


Abstract
Background/Objectives: Exposure to high and sustained levels of non-esterified fatty acids (NEFA) in the peripartal period is the main cause of fatty liver disease in dairy cows. Rumen-protected choline is often fed as part of the nutritional management of peripartal cows, with in vivo and in vitro data indicating positive effects of this nutrient on alleviating liver lipid accumulation. Although hepatic molecular mechanisms associated with choline supply have been studied using a target gene, protein, or metabolite approach, application of high-throughput technologies could vastly enhance fundamental knowledge on the functional role of choline. The main objective was to challenge isolated hepatocytes with a mixture of NEFA and determine proteome- and metabolome-wide effects in response to choline supply. Methods: Three healthy female calves (1 d old, 30–45 kg) were sacrificed to harvest hepatocytes. During a 12 h incubation, isolated hepatocytes were challenged without NEFA (control), 1.2 mM NEFA (c9-18:1, 18:2, 16:0, 18:0, and c9-16:1 at 43.5%, 4.9%, 31.9%, 14.4%, and 5.3% of total NEFA, respectively), or NEFA for 6 h followed by 10 μM choline chloride for another 6 h (NEFA + Chol). iTRAQ labeling-based protein profiling and GC/MS-based metabolomics profiling were used to determine changes in proteins and metabolites. Differentially abundant proteins for each group comparison were determined at a threshold of 1.4-fold change. Differences in metabolite profiles were assessed via pairwise comparisons. A subset of differentially abundant proteins was validated via qRT-PCR and Western blotting. Results: Compared with the control, there were 90 proteins and 22 metabolites in the NEFA group, and 83 proteins and 29 metabolites in the NEFA + Chol. Compared with NEFA, there were 49 proteins and 17 metabolites in the NEFA + Chol group. Greater abundance of hexokinase-1 (HK1), fructose-bisphosphate aldolase (ALDOA), mitochondrial pyruvate carrier 1 (MPC1), and increased concentrations of lactate with high NEFA treatment alone suggested greater glycolytic and TCA cycle activity. Accumulation of triacylglycerol in the NEFA group was associated with lipotoxicity and markers of inflammation, such as greater abundance of prostaglandin reductase 1 (PTGR1), serious cell autophagy processes, such as greater abundance of cell division cycle 42 (CDC42), and NFκB-related proteins. Choline supplementation reduced TAG partly due to greater VLDL secretion driven by greater abundance of diacylglycerol acyltransferase (DGAT1), perilipin 3 (PLIN3), and apolipoprotein C-III (APOC3). In addition, a greater abundance of carnitine O-palmitoyltransferase 1b (CPT1B) with choline suggested enhanced mitochondrial β-oxidation. Activation of the CDC42/JNK pathway and ROS/NFκB axis-related proteins, along with depressed PI3K/AKT/RAC-related proteins, indicated enhanced mitochondrial autophagy in response to NEFA. Conclusions: Overall, data confirmed published effects of choline on TAG accumulation, VLDL secretion, and fatty acid oxidation, while highlighting negative effects of NEFA on the respiratory electron transport chain, autophagy, and inflammatory processes.
1. Introduction
Fatty liver disease is one of the most common metabolic disorders in peripartal (transition) dairy cows [1]. Negative energy balance (NEB) due to insufficient dry matter intake to sustain increased energy requirements for maintenance of body functions and milk production leads to mobilization of fat depots, resulting in high and sustained plasma concentrations of non-esterified fatty acids (NEFA) [2]. In turn, flooding of the liver by the ensuing surge of NEFA, along with the inherently low rates of secretion of very low density lipoproteins (VLDL), is the main cause for the development of fatty liver [3].
Choline, a key micronutrient, is essential for phosphatidylcholine synthesis and plays an important role in the packaging and export of triacylglycerol into VLDL [4]. It is well-established in non-ruminants that low choline intake is a cause for the development of fatty liver disease [5]. In the same way, some studies with dairy cows have reported potential benefits of post-ruminal choline supply on liver health and reduction in lipid accumulation [6,7]. However, recent reports with a meta-analysis approach have discussed and highlighted that the direct effects of rumen-protected choline (RPC) in reducing liver TAG are still inconsistent [8,9]. Thus, additional studies at the proteomic and metabolomic level could aid in identifying additional mechanisms involved in the hepatic response to RPC.
Using molecular techniques to study target genes in lipid metabolism-related regulation pathways, previous studies reported positive associations between lower liver TAG in dairy cows and increased abundance of liver carnitine palmitoyltransferase 1 (CPT1), which was associated with stimulation of fatty acid (FA) oxidation, and increased apolipoprotein A5 (ApoA5) and apolipoprotein B (ApoB), which suggested increased VLDL assembly [10,11]. Despite somewhat consistent effects in terms of lipid metabolism, it is unknown what (if any) additional biological effects might be responsive to choline supply, especially when the liver faces an influx of high concentrations of NEFA. Thus, the objective of the present study was to use proteomic and metabolomics profiling to study large-scale changes in profiles in vitro in response to NEFA challenge of isolated bovine hepatocytes alone or in combination with choline.
2. Materials and Methods
The Ethics Committee for the Use and Care of Animals, Heilongjiang Bayi Agricultural University (Daqing, China), approved the animal use protocol. The ethical approval number was SMKXJSXY2022003, with the approval date of 10 March 2022.
2.1. Hepatocyte Isolation and Culture
Primary hepatocytes were isolated from 3 newborn female Holstein calves (1 d old, 30–45 kg) according to published protocols from our laboratory [12]. Briefly, calves were anesthetized with sodium thiamylal, heparinized intravenously, and euthanized via saturated potassium chloride injection (150 mg/kg body weight; Thermo Fisher Scientific, St. Louis, MO, USA) immediately after caudate lobe removal. The lobe was perfused, cleared of vessels/connective tissue, minced, filtered, and seeded in 6-well plates (1.5 × 10⁶ cells/well) in RPMI-1640 medium supplemented with 10% newborn calf serum, 10−6 mol/L insulin, 10−6 mol/L dexamethasone, and 10 μg/mL vitamin C at 37 °C with 5% CO2. After 5 h, the medium was replaced with growth medium containing 10% newborn calf serum, which was refreshed every 24 h.
2.2. Preparation of NEFA Mixture and Treatment
The NEFA (Sigma-Aldrich, St. Louis, MO, USA) used in this study was prepared as described in a manuscript from our laboratory [13], and included oleic acid (10.875 mM), linoleic acid (1.225 mM), palmitic acid (7.975 mM), stearic acid (3.6 mM), and palmitoleic acid (1.325 mM) prepared by diluting individual fatty acids in 0.1 M KOH at 60 °C, and adjusted to pH 7.6 with hydrochloric acid (1 mM).
After 72 h of culture, fresh isolated hepatocytes were cultured for 6 h with RPMI-1640 basic medium without serum, then RPMI-1640 containing 2% bovine serum albumin (BSA) was used. The actual experiment involved a 12 h incubation, during which isolated hepatocytes (6 replicates, 3 biological replicates with 2 technical replications per group) were challenged 4.8 mM KCl (control), 1.2 mM NEFA (c9-18:1, 18:2, 16:0, 18:0, and c9-16:1 at 43.5%, 4.9%, 31.9%, 14.4%, and 5.3% of total NEFA, respectively), or NEFA for 6 h followed by 10 µM ultrapure water dissolved choline chloride (Sigma-Aldrich, St. Louis, MO, USA) for another 6 h (NEFA + Chol).
2.3. Cellular TAG Content and Lipid Droplet Fluorescence Assay
Content of TAG in primary hepatocytes was determined using an enzymatic assay kit (Applygen Technologies Inc., Beijing, China) in accordance with the manufacturer’s instructions. Lipid droplets were assessed by fluorescence using cellular staining with BODIPY 493/503 (Invitrogen Corporation, Carlsbad, CA, USA) according to the manufacturer’s instructions. Images were obtained with a confocal laser-scanning microscope (Leica TCS SP8; Leica, Wetzlar, Germany) with 40×/1.3 numerical aperture (NA) differential interference contrast and analyzed with the instrument’s software. Each experimental group had 6 replicates.
2.4. Protein Extraction, Digestion, and iTRAQ Labeling
Cells (n = 3 samples pooled per group) were collected and washed with PBS and then scraped in lysis buffer containing 7 M urea, 1.4 M thiourea, and 4% 3-[(3-Cholamidopropyl) dimethylammonio]propanesulfonate (CHAPS). After centrifugation at 14,000× g for 20 min, protein concentration in the supernatant was detected with the Bradford assay kit (Solarbio, Beijing, China). One hundred μg total protein from pooled samples in each experimental group was reduced and alkylated by incubating with 5 mM dithiothreitol (DTT) for 60 min, followed by 10 mM iodoacetamide for 40 min. Proteins were washed twice in 200 µL 100 mM Tris-HCl containing 8 M Urea by hyperfiltration at 12,000× g for 20 min. The precipitates were collected and washed with 200 mM triethylammonium bicarbonate (TEAB) twice. After centrifugation at 12,000× g for 20 min, proteins were digested with trypsin (1:50, w/w) (Promega, Madison, WI, USA) at 37 °C overnight. The digested peptides were washed twice with double-distilled H2O and collected by centrifugation in 40 μL of 0.5 M TEAB.
Twenty μL of protein from pooled samples in each treatment group was used for iTRAQ. iTRAQ labeling was performed according to the manufacturer’s instructions (Applied Biosystems, Foster City, CA, USA). Labeled samples were fractionated using high pH reverse-phase fractionation (RPF) chromatography (Dionex UltiMate 3000 high-performance LC system, Thermo Fisher Scientific, MA, USA). LC-MS/MS analysis was performed on a nano LC-MS/MS system (UltiMate 3000 RSLC nano system, Thermo Fisher Scientific, MA, USA).
2.5. qRT-PCR Analysis and Western Blotting
A subset of differentially abundant proteins was evaluated at the mRNA level (n = 6 replicates per group; bold marked in Table 1) via qRT-PCR. In addition, mRNA abundance for selected proteins in enriched pathways related to peroxisome proliferation-activated receptor alpha (PPARα) and phosphatase and tensin homolog (PTEN) was analyzed. Total RNA was extracted using Trizol RNA extraction reagent (Invitrogen Corporation, Carlsbad, CA, USA) from each of 6 replicates per group. The RNA was reverse transcribed into cDNA using Reverse Transcriptase M-MLV (RNase H-) (Takara Bio, Inc., Otsu, Japan). qRT-PCR was performed on an Applied Biosystems 7300 real-time PCR system using SYBR Premix Ex Taq I (F. Hoffmann-La Roche AG, Basel, Switzerland). Gene primers were designed using Primer Premier 5 and are shown in Table A1 of the Appendix A. Gene expression was assessed with the 2−ΔΔCT method.
Table 1.
Subpathway analysis of greater or lesser abundance proteins. During a 12 h incubation, isolated hepatocytes were challenged without NEFA (control), 1.2 mM NEFA (c9-18:1, 18:2, 16:0, 18:0, and c9-16:1 at 43.5%, 4.9%, 31.9%, 14.4%, and 5.3% of total NEFA, respectively), or NEFA for 6 h followed by 10 μM choline chloride for another 6 h (NEFA + Chol). Superscript u1 represents greater abundance in NEFA compared with the control group, u2 represents greater abundance in NEFA + Chol compared with control, u3 represents greater abundance in NEFA + Chol compared with NEFA, d1 represents lesser abundance in NEFA compared with control, d2 represents lesser abundance in NEFA + Chol compared with control, and d3 represents lesser abundance in NEFA + Chol compared with NEFA. Bold indicates that gene expression of the protein was verified by qRT-PCR.
Western blotting analysis of key proteins associated with insulin and cell growth, or transcriptional control of inflammation, was done using specific commercial antibodies. Protein kinase B (AKT; 1:500, ab18785; abcam, Burlingame, CA, USA) and nuclear factor κB (NFκB) P65 (1:1000; D14E12; Cell Signaling; Danvers, MA, USA) were the target proteins, and their abundance was normalized to β-actin (internal control; 1:1000, sc-47778; Santa Cruz Biotechnology Inc., Santa Cruz, CA, USA). Data (6 replicates per group) were generated with a ProteinSimple imager (ProteinSimple, San Jose, CA, USA). Band intensity was quantified using the ImageJ software (version 1.54, National Institutes of Health, Bethesda, MD, USA).
2.6. Metabolomics Analysis
Cells (n = 6 replicates per group) were extracted with 600 µL extraction liquid (methanol:chloroform = 3:1 vol/vol) with 20 μL of L-2- chlorophenylalanine (1 mg/mL stock in dH2O) as internal standard. The mixture was homogenized for 4 min at 45 Hz, then ultrasound-treated for 5 min (while on ice water). This process was repeated 5 times, followed by centrifugation at 19,300× g for 15 min at 4 °C. Four hundred-fifty μL of the supernatant was transferred to a new GC/MS glass vial, and 12 μL from each sample was pooled as a quality control sample. After the mixture was freeze-dried, 80 μL of methoxyamine HCl in pyridine (20 mg/mL) was added and incubated at 80 °C for 30 min. Then, 40 μL of N,O-bis(trimethylsilyl)trifluoroacetamide (BSTFA) containing 1% trimethylchlorosilane (TCMS, REGIS Technologies Inc., Morton Grove, IL, USA) was added and incubated at 70 °C for 2 h. Samples were run in an Agilent 7890 gas chromatograph system coupled with a Pegasus HT time-of-flight mass spectrometer for GC-TOFMS analysis. The system utilized a DB-5MS capillary column coated with 5% diphenyl cross-linked with 95% dimethylpolysiloxane (30 m × 250 μm inner diameter, 0.25 μm film thickness; J&W Scientific, Folsom, CA, USA). A 1 μL aliquot of the analyte was injected in splitless mode. Helium was used as the carrier gas, the front inlet purge flow was 3 mL/min, and the gas flow rate through the column was 1 mL/min. The initial temperature was kept at 50 °C for 1 min, then raised to 310 °C at a rate of 10 °C/min, then kept for 8 min at 310 °C. The injection, transfer line, and ion source temperatures were 280, 270, and 220 °C, respectively. The energy was −70 eV in electron impact mode. The mass spectrometry data were acquired in full-scan mode with the m/z range of 50–500 at a rate of 20 spectra per second after a solvent delay of 366 s.
2.7. Statistical Analysis
Empirical differences in protein profiles were determined via Proteome Discoverer 1.4 (Thermo Fisher Scientific) using raw files. Mass spectrometry data were analyzed using ProteinPilotTM v4.5 (Applied Biosystems), peptide identification was done using the Paragon algorithm against the UniProt Bos protein database (http://www.uniprot.org/, accessed on 15 October 2022), and the identified protein ID was converted to a UniProt ID and then mapped to Gene Ontology (GO) IDs by protein ID. “Differentially abundant” proteins for each group comparison were determined at an empirical threshold of 1.4-fold change, and were classified according to GO (http://www.geneontology.org, accessed on 15 October 2022) annotation into two categories: molecular function and biological processes. The Kyoto Encyclopedia of Genes and Genomes (KEGG, http://www.genome.jp/kegg/ or http://www.kegg.jp/, accessed on 15 October 2022) database and Reactome Database (https://reactome.org, accessed on 15 October 2022) were used to identify enriched pathways by a hypergeometric distribution test to compare the enrichment of the differentially abundant protein against all identified proteins, and pathways enriched were considered significant at p < 0.05.
Data from qRT-PCR and Western blotting were analyzed using SPSS 22.0 (SPSS Inc., Chicago, IL, USA) and GraphPad Prism 7.00 (GraphPadSoftware, San Diego, CA, USA). Statistical significance was determined using one-way ANOVA followed by post hoc Bonferroni correction. Differences were considered significant at p < 0.05. Results are reported as means ± standard error of the mean.
Statistical analysis of metabolomics data relied on the Chroma TOF 4.3X software (LECO Corp., St. Joseph, MI, USA, LECO-Fiehn Rtx5 database). The retention time index method was used for peak identification. SIMCA software (V14.1, MKS Data Analytics Solutions, Umea, Sweden) was used for multivariate statistical analyses, including principal component analysis (PCA) and orthogonal partial least-squares discriminant analysis (OPLS-DA). Differences in metabolite concentrations were assessed using multiple testing and corrected by the two-stage-up method of Benjamini, Krieger, and Yekutieli to control the false discovery rate at 0.05, and Variable Importance in the Projection (VIP) of the OPLS-DA model >1. The KEGG (http://www.genome.jp/kegg/, accessed on 15 October 2022) and NIST (https://webbook.nist.gov/chemistry/, accessed on 15 October 2022) were used to search for the pathways of metabolites. MetaboAnalyst (http://www.metaboanalyst.ca, accessed on 1 November 2022), which uses the high-quality KEGG metabolic pathway as the backend knowledge base, is used for pathway enrichment analysis of the significant metabolites.
3. Results
3.1. Content of TAG and Lipid Droplets
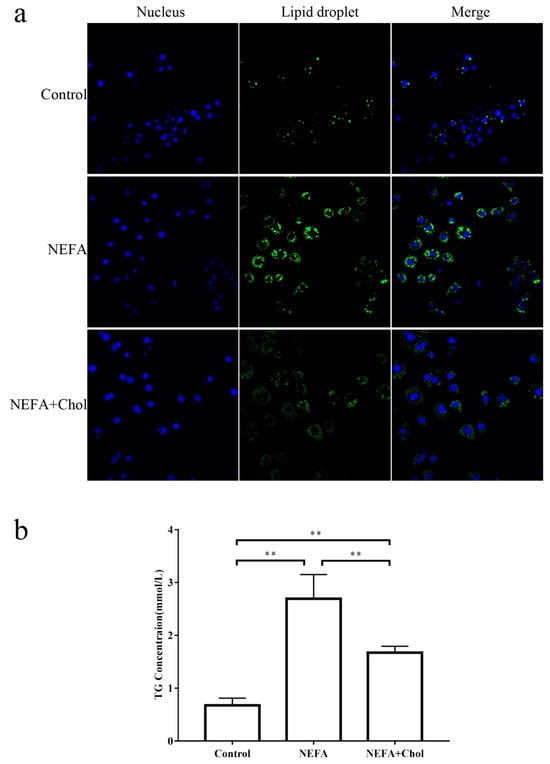
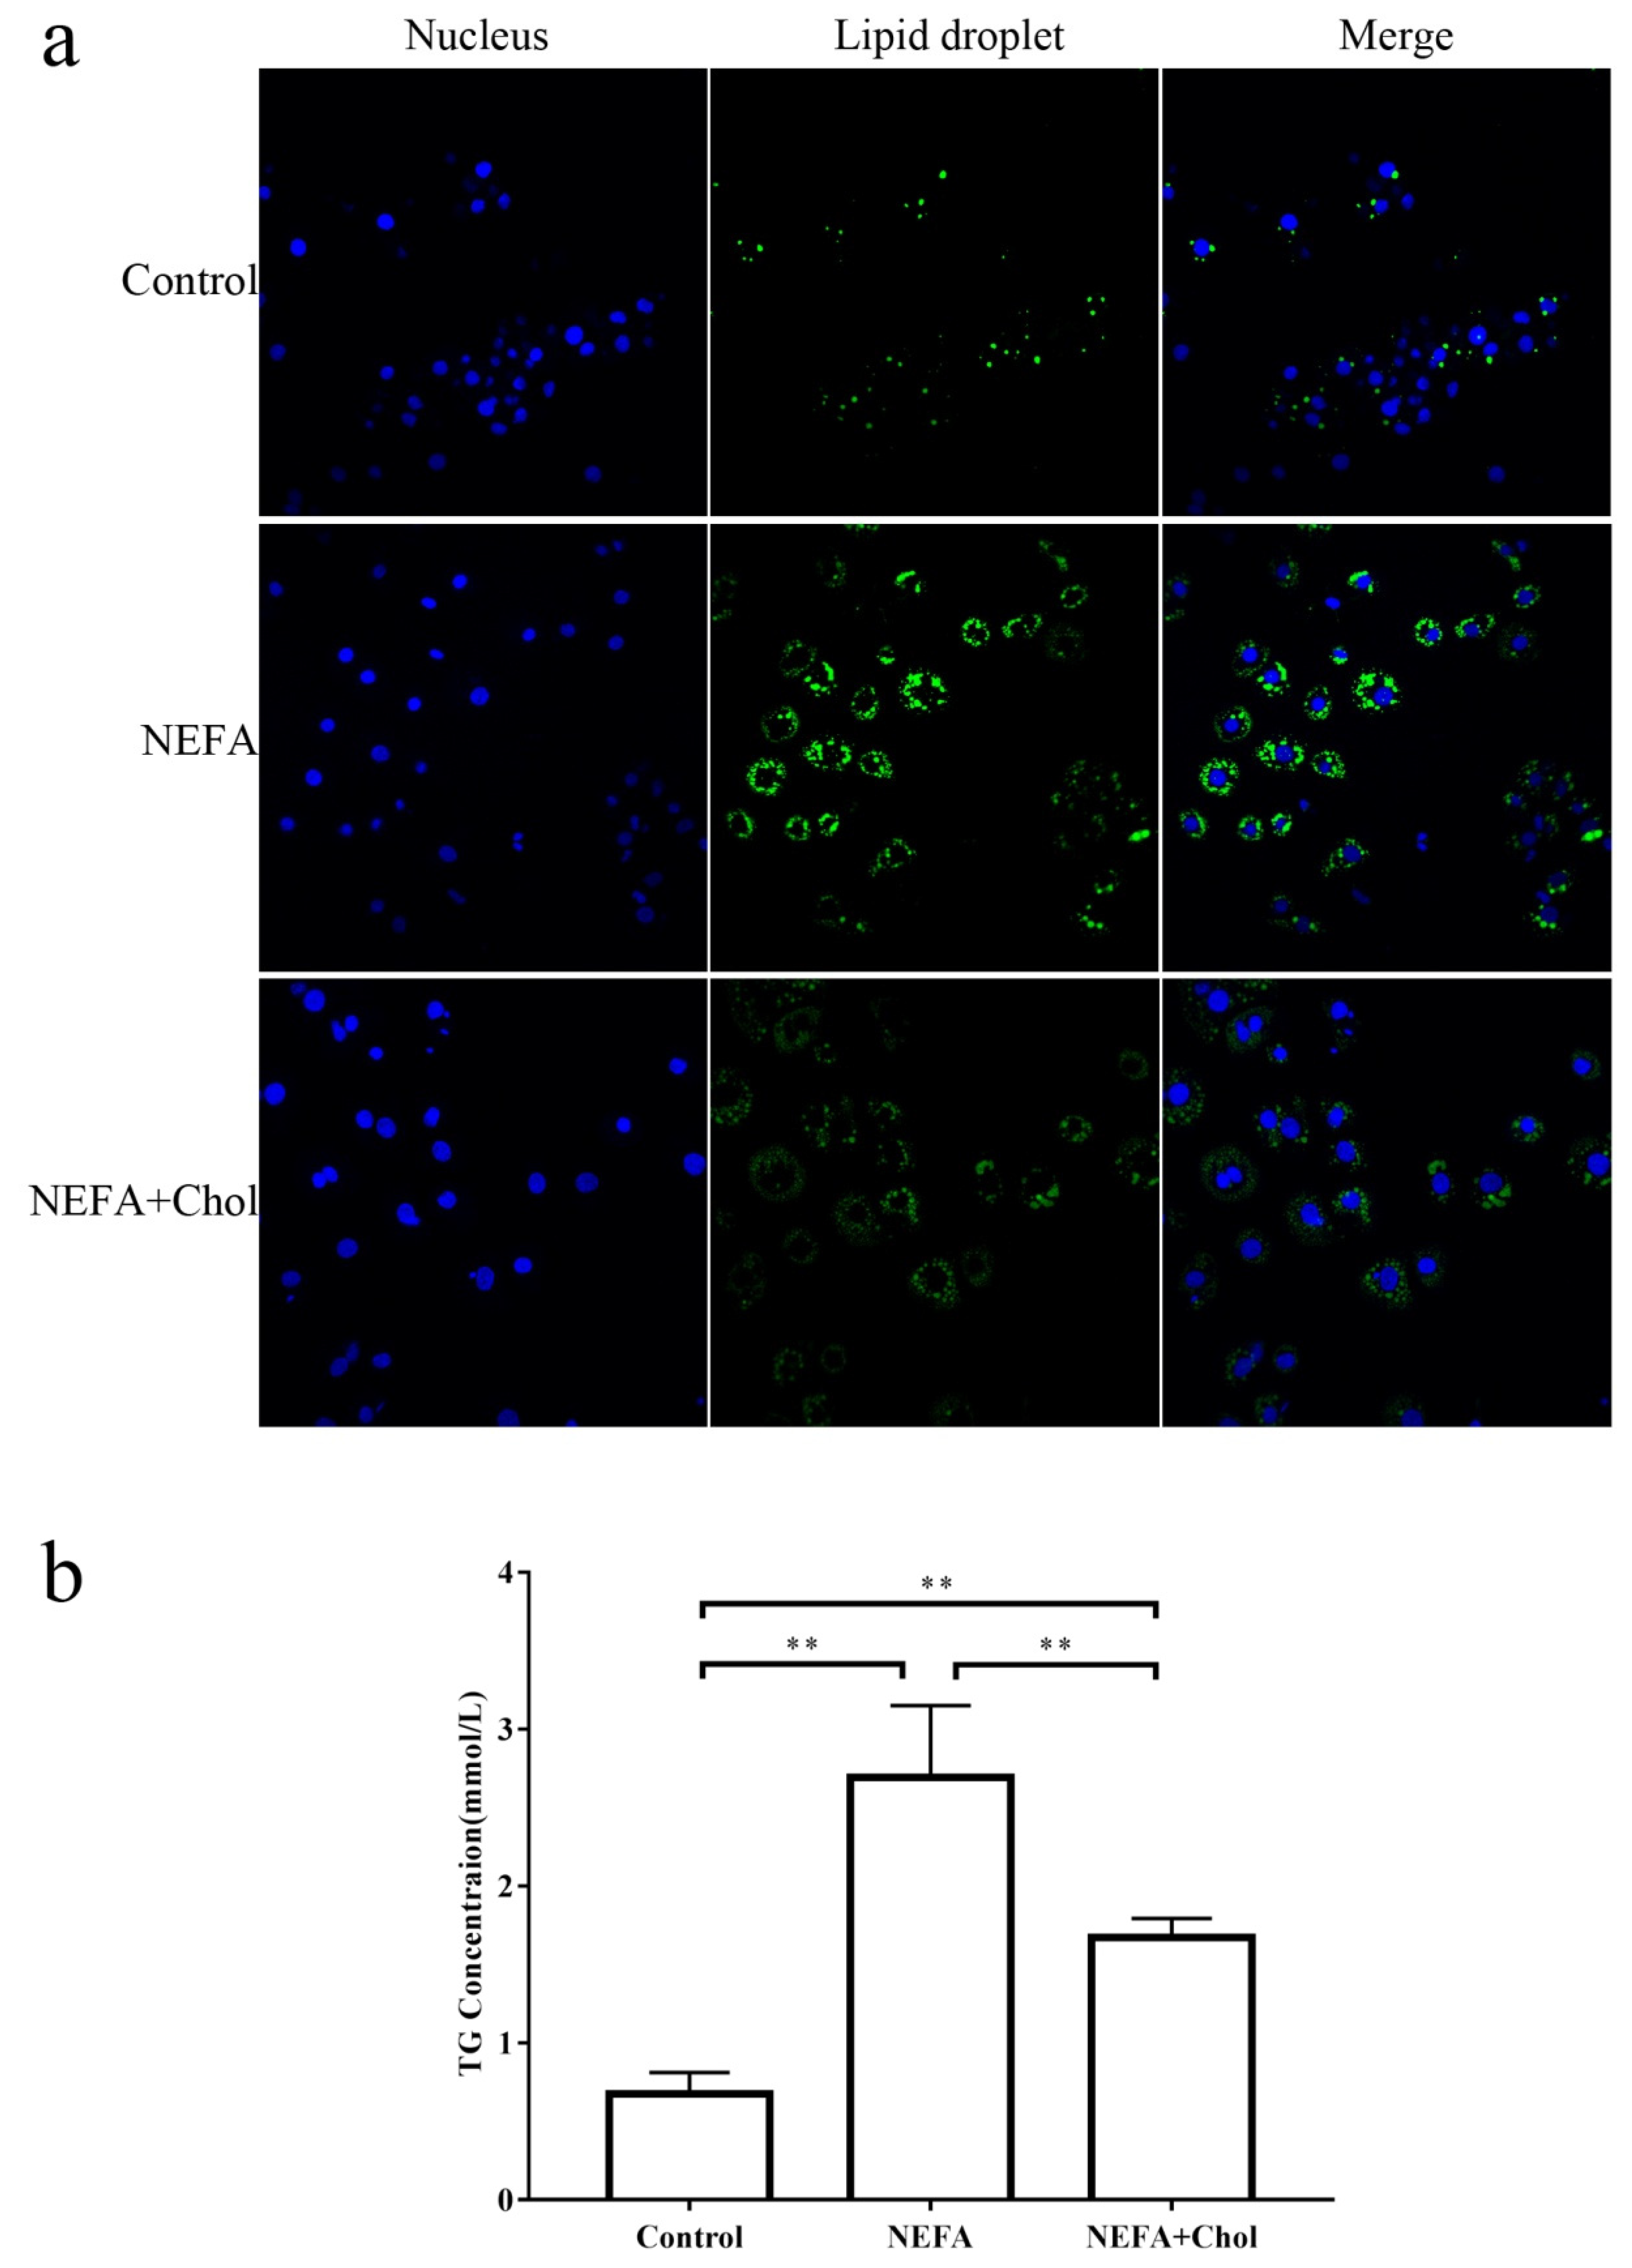
Compared with the control, hepatocytes in the NEFA and NEFA + Chol group had greater (p = 0.0001 and p = 0.0028, respectively) TAG concentrations (Figure 1a,b), while the NEFA + Chol group had lower TAG concentrations compared with the NEFA group (p = 0.0025).
Figure 1.
Effects of choline supply on high NEFA-induced lipid accumulation in isolated hepatocytes. During a 12 h incubation, isolated hepatocytes were challenged without NEFA (control), 1.2 mM NEFA (c9-18:1, 18:2, 16:0, 18:0, and c9-16:1 at 43.5%, 4.9%, 31.9%, 14.4%, and 5.3% of total NEFA, respectively), or NEFA for 6 h followed by 10 μM choline chloride for another 6 h (NEFA + Chol). Each assay was performed in 6 replicates. Data are means ± SEM. Lipid droplet fluorescence (Panel (a)). Blue fluorescence indicates cell nuclei; green fluorescence indicates lipid droplets. The intensity of green fluorescence increases with the number of lipid droplets in the cell. Cell triglyceride content (Panel (b)). ** p < 0.01 indicate significant differences.
3.2. Differentially Abundant Proteins
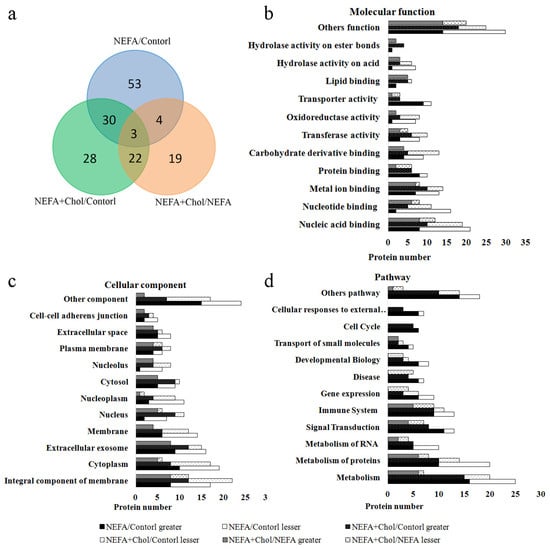
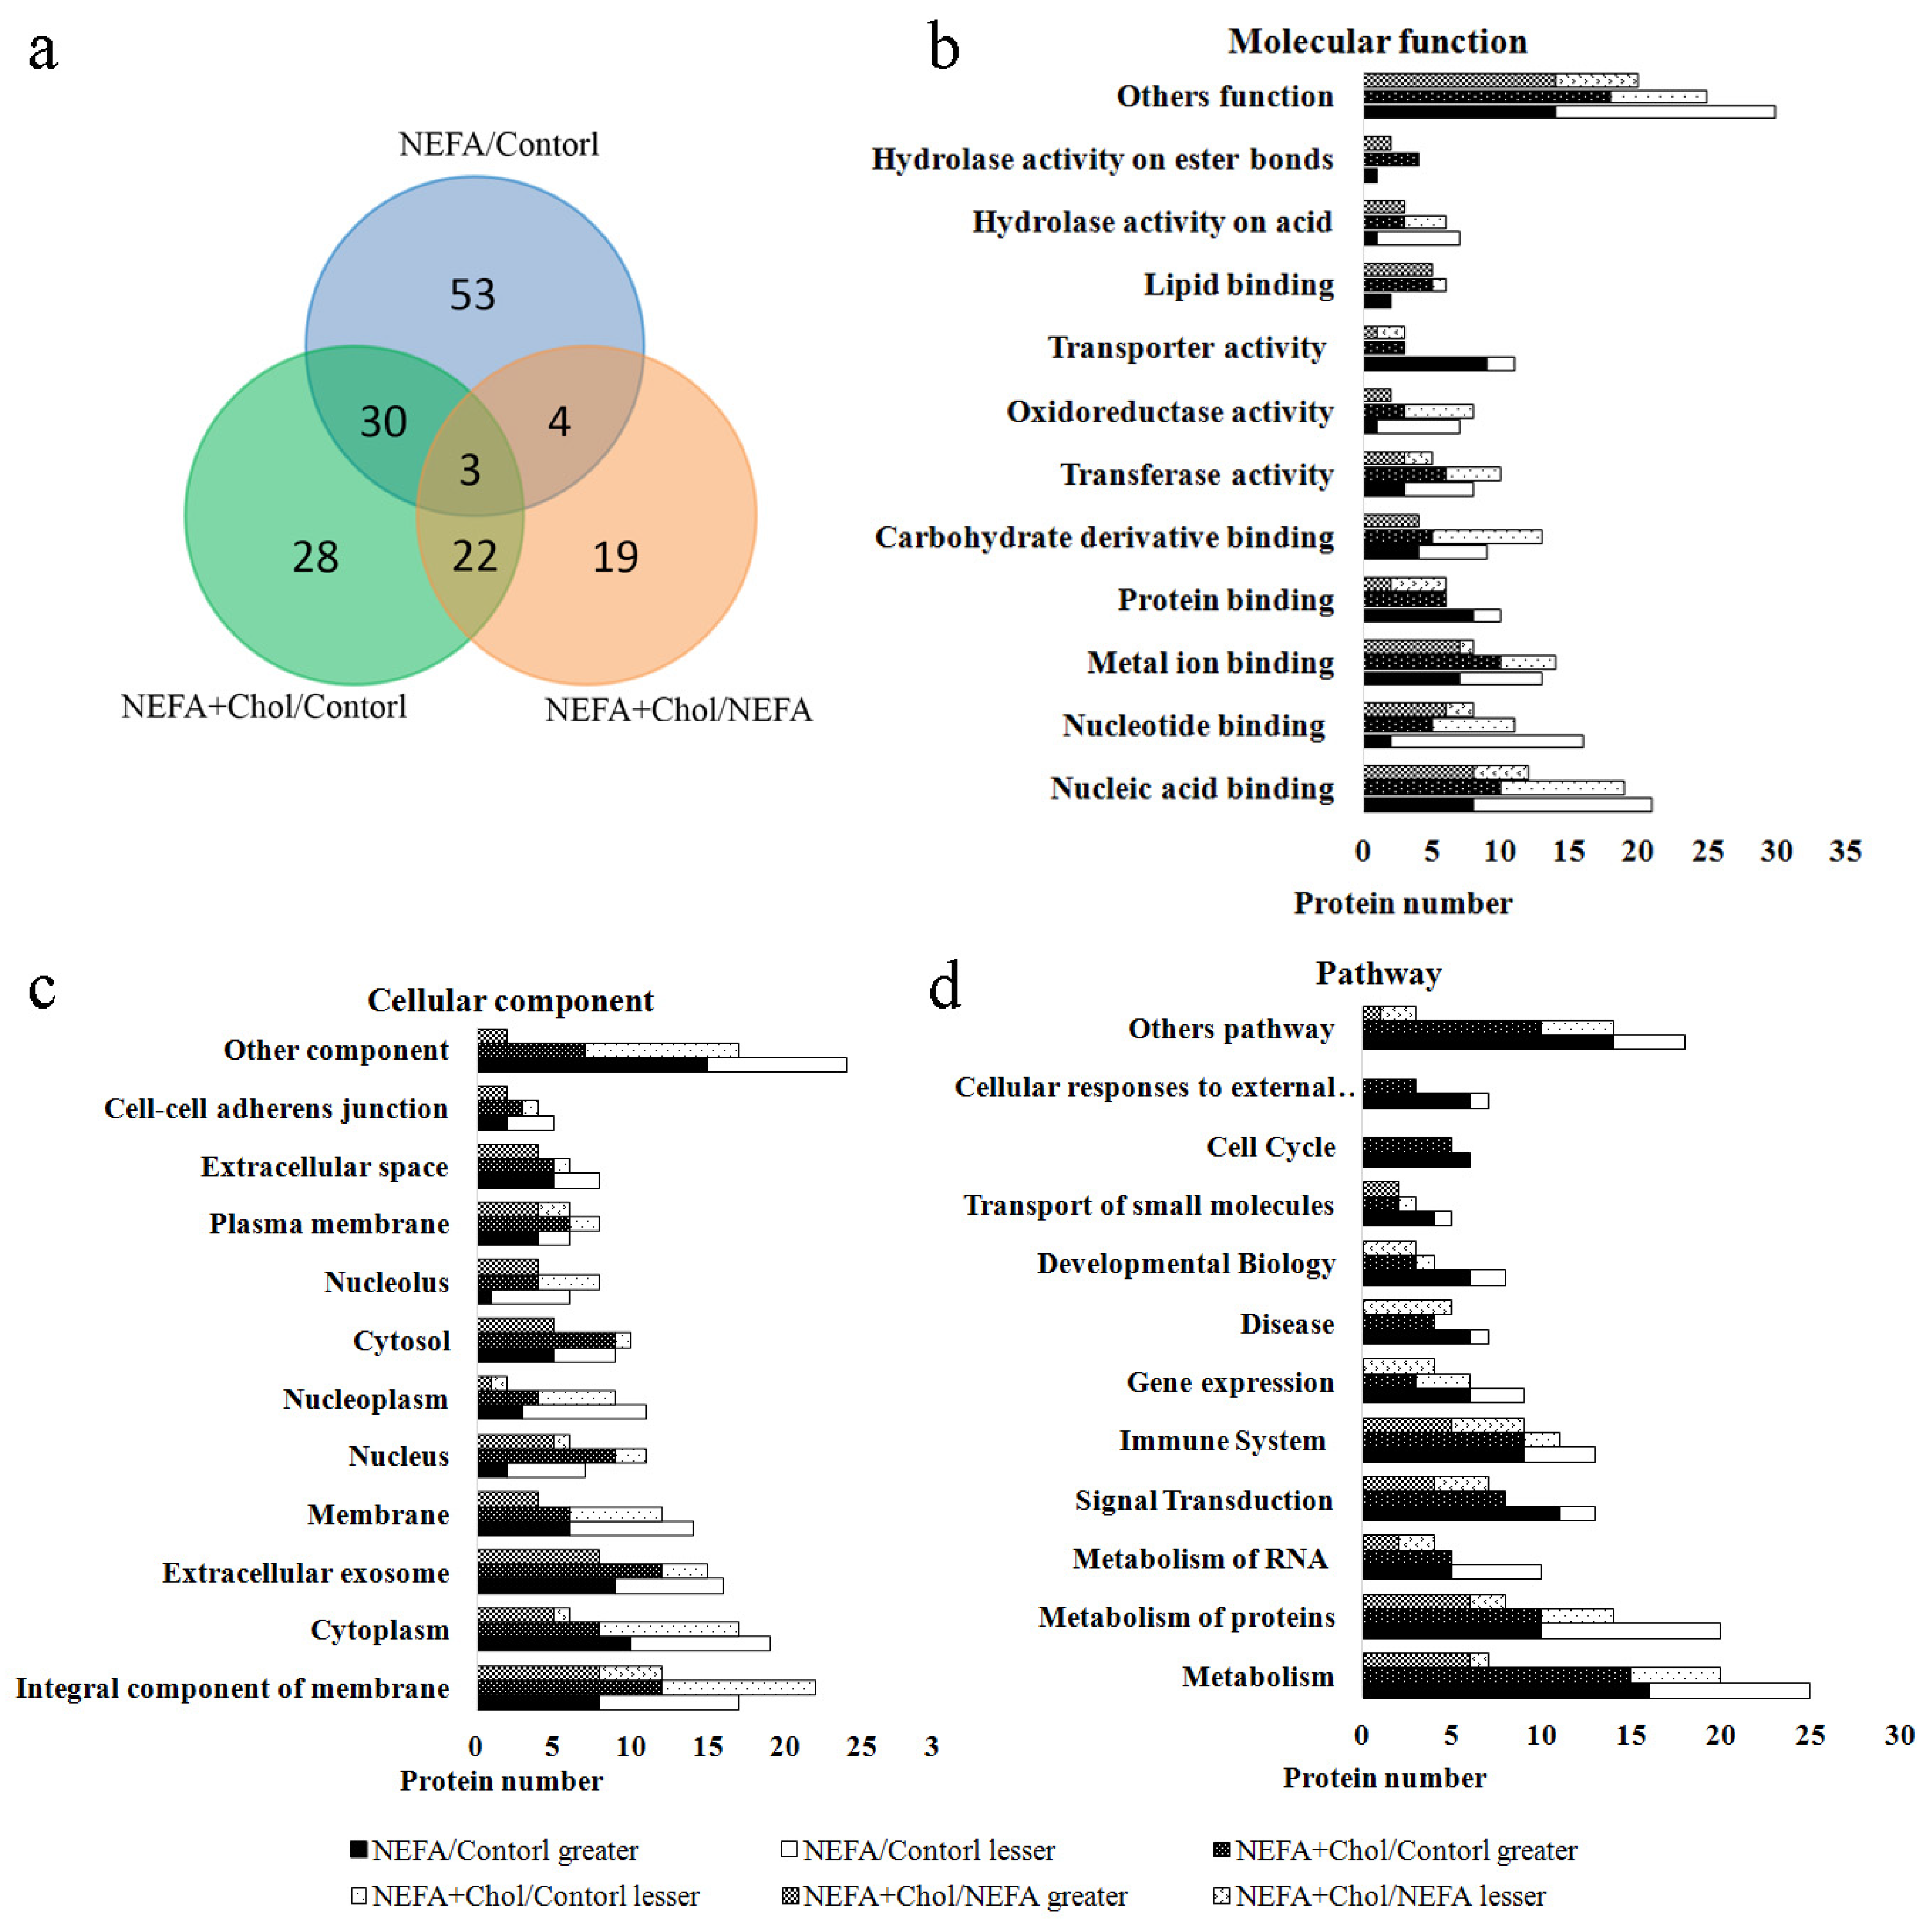
There were 2892 proteins identified in each sample in the quantitative proteomic study. Compared with the control, 40 proteins had greater abundance, and 50 had lesser abundance in the NEFA group, and 49 proteins had greater abundance, and 34 had lesser abundance in the NEFA + Chol group. Compared with NEFA, there were 31 proteins with greater abundance and 17 with lesser abundance in the NEFA + Chol group. Among these proteins, as depicted in Figure 2a, a total of 30 proteins were altered in both the NEFA versus control and NEFA + Chol versus control comparisons, 22 in both the NEFA + Chol versus control and NEFA + Chol versus NEFA comparisons, and four in both NEFA versus control and NEFA + Chol versus NEFA. Only four proteins were similarly affected among the three groups.
Figure 2.
GO term and pathway analysis of greater or lesser abundance proteins. During a 12 h incubation, isolated hepatocytes were challenged without NEFA (control), 1.2 mM NEFA (c9-18:1, 18:2, 16:0, 18:0, and c9-16:1 at 43.5%, 4.9%, 31.9%, 14.4%, and 5.3% of total NEFA, respectively), or NEFA for 6 h followed by 10 μM choline chloride for another 6 h (NEFA + Chol). Correlations of differentially abundant proteins among groups (Panel (a)). Molecular functions enriched with differently abundant proteins (Panel (b)). Cellular components enriched with differently abundant proteins (Panel (c)). Pathways enriched with differently abundant proteins (Panel (d)).
3.3. GO and Pathway Analysis
The GO term and pathway analysis of differently abundant proteins is reported in Figure 2b–d. Molecular functions enriched with differently abundant proteins are involved in nucleic acid binding, metal ion binding, protein binding, oxidoreductase activity, transporter activity, lipid binding, and hydrolase activity. Cellular components enriched with differentially abundant proteins include cytoplasm, extracellular exosome, membrane, nucleus, plasma membrane, and cell–cell adherens junction. Pathways enriched with differentially abundant proteins include metabolism, signal transduction, immune system, disease, developmental biology, transport of small molecules, cell cycle, and cellular responses to external stimuli. Among enriched subpathways (Table 1) were metabolism of lipids, metabolism of carbohydrates, citric acid cycle and respiratory electron transport, metabolism of amino acids and derivatives, signaling by receptor tyrosine kinases, signaling by interleukins, neutrophil degranulation, and RNA polymerase II transcription.
3.4. mRNA Abundance for Genes Encoding Target Proteins
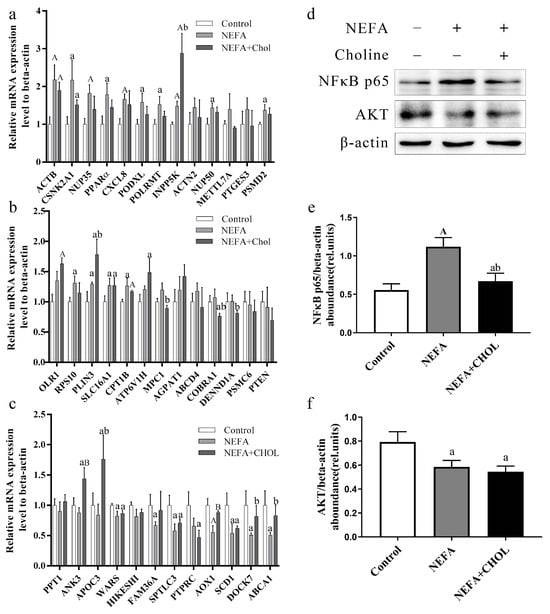
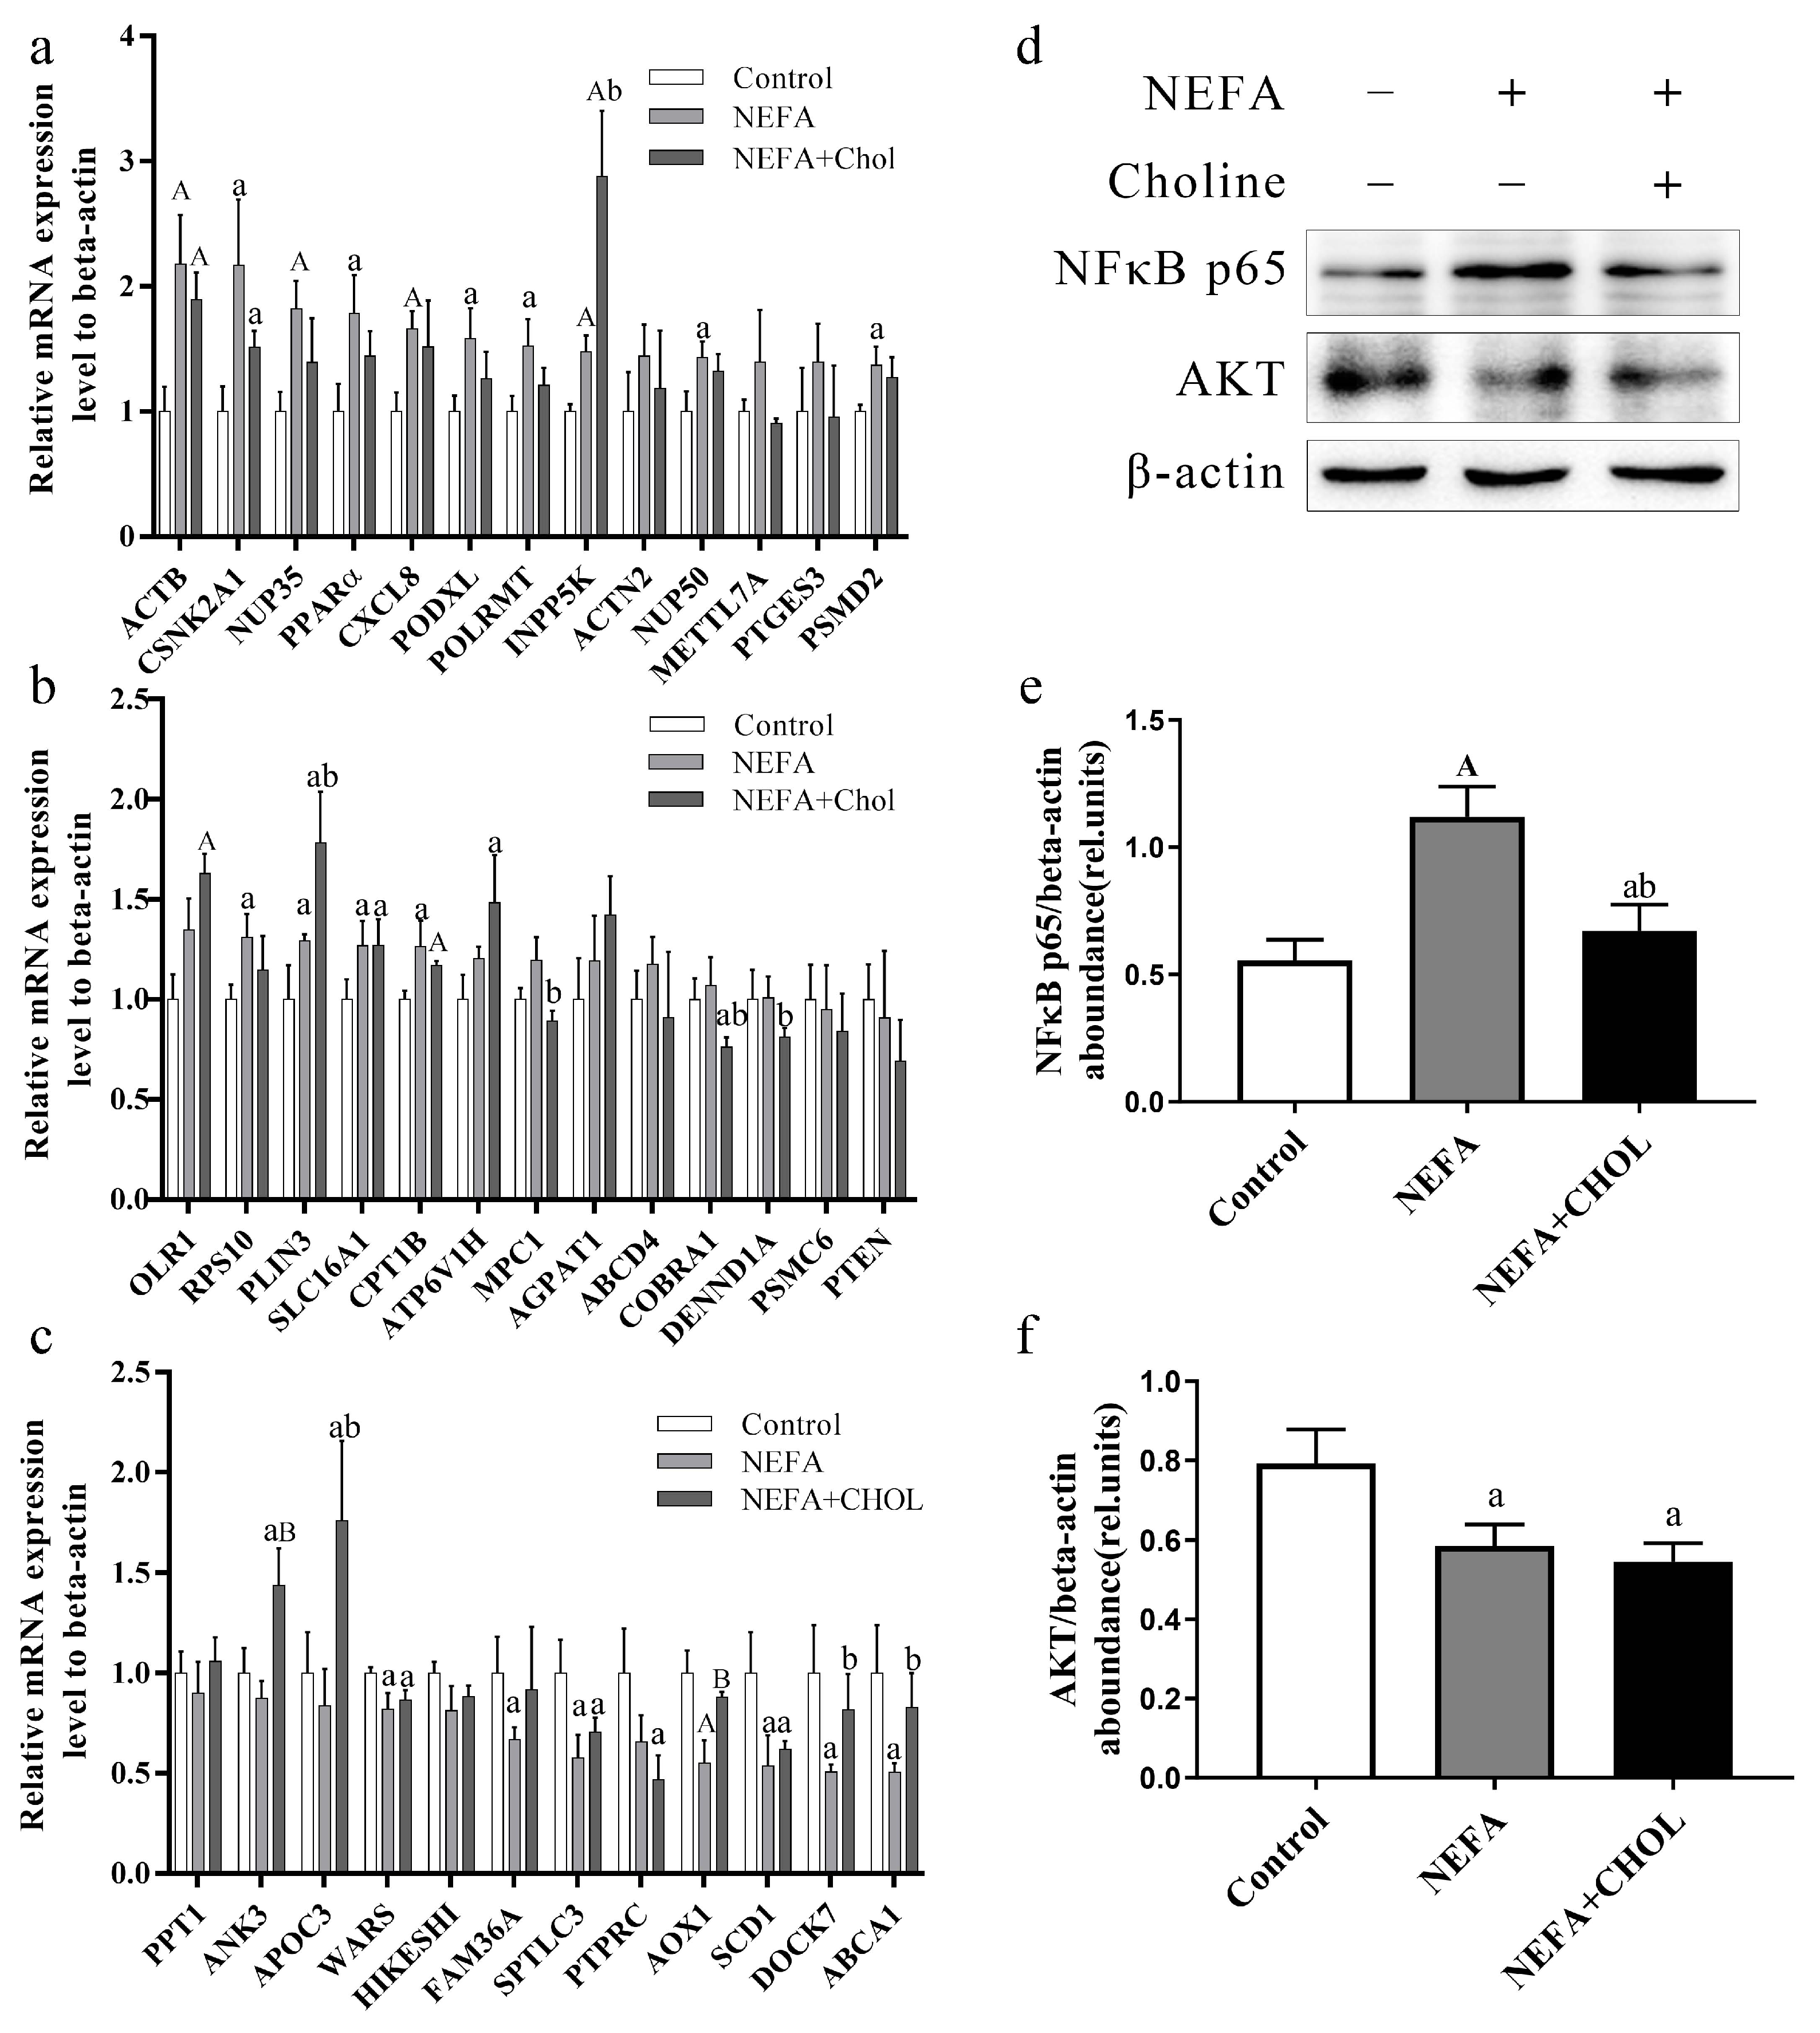
As shown in Figure 3a–c, the qRT-PCR results indicated that the expression level of most genes was consistent with transcription prediction and protein abundance uncovered by the iTRAQ data. However, 9 genes were inconsistent with transcription prediction according to the iTRAQ data: compared with the control group, neither palmitoyl-protein thioesterase 1 (PPT1) in the NEFA + Chol group nor mitochondrial pyruvate carrier 1 (MPC1) in the NEFA group had a significant change. In addition, compared with the Control group, 40S ribosomal protein S10 (RPS10) and podocalyxin-like (PODXL) in the NEFA group were upregulated (p < 0.05), and expression of ANK3 protein (ANK3) in the NEFA + Chol group was also upregulated compared with the NEFA group (p < 0.05). There was no significant difference in METTL7A among the three groups. Compared with the control group, DNA-directed RNA polymerase (POLRMT) and perilipin 3 (PLIN3) in the NEFA group were upregulated (p < 0.05). Similarly, compared with the NEFA group, ATP binding cassette subfamily A member 1 (ABCA1) in the NEFA + Chol group was upregulated (p < 0.05). In addition, compared with the control group, gene expression of peroxisome proliferator-activated receptor α (PPARα) in the NEFA group was upregulated (p < 0.05). Compared with the control, hepatocytes in the NEFA and NEFA + Chol group had greater protein abundance of NFκB and lesser protein abundance of AKT (Figure 3d–f).
Figure 3.
Verification analysis of selected proteins. During a 12 h incubation, isolated hepatocytes were challenged without NEFA (control), 1.2 mM NEFA (c9-18:1, 18:2, 16:0, 18:0, and c9-16:1 at 43.5%, 4.9%, 31.9%, 14.4%, and 5.3% of total NEFA, respectively), or NEFA for 6 h followed by 10 μM choline chloride for another 6 h (NEFA + Chol). Each assay was performed in 6 replicates. Data are means ± SEM. Gene expression analysis of different proteins and PPARα and PTEN (Panel (a–c)). Protein abundance of NFκB and AKT (Panel (d–f)). Lowercase letter a vs. control p < 0.05, uppercase letter A vs. control p ≤ 0.01, lowercase letter b vs. NEFA p < 0.05, uppercase letter B vs. NEFA p ≤ 0.01.
3.5. Metabolomics
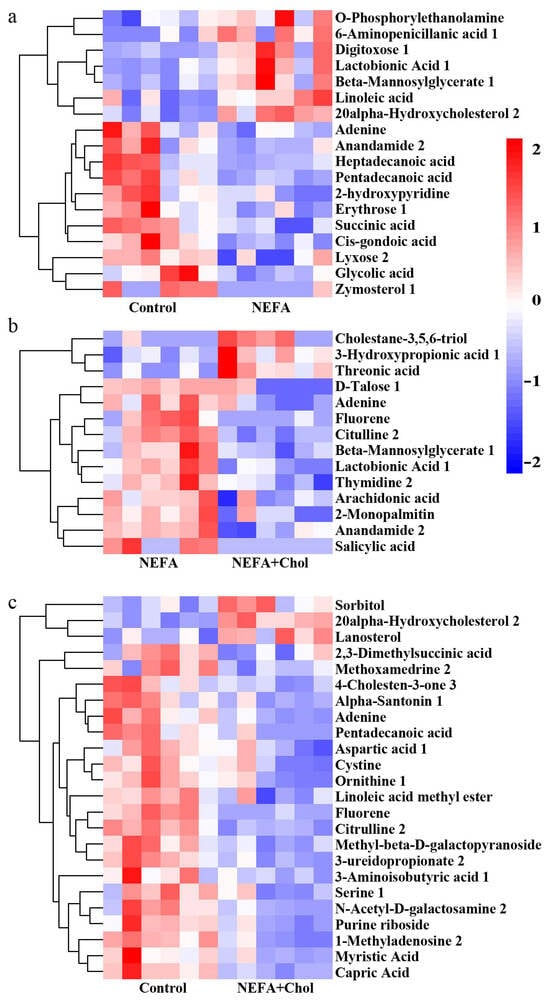
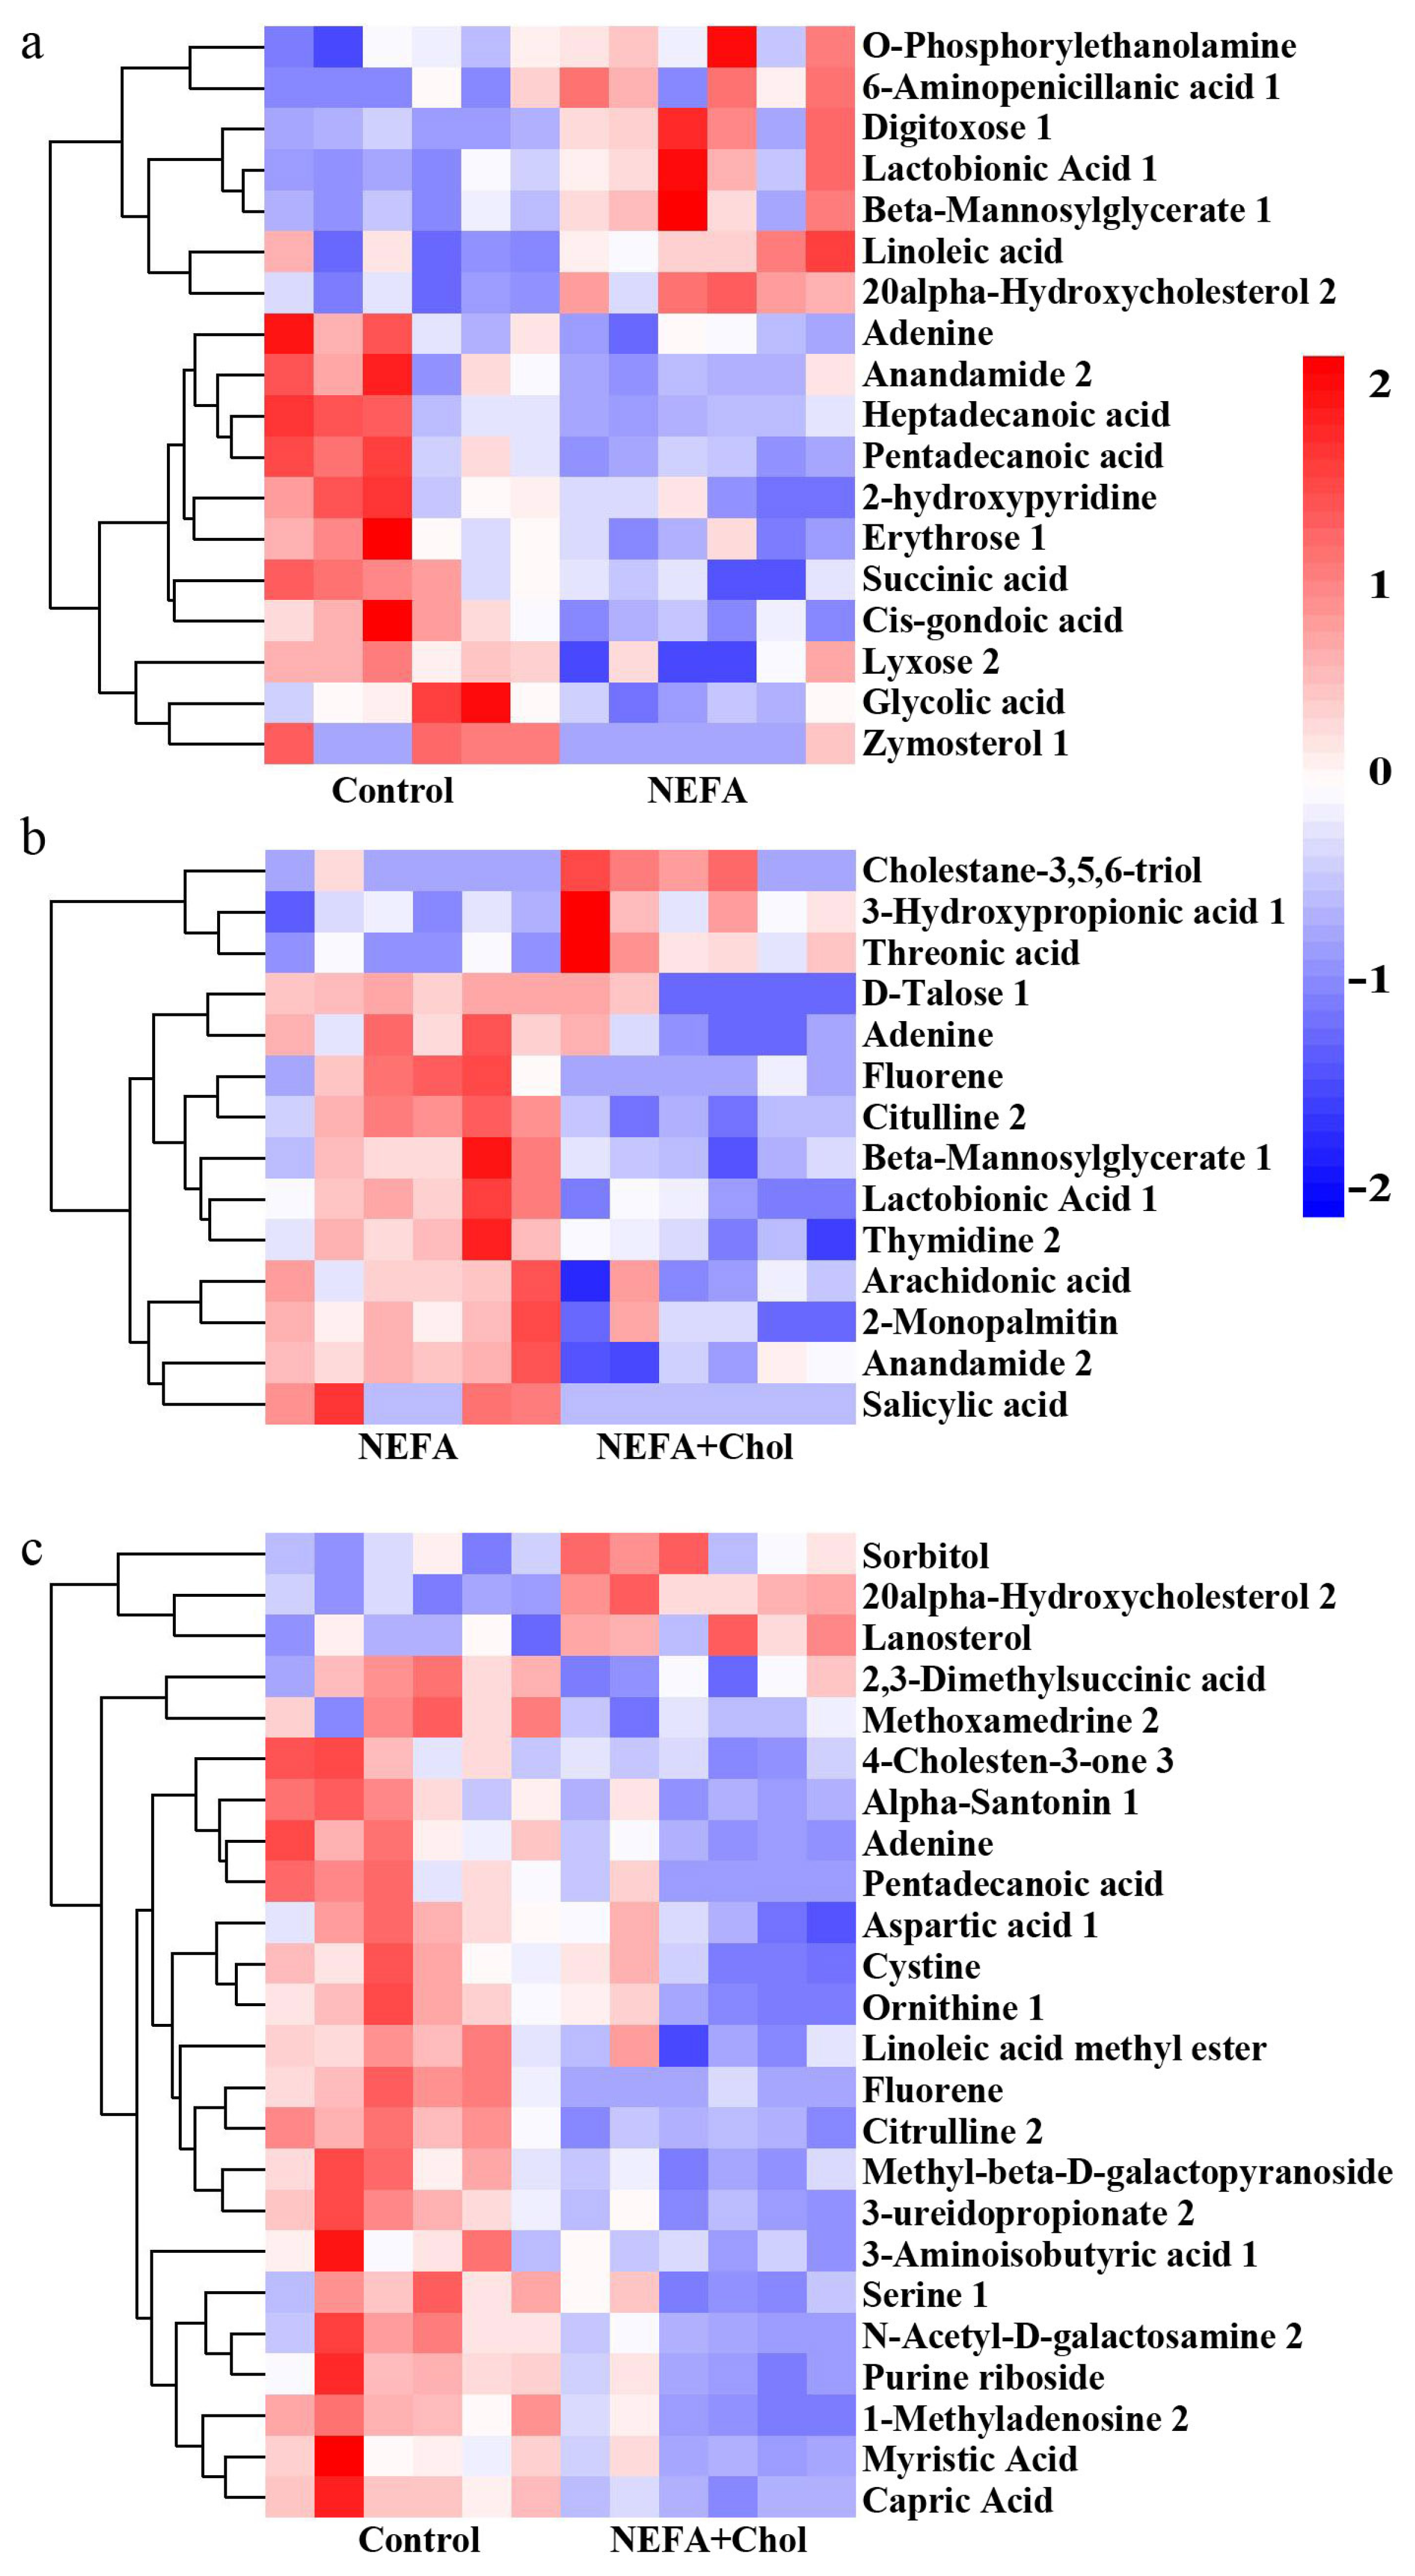
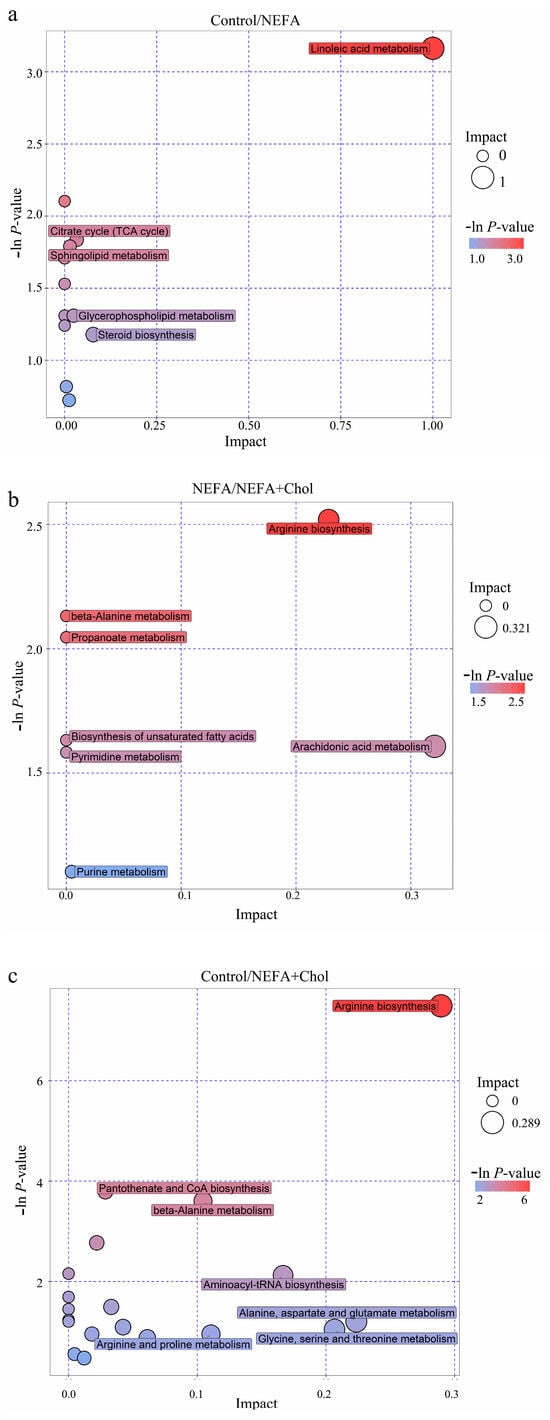
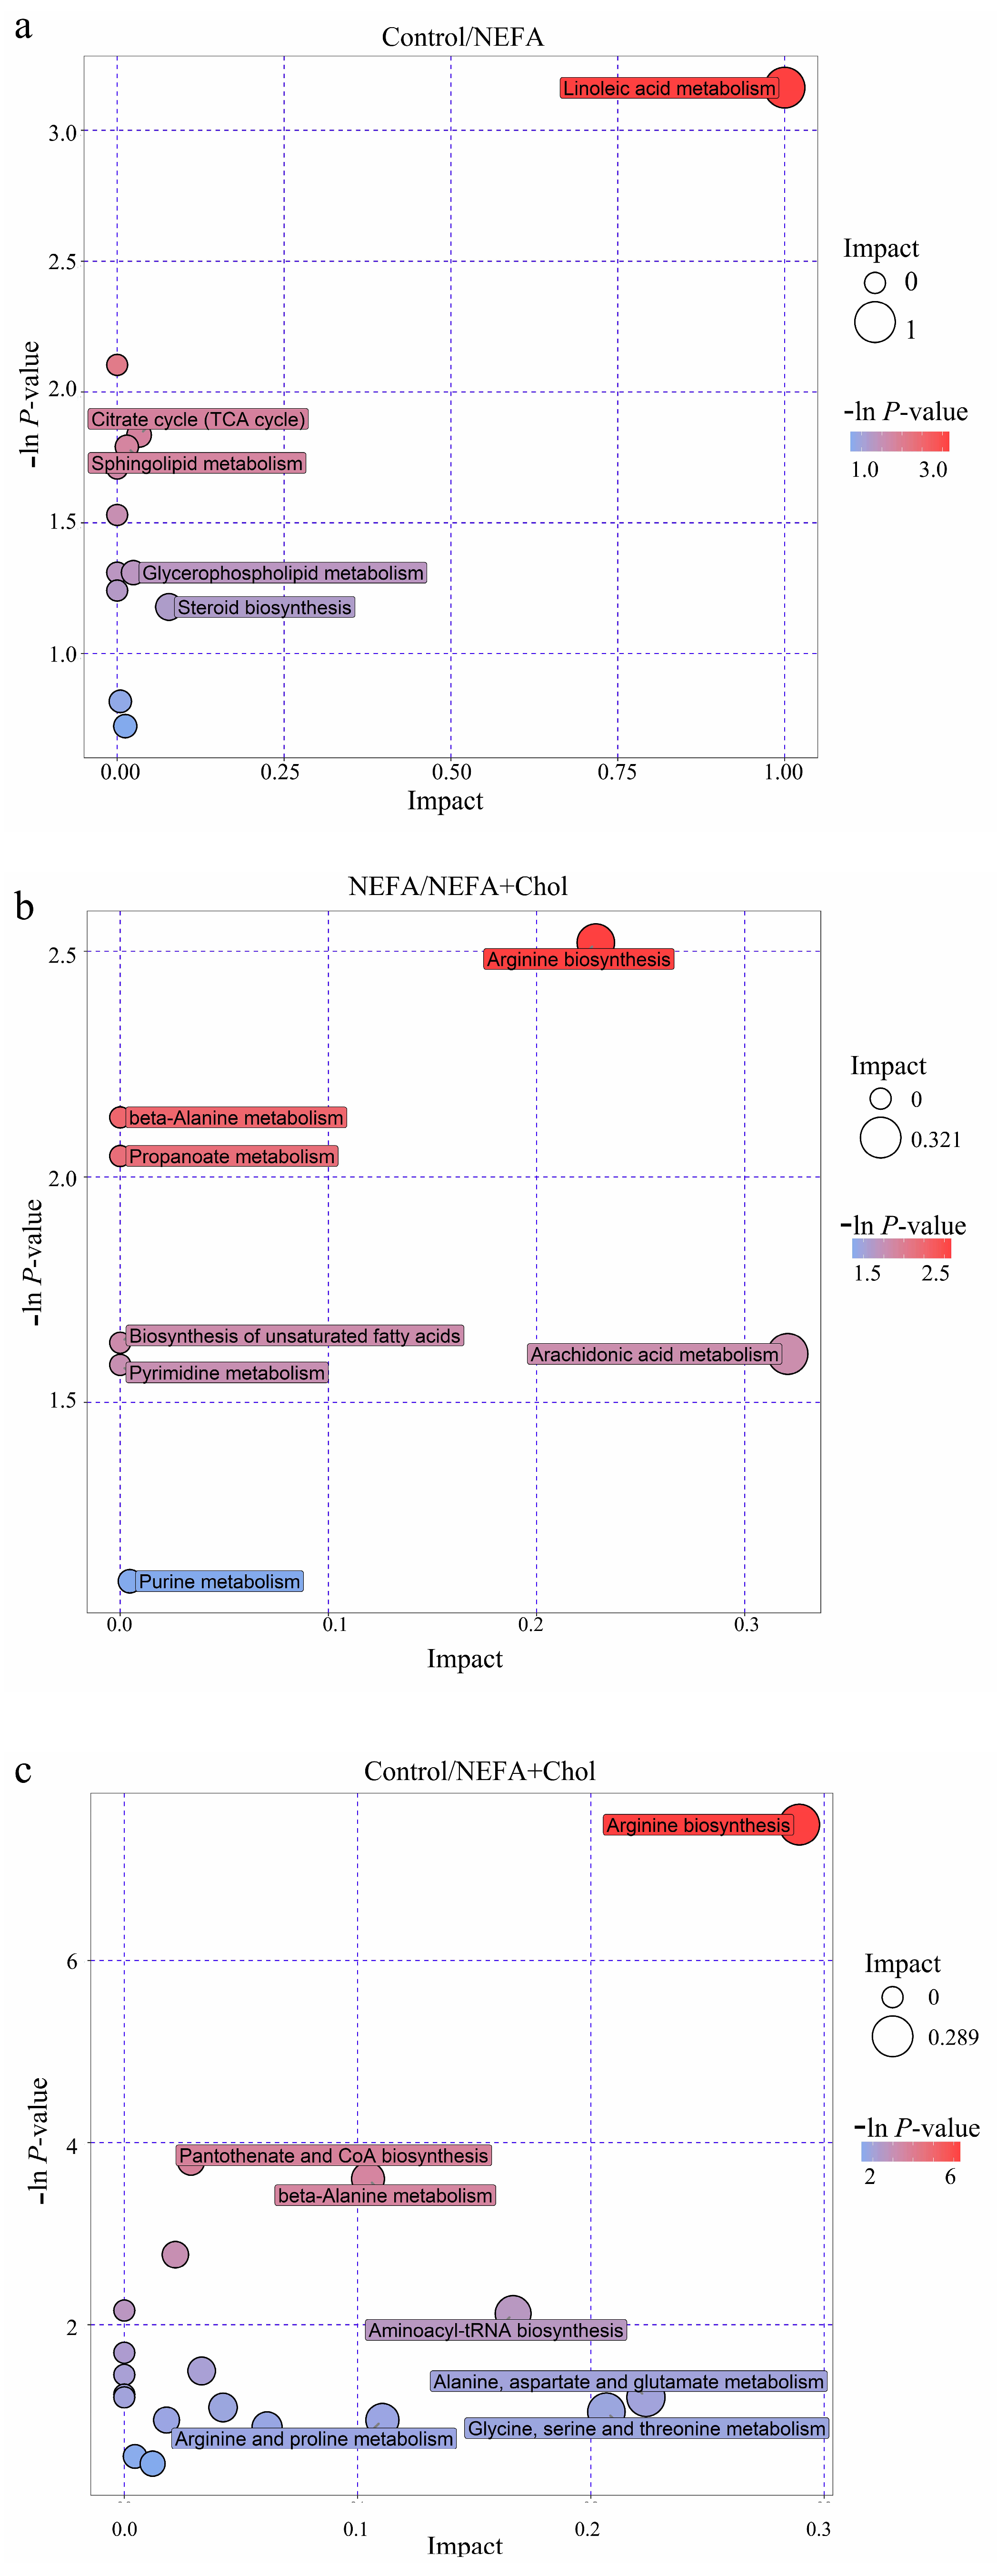
There were 295 metabolites identified in each group in the metabolomic study. A heatmap of hierarchical clustering analysis of differentially regulated metabolites is depicted in Figure 4. Among these, 18 affected metabolites in the comparison control versus NEFA participate in linoleic acid metabolism, glyoxylate and dicarboxylate metabolism, citrate cycle metabolism, sphingolipid metabolism, or steroid hormone biosynthesis (Figure 5a). A total of 14 metabolites in the NEFA versus NEFA + Chol comparison were identified, and participate in the biosynthesis of unsaturated fatty acids, arachidonic acid metabolism, arginine and proline metabolism, or purine metabolism (Figure 5b). A total of 24 metabolites in the control versus NEFA + Chol comparison participate in cysteine and methionine metabolism, aminoacyl-tRNA biosynthesis, glycine, serine, and threonine metabolism, methane metabolism, or steroid biosynthesis (Figure 5c).
Figure 4.
Heatmap of hierarchical clustering analysis of differentially affected metabolites. During a 12 h incubation, isolated hepatocytes were challenged without NEFA (control), 1.2 mM NEFA (c9-18:1, 18:2, 16:0, 18:0, and c9-16:1 at 43.5%, 4.9%, 31.9%, 14.4%, and 5.3% of total NEFA, respectively), or NEFA for 6 h followed by 10 μM choline chloride for another 6 h (NEFA + Chol). Each assay was performed on 6 replicates per treatment group. Differentially affected metabolites in control vs. NEFA (Panel (a)), NEFA vs. NEFA + Chol (Panel (b)), and control vs. NEFA + Chol (Panel (c)) hepatocyte cultures.
Figure 5.
Treemap of pathway analysis using differentially affected metabolites. During a 12 h incubation, isolated hepatocytes were challenged without NEFA (control), 1.2 mM NEFA (c9-18:1, 18:2, 16:0, 18:0, and c9-16:1 at 43.5%, 4.9%, 31.9%, 14.4%, and 5.3% of total NEFA, respectively), or NEFA for 6 h followed by 10 μM choline chloride for another 6 h (NEFA + Chol). Control vs. NEFA (Panel (a)), NEFA vs. NEFA + Chol (Panel (b)), and control vs. NEFA + Chol (Panel (c)). Each assay was performed on 6 replicates per treatment group.
3.6. Schematic Representation of the Key Regulatory Networks Modulated by Choline Supplementation in NEFA-Challenged Calf Hepatocytes
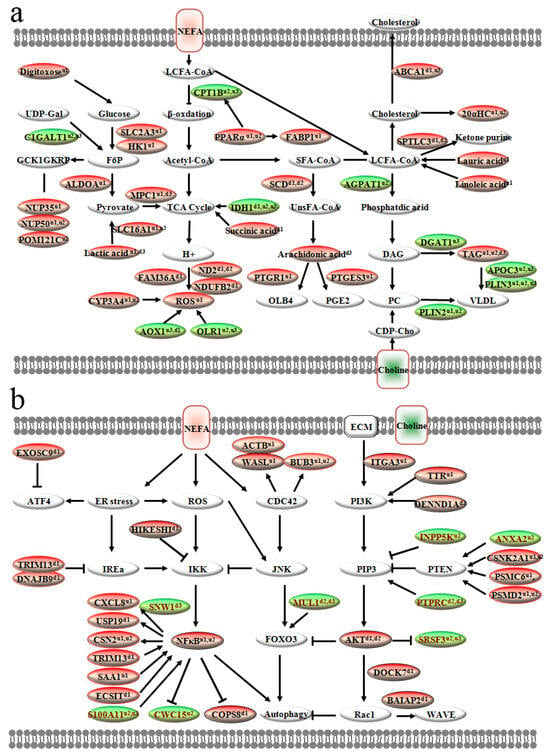
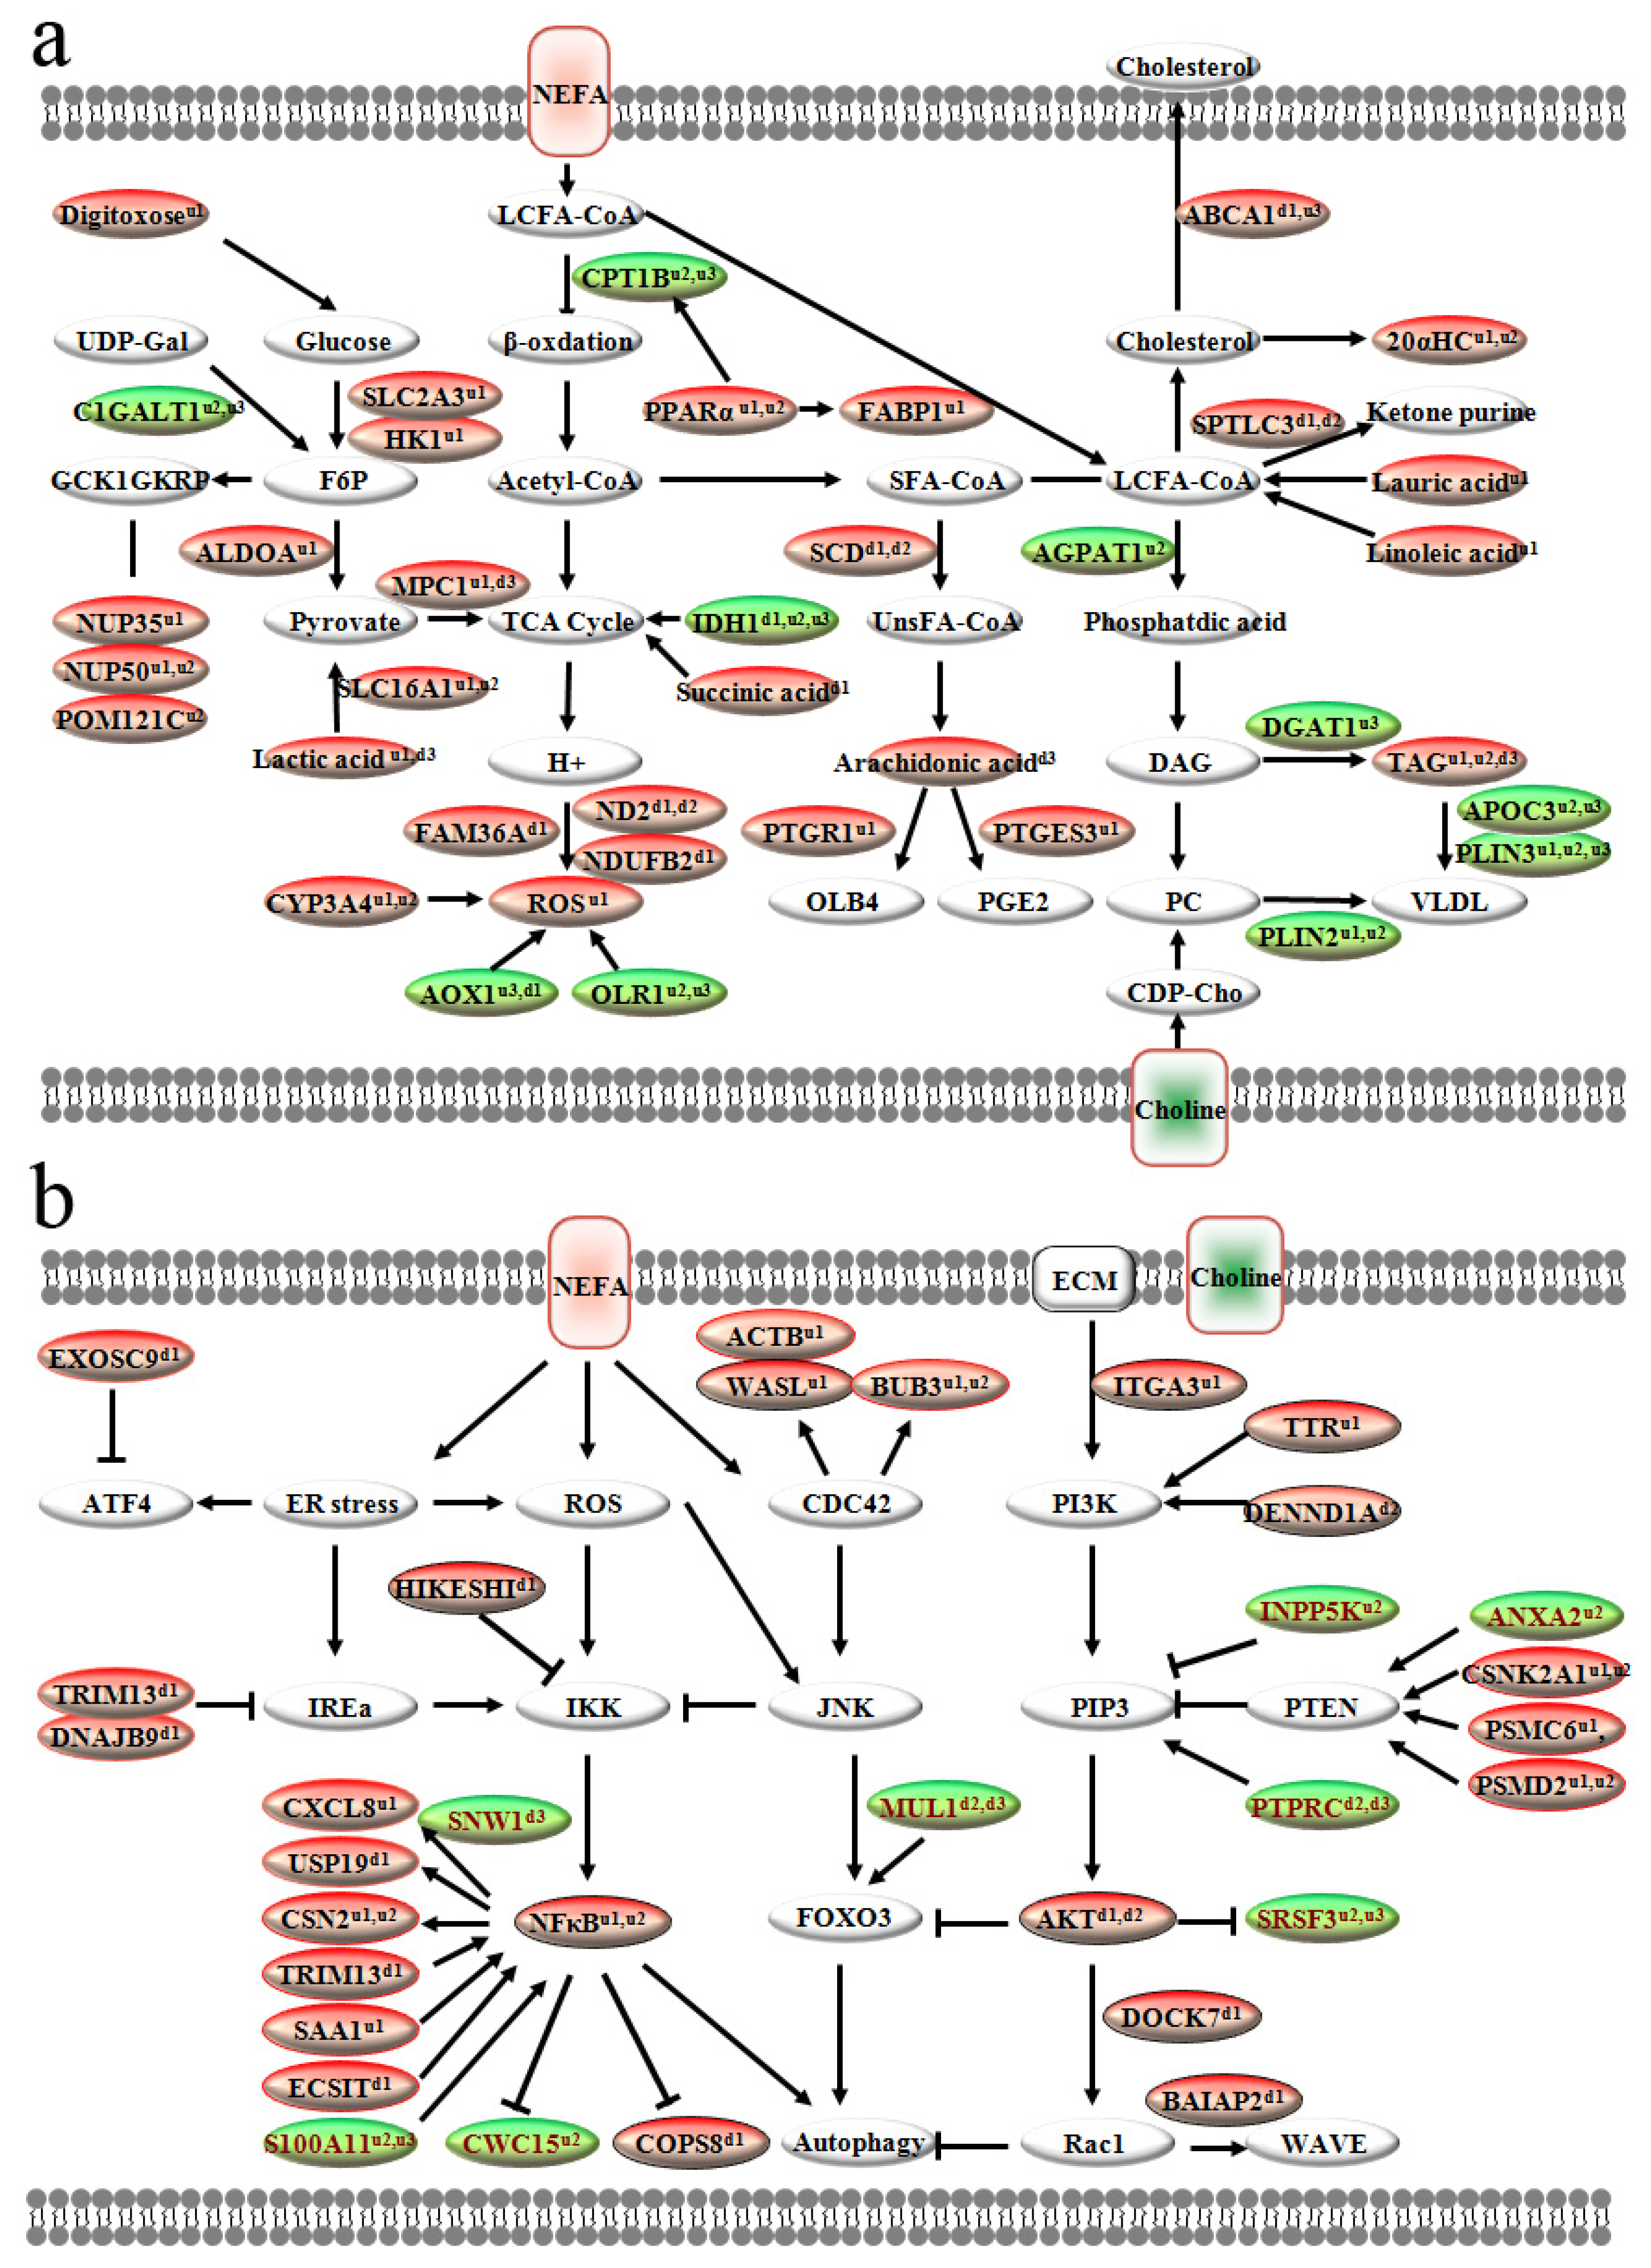
To integrate the proteomic and metabolomic findings, we constructed a schematic overview of the major regulatory pathways altered by high NEFA treatment and subsequent choline supplementation (Figure 6). Under NEFA challenge (Panel a), key proteins involved in glycolysis (HK1, ALDOA) and lactate production (SLC16A1) were upregulated, while TCA cycle flux was enhanced (IDH1, succinic acid). Concurrently, NEFA promoted β-oxidation via increased CPT1B and PPARα but induced oxidative stress through elevated ROS and dysregulated CYP3A4/AOX1. These metabolic perturbations were partially reversed by choline supplementation, which restored VLDL secretion (DGAT1, APOC3, PLIN3) and promoted fatty acid export.
Figure 6.
Schematic overview of major differentially abundant proteins and metabolite pathways modulated by choline in high NEFA-challenged calf hepatocytes. (a) Lipid metabolism-related signaling pathways regulated by NEFA and choline intervention; (b) Endoplasmic reticulum stress and inflammatory signaling pathways affected by NEFA and choline treatment. Hepatocytes were incubated for 12 h with (1) no NEFA (control); (2) 1.2 mM NEFA (composition: c9-18:1 43.5%, 18:2 4.9%, 16:0 31.9%, 18:0 14.4%, c9-16:1 5.3%); or (3) 1.2 mM NEFA for 6 h followed by 10 μM choline chloride for another 6 h (NEFA + Chol). Proteins and metabolites are colored based on their response: red, altered by NEFA vs. control; green, altered by choline vs. NEFA. Arrows indicate positive regulation, T-bars indicate negative regulation, and solid lines indicate direct interactions. Superscripts denote comparisons: u1, higher abundance in NEFA vs. control; u2, higher in NEFA + Chol vs. control; u3, higher in NEFA + Chol vs. NEFA; d1, lower in NEFA vs. control; d2, lower in NEFA + Chol vs. control; d3, lower in NEFA + Chol vs. NEFA.
At the signaling level (Panel b), NEFA exposure activated ER stress (ATF4, IRE1α) and the CDC42/JNK pathway, triggering downstream inflammatory (NF-κB) and autophagic responses. Choline treatment attenuated these stress signals by modulating PI3K/AKT/Rac signaling, reducing autophagy-related proteins (MUL1, COPS8), and suppressing NF-κB-mediated inflammation. Collectively, the integrated network illustrates that choline counteracts NEFA-induced lipotoxicity by restoring lipid export, improving mitochondrial function, and inhibiting stress-related inflammatory and autophagic cascades.
4. Discussion
Neonatal calves and periparturient dairy cows differ greatly in hepatic physiological function and metabolic traits, covering lipid metabolism, mitochondrial oxidative activity, and VLDL secretion capacity. Negative energy balance in periparturient cows accelerates adipose lipolysis and massive release of non-esterified fatty acids [14]. Excessive hepatic NEFA accumulation induces mitochondrial dysfunction and oxidative stress [15]. Impaired VLDL assembly and secretion restricts hepatic triglyceride export, leading to lipid deposition and hepatic metabolic disorders [16]. Unlike stress-related metabolic disturbance in periparturient cows, healthy neonatal calves possess an immature but metabolically steady liver. They present faint endogenous lipid mobilization, low basal mitochondrial oxidation, and weak VLDL secretion, without spontaneous lipid overload and oxidative damage [17]. Considering these inherent metabolic discrepancies, exogenous NEFA was used to treat neonatal calf hepatocytes in this study, so as to simulate the hepatocyte model of periparturient dairy cows.
Although several recent studies have enhanced the mechanistic understanding of the role of choline in the context of the physiology of the peripartal cow [18], studying mechanistic aspects of the metabolism of these nutrients in the liver in vivo is very challenging. Although there are drawbacks in using calf hepatocytes to address liver metabolism at the whole-animal level, this model allows for performing a more controlled evaluation of nutrient metabolism beyond the well-studied metabolic pathways [19]. Thus, choline was supplemented after 6 h of NEFA treatment to establish a therapeutic intervention model that mimics clinical scenarios in which fatty liver has already developed. In the current study, high-throughput methods were used to assess the proteome and metabolome spectra in response to NEFA and choline supply.
4.1. Responses to a Fatty Acid Challenge
In non-ruminants, under normal conditions, hepatocytes metabolize glucose into pyruvate, which is further metabolized to carbon dioxide in the mitochondria through the TCA cycle and oxidative phosphorylation (OXPHOS) for ATP production [20]. In this research, hepatocytes treated with NEFA showed high glycolysis with high HK1 and ALDOA, which promote glucose to fructose 6-phosphate and finally pyruvate, and high SLC16A1express which regulate transform between pyruvate and lactate. Liver disease, such as non-alcoholic fatty liver disease (NAFLD), is associated with defective mitochondrial OXPHOS and an increase in reactive oxygen species (ROS) production [19]. In addition, progressive hepatocyte damage was characterized by greater abundance of HK1 and ALDOA, and lactate production [21], supporting other data demonstrating that hepatocytes under these conditions increase the rate of glycolysis with consequent lactate production and efflux via the SLC16A1 [22]. Thus, the fact that in the present study hepatocytes treated with NEFA had a greater abundance of SLC16A1 and lactate production also indicated that the rate of glycolysis increased in response to excess NEFA.
Among glycolytic intermediates, fructose 6-phosphate stimulates nuclear pore protein nucleoporin 35 (NUP35), nuclear pore protein nucleoporin 50 (NUP50), and nuclear envelope pore membrane protein (POM121C) to translocate to the nucleus [23] along with the complex of glucokinase (GCK1) and glucokinase regulatory protein (GKRP) [24]. In addition, the greater abundance of MPC1, which cotransports pyruvate from the mitochondrial intermembrane space to the mitochondrial matrix [25], is an example of a low-carbohydrate state in cells treated with NEFA alone. Taken together, the greater abundance in metabolism of carbohydrates (e.g., NUP35) and TCA cycle (e.g., MPC1)-related proteins in hepatocytes challenged with NEFA reinforced the idea of an increase in glycolysis rates and TCA cycle activity due to high levels of fatty acids.
Oxidation of fatty acids and pyruvate in the mitochondrial matrix yields large amounts of NADH. The respiratory electron transport chain couples the NADH to NAD+ to the export of protons from the mitochondrial matrix. In this study, hepatocytes treated with NEFA showed a lesser abundance of respiratory electron transport chain regulators FAM36A, ND2, and NDUFB2. FAM36A is an important factor in the early steps of mitochondrial cytochrome c oxidase assembly that promotes the mitochondrial gene product COX20 and its assembly into the mitochondrial inner membrane CCO complex [26]. ND2 and NDUFB2 participate in mitochondrial Complex I, which utilizes NADH to pump protons out of the mitochondrial matrix. The lesser abundance of FAM36A, ND2, and NDUFB2 in response to NEFA challenge suggested an impairment in the respiratory electron transport chain, e.g., CCO complex and Complex I may have been damaged, likely due to excessive superoxide production and increased oxidative stress [27,28,29]. Under those conditions, liver cells trigger protective programs against ROS-inflicted cell death, rather than mitochondrial metabolism that contributes to the generation of ROS. This biological response corroborates previous work in patients with NAFLD and supports the idea of increased β-oxidation and lactate accumulation in liver cells exposed to high levels of fatty acids [30].
De novo fatty acid synthesis to form TAG and direct re-esterification to form VLDL are the main metabolic pathways of fatty acids in the liver. In this study, hepatocytes treated with NEFA showed significantly higher concentrations of TAG and linoleic acid (LA) and downregulated stearoyl-coenzyme A desaturase 1 (SCD1). SCD1 is the enzyme responsible for catalyzing the endogenous desaturation of saturated fatty acids (SFAs) to the synthesis of monounsaturated fatty acids, i.e., mainly oleate and palmitoleate. These fatty acids can be used as substrates for the synthesis of TAG, cholesterol esters, and phospholipids (PL) [31]. Greater expression of SCD1 in different rodent cell lines supplemented with SFA was associated with SFA incorporation into TAG species. Our recent study showed lower SCD1 mRNA abundance in calf hepatocytes challenged with oleic acid (OA), LA, and palmitoleic acid (POA) compared with palmitic acid (PA) and stearic acid (SA)-treated cells, and this study also showed that SFA causes more severe oxidative and endoplasmic reticulum stress, while unsaturated fatty acids cause marked lipid accumulation [32]. Although SCD1 can prevent liver injury, mostly by partitioning the excess of lipids into monounsaturated fatty acids that can be safely stored in the liver, the lesser abundance of SCD1 in NEFA-challenged hepatocytes suggests reduced cell viability due to induced apoptosis and autophagy as previously reported in non-ruminants [33].
Dysregulation of lipid metabolism, insulin signaling, inflammation, and immune response has an important role in NAFLD pathogenesis. The PI3K/AKT pathway is considered a link between inflammation and NAFLD, and decreased PI3K/AKT-related proteins were observed in NAFLD induced through both high-fat diet and genetic factors [34,35,36]. Within this pathway, the lesser abundance observed in PI3K/AKT regulation factors AKT, DENN domain containing 1A (DENND1A), dedicator of cytokinesis 7 (DOCK7), along with the upregulation in negative regulation factors PTEN, and INPP5K protein (INPP5K), are examples of decreased PI3K/AKT/RAC-related proteins, and indicate increased mitochondrial autophagy during a fatty acid challenge. In humans, DENND1A was reported as an activator of the PI3K/AKT signaling pathway [37]. PI3K plays a key role in glucose and lipid metabolism, and PTEN can dephosphorylate the second messengers generated by the activation of PI3K, thereby downregulating the PI3K downstream signal [38]. In addition, INPP5K has been suggested to negatively regulate PI3K levels. At least in non-ruminants, INPP5K heterozygotes are insulin sensitive with modest resistance to diet-induced obesity, and reinforce a negative role of INPP5K in AKT signaling [39]. A key function of AKT is to activate lipogenesis, in part via the mammalian target of rapamycin complex 1 (mTORC1) signaling complex. The activation of the PI3K/AKT pathway enables RAC family small GTPase 1 (RAC1) to bind to and activate NADPH oxidase, ultimately leading to the production of H2O2, which induces ROS production [40]. To balance the proliferative and survival advantage of moderate ROS levels versus their damaging effect at high concentrations, cells undergo a redox adaptation process through the induction of the antioxidant response [41]. Annexin A2 (ANXA2) plays a key role in protecting cells from ROS-induced death by positively regulating PTEN activity, hence, inhibiting the PI3K/AKT pathway [42]. Furthermore, FOXO3 induces ubiquitylation of AKT through mitochondrial E3 ubiquitin-protein ligase 1 (MUL1) regulation. Thus, the upregulation in PTEN, along with depressed PI3K/AKT/RAC-related proteins in response to NEFA challenge, might be a negative feedback mechanism by NEFA-induced lipotoxicity.
The transcription factor NFκB is activated by different pathogenic stimuli, including growth factors, cytokines, radiation, and oxidative stress. Activation of NFκB controls many genes involved in inflammatory processes, and high levels of NEFA were associated with NFκB activation due to increased oxidative stress [43,44]. AKT positively influences IKK (IκB kinase)-mediated NFκB activation through the downstream activation of mTORC1, while LPS-induced NFκB phosphorylation was unaffected by the inhibitor of PI3K in mouse macrophages [45]. In addition, the activation of the ROS/NFκB axis supported changes in catabolism of eicosanoids and lipid peroxidation status through greater abundance of prostaglandin reductase-1 (PTGR1) in response to NEFA challenge. Thus, we speculate that high levels of NEFA-induced ROS might modulate NFκB activation and its target genes in an attempt to dampen oxidative stress [43,46].
In the present study, NEFA-challenged hepatocytes showed a greater abundance of cell division cycle 42 (CDC42) pathway-related proteins, e.g., actin cytoplasmic (ACTB), neural Wiskott–Aldrich syndrome protein (WASL), and mitotic checkpoint protein BUB3 (BUB3), coupled with lower RAC pathway-related proteins, e.g., DOCK7 and brain-specific angiogenesis inhibitor 1-associated protein 2 (BAIAP2), suggesting an overall increase in cell adhesion damage. CDC42 is known to play important roles in the organization of the cytoskeleton, cell proliferation, cell polarity, cellular transport, and is necessary for the proper regulation of hepatocytes’ lipid metabolism [47]. In rodents, hepatocyte-specific deletion of CDC42 disrupted intracellular localization of ATP-binding cassette subfamily A member 1 (ABCA1) and was associated with delayed liver regeneration after partial hepatectomy [48]. These data, along with the responses in CDC42/JNK pathway-related proteins when hepatocytes were challenged with NEFA, might help explain a cellular overload and increased mitochondrial autophagy.
At least in non-ruminants, CDC42 and RAC1 are major contributors to the SFA-stimulated JNK pathway in hepatocytes [49]. The overexpression of RAC1 and CDC42 in fibroblasts revealed that only a greater abundance of CDC42 induced NFκB. As in our current study, these responses were associated with increased autophagy and glycolytic metabolism, coupled with a marked decrease in mitochondrial activity. Regardless of differences in the cellular type, taken together, these results suggested that CDC42 stimulates JNK more potently. As such, it can be speculated that RAC1 can potently activate both JNK and AKT kinases, and initiate an AKT-dependent (but NFκB-independent) survival mechanism, which is prevalent over the apoptotic signals mediated by JNK [50]. Furthermore, previous studies suggested that NEFA-induced activation of the CDC42/JNK pathway and the ROS/NFκB axis, along with inhibition of PI3K/AKT/RAC1, led to greater mitochondrial autophagy in rodent hepatocytes [51,52,53,54]. Thus, the findings of CDC42 and NFκB-related proteins led us to focus on targets that could play a relevant role in cell autophagy and inflammatory processes.
4.2. Responses to Increased Choline Supply
Although the effects of choline supplementation in reducing liver TAG are inconsistent in studies conducted with dairy cattle, those studies that showed beneficial effects associated such responses with an increase in PC synthesis through the CDP–choline pathway [55]. In addition, recent work with dairy cows reported upregulation of apolipoproteins-related genes due to increased post-ruminal choline supply [11,56]. These lipoproteins provide support for enhanced hepatic synthesis of VLDL, which plays a fundamental role in reducing liver TAG accumulation and was underscored as the main explanation for the positive effects of choline supply on liver lipid metabolism [57]. Previous work suggested that synthesis of TAG, rather than being symptomatic of hepatic lipid overload, actually serves a protective role by enhancing lipid droplet formation and alleviating the potential for NEFA to induce a lipotoxic effect [3]. This effect was observed in the present study through greater TAG in hepatocytes incubated with NEFA and NEFA + Chol. However, the lower TAG concentrations in NEFA + Chol compared with NEFA cells can be partly explained by the greater abundance of DGAT1, APOC3, and PLIN3 in choline-supplemented cells.
From a mechanistic standpoint, the fact that DGAT1 exhibits substrate preference for exogenously derived NEFA for TAG synthesis and incorporation into VLDL agrees with the present in vitro results. In the same way, a recent study conducted with murine models associated a greater DGAT1 expression with increased export of liver TAG and underscored the importance of this key metabolic enzyme on lipid metabolism and extra-hepatic fat partitioning [3]. At least in humans, APOC3 is associated with hepatic VLDL assembly/secretion under lipid-rich conditions and is directly linked to a reduction in liver TAG [58]. The greater APOC3 with choline supply suggested an increase in VLDL assembly and corroborates data in peripartal dairy cows receiving rumen-protected choline. Thus, the greater APOC3 in response to increased choline supply was another indication of liver TAG reduction in choline-treated hepatocytes during a NEFA challenge.
Lipid droplets are surrounded by a phospholipid monolayer and coated with unique proteins. Among the perilipin family, perilipin 2 (PLIN2) and PLIN3 are the predominant lipid droplet-associated proteins [19]. PLIN2 has a high affinity for PC, which supports the increase in TAG and VLDL concentrations detected in the NEFA + Chol versus non-challenged cells. Lower levels of PLIN2 result in the formation of smaller lipid droplets [59], which were observed in the control group. Under normal conditions, unlike PLIN2, PLIN3 targets nascent lipid droplets primarily and stimulates lipid storage. However, PLIN3 also participates in the process of lipid droplet dispersion, suggesting that a greater abundance of PLIN3 in the NEFA + Chol cells may have facilitated lipolysis and β-oxidation of fatty acids [60]. Furthermore, a study in knockout mice showed that silencing of MPC1 activity boosted fatty acid oxidation [61], and this behavior seemed to have occurred in choline-treated cells due to the lesser abundance of MPC1in NEFA + Chol versus NEFA cells. Thus, besides reducing lipotoxicity by promoting the elimination of TAG in the form of VLDL, the present data suggested that choline might have enhanced mitochondrial β-oxidation and facilitated fatty acid oxidation as recently reported in vivo.
The enzyme CPT1 catalyzes the conversion of long-chain fatty acyl-CoAs into acylcarnitine for transport into the mitochondrial matrix for β-oxidation to acetyl-CoA, followed by metabolism via the TCA cycle or ketogenesis [62]. Greater CPT1B in the NEFA + Chol compared with the NEFA group suggested an increase in mitochondrial fatty acid degradation, and was consistent with the increased fatty acid mitochondrial oxidation in the liver of cows supplemented with post-ruminal choline [63]. These responses observed due to increased choline supply might be related to an increased availability of methyl donors within hepatocytes as a result of greater choline availability [56]. In rodents, a greater abundance of liver CPT1A gene expression was associated with increased betaine-homocysteine methyltransferase (BHMT) activity and consequent effects on DNA methylation of the PPARα promoter region [64]. As BHMT catalyzes the transfer of a methyl group from betaine to homocysteine to generate Met [65], we speculated that increased availability of Met might have led to changes in DNA methylation and transcriptional regulation. Similar responses with CPT1A upregulation were also observed in human hepatocytes treated with choline [66]. Although BHMT and PPARα effects were not confirmed directly in the present study, modulation of one-carbon metabolism with increased availability of methyl donors (e.g., choline and Met) supports the increase in CPT1A [56].
Integrated analysis of metabolomic and proteomic data revealed coordinated alterations in hepatic metabolic networks. In NEFA-challenged hepatocytes, enhanced glycolysis (elevated HK1, ALDOA, SLC16A1) was accompanied by increased lactate and TCA cycle intermediates, indicating a metabolic shift toward anaerobic metabolism. In addition, previous studies have demonstrated that NEFA exposure enhances mitochondrial autophagy in calf hepatocytes, as evidenced by increased protein abundance of LC3-II and p62 [67]. Meanwhile, NEFA suppresses fatty acid oxidation, promotes excessive ROS production, and elevates mitochondrial membrane potential [68]. Impaired mitochondrial respiratory chain proteins (FAM36A, ND2, NDUFB2) coincided with oxidative stress and activated ROS/NFκB signaling, which further triggered mitochondrial autophagy. Choline supplementation restored lipid homeostasis by enhancing VLDL secretion (DGAT1, APOC3, PLIN3) and mitochondrial β-oxidation (CPT1B), while reducing inflammation and autophagy. These coordinated changes across the proteome and metabolome demonstrate that choline alleviates NEFA-induced lipotoxicity by restoring mitochondrial function, lipid export, and cellular redox balance.
Notably, although calf hepatocytes were widely used to elucidate regulatory mechanisms of hepatic lipid metabolism in adult ruminants [69,70], caution should be exercised when extrapolating findings from 1-day-old calves due to distinct age-related differences in hepatic lipid metabolism. Because there are clear differences in aspects of lipid metabolism as a function of age [17]. Although the current in vitro experimental data indicat abundance e that choline can restore mitochondrial function, lipid output, and cellular redox balance, the actual role of choline in the metabolism of dairy cow liver remains to be determined.
5. Conclusions
Data suggested that calf hepatocytes treated with high NEFA concentrations respond by enhancing glycolysis rate and lactate accumulation, along with increased TCA cycle activity. Activation of the CDC42/JNK pathway and ROS/NFκB axis, along with lesser abundance in PI3K/AKT/RAC-related proteins, also indicated increased mitochondrial autophagy and impaired respiratory transport chain in response to NEFA. As observed in some in vivo studies with dairy cows, the increased supply of choline in vitro reduced NEFA-induced hepatocyte TAG accumulation. This response occurred partly through enhanced VLDL secretion, increased mitochondrial β-oxidation, coupled with a lower degree of lactate accumulation, cellular autophagy, and inflammation.
This study improves our understanding of hepatic lipid metabolism disorders in transition dairy cows and offers a theoretical basis for nutritional intervention strategies. The application prospects of these results include optimizing rumen-protected choline supplementation regimens to prevent and alleviate fatty liver and metabolic stress in periparturient dairy cows, thereby improving liver health, metabolic stability, and productive performance in modern dairy farming.
Author Contributions
Y.C., B.J., Y.W., J.J.L., B.Z. and W.Y. designed this project. Y.S., Z.Z., J.L., Y.G., J.W. and Y.W. performed the experiments and analyzed the results. Y.C. revised the manuscript. W.Y. and B.Z. drafted this paper. All authors have read and agreed to the published version of the manuscript.
Funding
This work was supported by Longjiang Technology Talent “Chunyan” Support Program Youth Team (CYQN24048).
Institutional Review Board Statement
The animal use protocol complied with the Ethics Committee for the Use and Care of Animals, Heilongjiang Bayi Agricultural University (approval No. SMKXJSXY2022003, dated 10 March 2022). The study was conducted in accordance with the local legislation and institutional requirements.
Informed Consent Statement
Not applicable.
Data Availability Statement
The original contributions presented in this study are included in the article. Further inquiries can be directed to the corresponding author(s).
Conflicts of Interest
The authors declare no conflicts of interest.
Appendix A
Table A1.
Sequences of primers used for real-time PCR amplification.
References
- Sejersen, H.; Sorensen, M.T.; Larsen, T.; Bendixen, E.; Ingvartsen, K.L. Liver protein expression in dairy cows with high liver triglycerides in early lactation. J. Dairy Sci. 2012, 95, 2409–2421. [Google Scholar] [CrossRef] [Scilit] [PubMed]
- Yang, W.; Zhang, B.; Xu, C.; Zhang, H.; Xia, C. Effects of Ketosis in Dairy Cows on Blood Biochemical Parameters, Milk Yield and Composition, and Digestive Capacity. J. Vet. Res. 2019, 63, 555–560. [Google Scholar] [CrossRef] [Scilit] [PubMed]
- Yang, W.; Wang, S.; Loor, J.J.; Lopes, M.G.; Zhao, Y.; Ma, X.; Li, M.; Zhang, B.; Xu, C. Role of diacylglycerol O-acyltransferase (DGAT) isoforms in bovine hepatic fatty acid metabolism. J. Dairy Sci. 2022, 105, 3588–3600. [Google Scholar] [CrossRef] [Scilit] [PubMed]
- Wang, F.; Guo, Y.; Su, X.; Cao, J. Choline as a Modulator of Periparturient Diseases in Dairy Cows. Vet. Sci. 2025, 12, 1016. [Google Scholar] [CrossRef] [Scilit] [PubMed]
- Arshad, U.; Husnain, A.; Poindexter, M.B.; Zimpel, R.; Nelson, C.D.; Santos, J.E.P. Rumen-protected choline reduces hepatic lipidosis by increasing hepatic triacylglycerol-rich lipoprotein secretion in dairy cows. J. Dairy Sci. 2023, 106, 7630–7650. [Google Scholar] [CrossRef] [Scilit] [PubMed]
- Cooke, R.F.; Silva Del Rio, N.; Caraviello, D.Z.; Bertics, S.J.; Ramos, M.H.; Grummer, R.R. Supplemental choline for prevention and alleviation of fatty liver in dairy cattle. J. Dairy Sci. 2007, 90, 2413–2418. [Google Scholar] [CrossRef] [Scilit] [PubMed]
- Zom, R.L.; van Baal, J.; Goselink, R.M.; Bakker, J.A.; de Veth, M.J.; van Vuuren, A.M. Effect of rumen-protected choline on performance, blood metabolites, and hepatic triacylglycerols of periparturient dairy cattle. J. Dairy Sci. 2011, 94, 4016–4027. [Google Scholar] [CrossRef] [Scilit] [PubMed]
- Humer, E.; Bruggeman, G.; Zebeli, Q. A Meta-Analysis on the Impact of the Supplementation of Rumen-Protected Choline on the Metabolic Health and Performance of Dairy Cattle. Animals 2019, 9, 566. [Google Scholar] [CrossRef] [Scilit] [PubMed]
- Arshad, U.; Zenobi, M.G.; Staples, C.R.; Santos, J.E.P. Meta-analysis of the effects of supplemental rumen-protected choline during the transition period on performance and health of parous dairy cows. J. Dairy Sci. 2020, 103, 282–300. [Google Scholar] [CrossRef] [Scilit] [PubMed]
- Carlson, D.B.; McFadden, J.W.; D’Angelo, A.; Woodworth, J.C.; Drackley, J.K. Dietary L-carnitine affects periparturient nutrient metabolism and lactation in multiparous cows. J. Dairy Sci. 2007, 90, 3422–3441. [Google Scholar] [CrossRef] [Scilit] [PubMed]
- Goselink, R.M.; van Baal, J.; Widjaja, H.C.; Dekker, R.A.; Zom, R.L.; de Veth, M.J.; van Vuuren, A.M. Effect of rumen-protected choline supplementation on liver and adipose gene expression during the transition period in dairy cattle. J. Dairy Sci. 2013, 96, 1102–1116. [Google Scholar] [CrossRef] [Scilit] [PubMed]
- Du, X.; Shi, Z.; Peng, Z.; Zhao, C.; Zhang, Y.; Wang, Z.; Li, X.; Liu, G.; Li, X. Acetoacetate induces hepatocytes apoptosis by the ROS-mediated MAPKs pathway in ketotic cows. J. Cell Physiol. 2017, 232, 3296–3308. [Google Scholar] [CrossRef] [Scilit] [PubMed]
- Liu, L.; Li, X.; Li, Y.; Guan, Y.; Song, Y.; Yin, L.; Chen, H.; Lei, L.; Liu, J.; Li, X.; et al. Effects of nonesterified fatty acids on the synthesis and assembly of very low density lipoprotein in bovine hepatocytes in vitro. J. Dairy Sci. 2014, 97, 1328–1335. [Google Scholar] [CrossRef] [Scilit] [PubMed]
- Ghorbanalinia, M.; Dirandeh, E.; Ansari-Pirsaraei, Z.; Sadri, H.; Thatcher, W.W. Modulation of fat mobilization and adipose tissue gene expression in Holstein cows supplemented with omega-3 fatty acids and N-acetyl-tryptophan during the transition period. Sci. Rep. 2026, 16, 7785. [Google Scholar] [CrossRef] [Scilit] [PubMed]
- Wen, Y.; Wang, Y.; Loor, J.J.; Zhao, C.; Wang, J. Non-esterified fatty acids disrupt hepatic lipid metabolism and mitochondrial function via TLR4/MyD88/IRAK2 signaling in bovine hepatocytes. J. Steroid Biochem. Mol. Biol. 2025, 253, 106813. [Google Scholar] [CrossRef] [Scilit] [PubMed]
- Xing, D.; Wang, B.; Lu, H.; Peng, T.; Su, J.; Lei, H.; He, J.; Zhou, Y.; Liu, L. Sirtuin 3 Restores Synthesis and Secretion of Very Low-Density Lipoproteins in Cow Hepatocytes Challenged with Nonesterified Fatty Acids In Vitro. Vet. Sci. 2021, 8, 121. [Google Scholar] [CrossRef] [Scilit] [PubMed]
- Hahn, O.; Grönke, S.; Stubbs, T.M.; Ficz, G.; Hendrich, O.; Krueger, F.; Andrews, S.; Zhang, Q.; Wakelam, M.J.; Beyer, A.; et al. Dietary restriction protects from age-associated DNA methylation and induces epigenetic reprogramming of lipid metabolism. Genome Biol. 2017, 18, 56. [Google Scholar] [CrossRef] [Scilit] [PubMed]
- Zenobi, M.G.; Gardinal, R.; Zuniga, J.E.; Mamedova, L.K.; Driver, J.P.; Barton, B.A.; Santos, J.E.P.; Staples, C.R.; Nelson, C.D. Effect of prepartum energy intake and supplementation with ruminally protected choline on innate and adaptive immunity of multiparous Holstein cows. J. Dairy Sci. 2020, 103, 2200–2216. [Google Scholar] [CrossRef] [Scilit] [PubMed]
- Wang, S.; Zhang, B.; Mauck, J.; Loor, J.J.; Fan, W.; Tian, Y.; Yang, T.; Chang, Y.; Xie, M.; Aernouts, B.; et al. Diacylglycerol O-acyltransferase isoforms play a role in peridroplet mitochondrial fatty acid metabolism in bovine liver. J. Dairy Sci. 2024, 107, 9897–9914. [Google Scholar] [CrossRef] [Scilit] [PubMed]
- Lee, N.C.W.; Carella, M.A.; Papa, S.; Bubici, C. High Expression of Glycolytic Genes in Cirrhosis Correlates with the Risk of Developing Liver Cancer. Front. Cell Dev. Biol. 2018, 6, 138. [Google Scholar] [CrossRef] [Scilit] [PubMed]
- Li, X.; Jiang, F.; Ge, Z.; Chen, B.; Yu, J.; Xin, M.; Wang, J.; An, L.; Wei, J.; Wu, L. Fructose-Bisphosphate Aldolase A Regulates Hypoxic Adaptation in Hepatocellular Carcinoma and Involved with Tumor Malignancy. Dig. Dis. Sci. 2019, 64, 3215–3227. [Google Scholar] [CrossRef] [Scilit] [PubMed]
- Mukai, Y.; Yamaguchi, A.; Sakuma, T.; Nadai, T.; Furugen, A.; Narumi, K.; Kobayashi, M. Involvement of SLC16A1/MCT1 and SLC16A3/MCT4 in l-lactate transport in the hepatocellular carcinoma cell line. Biopharm. Drug Dispos. 2022, 43, 183–191. [Google Scholar] [CrossRef] [Scilit] [PubMed]
- Beck, T.; Miller, B.G. Structural basis for regulation of human glucokinase by glucokinase regulatory protein. Biochemistry 2013, 52, 6232–6239. [Google Scholar] [CrossRef] [Scilit] [PubMed]
- Shiota, C.; Coffey, J.; Grimsby, J.; Grippo, J.F.; Magnuson, M.A. Nuclear import of hepatic glucokinase depends upon glucokinase regulatory protein, whereas export is due to a nuclear export signal sequence in glucokinase. J. Biol. Chem. 1999, 274, 37125–37130. [Google Scholar] [CrossRef] [Scilit] [PubMed]
- Sun, Y.; Wang, Y.; Xing, Z.; Li, D.; Wang, R.; Chen, B.; Zhou, N.; Ayala, A.; Tu, B.P.; Qi, X. Structure of human mitochondrial pyruvate carrier MPC1 and MPC2 complex. Nat. Commun. 2025, 16, 6700. [Google Scholar] [CrossRef] [Scilit] [PubMed]
- Nieto-Panqueva, F.; Vazquez-Acevedo, M.; Hamel, P.P.; Gonzalez-Halphen, D. Identification of factors limiting the allotopic production of the Cox2 subunit of yeast cytochrome c oxidase. Genetics 2024, 227, iyae058. [Google Scholar] [CrossRef] [Scilit] [PubMed]
- Nassir, F.; Ibdah, J.A. Role of mitochondria in nonalcoholic fatty liver disease. Int. J. Mol. Sci. 2014, 15, 8713–8742. [Google Scholar] [CrossRef] [Scilit] [PubMed]
- Haubold, S.; Kroger-Koch, C.; Starke, A.; Tuchscherer, A.; Troscher, A.; Kienberger, H.; Rychlik, M.; Bernabucci, U.; Trevisi, E.; Hammon, H.M. Effects of abomasal infusion of essential fatty acids and conjugated linoleic acid on performance and fatty acid, antioxidative, and inflammatory status in dairy cows. J. Dairy Sci. 2020, 103, 972–991. [Google Scholar] [CrossRef] [Scilit] [PubMed]
- Shi, Z.; Li, X.B.; Peng, Z.C.; Fu, S.P.; Zhao, C.X.; Du, X.L.; Fang, Z.Y.; Wang, Z.; Liu, G.W.; Li, X.W. Berberine Protects against NEFA-Induced Impairment of Mitochondrial Respiratory Chain Function and Insulin Signaling in Bovine Hepatocytes. Int. J. Mol. Sci. 2018, 19, 1691. [Google Scholar] [CrossRef] [Scilit] [PubMed]
- Wu, G.; Dai, Y.; Yan, Y.; Zheng, X.; Zhang, H.; Li, H.; Chen, W. The lactate receptor GPR81 mediates hepatic lipid metabolism and the therapeutic effect of metformin on experimental NAFLDs. Eur. J. Pharmacol. 2022, 924, 174959. [Google Scholar] [CrossRef] [Scilit] [PubMed]
- Dziewulska, A.; Dobosz, A.M.; Dobrzyn, A.; Smolinska, A.; Kolczynska, K.; Ntambi, J.M.; Dobrzyn, P. SCD1 regulates the AMPK/SIRT1 pathway and histone acetylation through changes in adenine nucleotide metabolism in skeletal muscle. J. Cell. Physiol. 2020, 235, 1129–1140. [Google Scholar] [CrossRef] [Scilit] [PubMed]
- Zhang, B.; Yang, W.; Wang, S.; Liu, R.; Loor, J.J.; Dong, Z.; Zhao, Y.; Ma, X.; Xia, C.; Xu, C. Lipid Accumulation and Injury in Primary Calf Hepatocytes Challenged with Different Long-Chain Fatty Acids. Front. Vet. Sci. 2020, 7, 547047. [Google Scholar] [CrossRef] [Scilit] [PubMed]
- Piccinin, E.; Cariello, M.; De Santis, S.; Ducheix, S.; Sabba, C.; Ntambi, J.M.; Moschetta, A. Role of Oleic Acid in the Gut-Liver Axis: From Diet to the Regulation of Its Synthesis via Stearoyl-CoA Desaturase 1 (SCD1). Nutrients 2019, 11, 2283. [Google Scholar] [CrossRef] [Scilit] [PubMed]
- Scita, G.; Tenca, P.; Frittoli, E.; Tocchetti, A.; Innocenti, M.; Giardina, G.; Di Fiore, P.P. Signaling from Ras to Rac and beyond: Not just a matter of GEFs. EMBO J. 2000, 19, 2393–2398. [Google Scholar] [CrossRef] [Scilit] [PubMed]
- Balaji, V.; Pokrzywa, W.; Hoppe, T. Ubiquitylation Pathways In Insulin Signaling and Organismal Homeostasis. Bioessays 2018, 40, e1700223. [Google Scholar] [CrossRef] [Scilit] [PubMed]
- Yang, P.; Liang, Y.; Luo, Y.; Li, Z.; Wen, Y.; Shen, J.; Li, R.; Zheng, H.; Gu, H.F.; Xia, N. Liraglutide ameliorates nonalcoholic fatty liver disease in diabetic mice via the IRS2/PI3K/Akt signaling pathway. Diabetes Metab. Syndr. Obes. 2019, 12, 1013–1021. [Google Scholar] [CrossRef] [Scilit] [PubMed]
- Kadioglu, E.; Altun, B.; Ipek, C.; Doger, E.; Bideci, A.; Attaran, H.; Cok, I. The role of DENND1A and CYP19A1 gene variants in individual susceptibility to obesity in Turkish population—A preliminary study. Mol. Biol. Rep. 2018, 45, 2193–2199. [Google Scholar] [CrossRef] [Scilit] [PubMed]
- Sun, Y.; Zhang, H.; Meng, J.; Guo, F.; Ren, D.; Wu, H.; Jin, X. S-palmitoylation of PCSK9 induces sorafenib resistance in liver cancer by activating the PI3K/AKT pathway. Cell Rep. 2022, 40, 111194. [Google Scholar] [CrossRef] [Scilit] [PubMed]
- Bridges, D.; Saltiel, A.R. Phosphoinositides: Key modulators of energy metabolism. Biochim. Biophys. Acta 2015, 1851, 857–866. [Google Scholar] [CrossRef] [Scilit] [PubMed]
- Chang, J.G.; Tien, N.; Chang, Y.C.; Lin, M.L.; Chen, S.S. Oxidative Stress-Induced Unscheduled CDK1-Cyclin B1 Activity Impairs ER-Mitochondria-Mediated Bioenergetic Metabolism. Cells 2021, 10, 1280. [Google Scholar] [CrossRef] [Scilit] [PubMed]
- Castaldo, S.A.; Freitas, J.R.; Conchinha, N.V.; Madureira, P.A. The Tumorigenic Roles of the Cellular REDOX Regulatory Systems. Oxid. Med. Cell Longev. 2016, 2016, 8413032. [Google Scholar] [CrossRef] [Scilit] [PubMed]
- Castaldo, S.A.; Ajime, T.; Serrao, G.; Anastacio, F.; Rosa, J.T.; Giacomantonio, C.A.; Howarth, A.; Hill, R.; Madureira, P.A. Annexin A2 Regulates AKT Upon H(2)O(2)-Dependent Signaling Activation in Cancer Cells. Cancers 2019, 11, 492. [Google Scholar] [CrossRef] [Scilit] [PubMed]
- Zhang, B.; Li, M.; Zou, Y.; Guo, H.; Zhang, B.; Xia, C.; Zhang, H.; Yang, W.; Xu, C. NFkappaB/Orai1 Facilitates Endoplasmic Reticulum Stress by Oxidative Stress in the Pathogenesis of Non-alcoholic Fatty Liver Disease. Front. Cell Dev. Biol. 2019, 7, 202. [Google Scholar] [CrossRef] [Scilit] [PubMed]
- Shi, X.; Li, D.; Deng, Q.; Li, Y.; Sun, G.; Yuan, X.; Song, Y.; Wang, Z.; Li, X.; Li, X.; et al. NEFAs activate the oxidative stress-mediated NF-kappaB signaling pathway to induce inflammatory response in calf hepatocytes. J. Steroid Biochem. Mol. Biol. 2015, 145, 103–112. [Google Scholar] [CrossRef] [Scilit] [PubMed]
- Zhang, B.; Zeng, M.; Li, B.; Kan, Y.; Wang, S.; Cao, B.; Huang, Y.; Zheng, X.; Feng, W. Arbutin attenuates LPS-induced acute kidney injury by inhibiting inflammation and apoptosis via the PI3K/Akt/Nrf2 pathway. Phytomedicine 2021, 82, 153466. [Google Scholar] [CrossRef] [Scilit] [PubMed]
- Morgan, M.J.; Liu, Z.G. Crosstalk of reactive oxygen species and NF-kappaB signaling. Cell Res. 2011, 21, 103–115. [Google Scholar] [CrossRef] [Scilit] [PubMed]
- Huang, Q.Y.; Lai, X.N.; Qian, X.L.; Lv, L.C.; Li, J.; Duan, J.; Xiao, X.H.; Xiong, L.X. Cdc42: A Novel Regulator of Insulin Secretion and Diabetes-Associated Diseases. Int. J. Mol. Sci. 2019, 20, 179. [Google Scholar] [CrossRef] [Scilit] [PubMed]
- Yuan, H.; Zhang, H.; Wu, X.; Zhang, Z.; Du, D.; Zhou, W.; Zhou, S.; Brakebusch, C.; Chen, Z. Hepatocyte-specific deletion of Cdc42 results in delayed liver regeneration after partial hepatectomy in mice. Hepatology 2009, 49, 240–249. [Google Scholar] [CrossRef] [Scilit] [PubMed]
- Sharma, M.; Urano, F.; Jaeschke, A. Cdc42 and Rac1 are major contributors to the saturated fatty acid-stimulated JNK pathway in hepatocytes. J. Hepatol. 2012, 56, 192–198. [Google Scholar] [CrossRef] [Scilit] [PubMed]
- Murga, C.; Zohar, M.; Teramoto, H.; Gutkind, J.S. Rac1 and RhoG promote cell survival by the activation of PI3K and Akt, independently of their ability to stimulate JNK and NF-kappaB. Oncogene 2002, 21, 207–216. [Google Scholar] [CrossRef] [PubMed]
- Cheng, C.Y.; Tseng, H.H.; Chiu, H.C.; Chang, C.D.; Nielsen, B.L.; Liu, H.J. Bovine ephemeral fever virus triggers autophagy enhancing virus replication via upregulation of the Src/JNK/AP1 and PI3K/Akt/NF-kappaB pathways and suppression of the PI3K/Akt/mTOR pathway. Vet. Res. 2019, 50, 79. [Google Scholar] [CrossRef] [Scilit] [PubMed]
- Linton, M.F.; Babaev, V.R.; Huang, J.; Linton, E.F.; Tao, H.; Yancey, P.G. Macrophage Apoptosis and Efferocytosis in the Pathogenesis of Atherosclerosis. Circ. J. 2016, 80, 2259–2268. [Google Scholar] [CrossRef] [Scilit] [PubMed]
- Arain, M.A.; Khaskheli, G.B.; Barham, G.S.; Marghazani, I.B. Lactoferrin’s role in modulating NF-κB pathway to alleviate diabetes-associated inflammation: A novel in-silico study. Heliyon 2024, 10, e34051. [Google Scholar] [CrossRef] [Scilit] [PubMed]
- Saeed, M.; Alagawany, M.; Arain, M.A.; El-Hack, M.E.A.; Dhama, K. Beneficial Impacts of Choline in Animal and Human with Special Reference to Its Role against Fatty Liver Syndrome. J. Exp. Biol. Agric. Sci. 2017, 5, 589–598. [Google Scholar] [CrossRef] [Scilit]
- Coleman, D.N.; Alharthi, A.S.; Liang, Y.; Lopes, M.G.; Lopreiato, V.; Vailati-Riboni, M.; Loor, J.J. Multifaceted role of one-carbon metabolism on immunometabolic control and growth during pregnancy, lactation and the neonatal period in dairy cattle. J. Anim. Sci. Biotechnol. 2021, 12, 27. [Google Scholar] [CrossRef] [Scilit] [PubMed]
- Coleman, D.N.; Vailati-Riboni, M.; Elolimy, A.A.; Cardoso, F.C.; Rodriguez-Zas, S.L.; Miura, M.; Pan, Y.X.; Loor, J.J. Hepatic betaine-homocysteine methyltransferase and methionine synthase activity and intermediates of the methionine cycle are altered by choline supply during negative energy balance in Holstein cows. J. Dairy Sci. 2019, 102, 8305–8318. [Google Scholar] [CrossRef] [Scilit] [PubMed]
- Chandler, T.L.; White, H.M. Glucose metabolism is differentially altered by choline and methionine in bovine neonatal hepatocytes. PLoS ONE 2019, 14, e0217160. [Google Scholar] [CrossRef] [Scilit] [PubMed]
- Yang, X.; Alexander, V.J.; Xia, S.; Tsimikas, S. Effect of olezarsen on lipoprotein-associated ApoC-III levels in patients with familial chylomicronemia syndrome. Atherosclerosis 2025, 408, 120462. [Google Scholar] [CrossRef] [Scilit] [PubMed]
- Najt, C.P.; Senthivinayagam, S.; Aljazi, M.B.; Fader, K.A.; Olenic, S.D.; Brock, J.R.; Lydic, T.A.; Jones, A.D.; Atshaves, B.P. Liver-specific loss of Perilipin 2 alleviates diet-induced hepatic steatosis, inflammation, and fibrosis. Am. J. Physiol. Gastrointest. Liver Physiol. 2016, 310, G726–G738. [Google Scholar] [CrossRef] [Scilit] [PubMed]
- Zhu, J.; Xu, M.; Liu, Y.; Zhuang, L.; Ying, K.; Liu, F.; Liu, D.; Ma, W.; Songyang, Z. Phosphorylation of PLIN3 by AMPK promotes dispersion of lipid droplets during starvation. Protein Cell 2019, 10, 382–387. [Google Scholar] [CrossRef] [Scilit] [PubMed]
- Zou, S.; Lang, T.; Zhang, B.; Huang, K.; Gong, L.; Luo, H.; Xu, W.; He, X. Fatty acid oxidation alleviates the energy deficiency caused by the loss of MPC1 in MPC1(+/−) mice. Biochem. Biophys. Res. Commun. 2018, 495, 1008–1013. [Google Scholar] [CrossRef] [Scilit] [PubMed]
- Lu, K.L.; Zhang, D.D.; Wang, L.N.; Xu, W.N.; Liu, W.B. Molecular characterization of carnitine palmitoyltransferase IA in Megalobrama amblycephala and effects on its expression of feeding status and dietary lipid and berberine. Comp. Biochem. Physiol. B Biochem. Mol. Biol. 2016, 191, 20–25. [Google Scholar] [CrossRef] [Scilit] [PubMed]
- Coleman, D.N.; Alharthi, A.; Lopreiato, V.; Trevisi, E.; Miura, M.; Pan, Y.X.; Loor, J.J. Choline supply during negative nutrient balance alters hepatic cystathionine beta-synthase, intermediates of the methionine cycle and transsulfuration pathway, and liver function in Holstein cows. J. Dairy Sci. 2019, 102, 8319–8331. [Google Scholar] [CrossRef] [Scilit] [PubMed]
- Wang, L.; Chen, L.; Tan, Y.; Wei, J.; Chang, Y.; Jin, T.; Zhu, H. Betaine supplement alleviates hepatic triglyceride accumulation of apolipoprotein E deficient mice via reducing methylation of peroxisomal proliferator-activated receptor alpha promoter. Lipids Health Dis. 2013, 12, 34. [Google Scholar] [CrossRef] [Scilit] [PubMed]
- Ceccotti, C.; Biasato, I.; Gasco, L.; Caimi, C.; Bellezza Oddon, S.; Rimoldi, S.; Brambilla, F.; Terova, G. How Different Dietary Methionine Sources Could Modulate the Hepatic Metabolism in Rainbow Trout? Curr. Issues Mol. Biol. 2022, 44, 3238–3252. [Google Scholar] [CrossRef] [Scilit] [PubMed]
- Zhu, J.; Wu, Y.; Tang, Q.; Leng, Y.; Cai, W. The effects of choline on hepatic lipid metabolism, mitochondrial function and antioxidative status in human hepatic C3A cells exposed to excessive energy substrates. Nutrients 2014, 6, 2552–2571. [Google Scholar] [CrossRef] [Scilit] [PubMed]
- Chandler, T.L.; White, H.M. Choline and methionine differentially alter methyl carbon metabolism in bovine neonatal hepatocytes. PLoS ONE 2017, 12, e0171080. [Google Scholar] [CrossRef] [Scilit] [PubMed]
- Moffat, C.; Bhatia, L.; Nguyen, T.; Lynch, P.; Wang, M.; Wang, D.; Ilkayeva, O.R.; Han, X.; Hirschey, M.D.; Claypool, S.M.; et al. Acyl-CoA thioesterase-2 facilitates mitochondrial fatty acid oxidation in the liver. J. Lipid Res. 2014, 55, 2458–2470. [Google Scholar] [CrossRef] [Scilit] [PubMed]
- Graulet, B.; Gruffat, D.; Durand, D.; Bauchart, D. Fatty acid metabolism and very low density lipoprotein secretion in liver slices from rats and preruminant calves. J. Biochem. 1998, 124, 1212–1219. [Google Scholar] [CrossRef] [Scilit] [PubMed]
- Liu, M.; Gu, J.; Zhao, C.; Li, J.; Kong, F.; Du, X.; Qi, D.; Li, E.; Gao, J.; Du, X.; et al. Hepatocyte necroptosis is associated with liver damage in dairy cows with ketosis. J. Dairy Sci. 2025, 108, 8844–8858. [Google Scholar] [CrossRef] [Scilit] [PubMed]

Disclaimer/Publisher’s Note: The statements, opinions and data contained in all publications are solely those of the individual author(s) and contributor(s) and not of MDPI and/or the editor(s). MDPI and/or the editor(s) disclaim responsibility for any injury to people or property resulting from any ideas, methods, instructions or products referred to in the content. |
© 2026 by the authors. Licensee MDPI, Basel, Switzerland. This article is an open access article distributed under the terms and conditions of the Creative Commons Attribution (CC BY) license.