


Abstract
Background: The fruits of Rosa laxa Retz. (FRL) is a traditional medicinal and edible fruit widely used in Xinjiang for its potential health benefits. Its chemical variations across geographical origins remain poorly understood, as do the molecular mechanisms underlying its anti-hyperlipidemic effects. This study aimed to characterize the chemical profile of FRL extract (FRLE) from different origins, identify its bioactive constituents and metabolites in vivo, and evaluate its efficacy and potential mechanisms against HLP. Methods: UPLC-QTOF-MS was employed for qualitative and quantitative profiling, combined with PCA to differentiate samples from five origins. An HLP mouse model was established to evaluate the pharmacodynamic effects, while acute and sub-chronic toxicity tests assessed safety. Serum pharmacochemistry was used to track absorbed constituents and metabolites. Finally, network pharmacology, molecular docking, and Western blot were integrated to elucidate the underlying mechanisms. Results: A total of 60 compounds were identified in FRLE, with 20 key components quantified via the TOF-MRM mode. PCA indicated that the Yamalike Mountain samples possessed the most diverse chemical profile and the highest response of active markers. Pharmacodynamic results showed that FRLE (extraction yield 24.19%) significantly improved TC, LDL-C, and corrected abnormal HDL-C levels in HLP mice, while H&E staining confirmed the alleviation of hepatic steatosis. Safety evaluations revealed no significant acute or cumulative toxicity at the maximum feasible dose of 16.6 g/kg. In rat plasma, 15 prototypes and 14 metabolites were identified. FRLE acted on the “Lipid and Atherosclerosis” pathway by modulating key targets, including NFE2L2, CYP1A1, NOS3, and MAPK1. Conclusions: Our findings demonstrate that FRLE is a safe and effective candidate for the management of hyperlipidemia. This study establishes a link between the material basis and biological mechanisms of FRL, thereby providing a scientific foundation for its further resource development and clinical application.
1. Introduction
Hyperlipidemia (HLP) is a chronic metabolic disorder characterized by abnormal serum lipid profiles [1]. According to the latest data from the World Health Organization, approximately 39% of adults worldwide exhibit dysregulated total cholesterol levels. This condition is a primary driver of atherosclerotic cardiovascular disease, which causes nearly 17.9 million deaths annually and accounts for 32% of all global mortality [2]. Statins and fibrates remain the cornerstone of HLP pharmacotherapy, yet their long-term clinical utility is often constrained by adverse effects [3]. Chronic statin administration is associated with muscle-related complications, ranging from myalgia and myositis to life-threatening rhabdomyolysis [4,5]. Similarly, prolonged fibrate therapy has been linked to an increased incidence of cholelithiasis and gastrointestinal disturbances [6,7,8]. These safety concerns underscore the need to develop novel lipid-lowering agents that are both effective and suitable for long-term administration.
Rosa laxa Retz., a distinctive botanical resource native to Xinjiang, is widely distributed and exhibits considerable stress resistance. The mature fruit of Rosa laxa Retz. (FRL), known as Fructus Rosae Laxae, is formally recorded in the Pharmacopoeia of Kazakh Medicine [9]. It is traditionally utilized in the preparation of various functional foods, such as jams, syrups, and beverages [10]. Previous studies have demonstrated that FRL extracts exhibit significant hepatoprotective activity in murine models of acute toxic hepatitis [9]. Our preliminary research indicated that FRL is rich in bioactive constituents, such as flavonoids, polyphenols, organic acids, polysaccharides, and amino acids, which possess potent lipid-regulating properties [11]. The rapid evolution of pharmacological and disease-related databases has drawn increasing attention to bioinformatics. In recent years, network pharmacology has emerged as a powerful tool in the study of Traditional Chinese Medicine (TCM) and natural products [12]. This approach facilitates the construction of complex interaction networks encompassing “component-target-disease-pathway”, thereby enabling a systematic exploration of the pharmacological mechanisms underlying multi-component therapies [13,14]. Network pharmacology thus provides a robust framework to further elucidate the molecular mechanisms by which the chemical constituents in FRL extract (FRLE) exert their lipid-lowering effects.
This study aimed to systematically evaluate the therapeutic potential and regulatory mechanisms of FRLE against hyperlipidemia. Samples from Yamalike Mountain were specifically selected for detailed chemical composition analysis because preliminary principal component analysis (PCA) and statistical evaluations revealed that FRL from this region possessed the greatest abundance of high-response chemical constituents. To achieve this central aim without overextending our objectives, the research was executed through a three-stage sequential workflow. First, the chemical profile of FRLE was comprehensively characterized using liquid chromatography-mass spectrometry (LC-MS) to map its primary active constituents. Second, a hyperlipidemia mouse model was established to evaluate the in vivo lipid-lowering efficacy of the extract derived from this optimal origin, while its safety profile was rigorously investigated through acute and sub-chronic toxicity assays in healthy mice. Finally, the underlying molecular mechanisms of these identified constituents were predicted via an integrated, hypothesis-generating approach of network pharmacology and molecular docking, followed by empirical validation using Western blotting. Collectively, this systematic pipeline bridges the gap between raw material profiling, phenotypic efficacy, and molecular execution, providing a novel and structured strategy for discovering effective preventive and therapeutic agents for hyperlipidemia derived from TCM.
2. Materials and Methods
2.1. Chemicals and Reagents
Optima-grade methanol was purchased from Thermo Fisher Scientific (Waltham, MA, USA), and distilled water was obtained from Watson’s (Hong Kong, China). Reference standards, including quercetin, euscaphic acid, protocatechuic aldehyde, citric acid, quinic acid, hyperoside, astragalin, kaempferol, kaempferol-3-O-rutinoside, oleanolic acid, asiatic acid, ursolic acid, corilagin, and epicatechin, were purchased from Chengdu Must Bio-Technology Co., Ltd. (Chengdu, China). Malic acid was obtained from Shanghai Standard Technology Service Co., Ltd. (Shanghai, China). Pomolic acid and tartaric acid were purchased from Baoji Herbest Bio-Tech Co., Ltd. (Baoji, China). Raffinose, arginine, and sucrose were sourced from Shanghai Chunyou Bio-Technology Co., Ltd. (Shanghai, China). Rutin, tiliroside, tormentic acid, and isoquercitrin were purchased from Chengdu Herbpurify Co., Ltd. (Chengdu, China). Ellagic acid and gallic acid were obtained from Sichuan Vicky Biotechnology Co., Ltd. (Chengdu, China), while luteoloside was provided by the National Institutes for Food and Drug Control (Beijing, China). The purity of all reference standards was verified to be >98%. Absolute ethanol was purchased from Tianjin Xinbote Chemical Co., Ltd. (Tianjin, China). Sodium formate was obtained from Merck (Darmstadt, Hesse, Germany), and leucine-enkephalin was purchased from Waters Corp. (Milford, MA, USA).
Regarding biological reagents, the 40% kcal high-fat diet (HFD) was purchased from Beijing Boaigang Biological technology (Beijing, China). Commercial kits for total cholesterol (TC), triglycerides (TG), high-density lipoprotein cholesterol (HDL-C), and low-density lipoprotein cholesterol (LDL-C) were obtained from Nanjing Jiancheng Bioengineering Institute (Nanjing, China). Rosuvastatin calcium tablets were purchased from Simcere Pharmaceutical Co., Ltd. (Nanjing, China), and fenofibrate capsules were from Abbott Laboratories (Shanghai, China). Primary antibodies against NFE2L2 (Cat No. 80593-1-RR), NOS3 (Cat No. 27120-1-AP), CYP1A1 (Cat No. 13241-1-AP), PPARG (Cat No. 16643-1-AP), and MAPK1 (Cat No. 51068-1-AP) were purchased from Proteintech Group (Wuhan, China). The GAPDH (Cat No. GB11002-100) antibody was obtained from Servicebio Technology Co., Ltd. (Wuhan, China). Additional supplies, including the one-step gel casting kit, were purchased from Shanghai Yaemei Biotechnology Co., Ltd. (Shanghai, China); the tri-color pre-stained protein marker was from Life-ilab Co., Ltd. (Shanghai, China); the ECL chemiluminescence kit was from Beijing Lanjieco Technology Co., Ltd. (Beijing, China); and PVDF membranes were purchased from Roche (Basel, Switzerland).
2.2. Preparation of FRLE Samples
FRLs were collected from five distinct locations: Yamalike Mountain in Urumqi, the Urumqi Botanical Garden, Hotan Prefecture, Altay Region, and Habahe County. The maturity stage at harvest was determined based on morphological criteria, specifically targeting fruits with a uniform deep red color, and all samples were collected annually in mid-September. All specimens were authenticated as the mature fruits of Rosa laxa Retz. by Professor Haiyan Xu of Xinjiang Medical University. Voucher specimens were deposited in the Laboratory of Extraction and Separation of Traditional Chinese Medicine Constituents at Xinjiang Medical University. The sepals and pedicels were removed, and the fruits were halved to eliminate seeds and trichomes. The processed fruits were air-dried, pulverized, and passed through a 50-mesh sieve to obtain FRL powder for subsequent use.
The FRL powder was extracted using a reflux method. Briefly, a specific amount of the dry powder was macerated overnight in 65% ethanol at a solid-to-liquid ratio of 1:18 (w/v), followed by reflux extraction for 1.5 h. After filtration, the residue was re-extracted with 65% ethanol at a ratio of 1:17 (w/v) for 1 h. The filtrates from both extractions were combined, concentrated under reduced pressure, and vacuum-dried at 70 °C to yield a brownish-black powder, designated as FRLE. The extraction yield was 24.19% (w/w).
To prepare the analytical samples, approximately 5.0 mg of FRLE powder was accurately weighed and completely dissolved in 65% chromatographic-grade methanol. The solution was transferred to a 10 mL volumetric flask and diluted to volume. The mixture was then subjected to high-speed centrifugation at 13,780 g for 10 min. The resulting supernatant was collected as the FRLE sample for further analysis.
2.3. UPLC-QTOF-MS Analysis of Chemical Constituents in FRLE from Different Origins
The FRLE samples were separated using an ultra-performance liquid chromatography (UPLC) system (I-Class, Waters, Milford, MA, USA) coupled with a quadrupole time-of-flight mass spectrometer (QTOF-MS; Xevo G2-XS, Waters, Milford, MA, USA) equipped with an electrospray ionization (ESI) source.
Chromatographic conditions: Samples were injected into an ACQUITY UPLC HSS T3 column (2.1 mm × 100 mm, 1.8 µm; Waters) for separation. The column temperature was maintained at 40 °C, and the injection volume was 1 µL. The flow rate was set at 0.2 mL/min. The mobile phase consisted of methanol (A) and 0.1% formic acid in water (v/v, B). The gradient elution program was optimized as follows: 0–3 min, 0% A; 3–20 min, 0–45% A; 20–23 min, 45% A; 23–28 min, 45–100% A; 28–31 min, 100% A; 31–36 min, 100–0% A; and 36–39 min, 0% A.
Mass spectrometry was performed in MSE mode. For ESI (+), the parameters were set as follows: source temperature, 120 °C; capillary voltage, 3.5 kV; sampling cone voltage, 40 V; source offset voltage, 80 V; cone gas flow, 50 L/h desolvation temperature, 450 °C; and desolvation gas flow, 900 L/h. The collision energy was set at 6 eV for the low-energy function and ramped from 20 to 60 eV for the high-energy function. For real-time mass calibration, leucine-enkephalin was utilized as the lock-spray (ESI+: m/z 556.2771; ESI-: m/z 554.2615), and 5 mM sodium formate was used for multi-point external calibration. The ESI (−) parameters were identical to those of ESI (+), except that the capillary voltage was adjusted to 2.5 kV.
Data acquisition and processing, including the analysis of constituent differences across various origins, were conducted using Progenesis QI software (Ver. 3.0, Waters, Milford, MA, USA).
2.4. Chemical Constituent Analysis of FRLE
The FRLE samples exhibiting the highest number of chemical constituents among the five different origins was selected for further investigation. The corresponding MSE raw data were imported into the UNIFI informatics platform (Ver. 1.9.4, Waters, Milford, MA, USA). Chemical constituents within FRLE were identified by matching against an in-house chemical information database.
The in-house database was established as follows: comprehensive literature reviews were conducted to collect mass spectrometry data (including precursor and fragment ion information) of other medicinal plants within the same genus (Rosa). The structural information of these compounds in .mol format was retrieved from the ChemSpider database (https://www.chemspider.com/, accessed on 31 May 2026). These structural files were subsequently imported into the UNIFI compound library, where the collected precursor and fragment ion data were appended as supplementary mass spectrometry parameters.
Compound identifications tentative by UNIFI were further validated by comparing their retention times and MS/MS fragmentation patterns with reference standards using the UPLC-QTOF-MS/MS method. Finally, the confirmed positive constituents were quantitatively analyzed using the TOF-MRM (Multiple Reaction Monitoring) mode.
To establish the calibration curves, reference standards were precisely weighed and dissolved in methanol. Stock solutions of astragalin and oleanolic acid were prepared at 0.5 mg/mL, while ellagic acid, tartaric acid, citric acid, gallic acid, pomolic acid, quercetin, kaempferol, kaempferol-3-O-rutinoside, arginine, rutin, hyperoside, euscaphic acid, malic acid, isoquercitrin, quinic acid, epicatechin, tiliroside, and protocatechuic aldehyde were prepared at 0.1 mg/mL. These stock solutions were serially diluted to generate a range of working concentrations: astragalin and oleanolic acid (500, 250, 125, 62.5, and 30.125 μg/mL); citric acid and pomolic acid (100, 50, 25, 12.5, and 6.25 μg/mL); ellagic acid and arginine (50, 25, 12.5, 6.25, and 3.125 μg/mL); tartaric acid, gallic acid, quercetin, epicatechin, euscaphic acid, isoquercitrin, quinic acid, and malic acid (10, 2.5, 0.625, 0.3125, and 0.15625 μg/mL); kaempferol, kaempferol-3-O-rutinoside, hyperoside, and tiliroside (1000, 500, 250, 125, and 62.5 ng/mL); and protocatechuic aldehyde and rutin (100, 50, 25, 12.5, and 6.25 ng/mL).
2.5. Pharmacodynamic Evaluation of FRLE Against HLP
Institute for Cancer Research (ICR) mice (6 weeks old, weighing 20 ± 2 g) were obtained from the Animal Experiment Center of Xinjiang Medical University [License No. SCXK (Xin) 2023-001]. The animals were housed in a Specific Pathogen-Free (SPF) facility [License No. SYXK (Xin) 2023-004] under controlled conditions: temperature at 24 °C, relative humidity at 50%, and a 12 h light/dark cycle, with ad libitum access to food and water. All experimental procedures were conducted in accordance with the Guide for the Care and Use of Laboratory Animals and approved by the Animal Ethics Committee of the First Affiliated Hospital of Xinjiang Medical University (Approval Nos. IACUC-20240308-21).
After one week of acclimatization, the mice were randomly assigned to the control group (n = 6) and the HLP model group (n = 54). The control group was fed a standard diet, while the model group received an HFD for 8 weeks. Subsequently, blood was collected from the retro-orbital venous plexus, and serum was isolated by centrifugation at 3000 rpm for 15 min. Success of the HLP model was confirmed by comparing the four primary lipid profiles (TC, TG, HDL-C, and LDL-C) between the two groups.
Successfully modeled mice were randomly subdivided into 8 groups (n = 6 per group): model, fenofibrate (Fb, 26 mg/kg), rosuvastatin (Rt, 1.3 mg/kg), Yamalike Mountain FRLE low-dose (FRLE-L, 1.66 g/kg), Yamalike Mountain FRLE medium-dose (FRLE-M, 8.30 g/kg), Yamalike Mountain FRLE high-dose (FRLE-H, 16.60 g/kg), Hotan FRLE (FRLE-HT, 16.60 g/kg), and Altay FRLE (FRLE-ALT, 16.60 g/kg). The control group and model group received sterile saline via oral gavage. Dosages for Fb, Rt, and FRLE-L were calculated based on human equivalent doses according to body surface area, as referenced in clinical guidelines and the Pharmacopoeia of Kazakh Medicine. Interventions lasted for 5 weeks, with body weights recorded weekly. Upon study completion, mice were anesthetized, and blood was collected via retro-orbital bleeding. Serum lipid levels were measured using commercial kits. Livers were excised, rinsed with saline, blotted dry, and weighed to calculate the liver index as follows: Liver Index = (liver weight/body weight) × 100% [15].
For histopathological examination, the large lobes of the livers were fixed in a universal tissue fixative for 24 h. Tissues were then trimmed (10 mm × 20 mm), dehydrated through a graded ethanol series, cleared in xylene, and embedded in paraffin. Sections (4 μm) were cut, mounted, and dried. Following deparaffinization and rehydration, sections were stained with Hematoxylin and Eosin (H&E), cleared, and mounted with neutral balsam [16]. Images were captured using an automated slide scanner, utilizing 10× magnification for coarse focusing (minimum 3 focus points per slide) and 20× magnification for fine focusing (minimum 5 focus points per slide).
2.6. Safety Evaluation of FRLE
ICR mice (6 weeks old, weighing 20 ± 2 g) were housed in an SPF facility under controlled conditions: 24 °C, 50% relative humidity, and a 12 h light/dark cycle, with ad libitum access to food and water. As FRL is recognized as a medicinal and edible resource, an acute toxicity study was conducted using the maximum feasible dose. Based on the maximum solubility of FRLE in water (830 mg/mL), a dose of 16.6 g/kg body weight was administered via oral gavage three times at 4 h intervals. Following administration, the clinical signs, behavioral patterns, and mortality of the mice were monitored continuously for 14 days, during which the animals had free access to food and water.
For the sub-chronic toxicity study, mice were administered FRLE at a daily dose of 16.6 g/kg via oral gavage for 30 consecutive days. Throughout the study period, the survival status and activity levels of the mice were recorded daily while maintaining standard ad libitum feeding and watering conditions.
2.7. Study on Rat Serum Constituents and Their Metabolites
Twelve Sprague-Dawley rats (6 weeks old, 350 ± 10 g) were housed in a standard environment with ad libitum access to food and water. The rats were randomly divided into two groups (n = 6 per group): the blank group and the administration group. FRLE was dissolved in distilled water to prepare a 0.83 g/mL suspension. After 12 h of fasting (with free access to water), rats in the Administration group received a single dose of 1 mL/100 body weight via oral gavage. Blood samples (≈ 0.3 mL) were collected from the retro-orbital venous plexus at 0 (pre-dose), 0.083, 0.25, 0.5, 0.75, 1, 1.5, 2, 3, 4, 6, 8, 12, 24, 36, and 48 h post-administration into heparinized tubes. Water was restricted for 2 h, and food was withheld for 4 h post-dosing. Serum was separated by centrifugation at 3000 rpm for 15 min and stored for analysis.
For protein precipitation, 0.1 mL of serum was mixed with 0.3 mL of acetonitrile containing 0.1% formic acid (v/v) and vortexed for 5 min. The mixture was centrifuged at 13,780 g for 10 min at 4 °C. The supernatant was transferred and evaporated to dryness under nitrogen at 37 °C. The residue was reconstituted in 0.1 mL of methanol, vortexed, and centrifuged again at 13,780 g for 10 min at 4 °C to obtain the final plasma samples.
Reference standard stock solutions (1 mg/mL) were prepared in methanol. A mixed standard solution (50 μg/mL) was created by diluting the stocks, and 10 μL of this mixture was spiked into 1 mL of blank serum to prepare the quality control (QC) plasma samples. Samples were analyzed using TOF-MRM mode, and absorbed constituents were identified based on retention time (RT) and characteristic fragment ions.
Metabolic pathways were predicted using BioTransformer 3.0 (https://biotransformer.ca/, accessed on 31 May 2026), a machine learning-based tool [17,18]. The chemical structures of 20 identified constituents (including malic acid, quinic acid, and tiliroside, etc.) were converted into SMILES strings via ACD/ChemSketch and processed to predict Phase I and Phase II metabolites, specifically targeting cytochrome P450 enzymatic transformations. To facilitate identification, CFM-ID 4.0 (https://cfmid.wishartlab.com/, accessed on 31 May 2026) was employed to simulate the fragmentation behavior and generate theoretical MS/MS spectra for the predicted metabolites in ESI- mode [19]. Finally, the absorbed metabolites were identified by integrating Waters UNIFI 1.9.4 with the results from BioTransformer and CFM-ID. A positive identification required at least one characteristic fragment ion to match between the experimental and theoretical MS/MS spectra.
2.8. Mechanism Prediction via Network Pharmacology and Molecular Docking
The targets of 15 prototype constituents identified in FRLE (including rutin, pomolic acid, and euscaphic acid, etc.) were retrieved from the TCMSP database (https://www.tcmsp-e.com/tcmsp.php, accessed on 3 March 2025) [20]. For their metabolites, potential targets were predicted using the SwissTargetPrediction database (http://swisstargetprediction.ch/, accessed on 4 March 2025) [21]. All identified target names were standardized to gene symbols using the STRING database (https://cn.string-db.org/, accessed on 3 March 2025) to establish the constituent-target dataset [22]. Concurrently, the disease-target dataset was constructed by searching the DisGeNET database (https://disgenet.com/, accessed on 3 March 2025) for “hyperlipemia” (Disease ID: C0020473), with retrieved genes similarly standardized via STRING [23]. The intersection of constituent and disease targets was determined using the Venny 2.1.0 tool to identify potential therapeutic targets [24]. Finally, Kyoto Encyclopedia of Genes and Genomes (KEGG) pathway enrichment analysis was performed on these common targets using the DAVID database (https://davidbioinformatics.nih.gov/, accessed on 4 March 2025) [25,26]. Constituent–target–pathway network was visualized using Cytoscape 3.9.1 [27].
Molecular docking was conducted to evaluate the binding affinities between the identified constituents (prototypes and metabolites) and HLP-related proteins. Chemical structures were drawn using ACD/ChemSketch and converted into 3D configurations via Open Babel, followed by energy minimization using the MMFF94 force field. Ligand files were prepared using the prepare_ligand4.py script from AutoDockTools 1.5.6, which involved merging non-polar hydrogens and assigning Gasteiger charges to generate PDBQT files [28]. The 3D structures of key HLP-related receptors were retrieved from the Protein Data Bank (PDB; http://www.rcsb.org/, accessed on 5 March 2025). Receptors were processed using the prepare_receptor4.py script, including adding hydrogen, removing water molecules, and deleting heteroatoms to generate the final PDBQT files.
Molecular docking simulations were performed using AutoDock Vina 1.2.3 in an Ubuntu 22.04 LTS environment [29]. A global conformational search was executed with an exhaustiveness of 25 and a spacing of 1 Å, with other parameters set to default. The conformation with the lowest binding energy for each ligand-receptor pair was selected for further analysis.
2.9. Western Blotting Analysis
Mouse liver tissues (0.1 g) from the Control, Model, and FRLE treatment groups were homogenized in 1 mL of pre-cooled RIPA lysis buffer supplemented with 1% PMSF. Homogenization was performed using grinding beads at 2000 rpm for three cycles (1 min per cycle, with 1 min intervals on ice). The lysates were centrifuged at 13,780 g for 15 min at 4 °C, and the supernatant was collected. Total protein concentration was quantified using a BCA assay. Protein samples were then diluted with distilled water and 4× loading buffer to a final concentration of 5 μg/μL (sample to buffer ratio of 3:1, v/v). The mixtures were denatured in a metal bath at 100 °C for 10 min and cooled for subsequent use.
Equal amounts of protein (25 μg) were separated via 10% SDS-PAGE (150 V for 90 min) and transferred onto PVDF membranes using a wet transfer method (100 V for 60 min). The membranes were blocked with 5% non-fat milk at room temperature for 1 h and subsequently washed three times with TBST. The membranes were then incubated overnight at 4 °C with primary antibodies against NFE2L2 (1:2500), eNOS (1:500), CYP1A1 (1:1000), PPARG (1:1000), MAPK1 (1:10,000), and GAPDH (1:5000). After washing, the membranes were incubated with secondary antibodies (1:10,000) for 1 h at room temperature. Protein bands were visualized using an ECL chemiluminescence kit and captured with a Bio-Rad imaging system (Gel Doc XR, Bio-Rad, Berkeley, CA, USA). The gray values of the protein bands were analyzed using Image Lab 6.0 software, and the relative protein expression levels were normalized to GAPDH.
2.10. Ligand-Receptor Binding Mode Analysis
The ligand-receptor binding modes of the positive targets validated by Western blotting were analyzed and visualized using PyMOL (Ver. 3.0, Educational Edition) and Discovery Studio 2021 Client [30,31]. This analysis focused on characterizing the key intermolecular interactions, including hydrogen bonding, hydrophobic effects, and pi-stacking, to elucidate the molecular basis of the constituent-target recognition.
2.11. Statistical Analysis
Statistical analysis was performed using IBM SPSS Statistics 17.0. Data following a normal distribution were analyzed using one-way analysis of variance and presented as the mean ± standard deviation (). For post hoc multiple comparisons, LSD test was applied if variances were homogeneous, while Tamhane’s T2 test was utilized in cases of unequal variances. Data that did not conform to normal distribution were analyzed using the rank-sum test. To visualize sample clustering and assess overall variations among the groups, an unsupervised PCA was conducted. The LC-MS dataset was mean-centered and Pareto-scaled prior to PCA modeling, which was performed using Waters EZinfo 3.0 software. The significance level was set at α = 0.05, and the value of p < 0.05 was considered statistically significant.
3. Results
3.1. Chemical Constituent Variations in FRLE from Different Origins
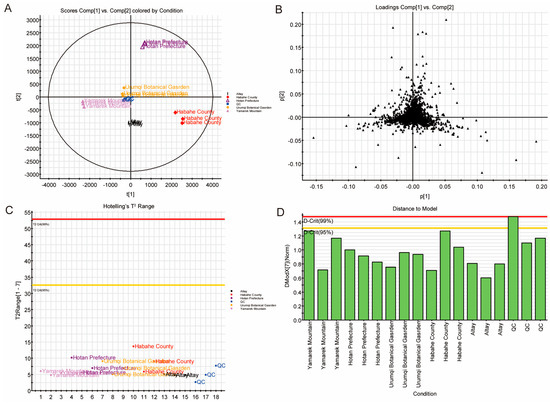
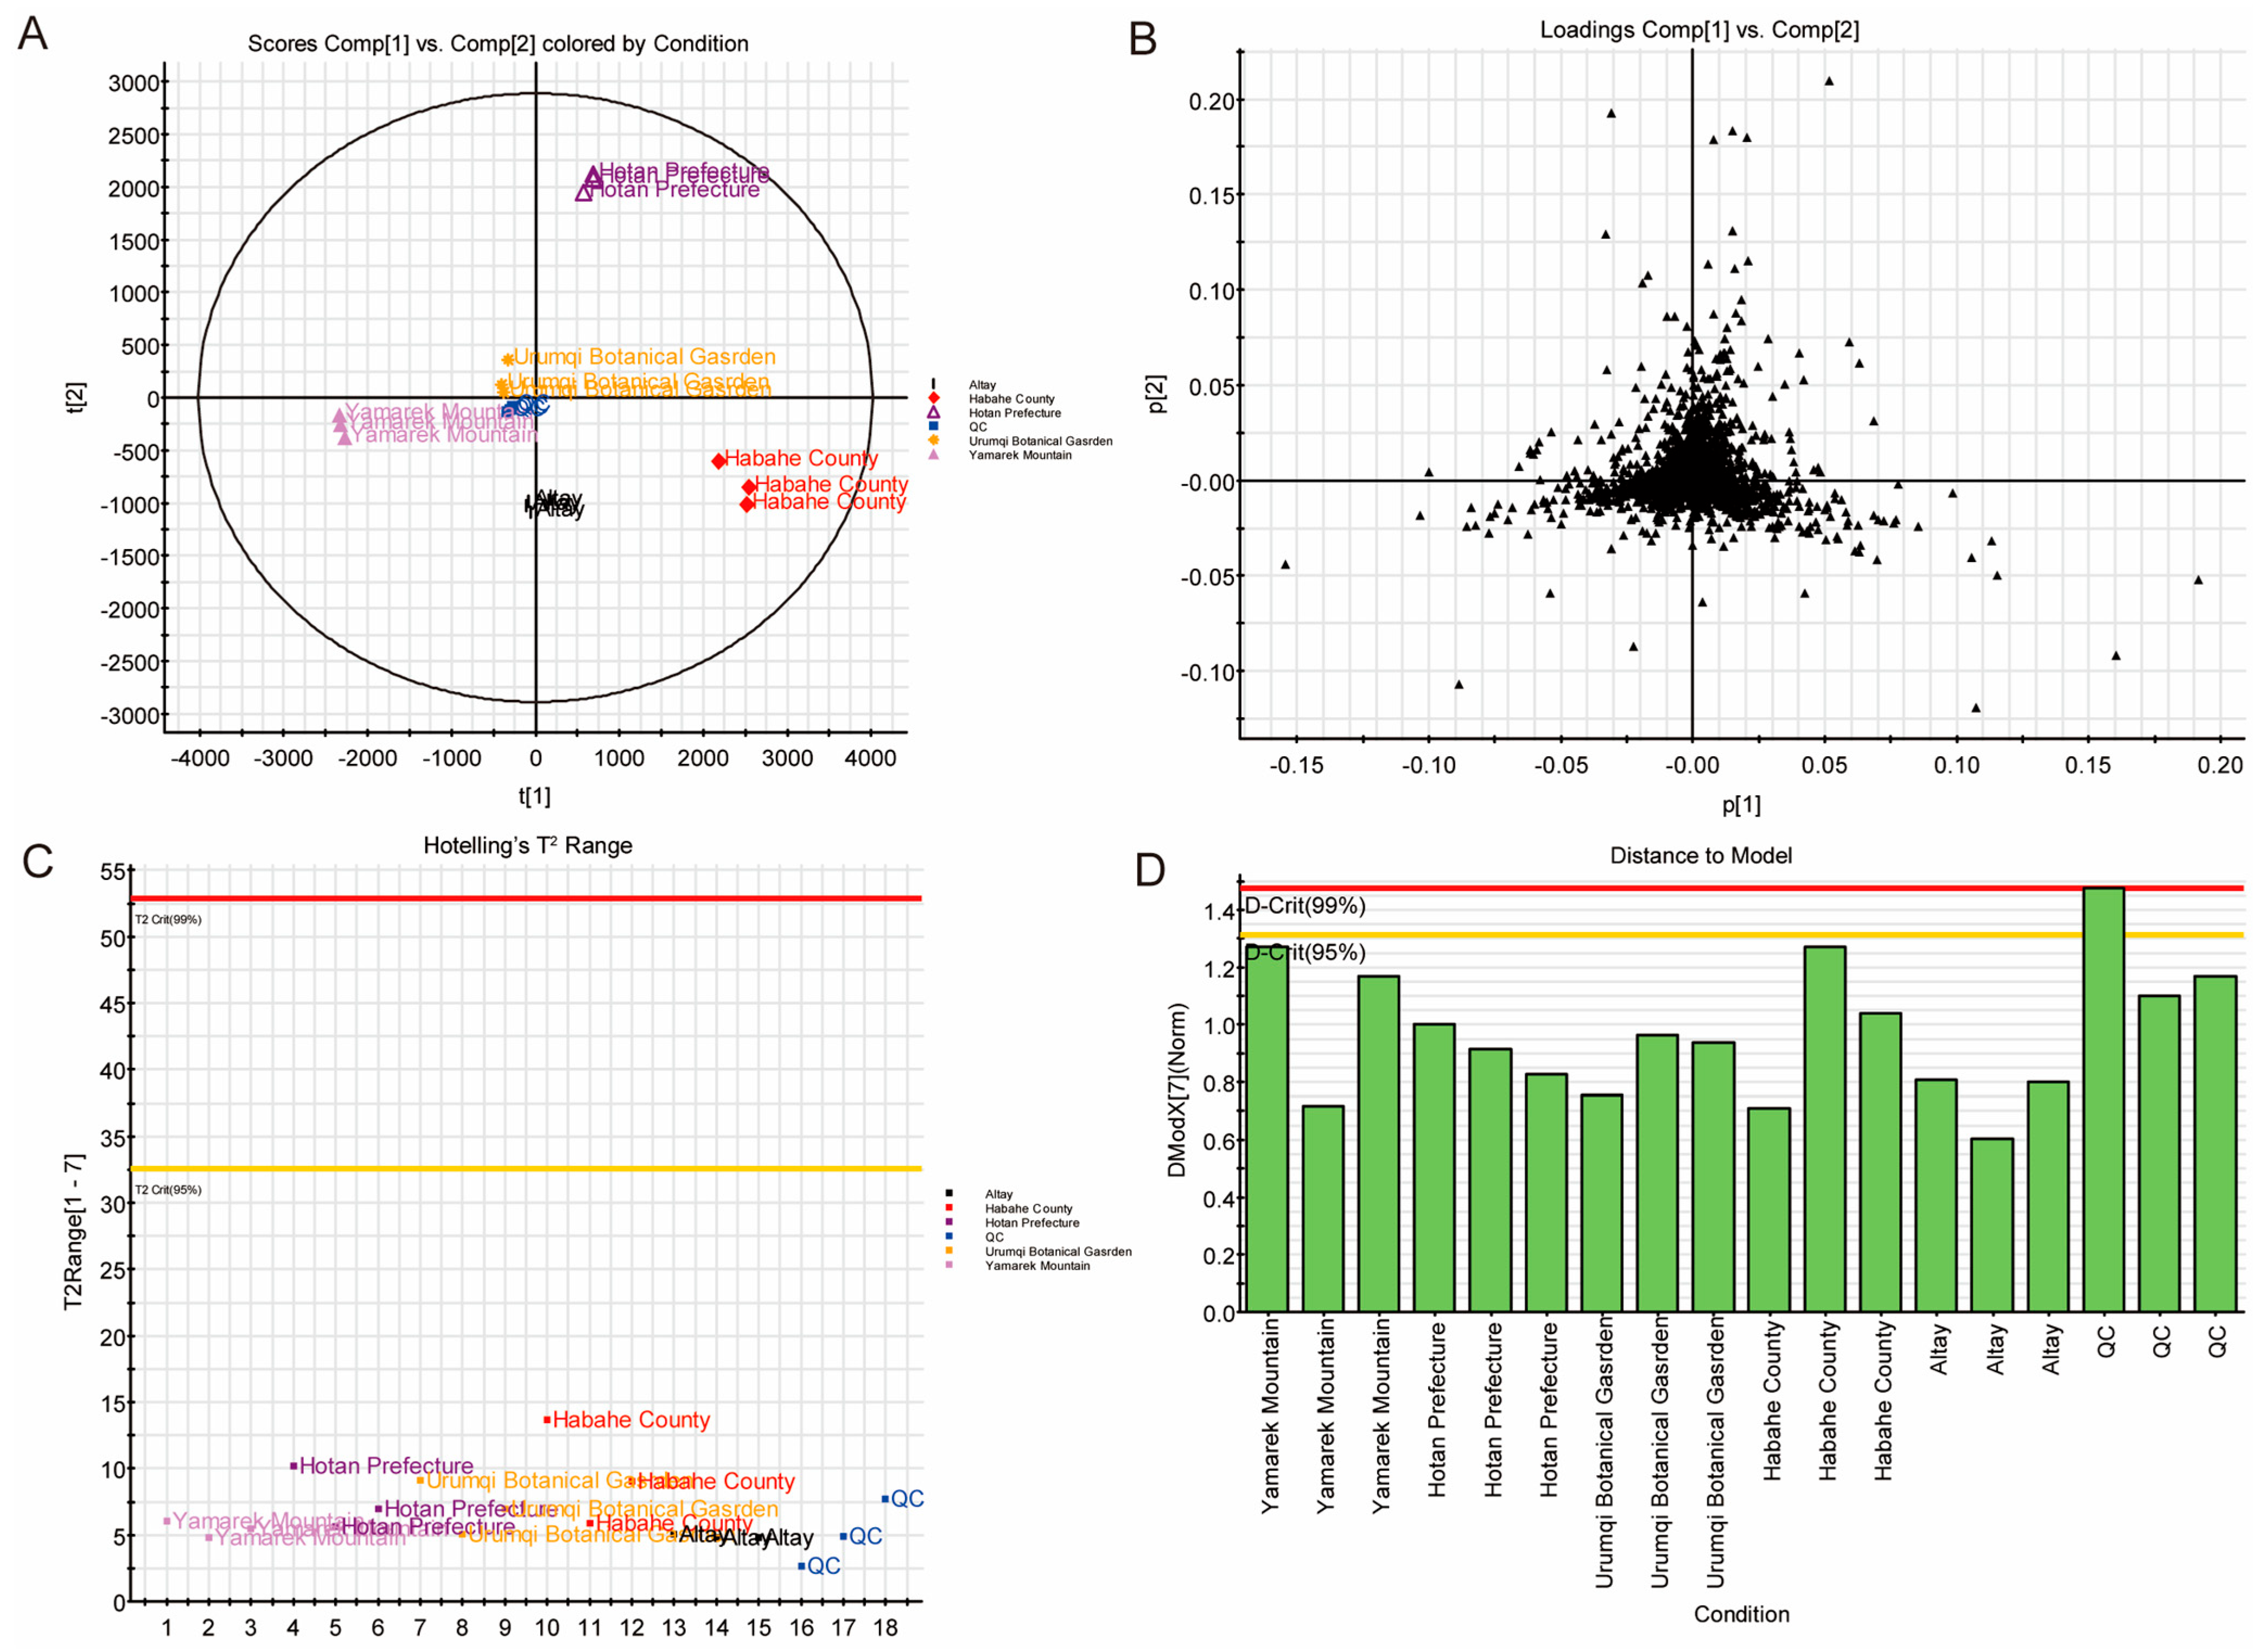
The data processed by Progenesis QI were imported into EZInfo V3.0 for PCA. According to the report generated, the dataset comprised 18 samples with 8507 variables and no missing values. Of these, 8501 variables were utilized for PCA. A PCA-X model was established using Pareto scaling without further data transformation. Seven principal components were extracted, cumulatively explaining 98% of the total variance. The PCA-X score plot (Figure 1A) revealed distinct clustering and segregation among the samples. Specifically, samples from Yamalike Mountain, Hotan, Habahe, and Altay exhibited significant dispersion, indicating substantial differences in their mass spectrometry-based chemical profiles.
Figure 1.
Five PCA diagrams of FRLE components from different origins. (A) PCA-X score plot. (B) loading diagram. (C) Hotelling T2 plot. (D) Distance to model diagram.
The loading plot (Figure 1B) illustrates the distribution of the 8501 variables across the principal component axes. Several variables exhibited high loading values, suggesting they contribute significantly to the total variance and serve as key markers for differentiating the origins. Hotelling’s T2 and the DModX were employed as critical metrics to assess sample outliers and the goodness of fit, respectively. In this study, the Hotelling’s T2 plot (Figure 1C) showed no extreme outliers, confirming the high quality of data acquisition. Furthermore, the DModX analysis (Figure 1D) demonstrated that all samples—with the exception of a single QC injection that slightly exceeded the 95% confidence interval—were within acceptable limits. This indicates a robust fit between the experimental observations and the PCA model.
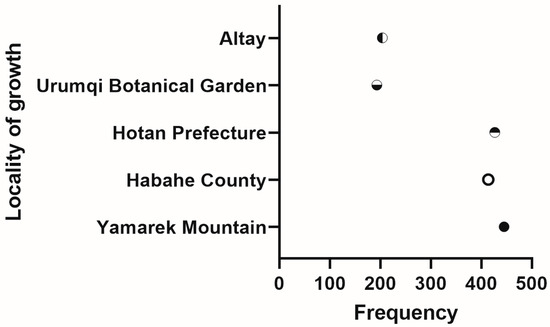
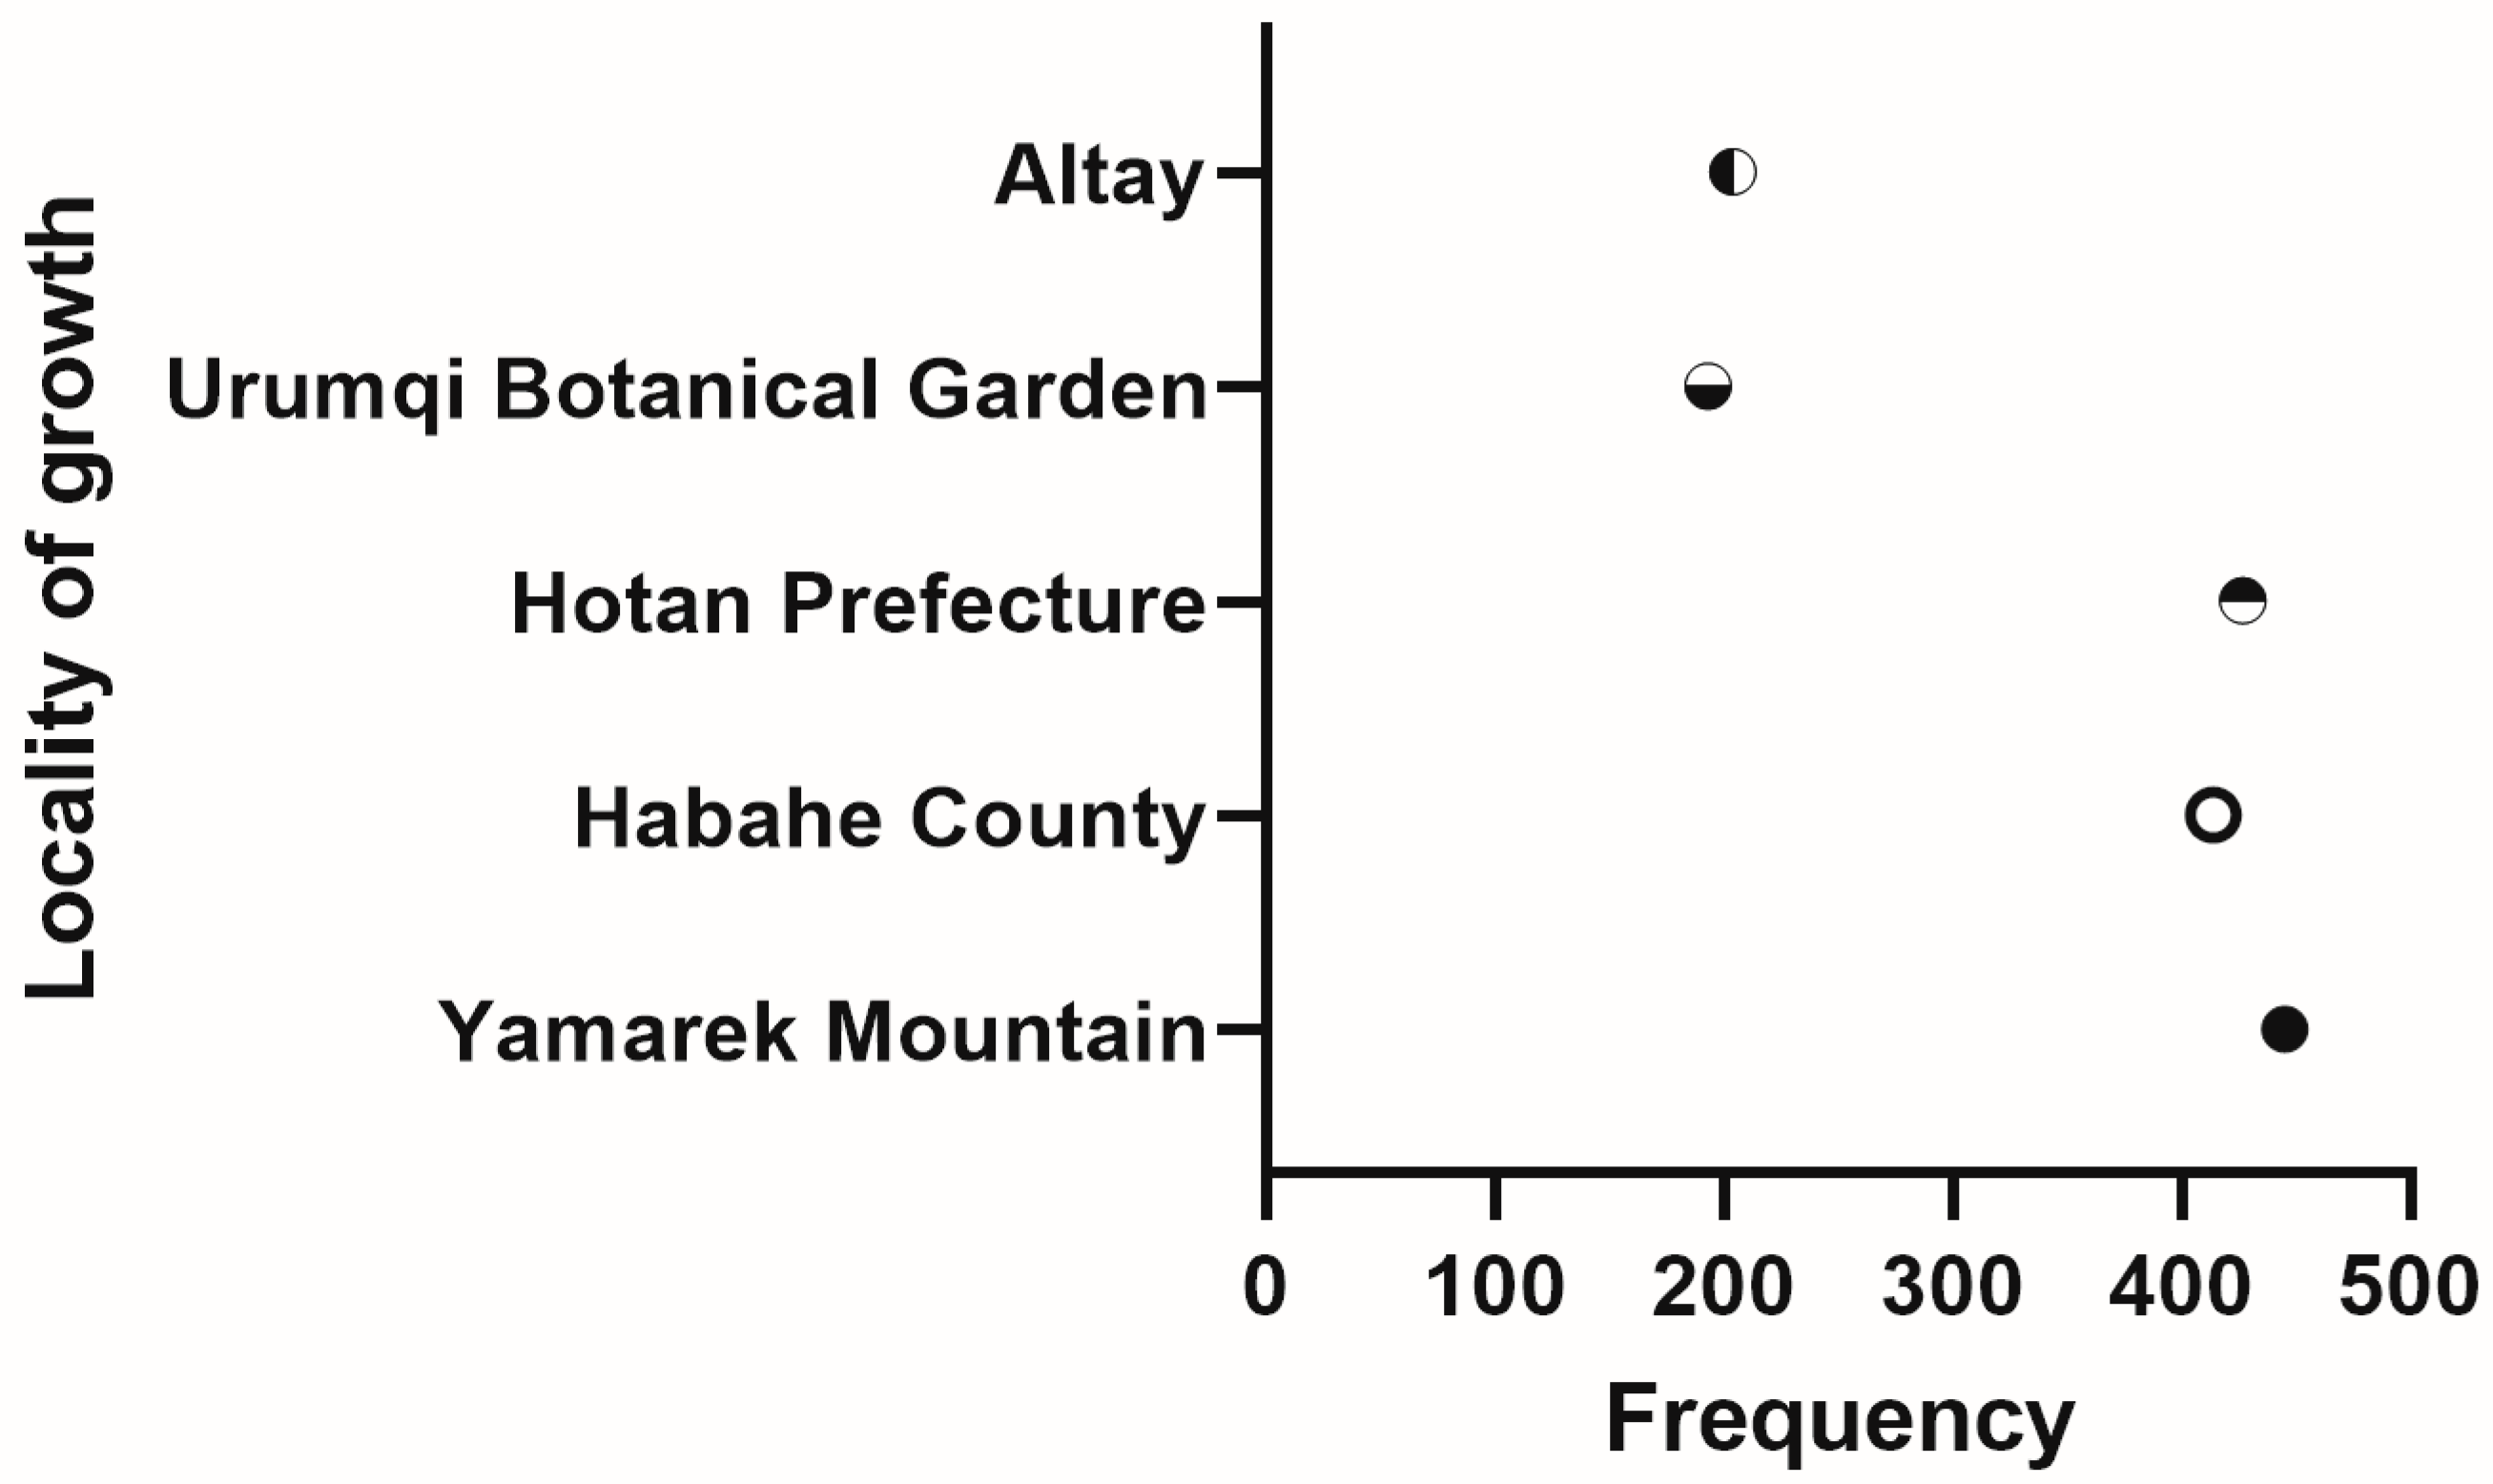
To further investigate inter-group variations, partial least squares discriminant analysis (PLS-DA) was performed using EZInfo V3.0, supplemented by differential constituent analysis in Progenesis QI. By applying strict filtering criteria of VIP ≥ 1 and q-value < 0.01, a total of 1736 significant variables were screened. Using mass spectrometry response intensity as the evaluation metric, we calculated the frequency of high-response compounds across the five different origins (Figure 2). The statistical analysis revealed that FRL from Yamalike Mountain possessed the greatest abundance of high-response chemical constituents. Based on these findings, the Yamalike Mountain sample was designated as the primary subject for all subsequent chemical profiling and pharmacodynamic studies.
Figure 2.
Origin Name Frequency Chart.
3.2. Identification and Validation of Chemical Constituents in FRLE
A systematic compound identification method was established using the UNIFI informatics platform, integrated with an in-house chemical database containing 354 compounds with fragmentation data curated from literature and preliminary studies. After binary comparison and exclusion of impurities from blank solvents, the remaining data were matched based on accurate mass with a tolerance of 10 ppm and a precursor ion response threshold of 10,000. The software was configured to generate theoretical fragments from input structures and incorporate all isotopic peaks for matching. To minimize false positives, a compound was only tentatively identified if it contained at least one experimentally reported fragment from literature. The results revealed that FRLE is rich in diverse chemical classes, including organic acids, flavonoids and their glycosides, triterpenoid acids, sugars and derivatives, phenolic acids and their glycosides, iridoid glycosides, tannins, amino acids, fatty acids, polyphenols, and lactones (Table 1).
Table 1.
Comparison table of UNIFI chemical library.
The m/z values of the compounds listed in Table 1 were imported into an inclusion list for data-dependent acquisition (DDA) mode. No exclusion list was utilized. The MS/MS trigger threshold was set at 10,000, with low and high collision energy ranges of 10–20 eV and 60–80 eV, respectively. Reference standards were procured based on these findings and injected into the mass spectrometer for collision-induced dissociation (CID) optimization (Table 2).
Table 2.
Reference Product Ions and CID.
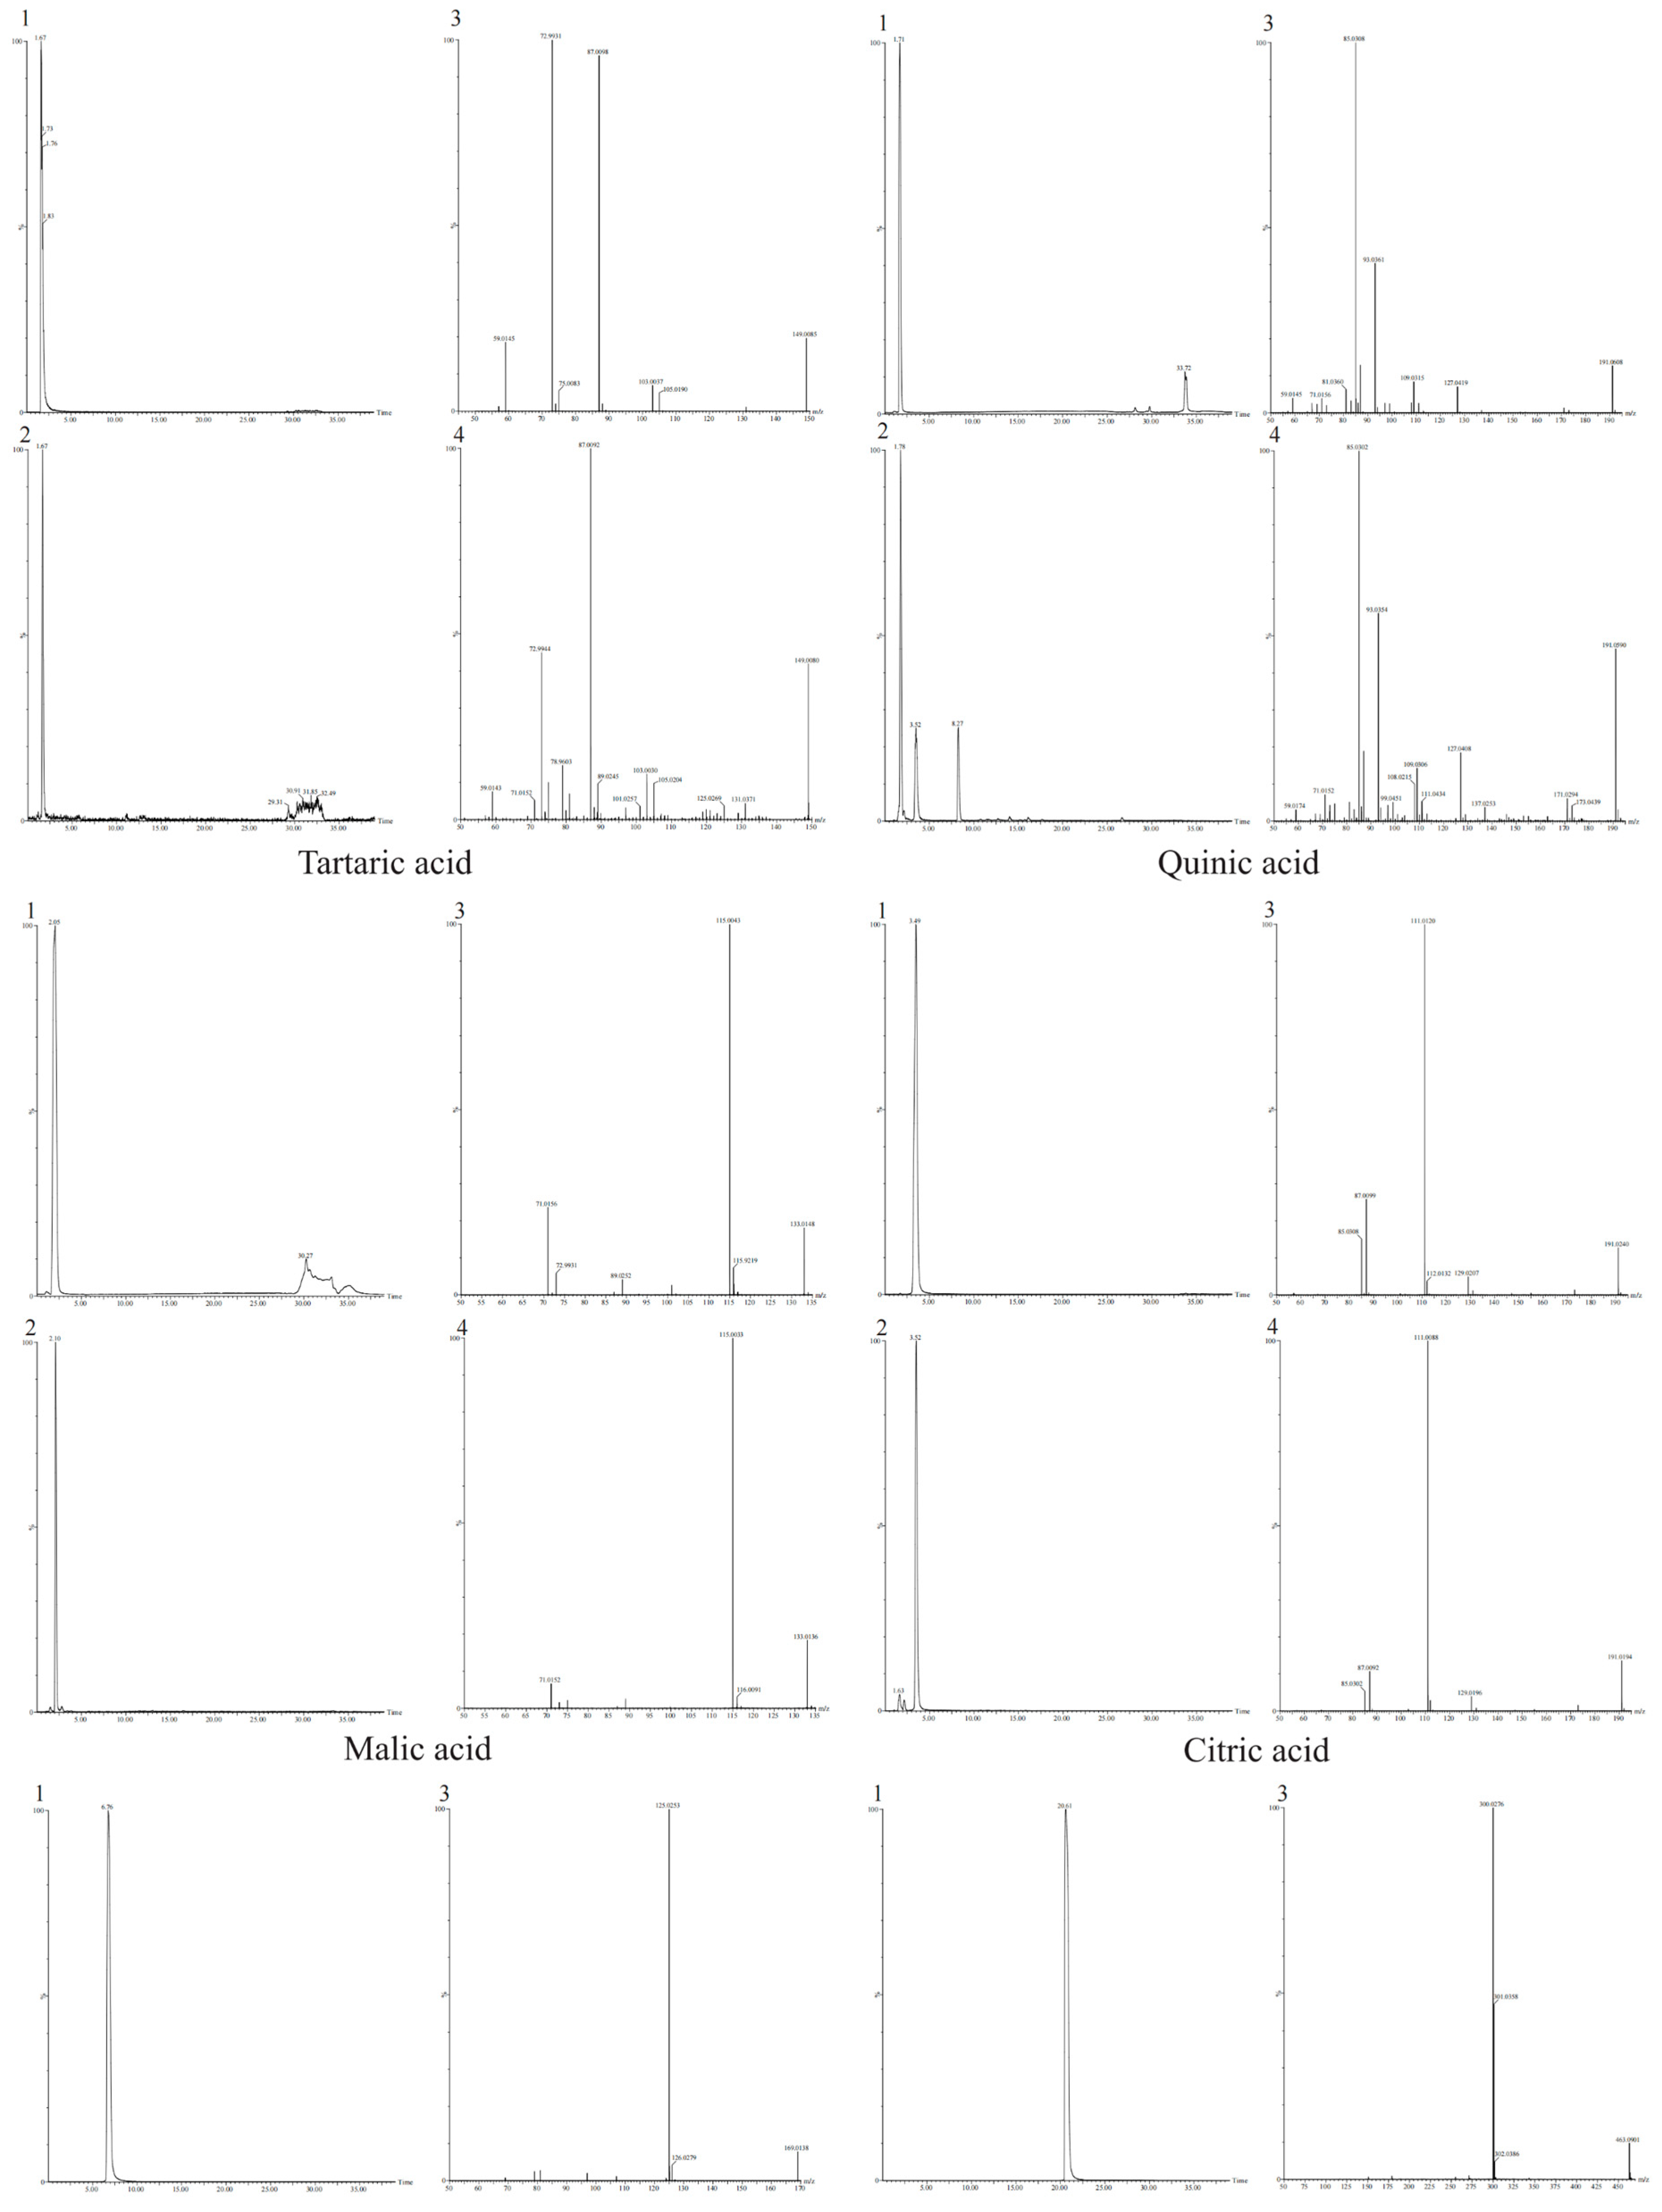
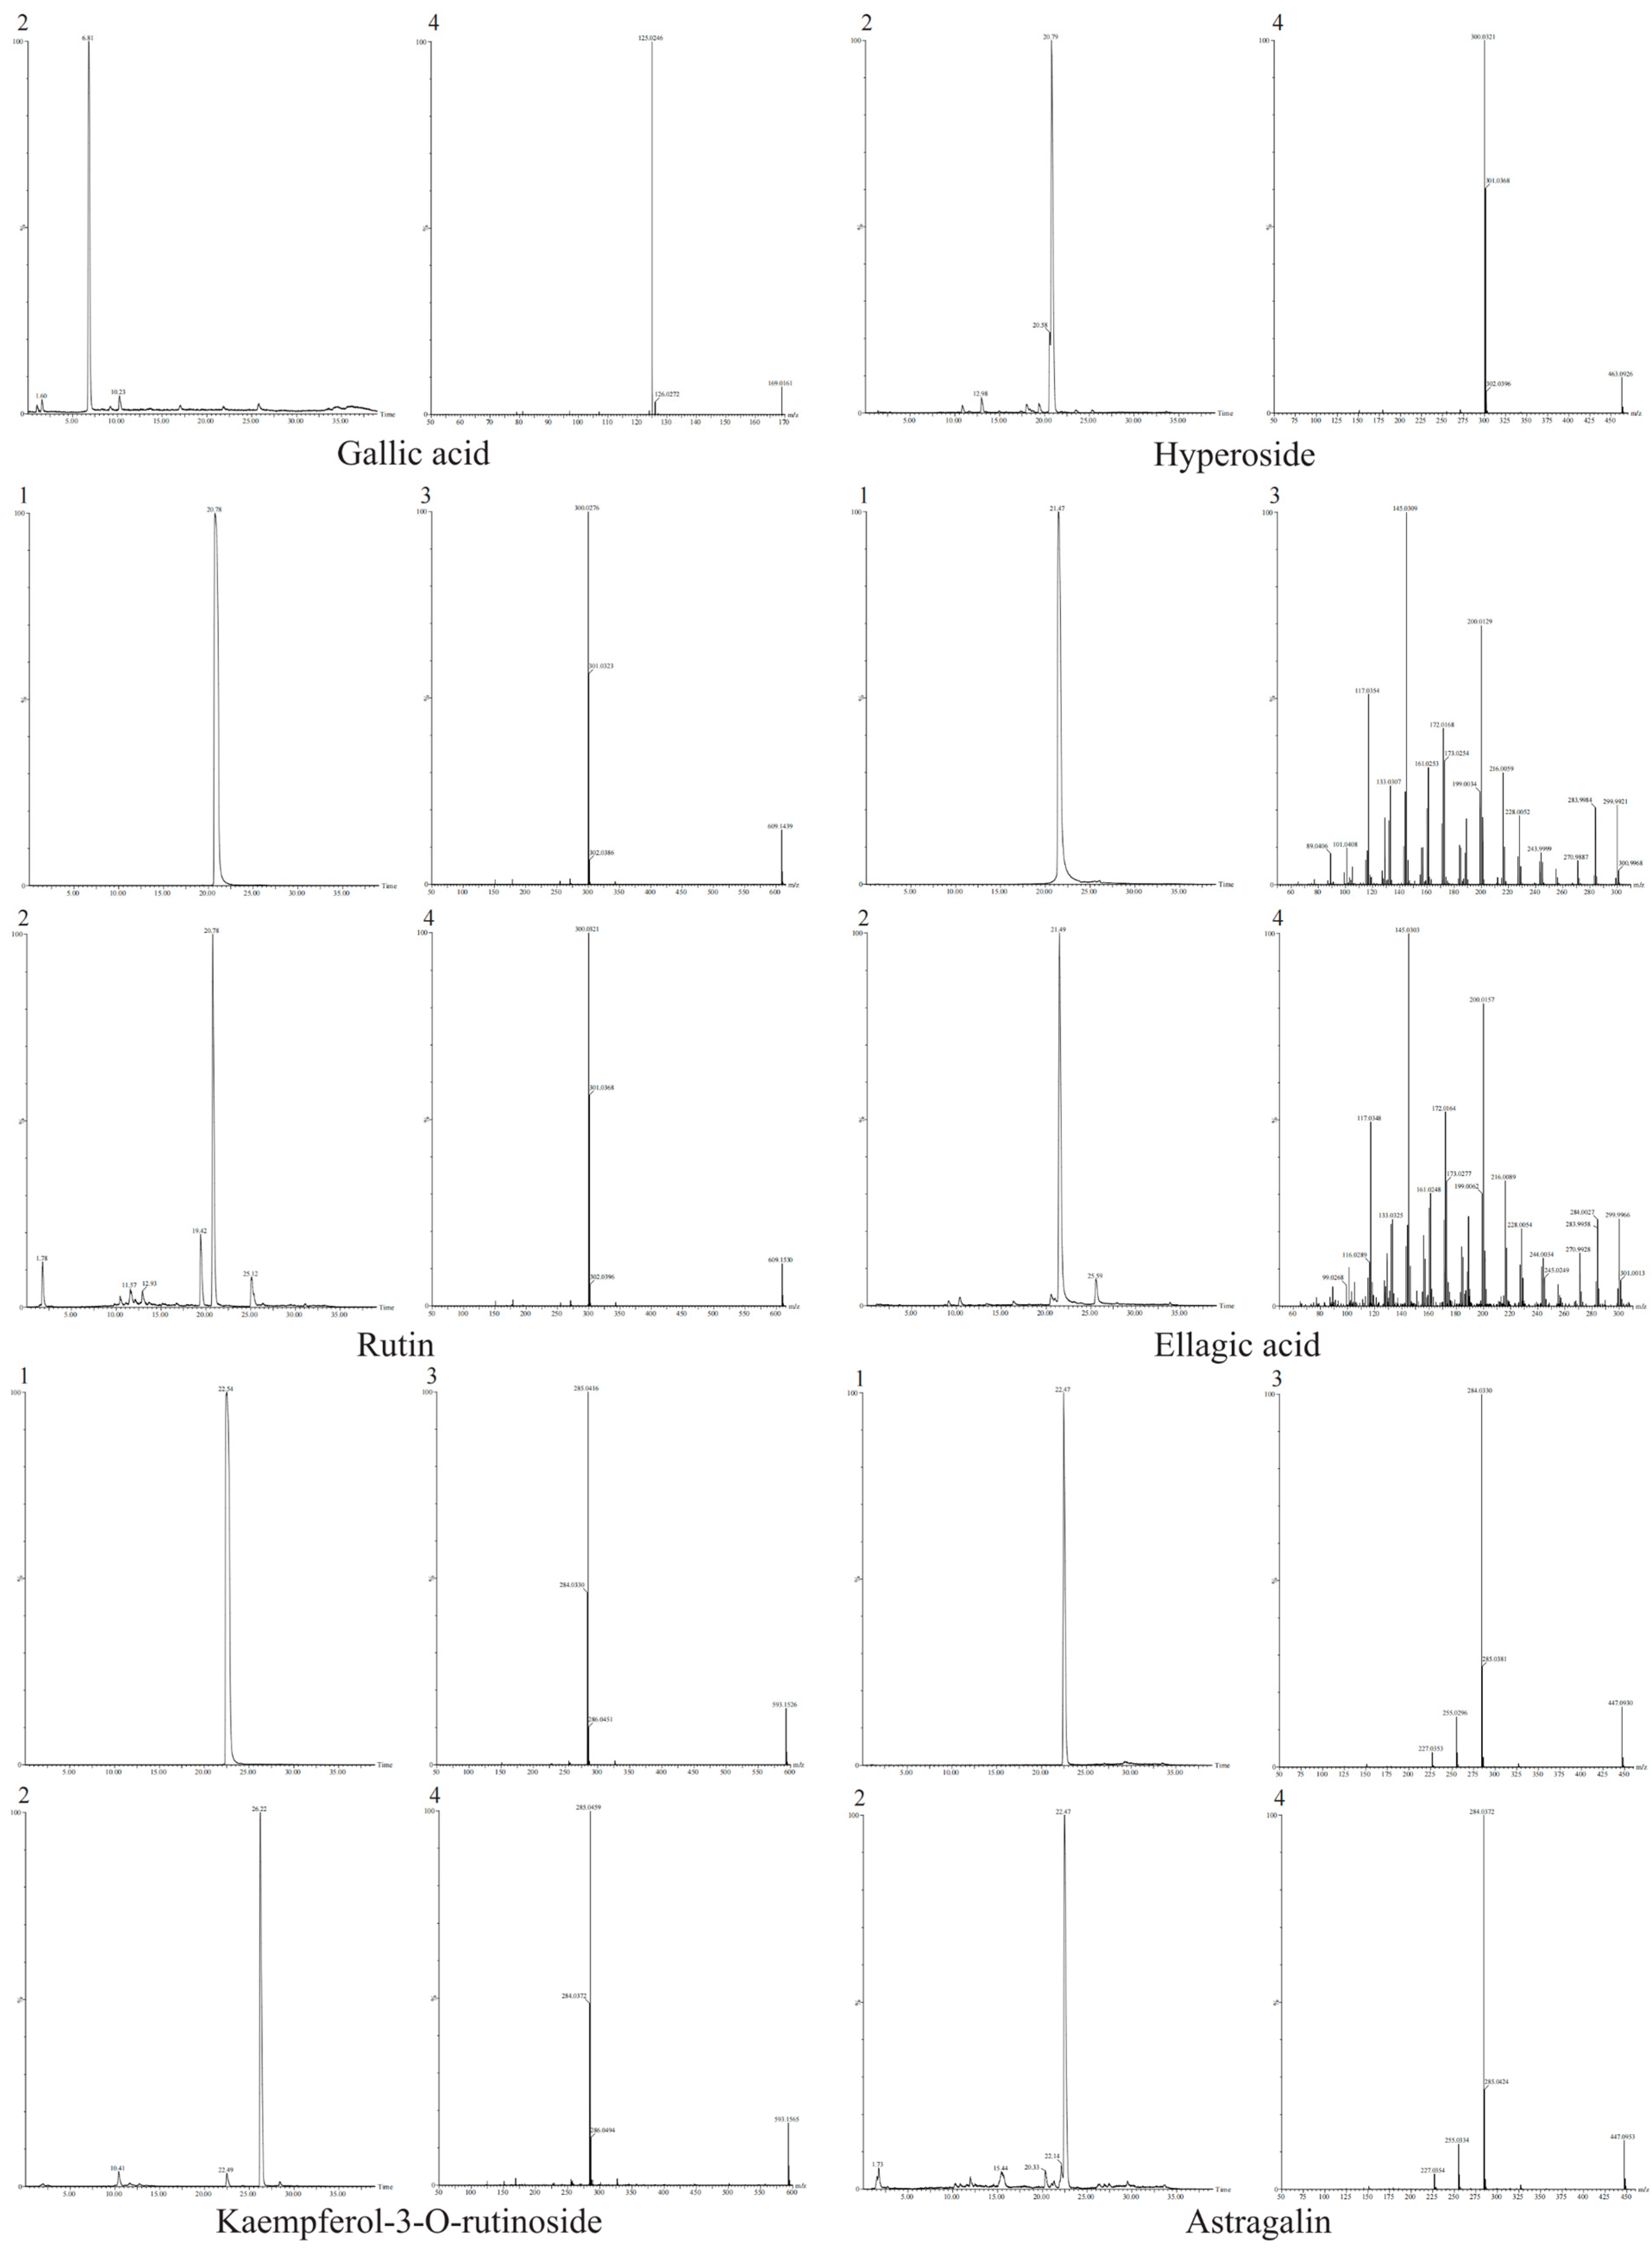
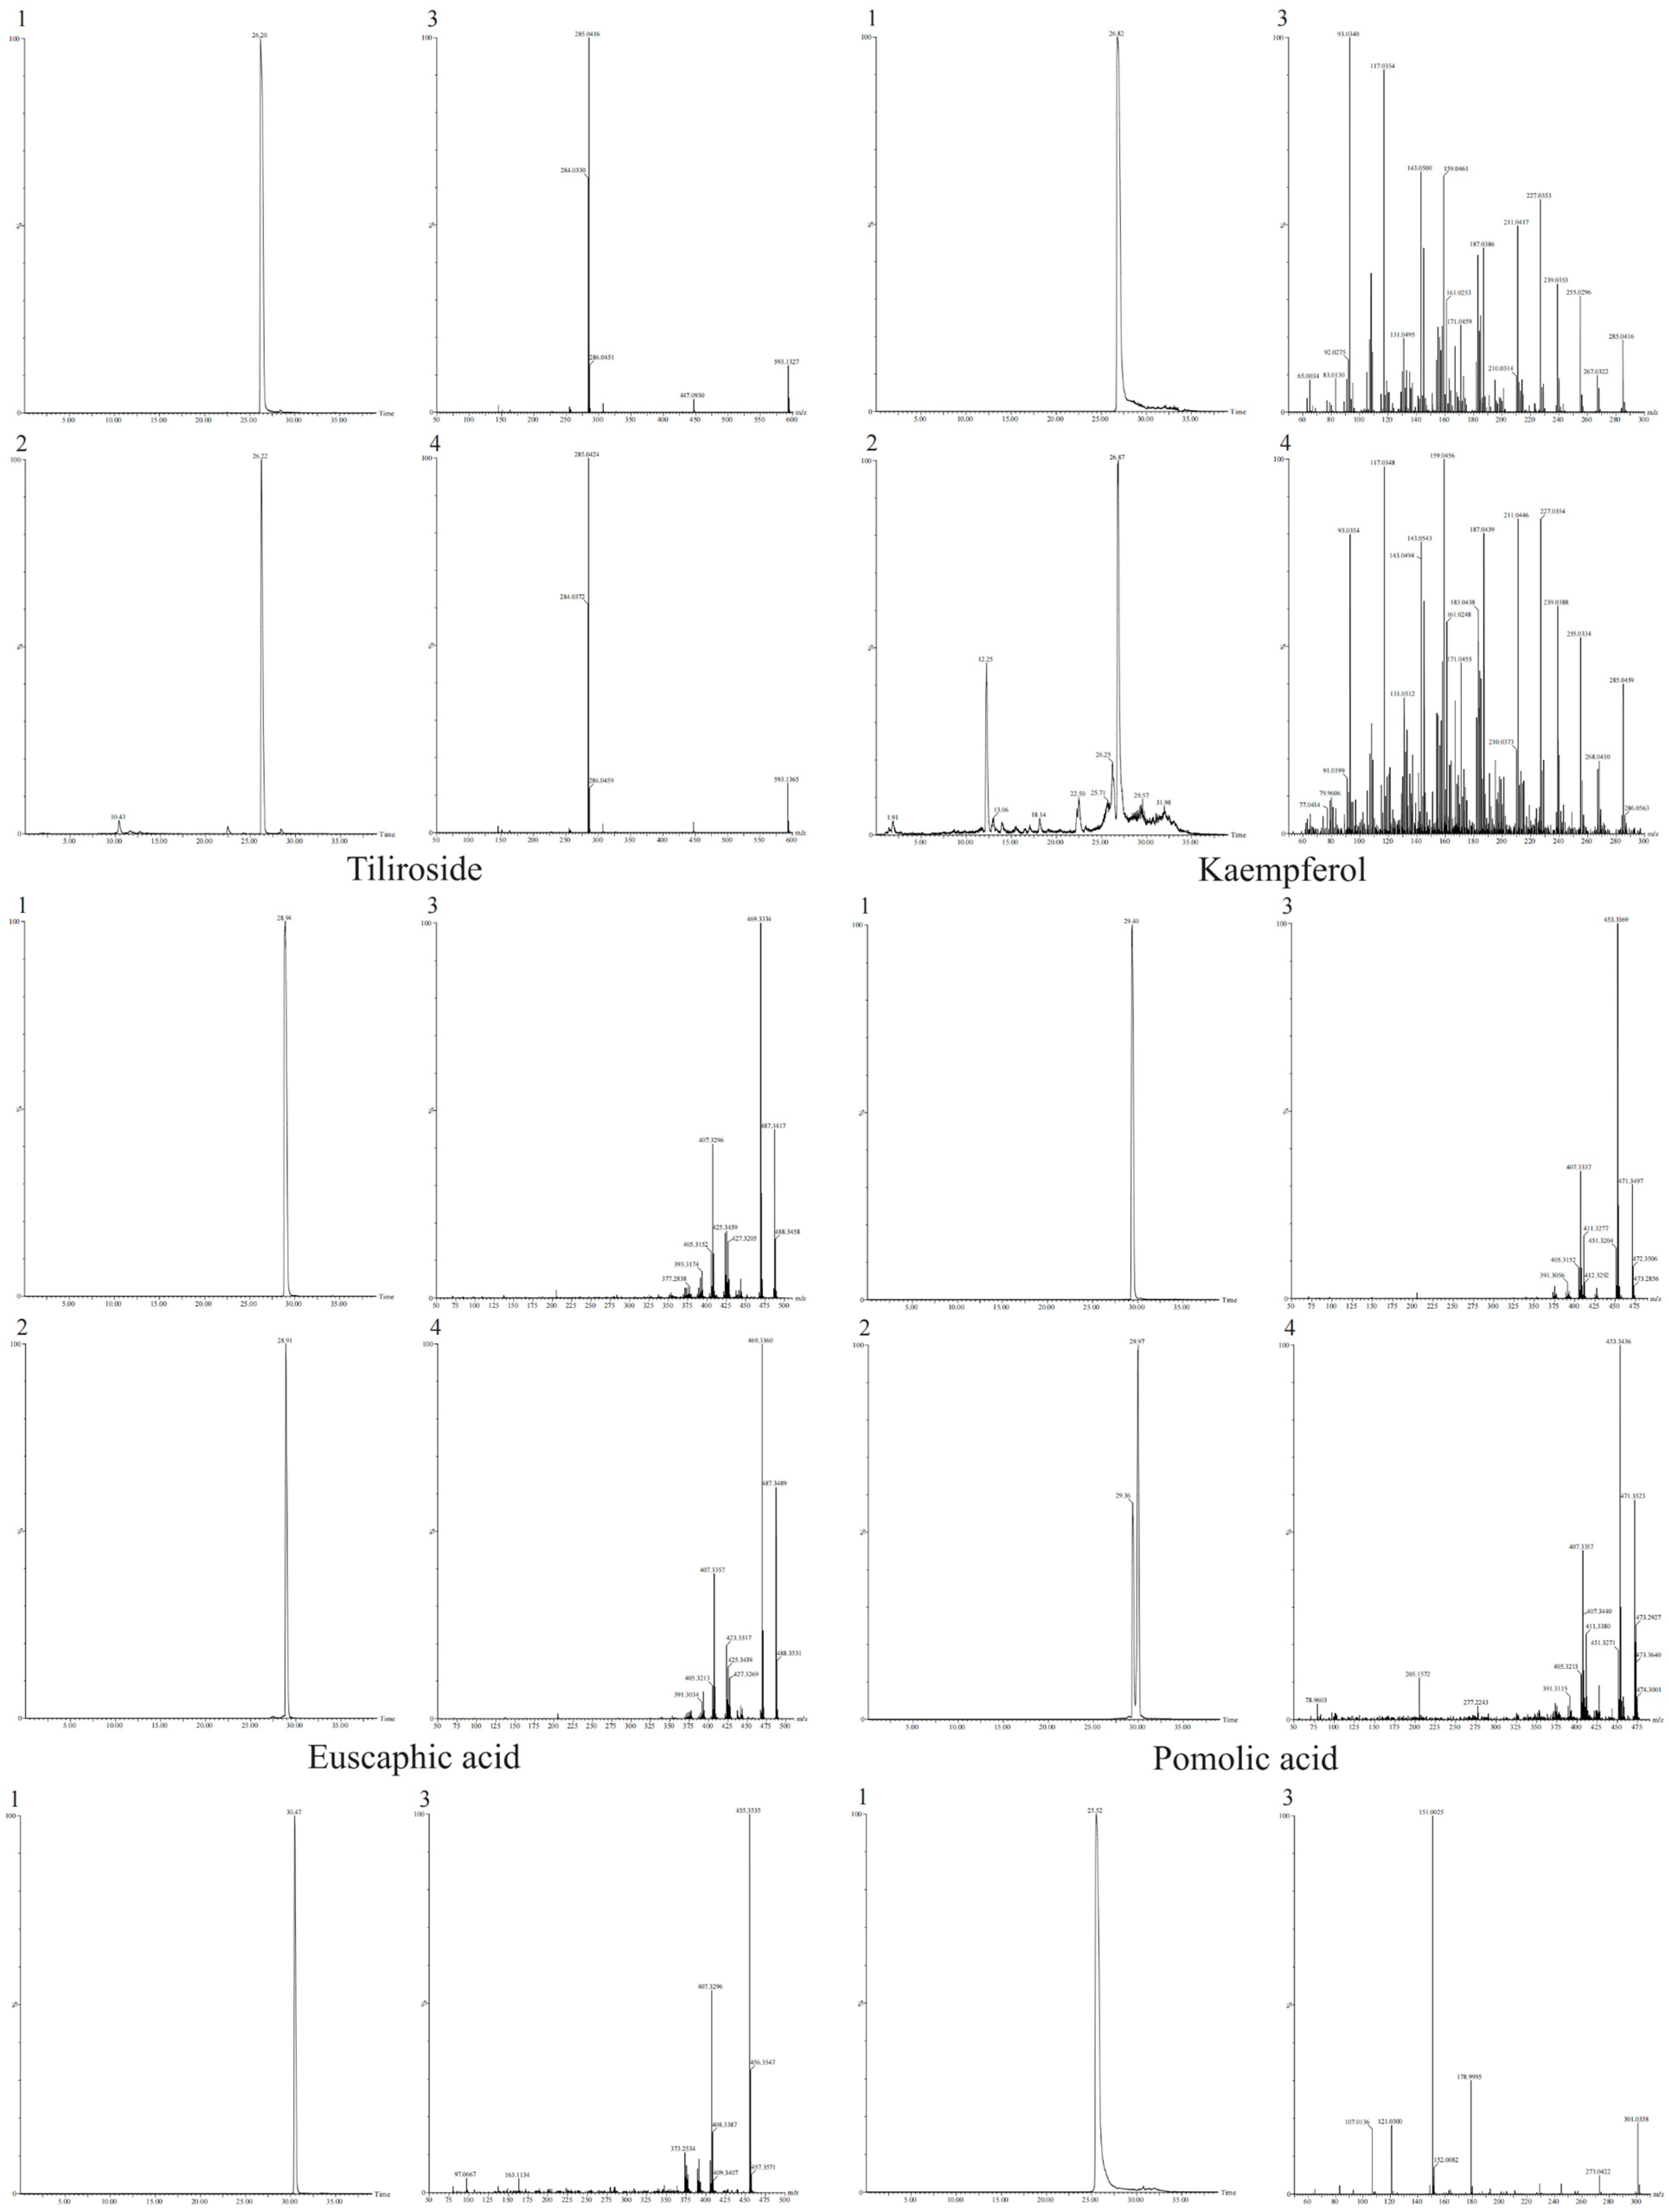
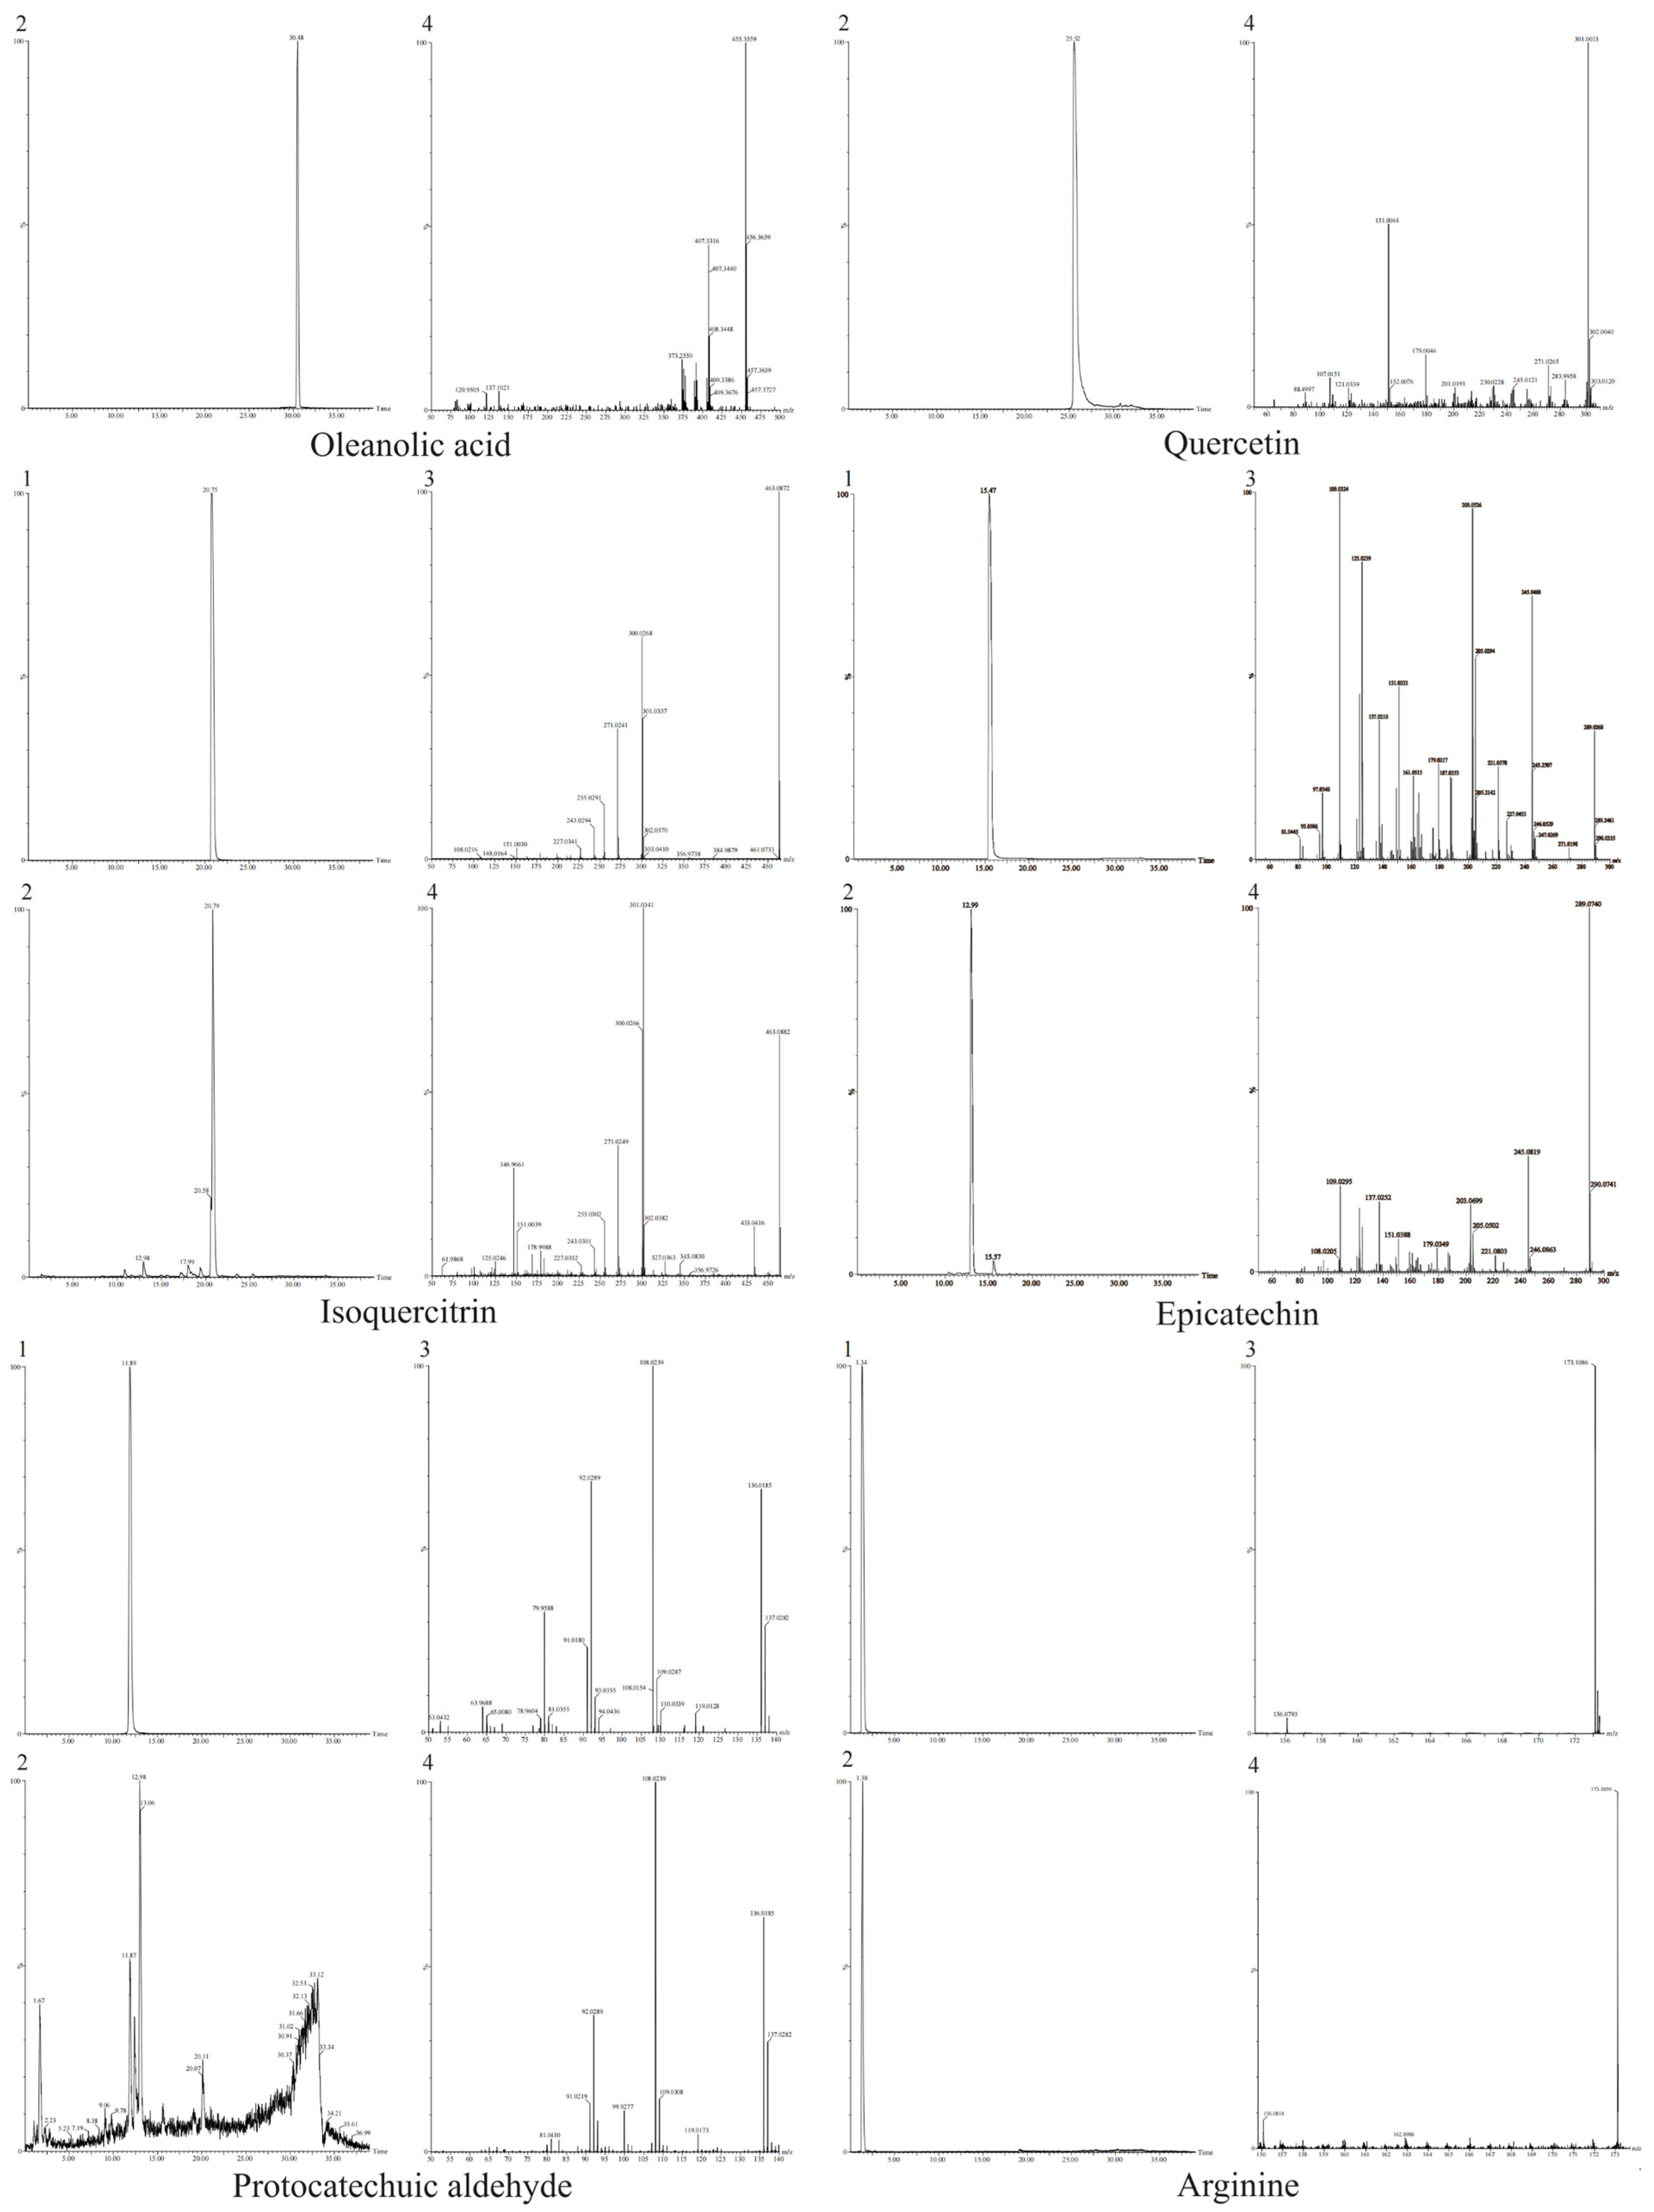
Finally, the reference standards and FRLE samples were analyzed using the optimized CID parameters for MS/MS data acquisition. Compounds in FRLE with retention times (RT) and fragment ions identical to those of the reference standards were confirmed as positively identified constituents (Appendix A).
3.3. Quantitative Determination of Chemical Constituents in FRLE
Calibration curves were established using the TOF-MRM mode. The limit of detection (LOD) and the limit of quantification (LOQ) were defined based on signal-to-noise (S/N) ratios of 3 and 10, respectively. Detailed parameters, including regression equations, correlation coefficients (R2), and linear ranges for each constituent, are summarized in Table 3. The contents of the identified compounds in FRLE are summarized in Table 4.
Table 3.
Linear equation and LOD and LOQ.
Table 4.
Contents of major chemical constituents in FRLE.
3.4. Pharmacodynamic Evaluation of FRLE Against HLP
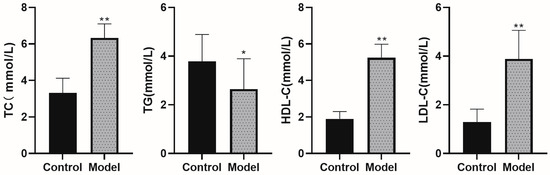
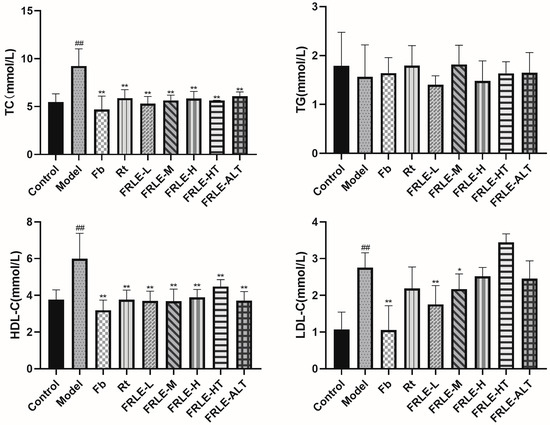
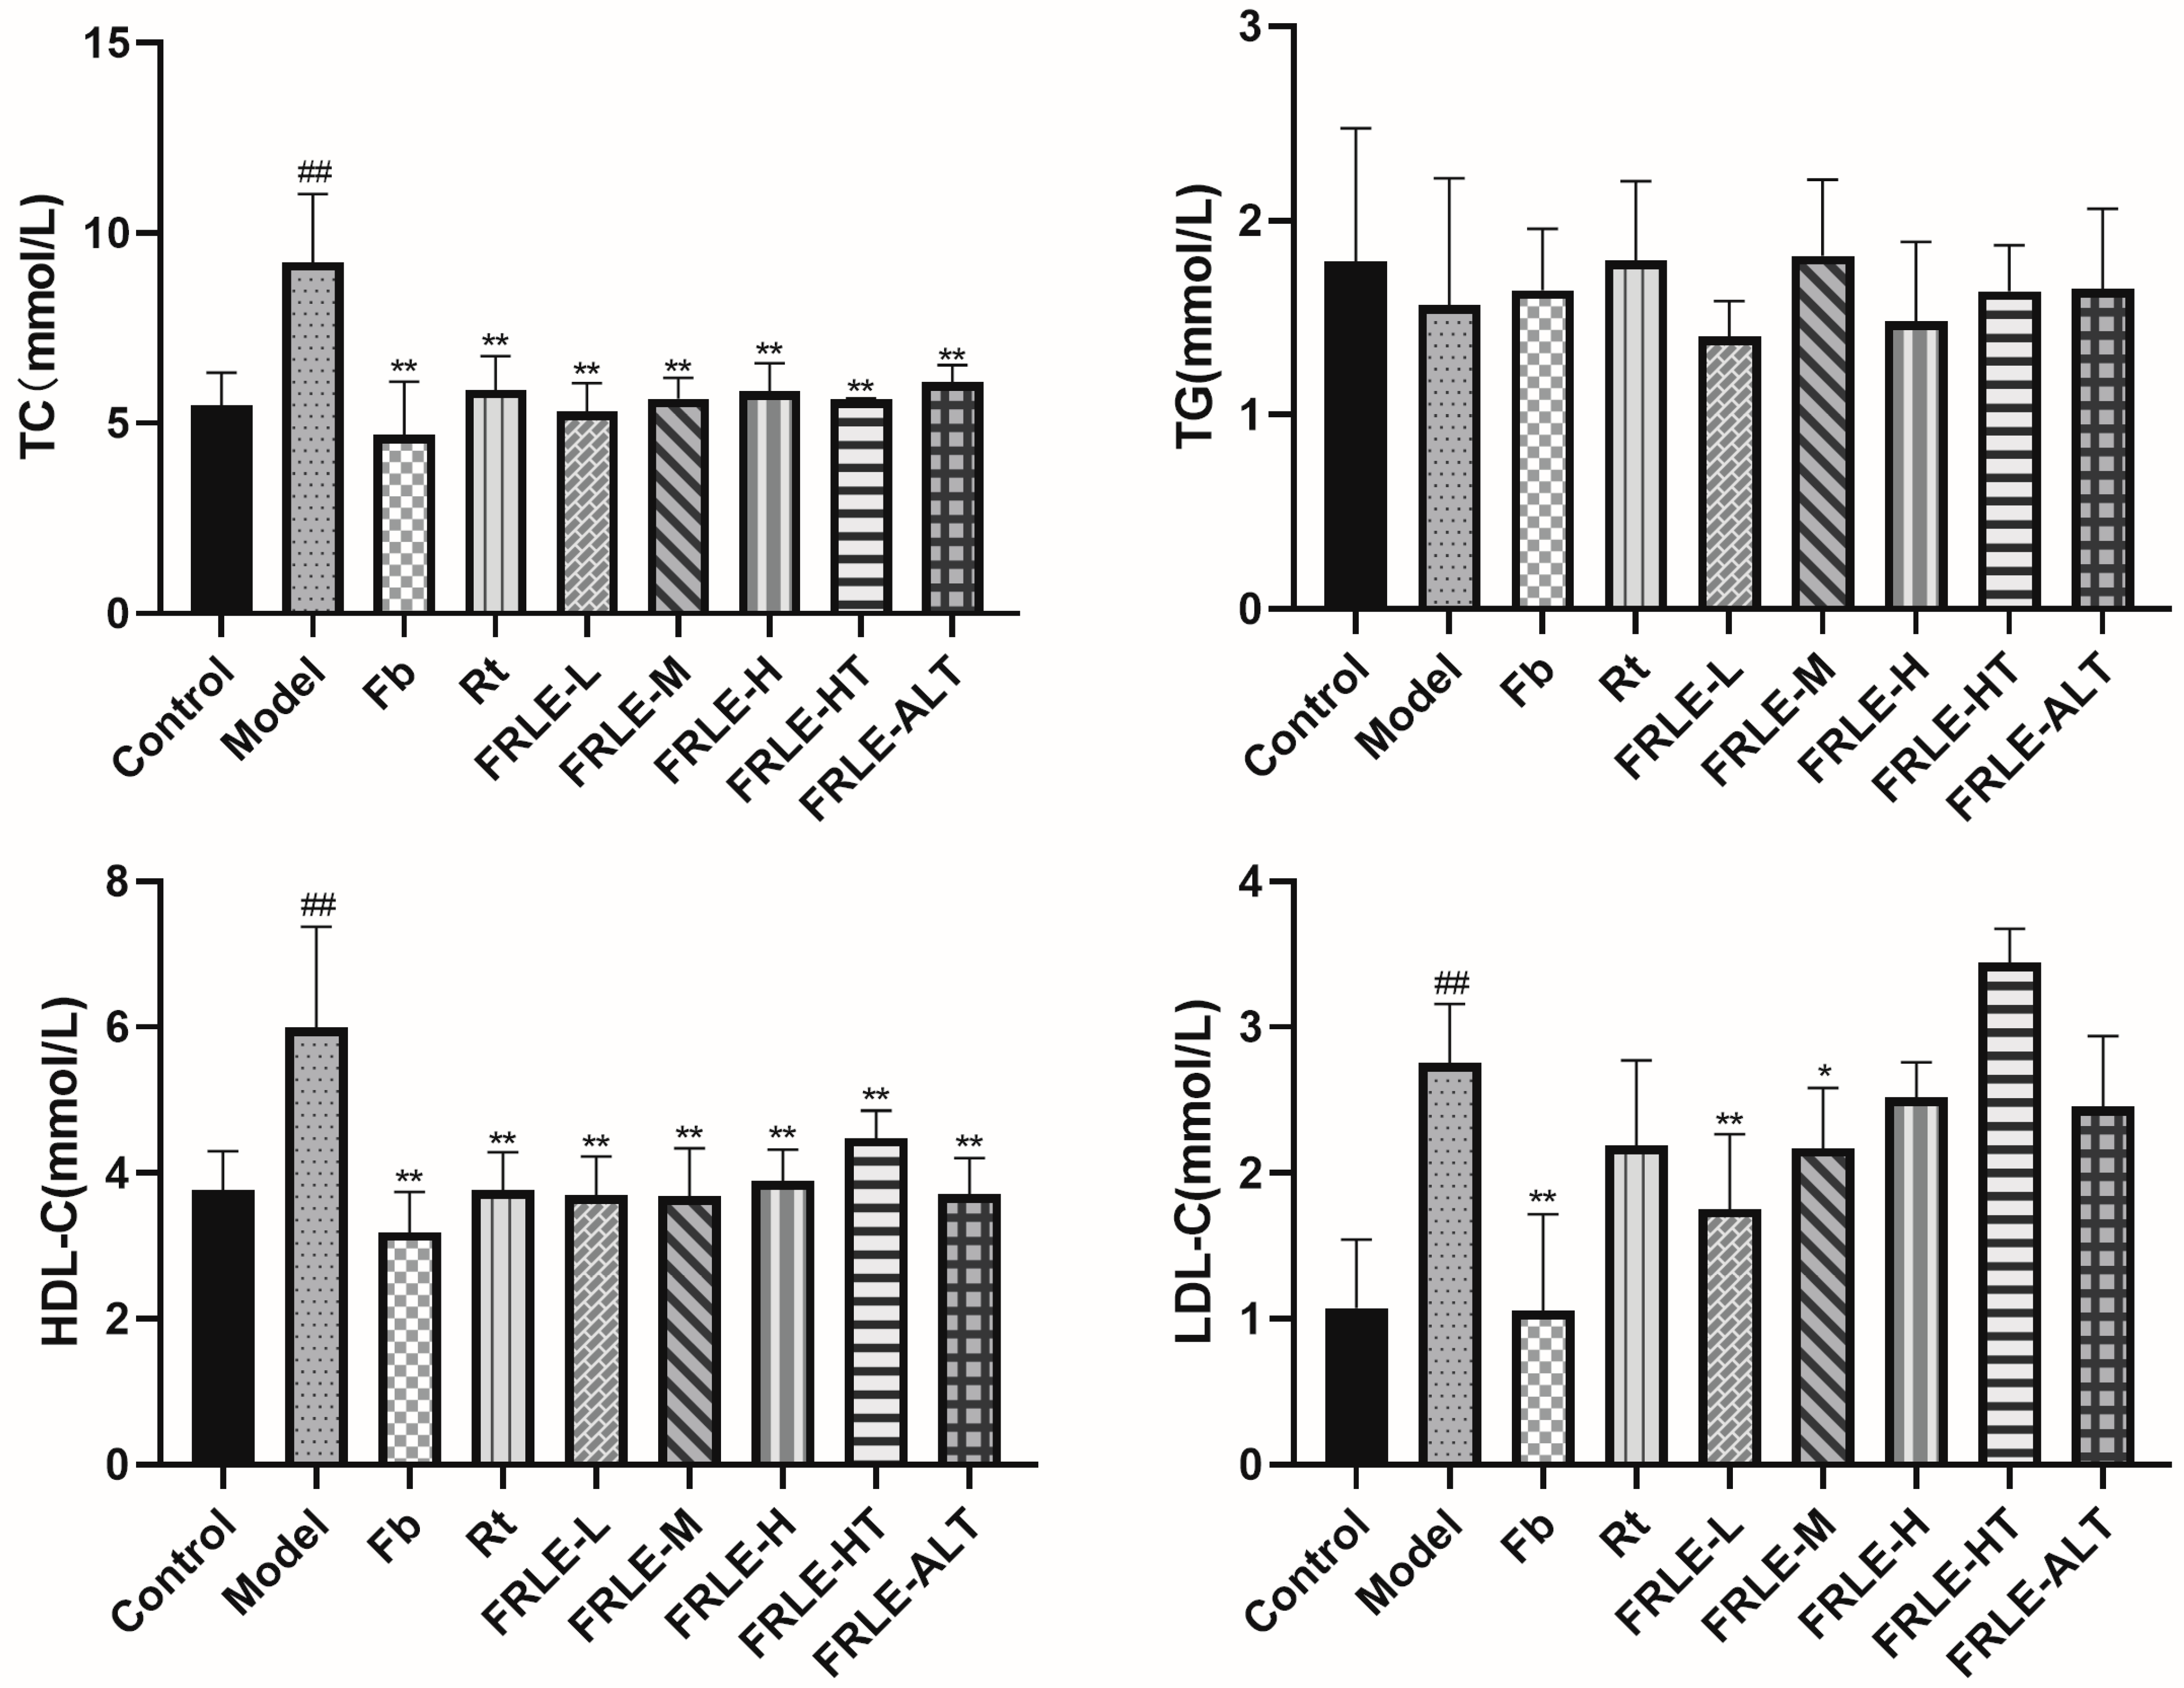
The levels of TC, TG, HDL-C, and LDL-C were determined following the manufacturer’s protocols. Each sample was measured in three independent replicates, and the mean value was used for statistical analysis (Figure 3). The model group exhibited significantly higher levels of TC and LDL-C compared to the control group (p < 0.01), confirming the successful establishment of the HLP model.
Figure 3.
TC, TG, HDL-C, and LDL-C statistical charts (*: p < 0.05, **: p < 0.01).
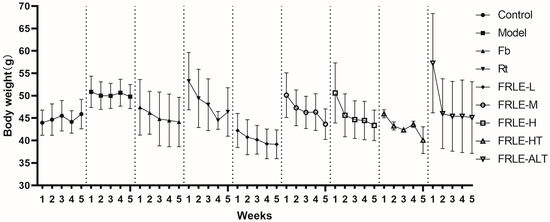
Following successful modeling, the mean body weights of mice in each group were plotted (Figure 4). The body weights of the control group and model group remained relatively stable throughout the study. In contrast, the FRLE-ALT group showed a significant weight decrease from week 1 to week 2, followed by a plateau until week 4, and a further decline in week 5. The Rt group displayed a continuous weekly weight reduction. Other drug intervention groups generally exhibited a gradual downward trend in body weight.
Figure 4.
Body weight of 5 weeks statistics chart (n = 6).
The serum levels of TC, TG, HDL-C, and LDL-C for all groups are summarized in Figure 5. Compared with the control group, the model group showed significantly elevated TC and LDL-C levels (p < 0.01), validating both the induction and maintenance of HLP. In the positive control groups, Fb significantly reduced TC and LDL-C levels (p < 0.01), while Rt significantly lowered TC (p < 0.01) compared to the model group, which is consistent with their clinical indications. These results confirm the reliability of the experimental environment and conditions. Notably, the FRLE-L, FRLE-M, FRLE-H, FRLE-HT, and FRLE-ALT groups all demonstrated a significant reduction in TC compared to the model group (p < 0.01); however, no clear dose-dependent relationship was observed among the three FRLE dosage levels. Regarding LDL-C, only the FRLE-L (p < 0.01) and FRLE-M (p < 0.05) groups showed significant decreases, whereas the FRLE-H and FRLE-ALT groups exhibited non-significant reductions (p > 0.05).
Figure 5.
TC, TG, HDL-C, and LDL-C statistical charts (#: model group vs. control group p < 0.05, ##: p < 0.01, *: drug intervention groups vs. model group, p < 0.05, **: p < 0.01).
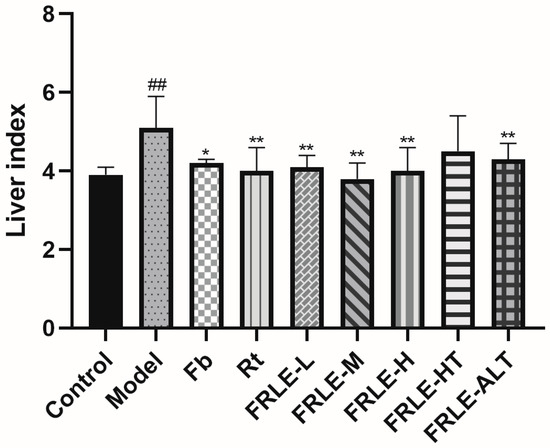
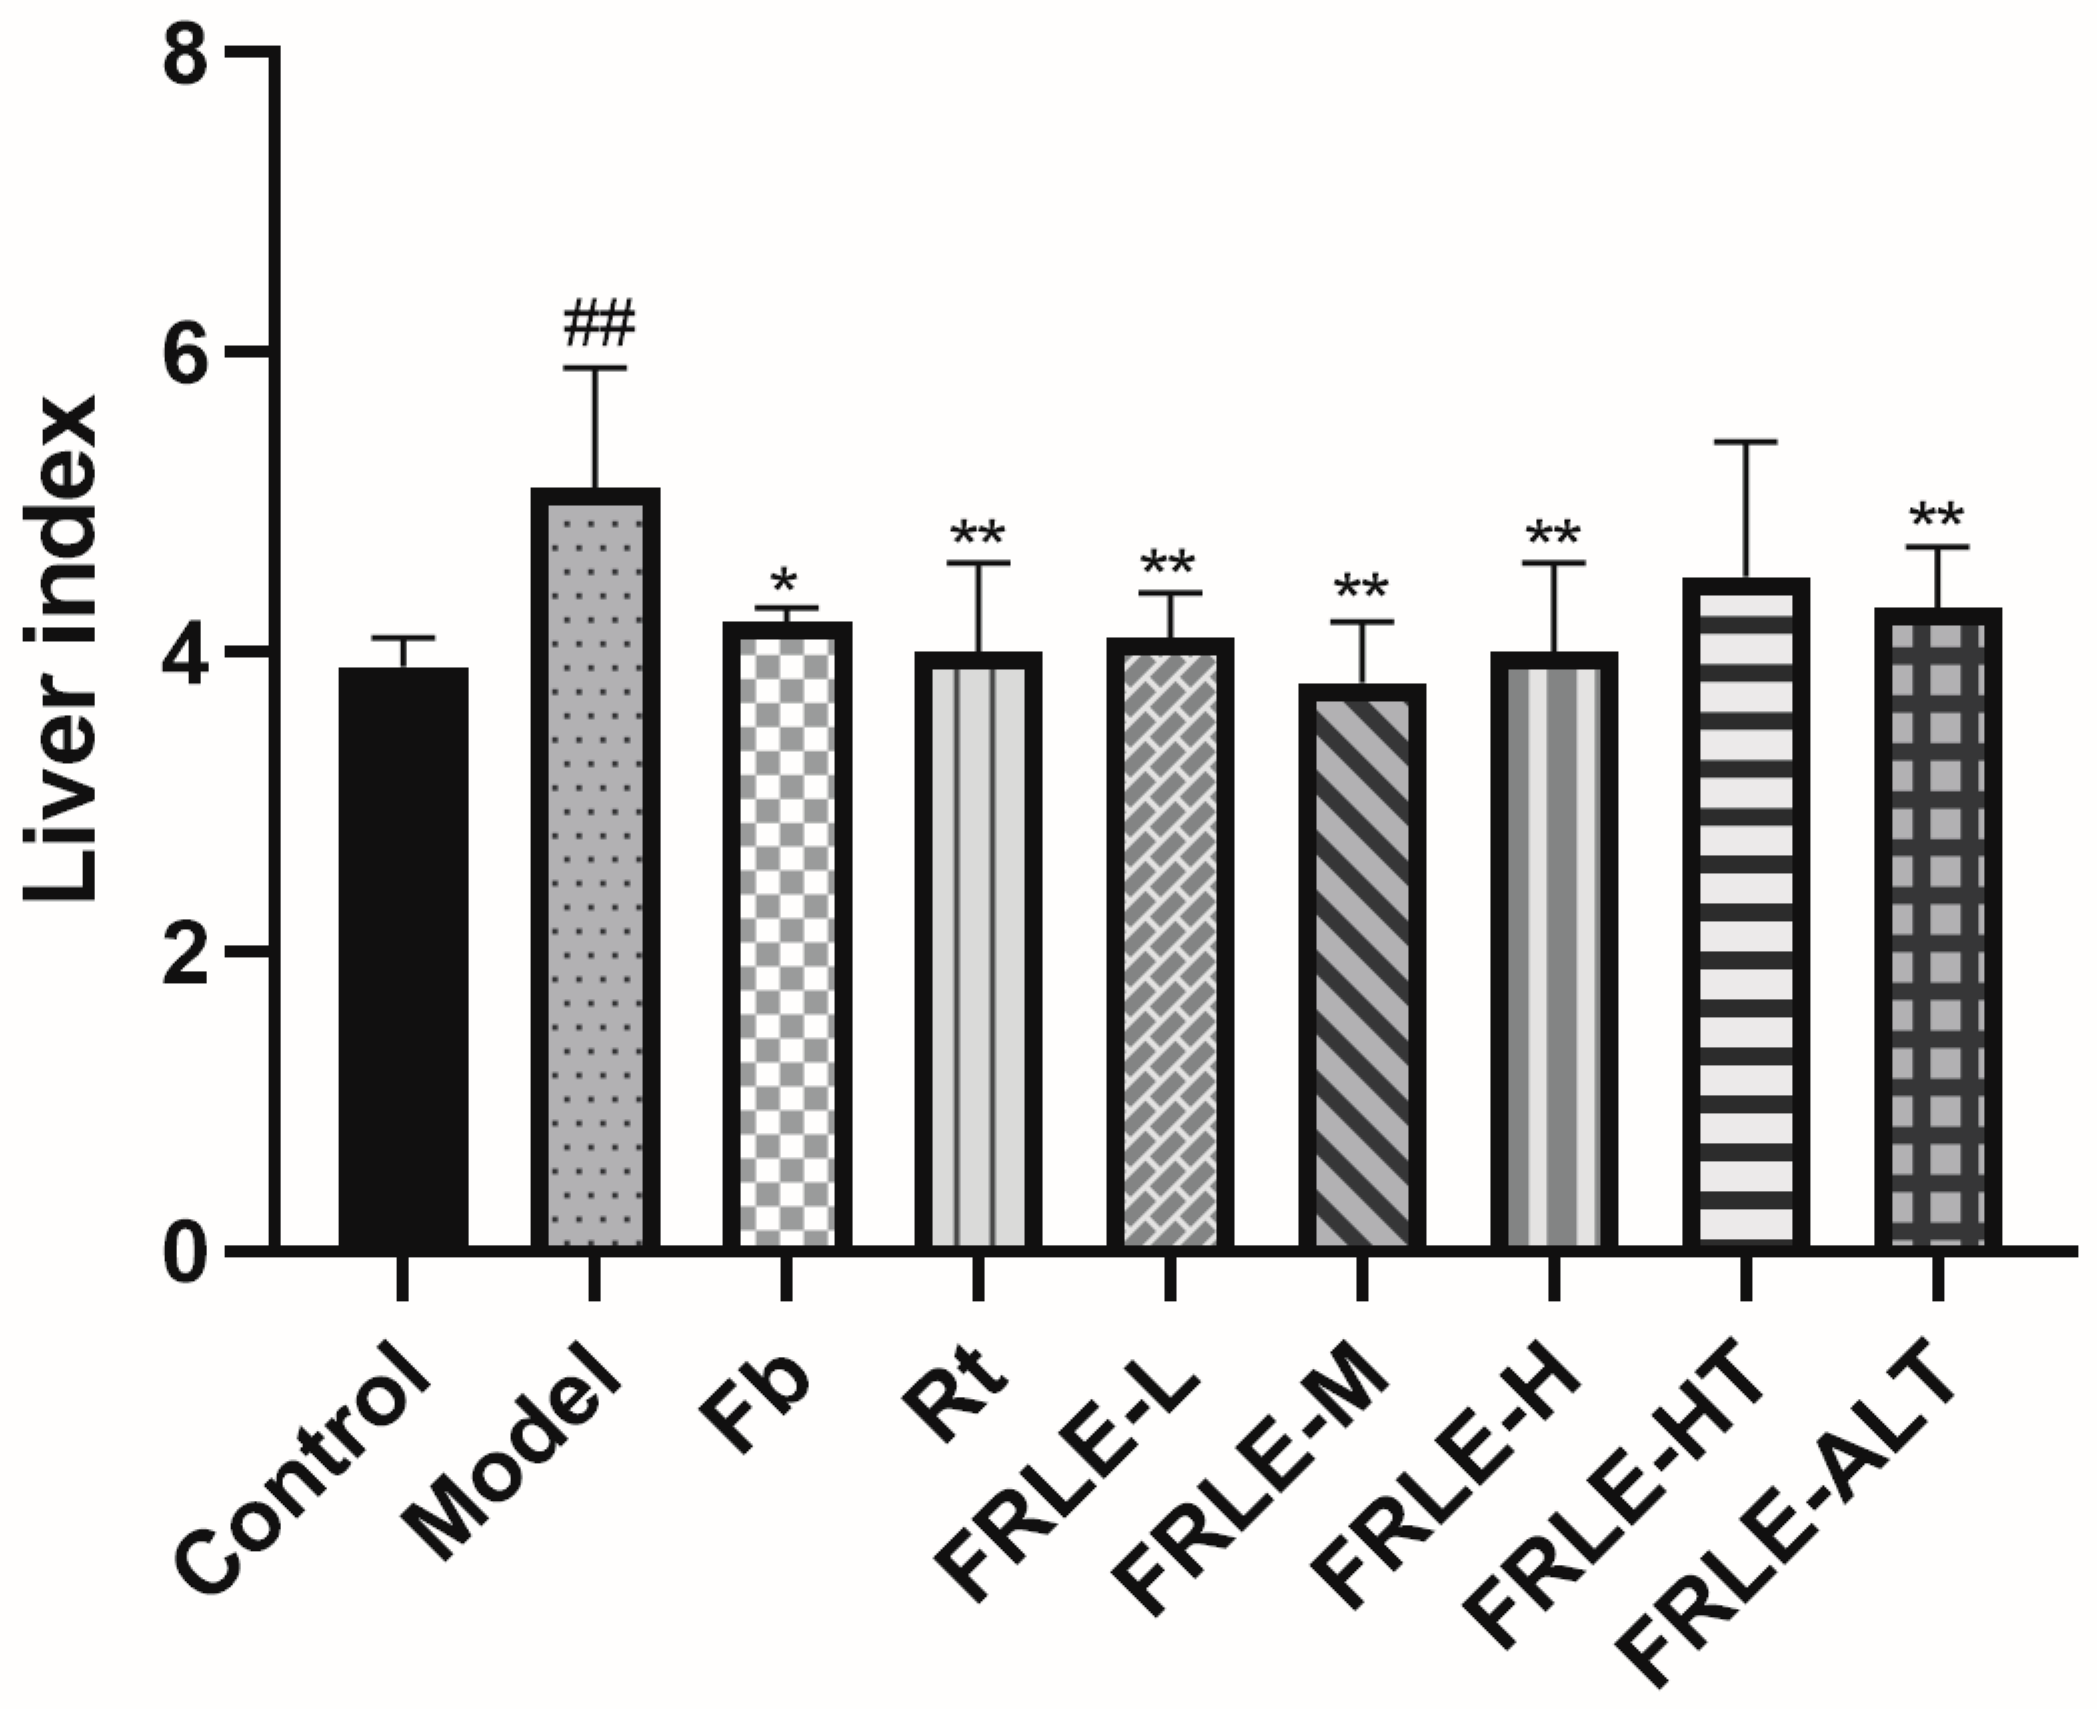
The liver index was calculated after rinsing and weighing the liver tissues (Figure 6). The model group showed a significant increase in the liver index compared to the control group. Except for the FRLE-HT group, all other drug-treated groups exhibited a significant decrease in liver index compared to the model group.
Figure 6.
Liver index statistical charts (#: model group vs. control group p < 0.05, ##: p < 0.01, *: drug intervention groups vs. model group, p < 0.05, **: p < 0.01).
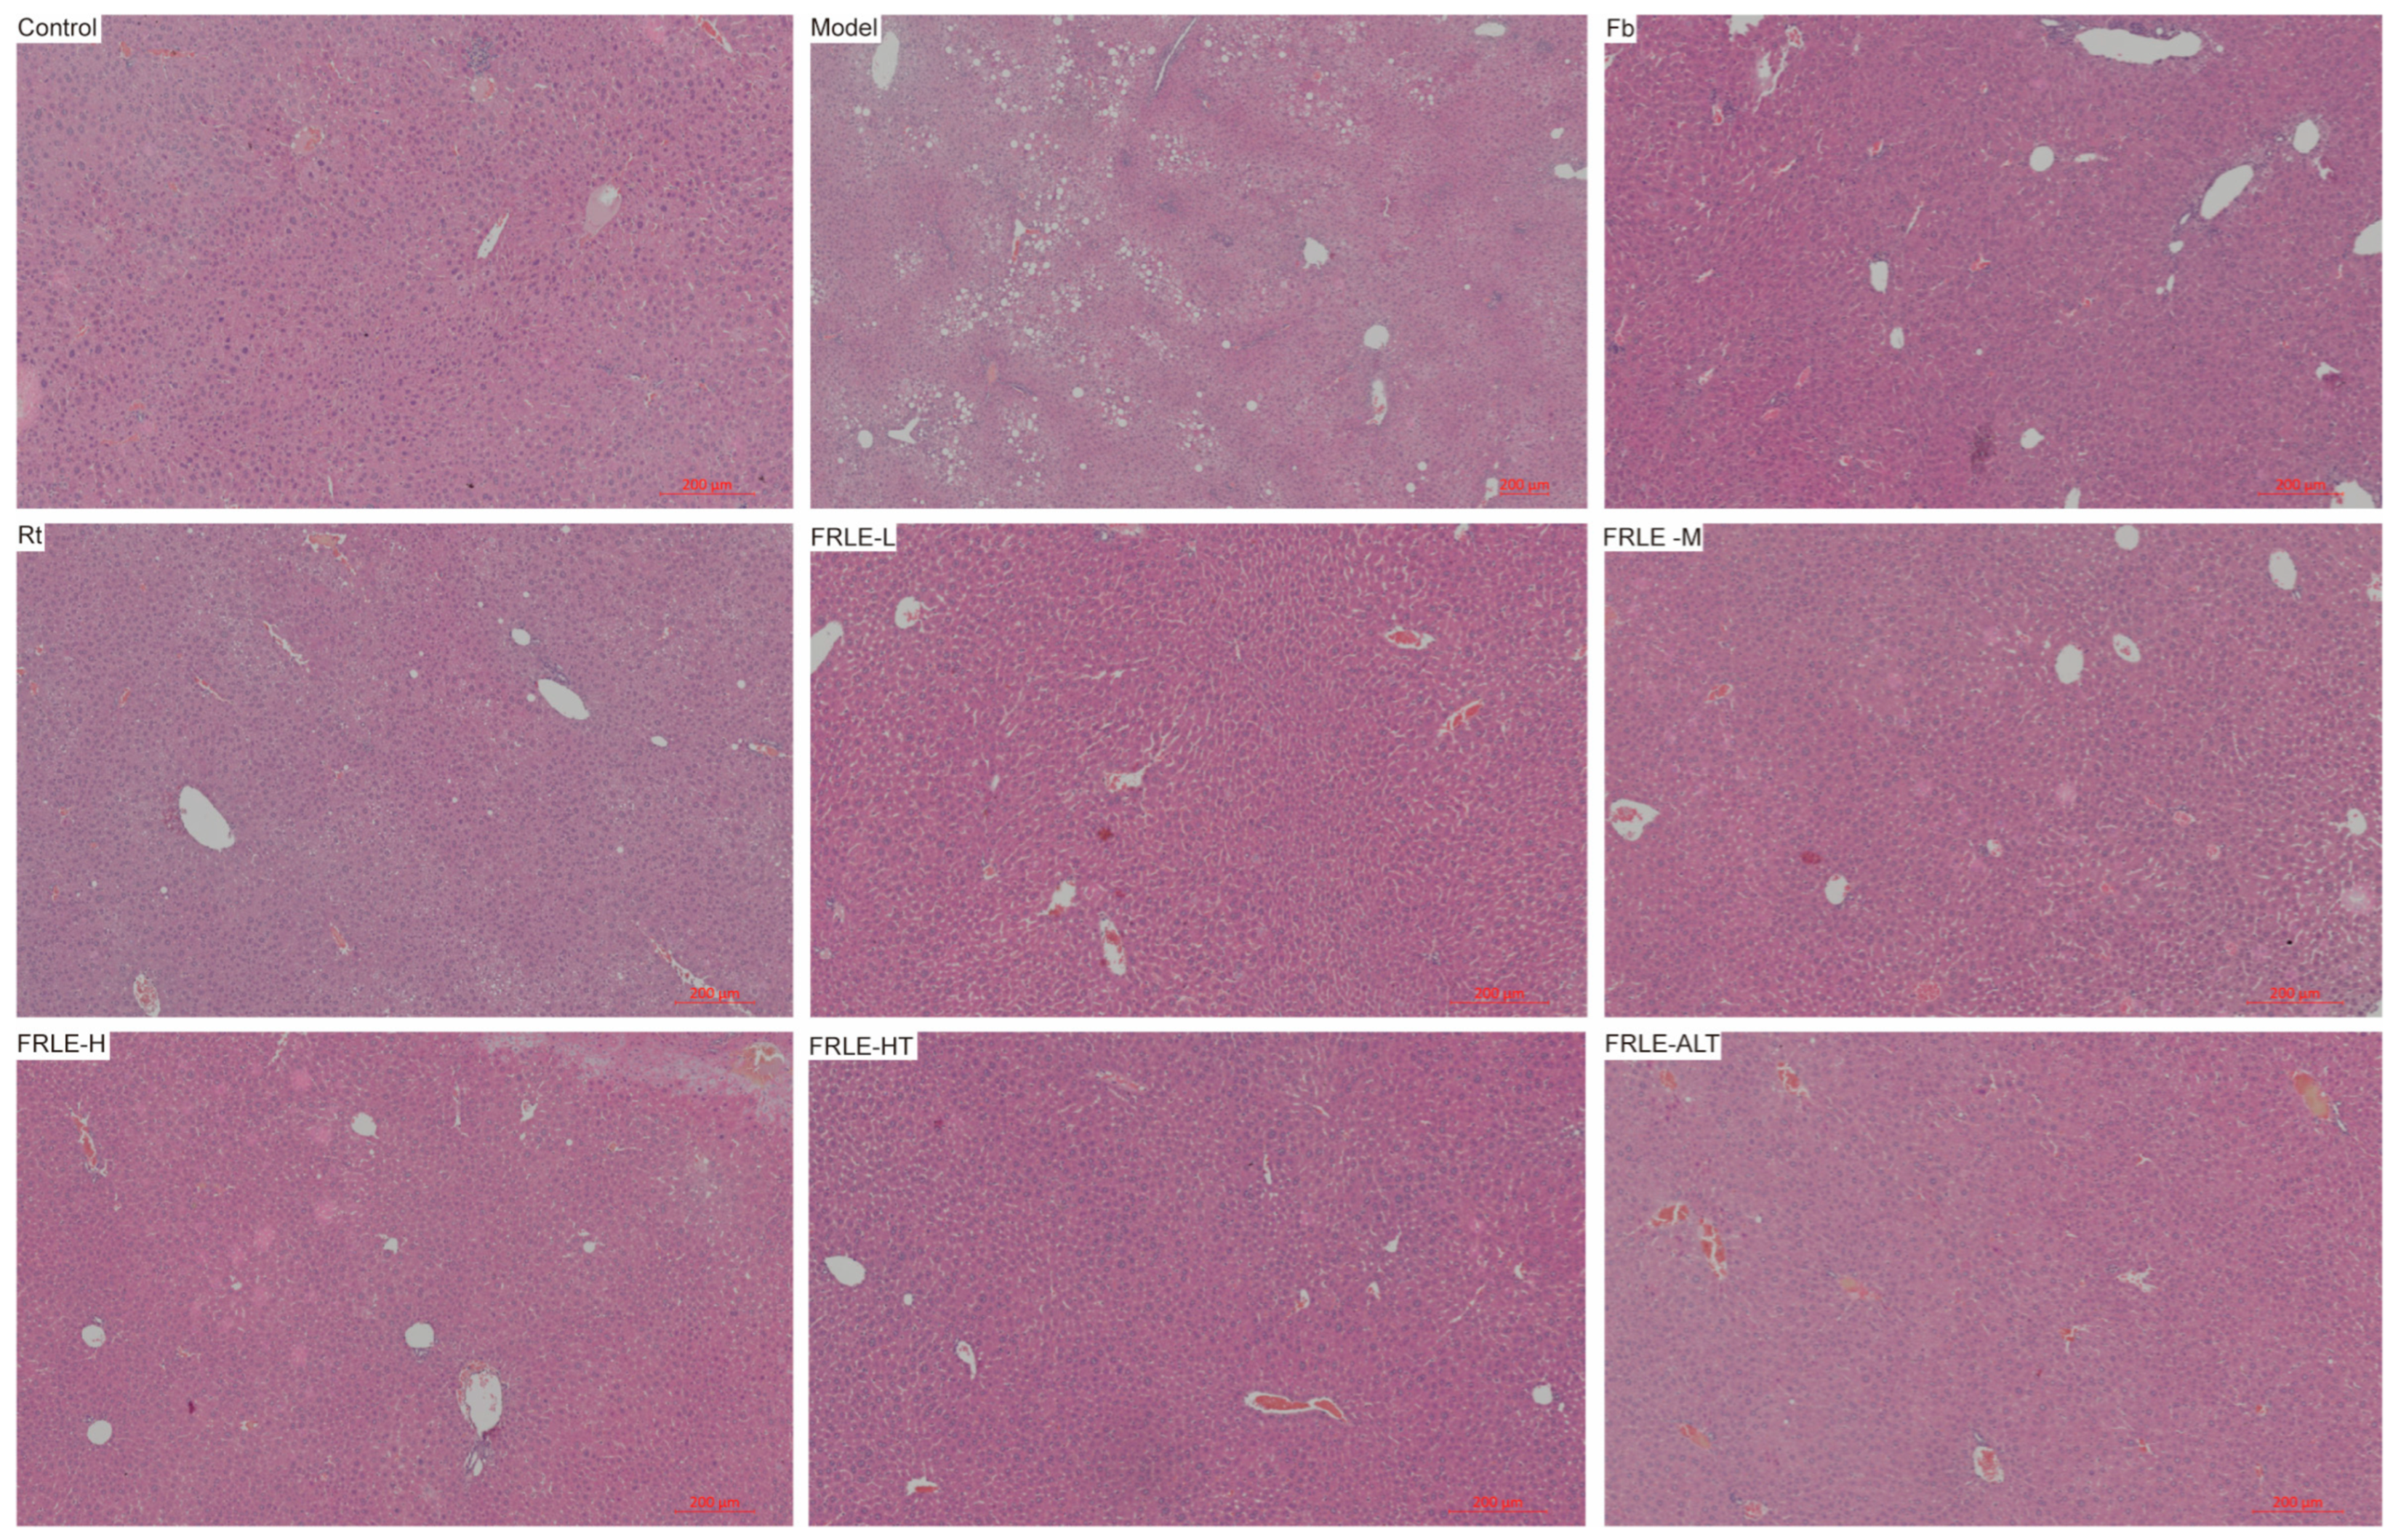
The H&E staining results of liver tissues are presented in Figure 7. In the model group, a large number of large, rounded vacuoles were observed in the field of view compared to the control group, indicating the occurrence of hepatic steatosis. Compared to the model group, the Fb and Rt groups showed a reduction in vacuoles, suggesting an improvement in hepatic steatosis. Similarly, the FRLE-L, FRLE-M, FRLE-H, FRLE-HT, and FRLE-ALT groups all exhibited fewer vacuoles, demonstrating the efficacy of FRLE in alleviating hepatic steatosis.
Figure 7.
H&E staining results of liver. All images were recorded at a magnification of 200×. (Note: All panels represent standard H&E staining. Minor variations in background coloration among image panels are due to light intensity and white balance fluctuations during brightfield microscopy acquisition and do not reflect differences in staining protocols.)
3.5. Safety Evaluation of FRLE
In the acute toxicity study, FRLE was administered via oral gavage at a concentration of 830 mg/mL (0.2 mL/10 g body weight). The treatment was repeated three times at 4 h intervals. The clinical signs, dietary intake, and mortality of the mice were monitored for 14 consecutive days. No mortality was observed throughout the observation period. On the first day, a slight decrease in activity and dietary intake was noted, which was attributed to the stress of repeated gavaging and the large volume administered, leading to temporary satiety. However, from days 2 to 3, the mice exhibited a gradual recovery in activity, including increased locomotor behavior within the cages and normalized food and water consumption. From day 4 to 14, the mice fully regained their baseline physiological state, exhibiting active climbing and normal metabolic frequency. These results indicate that FRLE possesses no significant acute toxicity (Table 5).
Table 5.
The number of mouse deaths, vitality, bite and sup over a 14-day period (n = 20).
The sub-chronic toxicity study was conducted using the same dosage, with daily oral gavage for 30 consecutive days. Body weights were recorded weekly to adjust the dosage volume, and parameters including mortality, clinical signs, food/water intake, and fur condition were monitored daily. Throughout the 30-day cycle, all mice survived healthily, except for two accidental deaths attributed to technical errors during the gavage procedure rather than drug toxicity. Activity levels and dietary intake returned to normal within 4 h post-administration each day. Furthermore, no abnormalities in fur color (e.g., yellowing or dullness) were observed during the study. These findings suggest that FRLE exhibits no significant cumulative toxicity under the tested conditions.
3.6. Identification of Absorbed Constituents and Their Metabolites in Rat Plasma
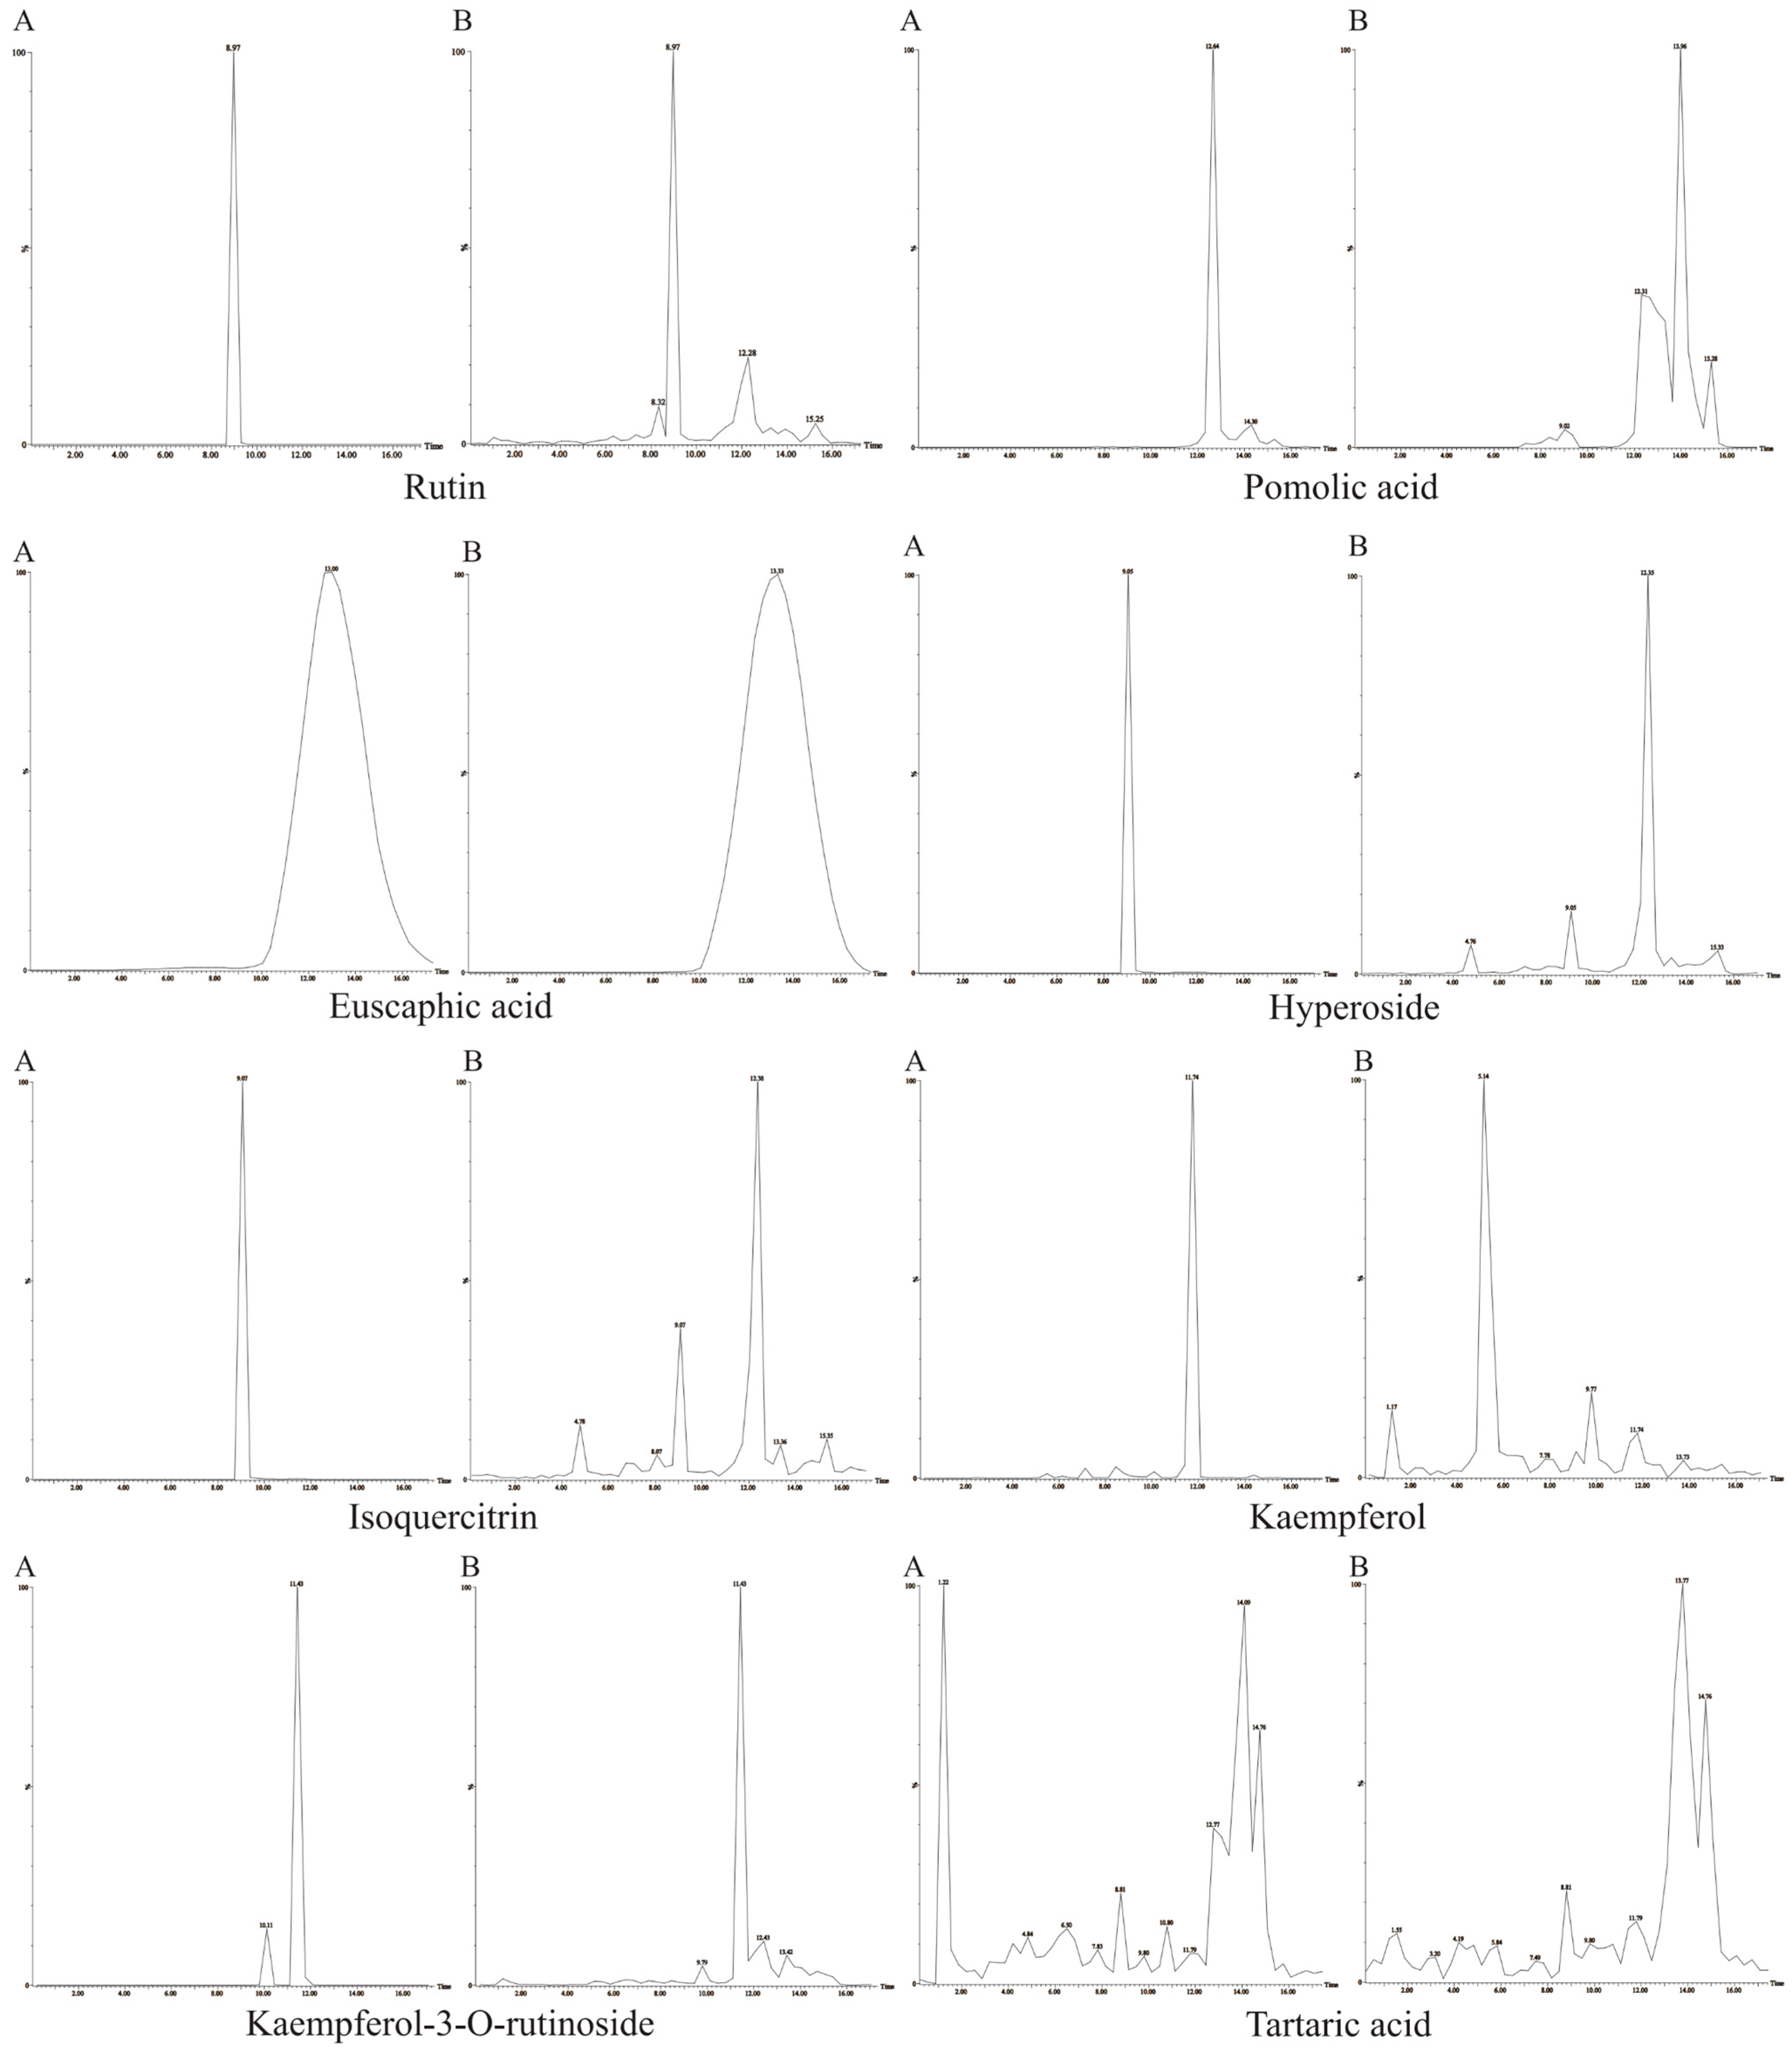
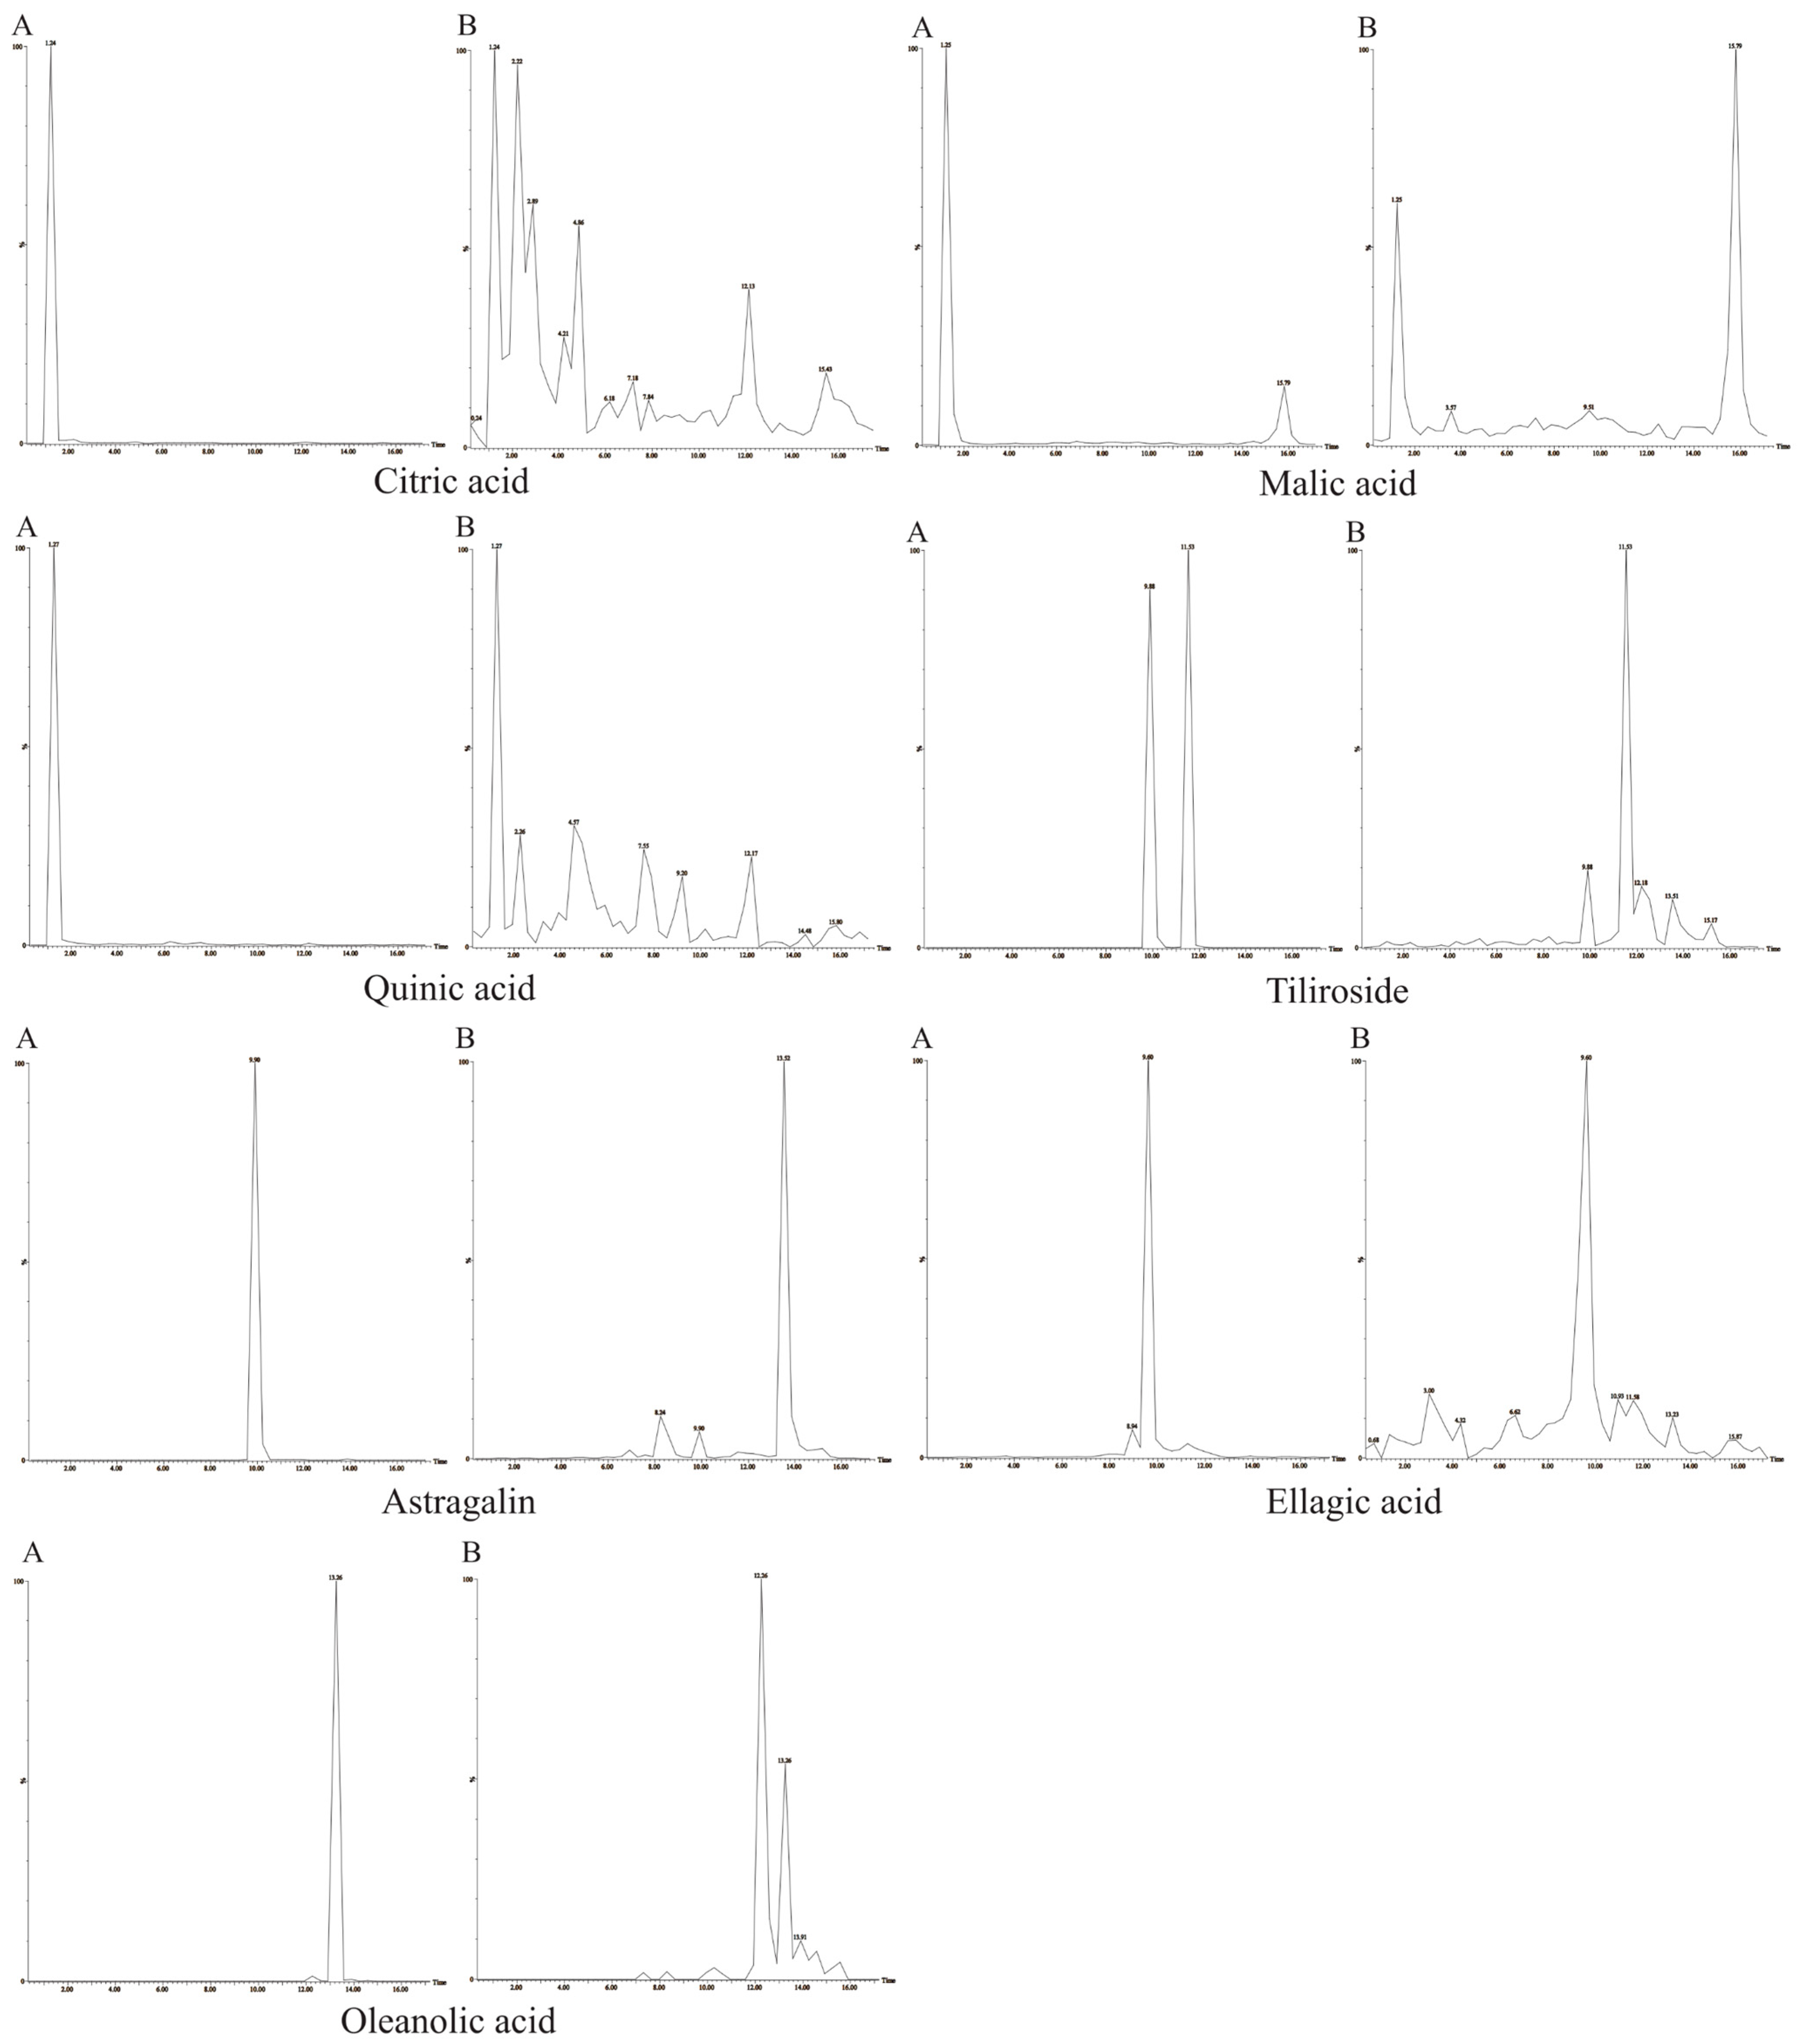
By comparing the MS profiles of drug-containing plasma with blank plasma and reference standards, 15 prototype constituents were identified as absorbed components: rutin, pomolic acid, euscaphic acid, hyperoside, isoquercitrin, kaempferol, kaempferol-3-O-rutinoside, tartaric acid, citric acid, malic acid, quinic acid, tiliroside, astragalin, ellagic acid, and oleanolic acid (Appendix B).
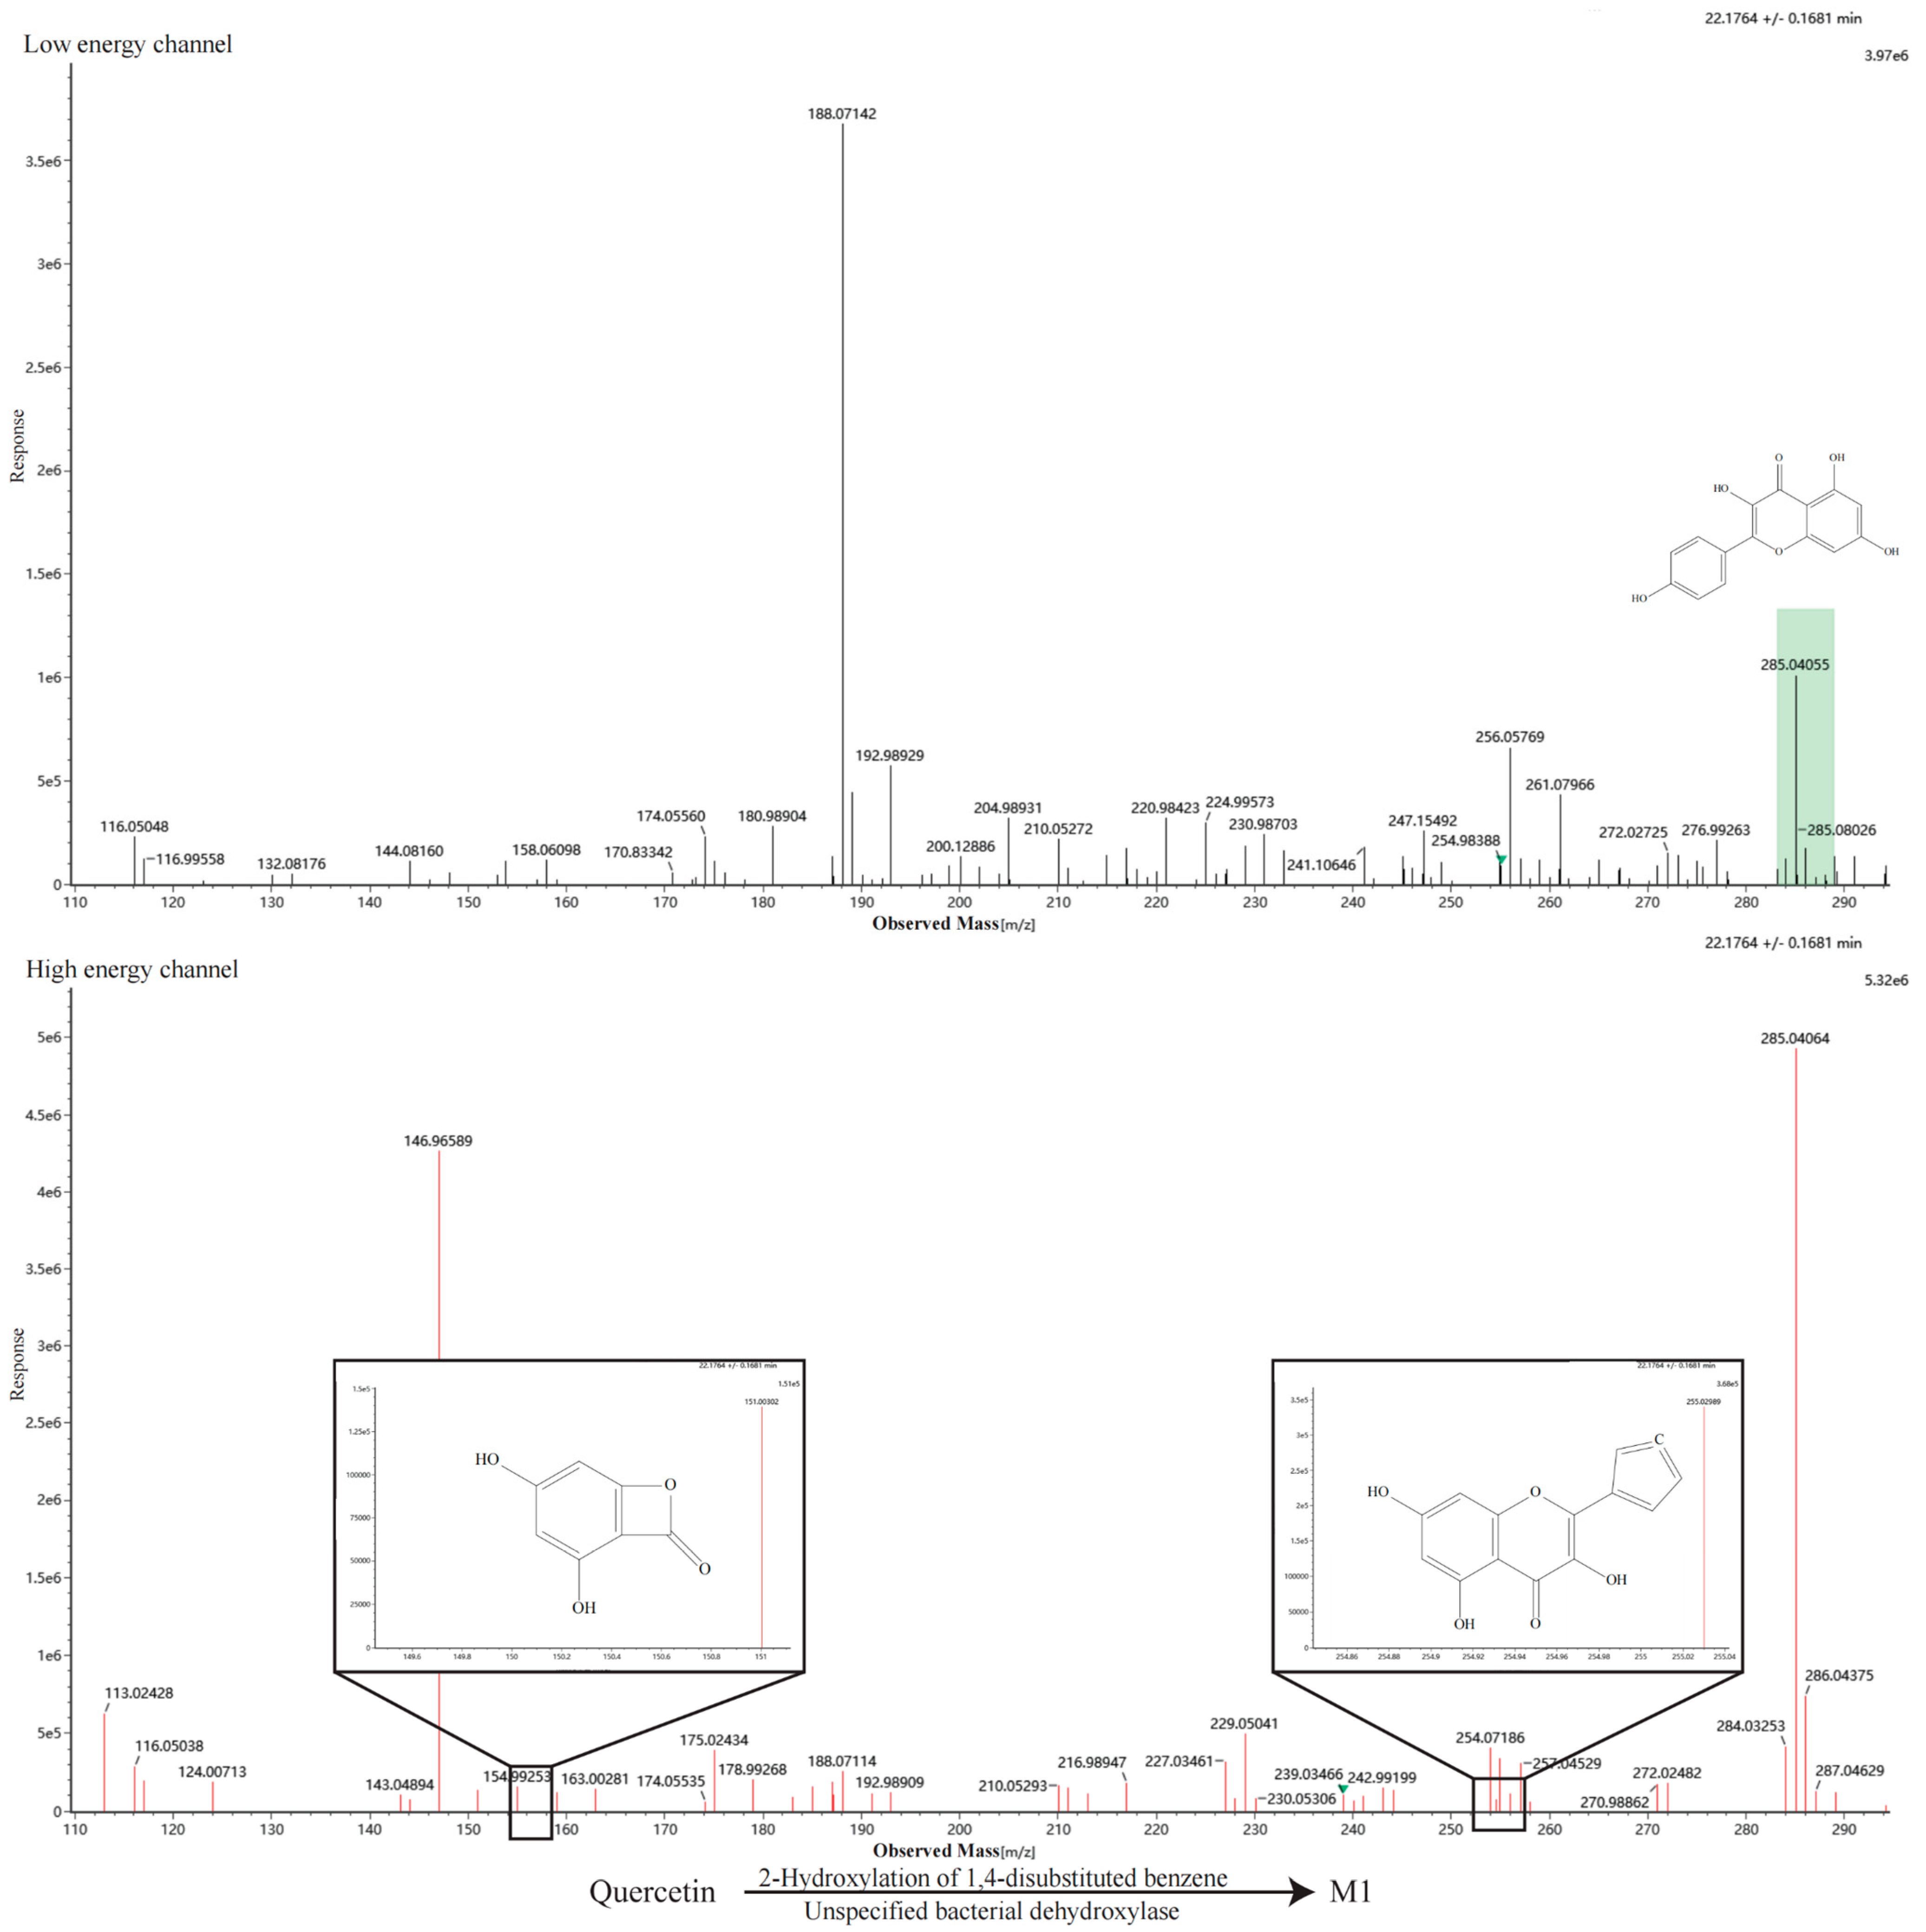
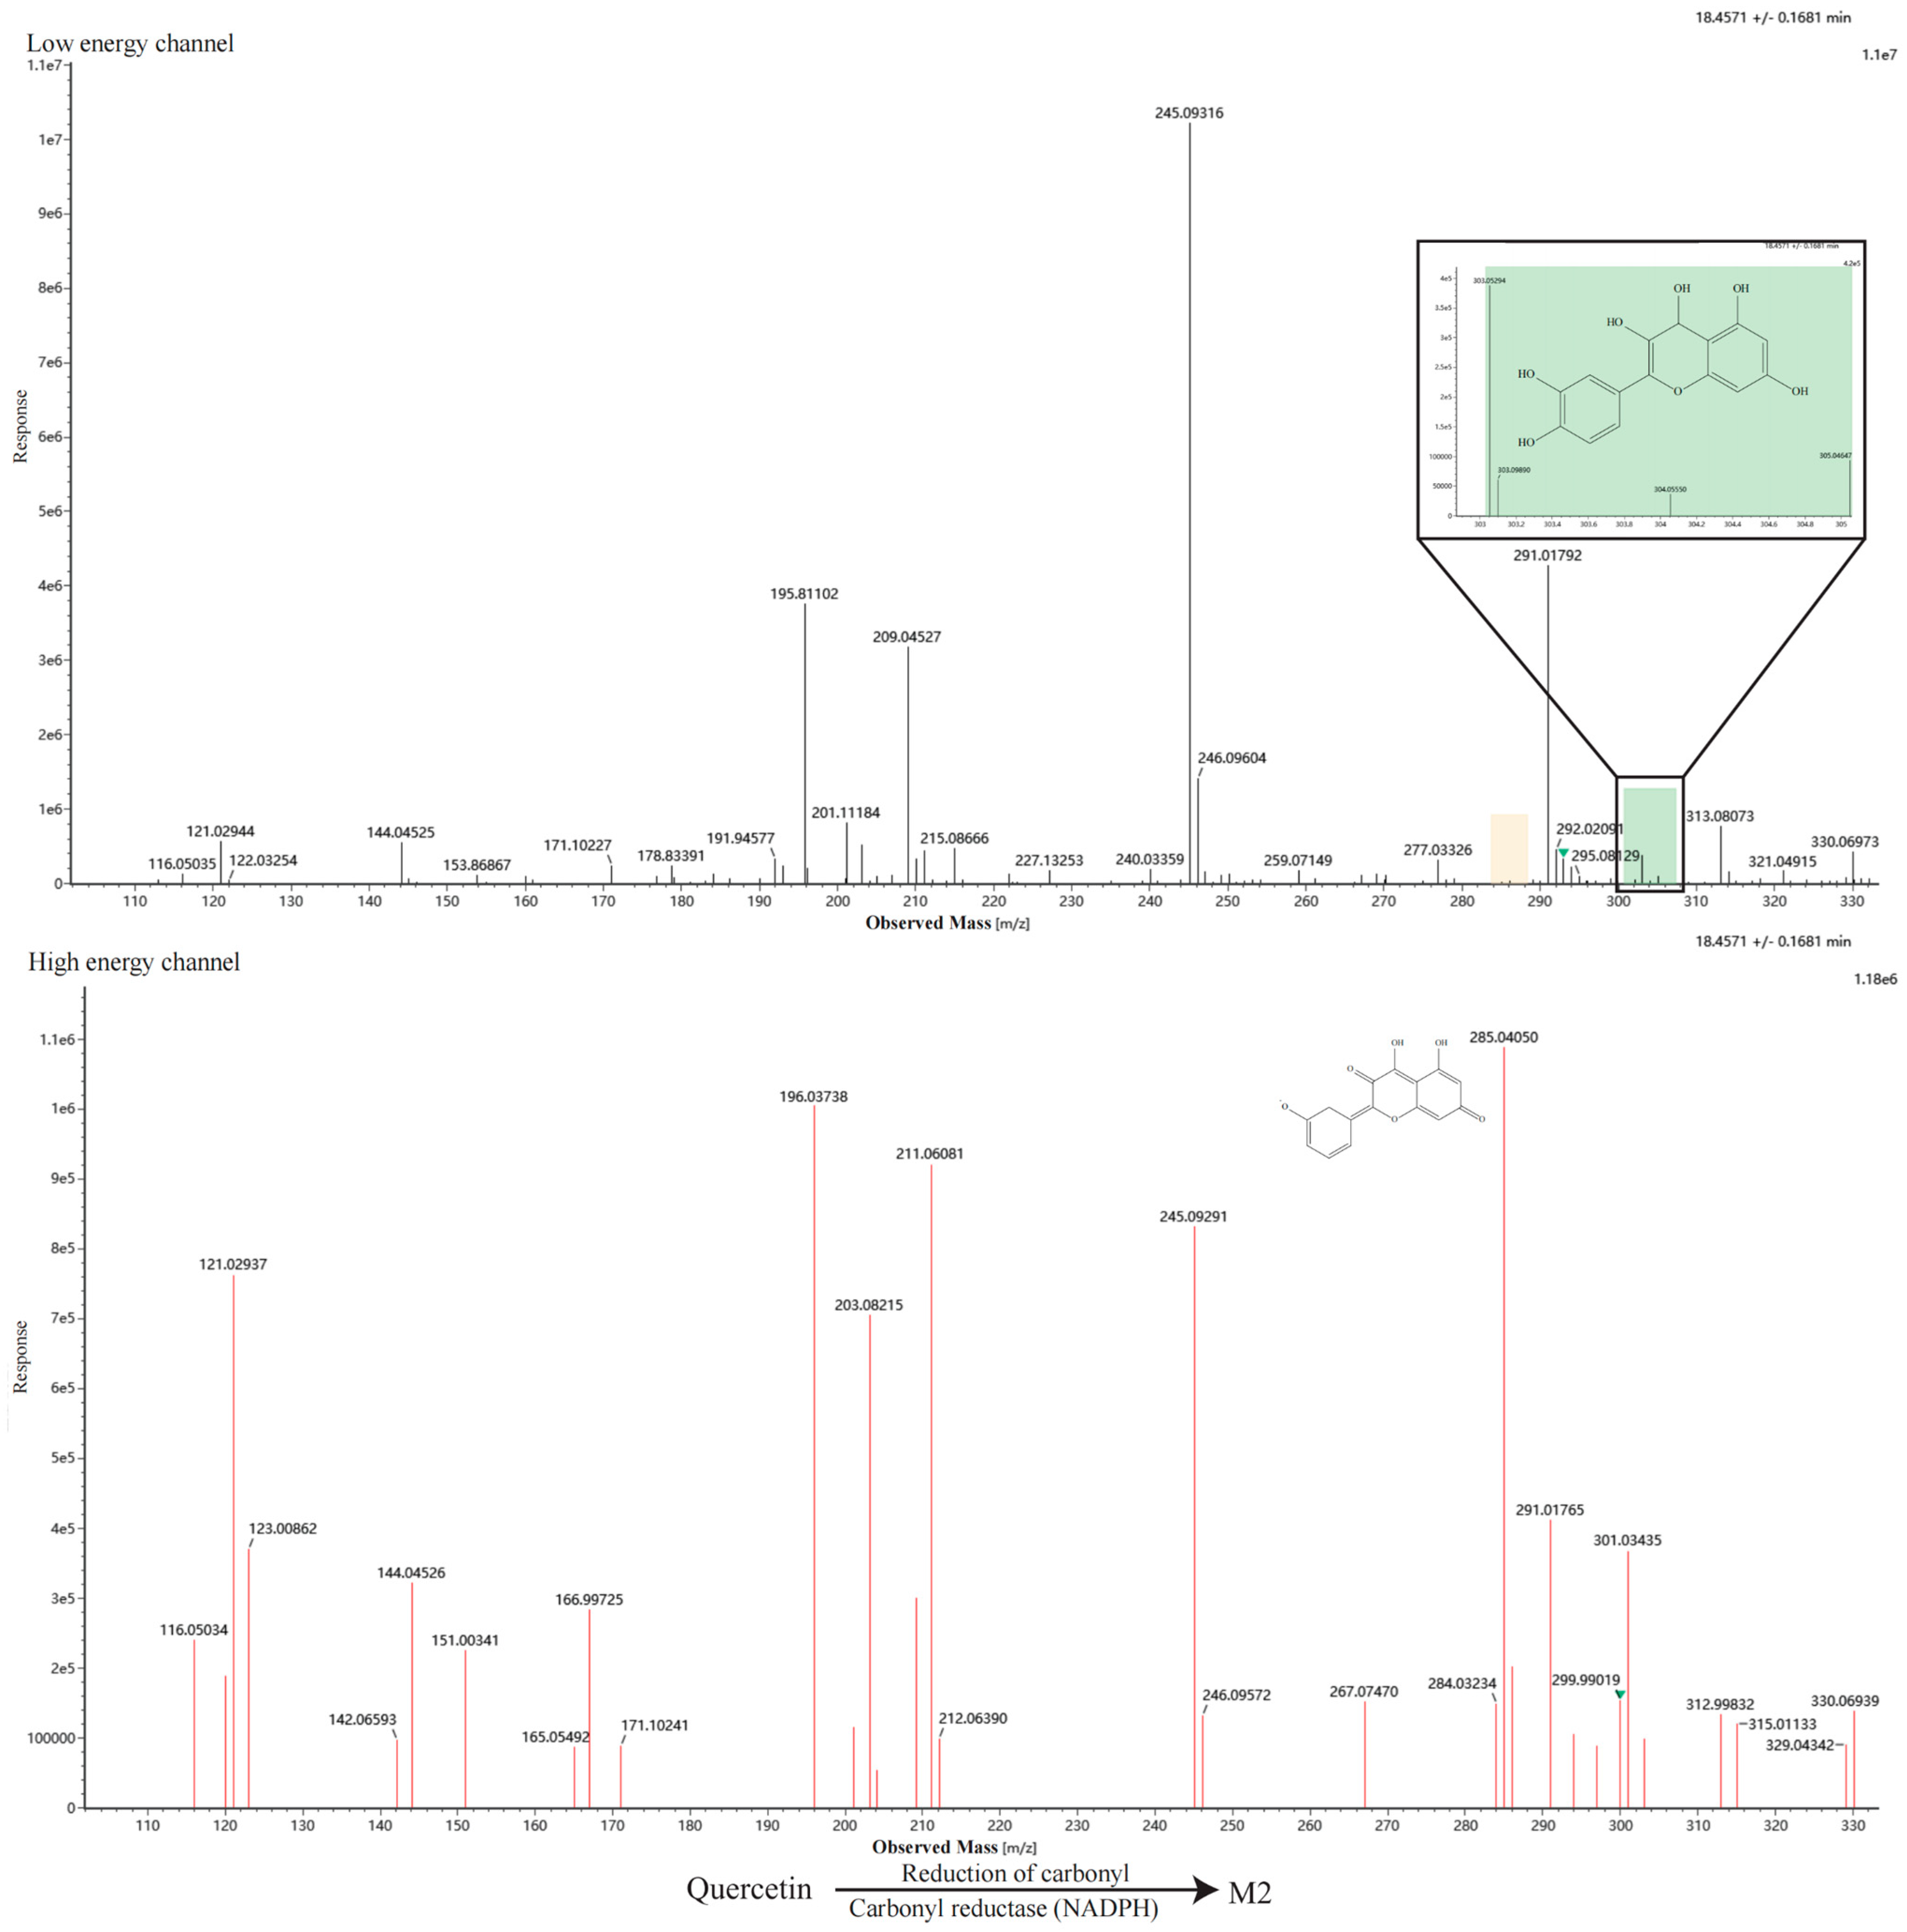
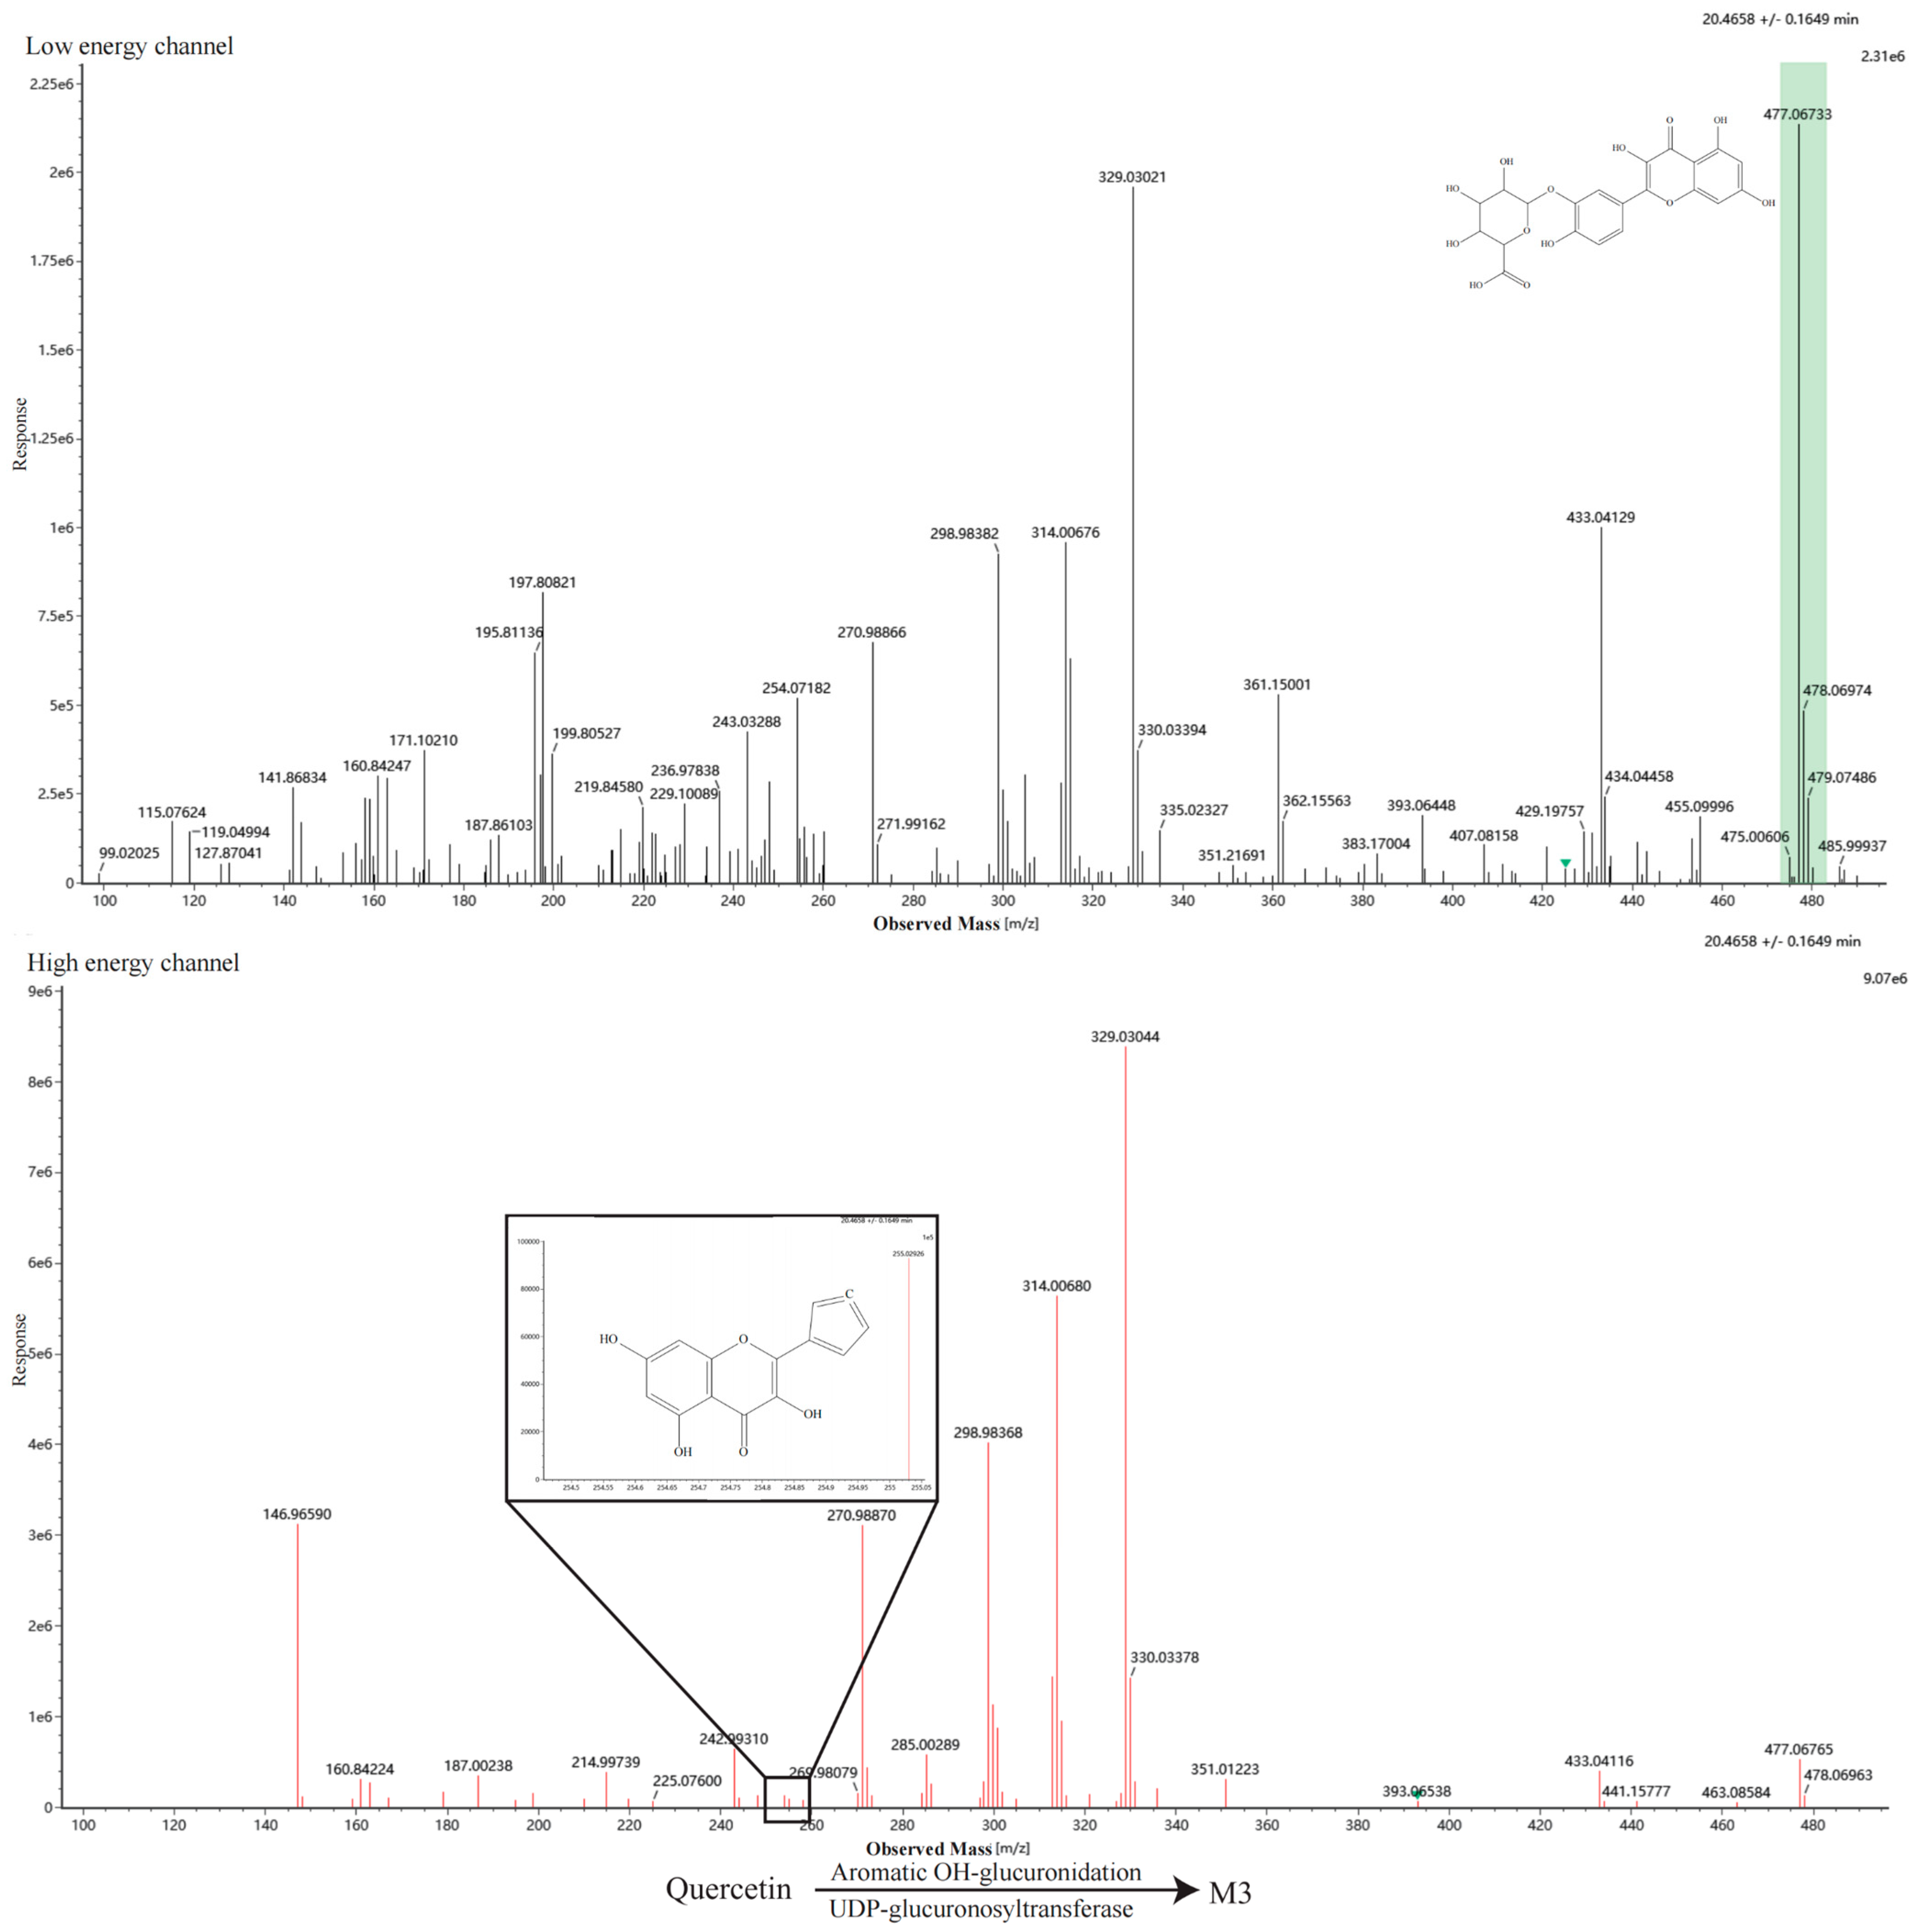
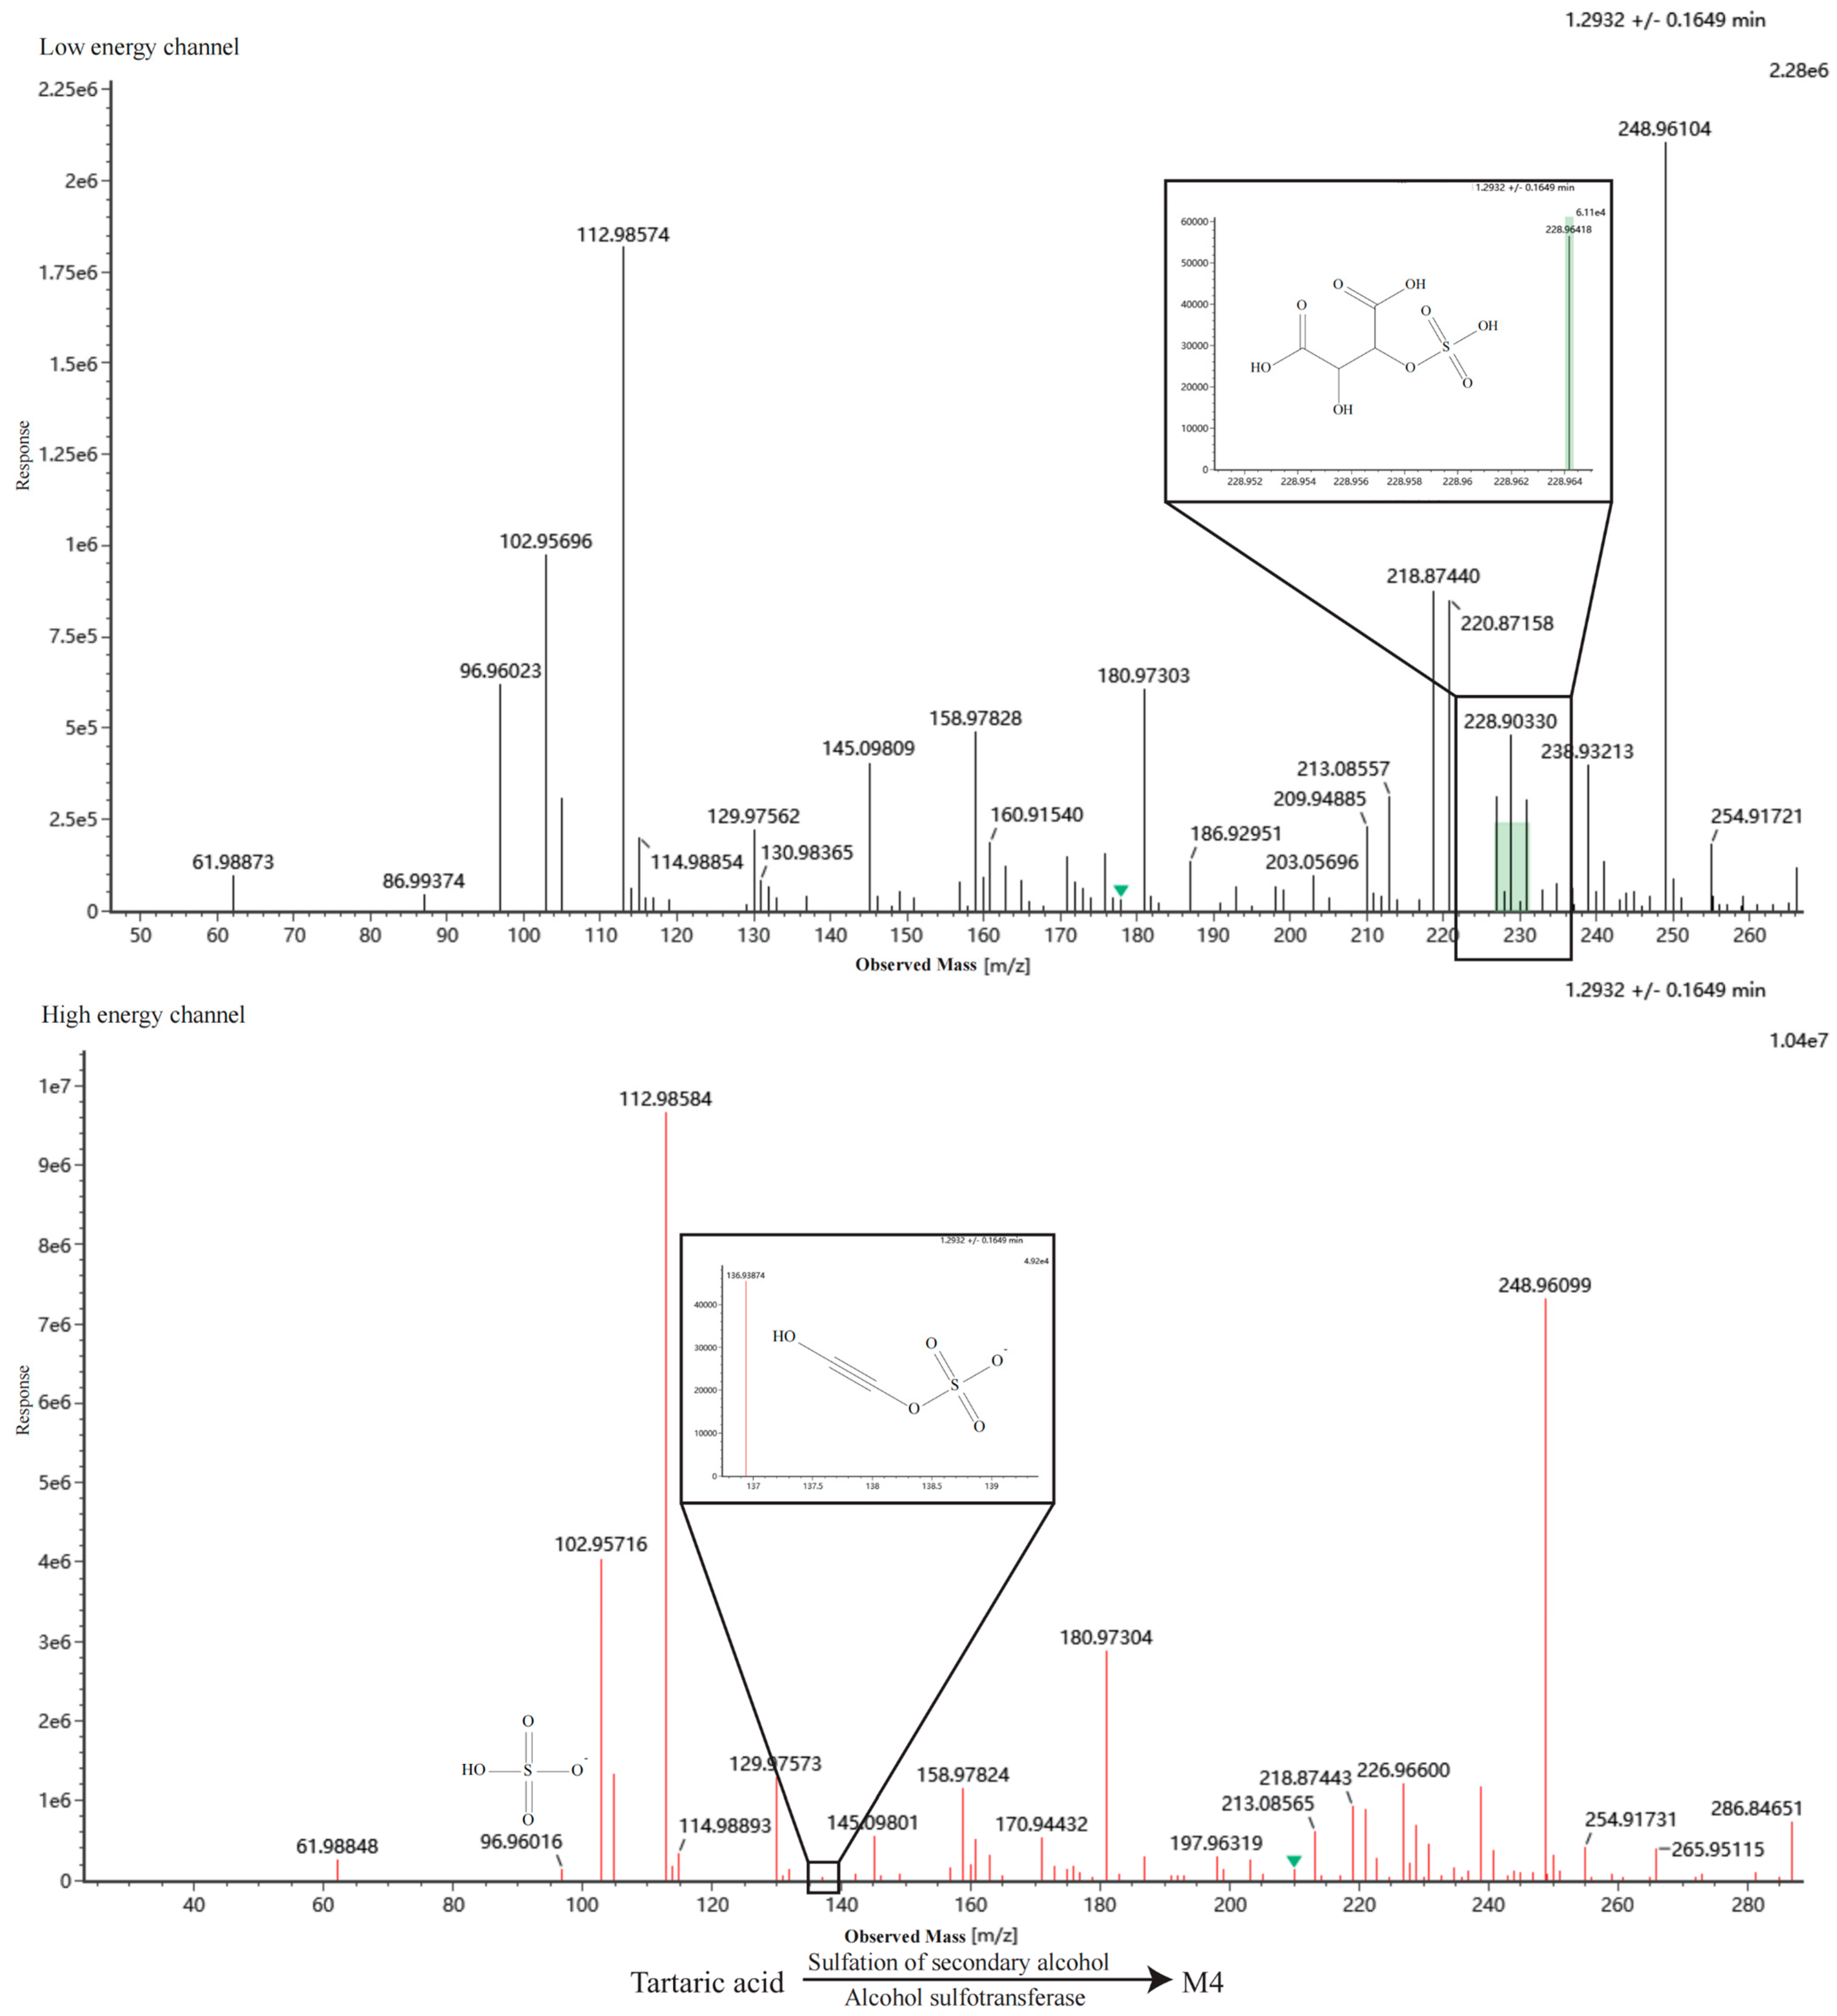
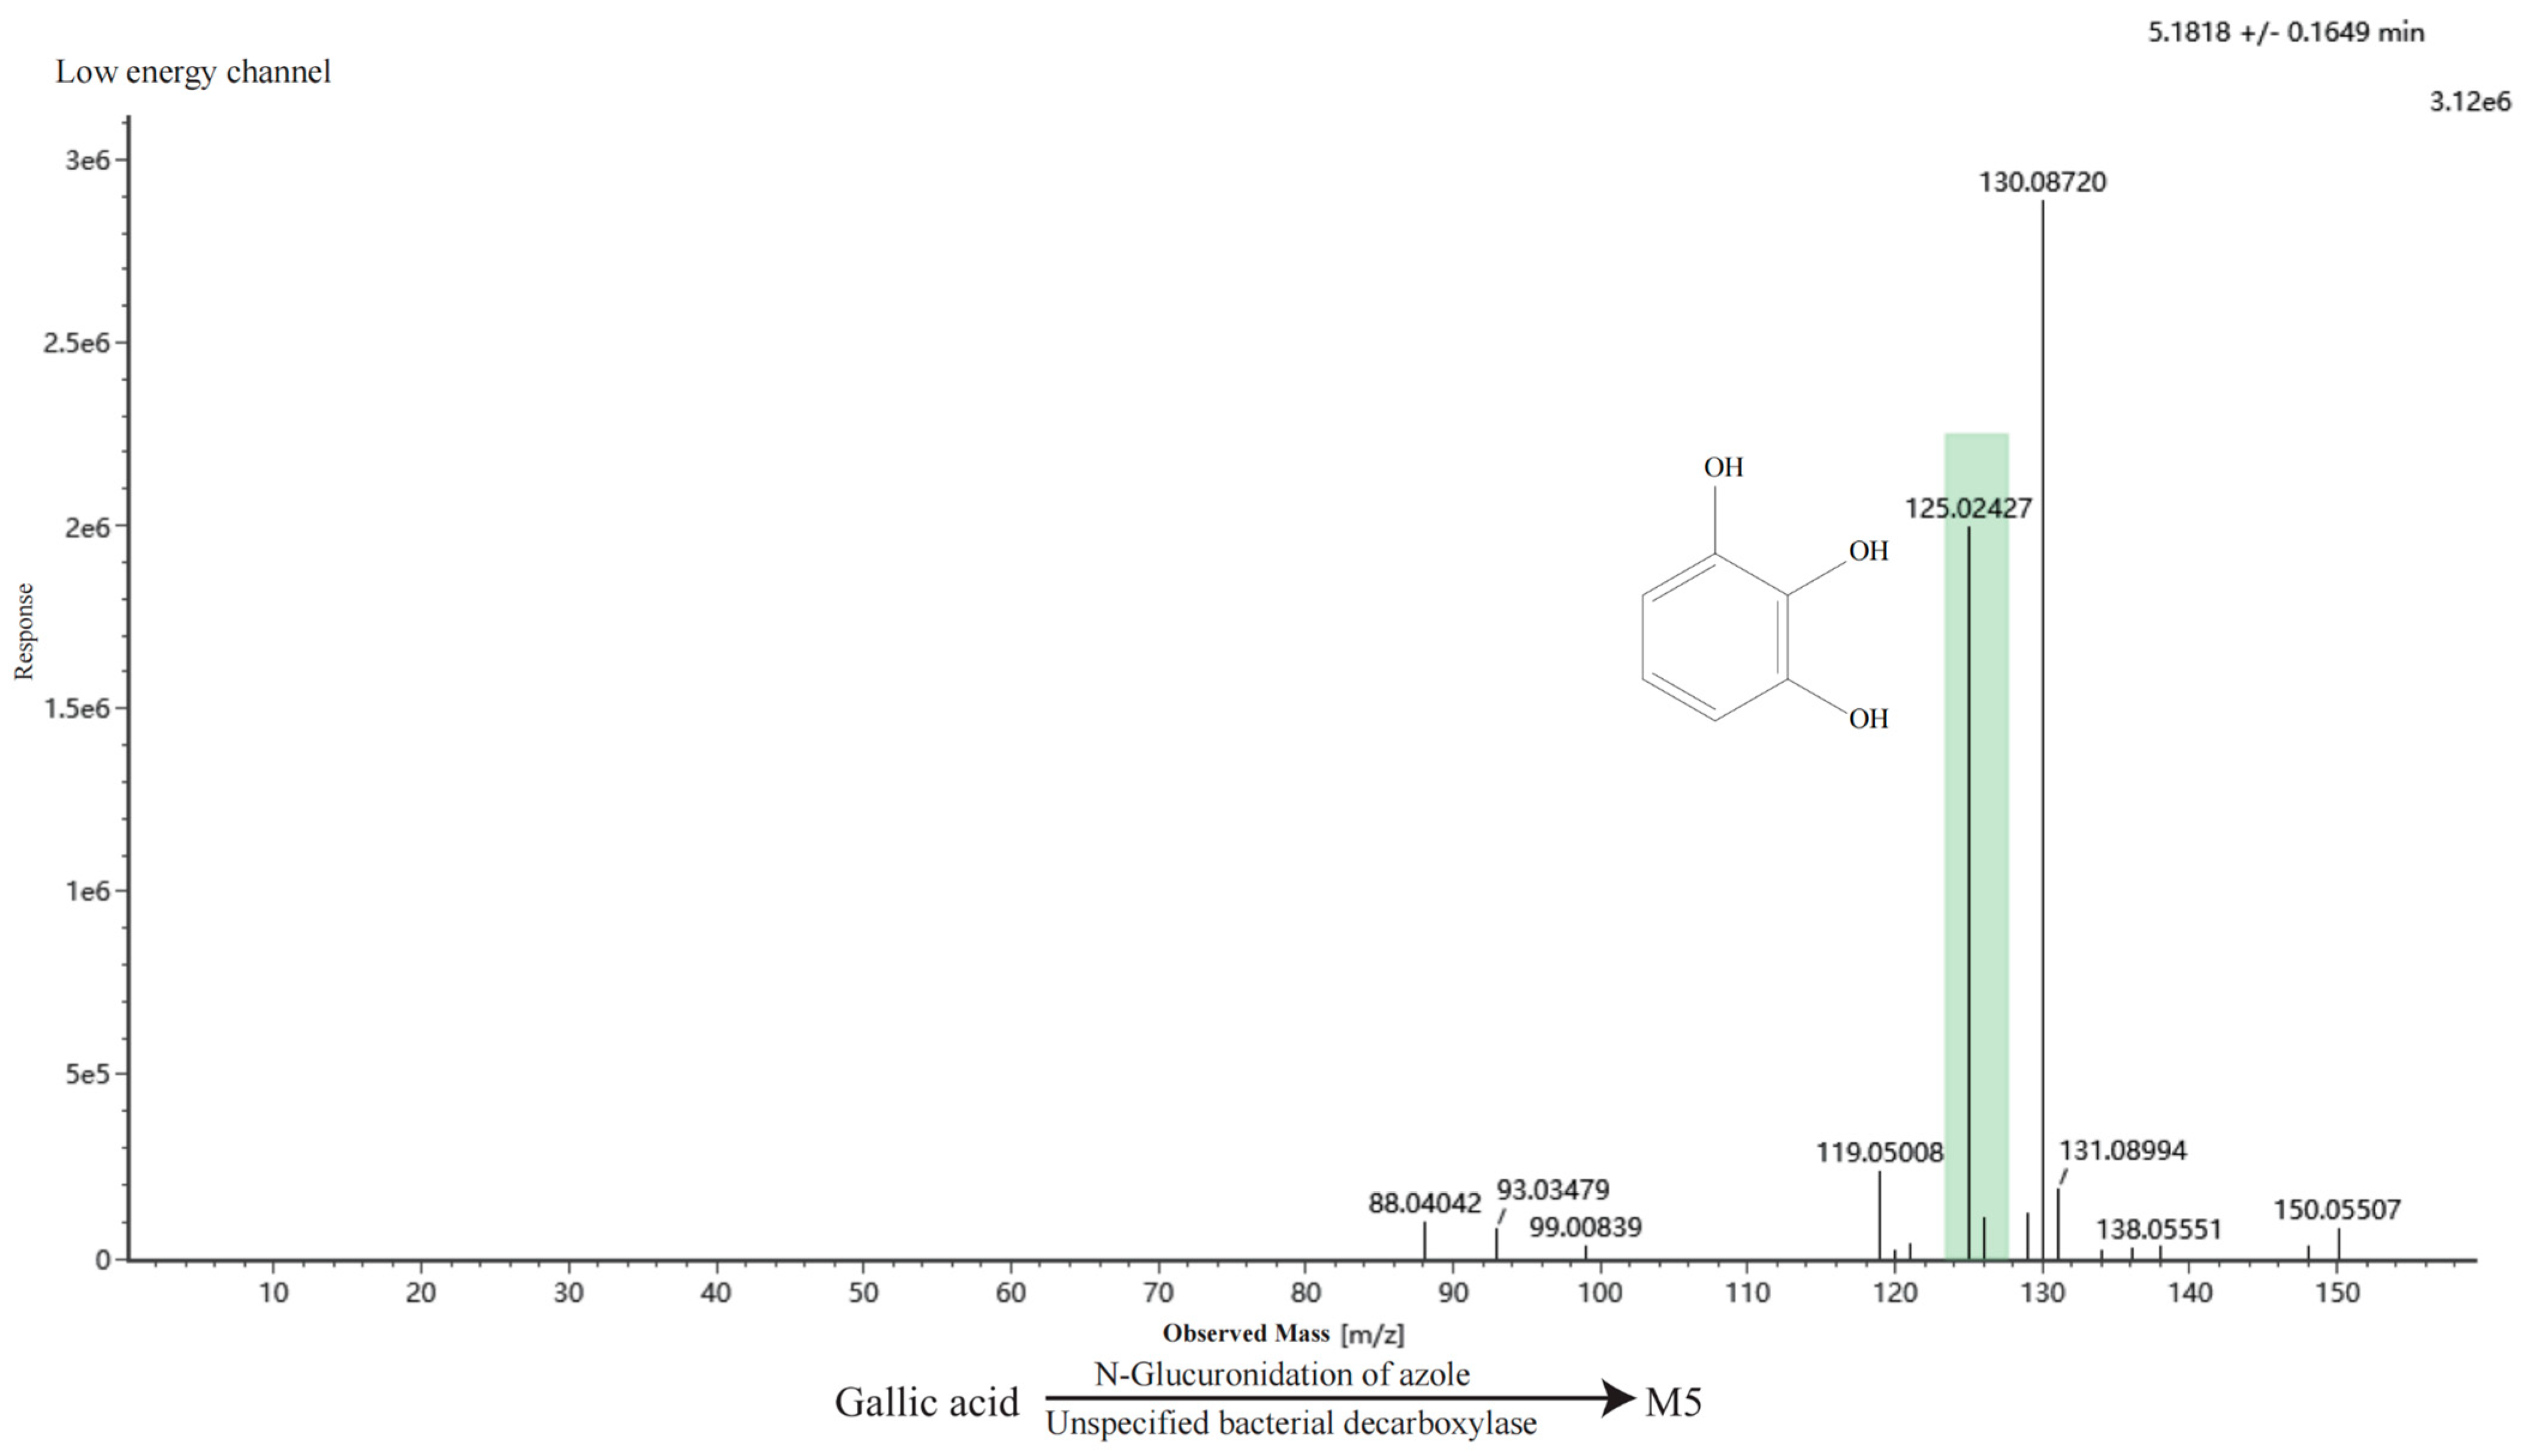
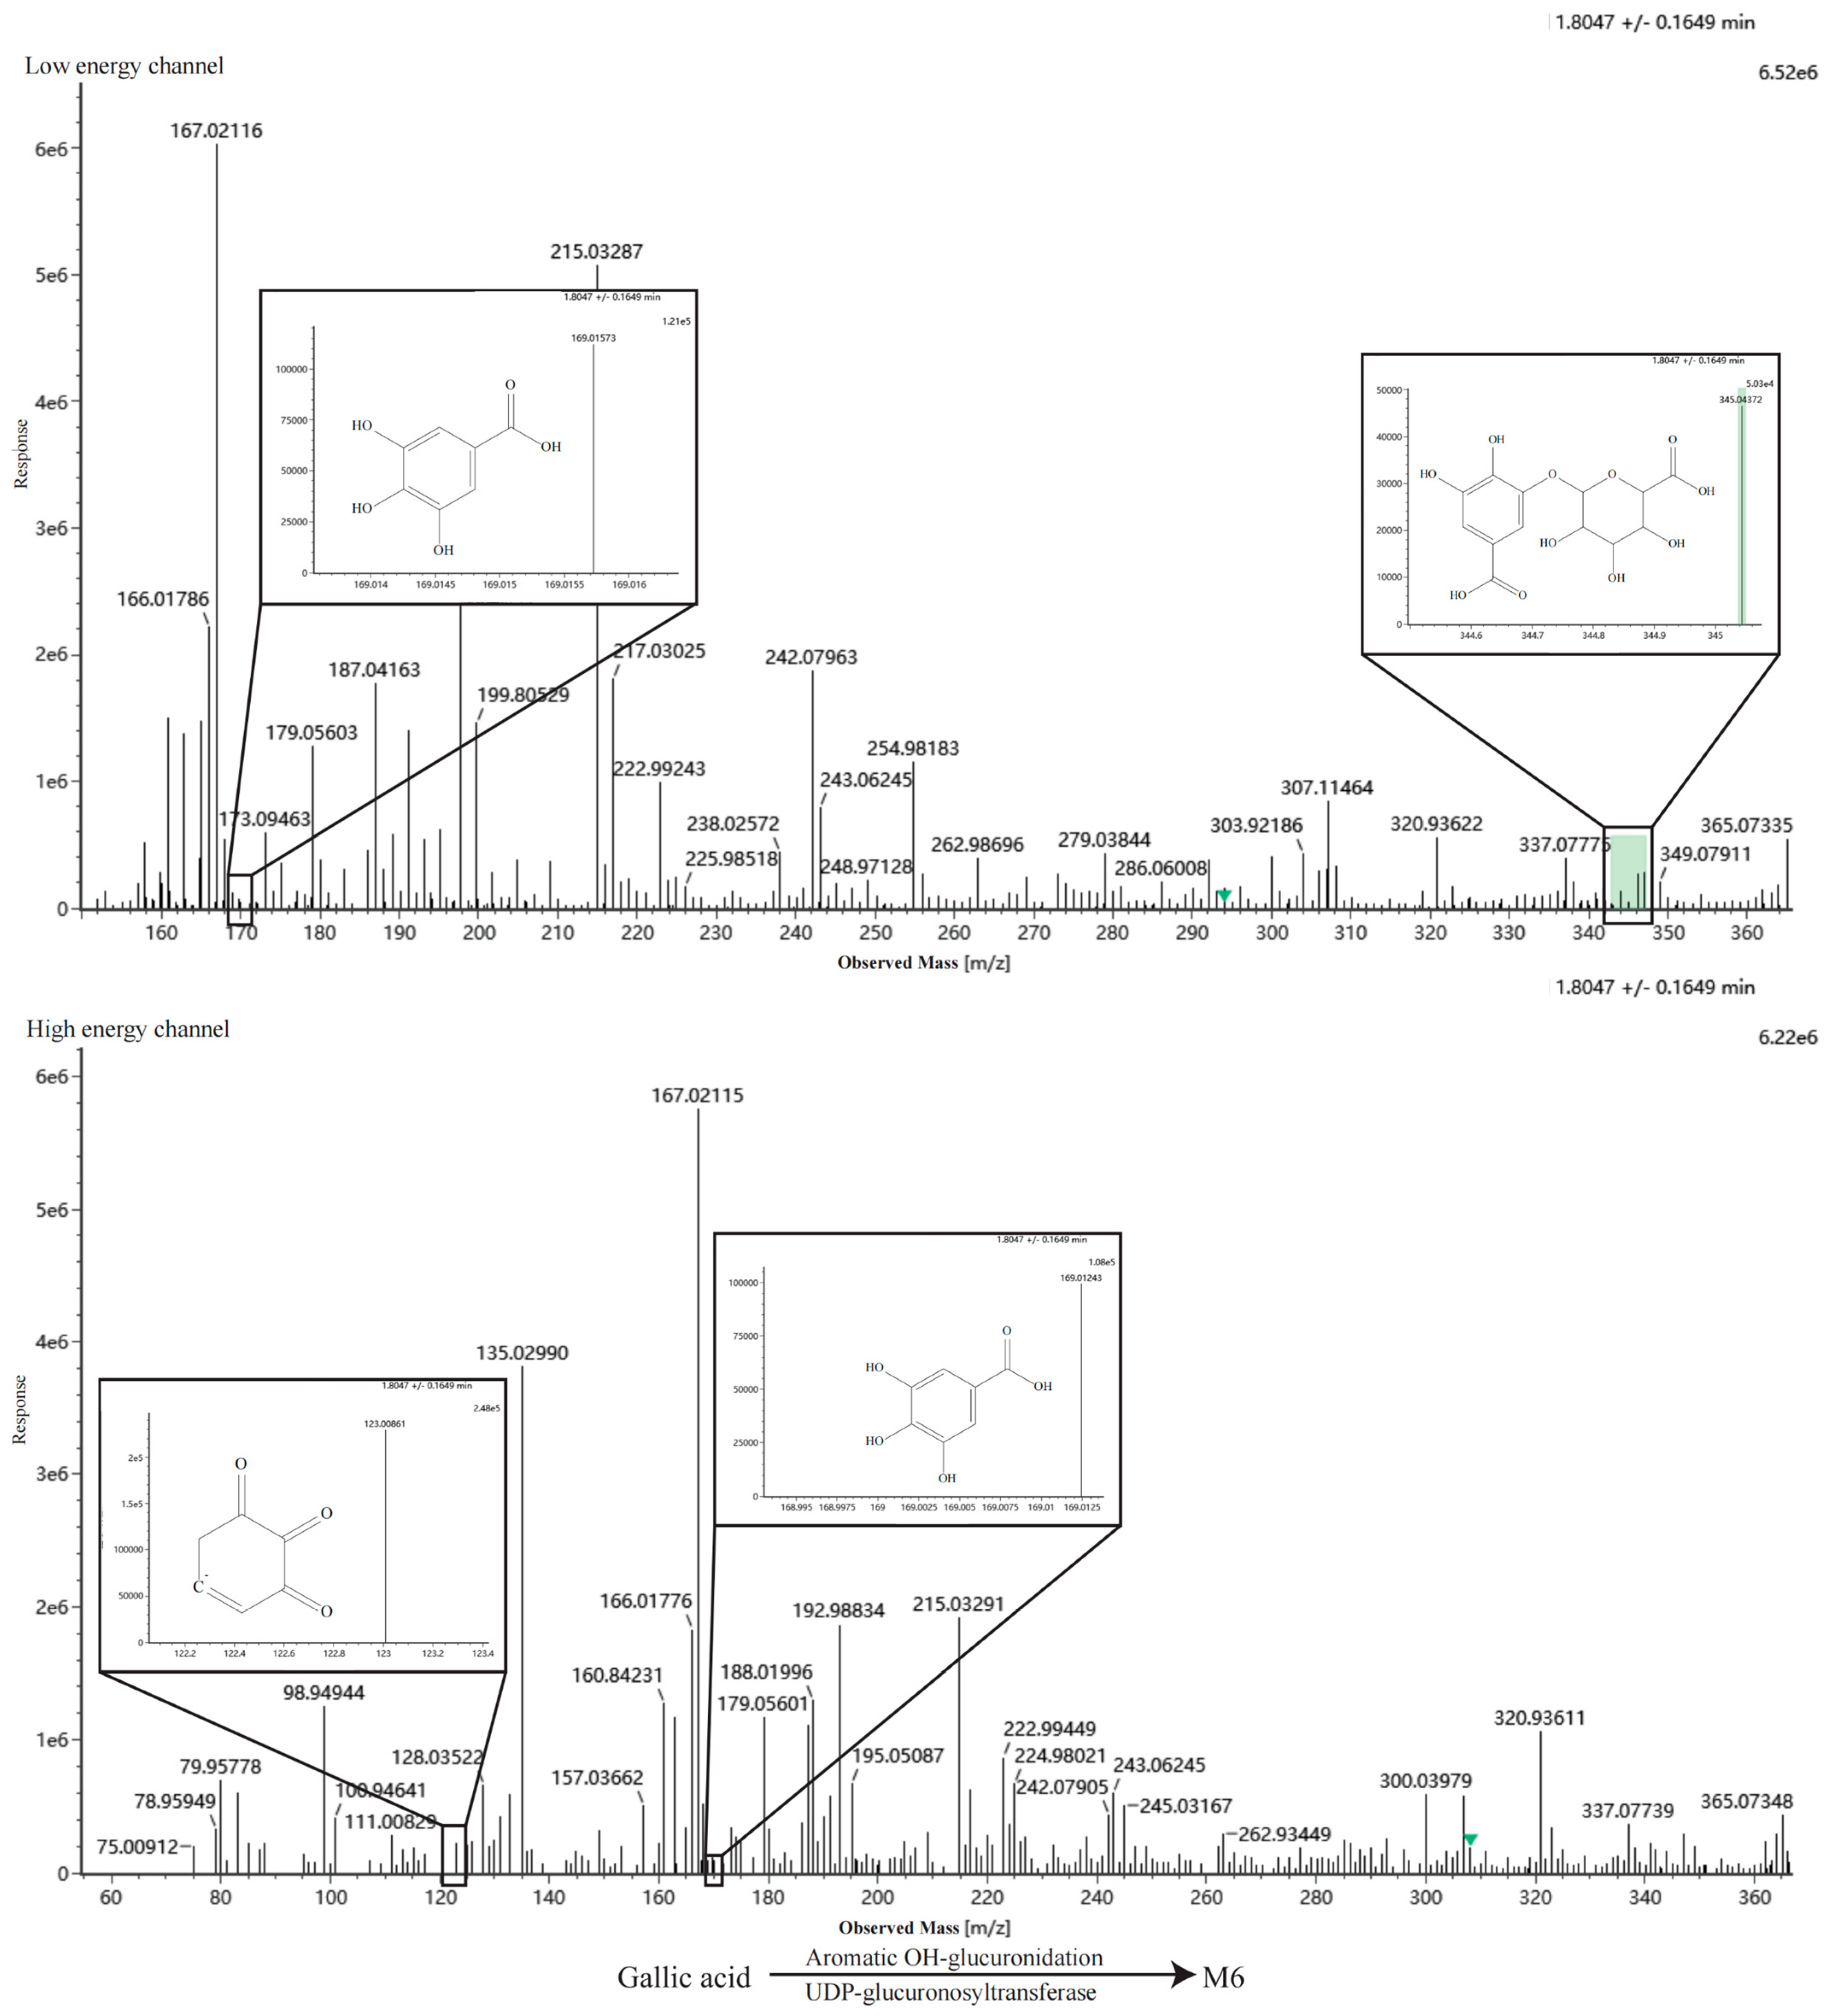
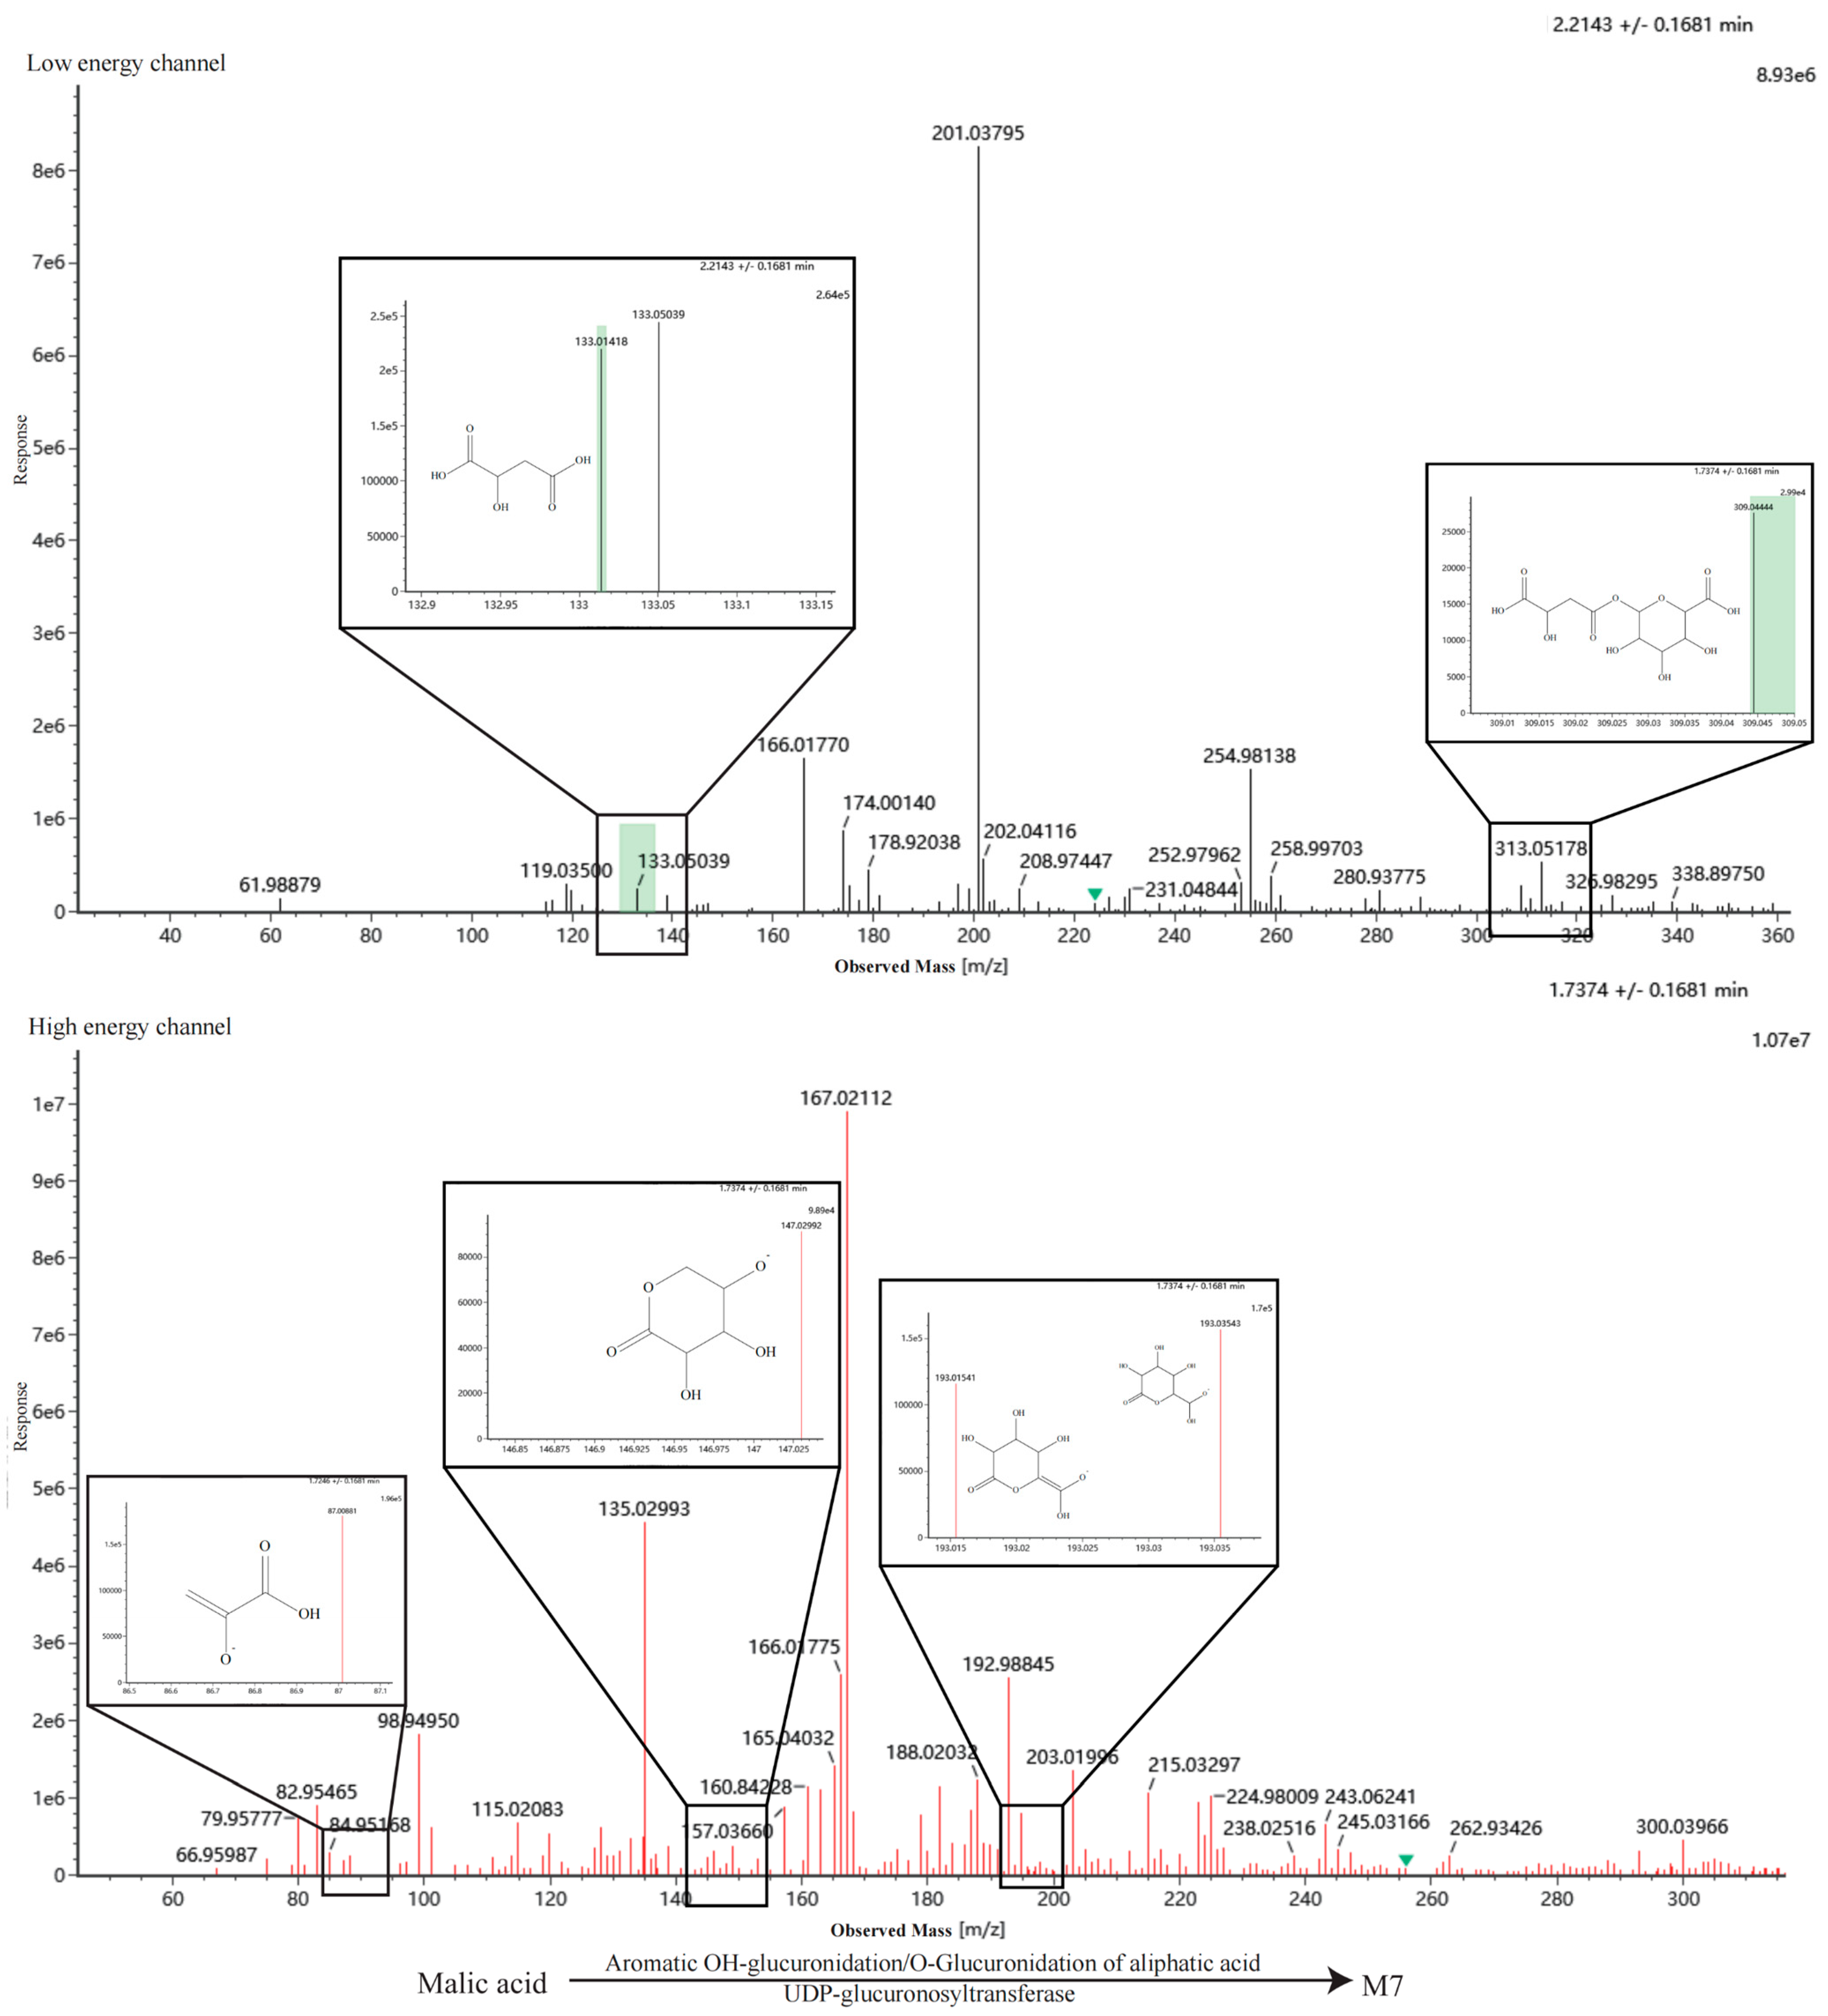
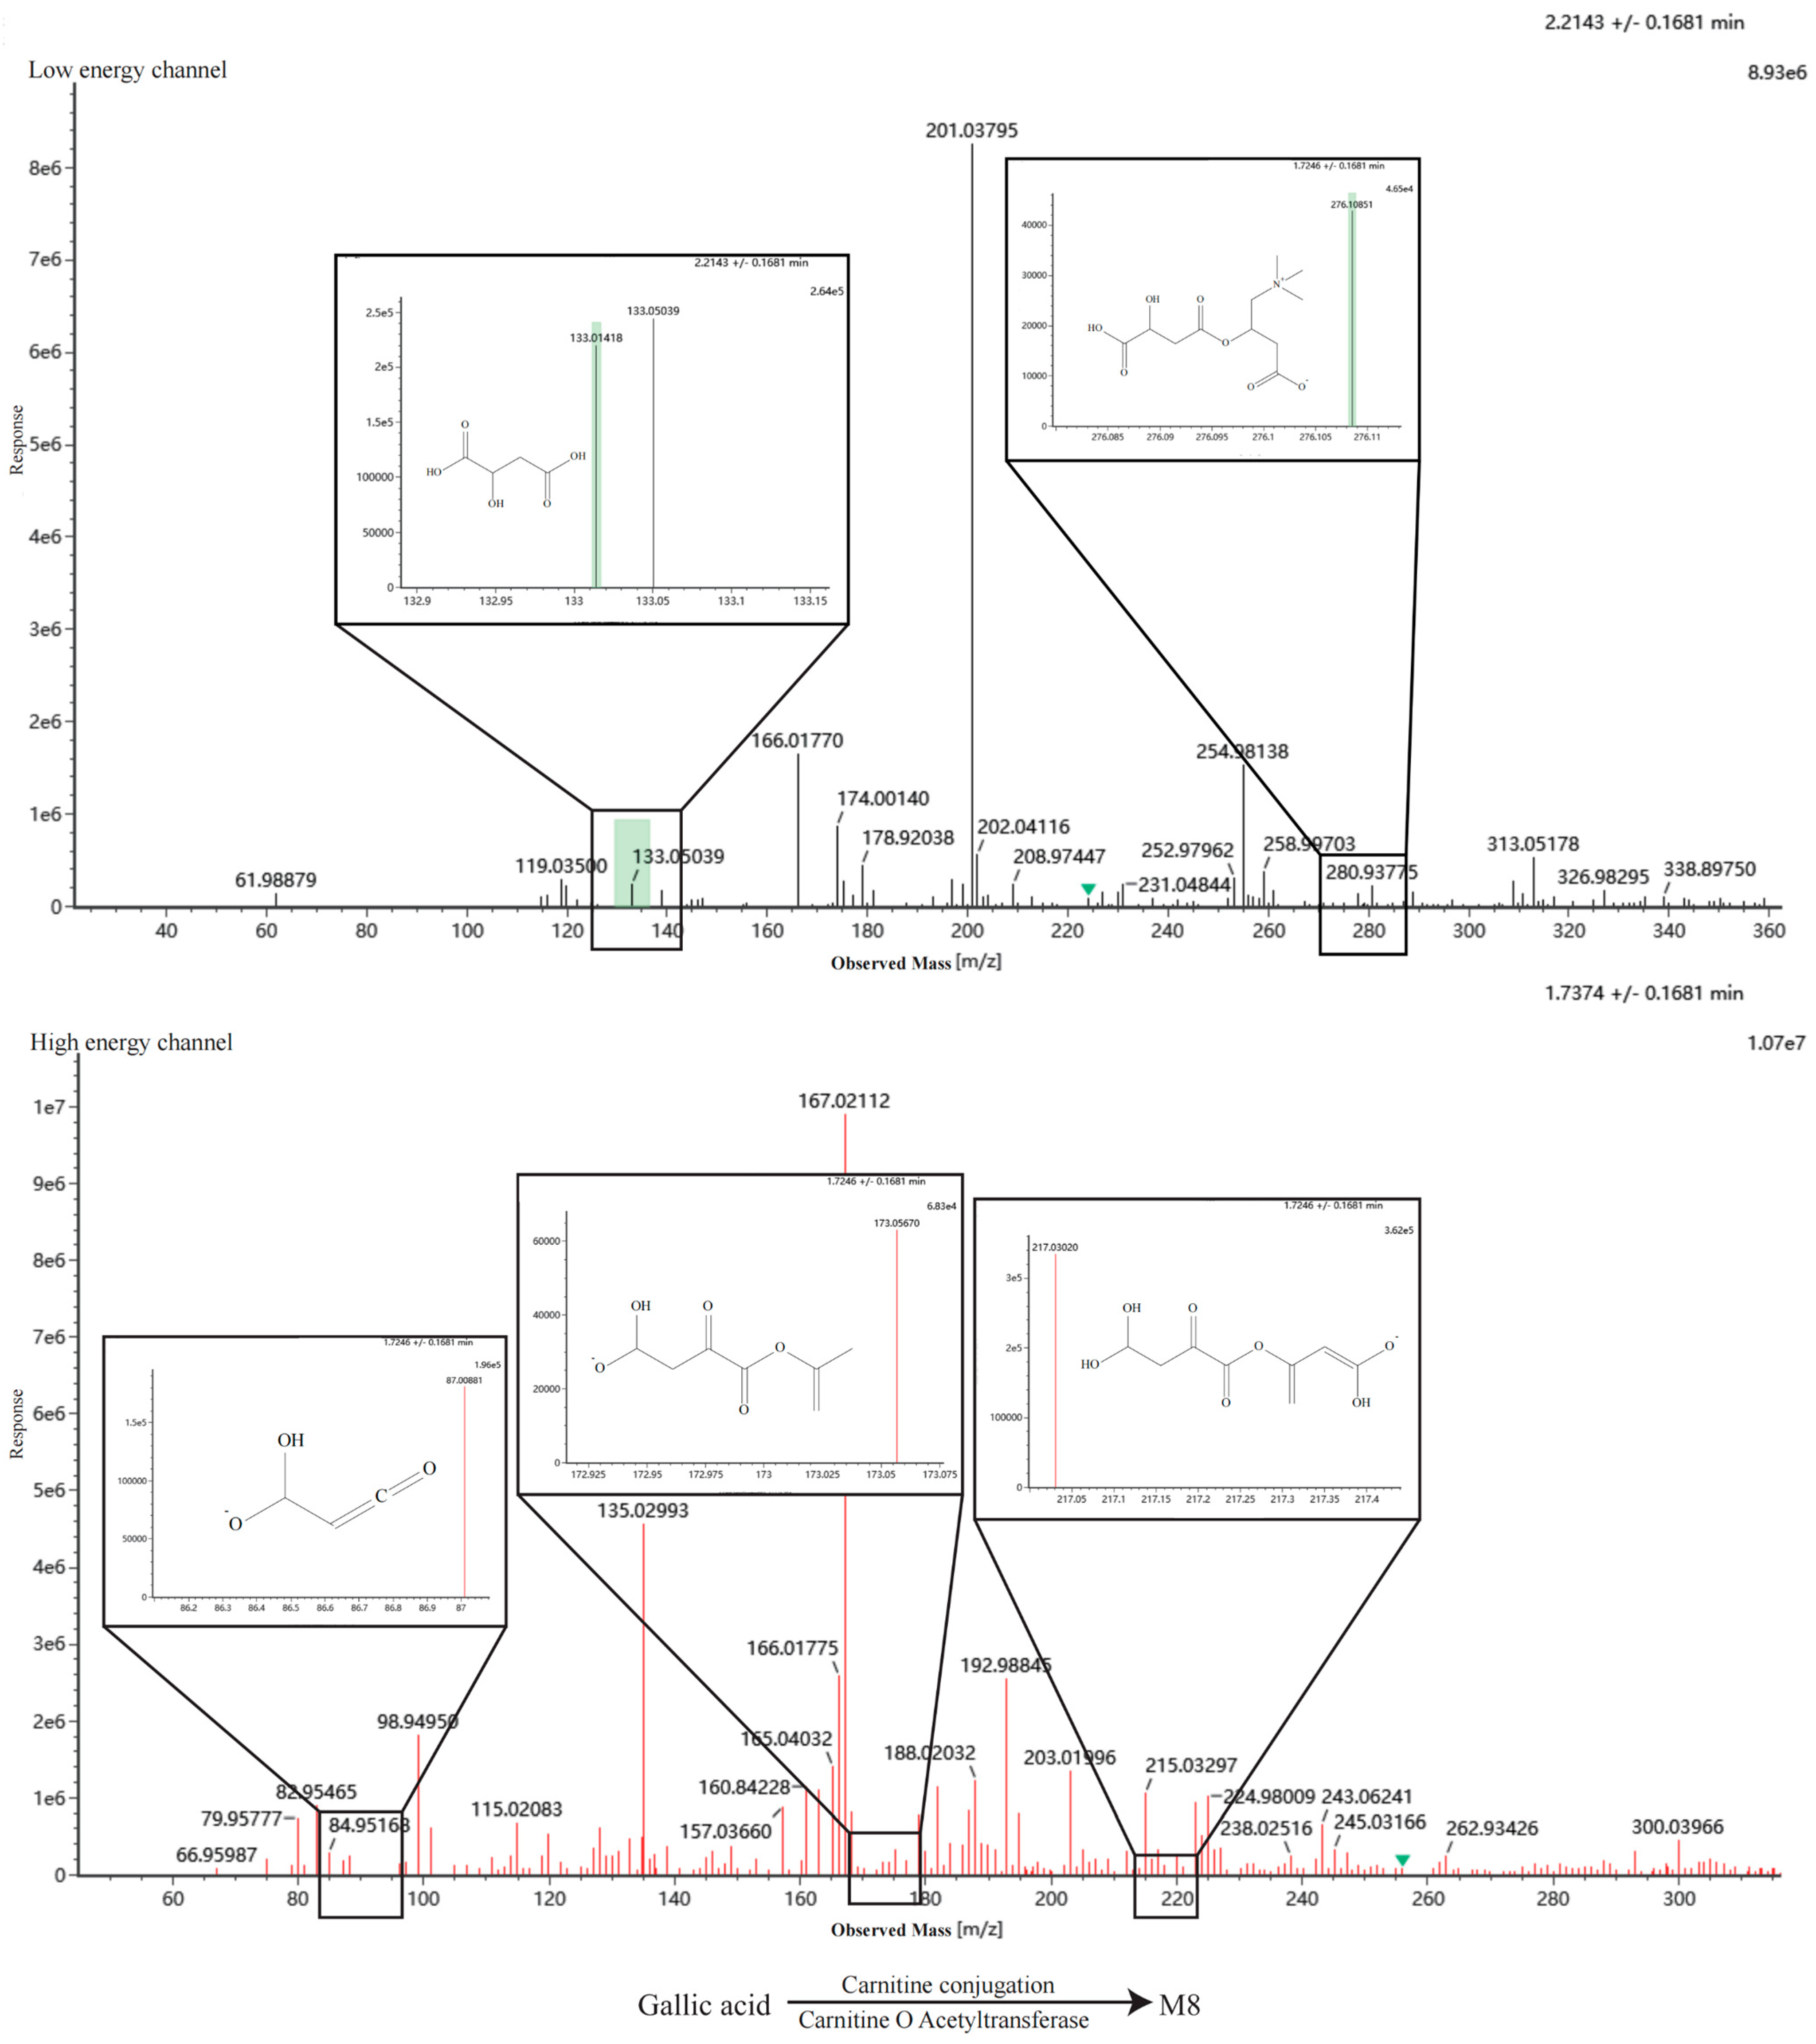
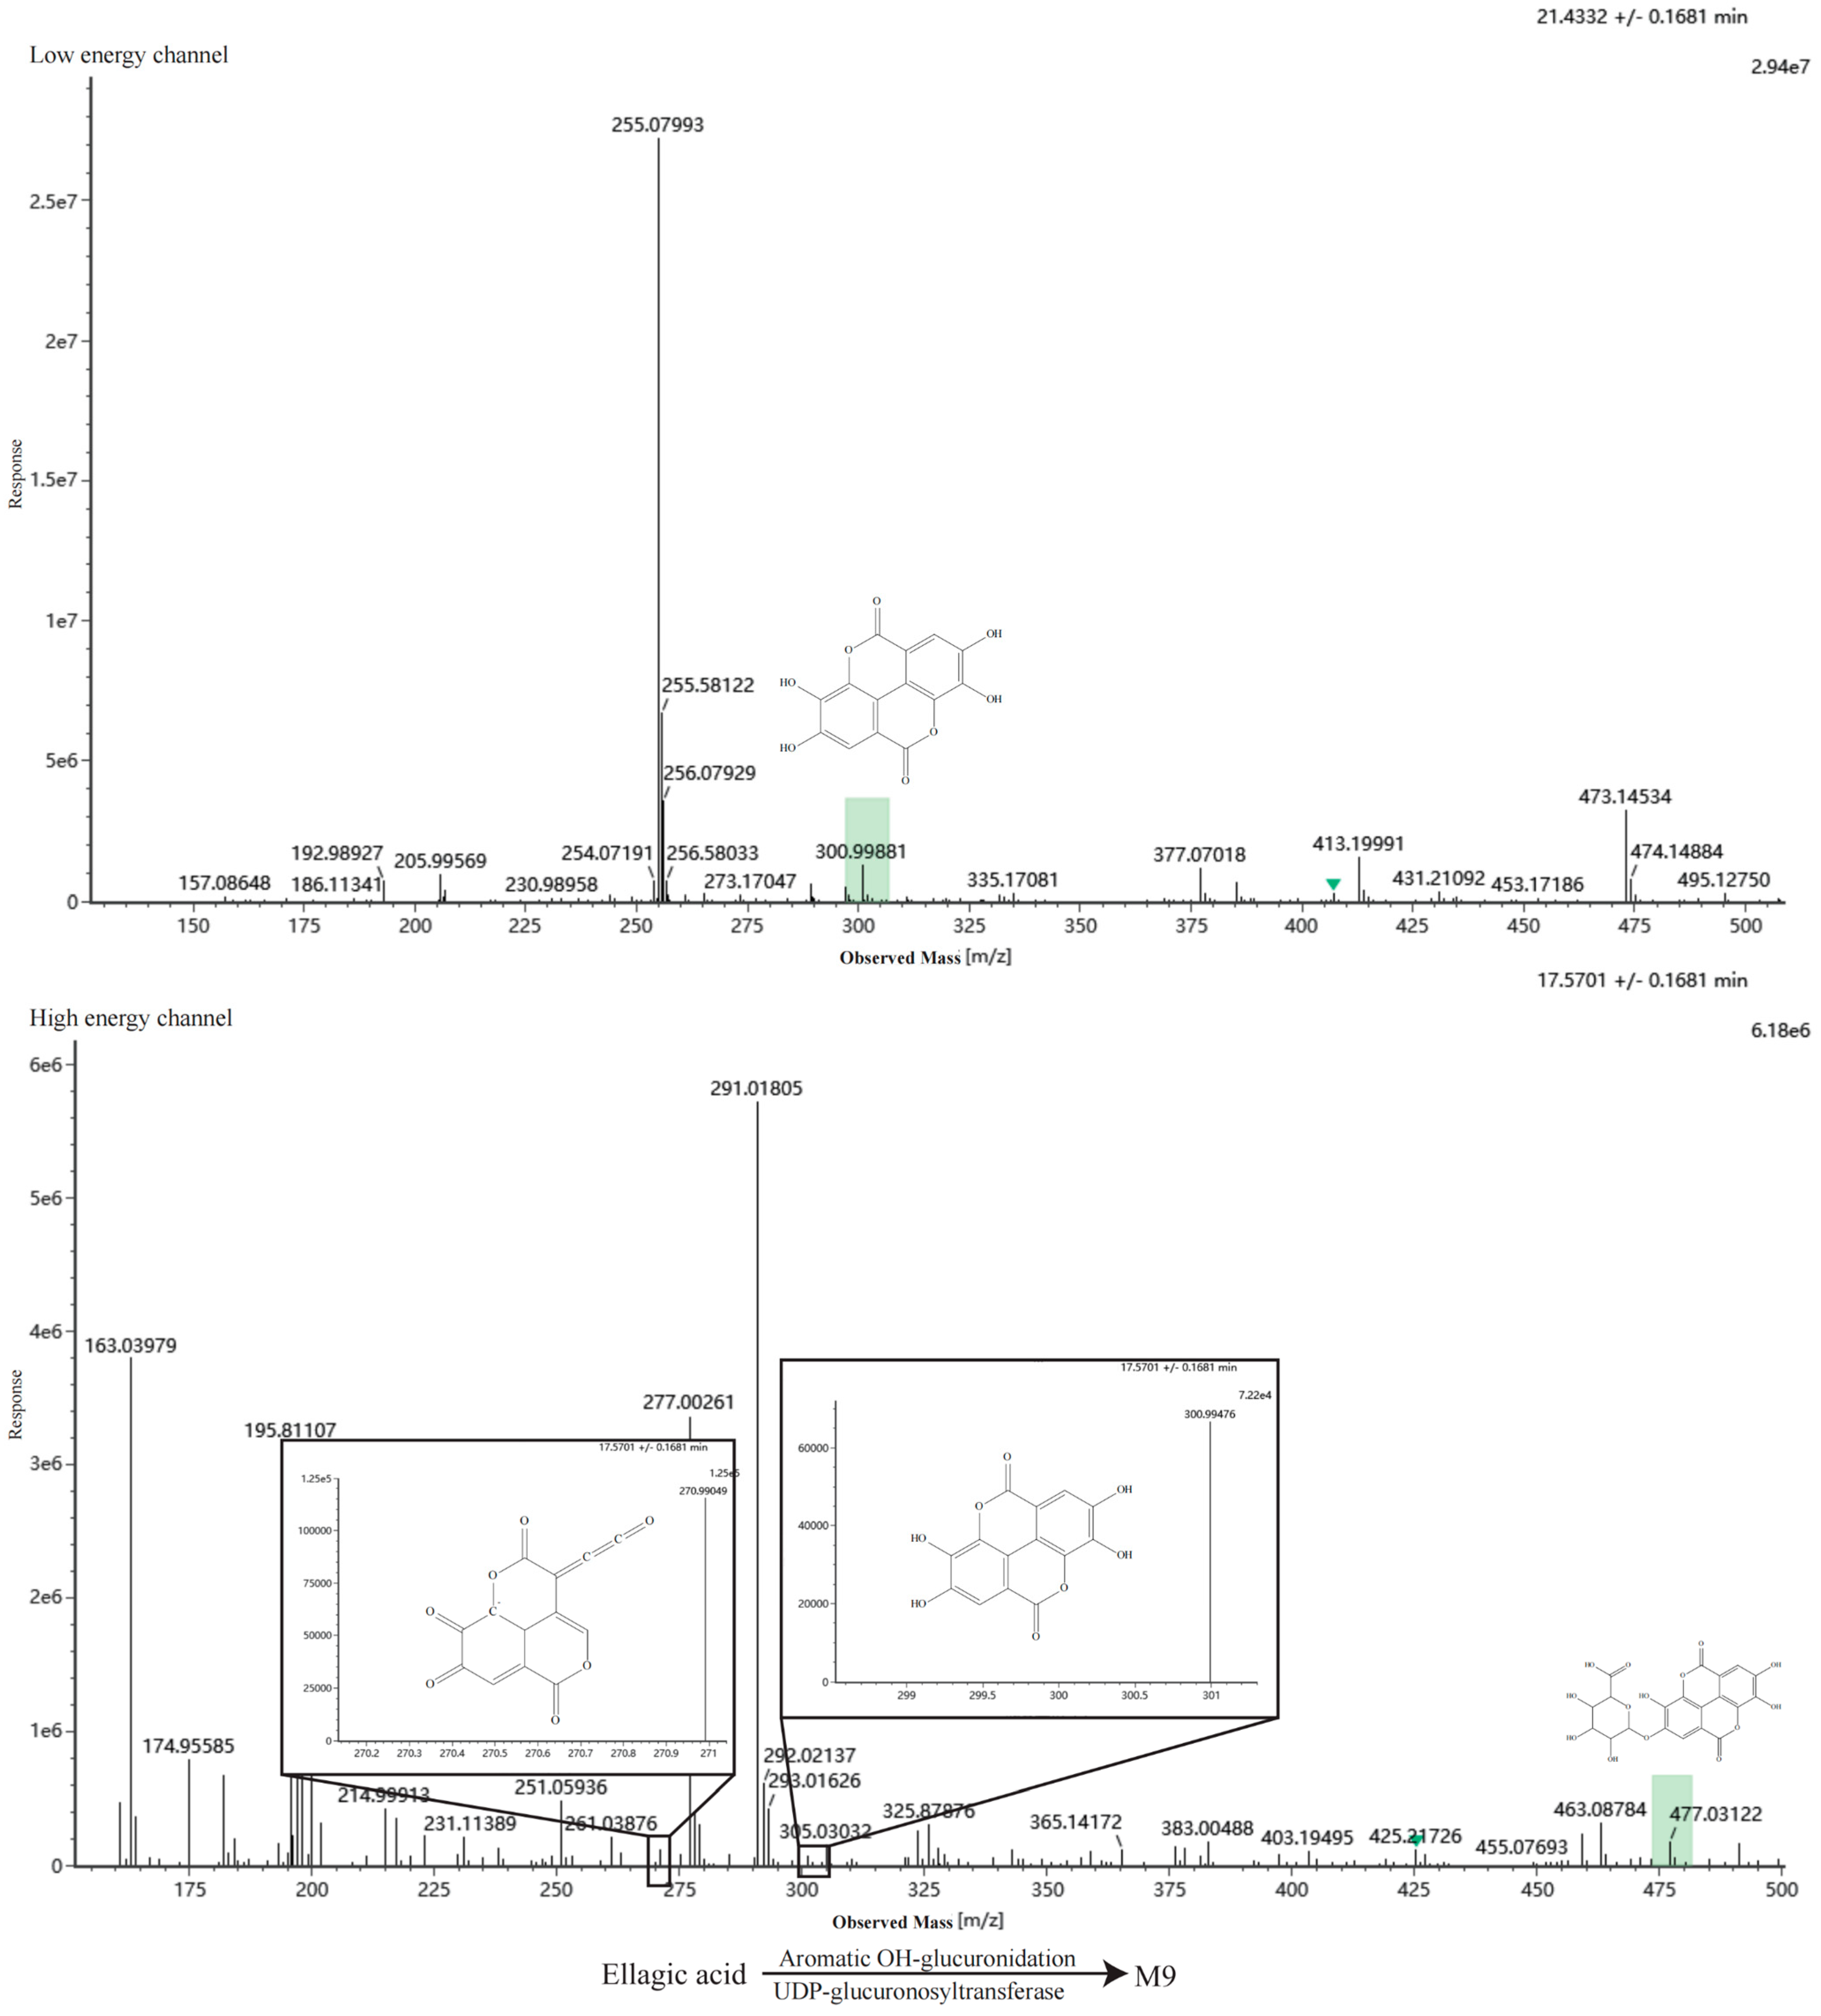
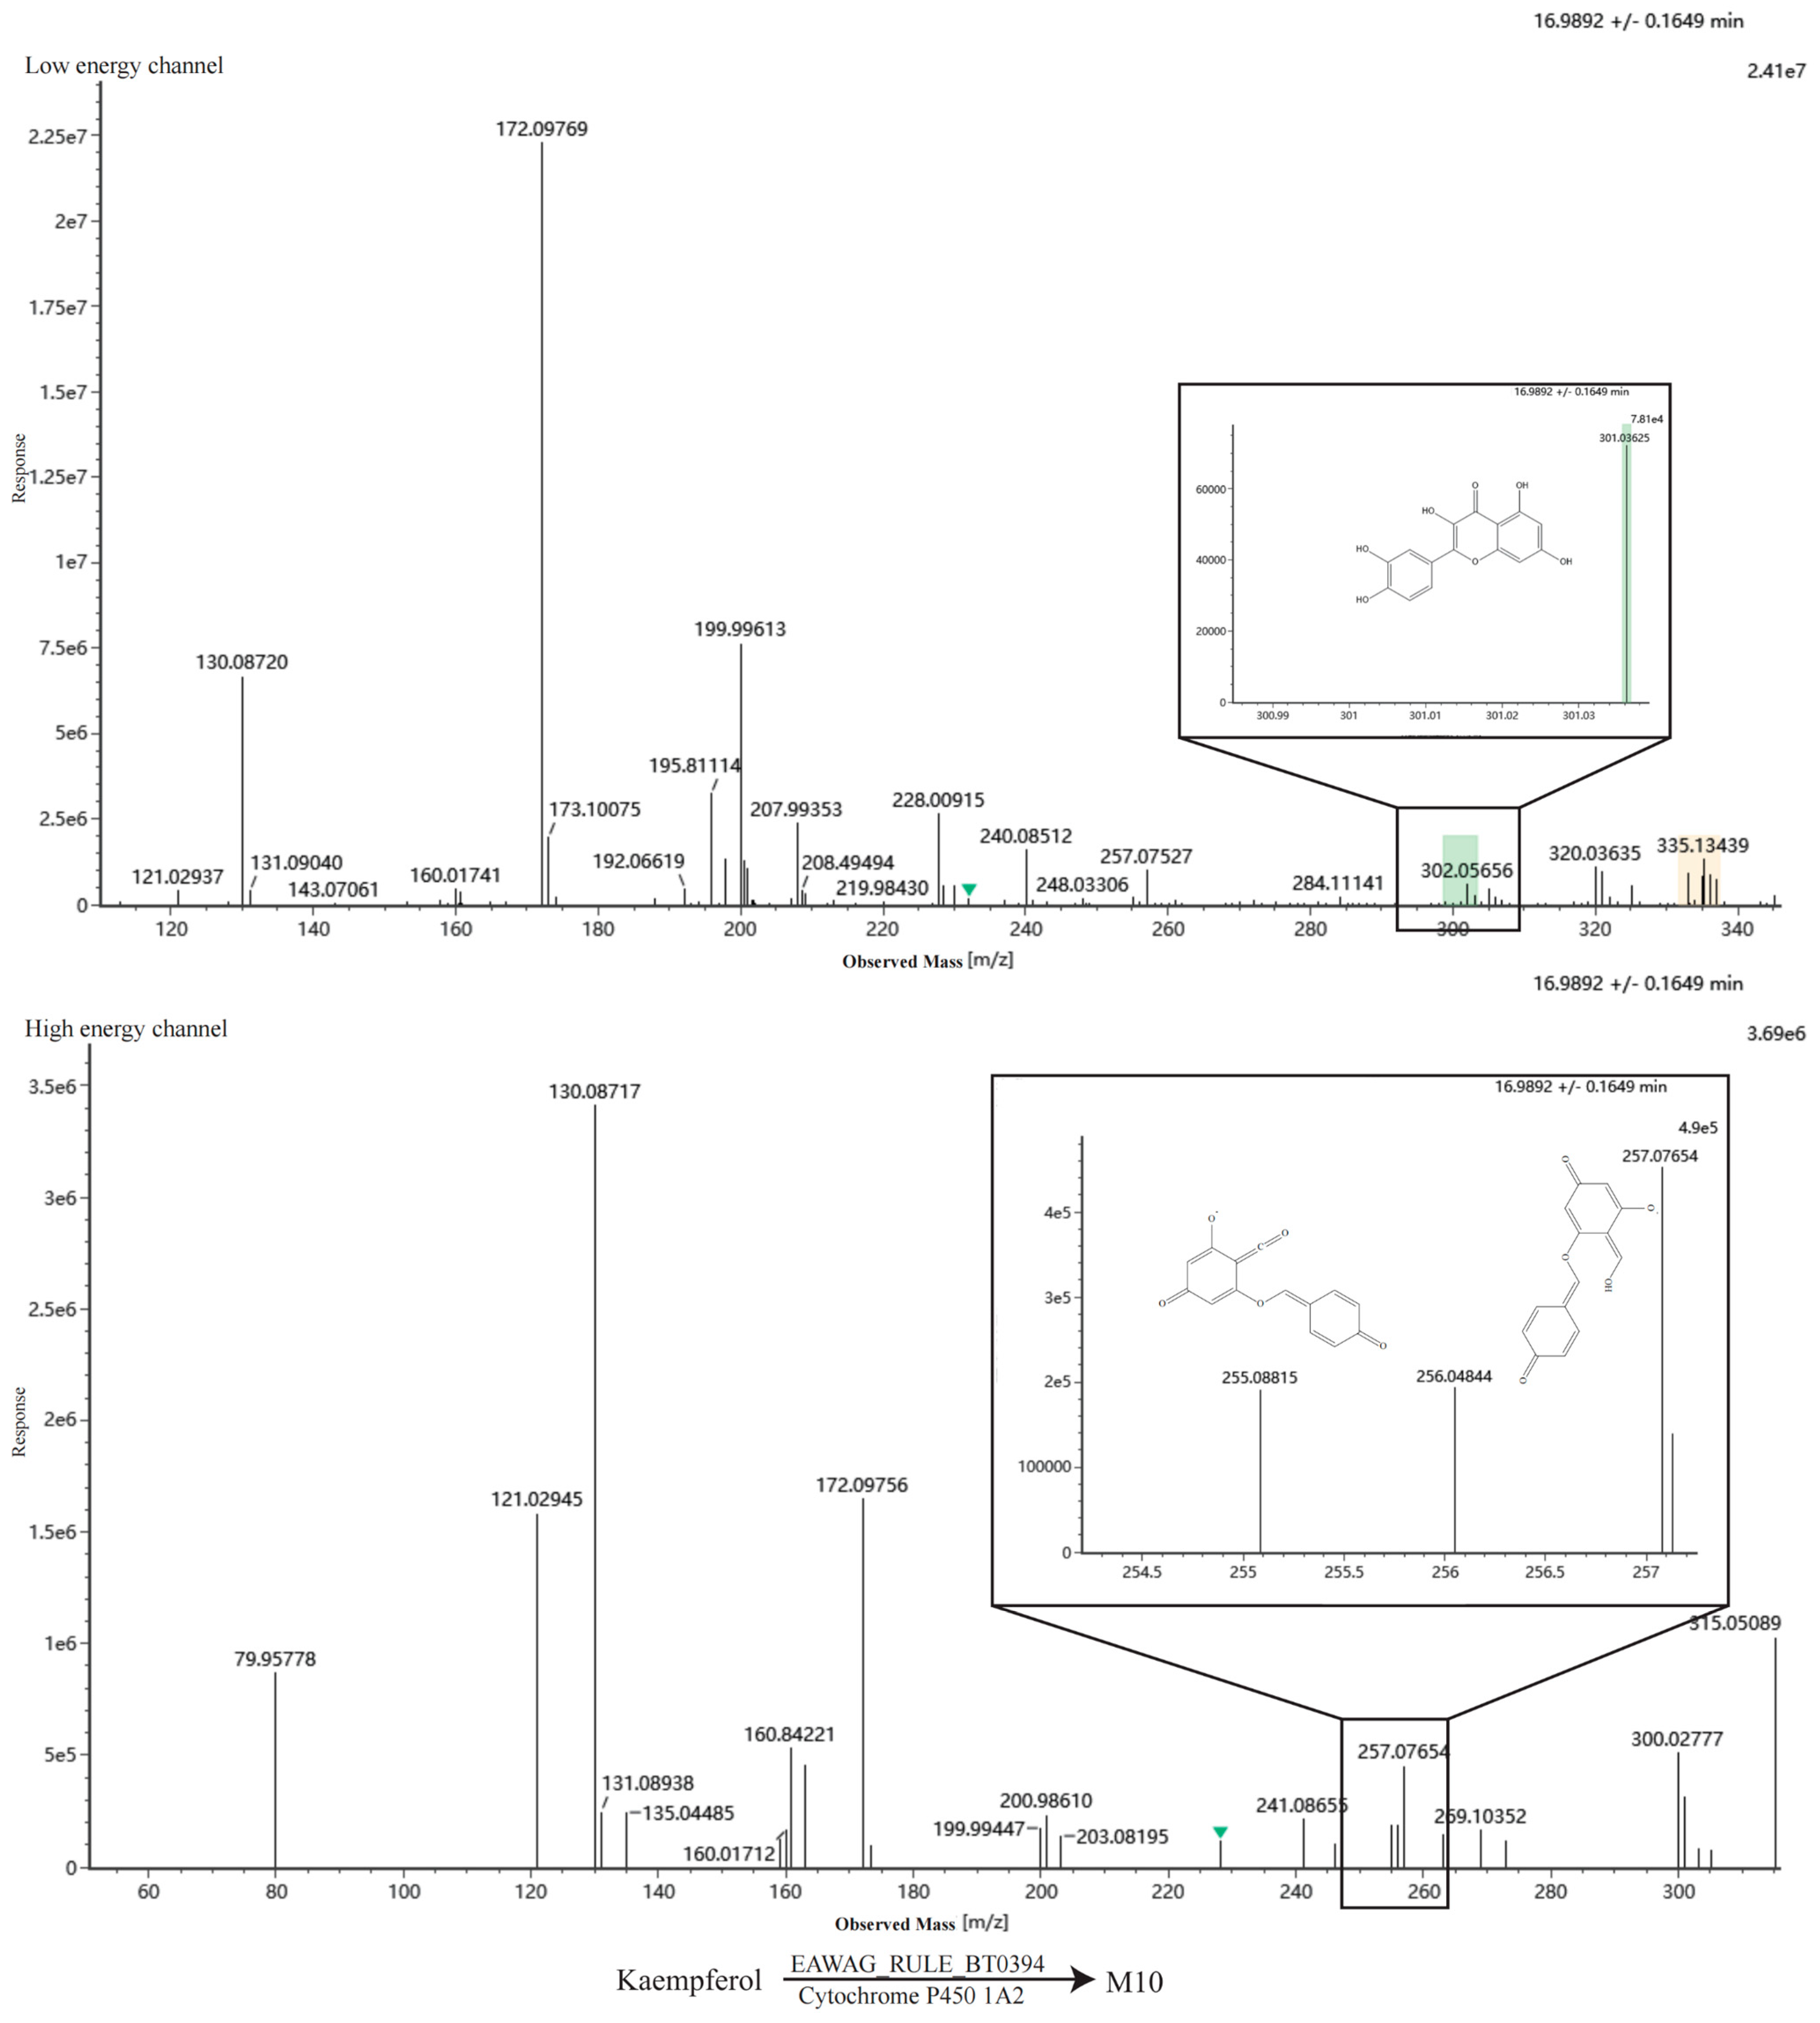
Integrating Waters UNIFI 1.9.4 with BioTransformer 3.0 and CFM-ID 4.0, a total of 14 metabolites (M1–M14) were characterized in rat plasma (Appendix C). The detailed metabolic transformations are described as follows:
M1 (m/z 285.0455, [M-H]−): A dehydroxylation product of quercetin. Its fragment ions at m/z 151.0030 and 255.0298 were consistent with the predicted MS/MS spectra.
M2 (m/z 303.0529, [M-H]−): Formed via carbonyl reduction of quercetin. The fragment ion at m/z 285.0405 matched the predicted data.
M3 (m/z 477.0673, [M-H]−): A glucuronidated product of quercetin catalyzed by UDP-glucuronosyltransferase (UGT). The fragment at m/z 255.0292 was consistent with predictions.
M4 (m/z 228.9641, [M-H]−): A secondary alcohol sulfation product of tartaric acid mediated by alcohol sulfotransferase. The fragment at m/z 136.9387 matched the prediction.
M5 (m/z 125.0242, [M-H]−): Formed via decarboxylation and N-glucuronidation of gallic acid. Due to low collision energy, no diagnostic ring-cleavage fragments were observed.
M6 (m/z 345.0437, [M-H]−): An aromatic O-glucuronide of gallic acid. Fragments at m/z 169.0124 and 123.0086 were consistent with predicted results.
M7 (m/z 309.0444, [M-H]−): An alkyl-OH-glucuronide or fatty acid O-glucoside of malic acid. Characteristic ions at m/z 193.0354, 193.0154, 147.0299, and 87.0088 were identified.
M8 (m/z 276.1085, [M-H]−): A carnitine conjugate of malic acid mediated by carnitine O-acetyltransferase. Fragments at m/z 217.0302, 173.0567, and 87.0088 matched the predictions.
M9 (m/z 477.0312, [M-H]−): An aromatic O-glucuronide of ellagic acid. Fragments at m/z 300.9947 and 270.9904 were consistent with the simulated spectra.
M10 (m/z 301.0362, [M-H]−): An ortho-hydroxylation product of kaempferol mediated by CYP1A2. Fragments at m/z 257.0765 and 255.0881 matched the predictions.
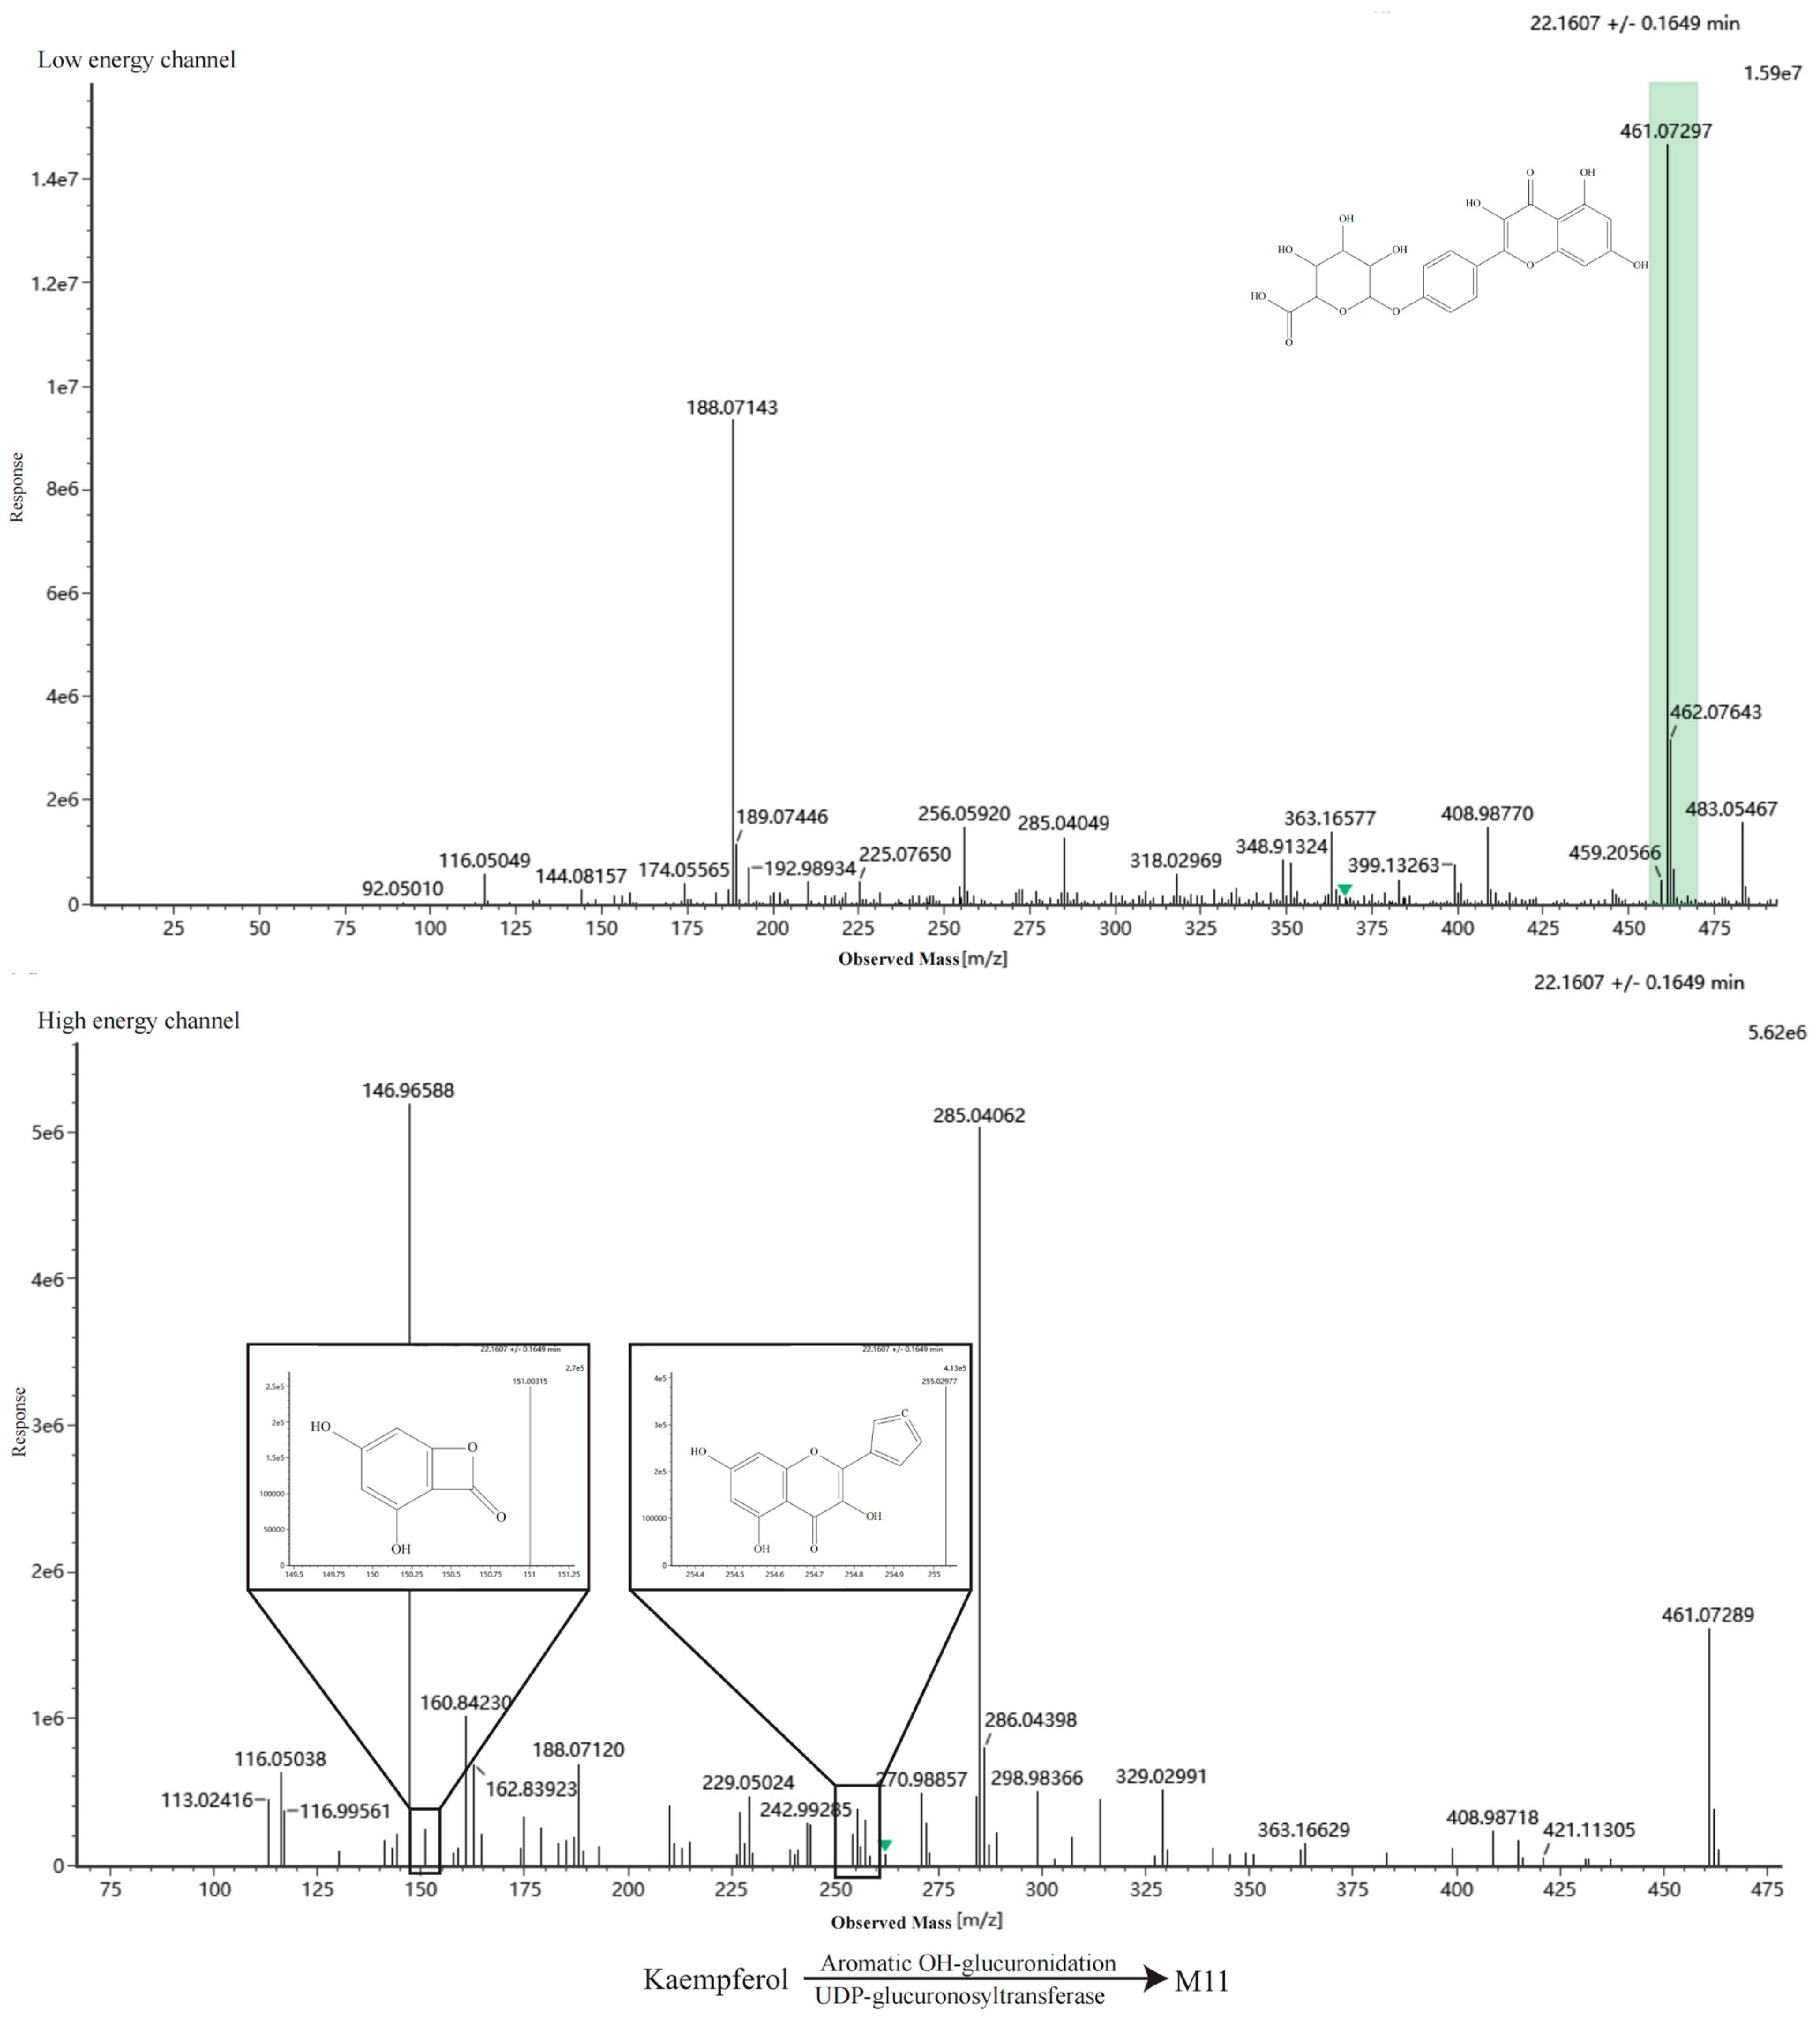
M11 (m/z 461.0729, [M-H]−): An aromatic O-glucuronide of kaempferol. Fragments at m/z 255.0297 and 151.0031 were consistent with predicted data.
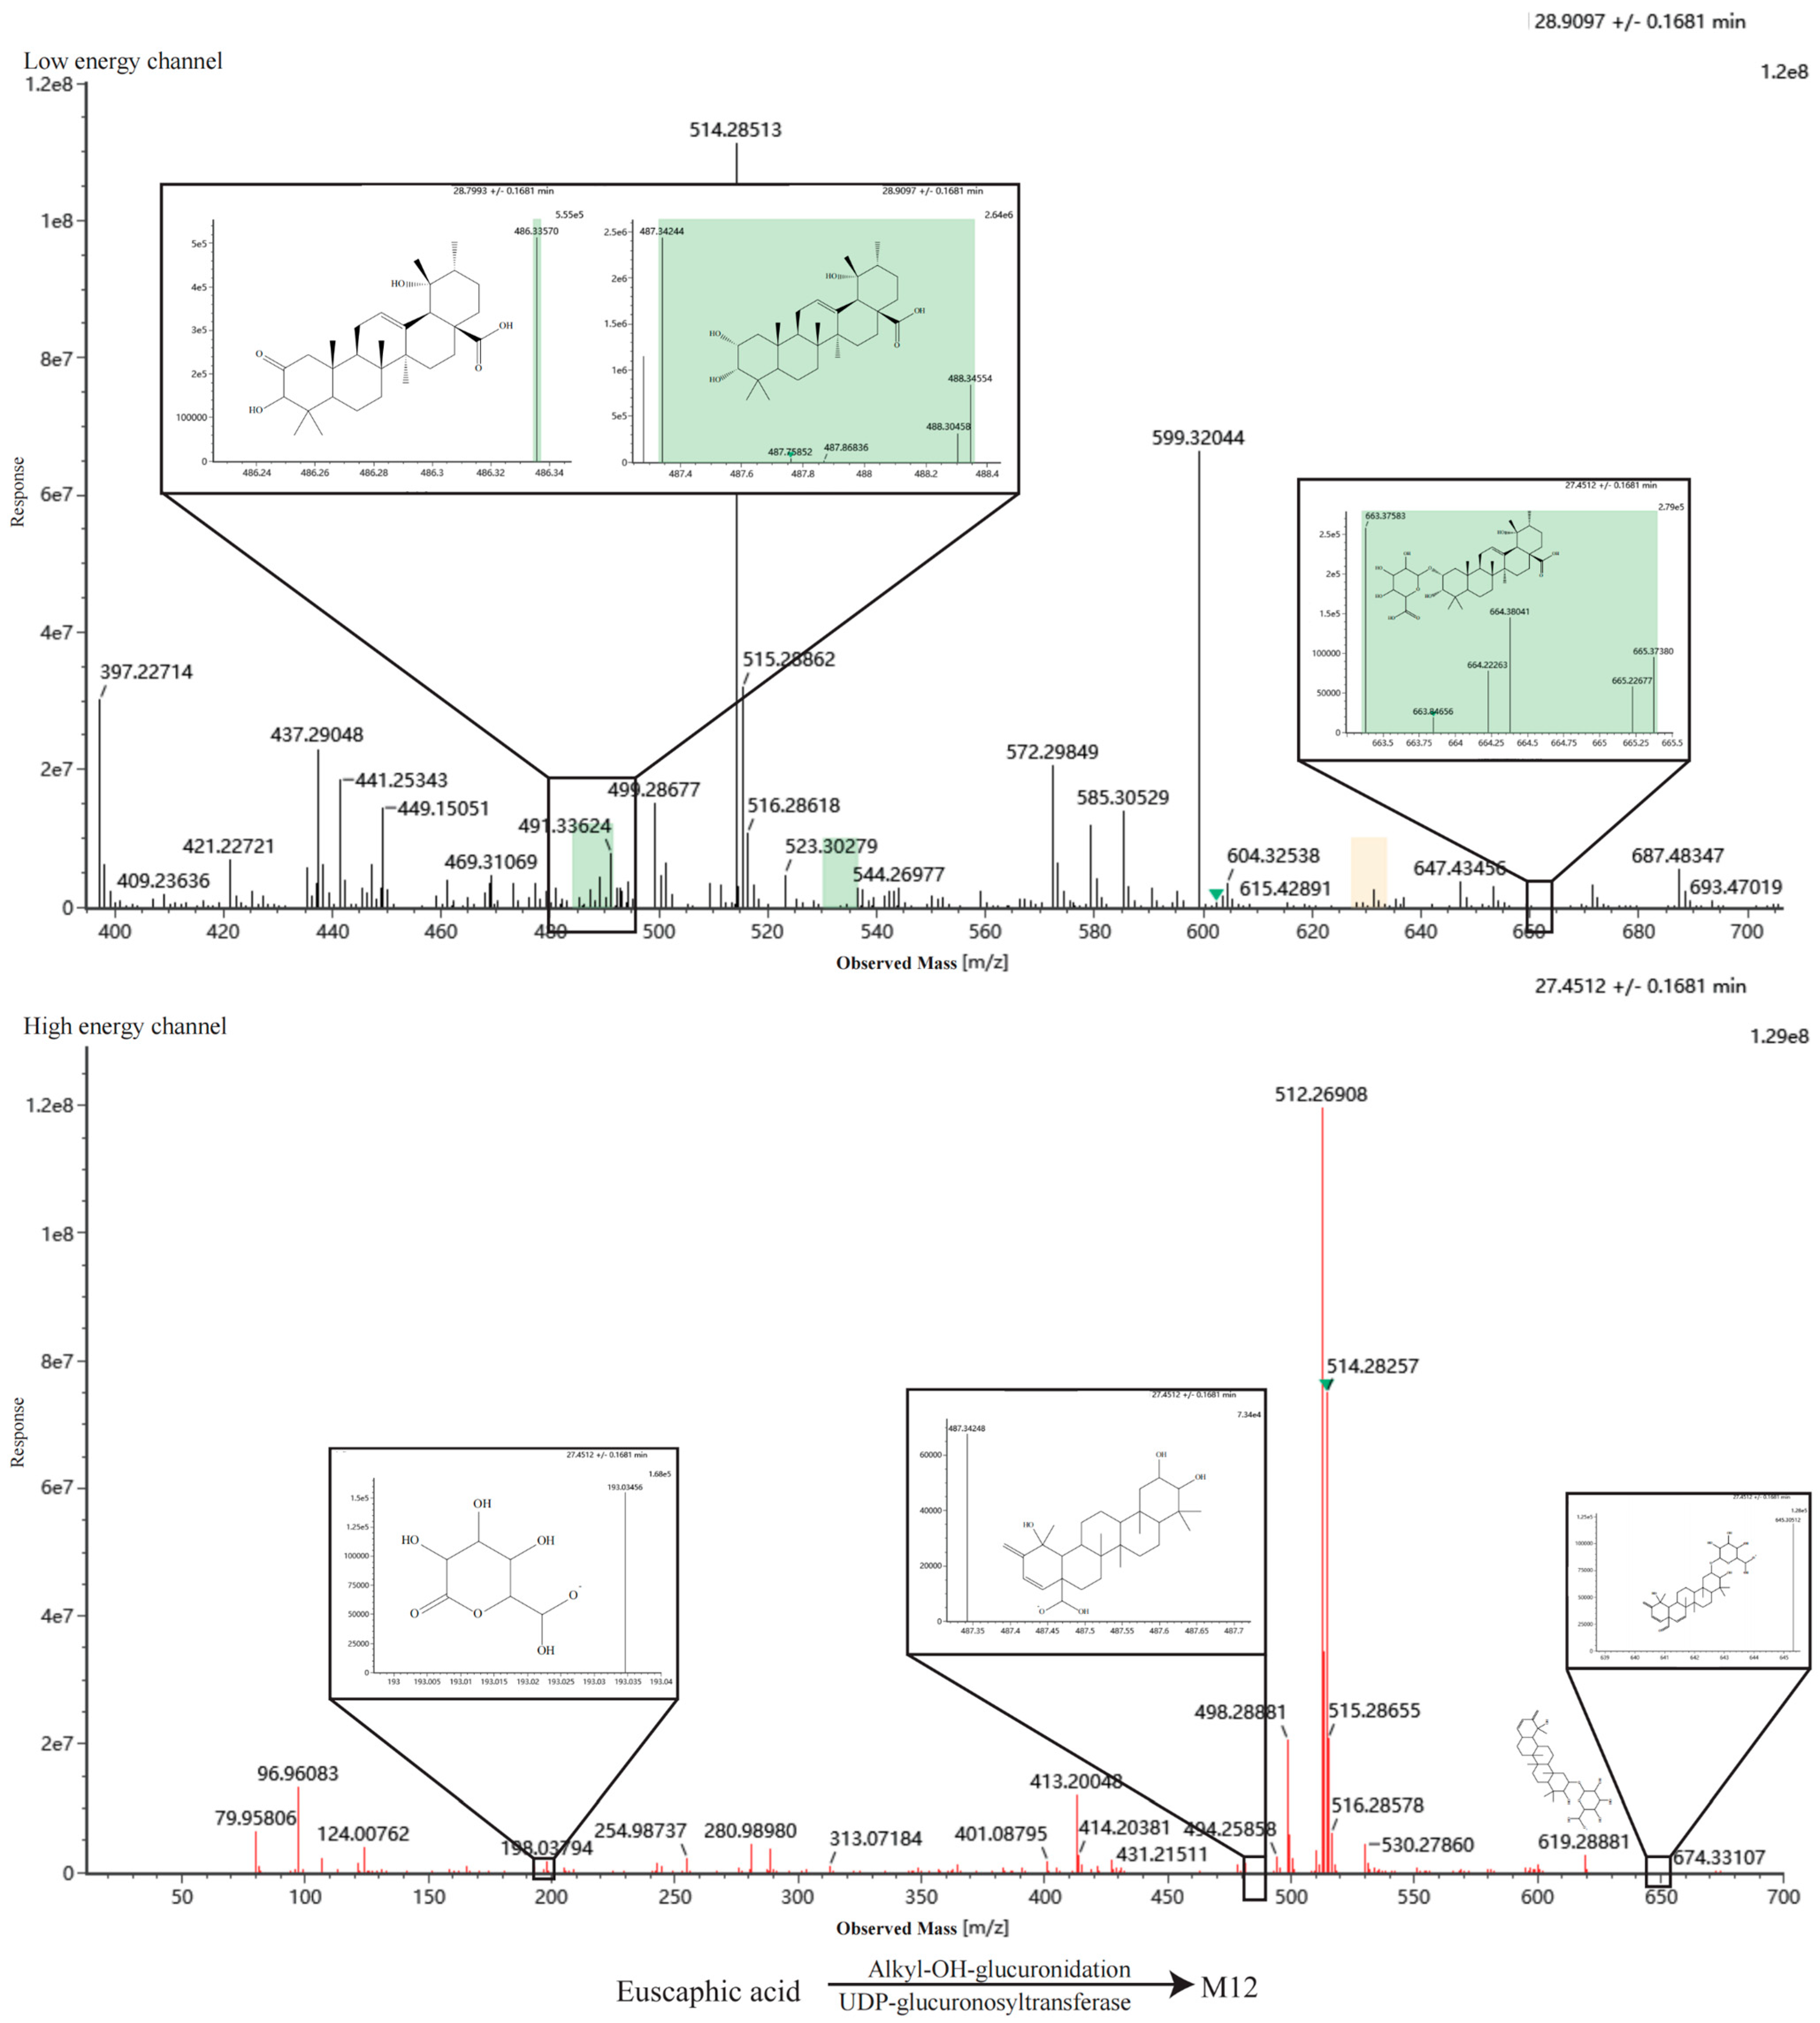
M12 (m/z 663.3758, [M-H]−): An alkyl-OH-glucuronide of euscaphic acid. Diagnostic fragments were found at m/z 645.3051, 487.3424, and 193.0345.
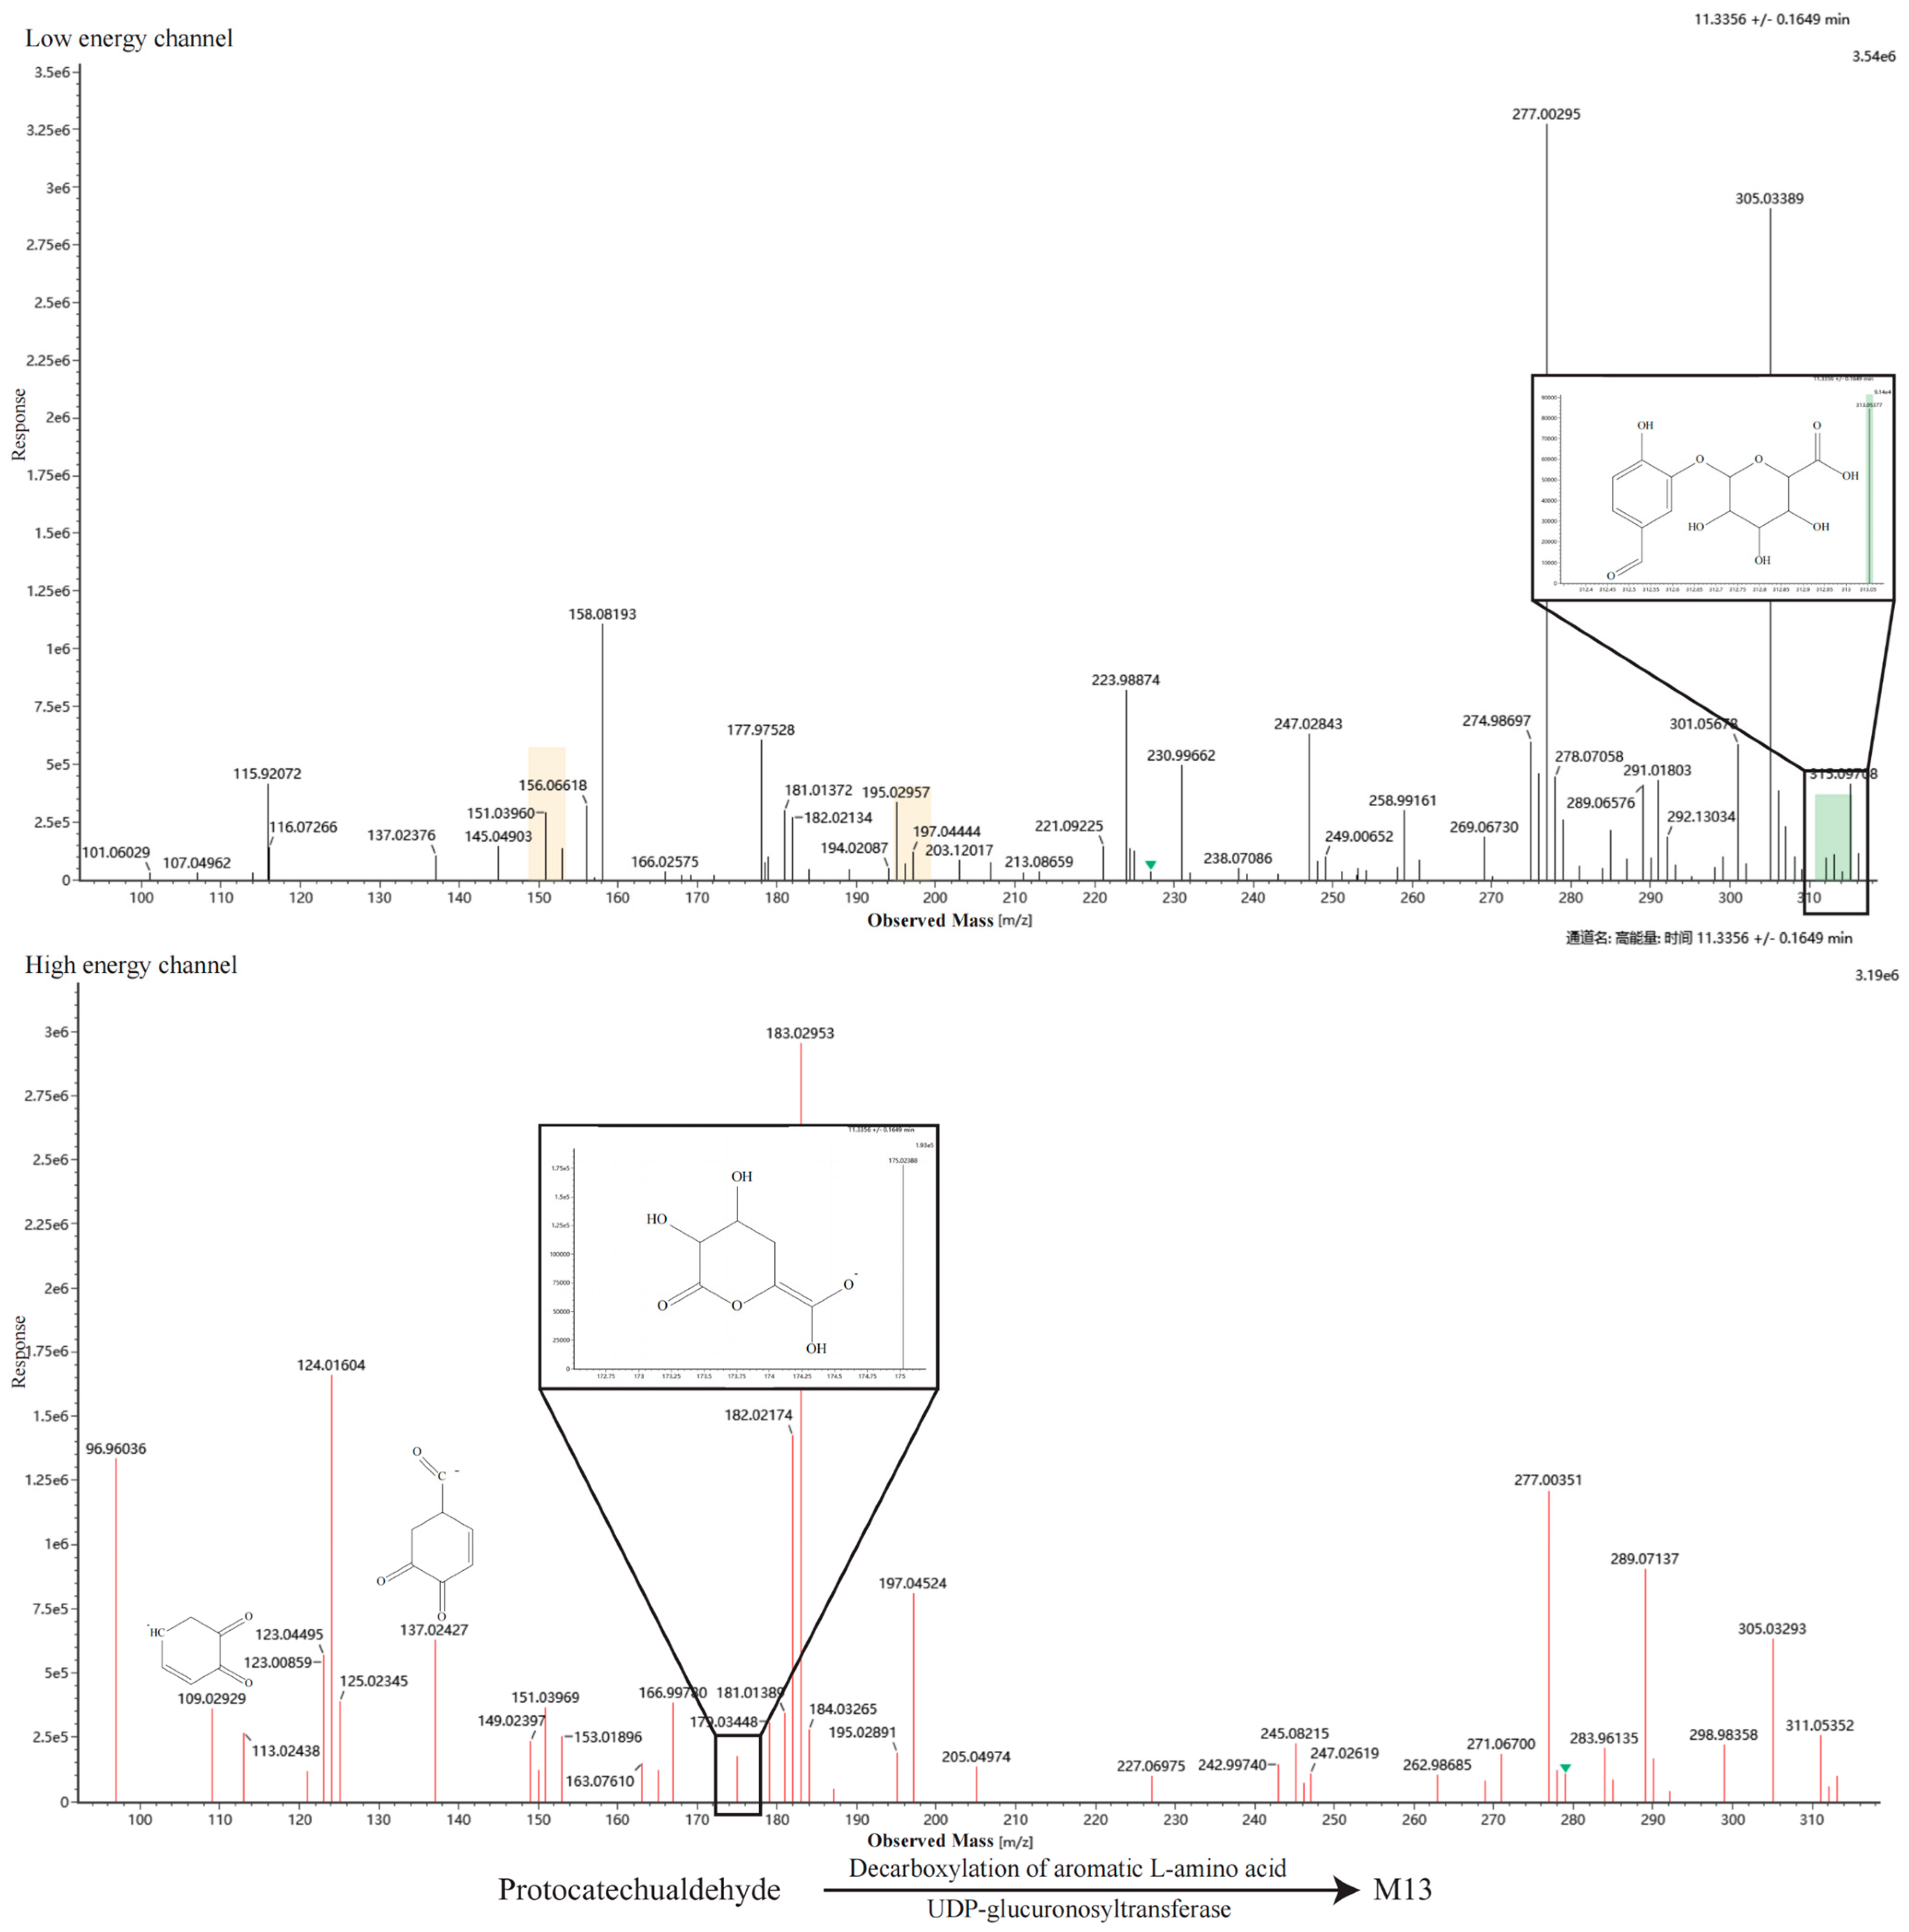
M13 (m/z 313.0137, [M-H]−): Derived from aromatic L-amino acid decarboxylation and glucuronidation of protocatechuic aldehyde. Fragments at m/z 175.0238, 137.0242, and 109.0292 matched the predictions.
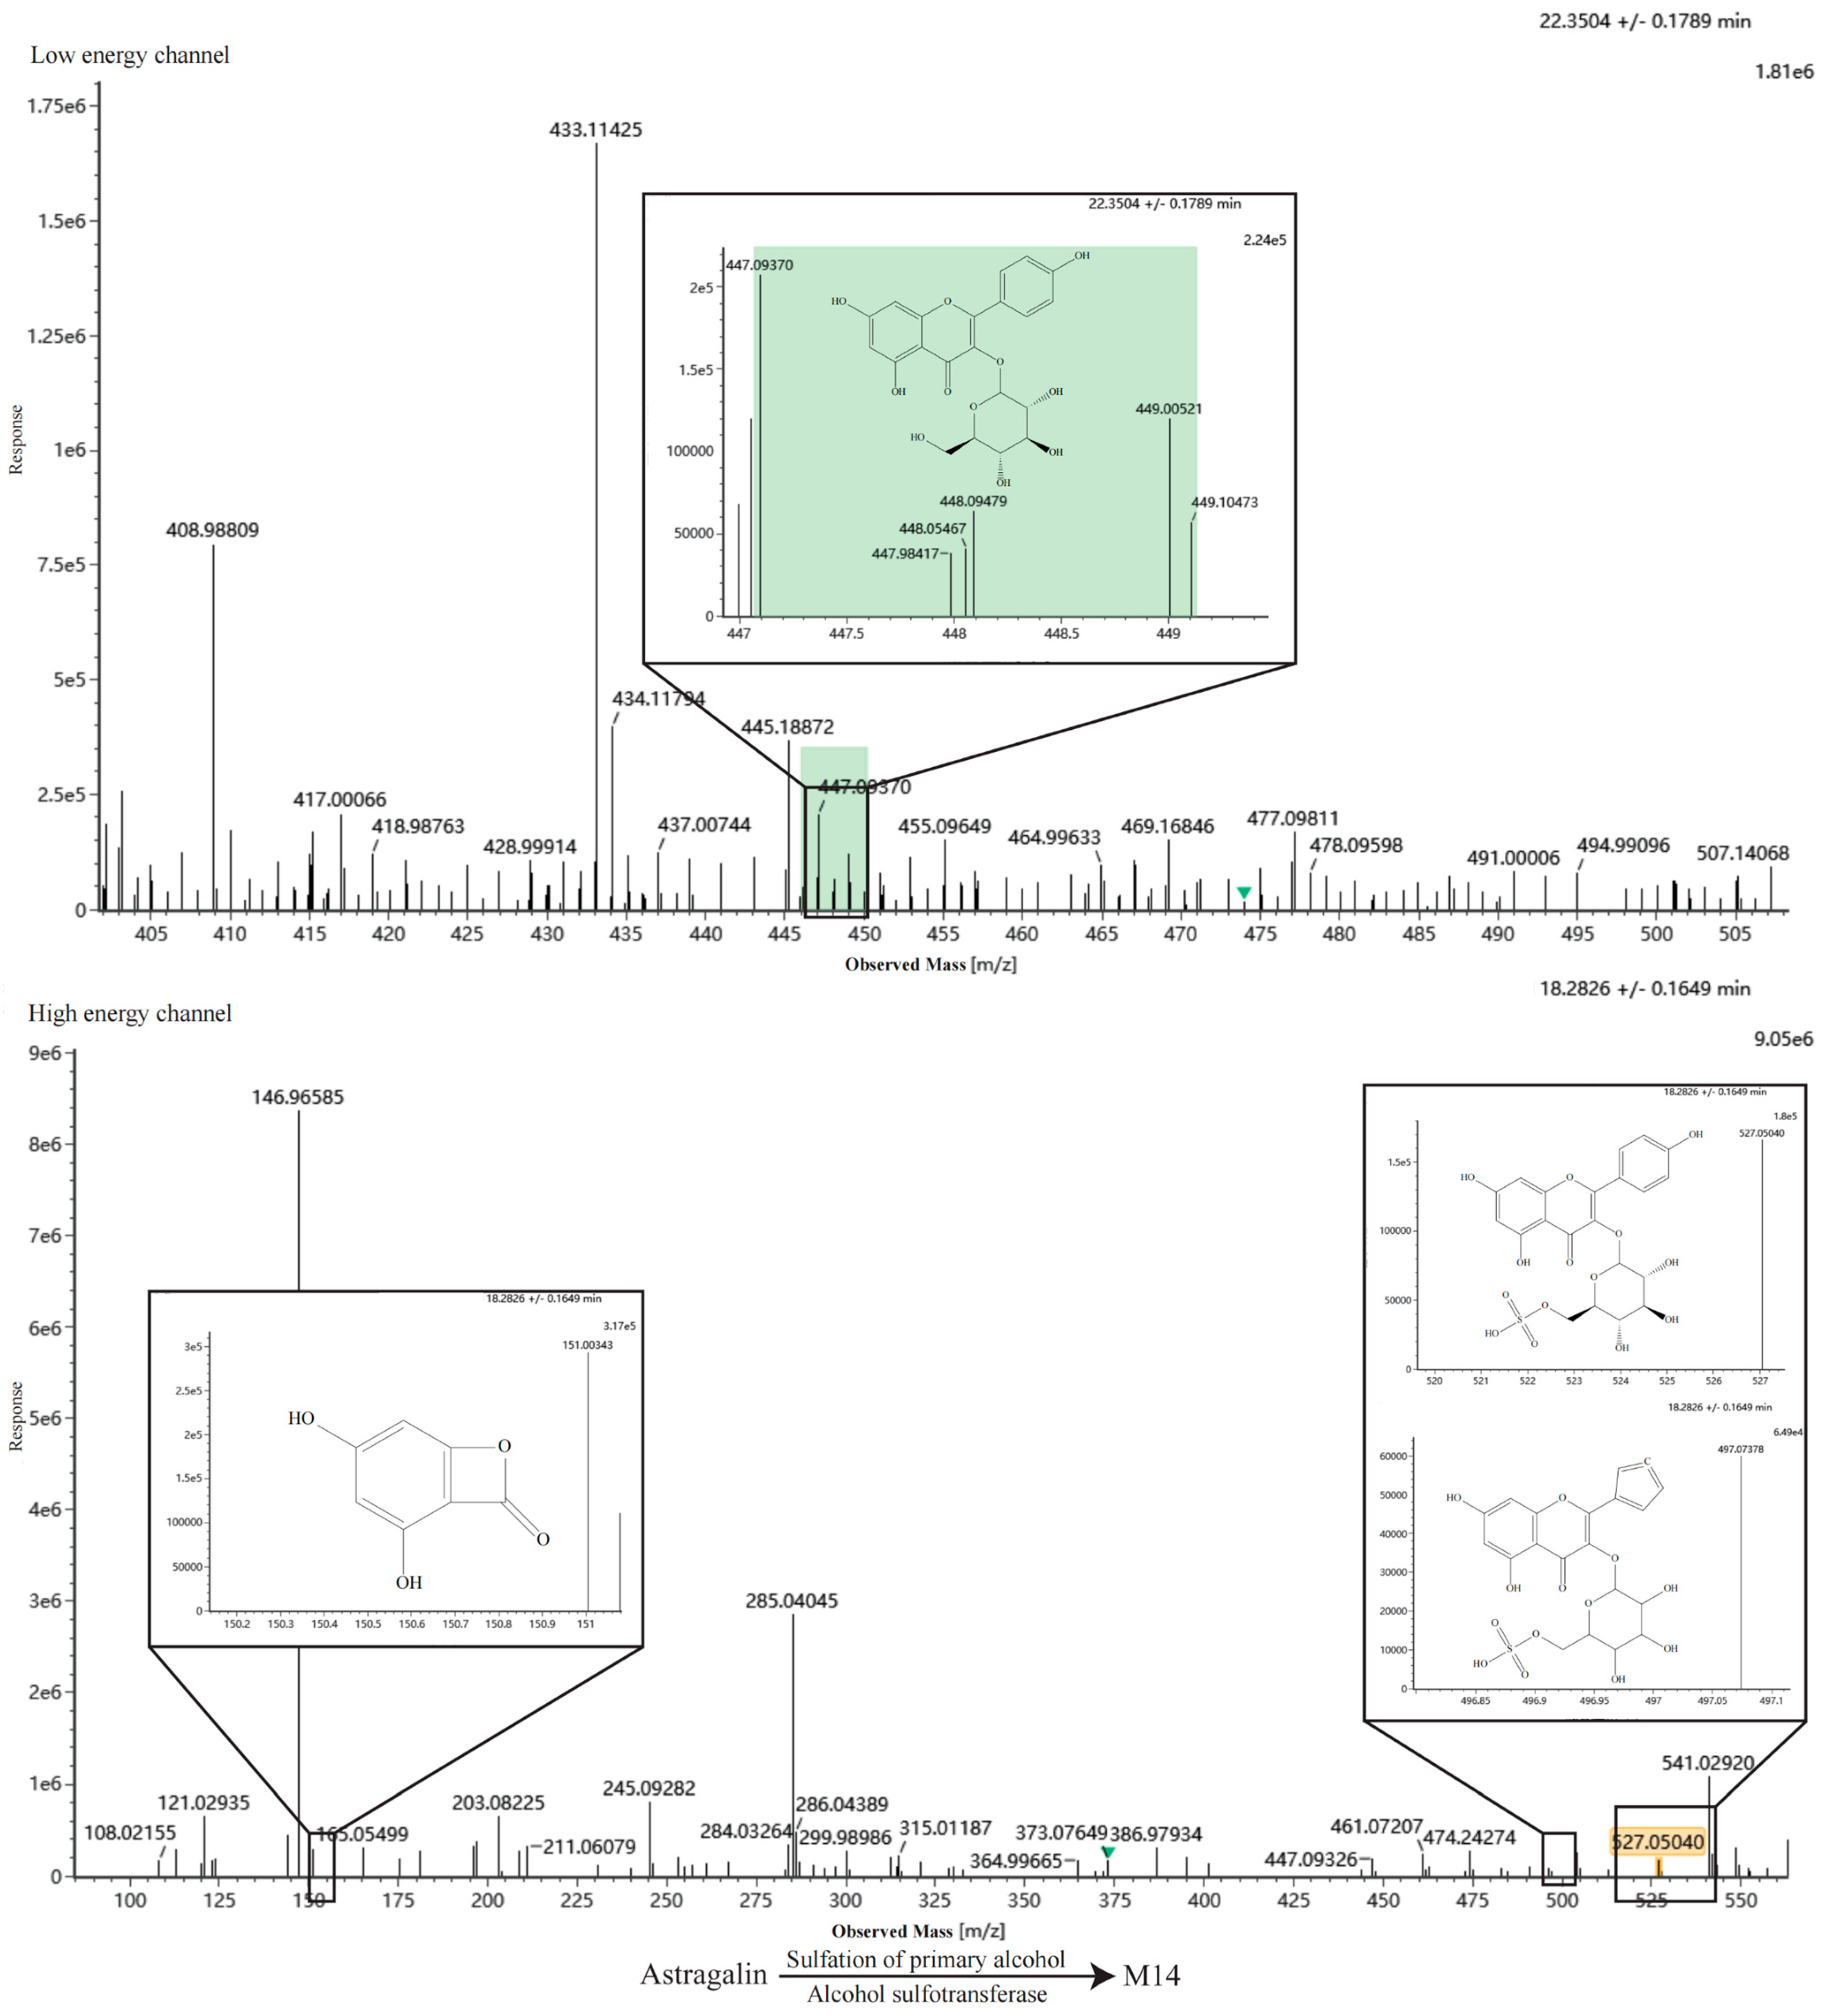
M14 (m/z 527.0504, [M-H]−): A primary alcohol sulfation product of astragalin. Characteristic fragments at m/z 497.0737 and 151.0034 were observed.
3.7. Potential Mechanism of FRLE Against HLP Predicted by Network Pharmacology and Molecular Docking
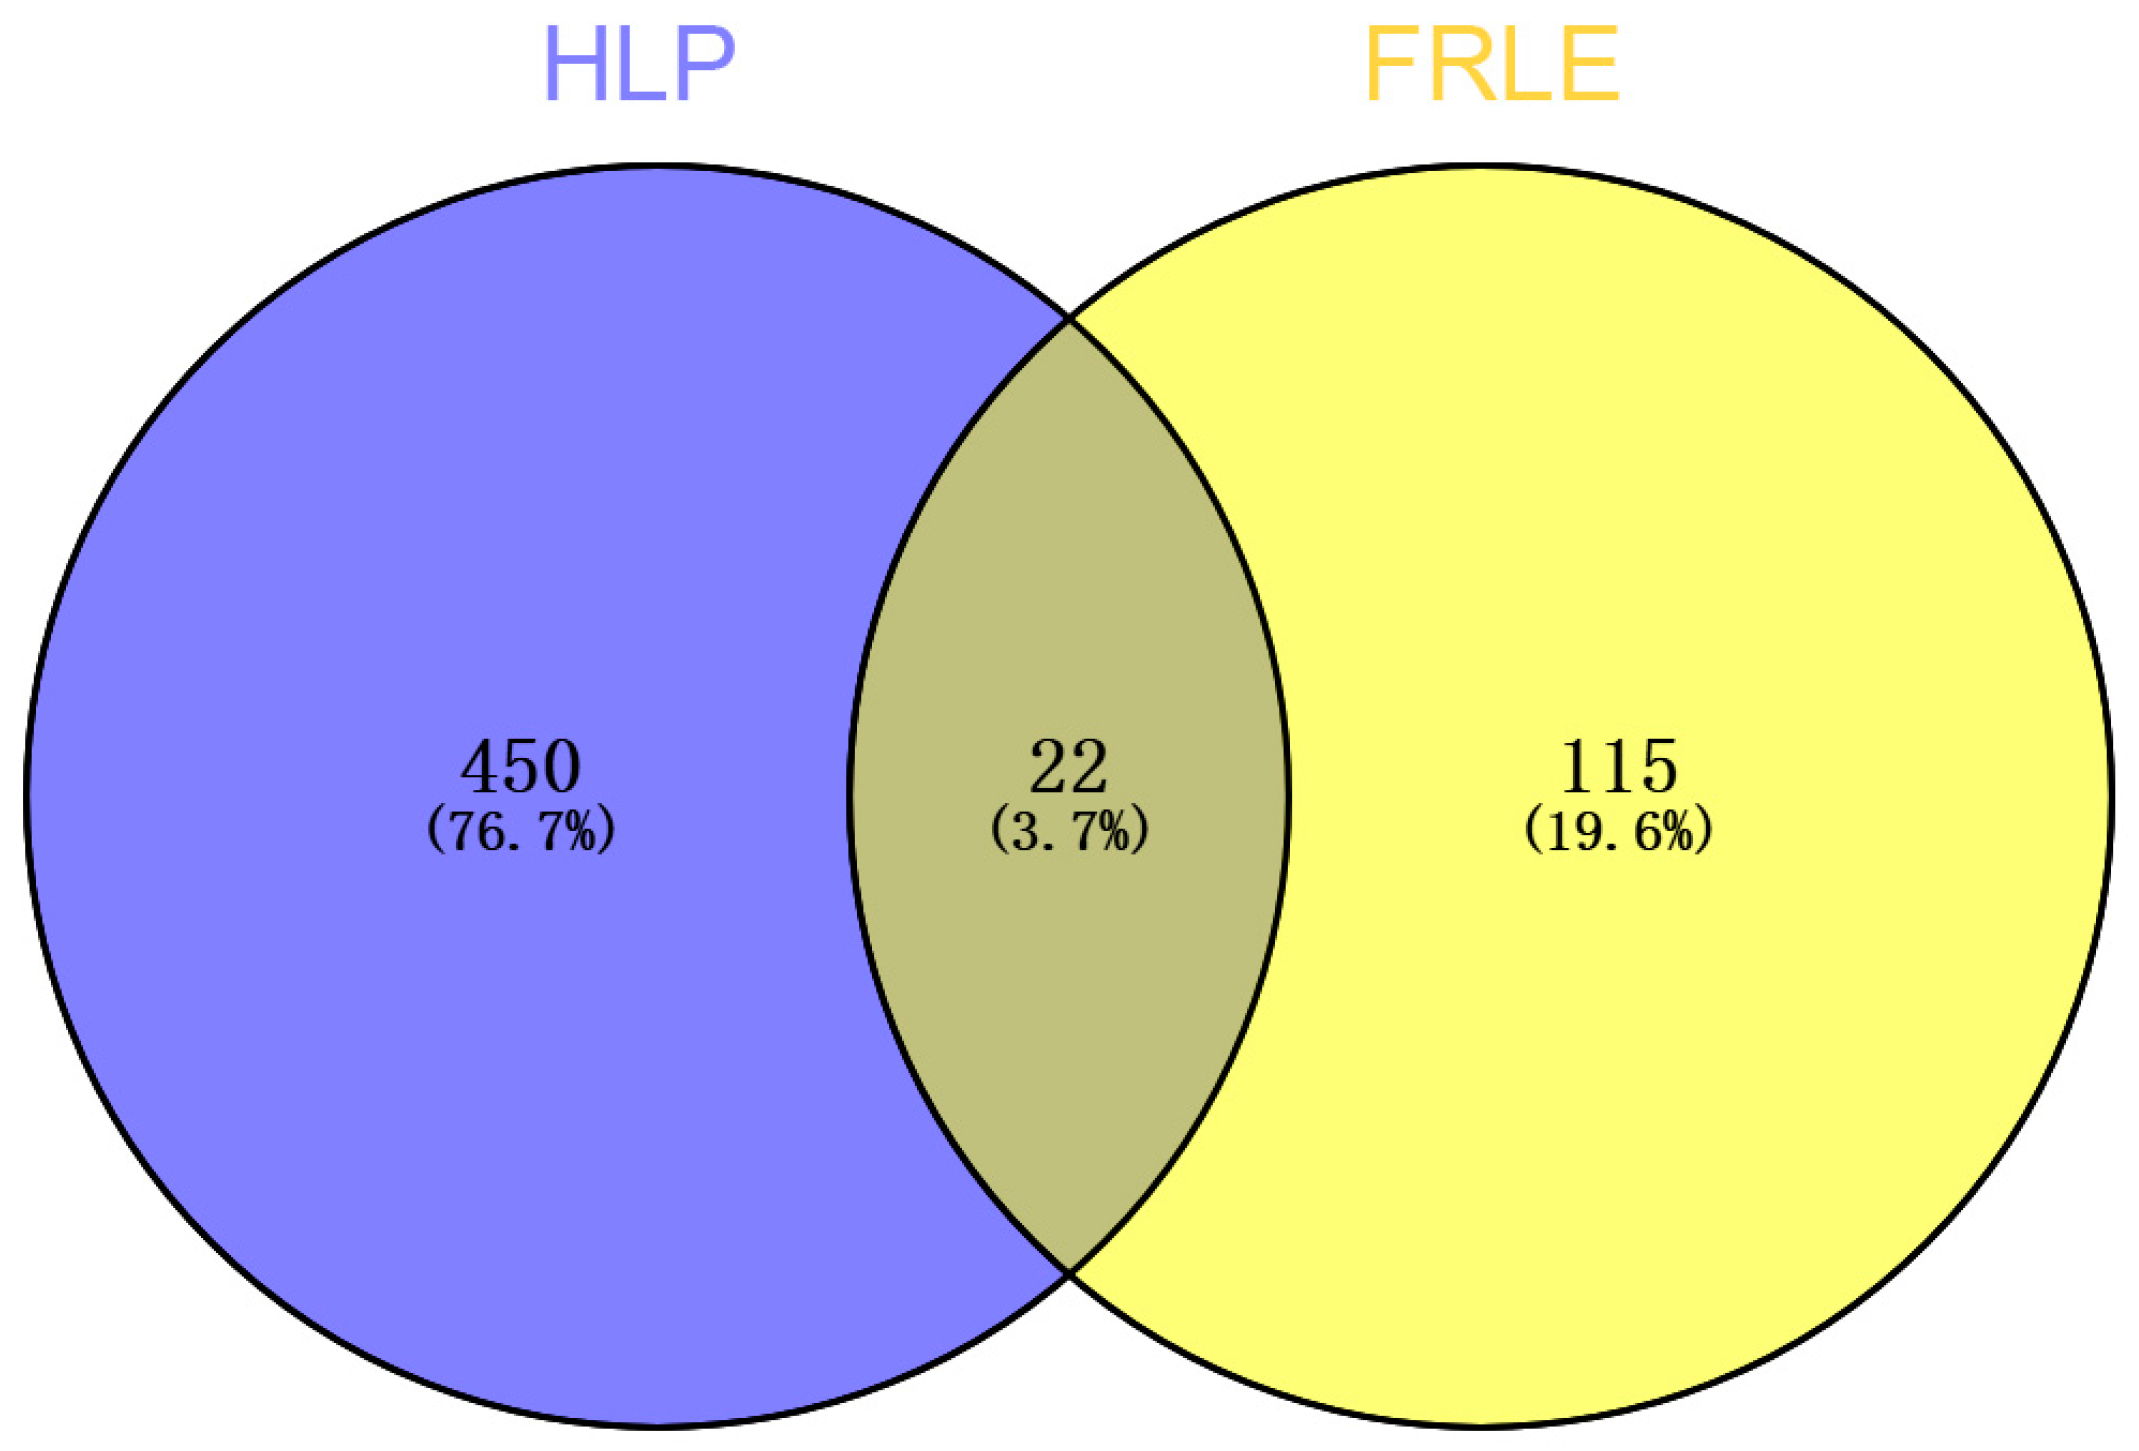
The disease-target dataset for HLP comprised 472 targets, while the constituent-target dataset for FRLE included 137 targets. Using the Venny 2.1.0 tool, 22 overlapping targets were identified as the core therapeutic candidates (Figure 8). These intersection targets included PPARA, HSD11B1, ABCB1, CYP19A1, PYGL, TNF, PPARG, ACHE, MPO, SELP, NR1H4, ESR1, PTGS2, CASP1, ESRRA, AHR, ESR2, ALOX5, LTB4R, CYP2D6, SERPINB2, and SERPIND1.
Figure 8.
Common targets of HLP and FRLE targets.
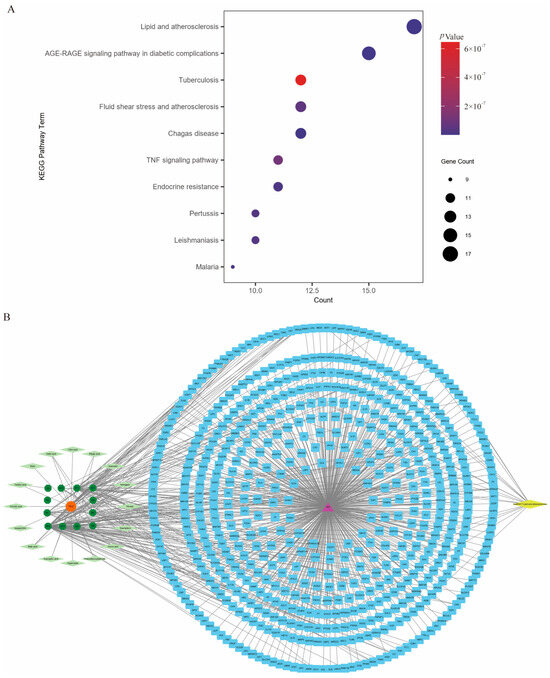
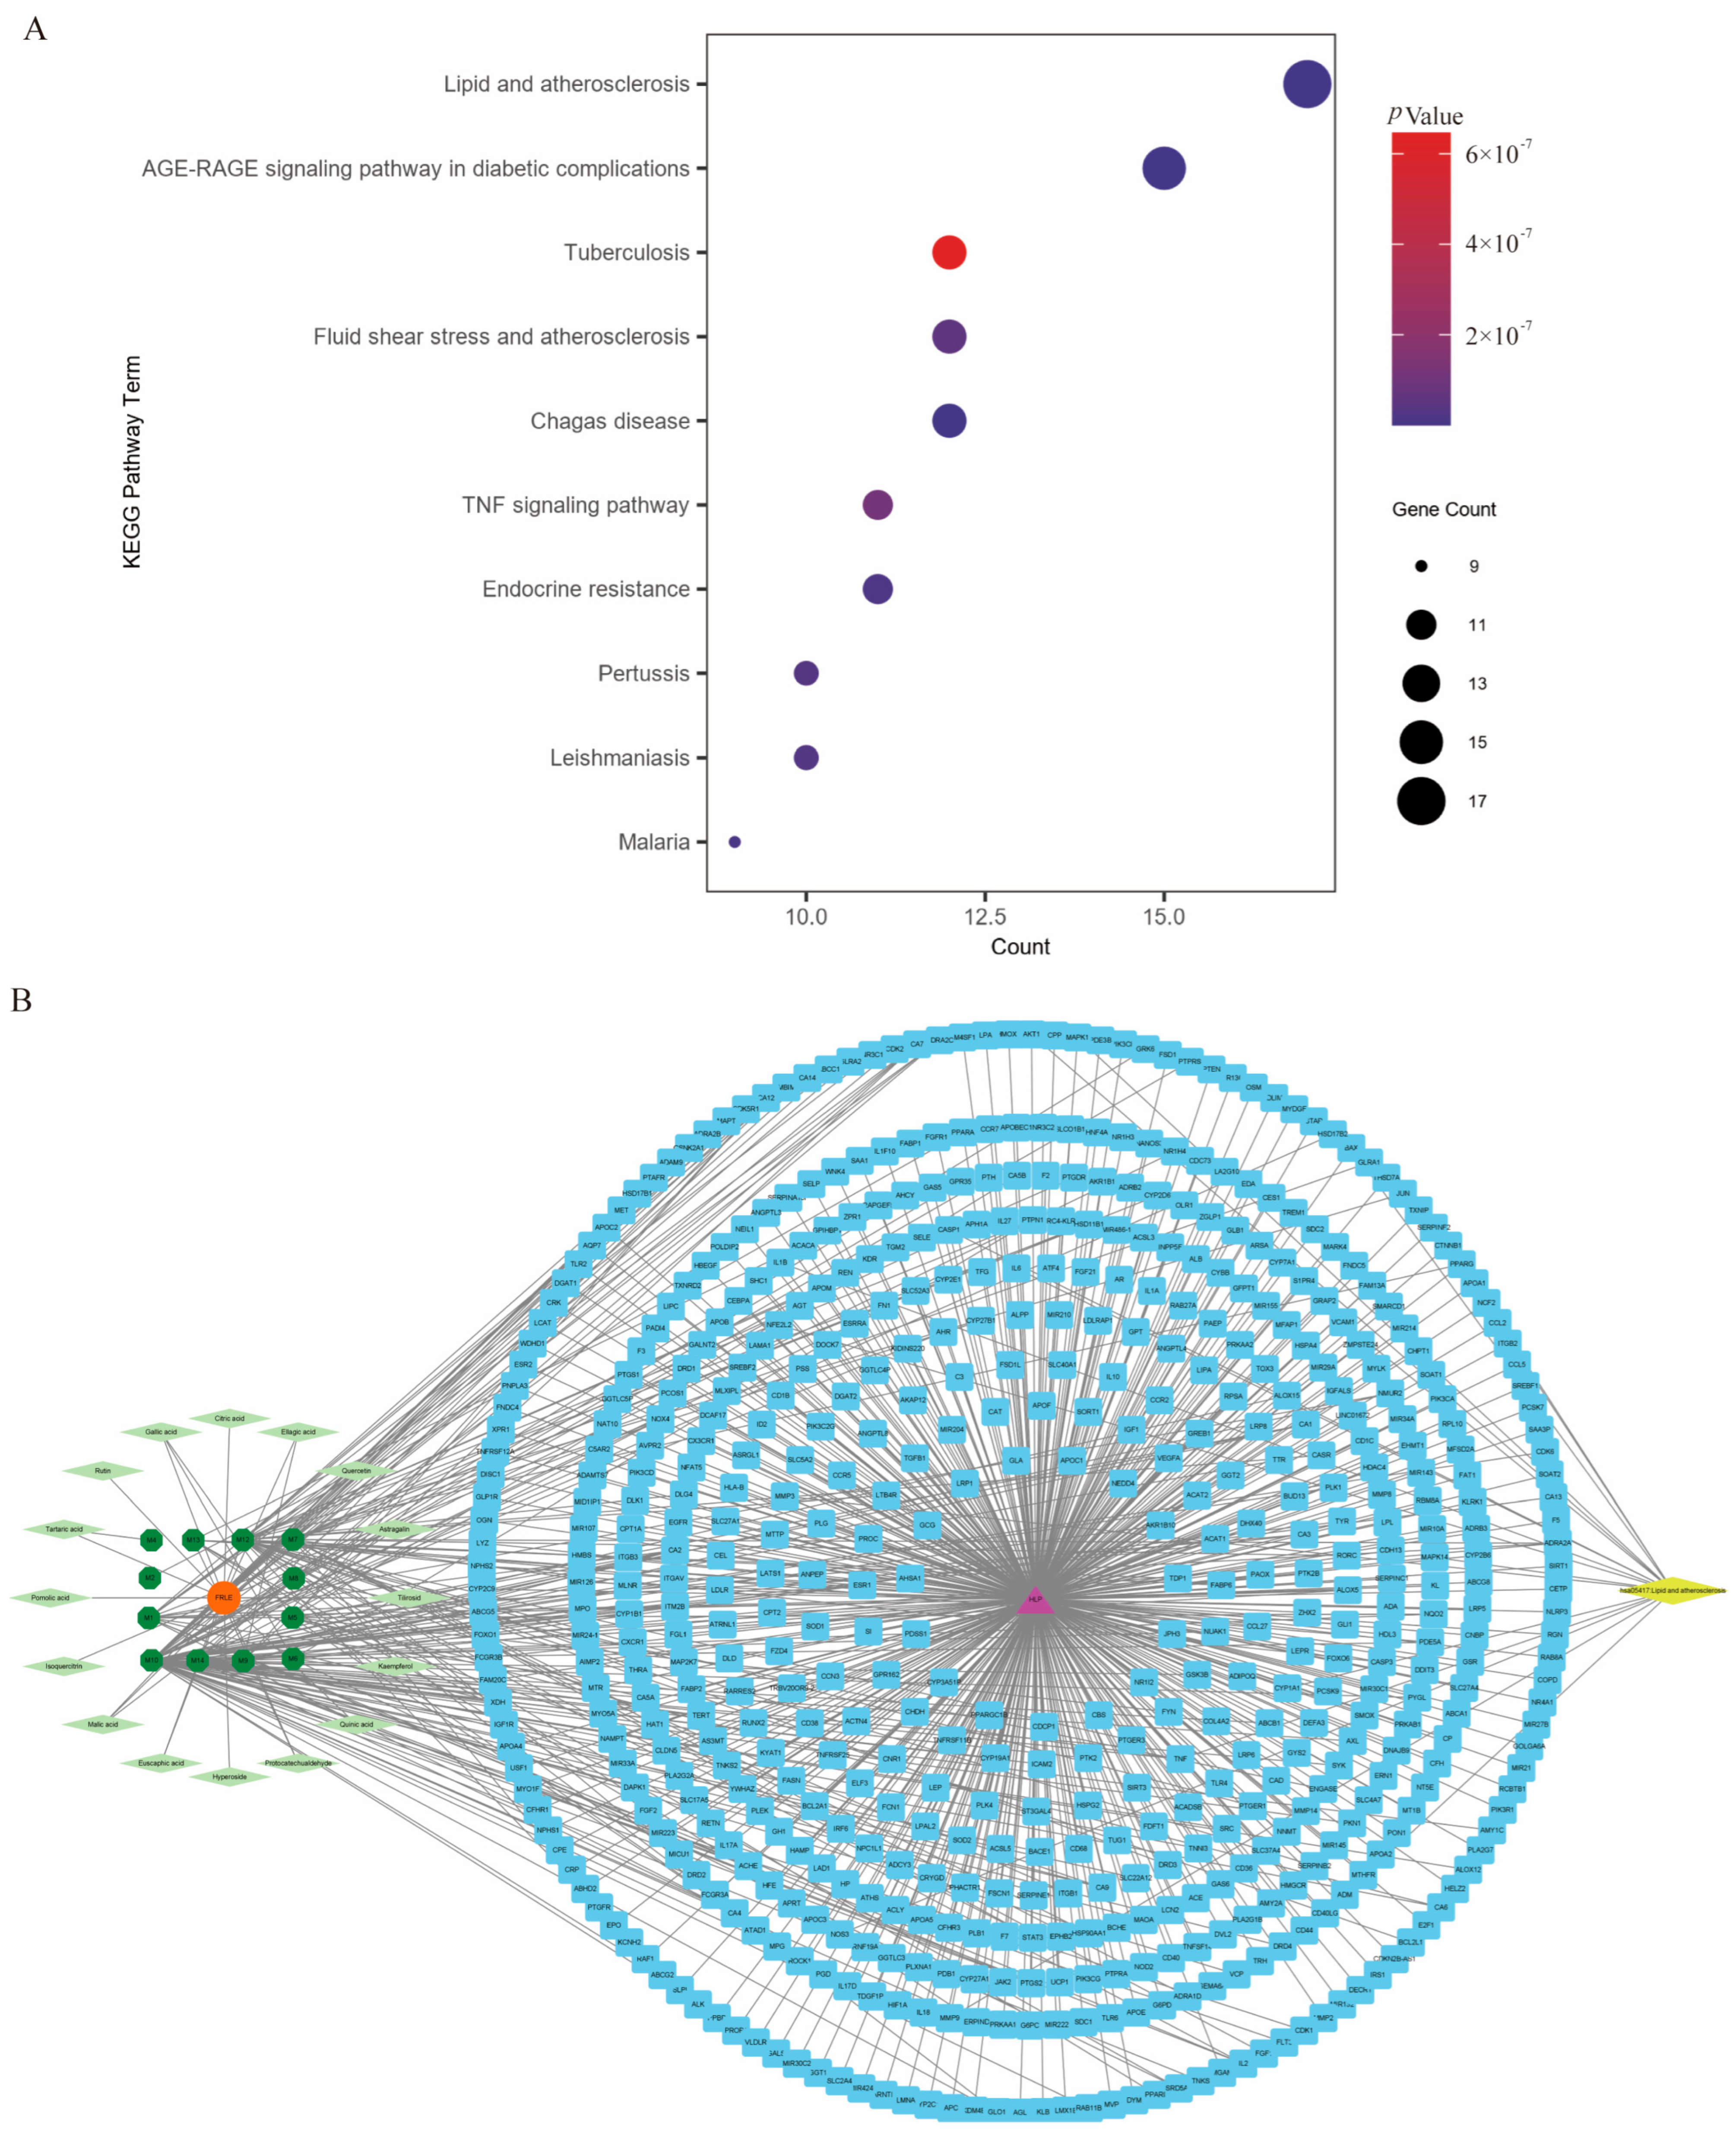
KEGG pathway enrichment analysis was performed on these common targets. The pathway with the lowest p-value (FDR < 0.01) and highest count, “Lipid and atherosclerosis” (hsa05417), was identified as the primary therapeutic pathway (Figure 9A). Further analysis revealed 17 common targets between the identified intersection targets and the genes involved in this specific pathway, namely VCAM1, NOS3, MMP3, MAPK14, TNF, MMP9, IL6, CD40LG, IL1B, CASP1, CYP1A1, BAX, CCL2, AKT1, MAPK1, PPARG, and NFE2L2. Construct the constituent-target-pathway diagram (Figure 9B).
Figure 9.
Network pharmacology analysis of FRLE in the treatment of HLP. (A) Top 10 KEGG pathways enrichment. (B) Drug-component-disease-target-pathway network diagram.
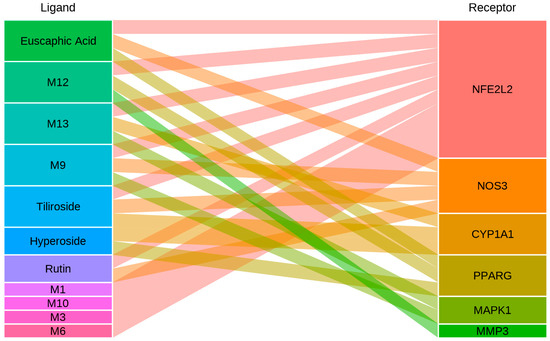
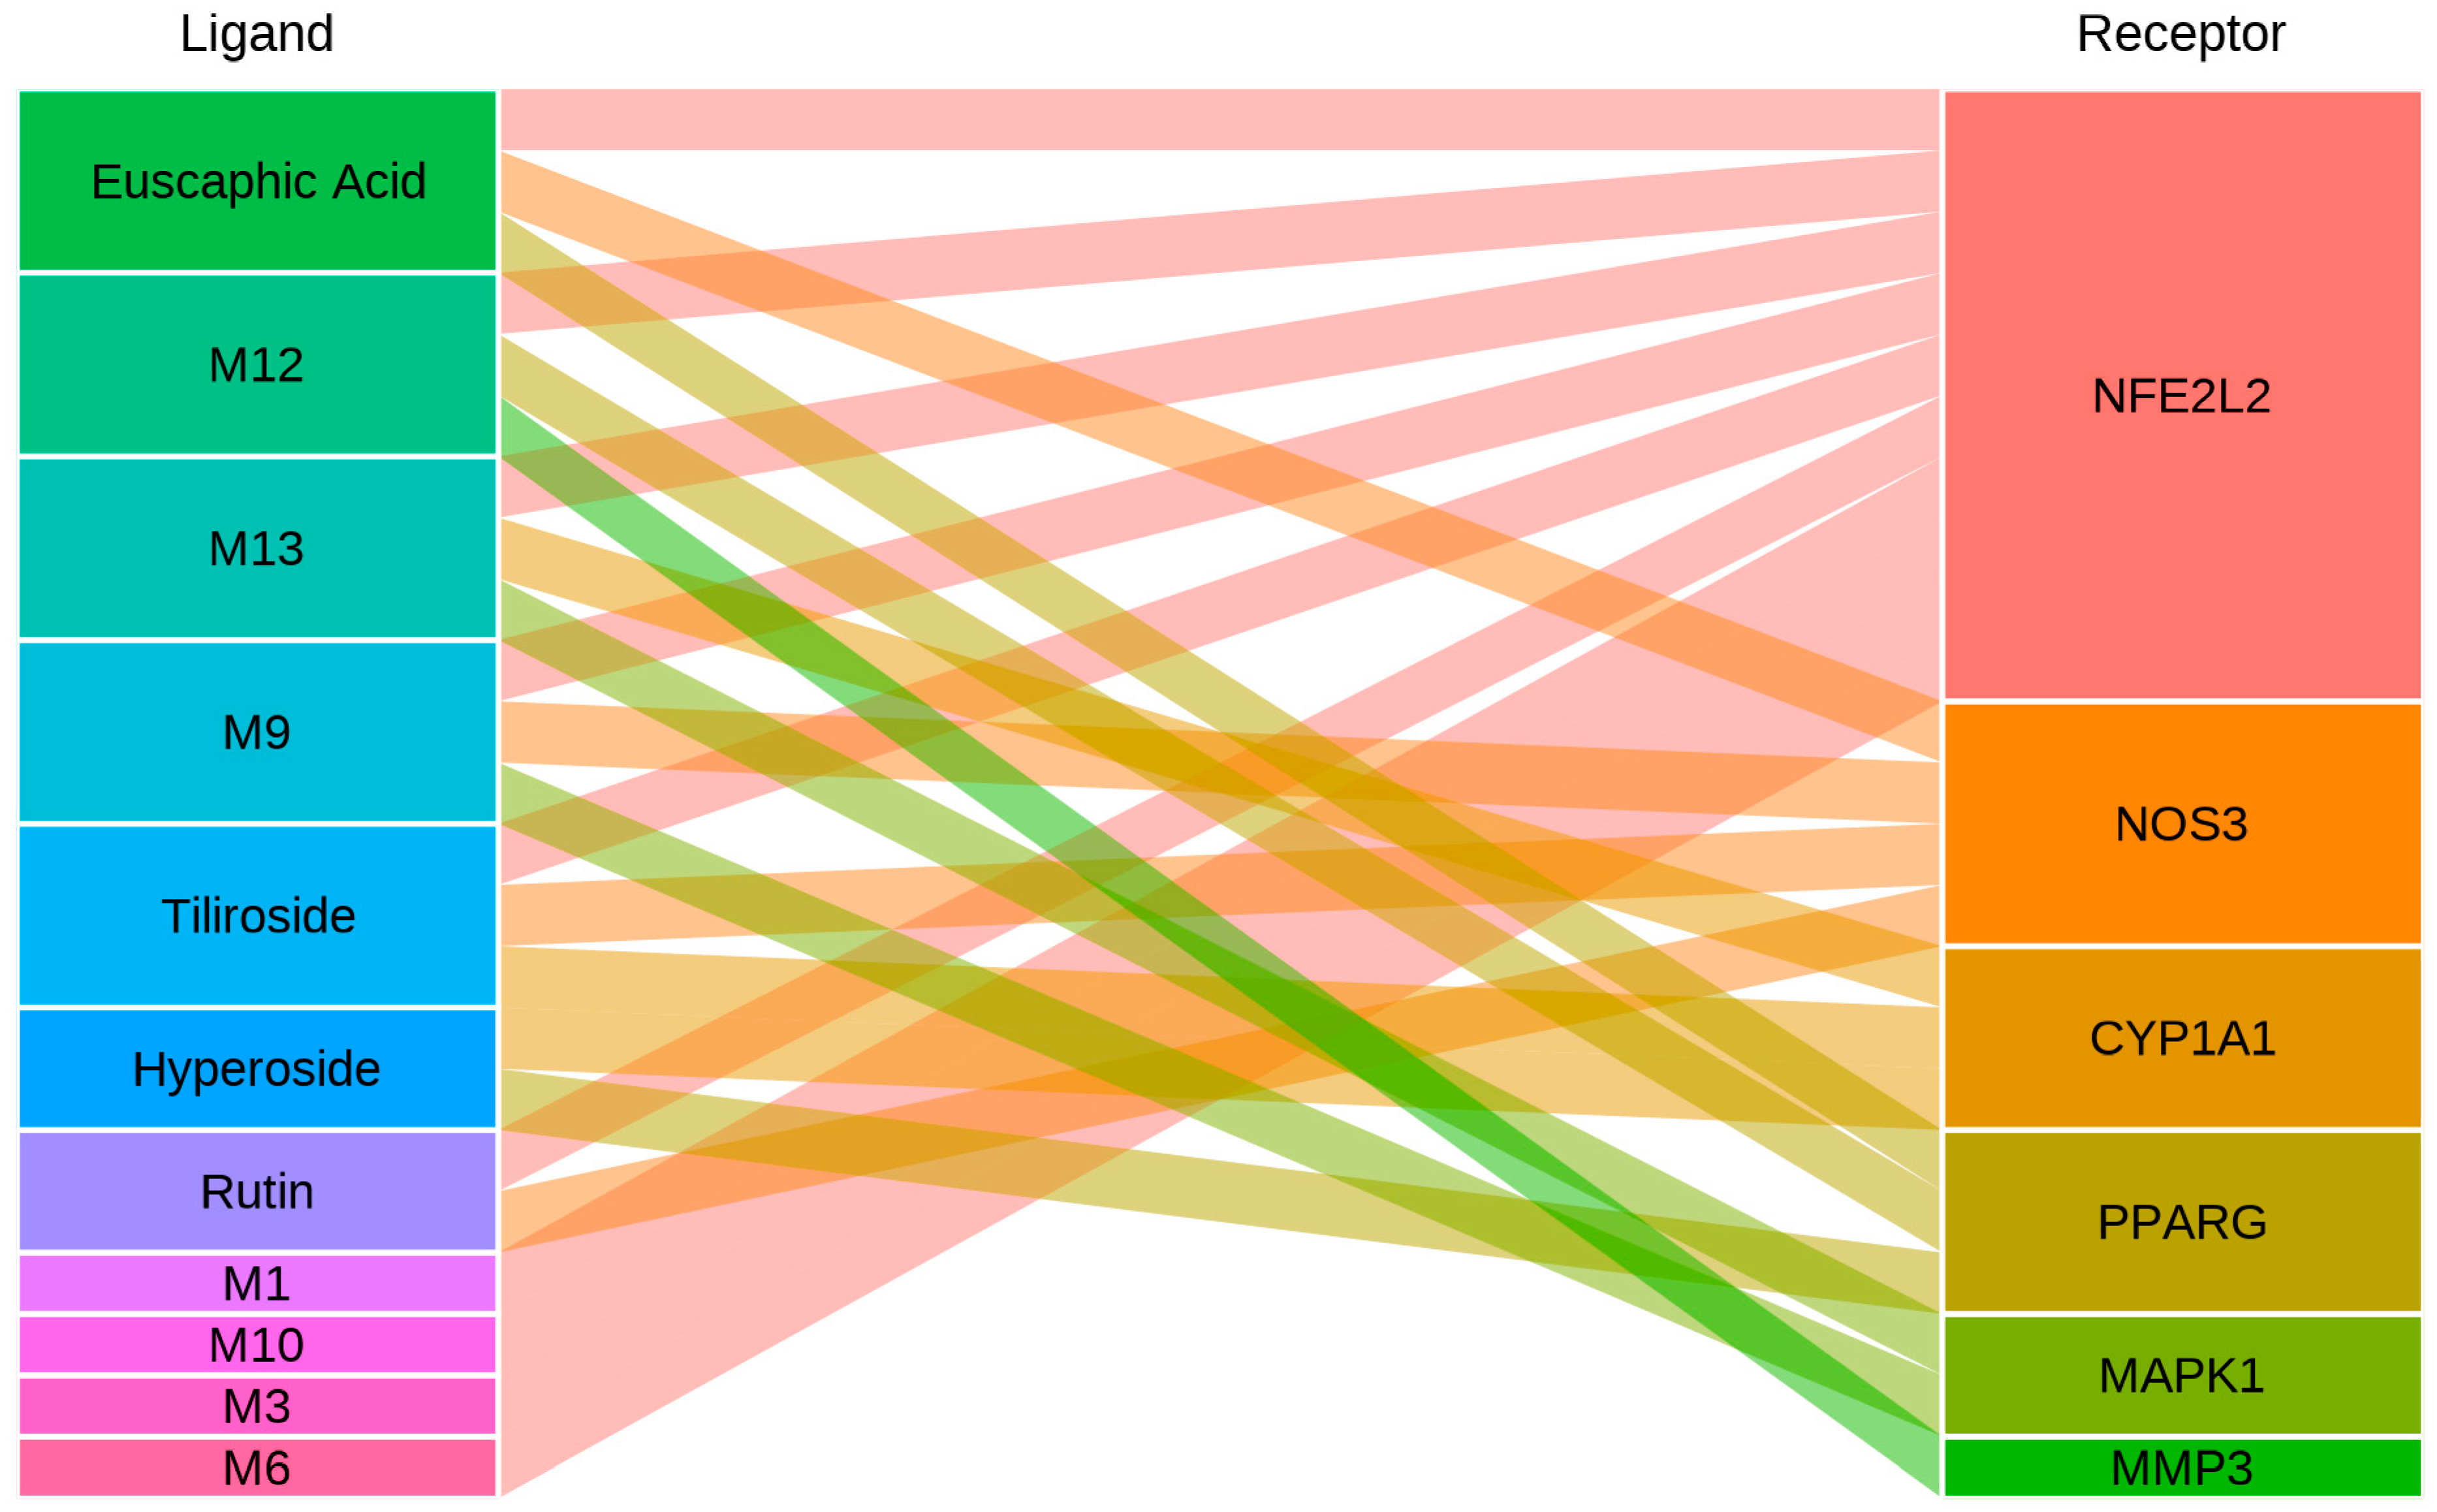
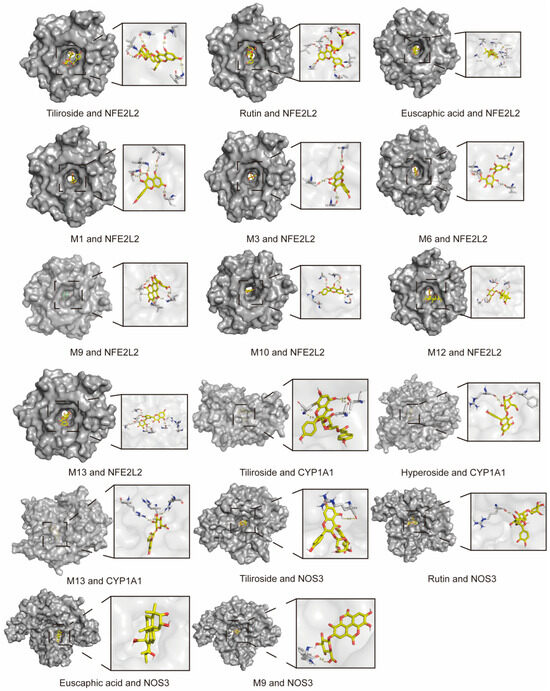
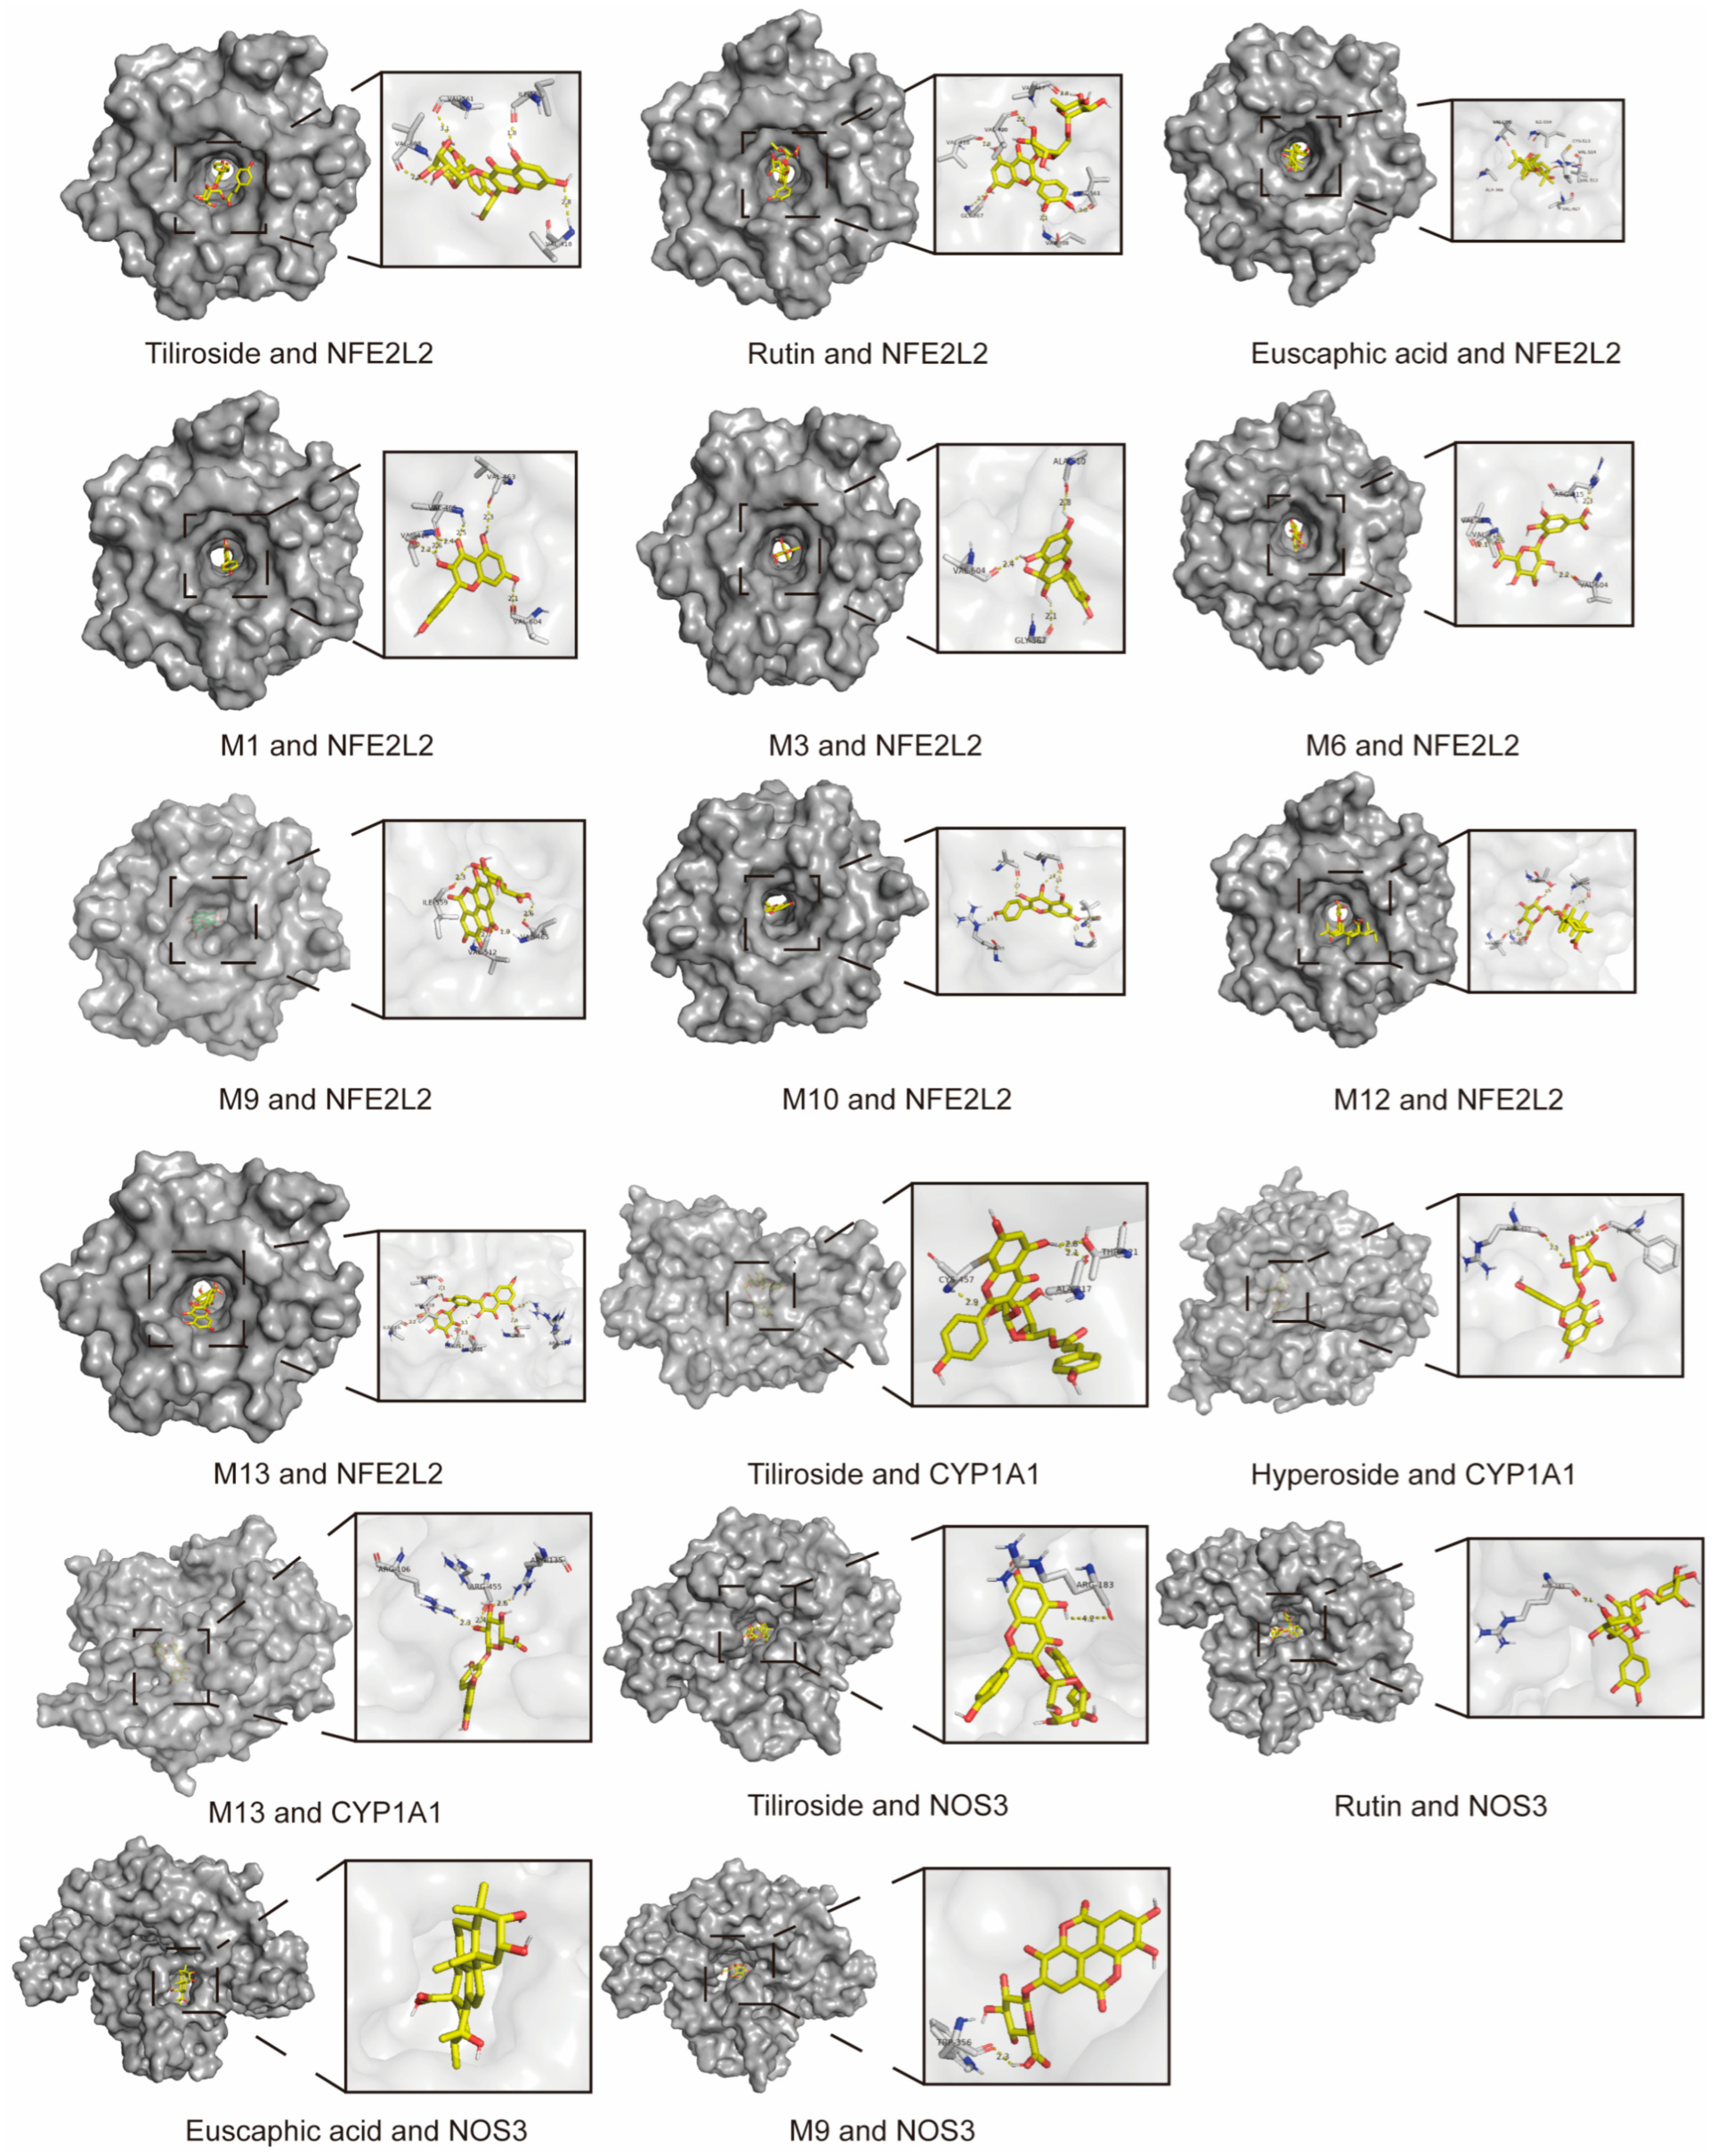
Molecular docking was employed to evaluate the binding affinities between the constituents and the key targets (Table 6). The docking results were ranked by binding energy, and interactions with energy values −9 kcal/mol were prioritized. Based on the frequency of occurrence among high-affinity ligand-receptor pairs, the top five targets—NFE2L2, NOS3, CYP1A1, PPARG, and MAPK1—were selected as the key candidates for subsequent Western blot validation. Detailed docking parameters and visual configurations are summarized in Table 7 and Figure 10.
Table 6.
Detailed grid box parameters and coordinates for molecular docking receptors.
Table 7.
Molecular docking results.
Figure 10.
Results of molecular docking results with binding energy −9 kcal/mol.
3.8. Western Blotting Analysis Results
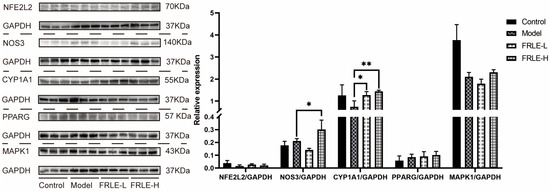
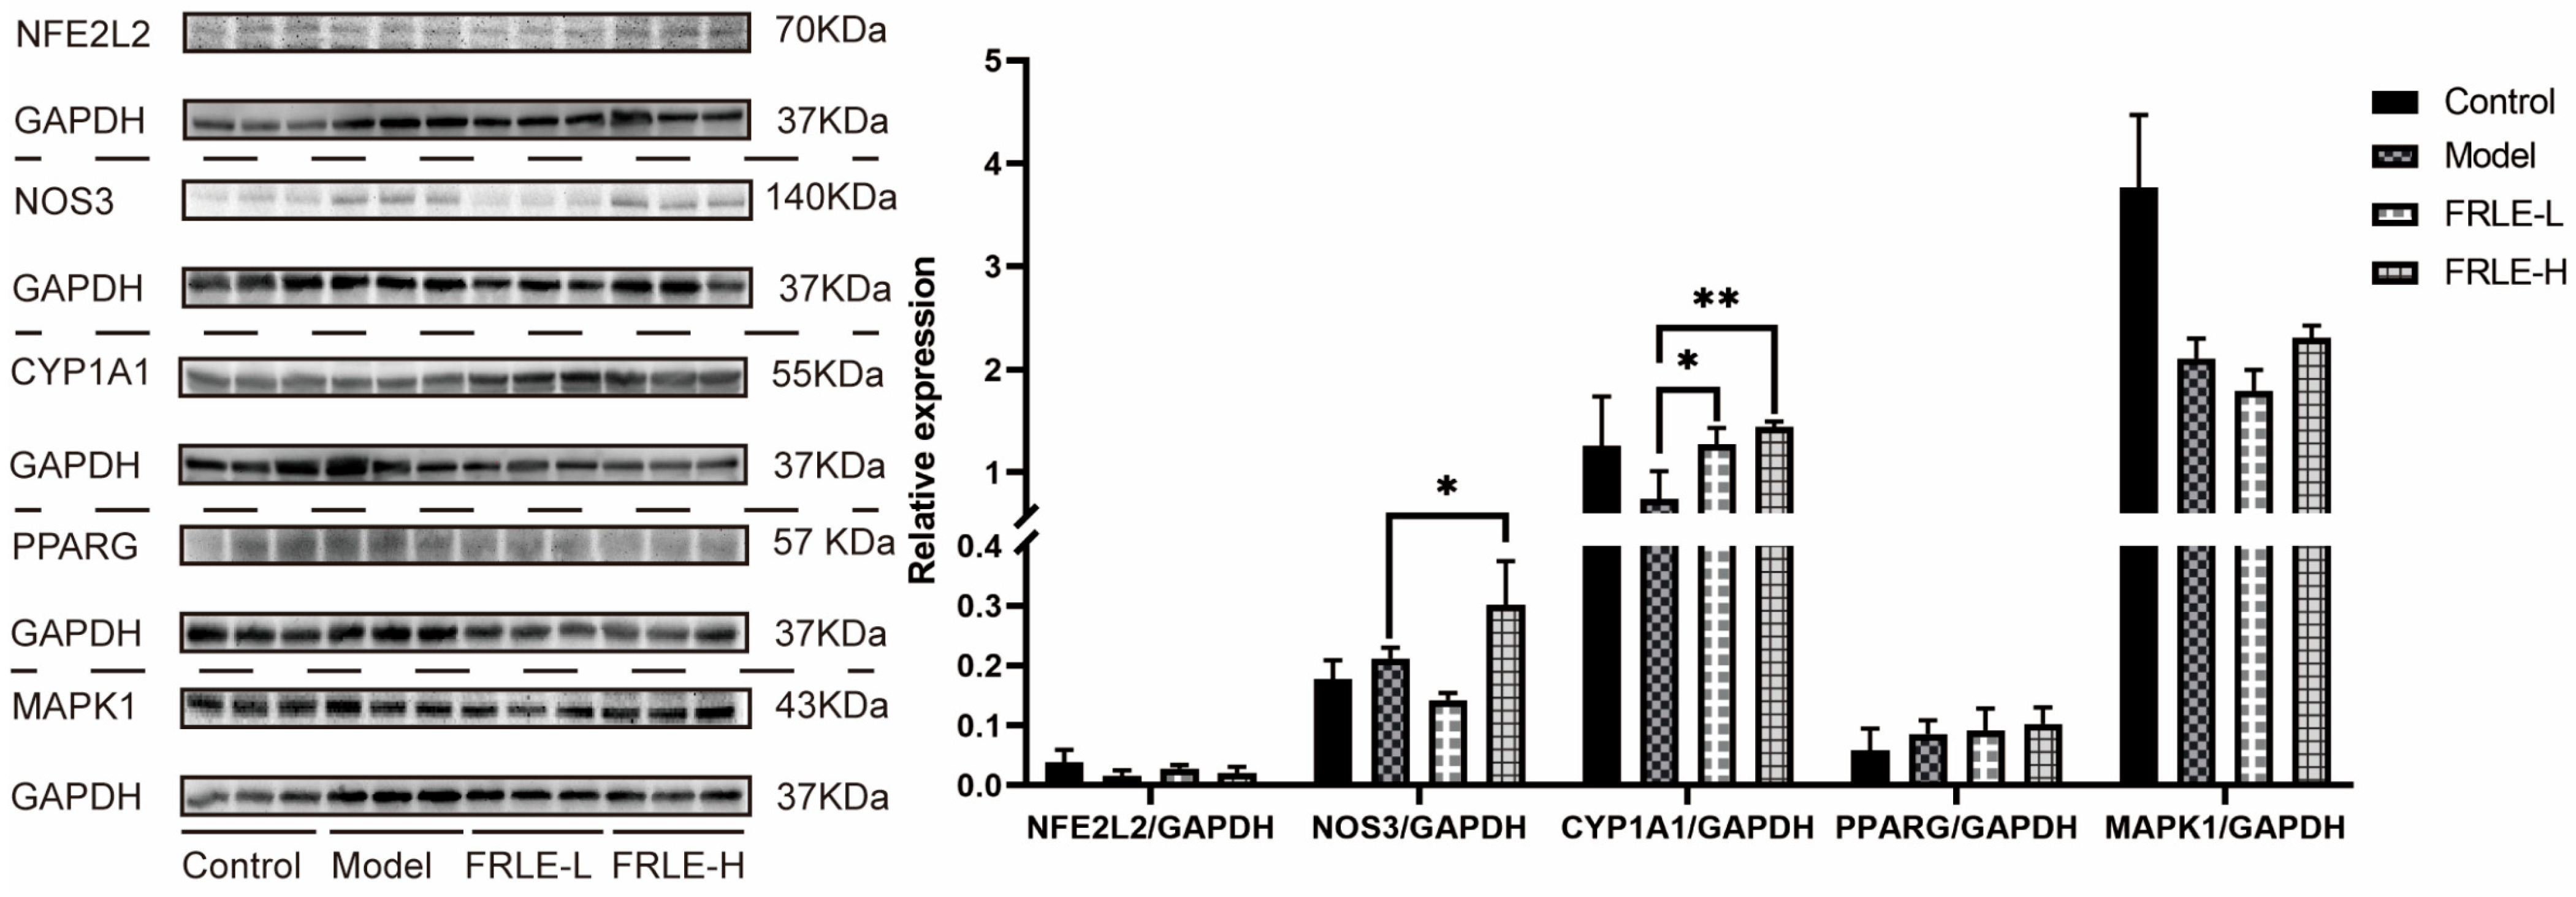
The results of the Western blotting analysis are illustrated in Figure 11. Compared to the model group, although NFE2L2 expression showed a slight upward trend in both the FRLE-L and FRLE-H groups, the differences did not reach statistical significance (p > 0.05), suggesting that further validation with larger sample sizes may be warranted. For NOS3 (eNOS), a marginal, non-significant decrease in expression was observed in the FRLE-L group (p > 0.05), whereas a significant up-regulation was detected in the FRLE-H group (p < 0.05). Regarding CYP1A1, both the FRLE-L and FRLE-H groups exhibited significantly elevated expression levels compared to the model group (p < 0.05). Similarly, the expression of PPARG showed an upward trend in both FRLE-treated groups, yet no statistically significant difference was established (p > 0.05). Finally, for MAPK1, a minor decrease in expression was noted in the FRLE-L group while an increase was found in the FRLE-H group; however, neither change was statistically significant (p > 0.05), indicating these variations might represent non-significant fluctuations rather than definitive treatment effects.
Figure 11.
Western blot results (n = 3, *: FRLE-L group and FRLE-H group vs. model group, p < 0.05, **: p < 0.01).
3.9. Analysis of Ligand-Receptor Binding Modes
Molecular docking simulations revealed that euscaphic acid, tiliroside, hyperoside, rutin, and metabolites M1, M3, M6, M9, M10, M12, and M13 successfully docked into the active pockets of NFE2L2, NOS3, CYP1A1, and PPARG. The binding stability was primarily mediated by diverse intermolecular forces, including hydrogen bonding, -alkyl interactions, -sigma interactions, - stacking, and -anion interactions. These interactions facilitate robust ligand-receptor recognition and binding, providing a structural basis for their biological activities (Figure 12).
Figure 12.
Analysis of ligand-receptor binding mode.
4. Discussion
This study confirms that the types and levels of secondary metabolites in FRL are closely related to their growth environments. UPLC-QTOF-MS analysis demonstrated that FRL from Yamalike Mountain possesses the greatest chemical diversity, significantly surpassing samples from the Botanical Garden. This variation likely stems from the semi-alpine habitat of Yamalike Mountain, where the substantial diurnal temperature range promotes the accumulation of secondary metabolites [32,33,34,35]. In contrast, excessive anthropogenic interventions in the Botanical Garden, such as pruning and intensive irrigation, may lead to the dilution or loss of specific constituents [36,37,38]. It is worth noting that the selection of Yamalike Mountain samples as the primary material for downstream pharmacological experiments was an analytical choice driven by chemical diversity and marker abundance, rather than a pre-demonstrated superiority in biological efficacy. Because the Yamalike Mountain samples possessed the most diverse array and the highest abundance of high-response differential constituents, utilizing this origin maximized our capacity to qualitatively and quantitatively characterize the comprehensive chemical profile of FRLE via UPLC-QTOF-MS. Characterizing such a highly enriched chemical repertoire is a crucial prerequisite for network pharmacology, ensuring that a wider spectrum of potential bioactive components can be captured and evaluated during subsequent target prediction and mechanism elucidation.
The complexity of TCM, characterized by numerous isomers, poses a risk of false positives when relying solely on MS spectral matching. To address this, we established an in-house library integrating RT of reference standards and employed a dual-verification strategy using MSE and DDA modes. This approach overcomes the limitations of RT variability and significantly enhances the accuracy of isomer identification, providing a high-fidelity chemical foundation for studying the pharmacodynamic basis of FRLE.
In conventional HLP models, TG levels typically increase while HDL-C levels decrease. However, our model group exhibited unexpected trends. The observed decrease in TG may be attributed to an increase in intrahepatic TG synthesis, which consequently lowers peripheral blood TG levels [39]. Furthermore, while HDL-C is traditionally viewed as “good cholesterol”, recent studies suggest that excessively high levels do not necessarily confer cardiovascular protection [40,41,42]. In this study, FRLE intervention maintained HDL-C at levels consistent with the control group. This indicates that FRLE exerts a cardiovascular protective effect by normalizing or correcting abnormally elevated HDL-C levels. Ultimately, the absence of significant differences in TG and HDL-C between the treatment groups and the control group suggests that FRLE effectively maintains these parameters within a normal physiological range.
PCA revealed significant chemical variations among FRL from Yamalike Mountain, Hotan, and Altay; however, all three samples significantly reduced TC levels in HLP mice, suggesting that common constituents drive the cholesterol-lowering effect. The pharmacodynamic distinction lies in the lack of LDL-C-lowering efficacy in the Hotan sample, whereas Altay and Yamalike Mountain samples showed similar performance in reducing LDL-C and maintaining HDL-C. Therefore, FRL samples with similar primary chemical profiles can be considered viable candidates for anti-HLP drug development.
Using the UPLC-QTOF-MRM method, 20 constituents were quantified in FRLE, and 15 bioactive components were confirmed in rat plasma. These included flavonoid glycosides (rutin, tiliroside, astragalin, hyperoside, isoquercitrin, kaempferol, and kaempferol-3-O-rutinoside), triterpenoid acids (pomolic acid, euscaphic acid, and oleanolic acid), and organic acids (tartaric, citric, malic, quinic, and ellagic acid). Flavonoids are well-documented for their anti-HLP activities, while triterpenoid acids exert anti-HLP effects by inhibiting bile acid transporter [43,44,45,46]. These components constitute the material basis for the therapeutic efficacy of FRLE. Arginine was undetected in plasma, likely because as an essential amino acid, it was rapidly utilized in physiological processes post-absorption. Other components, such as gallic acid, quercetin, and protocatechuic aldehyde, were undetected due to their low initial content and subsequent dilution or rapid metabolism in vivo.
Network pharmacology and molecular docking predicted that the anti-HLP mechanism of FRLE involves 17 key targets (e.g., VCAM1, NOS3, CYP1A1, PPARG, and NFE2L2) within the Lipid and Atherosclerosis pathway (hsa05417). These targets are intricately linked to lipid imbalance, inflammation, oxidative stress, and endothelial dysfunction. Western blot validation further confirmed that the absorbed constituents and their metabolites exert anti-HLP effects by modulating NFE2L2, CYP1A1, NOS3, and MAPK1. Further research is warranted to elucidate the deeper molecular mechanisms involved [47,48,49,50,51].
Finally, a limitation of this study is the relatively small sample size (n = 3) utilized for the Western blotting verification. While n = 3 is a standard convention for preliminary screening in pharmacodynamic studies, it inherently possesses low statistical power. This limitation may account for the observed but statistically non-significant (p > 0.05) regulatory trends in certain protein targets, such as NFE2L2, PPARG, and MAPK1. Future studies with a larger cohort are warranted to comprehensively validate these subtle molecular alterations.
5. Conclusions
In summary, the chemical constituents of FRLE were qualitatively and quantitatively characterized using UPLC-QTOF-MS. Sixty compounds were identified through database matching, 20 of which were further confirmed and quantified using reference standards. PCA revealed significant chemical variations among FRL from different geographical origins, with the Yamalike Mountain sample possessing the most diverse array of differential constituents. Safety evaluations classified FRLE as a low-toxicity product, suitable for potential long-term administration. Pharmacodynamic results demonstrated that FRLE effectively ameliorates TC, HDL-C, and LDL-C levels in HLP mice, exhibiting potent anti-HLP efficacy. Mechanistically, integration of computational predictions and empirical evidence suggests that the absorbed constituents and their metabolites may exert these therapeutic effects by modulating key potential targets, including CYP1A1, NOS3, NFE2L2, and MAPK1. These findings provide a scientific basis for the development of FRLE as a safe and effective candidate for the long-term management of hyperlipidemia.
Author Contributions
Conceptualization, Y.H. and L.T.; methodology, Y.H. and Q.F.; formal analysis, Y.H.; investigation, Y.H.; resources, L.T. and W.Z.; writing—original draft preparation, Y.H.; writing—review and editing, Y.H. and L.T.; visualization, Y.H.; project administration, L.T.; funding acquisition, L.T. All authors have read and agreed to the published version of the manuscript.
Funding
This research was funded by National Natural Science Foundation of China, grant number 82460821.
Institutional Review Board Statement
The animal study protocol was approved by the Animal Ethics Committee of the First Affiliated Hospital of Xinjiang Medical University (protocol code IACUC-20240308-21 and date of approval: 18 March 2024).
Informed Consent Statement
Not applicable.
Data Availability Statement
The original contributions presented in this study are included in the article. Further inquiries can be directed to the corresponding author.
Acknowledgments
The author would like to express his gratitude to Xuexin Yang, an application engineer from Waters Company, and Qi Zhen, a service engineer from the same company, for their assistance in the processing of mass spectrometry data and sample determination; the language polishing assistance provided by Gemini 3 Flash large language model for this article is also acknowledged.
Conflicts of Interest
The authors declare no conflicts of interest.
Appendix A
Figure A1.
The mass spectra and chromatograms of the compounds in the reference substance and the sample. (1) The chromatogram of the reference compound. (2) The chromatogram of the compounds in the sample. (3) The mass spectrum of reference compound. (4) The mass spectrum of the compounds in the sample.
Appendix B
Figure A2.
Chromatogram of blood-entering components (A) Chromatogram of blank plasma spiked with reference substances. (B) Chromatogram of compounds in the drug-containing plasma.
Appendix C
Figure A3.
Compound in vivo metabolic product mass spectrum.
References
- Stewart, J.; McCallin, T.; Martinez, J.; Chacko, S.; Yusuf, S. Hyperlipidemia. Pediatr. Rev. 2020, 41, 393–402. [Google Scholar] [CrossRef] [Scilit]
- Zhang, T.; Li, T.; Jin, P. Global, Regional, and National Burden of Cardiovascular Disease Attributable to Kidney Dysfunction (1990–2021) with Projections to 2050: Analysis of the 2021 Global Burden of Disease Study. Ren. Fail. 2025, 47, 2472039. [Google Scholar] [CrossRef] [Scilit]
- García-Fernández-Bravo, I.; Torres-Do-Rego, A.; López-Farré, A.; Galeano-Valle, F.; Demelo-Rodriguez, P.; Alvarez-Sala-Walther, L.A. Undertreatment or Overtreatment with Statins: Where Are We? Front. Cardiovasc. Med. 2022, 9, 808712. [Google Scholar] [CrossRef] [Scilit]
- Newman, C.B.; Preiss, D.; Tobert, J.A.; Jacobson, T.A.; Page, R.L.; Goldstein, L.B.; Chin, C. Statin Safety and Associated Adverse Events: A Scientific Statement from the American Heart Association. Arterioscler. Thromb. Vasc. Biol. 2019, 39, E38–E81. [Google Scholar] [CrossRef] [Scilit]
- Mulchandani, R.; Lyngdoh, T.; Kakkar, A.K. Statin Use and Safety Concerns: An Overview of the Past, Present, and the Future. Expert Opin. Drug Saf. 2020, 19, 1011–1024. [Google Scholar] [CrossRef] [Scilit]
- Lioudaki, E.; Ganotakis, E.S.; Mikhailidis, D.P. Ezetimibe; More than a Low Density Lipoprotein Cholesterol Lowering Drug? An Update after 4 Years. Curr. Vasc. Pharmacol. 2011, 9, 62–86. [Google Scholar] [CrossRef] [Scilit] [PubMed]
- Schwarz, U.L. Intestinal and Hepatic Drug Transporters and Their Role in the Disposition of Lipid-Lowering Drugs. Ph.D. Thesis, The University of Western Ontario, London, ON, Canada, 2012. [Google Scholar]
- Blais, J.E.; Tong, G.K.Y.; Pathadka, S.; Mok, M.; Wong, I.C.K.; Chan, E.W. Comparative Efficacy and Safety of Statin and Fibrate Monotherapy: A Systematic Review and Meta-Analysis of Head-to-Head Randomized Controlled Trials. PLoS ONE 2021, 16, e0246480. [Google Scholar] [CrossRef] [Scilit]
- Xu, X.; Bahargul, H.; Jia, X.G. Kazakh Materia Medica, 1st ed.; Ethnic Publishing House: Beijing, China, 2009. (In Chinese) [Google Scholar]
- Danilova, A.N.; Vdovina, T.A.; Kotukhov, Y.A.; Anufriyeva, O.A.; Vinokurov, A.A.; Isakova, E.A.; Lagus, O.A.; Sumbembayev, A.A. Study of the Geographical Distribution, Ecological–Biological Characteristics, and Economic Value of Rosa acicularis Lindl., Rosa laxa Retz., and Rosa spinosissima L. (Rosaceae) in Kazakhstan’s Part of the Altai Mountains. Diversity 2025, 17, 441. [Google Scholar] [CrossRef] [Scilit]
- Wang, N.; Sun, J.; Zhang, S.; Wang, C.; Tian, L. Microscopic Investigations and Pharmacognostic Techniques for the Standardization of the Fruits of Rosa laxa Retz. Microsc. Res. Tech. 2022, 85, 1035–1045. [Google Scholar] [CrossRef] [Scilit] [PubMed]
- Zhang, P.; Zhang, D.; Zhou, W.; Wang, L.; Wang, B.; Zhang, T.; Li, S. Network Pharmacology: Towards the Artificial Intelligence-Based Precision Traditional Chinese Medicine. Brief. Bioinform. 2023, 25, bbad518. [Google Scholar] [CrossRef] [Scilit]
- Shang, L.; Wang, Y.; Li, J.; Zhou, F.; Xiao, K.; Liu, Y.; Zhang, M.; Wang, S.; Yang, S. Mechanism of Sijunzi Decoction in the Treatment of Colorectal Cancer Based on Network Pharmacology and Experimental Validation. J. Ethnopharmacol. 2023, 302, 115876. [Google Scholar] [CrossRef] [Scilit] [PubMed]
- McNutt, A.T.; Francoeur, P.; Aggarwal, R.; Masuda, T.; Meli, R.; Ragoza, M.; Sunseri, J.; Koes, D.R. GNINA 1.0: Molecular Docking with Deep Learning. J. Cheminformatics 2021, 13, 43. [Google Scholar] [CrossRef] [Scilit]
- Wang, N.; Tong, Z.; Wang, D.; Zhang, Y.; Liu, T. Effects of Hericium Erinaceus Polypeptide on Lowering Blood Lipids of Mice with Hyperlipidemia Induced by a High-Fat Diet. J. Future Foods 2022, 2, 346–357. [Google Scholar] [CrossRef] [Scilit]
- Wu, L.; Guo, X.; Niu, Y.; Li, S.; Jiang, S.; Wang, X.; Gao, Y.; Zhang, S.; Zhou, L.; Yang, L.; et al. Mao Jian Black Tea Ethanol Extract Alleviates Alcoholic Liver Injury in Mice via Regulation of the PI3K/Akt/NF-κB Signaling Pathway. Foods 2025, 14, 3492. [Google Scholar] [CrossRef] [Scilit]
- Djoumbou-Feunang, Y.; Fiamoncini, J.; Gil-De-La-Fuente, A.; Greiner, R.; Manach, C.; Wishart, D.S. BioTransformer: A Comprehensive Computational Tool for Small Molecule Metabolism Prediction and Metabolite Identification. J. Cheminformatics 2019, 11, 2. [Google Scholar] [CrossRef] [Scilit]
- Wishart, D.S.; Tian, S.; Allen, D.; Oler, E.; Peters, H.; Lui, V.W.; Gautam, V.; Djoumbou-Feunang, Y.; Greiner, R.; Metz, T.O. BioTransformer 3.0—A Web Server for Accurately Predicting Metabolic Transformation Products. Nucleic Acids Res. 2022, 50, W115–W123. [Google Scholar] [CrossRef] [Scilit]
- Wang, F.; Allen, D.; Tian, S.; Oler, E.; Gautam, V.; Greiner, R.; Metz, T.O.; Wishart, D.S. CFM-ID 4.0—A Web Server for Accurate MS-Based Metabolite Identification. Nucleic Acids Res. 2022, 50, W165–W174. [Google Scholar] [CrossRef] [Scilit] [PubMed]
- Ru, J.; Li, P.; Wang, J.; Zhou, W.; Li, B.; Huang, C.; Li, P.; Guo, Z.; Tao, W.; Yang, Y.; et al. TCMSP: A Database of Systems Pharmacology for Drug Discovery from Herbal Medicines. J. Cheminformatics 2014, 6, 13. [Google Scholar] [CrossRef] [Scilit]
- Daina, A.; Zoete, V. Testing the Predictive Power of Reverse Screening to Infer Drug Targets, with the Help of Machine Learning. Commun. Chem. 2024, 7, 105. [Google Scholar] [CrossRef] [Scilit]
- Szklarczyk, D.; Kirsch, R.; Koutrouli, M.; Nastou, K.; Mehryary, F.; Hachilif, R.; Gable, A.L.; Fang, T.; Doncheva, N.T.; Pyysalo, S.; et al. The STRING Database in 2023: Protein–Protein Association Networks and Functional Enrichment Analyses for Any Sequenced Genome of Interest. Nucleic Acids Res. 2023, 51, D638–D646. [Google Scholar] [CrossRef] [Scilit]
- Piñero, J.; Ramírez-Anguita, J.M.; Saüch-Pitarch, J.; Ronzano, F.; Centeno, E.; Sanz, F.; Furlong, L.I. The DisGeNET Knowledge Platform for Disease Genomics: 2019 Update. Nucleic Acids Res. 2019, 48, gkz1021. [Google Scholar] [CrossRef] [Scilit]
- Oliveros, J.; Venny, C. An Interactive Tool for Comparing Lists with Venn’s Diagrams. BioinfoGP CNB-CSIC 2007. Available online: https://bioinfogp.cnb.csic.es/tools/venny/ (accessed on 3 March 2025).
- Kanehisa, M.; Furumichi, M.; Sato, Y.; Matsuura, Y.; Ishiguro-Watanabe, M. KEGG: Biological Systems Database as a Model of the Real World. Nucleic Acids Res. 2025, 53, D672–D677. [Google Scholar] [CrossRef] [Scilit]
- Sherman, B.T.; Panzade, G.; Imamichi, T.; Chang, W. DAVID Ortholog: An Integrative Tool to Enhance Functional Analysis through Orthologs. Bioinformatics 2024, 40, btae615. [Google Scholar] [CrossRef] [Scilit]
- Shannon, P.; Markiel, A.; Ozier, O.; Baliga, N.S.; Wang, J.T.; Ramage, D.; Amin, N.; Schwikowski, B.; Ideker, T. Cytoscape: A Software Environment for Integrated Models of Biomolecular Interaction Networks. Genome Res. 2003, 13, 2498–2504. [Google Scholar] [CrossRef] [Scilit] [PubMed]
- Morris, G.M.; Huey, R.; Lindstrom, W.; Sanner, M.F.; Belew, R.K.; Goodsell, D.S.; Olson, A.J. AutoDock4 and AutoDockTools4: Automated Docking with Selective Receptor Flexibility. J. Comput. Chem. 2009, 30, 2785–2791. [Google Scholar] [CrossRef] [Scilit]
- Eberhardt, J.; Santos-Martins, D.; Tillack, A.F.; Forli, S. AutoDock Vina 1.2.0: New Docking Methods, Expanded Force Field, and Python Bindings. J. Chem. Inf. Model. 2021, 61, 3891–3898. [Google Scholar] [CrossRef] [Scilit]
- Schrödinger, LLC. The PyMOL Molecular Graphics System, version 1.8; Schrödinger, LLC: New York, NY, USA, 2015.
- Hossain, S.; Sarkar, B.; Prottoy, M.N.I.; Araf, Y.; Taniya, M.A.; Ullah, M.A. Others Thrombolytic Activity, Drug Likeness Property and ADME/T Analysis of Isolated Phytochemicals from Ginger (Zingiber Officinale) Using in Silico Approaches. Mod. Res. Inflamm. 2019, 8, 29. [Google Scholar] [CrossRef]
- Zandalinas, S.I.; Balfagón, D.; Gómez-Cadenas, A.; Mittler, R. Plant Responses to Climate Change: Metabolic Changes under Combined Abiotic Stresses. J. Exp. Bot. 2022, 73, 3339–3354. [Google Scholar] [CrossRef] [Scilit] [PubMed]
- Laoué, J.; Fernandez, C.; Ormeño, E. Plant Flavonoids in Mediterranean Species: A Focus on Flavonols as Protective Metabolites under Climate Stress. Plants 2022, 11, 172. [Google Scholar] [CrossRef] [Scilit]
- Rienth, M.; Vigneron, N.; Darriet, P.; Sweetman, C.; Burbidge, C.; Bonghi, C.; Walker, R.P.; Famiani, F.; Castellarin, S.D. Grape Berry Secondary Metabolites and Their Modulation by Abiotic Factors in a Climate Change Scenario-a Review. Front. Plant Sci. 2021, 12, 643258. [Google Scholar] [CrossRef] [Scilit]
- Qaderi, M.M.; Martel, A.B.; Strugnell, C.A. Environmental Factors Regulate Plant Secondary Metabolites. Plants 2023, 12, 447. [Google Scholar] [CrossRef] [Scilit] [PubMed]
- Koza, N.A.; Adedayo, A.A.; Babalola, O.O.; Kappo, A.P. Microorganisms in Plant Growth and Development: Roles in Abiotic Stress Tolerance and Secondary Metabolites Secretion. Microorganisms 2022, 10, 1528. [Google Scholar] [CrossRef] [Scilit] [PubMed]
- Zhang, S.; Zhang, L.; Zou, H.; Qiu, L.; Zheng, Y.; Yang, D.; Wang, Y. Effects of Light on Secondary Metabolite Biosynthesis in Medicinal Plants. Front. Plant Sci. 2021, 12, 781236. [Google Scholar] [CrossRef] [Scilit]
- Jamloki, A.; Bhattacharyya, M.; Nautiyal, M.C.; Patni, B. Elucidating the Relevance of High Temperature and Elevated CO2 in Plant Secondary Metabolites (PSMs) Production. Heliyon 2021, 7, e07709. [Google Scholar] [CrossRef] [Scilit]
- Chen, L.-H.; Liang, L.; Zhu, W.-F.; Wang, Y.-M.; Zhu, J.-F. Effects of Intrauterine Growth Restriction and High-Fat Diet on Serum Lipid and Transcriptional Levels of Related Hepatic Genes in Rats. Chin. J. Contemp. Pediatr. 2015, 17, 1124–1130. [Google Scholar]
- Liu, C.; Dhindsa, D.; Almuwaqqat, Z.; Ko, Y.-A.; Mehta, A.; Alkhoder, A.A.; Alras, Z.; Desai, S.R.; Patel, K.J.; Hooda, A.; et al. Association between High-Density Lipoprotein Cholesterol Levels and Adverse Cardiovascular Outcomes in High-Risk Populations. JAMA Cardiol. 2022, 7, 672–680. [Google Scholar] [CrossRef] [Scilit]
- Franczyk, B.; Rysz, J.; Ławiński, J.; Rysz-Górzyńska, M.; Gluba-Brzózka, A. Is a High HDL-Cholesterol Level Always Beneficial? Biomedicines 2021, 9, 1083. [Google Scholar] [CrossRef] [Scilit]
- Trimarco, V.; Izzo, R.; Morisco, C.; Mone, P.; Virginia Manzi, M.; Falco, A.; Pacella, D.; Gallo, P.; Lembo, M.; Santulli, G.; et al. High HDL (High-Density Lipoprotein) Cholesterol Increases Cardiovascular Risk in Hypertensive Patients. Hypertension 2022, 79, 2355–2363. [Google Scholar] [CrossRef] [Scilit]
- Zheng, L.; Lu, Z.; Ma, Y.; Cui, P.; Zhang, X.; Gan, J.; Li, G. Hawthorn Total Flavonoids Ameliorate Hyperlipidemia through AMPK/SREBP1-c and PPARα/PGC-1α/CPT-1A Pathway Activation and Gut Microbiota Modulation. J. Sci. Food Agric. 2025, 105, 4326–4337. [Google Scholar] [CrossRef] [Scilit] [PubMed]
- Deng, M.; Zhang, S.; Dong, L.; Huang, F.; Jia, X.; Su, D.; Chi, J.; Muhammad, Z.; Ma, Q.; Zhao, D.; et al. Shatianyu (Citrus grandis L. Osbeck) Flavonoids and Dietary Fiber in Combination Are More Effective than Individually in Alleviating High-Fat-Diet-Induced Hyperlipidemia in Mice by Altering Gut Microbiota. J. Agric. Food Chem. 2022, 70, 14654–14664. [Google Scholar] [CrossRef] [Scilit] [PubMed]
- Cai, H.; Cheng, Y.; Zhu, Q.; Kong, D.; Chen, X.; Tamai, I.; Lu, Y. Identification of Triterpene Acids in Poria Cocos Extract as Bile Acid Uptake Transporter Inhibitors. Drug Metab. Dispos. Biol. Fate Chem. 2021, 49, 353–360. [Google Scholar] [CrossRef] [Scilit]
- Abou ELA, H.K.; Saeed, R.M.A.; Mazen, G.; Zaghloul, Y.S. Medicinal Utility and Cardiovascular Protection of Pomegranate or Ginger in the Treatment of Diabetic/Obese Rats. J. Sci. Res. Sci. 2024, 41, 215–237. [Google Scholar] [CrossRef] [Scilit]
- Ren, S.; Bian, Y.; Hou, Y.; Wang, Z.; Zuo, Z.; Liu, Z.; Teng, Y.; Fu, J.; Wang, H.; Xu, Y.; et al. The Roles of NFE2L1 in Adipocytes: Structural and Mechanistic Insight from Cell and Mouse Models. Redox Biol. 2021, 44, 102015. [Google Scholar] [CrossRef] [Scilit]
- Shen, W.; Ren, S.; Hou, Y.; Zuo, Z.; Liu, S.; Liu, Z.; Fu, J.; Wang, H.; Yang, B.; Zhao, R.; et al. Single-Nucleus RNA-Sequencing Reveals NRF1/NFE2L1 as a Key Factor Determining the Thermogenesis and Cellular Heterogeneity and Dynamics of Brown Adipose Tissues in Mice. Redox Biol. 2023, 67, 102879. [Google Scholar] [CrossRef] [Scilit]
- Liu, K.; Chen, B.; Zeng, F.; Wang, G.; Wu, X.; Liu, Y.; Li, G.; Yan, J.; Zhang, S. ApoE/NOS3 Knockout Mice as a Novel Cardiovascular Disease Model of Hypertension and Atherosclerosis. Genes 2022, 13, 1998. [Google Scholar] [CrossRef] [Scilit]
- Lu, J.; Shang, X.; Yao, B.; Sun, D.; Liu, J.; Zhang, Y.; Wang, H.; Shi, J.; Chen, H.; Shi, T.; et al. The Role of CYP1A1/2 in Cholesterol Ester Accumulation Provides a New Perspective for the Treatment of Hypercholesterolemia. Acta Pharm. Sin. B 2023, 13, 648–661. [Google Scholar] [CrossRef] [Scilit]
- Martínez-Romero, R.; González-Chávez, S.A.; Urías-Rubí, V.R.; Gómez-Moreno, V.M.; Blanco-Cantero, M.F.; Bernal-Velázquez, H.M.; Luévano-González, A.; Pacheco-Tena, C. Microarray Analysis of Visceral Adipose Tissue in Obese Women Reveals Common Crossroads among Inflammation, Metabolism, Addictive Behaviors, and Cancer: AKT3 and MAPK1 Cross Point in Obesity. J. Obes. 2024, 2024, 4541071. [Google Scholar] [CrossRef] [Scilit]

Disclaimer/Publisher’s Note: The statements, opinions and data contained in all publications are solely those of the individual author(s) and contributor(s) and not of MDPI and/or the editor(s). MDPI and/or the editor(s) disclaim responsibility for any injury to people or property resulting from any ideas, methods, instructions or products referred to in the content. |
© 2026 by the authors. Licensee MDPI, Basel, Switzerland. This article is an open access article distributed under the terms and conditions of the Creative Commons Attribution (CC BY) license.