


Abstract
Background/Objectives: Leprosy is a chronic infection caused by Mycobacterium leprae that, in addition to Schwann cells, macrophages, and adipocytes, also infects human peripheral blood monocytes and subverts their metabolism in its favor. Infection is marked by cholesterol and fatty acid accumulation in lipid droplets (LDs), and a reduction in mitochondrial membrane potential (Δψm). Previous studies showed that M. leprae downregulates adenosine receptor A2A (A2AR) expression in Schwann cells, while activation reduces LD accumulation and bacterial viability. Since A2AR controls immunometabolic response, we investigated whether A2AR signaling restrains M. leprae-driven reprogramming in monocytes. Methods: Peripheral blood mononuclear cells from healthy donors were enriched for monocytes and infected with M. leprae in the presence or absence of adenosinergic modulators (5′AMP, adenosine (ADO), A2AR agonist CGS21680, the antagonist ZM241385, or A2BR antagonist, MRS1754). We used flow cytometry, fluorescence microscopy, and RT-qPCR to evaluate purinergic components expression and bacillary viability. LDs and Δψm were measured by fluorescence microscopy, and extracellular levels of inosine (INO) and hypoxanthine (HPX) by LC-MS/MS. Results: The results show that infection increased CD39, ADA, A2AR and A3R expression, decreased ENT1, A1R and A2BR, and raised extracellular INO and HPX. In addition, 5′AMP, ADO and CGS21680 reversed infection-induced LD accumulation. CGS21680 also restored Δψm and decreased intracellular M. leprae viability. Conclusions: Our data suggest that M. leprae suppresses A2AR signaling to favor its survival in monocytes, indicating that the extracellular ADO–A2AR pathway may be a potential target to limit early M. leprae infection.
1. Introduction
Leprosy is a chronic infectious disease caused by Mycobacterium leprae and Mycobacterium lepromatosis [1]. Each year, over 180,000 new cases occur, mainly in India, Brazil, and Indonesia [2]. In the Americas, Brazil accounts for about 90% of all new cases, reflecting its endemic nature, and the persistence of pediatric cases indicates ongoing community transmission [2]. Leprosy primarily affects skin macrophages and peripheral nerves, leading to chronic inflammation, loss of sensation, muscle weakness, and, if untreated, permanent disabilities [3,4]. Despite advances in diagnosis and treatment, it remains a stigmatized condition that profoundly affects patients’ social participation and quality of life [5].
Although multidrug therapy (MDT) is effective, its prolonged duration remains a major limitation in leprosy control. In 2021, the World Health Organization (WHO) presented the Global Leprosy Strategy 2021–2030 [6], which points out ways to eliminate leprosy as a public health problem. One of the strategies focuses on developing therapies that complement MDT to overcome the challenges posed by drug-resistant strains, prolonged treatment durations, and side effects that can compromise patient adherence and quality of life [6]. M. leprae preferentially infects Schwann cells and skin macrophages [3,4]. More recently, it has also been described to infect and persist inside adipocytes [7]. In addition, monocytes are rapidly recruited to infection sites, peripheral nerves, or subcutaneous white adipose tissue [8,9,10]. Their cellular functions and metabolic processes can be subverted by M. leprae to promote persistence and establish the infection [11,12,13]. For example, M. leprae can inhibit the polarization of monocytes from healthy donors into an M1 macrophage profile. This reduces the secretion of pro-inflammatory cytokines such as IL-6, IL-1β, IL-12p70, and TNF-α, and lowers expression of the M1 markers CCR7 and CD40 [11,12]. It also downregulates the mitochondrial function (Δψm), limits fatty acid oxidation, and contributes to the foamy phenotype induced by infection [13]. Monocyte immunometabolic dysfunction has also been reported in M. tuberculosis and P. falciparum infections, where lipid remodeling, hemozoin-induced oxidative stress, and lipid peroxidation impair antimicrobial functions [14,15]. Thus, human monocytes provide a relevant model system for dissecting early host–pathogen interactions and identifying host-directed strategies for disease control.
A hallmark of M. leprae infection is its ability to subvert the host cell’s lipid metabolism, inducing the formation of lipid droplets (LDs) [16,17,18,19,20], organelles rich in cholesteryl esters and triacylglycerols [19,20], which serve as reservoirs for neutral lipids, playing a vital role in maintaining cellular energy balance, contributing to the evasion mechanisms employed during mycobacterial infection [21]. Our group has demonstrated, through both in vitro and in vivo studies, that treatment with cholesterol biosynthesis inhibitors, such as statins, can reduce LD accumulation and, consequently, intracellular viability of M. leprae [20,22]. Recently, we strengthened this finding by showing that pamidronate, another inhibitor of the mevalonate pathway, also decreased the viability of M. leprae in infected macrophages [23], underscoring the importance of LDs in the persistence of the bacillus. We also observed that M. leprae downregulates adenosine A2A receptor (A2AR) expression in Schwann cells. However, despite this downregulation, activation of this receptor with the selective agonist CGS21680 reduced LD formation in M. leprae-infected Schwann cells, coinciding with decreased intracellular bacillary viability [24].
A2AR is part of the purinergic system, a complex cellular communication network first proposed by Geoffrey Burnstock in 1972 [25]. It consists of extracellular ligands, including nucleotides/nucleosides (e.g., ATP, adenosine (ADO), and inosine (INO); cell-surface receptors, classified into P1 and P2 receptors; and ectoenzymes that control extracellular ligand levels [25]. The P1 receptors are subdivided into A1, A2A, A2B, and A3. A2AR and A2BR are coupled to the stimulatory G protein. In contrast, A1R and A3R are coupled to the inhibitory G protein [26,27]. Although the main ligand of these receptors is ADO, recent studies show that INO can activate some of these receptors, including A2AR [28]. The P2 receptors are classified into two families, P2X and P2Y, and bind nucleotides, such as extracellular ATP [27]. Through these elements, purinergic signaling regulates many cellular functions, such as inflammatory responses, immune activation, and pathogen clearance [29,30]. Among the ectoenzymes of the purinergic system, CD39, also known as ecto-nucleoside triphosphate diphosphohydrolase-1 (ENTPD1), that hydrolysis extracellular ATP and adenosine diphosphate (ADP) into extracellular 5′adenosine monophosphate (5′AMP) [28]. Another ectoenzyme that regulates extracellular nucleotide levels is ecto-5′-nucleotidase CD73 (NT5′E). This enzyme hydrolyzes the extracellular 5′AMP to generate extracellular ADO [31]. Both enzymes are expressed in different cell types, such as immune cells and endothelial cells, and both CD39 and CD73 participate in killing invading pathogens [32,33]. Interestingly, CD39 has been identified as a regulator of the pro-inflammatory response [34], whereas CD73 contributes to lipid metabolism regulation and supports host–pathogen adaptation mechanisms that enhance intracellular persistence of bacterial pathogens [35,36,37].
ADO is an immunomodulatory molecule [38,39,40] that, in the extracellular microenvironment, regulates lipolysis, cholesterol efflux, and LD formation, suggesting its involvement in lipid metabolism and energy homeostasis [41,42,43,44,45]. The levels of extracellular ADO are regulated by adenosine deaminase (ADA), which deaminates ADO into inosine (INO) [46]. In leprosy, elevated ADA activity, particularly during reactional episodes, supports the notion that purine metabolism is dynamically regulated during disease progression [47,48]. INO extracellular levels can be regulated by ectoenzyme purine nucleoside phosphorylase (ecto-PNP), which metabolizes INO into hypoxanthine (HPX) [49]. Further, adenosine transporters, such as equilibrative nucleoside transporters (ENTs), including ENT1, mediate the reuptake of ADO, INO, and HPX into cells, thereby regulating their extracellular concentrations [50]. The regulation of extracellular ADO levels has been shown to dampen inflammation, promote an immunosuppressive microenvironment, and aid the establishment of infections by Mycobacterium tuberculosis, Leishmania spp., Toxoplasma gondii, Streptococcus pneumoniae, Salmonella, and Plasmodium sp. [30,51,52]. In this context, activation of the A2AR has been associated with the regulation of host cell responses, contributing to the elimination of Candida albicans and M. leprae [24,53]. Furthermore, A2AR activation has been associated with reduced intracellular cholesterol levels, a mitoprotective effect, and an increase in Δψm [43,44,45].
In this study, we aimed to investigate how M. leprae regulates purinergic signaling in monocytes and how this influences host metabolic reprogramming and bacterial persistence. Our data showed that M. leprae infection increased the expression of the ectoenzymes CD39, CD73, and ADA, leading to increased extracellular levels of INO and HPX. Infection also increased A2AR expression, and its activation reversed LD accumulation and decreased the intracellular viability of M. leprae. Furthermore, we identify A2AR involvement in reversing the Δψm downregulation induced by M. leprae infection. These findings provide new insights into the pathogenesis of leprosy and suggest that the A2AR is a promising target for complementary therapeutic strategies.
2. Materials and Methods
2.1. Mycobacterium Leprae
Live Mycobacterium leprae (Thai-53 strain; taxid:1769) was kindly provided by Dr. Patrícia Sammarco Rosa (Lauro de Souza Lima Institute, Bauru, SP, Brazil). The bacilli were maintained and harvested from the footpad of athymic nude mice (BALB/c nu/nu; RRID: IMSR_JAX:002019) as described by Shepard [54], under protocol number ILSL003/21 approved by the Institutional Animal Care and Use Committee (CEUA) of the Lauro de Souza Lima Institute. All animal procedures were conducted and reported in accordance with the ARRIVE guidelines for reporting animal research.
For isolation, the bacilli were quantified by optical microscopy using the Shepard and McRae method [55]. Bacterial viability was determined using the LIVE/DEAD™ BacLight™ Bacterial Viability Kit (Invitrogen, Thermo Fisher Scientific, Waltham, MA, USA; Cat# L7007) according to the manufacturer’s instructions; only suspensions with a minimum viability of 90% were utilized for infection assays. To generate killed bacteria, a subset of the bacilli was subjected to lethal gamma irradiation (104 Gy) [56] at a specialized facility (Acelétron, Rio de Janeiro, Brazil). The absence of viability in irradiated samples was confirmed by Live/Dead.
2.2. Isolation and Enrichment of Primary Human Monocytes
The use of human peripheral blood samples was approved by the Research Ethics Committee of the Oswaldo Cruz Institute, Oswaldo Cruz Foundation (CEP FIOCRUZ/IOC), under approval number 1.538.467 (CAAE: 55367216.0.0000.5248), and performed in compliance with the principles of the Declaration of Helsinki.
Human peripheral blood mononuclear cells (PBMCs) were obtained from buffy coats of healthy adult donors of both sexes aged 21 to 46 years. Inclusion criteria comprised healthy adult donors with no reported history of infectious, inflammatory, or autoimmune diseases. Exclusion criteria included ongoing infections, chronic inflammatory conditions, or recent immunomodulatory treatments. In all experiments, buffy coats from at least three independent donors were used, and all assays were performed in technical triplicate.
Blood was collected in sodium heparinized tubes (BD Vacutainer®; BD Biosciences, San Jose, CA, USA; Cat# 367874) and separated by density gradient centrifugation using Ficoll-Paque PREMIUM (Cytiva, Marlborough, MA, USA; Cat# 17544202), as previously described [45]. Briefly, whole blood was diluted 1:1 with PBS (pH 7.4, without Ca2+ and Mg2+), carefully layered onto the density gradient medium, and centrifuged at 492× g for 30 min at room temperature with the brake off. The mononuclear cell layer at the interface was collected and subjected to two wash cycles in cold PBS (300× g, 10 min).
Cell viability was confirmed to be >95% using the trypan blue exclusion method. For monocyte enrichment via plastic adherence, PBMCs were seeded at a density of 2 × 10⁶ cells/mL in RPMI 1640 (Gibco, Thermo Fisher Scientific; Cat# 11875093) medium supplemented with 2% fetal bovine serum (FBS) (Gibco, Thermo Fisher Scientific; Cat# 12483020). Following a 2 h incubation at 37 °C in a 5% CO2 atmosphere, non-adherent cells were removed by three vigorous washes with warm PBS. The resulting adherent monocyte-enriched population was then maintained in fresh RPMI 1640 supplemented with 10% FBS for subsequent experiments. A purity of 98% was obtained, which refers specifically to the final gated population used for flow cytometry analysis, rather than to the overall monocyte proportion within the total PBMC culture.
2.3. Flow Cytometry Analysis
PBMCs were obtained from independent healthy donors, seeded at approximately 2 × 10⁶ cells per well in 24-well culture plates, enriched for monocytes by plastic adherence, and cultured in RPMI 1640 medium supplemented with 10% FBS. Monocytes were infected or not with M. leprae at a multiplicity of infection (MOI) of 10:1 for 48 h at 33 °C in a humidified atmosphere containing 5% CO2, using RPMI 1640 medium supplemented with 10% FBS. Following infection, cells were harvested, washed with PBS, and incubated with a blocking solution containing 10% human AB serum in PBS for 30 min at 4 °C to reduce nonspecific antibody binding.
Cells were then stained with mouse anti-human CD14 antibody conjugated to PerCP-Cy5.5 (Thermo Fisher Scientific, Cat# 15-0149-42, RRID: AB_2573058) to identify monocytes. Surface expression of purinergic receptors and ectoenzymes was assessed using the following primary antibodies diluted 1:250 in blocking solution for 30 min at 4 °C: rabbit anti-A2AR antibody (Alomone Labs, Jerusalem, Israel Cat# AAR-002, RRID: AB_2039707), rabbit anti-A1R antibody (Alomone Labs Cat# AAR-006, RRID: AB_2039705, rabbit anti-A2BR antibody (Alomone Labs Cat# AAR-003; RRID: AB_2039709), rabbit anti-A3R antibody (Alomone Labs Cat# AAR-004; RRID: AB_2039711), mouse anti-CD39 antibody (Abcam, Cambridge, UK; Cat# ab30422, RRID: AB_2100068), mouse anti-CD73 antibody (Abcam Cat# ab54217, RRID: AB_879692), and rabbit anti-adenosine deaminase (ADA) antibody (Santa Cruz Biotechnology, Dallas, TX, USA; Cat# sc-25747, RRID:AB_2273599).
At the end of the incubation period, cells were washed with PBS and incubated with species-appropriate secondary antibodies conjugated to Alexa Fluor 488: goat anti-rabbit IgG antibody (Thermo Fisher Scientific Cat# A11034, RRID: AB_2576217) or goat anti-mouse IgG antibody (Thermo Fisher Scientific Cat# A11001, RRID: AB_2534069), diluted 1:500 for 30 min at 4 °C in the dark. Cells were subsequently fixed in 1% paraformaldehyde for 30 min, washed twice with PBS, and resuspended in PBS for acquisition, according to a protocol adapted from Díaz-Acosta et al. [16].
Data were acquired on a BD FACSCanto™ II flow cytometer (BD Biosciences, San Jose, CA, USA) using BD FACSDiva software v6.1.3, with acquisition of at least 10,000 CD14+ events per sample. Compensation was performed using single-stained controls, and appropriate isotype-matched controls were included for all antibodies. Data analysis was carried out using FlowJo software v10 (RRID: SCR_008520). Gating strategies were defined based on forward and side-scatter parameters to exclude debris and doublets, followed by selection of CD14+ monocytes. Median fluorescence intensity (MFI) values were used for quantitative comparisons. Analyses were performed using biological replicates derived from independent donors. During flow cytometry acquisition, photomultiplier tube (PMT) voltages were adjusted to clearly resolve negative and positive populations on a logarithmic scale. As a result, in one analysis, the unstained control peak appears around 102 rather than 100. However, all samples were acquired using identical instrument settings, ensuring consistent comparison among experimental groups.
2.4. Fluorescence Microscopy Analysis
PBMCs were obtained from independent healthy donors and seeded at approximately 2 × 10⁶ cells per well onto sterile glass coverslips in 24-well culture plates. After the adherence period, non-adherent cells were removed, resulting in an enriched monocyte population for subsequent analyses. Adherent monocytes were infected or not with live M. leprae at a multiplicity of infection (MOI) of 10:1 and incubated for 48 h at 33 °C in a humidified atmosphere containing 5% CO2.
Following infection, cells were fixed with 4% paraformaldehyde (PFA) for 20 min at 4 °C and washed twice with PBS. Fixed cells were permeabilized and blocked using a solution containing 0.1% Triton X-100 (Sigma-Aldrich, St. Louis, MO, USA; Cat# HFH10) and 1% bovine serum albumin (BSA; Sigma-Aldrich, Cat# A2153) in PBS for 30 min at room temperature to reduce nonspecific antibody binding, following a protocol adapted from Díaz-Acosta et al. [16]. Cells were then incubated overnight at 4 °C with the following primary antibodies diluted 1:300 in blocking solution: rabbit anti-A2AR antibody (Alomone Labs Cat# AAR-002; RRID: AB_2039707), and rabbit anti-ENT1 antibody (Abcam Cat# ab182023; RRID: AB_2732846).
After primary antibody incubation, cells were washed twice with PBS and incubated for 2 h at room temperature in the dark with species-appropriate secondary antibodies diluted 1:500 in blocking solution: Alexa Fluor 488-conjugated goat anti-rabbit IgG (Thermo Fisher ScientificCat# A11034; RRID: AB_2576217) for A2AR detection, or Alexa Fluor 594-conjugated goat anti-rabbit IgG (Thermo Fisher ScientificCat# A-11012, RRID: AB_2534079) for ENT1 detection. Cell nuclei were counterstained with DAPI (1 µg/mL; Thermo Fisher Scientific, Waltham, MA, USA; Cat# D1306) for 5 min at room temperature, followed by two PBS washes. Coverslips were mounted onto glass slides using ProLong™ Diamond Antifade Mountant (Thermo Fisher Scientific, Waltham, MA, USA; Cat# P36961).
Fluorescence images were acquired using an Axio Observer Z1 epifluorescence microscope (Carl Zeiss, Oberkochen, Germany) equipped with a 40× objective. Image acquisition settings (exposure time, gain, and illumination intensity) were kept constant across all experimental conditions. For each condition, at least 20 randomly selected fields were imaged, corresponding to approximately 200 cells per condition, which were considered technical replicates. Image acquisition and quantitative analysis were performed in a blinded manner whenever applicable.
Quantification of fluorescence intensity was performed using ImageJ software (NIH, Bethesda, MD, USA; version 1.52a) (RRID: SCR_003070). MFI was measured for individual cells after background subtraction and normalized to cell number based on nuclear DAPI staining. Data from independent donors were pooled for statistical analysis.
2.5. Lipid Droplet Staining and Quantification
PBMCs were obtained from independent healthy donors and seeded at approximately 2 × 10⁶ cells per well onto sterile glass coverslips in 24-well culture plates. After the adherence period, non-adherent cells were removed, resulting in an enriched monocyte population for subsequent analyses. The cells were cultured in RPMI 1640 medium supplemented with 2% FBS throughout the experimental period. Monocytes were infected or not with live M. leprae at a MOI of 10:1 and incubated for 48 h at 33 °C in a humidified atmosphere containing 5% CO2.
Cells were pretreated for 30 min with the following adenosinergic modulators: adenosine (ADO; 100 µM; Sigma-Aldrich, Cat# A9251), 5′-adenosine monophosphate (5′-AMP; 100 µM; Sigma-Aldrich, Cat# A1752) the selective adenosine A2AR agonist CGS21680 (50 nM or 100 µM; Tocris Bioscience, Shanghai, China, Cat# 1063), the A2AR antagonist ZM241385 (50 nM; Sigma-Aldrich, Cat#Z0153), the adenosine A2BR antagonist MRS1754 (50 nM; Sigma-Aldrich, Cat# M6316), or the CD73 ecto-5′-nucleotidase inhibitor AMPCP (5 µM; Sigma-Aldrich, Cat#M8386). Following pretreatment, monocytes were infected or not with live or gamma-irradiated (dead) M. leprae at a multiplicity of infection (MOI) of 10:1 for 48 h at 33 °C, as described above.
After infection, cells were fixed with 4% paraformaldehyde (PFA) for 20 min at 4 °C. Intracellular LDs were stained using Oil Red O (Sigma-Aldrich, Cat# O0625) according to established protocol [16]. Cell nuclei were counterstained with DAPI (Invitrogen, Cat# D1306), and coverslips were mounted using ProLong™ Diamond Antifade Mountant (Thermo Fisher Scientific, Waltham, MA, USA; Cat# P36961).
LDs were visualized using an Axio Observer Z1 fluorescence microscope (Carl Zeiss, Oberkochen, Germany) equipped with a 40× objective. For morphometric analysis, images were processed using ImageJ software (RRID: SCR_003070). The relative LD area was quantified by thresholding the Oil Red O signal and normalizing the total lipid area to the number of DAPI-stained nuclei. A minimum of 250 cells per condition were analyzed across three independent biological replicates.
2.6. Mitochondrial Membrane Potential (Δψm) Analysis
Adherent monocytes were obtained as previously described. The cells were cultured in RPMI 1640 medium supplemented with 2% FBS throughout the experimental period. Monocytes were infected or not with live M. leprae at a MOI of 10:1 and incubated for 48 h at 33 °C in a humidified atmosphere containing 5% CO2. Cells were pretreated with CGS21680 (100 µM) or ZM241385 (50 nM) for 30 min, followed by infection, with live M. leprae or not, as described above. Δψm was assessed using tetramethylrhodamine methyl ester perchlorate (TMRM; Sigma-Aldrich, St. Louis, MO, USA; Cat# T668), a potentiometric fluorescent dye used in non-quenching mode to allow for relative comparisons of mitochondrial polarization. Cells were incubated with 0.5 nM TMRM for 30 min at 33 °C in the dark. As a positive control for mitochondrial depolarization, the protonophore carbonyl cyanide m-chlorophenyl hydrazone (CCCP; Sigma-Aldrich, St. Louis, MO, USA; Cat# C2759) was added at a final concentration of 15 µM, 10 min prior to TMRM incubation, following the protocol previously published by Medeiros [57].
Following staining, cells were washed with warm phosphate-buffered saline and immediately imaged by fluorescence microscopy using an Axio Observer Z1 microscope (Carl Zeiss, Oberkochen, Germany) equipped with a 40× objective. For each experimental condition, at least 20 randomly selected fields were acquired, corresponding to approximately 200 cells per condition, which were considered technical replicates. Image acquisition parameters were kept constant across all experimental groups.
Quantification of mitochondrial fluorescence intensity was performed using ImageJ software (RRID: SCR_003070). Δψm was expressed as the ratio of TMRM fluorescence intensity in the absence versus presence of CCCP, as previously described, allowing normalization for non-mitochondrial background signal and inter-experimental variability. Image analysis was performed in a blind manner with respect to treatment groups.
2.7. M. leprae Viability Assessment by 16S rRNA/DNA Ratio
To evaluate the impact of adenosinergic signaling on intracellular M. leprae survival, monocytes were enriched from approximately 107 PBMCs and seeded in 6-well plates by plastic adherence. Cells derived from independent healthy donors were used as biological replicates. Monocytes were pretreated for 30 min with CGS21680 (50 nM or 100 µM), ZM241385 (50 nM), or vehicle control (1% DMSO), followed by infection with live M. leprae at MOI 10:1, and cultured as previously described.
Following infection, total RNA was extracted using TRIzol reagent (Thermo Fisher Scientific, Cat# 15596026) according to the manufacturer’s instructions, as described in [16]. RNA concentration and purity were assessed by spectrophotometry based on the A260/A280 ratio. Complementary DNA (cDNA) was synthesized from 250 ng of total RNA using GoScript™ Reverse Transcriptase with random primers (Promega, Madison, WI, USA; Cat# A5001). In parallel, genomic DNA (gDNA) was extracted and purified from the same samples as previously described by Martinez [58], enabling paired analysis of RNA and DNA derived from the same biological material.
The viability of M. leprae was assessed by determining the ratio of 16S ribosomal RNA (cDNA) to 16S DNA (DNA) using quantitative real-time PCR (RT-qPCR), according to Amplification was performed using primers and a TaqMan probe specific for the M. leprae 16S rRNA region: forward primer, 5′-GCATGTCTTGTGGTGGAAAGC-3′; reverse primer, 5′-CACCCCACCAACAAGCTGAT-3′; and TaqMan probe, 5′-CATCCTGCACCGCA-3′ (6-FAM/NFQ-MGB).
PCR efficiency for each biological replicate was independently calculated using LinRegPCR software v2020.2.0.1 (RRID: SCR_015465). To exclude genomic DNA contamination, no–reverse transcriptase (−RT) controls were included in all experiments. Bacterial viability was expressed as the relative percentage of the 16S rRNA/DNA ratio normalized to the vehicle-treated control group.
2.8. Quantification of Extracellular Nucleosides by Liquid Chromatography–Mass Spectrometry (LC–MS/MS)
Adherent monocytes were obtained as previously described. The cells were cultured in RPMI 1640 medium supplemented with 2% FBS throughout the experimental period. Monocytes were infected or not with live M. leprae at a MOI of 10:1 and incubated for 48 h at 33 °C in a humidified atmosphere containing 5% CO2. Culture supernatants were collected after 48 h. Samples were clarified by centrifugation and stored at −70 °C until metabolite extraction. For metabolite extraction, 120 µL of cell-free supernatant was mixed with 800 µL of ice-cold methanol containing internal standards (caffeine, 5-fluorouridine, 5-fluorouracil, and p-fluoro-DL-phenylalanine; final concentration 3 µg/mL). Samples were vortexed for 60 s, incubated at 4 °C for 20 min to allow protein precipitation, and centrifuged at 21,000× g for 15 min at 10 °C. A total of 780 µL of the supernatant was transferred to a clean tube, evaporated to dryness under a nitrogen stream at 40 °C for 80 min, and stored at −20 °C until analysis. Dried extracts were reconstituted in 50 µL of a 7:3 (v/v) water: acetonitrile solution prior to LC–MS/MS analysis.
Chromatographic separation was performed using a Waters XBridge BEH Amide column (4.6 × 150 mm, 3.5 µm particle size) maintained at 45 °C. The mobile phase consisted of (A) Milli-Q water containing 10 mM ammonium acetate and 0.05% ammonium hydroxide, and (B) 95% acetonitrile containing 10 mM ammonium acetate and 0.05% ammonium hydroxide with 5% Milli-Q water. A total volume of 6 µL was injected per sample. Gradient elution was carried out at a flow rate of 0.5 mL/min using the following program: 0–2 min, 95% B; 2.1–18 min, 50% B; 18.1–21 min, 50% B; 21.1–28 min, 95% B, resulting in a total run time of 28 min per sample. Mass spectrometric analysis was performed on a TSQ Quantiva™ triple-quadrupole mass spectrometer (Thermo Fisher Scientific, San Jose, CA, USA) equipped with an electrospray ionization (ESI) source operated in negative-ion mode. Instrument parameters were as follows: The spray voltage was set to 2500 V; sheath gas, 10 arbitrary units; auxiliary gas, 21 arbitrary units; sweep gas, 1 arbitrary unit; ion transfer tube temperature, 350 °C; vaporizer temperature, 400 °C. Quantification of ADO, inosine (INO), and hypoxanthine (HPX) was carried out using multiple reaction monitoring (MRM) with the following transitions: ADO, m/z 266.2 → 133.8; INO, m/z 266.7 → 134.6; and HPX, m/z 134.9 → 92.04.
External calibration curves were generated using authentic standards prepared in a 7:3 (v/v) water:acetonitrile solution over a concentration range of 0.001 to 400 µg/mL, containing the internal standard 5-fluorouridine (3 µg/mL). Quantification was performed by peak integration using TraceFinder software version 4.1 (RRID: SCR_023045). Sample acquisition and data analysis were conducted in a blind manner with respect to experimental conditions. Each experimental group included at least three biological replicates (independent donors) and technical triplicates for LC–MS/MS analysis. Internal standards and quality control samples were used to monitor extraction efficiency and instrument performance throughout the analytical runs.
2.9. Cellular Toxicity
To ensure that the observed effects of adenosinergic modulation were not due to drug-induced toxicity, cell viability was assessed using the 3-(4,5-dimethylthiazol-2-yl)-2,5-diphenyltetrazolium bromide (MTT) (Sigma-Aldrich, Cat# M6494) colorimetric assay [59]. Enriched monocytes as described below were seeded at a density of 5 × 10⁴ cells/well in 96-well plates and treated for 48 h with ADO (100 µM), 5′AMP (100 µM), CGS21680 (50 nM), ZM241385 (50 nM), MRS1754 (50 nM), or AMPCP (5 µM).
Cells treated with the vehicle (1% DMSO) served as the negative control, while cells treated with 10% DMSO served as the positive control for cell death. After 48 h of incubation, MTT reagent (final concentration: 0.5 mg/mL) was added to each well and incubated for 4 h at 37 °C. The resulting formazan crystals were solubilized in 100 µL of 10% sodium dodecyl sulfate (SDS) in 0.01N HCl, following the protocol previously published by Diaz Acosta [11]. Absorbance was measured at 590 nm using an EON microplate spectrophotometer controlled by Gen5 Microplate Reader and Imager Software v2.07.10 (RRID: SCR_017317). Cell viability was expressed as a percentage of the vehicle-treated control. Data were analyzed using GraphPad Prism version 9.0 (RRID:SCR_002798).
2.10. Statistical Analysis
For experiments involving primary human monocytes derived from different donors, the donor was considered the biological unit of analysis. Each experimental condition was performed in technical triplicate, and at least three independent biological replicates (distinct donors) were included in all experiments. Data were analyzed and visualized using GraphPad Prism software (RRID: SCR_002798). Data distribution was assessed for normality using the Shapiro–Wilk test. Comparisons between two groups were performed using paired one-tailed Student’s t-tests, while comparisons among multiple groups were conducted using one-way analysis of variance (ANOVA) followed by Bonferroni post hoc test, as appropriate. Paired t-tests or repeated-measures (RM) ANOVA were applied to account for inter-individual biological variability. Results are expressed as mean ± standard deviation (SD), as indicated in the figure legends. Statistical significance was defined as p < 0.05.
3. Results
3.1. M. leprae Increases the Expression of Ectoenzyme CD39 in Human Monocytes
To investigate whether M. leprae infection modulates the expression of key enzymes regulating extracellular ATP and ADO levels, the expression of CD39 and CD73 was analyzed by flow cytometry. For this, human monocytes were isolated from PBMCs of healthy individuals and infected with M. leprae (MOI 10:1) for 48 h. The frequency of human monocytes expressing CD39 and CD73 was analyzed. Figure 1A shows the gating strategy used to identify CD14+ monocytes. The singlets were first selected (left graph), the gate of the monocyte population was based on size using Forward Scatter (FSC) versus granularity, Side Scatter (SSC) (middle graph), and finally, confirmed with the expression of CD14 (right graph), which revealed a purity of about 98%, which reflects the gated monocyte population for flow cytometry analysis, not total PBMC purity. Figure 1B,C show representative overlaid histograms (unstained, red; non-infected (NI), cyan; M. leprae, orange) of CD39 and CD73, respectively. The results show a rightward shift in CD39 expression with infection, whereas no shift in CD73 expression was observed between NI and infected cells. The bar graph (MFI, normalized to NI) indicates a significant increase in CD39 expression by approximately 33 ± 15%, when compared to NI (p = 0.0088; Figure 1B). In contrast, CD73 expression remained unchanged upon infection (Figure 1C). These findings suggest that M. leprae modulates extracellular ATP levels primarily by upregulating CD39, potentially as a pathogen-driven mechanism to limit ATP-mediated inflammatory responses in monocytes without altering AMP-to-ADO conversion.
Figure 1.
M. leprae increases CD39 expression in human monocytes. Enriched monocytes from PBMCs were infected with M. leprae (MOI 10:1) for 48 h, and the expression of CD39 and CD73 was assessed by flow cytometry. (A) Gating strategy: Singlets were selected based on FSC-A vs. FSC-H, followed by monocyte identification based on size (FSC-A) and granulosity (SSC-A). CD14+ monocytes were identified using anti-CD14 conjugated to PerCP Cy5.5, confirming a purity of approximately 98%. (B,C) Representative histograms showing CD39 (B) and CD73 (C) expression in unstained cells (red), non-infected (NI; cyan), and M. leprae-infected (orange) monocytes. Bar graphs represent quantification of median fluorescence intensity (MFI), normalized to NI controls. After normalization, data from the infection condition (M. leprae) are presented as mean ± SD from four independent donors. Each biological replicate was analyzed in technical duplicate. Statistical significance was assessed using a paired t-test. (** p < 0.01).
3.2. CD73 Is a Potential Regulator of Lipid Droplet Formation in M. leprae-Infected Monocytes
Although CD73 expression did not change, we hypothesized that its enzymatic activity might still affect extracellular ADO levels. Since extracellular ADO can regulate lipid metabolism [24,42,60], we tested whether adding 5′-AMP, the CD73 substrate, would alter LD formation during M. leprae infection.
For this, human monocytes were pretreated with 5′-AMP (100 µM) and/or AMPCP (5 µM), a selective CD73 inhibitor, and then infected with M. leprae. LDs were stained with Oil Red O (ORO) and analyzed by fluorescence microscopy. The red-stained structures, indicated by white arrowheads, are visible in the representative images of monocytes shown in Figure 2A.
Figure 2.
CD73 activity modulates lipid droplet formation in M. leprae-infected human monocytes. Enriched human monocytes from PBMCs were infected with M. leprae (MOI 10:1) for 48 h. (A) Representative fluorescence microscopy images of non-infected (NI) and M. leprae-infected human monocytes treated with 5′AMP (100 µM), AMPCP (5 µM), or their combination. LDs were stained with Oil Red O (red), and the LD area per cell was analyzed in a total of 200 cells per condition. Nuclei were stained with DAPI (blue). White arrowheads indicate LDs. Scale bar = 10 μm. (B) LD quantification was performed using ImageJ software. NI = not infected. Data are presented as mean ± SD from at least three independent experiments conducted in technical duplicate. Statistical significance was determined by paired one-way ANOVA followed by Bonferroni’s multiple comparisons test (* p < 0.05, ** p < 0.01, ns = not significant).
As expected, M. leprae infection markedly increased LD formation compared to NI, corroborating findings from previous studies [16,17,18,19,20,24]. The treatment with 5′AMP significantly reduced M. leprae-induced LD accumulation by approximately 81 ± 9% (p = 0.0298). This effect was abolished in infected cells in the presence of AMPCP (p = 0.0090) (Figure 2B). Although AMPCP treatment in the NI condition showed a trend toward increased LD area, this difference was not statistically significant (p = 0.1203). These results suggest that CD73 activity may play an important role in regulating lipid homeostasis during infection.
To ensure that the observed pharmacological effects were not due to cytotoxicity, we evaluated the impact of all compounds used in this study on cell viability. MTT assay results demonstrated that none of the treatments affected monocyte viability (Supplementary Figure S1).
3.3. Adenosine Downregulates Lipid Droplet Formation in Monocytes Infected by M. leprae
Since CD73 hydrolyzes 5′-AMP to generate ADO, we next evaluated whether ADO per se could produce a similar effect to that observed following 5′-AMP addition. To confirm this hypothesis, M. leprae-infected monocytes were pretreated with ADO (100 µM) followed by infection with M. leprae and staining of LDs with ORO. Treatment with ADO significantly reduced LD accumulation, as evidenced by a decreased LD area (Figure 3A). Quantification revealed a reduction by approximately 68 ± 44% LD area in M. leprae-infected monocytes treated with ADO compared to infected monocytes without treatment (p = 0.0124; Figure 3B), supporting our hypothesis that extracellular ADO regulates lipid metabolism during M. leprae infection.
Figure 3.
Treatment with ADO decreases lipid droplet levels in M. leprae-infected monocytes. Enriched human monocytes isolated from PBMCs were infected with M. leprae (MOI 10:1) for 48 h. (A) Representative fluorescence microscopy images of non-infected (NI) and M. leprae-infected human monocytes treated with ADO (100 µM). LDs were stained with Oil Red O (red), and the LD area per cell was analyzed in a total of 200 cells per condition. Nuclei were stained with DAPI (blue). White arrowheads indicate LDs. Scale bar = 10 μm. (B) LD quantification was performed using ImageJ software. NI = not infected. Data are presented as mean ± SD from at least three independent experiments conducted in technical duplicate. Statistical significance was determined by paired one-way ANOVA followed by Bonferroni’s multiple comparisons test (* p < 0.05, ** p < 0.01).
3.4. M. leprae Infection Differentially Modulates the Expression of Adenosine Receptors in Human Monocytes
Extracellular ADO modulates a wide range of cellular processes by activating P1 receptors, specifically A1, A2A, A2B, and A3 [26,27]. The next goal was to investigate the expression profile of P1 receptors in M. leprae-infected monocytes. Flow cytometry analysis revealed that infected monocytes exhibited a 34 ± 10% reduction in A1R expression (p = 0.009; Figure 4A) and a 41 ± 17% reduction in A2BR expression (p = 0.0475; Figure 4B) compared with NI cells. However, A3R expression was upregulated by 37 ± 8% in infected monocytes (p = 0.0112; Figure 4D). For A2AR, flow cytometry showed an increase in infected cell expression (Figure 4C), which was confirmed by immunofluorescence, revealing an 83 ± 30% increase compared with the NI condition (p = 0.0057; Figure 4E,F).
Figure 4.
M. leprae infection selectively modulates ADO receptor expression in monocytes. Enriched human monocytes isolated from PBMCs were infected with M. leprae (MOI 10:1) for 48 h. The expression of A1, A2B, A3, and A2A was assessed by flow cytometry and fluorescence microscopy. (A–D) Representative histograms showing (A) A1R, (B) A2BR, (C) A2AR, and (D) A3R expression in unstained cells (red), non-infected (NI; blue), and M. leprae-infected (orange) monocytes. (E) Representative fluorescence microscopy images of non-infected (NI) and M. leprae-infected human monocytes. A total of 200 cells per condition were stained with DAPI (blue) and an anti-A2A antibody (green). (F) Bar graphs represent quantification of median fluorescence intensity (MFI), normalized to NI controls. Data are presented as mean ± SD from four independent donors, with each measurement conducted in duplicate. Scale bar = 10 μm. Statistical significance was determined using a paired t-test (* p < 0.05, ** p < 0.01).
3.5. A2A Receptor Negatively Regulates Lipid Droplet Formation in Human Monocytes Infected by M. leprae
Previous studies have reported that activation of the A2AR is associated with reduced intracellular cholesterol accumulation [43,44,45]. Our group previously demonstrated that the A2AR agonist CGS21680 (100 µM) reduced the LD formation in Schwann cells infected with M. leprae [24]. To investigate whether this phenomenon also occurs in monocytes, cells were pretreated with a specific A2AR agonist (CGS21680) and infected as described before. A dose–response analysis was performed with CGS21680 at 50 nM, 1 µM, 10 µM, and 100 µM, all of which yielded a comparable reduction in lipid droplet (LD) formation (Supplementary Figure S2). Therefore, to maintain consistency with our previous studies, we started the analysis by evaluating the effect of 100 µM CGS21680. The results showed that the treatment of monocytes with the A2AR agonist CGS21680 (100 µM) reduced LD accumulation by 68 ± 12% in infected cells (p = 0.0297; Figure 5A,B). Moreover, inhibition of A2AR with the selective antagonist ZM241385 (50 nM) reversed this effect (p = 0.0319; Figure 5B).
Figure 5.
Activation of the A2AR decreases lipid droplet formation in M. leprae-infected human monocytes. Enriched human monocytes isolated from PBMCs were pretreated and infected with M. leprae. (A) Representative fluorescence microscopy images of non-infected (NI) and M. leprae-infected human monocytes treated with CGS21680 (100 µM) and or ZM241385 (50 nM). LDs were stained with Oil Red O (red), and the LD area per cell was analyzed in a total of 200 cells per condition. Nuclei were stained with DAPI (blue). White arrowheads indicate LDs. Scale bar = 10 μm. (B) LD quantification was performed using ImageJ software. NI = not infected. Data were presented as mean ± SD from at least three independent experiments conducted in technical duplicate. Statistical significance was determined by paired one-way ANOVA followed by Bonferroni’s multiple comparisons test (* p < 0.05).
3.6. CGS21680 Reduces Lipid Droplet Formation in an A2BR–Independent Manner
To exclude potential A2BR-mediated effects associated with high concentrations of CGS21680, LD biogenesis was evaluated during infection using a lower concentration of CGS21680 (50 nM) in the presence of the selective A2BR antagonist MRS1754. Consistent with the effects observed at 100 µM, treatment with 50 nM CGS21680 significantly reduced LD levels in infected cells by 28 ± 9% (p = 0.0470) (Figure 6). Moreover, in agreement with previous reports [24], MRS1754 did not interfere with the effects of CGS21680 at either 50 nM (p = 0.0351) or 100 µM (p = 0.0215) (Figure 6B). Together, these results indicate that the reduction in LD levels observed in M. leprae-infected monocytes is mediated by A2AR activation.
Figure 6.
CGS21680 reduces lipid droplets in M. leprae-infected monocytes independently of A2BR. Enriched human monocytes isolated from PBMCs were infected with M. leprae (MOI 10:1) for 48 h. (A) Representative fluorescence microscopy images of non-infected (NI) and M. leprae-infected human monocytes treated with CGS21680 (50 nM, 100 µM), MRS1754 (50 nM), or their combination. LDs were stained with Oil Red O (red), and the LD area per cell was analyzed in a total of 200 cells per condition. Nuclei were stained with DAPI (blue). White arrowheads indicate LDs. Scale bar = 10 μm. (B) LD quantification was performed using ImageJ software. NI = not infected. Data are presented as mean ± SD from at least three independent experiments conducted in technical duplicate. Statistical significance was determined by paired one-way ANOVA followed by Bonferroni’s multiple comparisons test (* p < 0.05).
3.7. Activation of the A2AR Reverses the Loss of Mitochondrial Membrane Potential in M. leprae-Infected Monocytes
Since activation of the A2AR exerts a mitoprotective effect by upregulating Δψm [43,44,45], and M. leprae infection downregulates Δψm in Schwann cells and monocytes [13,57], we wondered whether A2AR activation could reverse the reduction in Δψm in monocytes infected with M. leprae. Thus, we treated monocytes with CGS21680 (100 µM) or ZM241385 (50 nM), infected or not with M. leprae, and analyzed mitochondrial fluorescence using TMRM, a Δψm-sensitive probe, by fluorescence microscopy. The result shows that in the NI condition, the inhibition of A2AR with ZM241385 reduced the Δψm by 44 ± 15% compared with untreated NI cells (p = 0.0195). In contrast, treatment with CGS21680 increased the Δψm by approximately 110% ± 38% when compared with ZM241385-treated cells (p = 0.0187) (Figure 7A). In monocytes infected with M. leprae, Δψm decreased by 70 ± 6% (p = 0.0065) compared with the NI condition, corroborating our previously published findings [13]. Additionally, the addition of CGS21680 restored Δψm in infected cells, promoting an approximately 2-fold increase compared with untreated infected monocytes (p = 0.0150) (Figure 7B). Together, these data indicate that A2AR sustains mitochondrial function at baseline in NI cells and that pharmacologic A2AR activation reverses the M. leprae-induced mitochondrial depolarization in human monocytes.
Figure 7.
Treatment with CGS21680 increases mitochondrial membrane potential in M. leprae-infected monocytes. Human monocytes enriched from PBMCs were pretreated and infected with M. leprae (MOI 10:1 for 48 h) (A) Representative fluorescence microscopy images of non-infected (NI) and M. leprae-infected human monocytes treated with CGS21680 (100 µM) or ZM241385 (50 nM). Δψm was assessed using a mitochondrial fluorescent probe (TMRM) using a total of 200 cells per condition (red). Scale bar: 10 µm. (B) Quantification of Δψm (fold change) in different conditions. Data are presented as mean ± SD from four independent experiments conducted in duplicate. Statistical differences were evaluated using one-way ANOVA followed by Bonferroni’s multiple comparisons test (* p < 0.05; ** p < 0.01).
3.8. Activation of the A2A Receptor Decreases the Intracellular Viability of M. leprae
We showed that A2AR activation reverses two important metabolic alterations in M. leprae-infected cells that contribute to bacillary persistence and the establishment of infection: accumulation of LD and a reduction in Δψm. To investigate whether these effects of A2AR activation could affect intracellular M. leprae viability, we treated M. leprae-infected cells with 50 nM and 100 µM of CGS21680 and assessed bacterial viability by RT-qPCR. The results revealed that, at both doses, CGS21680 reduced M. leprae viability by about 48 ± 14% at 50 nM (p = 0.0039) and 77 ± 16% at 100 μM (p = 0.0056) compared to the vehicle (DMSO). However, this effect was reverted by the A2AR antagonist ZM241385 (50 nM), resulting in a 2.7-fold increase in M. leprae survival (p = 0.0031) (Figure 8A–C).
Figure 8.
A2AR activation reduces M. leprae viability in human monocytes. Enriched human monocytes isolated from PBMCs were infected with M. leprae (MOI 10:1) for 48 h, and pretreated or not with the selective A2AR agonist CGS21680 (50 nM or 100 µM) and/or the antagonist ZM241385 (50 nM). M. leprae viability was assessed by RT-qPCR using the ratio of 16S cDNA to 16S DNA represented by percentage relative to the control. (A,B) Pretreatment with CGS21680 significantly reduced M. leprae viability, and this effect was reversed by co-treatment with ZM241385. (C) Treatment with ZM241385 alone increased the bacterial survival compared to untreated infected cells. Data are presented as mean ± SD relative to the control, from at least four independent experiments in technical duplicate. Statistical significance was determined using one-way ANOVA followed by Bonferroni’s multiple comparisons test or using a paired t-test (* p < 0.05; ** p < 0.01; *** p < 0.001).
3.9. Adenosinergic Compounds Reduce Lipid Droplet Accumulation Independently of M. leprae Viability
Considering that treatment with CGS21680 decreases M. leprae viability (Figure 8A,B), we hypothesized that the reduced formation of LDs observed in the presence of 5′-AMP, ADO, and CGS21680 during M. leprae infection may be a consequence of decreased bacterial viability rather than a direct inhibition of LD biogenesis. However, our group has previously shown that macrophages stimulated with dead M. leprae are still able to induce lipid droplet formation [19]. To determine whether human monocytes exhibit a similar phenotype, we stimulated monocytes with dead M. leprae and treated them with 5′-AMP, ADO, or CGS21680. The stimulation with dead M. leprae increased LD area by 3.7-fold when compared to non-stimulated cells (NS) (p = 0.0175) and treatment with 5′AMP, ADO, and CGS21680 reduced the LD area by 59 ± 5% (p = 0.0246), 64 ± 5% (p = 0.0259), and 79 ± 17% (p = 0.0343) respectively, suggesting that the downregulation of LDs by adenosinergic compounds occurs independently of bacillary viability (Figure 9A,B).
Figure 9.
Lipid droplet reduction by adenosinergic compounds is independent of M. leprae viability. Enriched human monocytes isolated from PBMCs were stimulated with dead M. leprae (MOI 10:1) for 48 h, and (A) representative fluorescence microscopy images of non-stimulated (NS) and M. leprae-stimulated human monocytes treated with 5′AMP, ADO or CGS21680 (100 µM). LDs were stained with Oil Red O (red), and the LD area per cell was analyzed in a total of 200 cells per condition. Nuclei were stained with DAPI (blue). White arrowheads indicate LDs. Scale bar = 10 μm. (B) LD quantification was performed using ImageJ software. Data are presented as mean ± SD from three independent experiments conducted in duplicate. Statistical significance was determined by paired one-way ANOVA followed by Bonferroni’s multiple comparisons test (* p < 0.05).
3.10. M. leprae-Infected Monocytes Downregulate the Expression of ENT1, Exhibit Higher ADA Expression and Extracellular Inosine and Hypoxanthine Levels
These results suggest that A2AR activation may influence metabolic responses in host cells infected with M. leprae. However, infection was also associated with increased A2AR expression, suggesting that A2AR signaling may be differentially regulated during infection. Therefore, we examined the effect of M. leprae infection on the expression of the equilibrative transporter ENT1 and the ectoenzyme ADA, which mediate the reuptake of ADO/INO and the deamination of ADO to INO, respectively. In addition, we investigated the influence of the infection on the extracellular ADO, INO, and HPX levels. Human monocytes were infected with M. leprae as described earlier, and immunofluorescence analysis showed a downregulated expression of ENT1 by 15 ± 3% (p = 0.0101; Figure 10A,B), and flow cytometry analysis showed that M. leprae infection increased ADA expression by 21 ± 5% compared with NI cells (p = 0.0123; Figure 10C). To validate this result, we performed LC-MS/MS analysis of supernatants from these cells to determine extracellular levels of purinergic mediators. Although we had not detected extracellular ADO in either condition, we observed increased INO and HPX in the supernatant of infected cells compared with NI (Figure 10D,E), suggesting high activity of ADA and purine nucleoside phosphorylase (ecto-PNP). Interestingly, our findings highlight that M. leprae infection not only alters receptor signaling A2AR but also, for the first time, shows that it rewires extracellular purine metabolism, and reveals new mechanisms that may be contributing to the chronic persistence and tissue pathology of leprosy.
Figure 10.
M. leprae infection decreases ENT1 and upregulates ADA expression, leading to higher extracellular inosine and hypoxanthine levels. Human monocytes enriched from PBMCs were infected with M. leprae (MOI 10:1) for 48 h, and ADA expression was assessed by flow cytometry, and nucleoside levels were measured by LC-MS/MS. (A) Representative fluorescence microscopy images of non-infected (NI) and M. leprae-infected human monocytes. Cells were stained with DAPI (blue) and an anti-ENT1 antibody (red) and analyzed from a total of 200 cells per condition. (B) The bar graph represents quantification of median fluorescence intensity (MFI) normalized to NI controls, demonstrating a significant decrease in ENT1 expression upon infection (* p < 0.05). Scale bar = 10 μm. (C) Representative histogram shows ADA expression in unstained cells (red), non-infected (NI, blue), and M. leprae-infected cells (orange). Quantification of the mean fluorescence intensity (MFI) normalized to control demonstrates a significant increase in ADA expression upon infection (* p < 0.05). (D,E) Quantification of extracellular levels of inosine and hypoxanthine in infected and non-infected cells. LC-MS/MS data were normalized to protein levels and are expressed as ng/ng. Data represents SD from at least three independent experiments. Statistical significance was determined using a paired t-test (* p < 0.05, ** p < 0.01).
4. Discussion
This work highlights the role of A2AR in the interaction between M. leprae and monocytes. Despite increased expression in A2AR and A3R, we focus on A2AR due to its anti-lipogenic and mitoprotective effects [24,42,43,44,45]. Our findings suggest that M. leprae bypasses these effects by increasing ADA expression, which downregulates extracellular ADO levels and thereby potentially suppresses A2AR activation in infected monocytes. In addition, increased expression of the ADA enzyme, as well as extracellular levels of INO and HPX in infected cells, support the idea that extracellular ADO levels decrease during infection and that INO and HPX can play a relevant role in the M. leprae-host cell interaction.
Monocytes are key immune cells involved in the clearance of invading pathogens, and the purinergic system has been implicated in host–pathogen interactions [8,30]. Recent research highlights this system as a promising target for metabolic interventions in the treatment of chronic inflammatory and infectious diseases [30,61]. The study with naïve monocytes in vitro contributes to unraveling the early immunomodulatory mechanisms of circulating monocytes, helping to understand the immune tolerance observed in leprosy.
In microenvironments of infected cells, elevated extracellular ATP levels are commonly observed [62,63]. Extracellular ATP is an essential molecule for paracrine signaling, modulating innate immunity, and enhancing macrophage phagocytosis through P2X7- and P2X4-dependent pathways [64]. However, extracellular ATP also activates inflammasomes and triggers intense pro-inflammatory responses, contributing to microbicidal activity [65,66]. For example, CD39-deficient macrophages exhibit a pro-inflammatory phenotype and fail to adopt an immunosuppressive state [67]. Thus, M. leprae infection may increase CD39 expression in host cells, thereby regulating extracellular ATP levels to favor its uptake. Although CD39 levels increased in M. leprae-infected monocytes, the increase was moderate (~33%) and varied between donors. Even small changes, however, may affect function because CD39 is key in breaking down ATP. Thus, modest increases may shift the balance between ATP and ADO, controlling both inflammation and immune suppression. Greater ATP breakdown could lower inflammatory signals and enhance ADO’s role in immune tolerance. These metabolic shifts are also linked to increased lipid droplet formation and pathogen persistence. The observed differences likely reflect natural variation in cells from different people, which is common in ex vivo infection studies. Despite this variability, the effect was still statistically significant, underscoring its importance. However, future studies assessing CD39 enzymatic activity will be important to determine how this enzyme regulates the extracellular ATP–ADO balance and how this modulation may influence immune responses in infected monocytes.
In the inflammatory microenvironment, the tight regulation of the extracellular ATP/ADO ratio becomes a key mechanism by which pathogens subvert host immune responses, mainly through the metabolic reprogramming of innate and adaptive immune cells [30]. We have not observed any change in CD73 expression in M. leprae-infected monocytes; however, treatment with its substrate, 5′AMP, induces an anti-lipogenic effect in infected cells, which was abolished in the presence of the specific enzymatic inhibitor, as observed by Cui and colleagues [35], reinforcing CD73′s functional activity in our model. Nonetheless, further studies are needed to evaluate the real impact of M. leprae infection on the activity of CD73 and its role in leprosy pathogenesis.
5′-AMP has been shown to activate both A1R and A2AR [68,69], receptors involved in lipid metabolism [42]. Overall, these results indicate that M. leprae infection modulates CD73 activity to regulate extracellular 5′AMP/ADO levels, thereby maintaining the pro-lipid intracellular profile in the host cell. In this study, we observed that the addition of ADO reduced LD formation induced by M. leprae infection, as previously reported in infected Schwann cells [24]. Furthermore, we confirmed the effect of A2AR pharmacologically using CGS21680 (an agonist) and ZM241385 (an antagonist). We selected the concentration of CGS21680 based on previous studies. Yasuda et al. (2003) and Lebon et al. (2015) employed 100 µM in hepatocytes and in receptor structural analyses, respectively, demonstrating high selectivity for A2AR over A2BR [70,71]. Furthermore, our group also used 100 µM CGS21680 in M. leprae-infected Schwann cells, demonstrating its effect on lipid metabolism [24]. Thus, we maintained this concentration for comparability with past data. Since A2AR activation occurs in the nanomolar to micromolar range [24,70,71], we also tested 50 nM CGS21680 and included an A2BR antagonist (MRS1735) to assess specificity. The A2BR antagonist did not affect the anti-lipogenic effect induced by either 50 nM or 100 µM CGS21680, strengthening evidence for CGS21680′s specificity for A2AR.
The use of 100µM of CGS21680 was a pharmacological strategy to achieve maximal stimulation conditions designed to (i) ensure robust A2A pathway engagement in a milieu where M. leprae increases ADA and alters nucleoside handling, reducing the effective extracellular ADO concentration and (ii) stress-test specificity alongside selective antagonists.
Although the precise molecular mechanisms were not examined in the present study, activation of A2AR is known to elevate intracellular cAMP levels and engage the PKA–CREB signaling axis, which has been associated with coordinated anti-lipogenic and metabolic regulatory programs [72]. For example, PKA accelerates triglyceride hydrolysis by phosphorylating the hormone-sensitive lipase and perilipin-1 [73]. When perilipin-1 is phosphorylated, the surface of the LD changes, making it easier for lipolytic enzymes to attach. At the same time, PKA phosphorylation activates HSL, which moves from the cytosol to the lipid droplet, where it breaks down stored triglycerides into diglycerides and free fatty acids. These actions work together to increase lipolysis and reduce the amount of stored fat in the cell [74,75,76,77]. In addition, CREB activation can also influence cellular energy metabolism by regulating PGC-1α (peroxisome proliferator-activated receptor gamma coactivator-1 alpha), a master regulator of mitochondrial biogenesis and oxidative metabolism [78,79]. Upon phosphorylation by PKA, CREB binds to cAMP-responsive elements in the promoter region of the PPARGC1A gene, increasing the expression of PGC-1α, which in turn, acts as a transcriptional coactivator for nuclear receptors and transcription factors such as PPARs and NRF1/NRF2, which regulate genes involved in fatty acid β-oxidation, mitochondrial respiration, and oxidative phosphorylation [80]. Through this pathway, CREB-dependent induction of PGC-1α enhances mitochondrial function and promotes fatty acid utilization as an energy source, thereby contributing to reduced intracellular lipid accumulation. This pathway may help explain how A2AR activation restores mitochondrial membrane potential that is reduced during M. leprae infection.
In macrophages, the cAMP–PKA–CREB axis also increases ABCA1, enhancing cholesterol efflux to apoA-I [81,82,83]. Further, CREB induces ATF3, which binds the PPARγ promoter and suppresses PPARγ transcription and target-gene expression [84,85,86]. Beyond transcription, cAMP/PKA can activate the MAPK/ERK pathway [87], which phosphorylates PPARγ, reducing its transactivation [88,89]. In summary, the cAMP–PKA–CREB pathway activated by A2AR may reduce LD accumulation by shifting cellular metabolism toward oxidation, providing a mechanistic basis for the anti-lipogenic phenotype observed during M. leprae infection. In addition, we observed in M. leprae-infected Schwann cells an anti-lipogenic effect following A2AR activation that involved the downregulation of key genes controlling lipid metabolism, such as PPARγ, CD36, and PLIN3, while simultaneously promoting the upregulation of ABCA1 and ABCG1, which encode critical proteins involved in reverse cholesterol transport, as described in the literature [24]. Another relevant aspect of A2AR activation is its potential impact on the formation of lipid mediators induced during M. leprae infection. A2AR signaling is an important regulator in eicosanoid biology. When activated, A2AR engagement decreases pro-inflammatory eicosanoid production, including COX-2-derived prostaglandins and 5-lipoxygenase products [90,91]. Different clinical forms of leprosy exhibit distinct eicosanoid profiles, including prostaglandin E2, prostaglandin D2, and lipoxin A4 [92,93,94]. This supports the role of lipid mediators in the disease’s immunopathology. In addition, LDs induced by M. leprae are platforms for eicosanoid synthesis [19]. These molecules can act in various ways; for example, hemozoin produces 15(S)-HETE, a PPAR-γ ligand that inhibits dendritic cell differentiation and maturation [95]. In addition to its effects on cAMP-dependent signaling pathways, activation of the A2AR may additionally influence the metabolism of arachidonic acid-derived lipid mediators. Considering that LDs are key intracellular platforms for eicosanoid synthesis, modulation of these metabolic pathways by A2AR signaling may indirectly alter LD activity and the production of inflammatory lipid mediators during infection. In the context of Mycobacterium leprae infection, where LD accumulation and host lipid metabolism are central features of the host–pathogen interaction, A2AR-dependent regulation of these pathways may contribute to remodeling cellular lipid metabolism and inflammatory responses.
A2AR is also known to regulate mitochondrial function through cAMP/PKA signaling, which can either stabilize the mitochondrial function and ROS production [96,97]. Previous studies have demonstrated that A2AR and A2BR activation inhibit mitoROS production in chondrocytes and neutrophils, respectively [96,98]. In macrophages, A2AR activation promotes a metabolic shift toward oxidative phosphorylation and an anti-inflammatory phenotype, partially mediated by modulation of mitochondrial activity [97]. Additionally, increased electron transport-driven mitoROS production has been associated with enhanced pathogen clearance [99,100]. The mitochondrial function is essential for clearing pathogens and plays a central role in balancing lipid storage and fatty acid oxidation [101]. Furthermore, activation of A2AR may modulate mitochondrial functions, potentially leading to reduced intracellular viability of M. leprae. Together, these transcriptional and post-translational mechanisms may converge to suppress lipogenic pathways, enhance lipid catabolism, and improve mitochondrial fitness, ultimately counteracting the immunometabolic reprogramming induced by M. leprae infection. Ongoing studies are currently being conducted to further delineate the molecular pathways activated downstream of A2AR signaling in infected cells, with particular focus on cAMP-dependent networks, lipid metabolic regulators, and mitochondrial homeostasis.
The ATP/ADO ratio acts as an immunological switch, mediating transitions between pro- and anti-inflammatory responses [33]. In our model, M. leprae infection increased CD39 and ADA expression, which can be linked to the regulation of ATP/ADO levels. We also found that M. leprae infection decreases ENT1 expression in human monocytes, a nucleoside transporter responsible for the reuptake of ADO and INO [50]. Previous studies indicate that extracellular ADO levels can modulate ENT1 expression [102]. Thus, in infected monocytes, it is plausible that increased ADA activity reduces extracellular ADO, contributing to ENT1 downregulation. Nevertheless, additional studies are required to elucidate the specific contribution of extracellular purinergic components to the host cell microenvironment.
Our data demonstrated that M. leprae infection led to a significant increase in extracellular levels of INO and HPX, two purine metabolites implicated in lipid metabolism. Previous studies have shown that INO upregulates 3-hydroxy-3-methylglutaryl-CoA reductase (HMGCR), a key enzyme in cholesterol biosynthesis [103], whereas HPX downregulates APOE and ABCA1, both of which are crucial for cholesterol efflux and transport [104]. These findings suggest that M. leprae infection modulates the catabolic pathway of purine metabolites, thereby altering the host extracellular microenvironment to favor cholesterol accumulation. Such metabolic reprogramming likely supports LD formation and creates a lipid-enriched niche that benefits bacterial persistence.
Our findings demonstrate that activation of the A2AR by CGS21680 reduces LD accumulation in M. leprae-infected monocytes and restores Δψm. This suggests that A2AR signaling may shift the metabolic profile toward increased lipid catabolism and mitochondrial activation. Given that LDs provide a lipid-rich niche that supports M. leprae intracellular survival, A2AR-induced LD reduction and mitochondrial reactivation likely should contribute to limiting bacterial viability. To confirm this hypothesis, intracellular viability assays were performed, and we observed that treatment with CGS21680 significantly reduced bacterial viability, and the addition of ZM241385 reversed this effect. Interestingly, when we added only ZM241385, we detected increased M. leprae survival. These results suggest that, in a microenvironment enriched in extracellular ADO may be engaged to limit bacillary survival; conversely, when A2AR is pharmacologically blocked, extracellular ADO may become available to activate other adenosine receptor subtypes, which might promote M. leprae persistence. We cannot rule out the possibility that compensatory activation by other adenosine receptors also contributes to the observed effects. While our data support a central role for A2AR signaling in regulating the immunometabolic response of M. leprae-infected monocytes, the involvement of additional ADO receptor subtypes cannot be excluded. Monocytes and macrophages express all four adenosine receptors, which may be differentially engaged depending on extracellular ADO levels and the inflammatory environment [105]. Therefore, ongoing studies are exploring the role of alternative ADO receptors in host–pathogen interactions to better understand the adenosinergic axis’s involvement in leprosy pathogenesis.
5. Conclusions
Our findings show that M. leprae infection triggers coordinated immunometabolic changes in human monocytes. It remodels the extracellular purinergic environment, as evidenced by increased ATP hydrolysis, higher ADA activity, and the buildup of metabolites such as inosine and hypoxanthine, which affect lipid and cholesterol metabolism. Infected monocytes also display more LDs and mitochondrial dysfunction. These changes create an intracellular microenvironment that supports bacillary survival. In this context, A2AR acts as a metabolic checkpoint. It increases lipid breakdown and restores mitochondrial function, shifting metabolism to limit pathogen survival. Our data thus highlight purinergic signaling as an upstream regulator connecting extracellular nucleotide processing to intracellular lipid storage, mitochondrial function, and host defense, and targeting the purinergic signaling axis as a potential new therapeutic opportunity to enhance immune control and limit bacterial persistence in leprosy.
Supplementary Materials
The following supporting information can be downloaded at: https://www.mdpi.com/article/10.3390/metabo16050304/s1. Supplementary Figure S1. Treatment with adenosinergic pathway components does not affect monocyte viability. Supplementary Figure S2. Dose–response analysis of CGS21680 on lipid droplet accumulation in M. leprae-infected human monocytes.
Author Contributions
Conceptualization, A.M.R.P. and M.B.-P.; methodology, A.M.R.P., C.D.A., T.L.S.A.R., A.A.D., K.G.C.V., F.M.R.C., R.G., M.A.A., F.A.L. and L.M.S.L.; investigation, A.M.R.P., P.M.F.d.S., K.G.C.V., L.D.G. and A.A.D.; formal analysis, A.M.R.P., R.O.P. and M.B.-P.; data curation, A.M.R.P., A.A.D., K.G.C.V. and M.A.A.; funding acquisition, M.C.V.P. and M.B.-P.; project administration, M.C.V.P. and M.B.-P.; supervision, M.B.-P.; visualization, A.M.R.P.; writing—original draft, A.M.R.P. and M.B.-P.; writing—review and editing, A.M.R.P., C.D.A., F.M.R.C., T.L.S.A.R., R.G., M.A.A., F.A.L., L.S.R., L.M.S.L., R.O.P. and M.B.-P. All authors have read and agreed to the published version of the manuscript.
Funding
This research was funded by the Oswaldo Cruz Foundation (FIOCRUZ); the National Institute of Allergy and Infectious Diseases, National Institutes of Health (NIH), grant number R01AI141526-01A1; the Conselho Nacional de Desenvolvimento Científico e Tecnológico (CNPq), grant number 432434/2018-6; and the Fundação Carlos Chagas Filho de Amparo à Pesquisa do Estado do Rio de Janeiro (FAPERJ) grant number E26/111.493/2013. INOVA-Oswaldo Cruz Foundation (FIOCRUZ)-VPPCB-007-FIO-18-2-61. A.M.R.P. was supported by the Coordenação de Aperfeiçoamento de Pessoal de Nível Superior (CAPES) fellowship, Finance Code 001.
Institutional Review Board Statement
The study was conducted in accordance with the Declaration of Helsinki and approved by the Research Ethics Committee of the Oswaldo Cruz Institute, Fundação Oswaldo Cruz (CEP FIOCRUZ/IOC), under approval number 1.538.467 (CAAE: 55367216.0.0000.5248), approved on December 02/2017. The animal study protocol was approved by the Institutional Animal Care and Use Committee (CEUA) of the Lauro de Souza Lima Institute under protocol number ILSL003/21.
Informed Consent Statement
In this study, informed consent was not required because all experiments were conducted using peripheral blood mononuclear cells obtained from buffy coats provided under a formal technical and scientific cooperation agreement between the Oswaldo Cruz Foundation (Fiocruz) and the Blood Bank of the Clementino Fraga Filho University Hospital, Federal University of Rio de Janeiro (UFRJ). This cooperation agreement and the use of the biological material were reviewed and approved by the Research Ethics Committee, as stated in the corresponding ethics opinion. All buffy coats were transferred to the laboratory in a fully anonymized and de-identified manner. Samples were labeled exclusively with a numeric code. The exclusion criteria applied were the same as those routinely used for blood donation under current Brazilian laws and regulations governing hemotherapy services.
Data Availability Statement
The original contributions presented in this study are included in the article/Supplementary Materials. Further inquiries can be directed to the corresponding author.
Acknowledgments
The authors are grateful to Patricia Samarco Rosa and Daniela Cosentino-Gomes, as well as the entire team of the Research and Teaching Division of the Instituto Lauro de Souza Lima (Bauru, Brazil), for providing the animal facilities, performing the infections, and supplying Mycobacterium leprae for this study.
Conflicts of Interest
The authors declare no conflicts of interest.
Abbreviations
The following abbreviations are used in this manuscript:
| ADO | Adenosine |
| 5′AMP | Adenosine monophosphate |
| INO | Inosine |
| A1 | Adenosine A1 receptor |
| A2AR | Adenosine A2A receptor |
| A3 | Adenosine A3 receptor |
| A2BR | Adenosine A2B receptor |
| ADA | Adenosine deaminase |
| AMPCP | α,β-methylene adenosine 5′-diphosphate |
| CCCP | Carbonyl cyanide m-chlorophenyl hydrazone |
| BSA | Bovine serum albumin |
| ANOVA | Analysis of variance |
| CEP | Research Ethics Committee |
| CEUA | Institutional Animal Care and Use Committee |
| cDNA | Complementary DNA |
| PBMCs | Peripheral blood mononuclear cells |
| DAPI | 4′,6-diamidino-2-phenylindole |
| DMSO | Dimethyl sulfoxide |
| ENT-1 | Equilibrative nucleoside transporter 1 |
| HPX | Hypoxanthine |
| IF | Immunofluorescence |
| PFA | Paraformaldehyde |
| LC-MS/MS | Liquid chromatography–tandem mass spectrometry |
| LDs | Lipid droplets |
| FBS | Fetal bovine serum |
| MOI | Multiplicity of infection |
| ESI | Electrospray ionization |
| FIOCRUZ | Oswaldo Cruz Foundation |
| MFI | Median fluorescence intensity |
| MTT | 3-(4,5-dimethylthiazol-2-yl)-2,5-diphenyltetrazolium bromide |
| PBS | Phosphate-buffered saline |
| RM ANOVA | Repeated-measures analysis of variance |
| RT-qPCR | Reverse transcription quantitative polymerase chain reaction |
| SD | Standard deviation |
| SDS | Sodium dodecyl sulfate |
| TCA | Trichloroacetic acid |
| TMRM | Tetramethylrhodamine methyl ester |
| Δψm | Mitochondrial membrane potential |
References
- Deps, P.; Collin, S.M. Mycobacterium lepromatosis as a Second Agent of Hansen’s Disease. Front. Microbiol. 2021, 12, 698588. [Google Scholar] [CrossRef] [Scilit]
- World Health Organization. Global leprosy (Hansen disease) update, 2023: Elimination of leprosy disease is possible—Time to act! Wkly. Epidemiol. Rec. Relev. Épidémiologique Hebd. 2024, 99, 501–521. Available online: https://www.who.int/publications/i/item/who-wer9937-501-521 (accessed on 25 March 2026).
- Scollard, D.M.; Adams, L.B.; Gillis, T.P.; Krahenbuhl, J.L.; Truman, R.W.; Williams, D.L. The continuing challenges of leprosy. Clin. Microbiol. Rev. 2006, 19, 338–381. [Google Scholar] [CrossRef] [Scilit] [PubMed]
- Britton, W.J.; Lockwood, D.N.J. Leprosy. Lancet 2004, 363, 1209–1219. [Google Scholar] [CrossRef] [Scilit]
- Costa, R.M.P.G.; Fernandes, M.A.; Santos, G.P.G.; Rocha, D.d.M.; Dos Santos, A.M.R.; Avelino, F.V.S.D. Social stigma and mental health impairment in people with leprosy: An integrative review. Lepr. Rev. 2022, 93, 254–264. [Google Scholar] [CrossRef] [Scilit]
- Word Health Organization. WHO Towards Zero Leprosy Global Leprosy (Hansen’s Disease) Strategy 2021–2030; WHO: Geneva, Switzerland, 2021. [Google Scholar]
- dos Reis, S.A.; Gonçalves, J.D.; Lima, K.d.A.; Demaria, T.M.; Costa-Bartuli, E.; Gomes, T.A.; Corrêa, M.B.C.; Atella, G.C.; Sola-Penna, M.; Rosa, P.S.; et al. Mycobacterium leprae is able to infect adipocytes, inducing lipolysis and modulating the immune response. Microbes Infect. 2024, 26, 105283. [Google Scholar] [CrossRef] [Scilit]
- Serbina, N.V.; Jia, T.; Hohl, T.M.; Pamer, E.G. Monocyte-mediated defense against microbial pathogens. Annu. Rev. Immunol. 2008, 26, 421–452. [Google Scholar] [CrossRef] [Scilit]
- Stratton, J.A.; Shah, P.T. Macrophage polarization in nerve injury: Do Schwann cells play a role ? Neural Regen. Res. 2016, 11, 53–57. [Google Scholar] [CrossRef] [Scilit] [PubMed]
- Wang, Q.; Hartig, S.M.; Ballantyne, C.M.; Wu, H. The multifaceted life of macrophages in white adipose tissue: Immune shift couples with metabolic switch. Immunol. Rev. 2024, 324, 11–24. [Google Scholar] [CrossRef] [Scilit]
- Fallows, D.; Peixoto, B.; Kaplan, G.; Manca, C. Mycobacterium leprae alters classical activation of human monocytes in vitro. J. Inflamm. 2016, 13, 4–8. [Google Scholar] [CrossRef] [Scilit] [PubMed]
- Sinsimer, D.; Fallows, D.; Peixoto, B.; Krahenbuhl, J.; Kaplan, G.; Manca, C. Mycobacterium leprae actively modulates the cytokine response in naïve human monocytes. Infect. Immun. 2010, 78, 293–300. [Google Scholar] [CrossRef] [Scilit]
- Oliveira, M.F.; Medeiros, R.C.A.; Mietto, B.S.; Calvo, T.L.; Mendonça, A.P.M.; Rosa, T.L.S.A.; da Silva, D.S.; Vasconcelos, K.G.D.C.D.; Pereira, A.M.R.; de Macedo, C.S.; et al. Reduction of host cell mitochondrial activity as Mycobacterium leprae’s strategy to evade host innate immunity. Immunol. Rev. 2021, 301, 193–208. [Google Scholar] [CrossRef] [Scilit]
- Russell, D.G.; Huang, L.; Vanderven, B.C. Immunometabolism at the interface between macrophages and pathogens pathogens. Nat. Rev. Immunol. 2019, 19, 291–304. [Google Scholar] [CrossRef] [Scilit]
- Schwarzer, E.; Alessio, M.; Ulliers, D.; Arese, P. Phagocytosis of the Malarial Pigment, Hemozoin, Impairs Expression of Major Histocompatibility Complex Class II Antigen, CD54, and CD11c in Human Monocytes. Infect. Immun. 1998, 66, 1601–1606. [Google Scholar] [CrossRef] [Scilit]
- Díaz Acosta, C.; Dias, A.; Rosa, T.; Batista-Silva, L.; Rosa, P.; Toledo-Pinto, T.; Costa, F.; Lara, F.; Rodrigues, L.; Mattos, K.; et al. PGL I expression in live bacteria allows activation of a CD206/PPARγ cross-talk that may contribute to successful Mycobacterium leprae colonization of peripheral nerves. PLoS Pathog. 2018, 14, e1007151. [Google Scholar] [CrossRef] [Scilit] [PubMed]
- Mattos, K.A.; Lara, F.A.; Oliveira, V.G.C.; Rodrigues, L.S.; D’Avila, H.; Melo, R.C.N.; Manso, P.P.A.; Sarno, E.N.; Bozza, P.T.; Pessolani, M.C.V. Modulation of lipid droplets by Mycobacterium leprae in Schwann cells: A putative mechanism for host lipid acquisition and bacterial survival in phagosomes. Cell. Microbiol. 2011, 13, 259–273. [Google Scholar] [CrossRef] [Scilit] [PubMed]
- Mattos, K.A.; Oliveira, V.G.C.; D’Avila, H.; Rodrigues, L.S.; Pinheiro, R.O.; Sarno, E.N.; Pessolani, M.C.V.; Bozza, P.T. TLR6-Driven Lipid Droplets in Mycobacterium leprae- Infected Schwann Cells: Immunoinflammatory Platforms Associated with Bacterial Persistence. J. Immunol. 2011, 187, 2548–2558. [Google Scholar] [CrossRef] [Scilit] [PubMed]
- Mattos, K.A.; D’Avila, H.; Rodrigues, L.S.; Oliveira, V.G.C.; Sarno, E.N.; Atella, G.C.; Pereira, G.M.; Bozza, P.T.; Pessolani, M.C. V Lipid droplet formation in leprosy: Toll-like receptor-regulated organelles involved in eicosanoid formation and Mycobacterium leprae pathogenesis. J. Leukoc. Biol. 2009, 87, 371–384. [Google Scholar] [CrossRef] [Scilit]
- Mattos, K.A.; Oliveira, V.C.G.; Berrêdo-Pinho, M.; Amaral, J.J.; Antunes, L.C.M.; Melo, R.C.N.; Acosta, C.C.D.; Moura, D.F.; Olmo, R.; Han, J.; et al. Mycobacterium leprae intracellular survival relies on cholesterol accumulation in infected macrophages: A potential target for new drugs for leprosy treatment. Cell. Microbiol. 2014, 16, 797–815. [Google Scholar] [CrossRef] [Scilit]
- de Almeida, P.E.; Pereira de Sousa, N.M.; Rampinelli, P.G.; Silva, R.V.d.S.; Correa, J.R.; D’Avila, H. Lipid droplets as multifunctional organelles related to the mechanism of evasion during mycobacterial infection. Front. Cell. Infect. Microbiol. 2023, 13, 1102643. [Google Scholar] [CrossRef] [Scilit]
- Lobato, L.S.; Rosa, P.S.; Da Silva Ferreira, J.; Da Silva Neumann, A.; Da Silva, M.G.; Nascimento, D.C.; Soares, C.T.; Pedrini, S.C.B.; De Oliveira, D.S.L.; Monteiro, C.P.; et al. Statins increase rifampin Mycobactericidal effect. Antimicrob. Agents Chemother. 2014, 58, 5766–5774. [Google Scholar] [CrossRef] [Scilit]
- da Silva Rocha, M.; Rodrigues Pereira, A.M.; Freire Dos Santos, P.M.; Alves Dias, A.; Pontes Pereira, M.; Sammarco Rosa, P.; Bertoluci, D.F.F.; Belisle, J.T.; Ramalho Costa, F.d.M.; de Macedo, C.S.; et al. Impact of protein prenylation inhibition on Mycobacterium leprae viability and IL-1β production in infected macrophages. J. Bacteriol. 2025, 207, e0018525. [Google Scholar] [CrossRef] [Scilit] [PubMed]
- dos Santos, P.; Díaz Acosta, C.; Rosa, T.; Ishiba, M.; Dias, A.; Pereira, A.; Gutierres, L.; Pereira, M.; da Silva Rocha, M.; Rosa, P.; et al. Adenosine A2A receptor as a potential regulator of Mycobacterium leprae survival mechanisms: New insights into leprosy neural damage. Front. Pharmacol. 2024, 15, 1399363. [Google Scholar] [CrossRef] [Scilit]
- Burnstock, G. Purinergic signalling: From discovery to current developments. Exp. Physiol. 2014, 99, 16–34. [Google Scholar] [CrossRef] [Scilit]
- Fredholm, B.B.; IJzerman, A.P.; Jacobson, K.A.; Linden, J.; Müller, C.E. International union of basic and clinical pharmacology. LXXXI. Nomenclature and classification of adenosine receptors—An update. Pharmacol. Rev. 2011, 63, 1–34. [Google Scholar] [CrossRef] [Scilit]
- Burnstock, G. Purine and purinergic receptors. Brain Neurosci. Adv. 2018, 2, 2398212818817494. [Google Scholar] [CrossRef] [Scilit] [PubMed]
- Welihinda, A.A.; Kaur, M.; Greene, K.; Zhai, Y.; Amento, E.P. The adenosine metabolite inosine is a functional agonist of the adenosine A2A receptor with a unique signaling bias. Cell. Signal. 2016, 28, 552–560. [Google Scholar] [CrossRef] [Scilit]
- Di Virgilio, F.; Vuerich, M. Purinergic signaling in the immune system. Auton. Neurosci. Basic Clin. 2015, 191, 117–123. [Google Scholar] [CrossRef] [Scilit] [PubMed]
- Eberhardt, N.; Bergero, G.; Mazzocco Mariotta, Y.L.; Aoki, M.P. Purinergic modulation of the immune response to infections. Purinergic Signal. 2022, 18, 93–113. [Google Scholar] [CrossRef] [Scilit]
- Yegutkin, G.G. Nucleotide- and nucleoside-converting ectoenzymes: Important modulators of purinergic signalling cascade. Biochim. Biophys. Acta 2008, 1783, 673–694. [Google Scholar] [CrossRef] [Scilit]
- Antonioli, L.; Pacher, P.; Vizi, S.; Haskó, G. CD39 and CD73 in immunity and inflammation. Trends Mol. Med. 2013, 19, 355–367. [Google Scholar] [CrossRef] [Scilit]
- Faas, M.M.; Sáez, T.; de Vos, P. Extracellular ATP and adenosine: The Yin and Yang in immune responses? Mol. Asp. Med. 2017, 55, 9–19. [Google Scholar] [CrossRef] [Scilit]
- Savio, L.; Mello, P.; Figliuolo, V.; Almeida, T.; Santana, P.; Oliveira, S.; Silva, C.; Feldbrügge, L.; Csizmadia, E.; Minshall, R.; et al. CD39 limits P2X7 receptor inflammatory signaling and attenuates sepsis-induced liver injury. J. Hepatol. 2017, 67, 716–726. [Google Scholar] [CrossRef] [Scilit]
- Cui, Z.; Feng, L.; Rao, S.; Huang, Z.; Huang, S.; Liu, L.; Liao, Y.; Lan, Z.; Chen, Q.; Deng, J.; et al. Adenosine Monophosphate Improves Lipolysis in Obese Mice by Reducing DNA Methylation via ADORA2A Activation by Ecto-5′-Nucleotidase (CD73). Adv. Sci. 2025, 12, 202405079. [Google Scholar] [CrossRef] [Scilit]
- Kao, D.J.; Saeedi, B.J.; Kitzenberg, D.; Burney, K.M.; Dobrinskikh, E.; Battista, K.D.; Vázquez-Torres, A.S.P.C.; Kominsky, D.J. Intestinal Epithelial Ecto-5-Nucleotidase (CD73) Regulates Intestinal Colonization and Infection by Nontyphoidal Salmonella. Infect. Immun. 2017, 85, e01022-16. [Google Scholar] [CrossRef] [Scilit]
- Lee, J.S.; Chowdhury, N.; Roberts, J.A.S.; Yilmaz, Ö. Host surface ectonucleotidase-CD73 and the opportunistic pathogen, Porphyromonas gingivalis, cross-modulation underlies a new homeostatic mechanism for chronic bacterial survival in human epithelial cells. Virulence 2020, 11, 414–429. [Google Scholar] [CrossRef] [Scilit]
- Cronstein, B.N. Adenosine, an endogenous anti-inflammatory agent Adenosine, an endogenous anti-inflammatory. J. Appl. Physiol. 1994, 76, 5–13. [Google Scholar] [CrossRef] [Scilit] [PubMed]
- Hasko, G.; Cronstein, B. Adenosine: An endogenous regulator of innate immunity. Trends Immunol. 2004, 25, 33–39. [Google Scholar] [CrossRef] [Scilit]
- Morandi, F.; Horenstein, A.L.; Rizzo, R.; Malavasi, F. The Role of Extracellular Adenosine Generation in the Development of Autoimmune Diseases. Mediat. Inflamm. 2018, 2018, 7019398. [Google Scholar] [CrossRef] [Scilit] [PubMed]
- Bingham, T.C.; Fisher, E.A.; Parathath, S.; Reiss, A.B.; Chan, E.S.; Cronstein, B.N. A2A adenosine receptor stimulation decreases foam cell formation by enhancing ABCA1-dependent cholesterol efflux. J. Leukoc. Biol. 2010, 87, 683–690. [Google Scholar] [CrossRef] [Scilit] [PubMed]
- Koupenova, M.; Ravid, K. Adenosine, Adenosine Receptors and Their Role in Glucose Homeostasis and Lipid Metabolism. J. Cell. Physiol. 2013, 228, 1703–1712. [Google Scholar] [CrossRef] [Scilit] [PubMed]
- Ferrante, A.; De Nuccio, C.; Pepponi, R.; Visentin, S.; Martire, A.; Bernardo, A.; Minghetti, L.; Popoli, P. Stimulation of adenosine A2A receptors reduces intracellular cholesterol accumulation and rescues mitochondrial abnormalities in human neural cell models of Niemann-Pick C1. Neuropharmacology 2016, 103, 155–162. [Google Scholar] [CrossRef] [Scilit]
- Visentin, S.; De Nuccio, C.; Bernardo, A.; Pepponi, R.; Ferrante, A.; Minghetti, L.; Popoli, P. The stimulation of adenosine A2A receptors ameliorates the pathological phenotype of fibroblasts from Niemann-Pick type C patients. J. Neurosci. 2013, 33, 15388–15393. [Google Scholar] [CrossRef] [Scilit] [PubMed]
- De Nuccio, C.; Bernardo, A.; Ferrante, A.; Pepponi, R.; Martire, A.; Falchi, M.; Visentin, S.; Popoli, P.; Minghetti, L. Adenosine A 2A receptor stimulation restores cell functions and differentiation in Niemann-Pick type C-like oligodendrocytes. Sci. Rep. 2019, 9, 9782. [Google Scholar] [CrossRef] [Scilit] [PubMed]
- Zimmermann, H. Extracellular Purine Metabolism. Drug Dev. Res. 1996, 39, 337–352. [Google Scholar] [CrossRef] [Scilit]
- Nigam, P.; Srivastava, P.; Patra, P. Serum adenosine deaminase levels in reactional and non-reactional leprosy. Indian J. Dermatol. Venereol. Leprol. 2005, 71, 20–22. [Google Scholar] [CrossRef] [Scilit]
- Shende, R.; Bardapurker, J.; Patil, V.; Gaikwad, A. Adenosine deaminase activity in leprosy. Indian J. Lepr. 1993, 65, 201–205. [Google Scholar]
- Kim, I.S.; Jo, E.; Jordheim, L.P.; Lyon, U. De Inosine: A bioactive metabolite with multimodal actions in human diseases. Front. Pharmacol. 2022, 13, 1043970. [Google Scholar] [CrossRef] [Scilit]
- Boswell-Casteel, R.C.; Hays, F.A. Equilibrative nucleoside transporters—A review. Nucleosides Nucleotides Nucleic Acids 2017, 36, 7–30. [Google Scholar] [CrossRef] [Scilit]
- Shaw, J.A.; Irusen, E.M.; Diacon, A.H.; Koegelenberg, C.F. Pleural tuberculosis: A concise clinical review. Ser. Pleural Dis. 2018, 12, 1779–1786. [Google Scholar] [CrossRef] [Scilit]
- Ramdani, G.; Langsley, G. ATP, an Extracellular Signaling Molecule in Red Blood Cells. Biomed. J. 2014, 37, 284–292. [Google Scholar] [CrossRef] [Scilit]
- Wu, X.; Dong, K.; Liu, Y.; Yang, L.; Zhang, J.; Yang, M.; Gao, Z. Adenosine A2A Receptor Activation Alleviated Disease of Mice with Systemic Candida albicans Infection by Regulating Macrophage Function. J. Inflamm. Res. 2025, 18, 3283–3294. [Google Scholar] [CrossRef] [Scilit] [PubMed]
- Shepard, C.C. the Experimental Disease That Follows the Injection of Human Leprosy Bacilli Into Foot-Pads of Mice. J. Exp. Med. 1960, 112, 445–454. [Google Scholar] [CrossRef] [Scilit]
- Shepard, C.C.; McRae, D.H. A method for counting acid-fast bacteria. Int. J. Lepr. Other Mycobact. Dis. 1968, 36, 78–82. [Google Scholar] [PubMed]
- Lahiri, R.; Randhawa, B.; Krahenbuhl, J. Application of a viability-staining method for Mycobacterium leprae derived from the athymic (nu/nu) mouse foot pad. J. Med. Microbiol. 2005, 54, 235–242. [Google Scholar] [CrossRef] [Scilit] [PubMed]
- Medeiros, R.C.A.; de Vasconcelos Girardi, K.D.C.; Cardoso, F.K.L.; de Siqueira Mietto, B.; de Toledo Pinto, T.G.; Gomez, L.S.; Rodrigues, L.S.; Gandini, M.; Amaral, J.J.; Antunes, S.L.G.; et al. Subversion of Schwann Cell Glucose Metabolism by Mycobacterium leprae. J. Biol. Chem. 2016, 291, 21375–21387. [Google Scholar] [CrossRef] [Scilit]
- Martinez, A.N.; Lahiri, R.; Pittman, T.L.; Scollard, D.; Truman, R.; Moraes, M.O.; Williams, D.L. Molecular determination of Mycobacterium leprae viability by use of real-time PCR. J. Clin. Microbiol. 2009, 47, 2124–2130. [Google Scholar] [CrossRef] [Scilit]
- Mosmann, T. Rapid Colorimetric Assay for Cellular Growth and Survival: Application to Proliferation and Cytotoxicity Assays. J. Immunol. Methods 1983, 65, 55–63. [Google Scholar] [CrossRef] [Scilit]
- Burnstock, G.; Gentile, D. The involvement of purinergic signalling in obesity. Purinergic Signal. 2018, 14, 97–108. [Google Scholar] [CrossRef] [Scilit]
- Antonioli, L.; Blandizzi, C.; Pacher, P.; Haskó, G. The Purinergic System as a Pharmacological Target for the Treatment of Immune-Mediated Inflammatory Diseases. Pharmacol. Rev. 2019, 71, 345–382. [Google Scholar] [CrossRef] [Scilit]
- Di Virgilio, F.; Sarti, A.C.; Coutinho-Silva, R. Purinergic signaling, DAMPs, and inflammation. Am. J. Physiol. Cell Physiol. 2020, 318, C832–C835. [Google Scholar] [CrossRef] [Scilit]
- Dosch, M. Mechanisms of ATP Release by Inflammatory Cells. Int. J. Mol. Sci. 2018, 19, 1222. [Google Scholar] [CrossRef] [Scilit]
- Zumerle, S.; Calì, B.; Munari, F.; Angioni, R.; Di Virgilio, F.; Molon, B.; Viola, A. Intercellular Calcium Signaling Induced by ATP Potentiates Macrophage Phagocytosis. Cell Rep. 2019, 27, 1–10.e4. [Google Scholar] [CrossRef] [Scilit] [PubMed]
- Skeldon, A.; Saleh, M. The inflammasomes: Molecular effectors of host resistance against bacterial, viral, parasitic, and fungal infections. Front. Microbiol. 2011, 2, 8810. [Google Scholar] [CrossRef] [Scilit] [PubMed]
- Anand, P.K.; Malireddi, R.K.S.; Kanneganti, T.D. Role of the Nlrp3 inflammasome in microbial infection. Front. Microbiol. 2011, 2, 12. [Google Scholar] [CrossRef] [Scilit] [PubMed]
- Cohen, H.B.; Briggs, K.T.; Marino, J.P.; Ravid, K.; Robson, S.C.; Mosser, D.M. TLR stimulation initiates a CD39-based autoregulatory mechanism that limits macrophage inflammatory responses. Blood 2013, 122, 1935–1945. [Google Scholar] [CrossRef] [Scilit]
- Rittiner, J.E.; Korboukh, I.; Hull-Ryde, E.A.; Jin, J.; Janzen, W.P.; Frye, S.V.; Zylka, M.J. AMP is an adenosine A 1 receptor agonist. J. Biol. Chem. 2012, 287, 5301–5309. [Google Scholar] [CrossRef] [Scilit]
- Gao, N.; Hu, H.Z.; Liu, S.; Gao, C.; Xia, Y.; Wood, J.D. Stimulation of adenosine A1 and A2A receptors by AMP in the submucosal plexus of guinea pig small intestine. Am. J. Physiol. Gastrointest. Liver Physiol. 2007, 292, 492–500. [Google Scholar] [CrossRef] [Scilit]
- Yasuda, N.; Inoue, T.; Horizoe, T.; Nagata, K.; Minami, H.; Kawata, T.; Hoshino, Y.; Harada, H.; Yoshikawa, S.; Asano, O.; et al. Functional characterization of the adenosine receptor contributing to glycogenolysis and gluconeogenesis in rat hepatocytes. Eur. J. Pharmacol. 2003, 459, 159–166. [Google Scholar] [CrossRef] [Scilit]
- Lebon, G.; Edwards, P.C.; Leslie, A.G.W.; Tate, C.G. Molecular determinants of CGS21680 binding to the human adenosine A2A receptor. Mol. Pharmacol. 2015, 87, 907–915. [Google Scholar] [CrossRef] [Scilit]
- Chen, C.; Gao, H.; Tian, Q.; Cao, J. cAMP–PKA/EPAC signaling pathways: Crucial regulators of lipid homeostasis. Adipocyte 2026, 15, 2603605. [Google Scholar] [CrossRef] [Scilit]
- Hansen, J.S.; De Maré, S.; Jones, H.A.; Göransson, O.; Lindkvist-Petersson, K. Visualization of lipid directed dynamics of perilipin 1 in human primary adipocytes. Sci. Rep. 2017, 7, 15011. [Google Scholar] [CrossRef] [Scilit]
- Kraemer, F.B.; Shen, W.J. Hormone-sensitive lipase: Control of intracellular tri-(di-)acylglycerol and cholesteryl ester hydrolysis. J. Lipid Res. 2002, 43, 1585–1594. [Google Scholar] [CrossRef] [Scilit]
- Granneman, J.G.; Moore, H.H.; Krishnamoorthy, R.; Rathod, M. Perilipin Controls Lipolysis by Regulating the Interactions of AB-hydrolase Containing 5 (Abhd5) and Adipose Triglyceride. J. Biol. Chem. 2009, 284, 34538–34544. [Google Scholar] [CrossRef] [Scilit]
- Krintel, C.; Osmark, P.; Larsen, M.R.; Resjo, S.; Logan, D.T.; Holm, C. Ser649 and Ser650 Are the Major Determinants of Protein Kinase A-Mediated Activation of Human Hormone-Sensitive Lipase against Lipid Substrates. PLoS ONE 2008, 3, e3756. [Google Scholar] [CrossRef] [Scilit]
- Miyoshi, H.; Souza, S.C.; Zhang, H.; Strissel, K.J.; Christoffolete, M.A.; Kovsan, J.; Rudich, A.; Kraemer, F.B.; Bianco, A.C.; Obin, M.S.; et al. Perilipin Promotes Hormone-sensitive Lipase-mediated Adipocyte Lipolysis via Phosphorylation-dependent and -independent Mechanisms. J. Biol. Chem. 2006, 281, 15837–15844. [Google Scholar] [CrossRef] [Scilit] [PubMed]
- Song, Y.F.; Hogstrand, C.; Ling, S.C.; Chen, G.H.; Luo, Z. Creb-Pgc1α pathway modulates the interaction between lipid droplets and mitochondria and influences high fat diet-induced changes of lipid metabolism in the liver and isolated hepatocytes of yellow catfish. J. Nutr. Biochem. 2020, 80, 108364. [Google Scholar] [CrossRef] [Scilit] [PubMed]
- Rius-Pérez, S.; Torres-Cuevas, I.; Millán, I.; Ortega, Á.L.; Pérez, S.; Sandhu, M.A. PGC-1 α, Inflammation, and Oxidative Stress: An Integrative View in Metabolism. Oxidative Med. Cell. Longev. 2020, 2020, 1452696. [Google Scholar] [CrossRef] [Scilit]
- Puigserver, P.; Spiegelman, B.M. Peroxisome proliferator-activated receptor-γ coactivator 1α (PGC-1α): Transcriptional coactivator and metabolic regulator. Endocr. Rev. 2003, 24, 78–90. [Google Scholar] [CrossRef] [Scilit]
- Haidar, B.; Denis, M.; Krimbou, L.; Marcil, M.; Genest, J. cAMP induces ABCA1 phosphorylation activity and promotes cholesterol efflux from fibroblasts. J. Lipid Res. 2002, 43, 2087–2094. [Google Scholar] [CrossRef] [Scilit] [PubMed]
- Le Goff, W.; Zheng, P.; Brubaker, G.; Smith, J.D. Identification of the cAMP-Responsive Enhancer of the Murine ABCA1 Gene: Requirement for CREB1 and STAT3/4 Elements. Arter. Thromb. Vasc. Biol. 2006, 26, 527–533. [Google Scholar] [CrossRef] [Scilit]
- Srivastava, N.; Cefalu, A.B.; Averna, M.; Srivastava, R.A.K. Rapid degradation of ABCA1 protein following cAMP withdrawal and treatment with PKA inhibitor suggests ABCA1 is a short-lived protein primarily regulated at the transcriptional level. J. Diabetes Metab. Disord. 2020, 19, 363–371. [Google Scholar] [CrossRef] [Scilit]
- Lu, D.; Chen, J.; Hai, T. The regulation of ATF3 gene expression by mitogen-activated protein kinases. Biochem. J. 2007, 401, 559–567. [Google Scholar] [CrossRef] [Scilit]
- Jang, M.; Jung, M.H. ATF3 represses PPARc expression and inhibits adipocyte differentiation. Biochem. Biophys. Res. Commun. 2014, 454, 58–64. [Google Scholar] [CrossRef] [Scilit] [PubMed]
- Jang, M.; Jung, M.H. ATF3 inhibits PPARc -stimulated transactivation in adipocyte cells. Biochem. Biophys. Res. Commun. 2015, 456, 80–85. [Google Scholar] [CrossRef] [Scilit]
- Stork, P.J.S.; Schmitt, J.M. Crosstalk between cAMP and MAP kinase signaling in the regulation of cell proliferation. Trends Cell Biol. 2002, 12, 258–266. [Google Scholar] [CrossRef] [Scilit]
- Burns, K.A.; Heuvel, J.P. Vanden Modulation of PPAR activity via phosphorylation. Biochim. Biophys. Acta 2007, 1771, 952–960. [Google Scholar] [CrossRef] [Scilit]
- Frkic, R.L.; Richter, K.; Bruning, J.B. The therapeutic potential of inhibiting PPAR γ phosphorylation to treat type 2 diabetes. J. Biol. Chem. 2021, 297, 101030. [Google Scholar] [CrossRef] [Scilit] [PubMed]
- Pouliot, M.; Fiset, M.-É.; Massé, M.; Naccache, P.H.; Borgeat, P. Adenosine Up-Regulates Cyclooxygenase-2 in Human Granulocytes: Impact on the Balance of Eicosanoid Generation. J. Immunol. 2002, 169, 5279–5286. [Google Scholar] [CrossRef] [Scilit] [PubMed]
- Cadieux, J.S.; Leclerc, P.; St-Onge, M.; Dussault, A.A.; Laflamme, C.; Picard, S.; Ledent, C.; Borgeat, P.; Pouliot, M. Potentiation of neutrophil cyclooxygenase-2 by adenosine: An early anti-inflammatory signal. J. Cell Sci. 2005, 118, 1437–1447. [Google Scholar] [CrossRef] [Scilit]
- Amaral, J.J.; Antunes, L.C.M.; De Macedo, C.S.; Mattos, K.A.; Han, J.; Pan, J.; Bozza, T.; Finlay, B.B.; Borchers, C.H.; Sarno, E.N.; et al. Metabonomics Reveals Drastic Changes in Anti- Inflammatory/Pro-Resolving Polyunsaturated Fatty Acids-Derived Lipid Mediators in Leprosy Disease. PLoS Negl. Trop. Dis. 2013, 7, e2381. [Google Scholar] [CrossRef] [Scilit] [PubMed]
- Santos, C.; Macedo, D.; Marques, F.; Carvalho, D.; Jablonski, J.; De Mendonça, S.; Assis, E.F.; Nunes, E.; Torres, P.; Cristina, M.; et al. Cytokine Leprosy and its reactional episodes: Serum levels and possible roles of omega-3 and omega-6-derived lipid mediators. Cytokine 2018, 112, 87–94. [Google Scholar] [CrossRef] [Scilit]
- Silva, C.A.M.; Graham, B.G.; Webb, K.; Islam, M.N.; Harton, M.; Angela, M.; Marques, D.M.; De Carvalho, F.M.; Pinheiro, R.O.; Spencer, J.; et al. Polyunsaturated Fatty Acid-Derived Lipid Mediators as Potential Biomarkers for Leprosy Among Individuals with Asymptomatic. ACS Infect. Dis. 2023, 9, 1458–1469. [Google Scholar] [CrossRef] [Scilit] [PubMed]
- Skorokhod, O.A.; Alessio, M.; Mordmüller, B.; Arese, P.; Schwarzer, E. Hemozoin (Malarial Pigment) Inhibits Differentiation and Maturation of Human Monocyte-Derived Dendritic Cells: A Peroxisome Proliferator-Activated Receptor-γ-Mediated Effect. J. Immunol. 2004, 173, 4066–4074. [Google Scholar] [CrossRef] [Scilit] [PubMed]
- Castro, C.M.; Corciulo, C.; Solesio, M.E.; Liang, F.; Pavlov, E.V.; Cronstein, B.N. Adenosine A2A receptor (A2AR) stimulation enhances mitochondrial metabolism and mitigates reactive oxygen species-mediated mitochondrial injury. FASEB J. 2020, 34, 5027–5045. [Google Scholar] [CrossRef] [Scilit]
- Haskó, G.; Linden, J.; Cronstein, B.; Pacher, P. Adenosine receptors: Therapeutic aspects for inflammatory and immune diseases. Nat. Rev. Drug Discov. 2008, 7, 759–770. [Google Scholar] [CrossRef] [Scilit]
- Herring, S.E.; Mao, S.; Bhalla, M.; Tchalla, E.Y.I.; Kramer, J.M.; Bou Ghanem, E.N. Mitochondrial ROS production by neutrophils is required for host antimicrobial function against Streptococcus pneumoniae and is controlled by A2B adenosine receptor signaling. PLoS Pathog. 2022, 18, e1010700. [Google Scholar] [CrossRef] [Scilit]
- Hernansanz-Agustín, P.; Enríquez, J.A. Generation of reactive oxygen species by mitochondria. Antioxidants 2021, 10, 415. [Google Scholar] [CrossRef] [Scilit]
- Shekhova, E. Mitochondrial reactive oxygen species as major effectors of antimicrobial immunity. PLoS Pathog. 2020, 16, e1008470. [Google Scholar] [CrossRef] [Scilit]
- Faas, M.M.; de Vos, P. Mitochondrial function in immune cells in health and disease. Biochim. Biophys. Acta Mol. Basis Dis. 2020, 1866, 165845. [Google Scholar] [CrossRef] [Scilit]
- Pietrobono, D.; Bertilacchi, M.S.; Marchetti, L.; Martini, C.; Trincavelli, M.L. Extracellular adenosine oppositely regulates the purinome machinery in glioblastoma and mesenchymal stem cells. IUBMB Life 2024, 76, 1234–1251. [Google Scholar] [CrossRef] [Scilit] [PubMed]
- Chen, B.; Bao, R.; Pan, J.; Zhu, Z.; Chen, Q.; Wang, D.; Wu, Y. Taurine alleviates dysfunction of cholesterol metabolism under hyperuricemia by inhibiting A2AR-SREBP-2/CREB/HMGCR axis. J. Lipid Res. 2025, 66, 100746. [Google Scholar] [CrossRef] [Scilit]
- Ryu, H.; Kim, Y.; Oh, E.; Oh, S.; Choi, J. Hypoxanthine induces cholesterol accumulation and incites atherosclerosis in apolipoprotein E-deficient mice and cells. J. Cell. Mol. Med. 2016, 20, 2160–2172. [Google Scholar] [CrossRef] [Scilit] [PubMed]
- Cekic, C.; Linden, J. Purinergic regulation of the immune system. Nat. Rev. Immunol. 2016, 16, 177–192. [Google Scholar] [CrossRef] [Scilit] [PubMed]
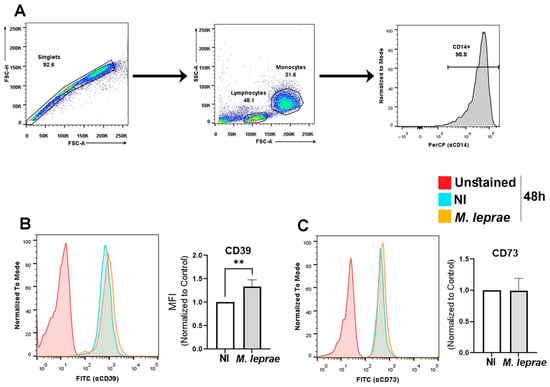
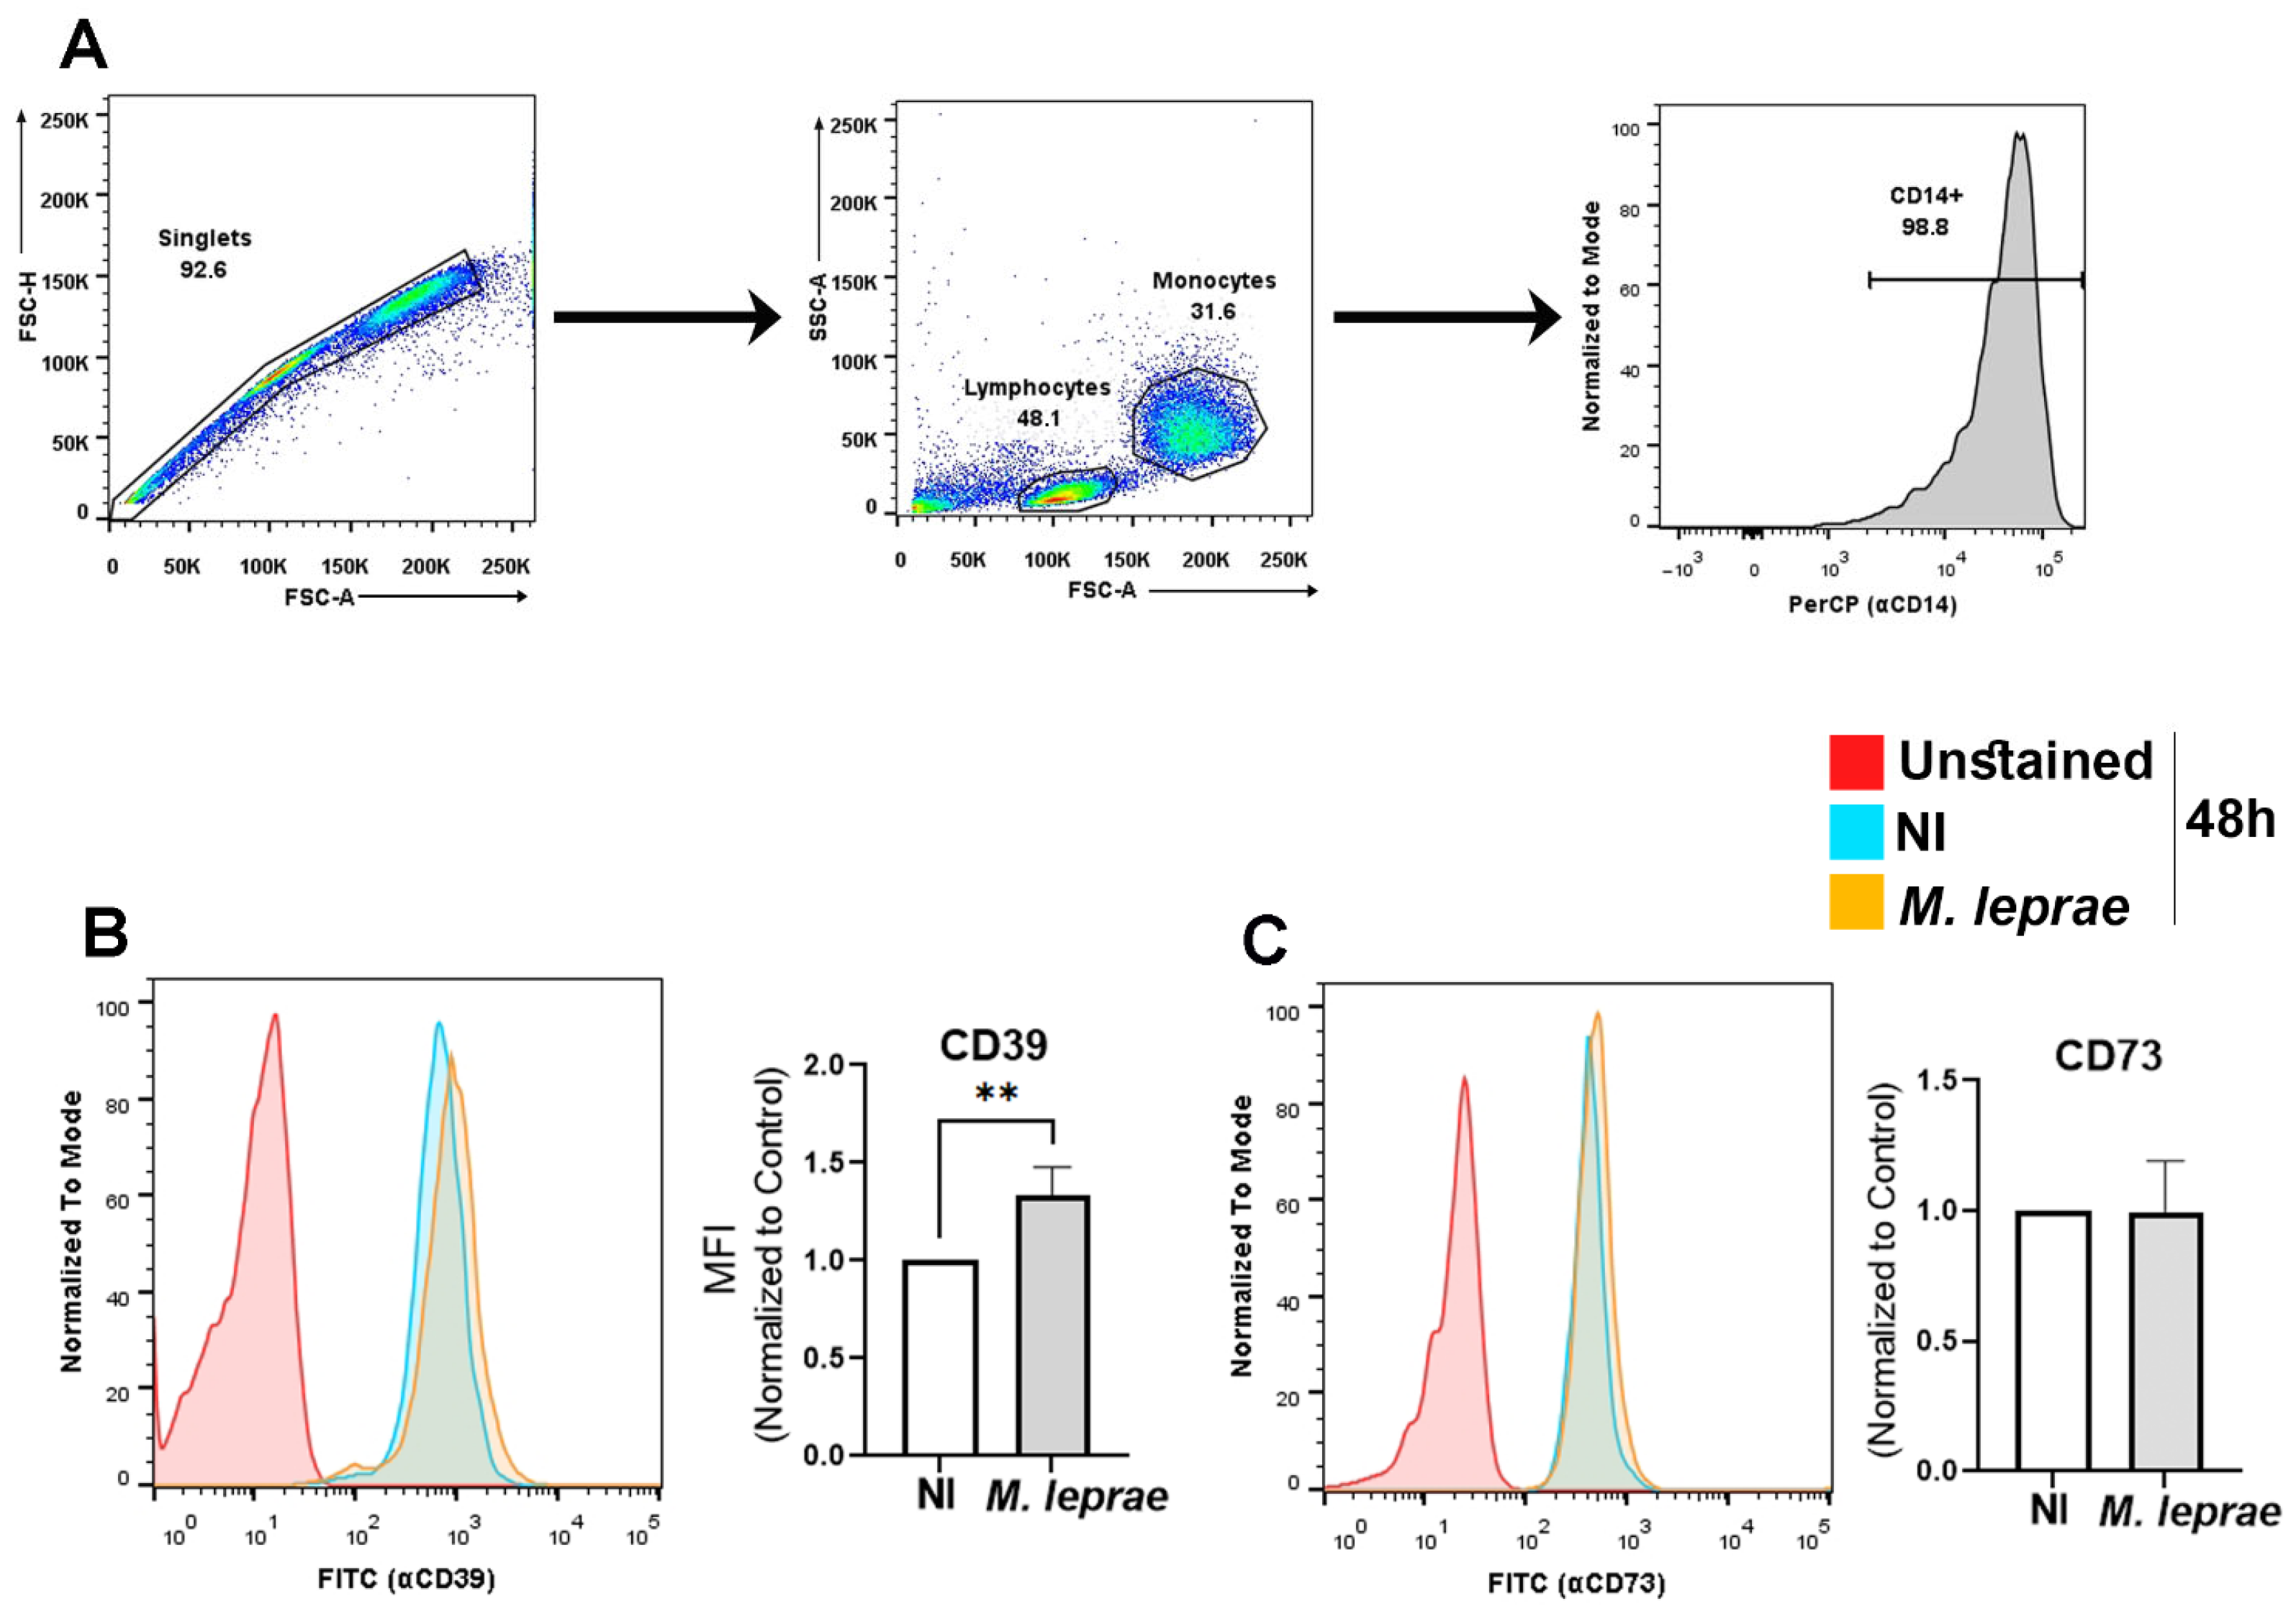
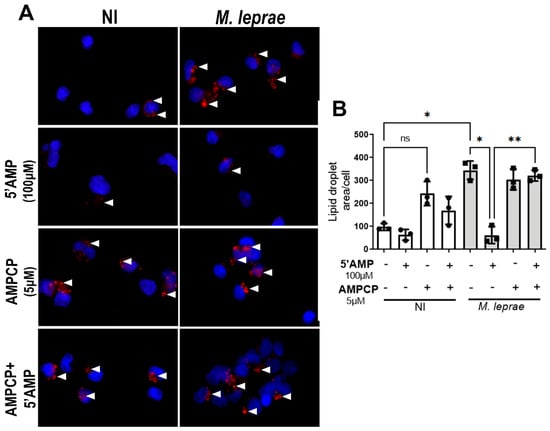
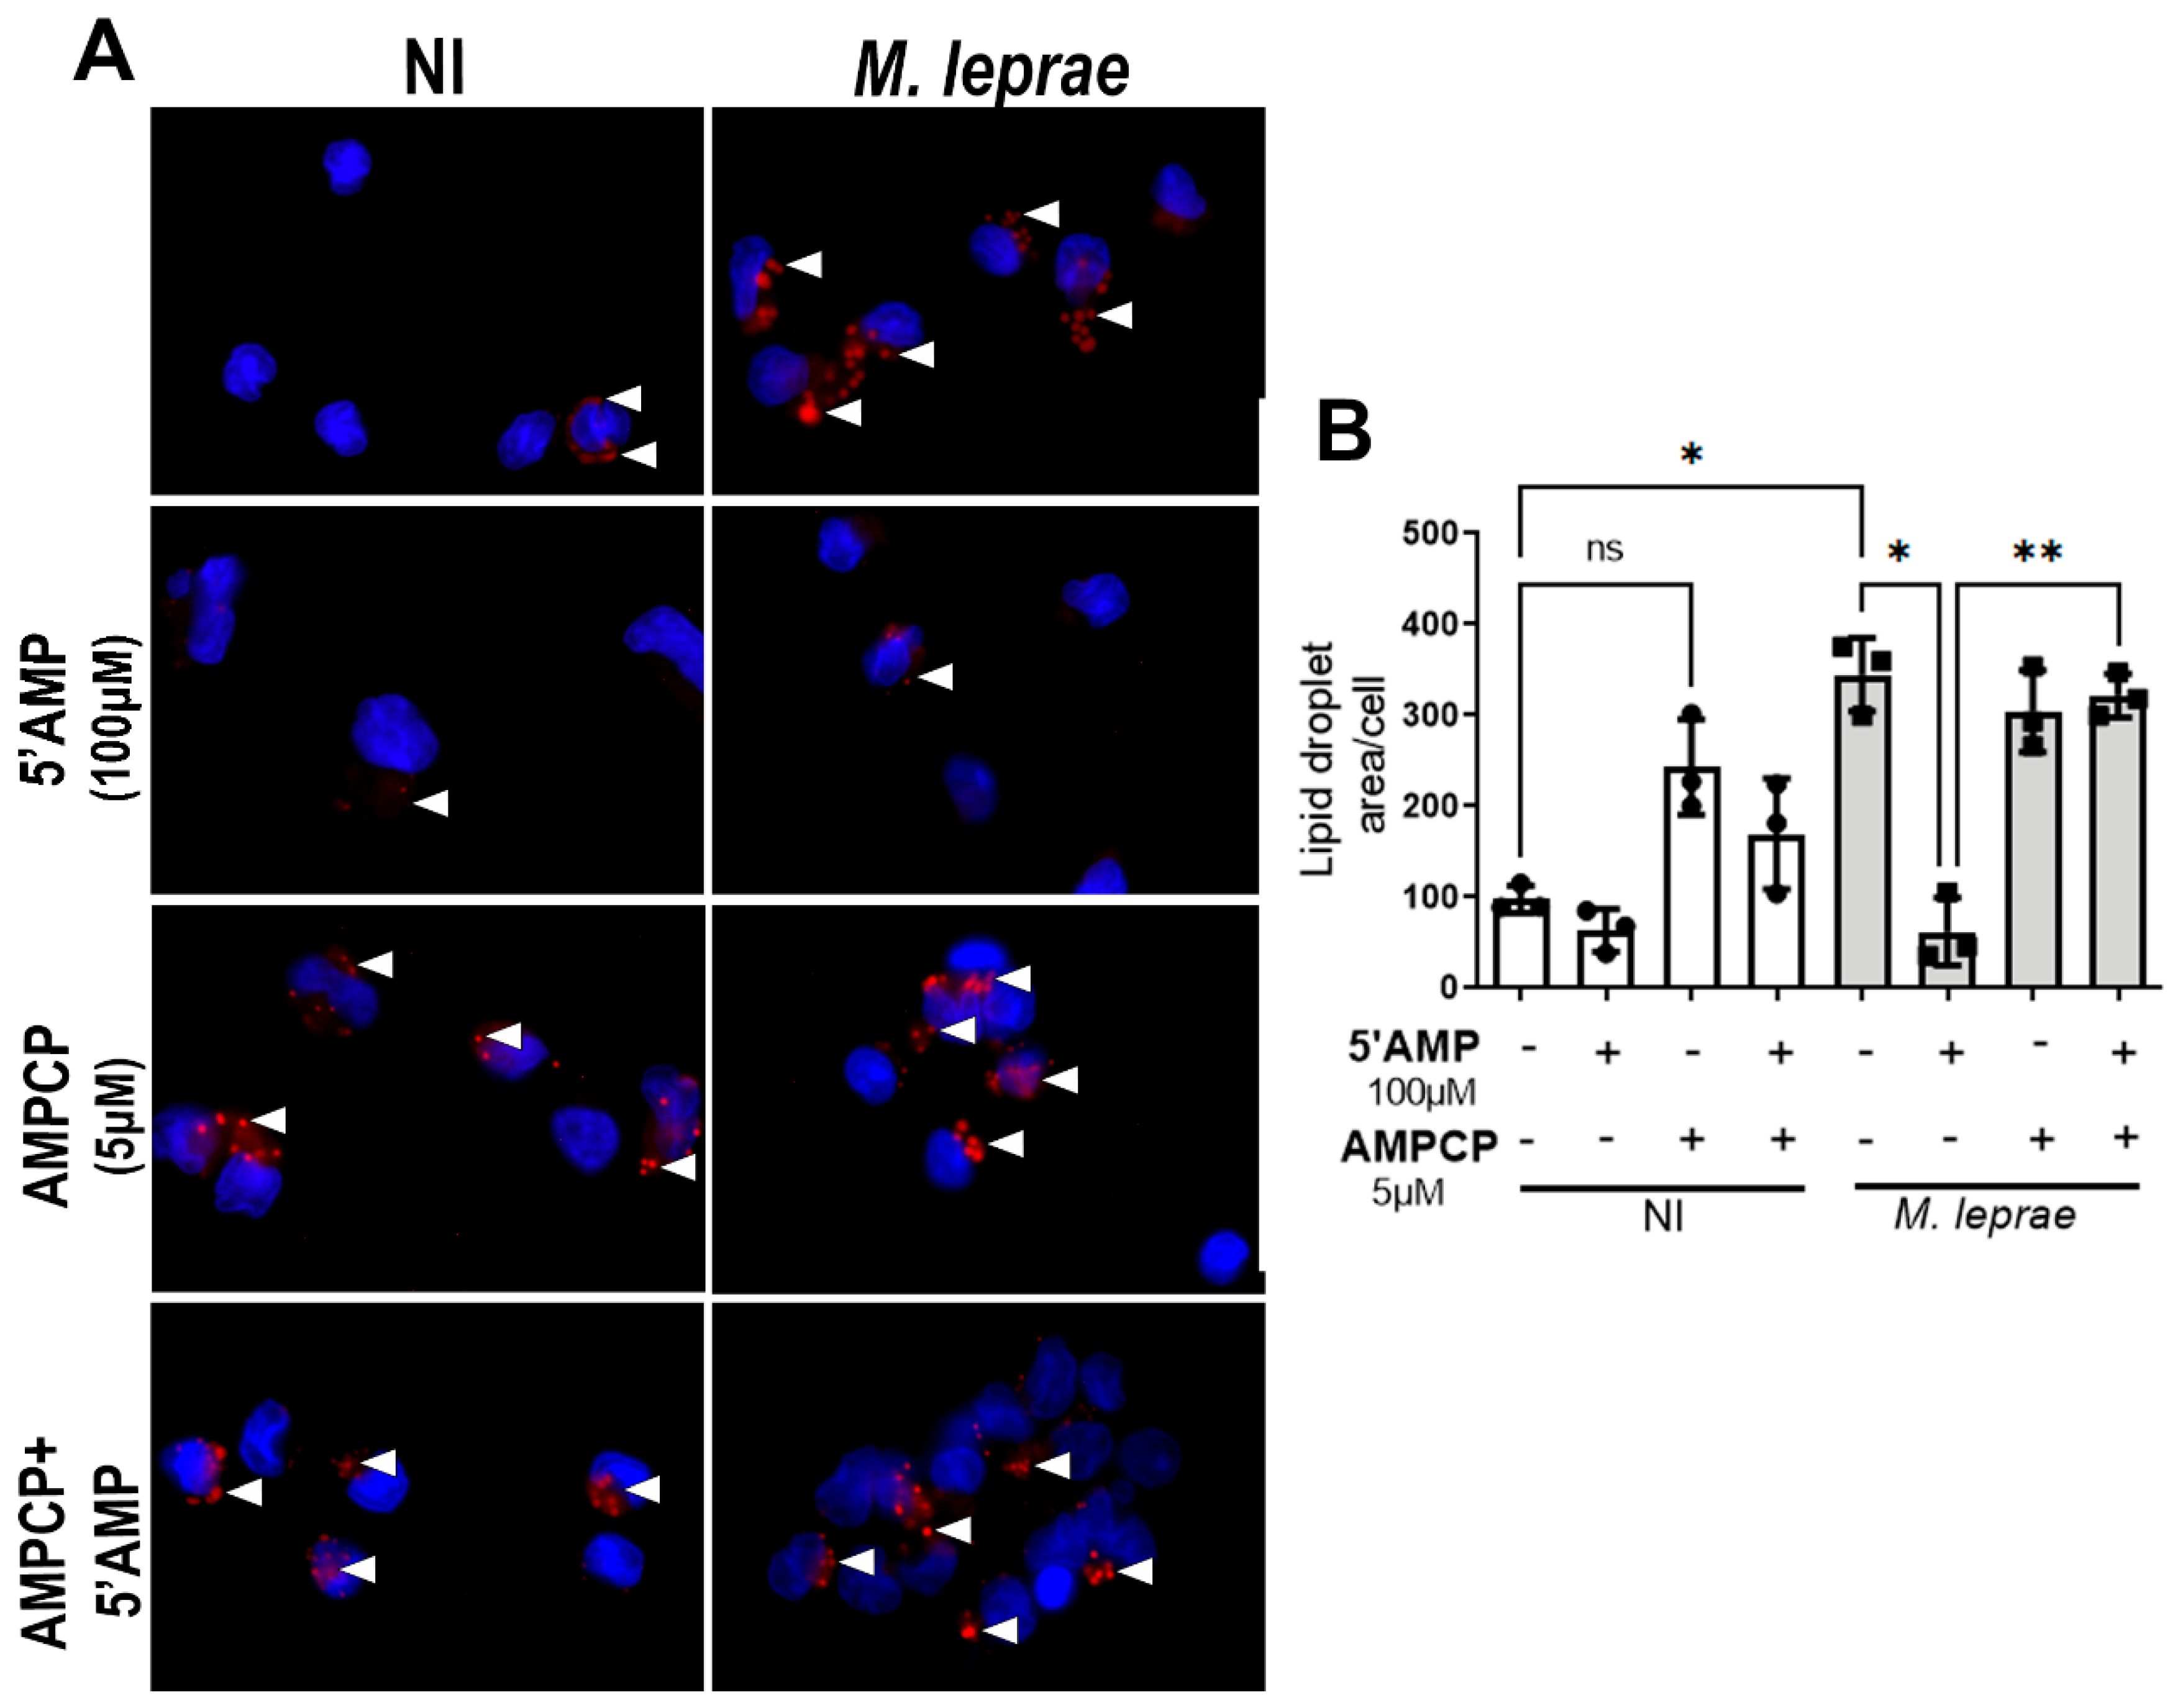
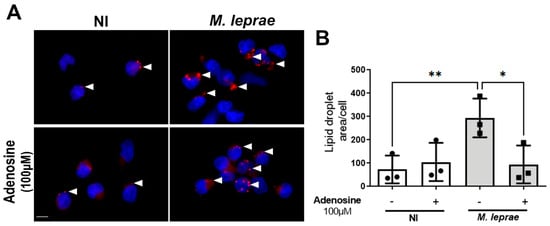
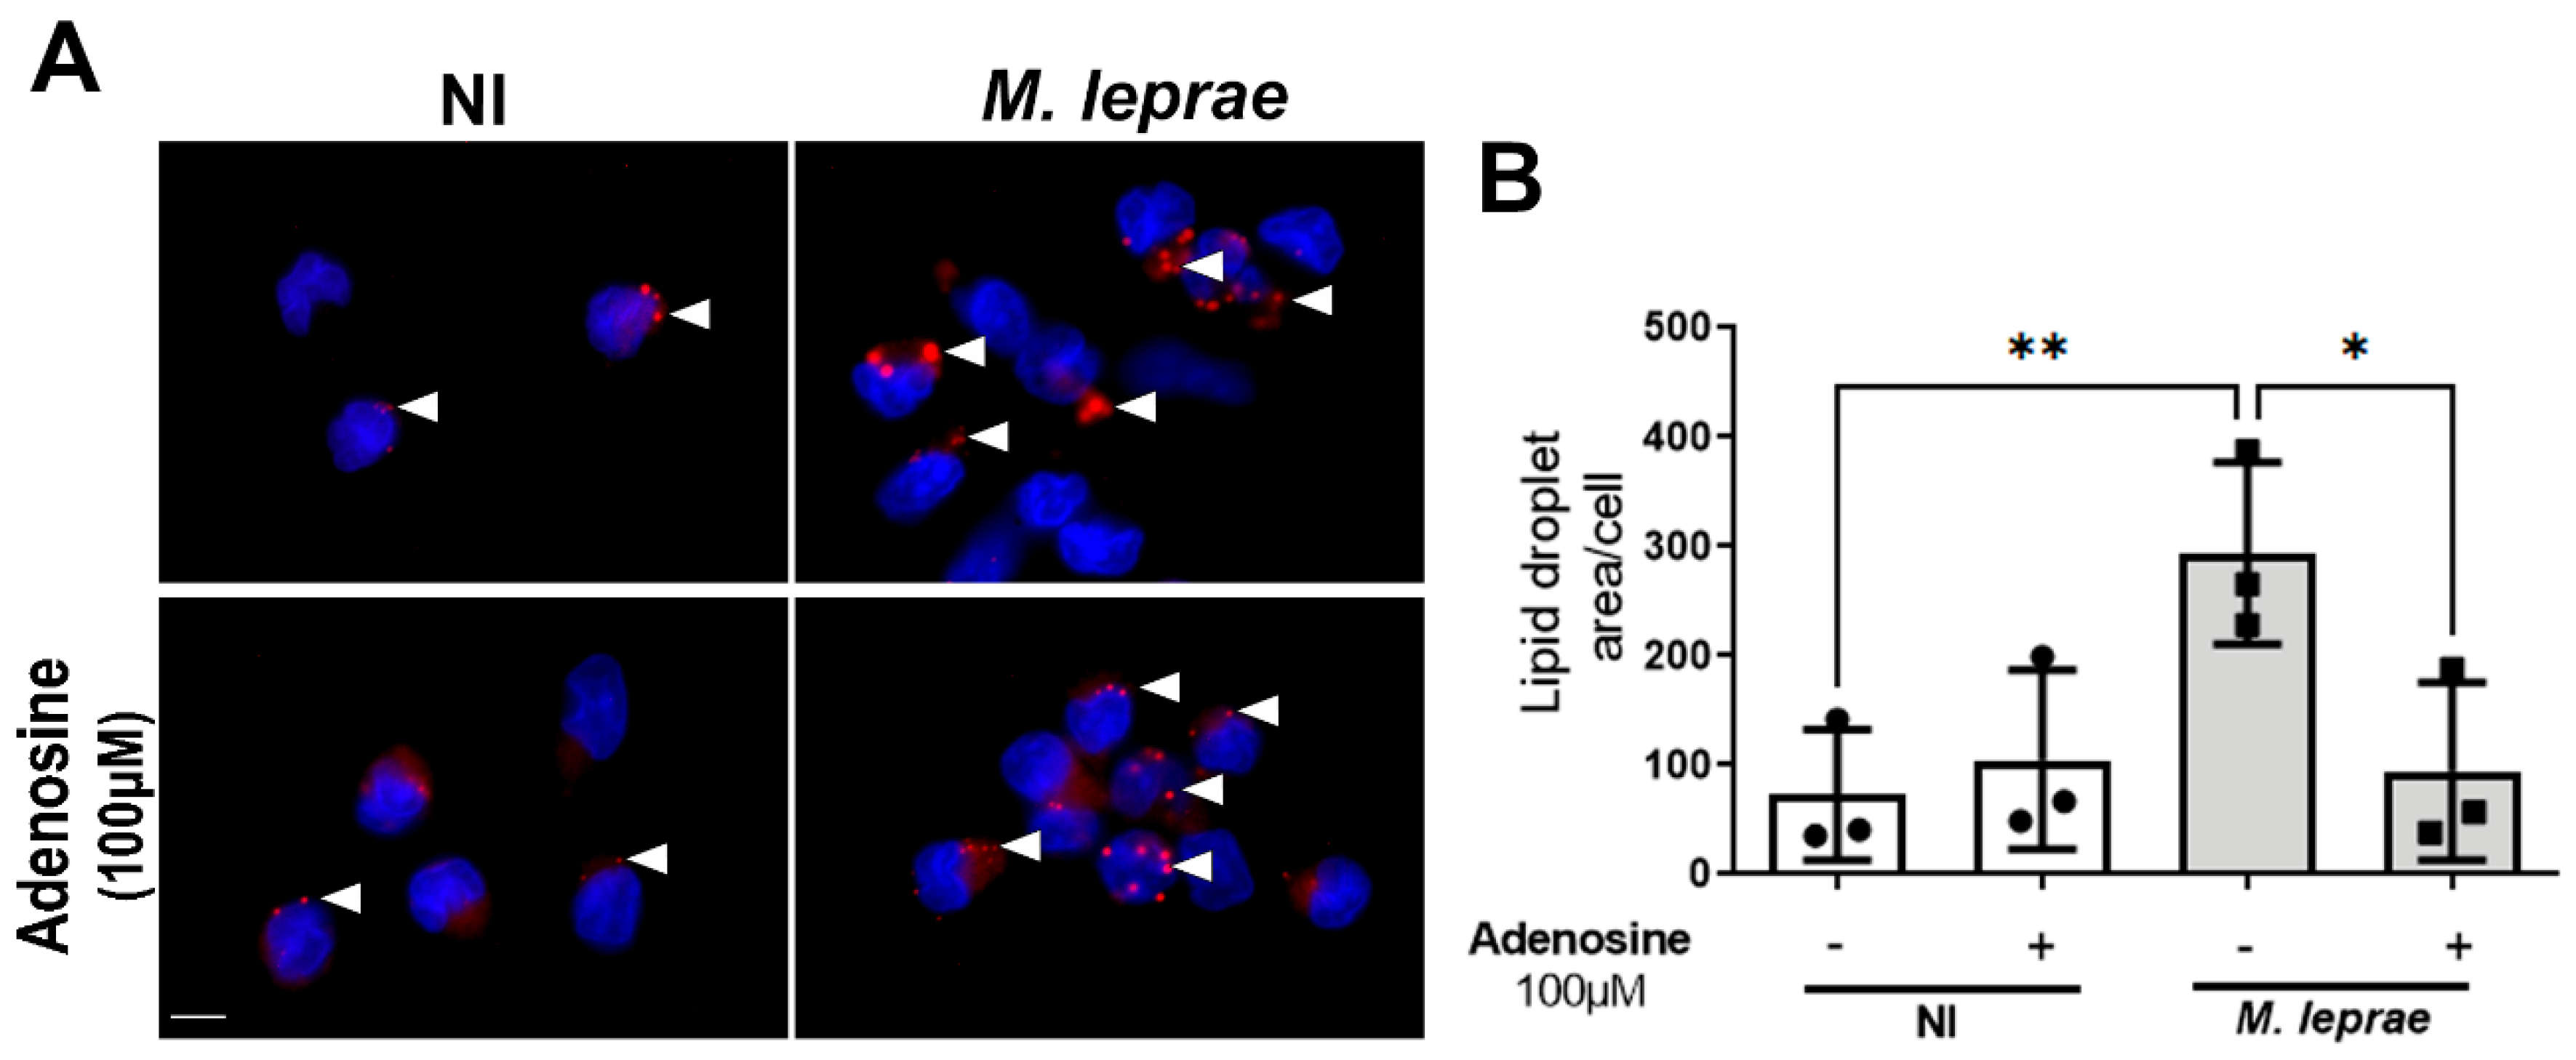
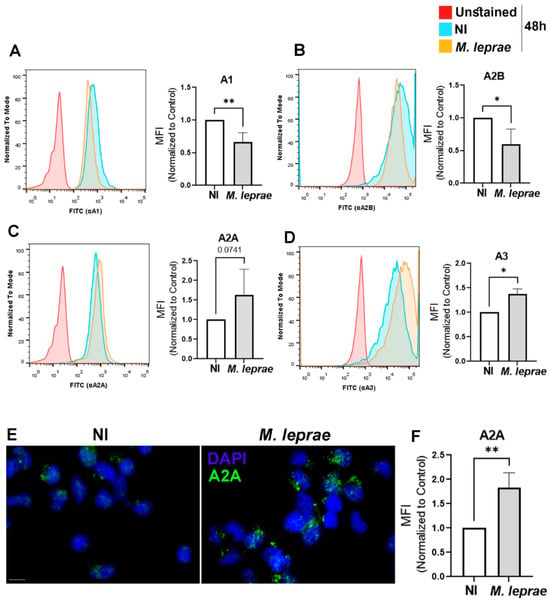
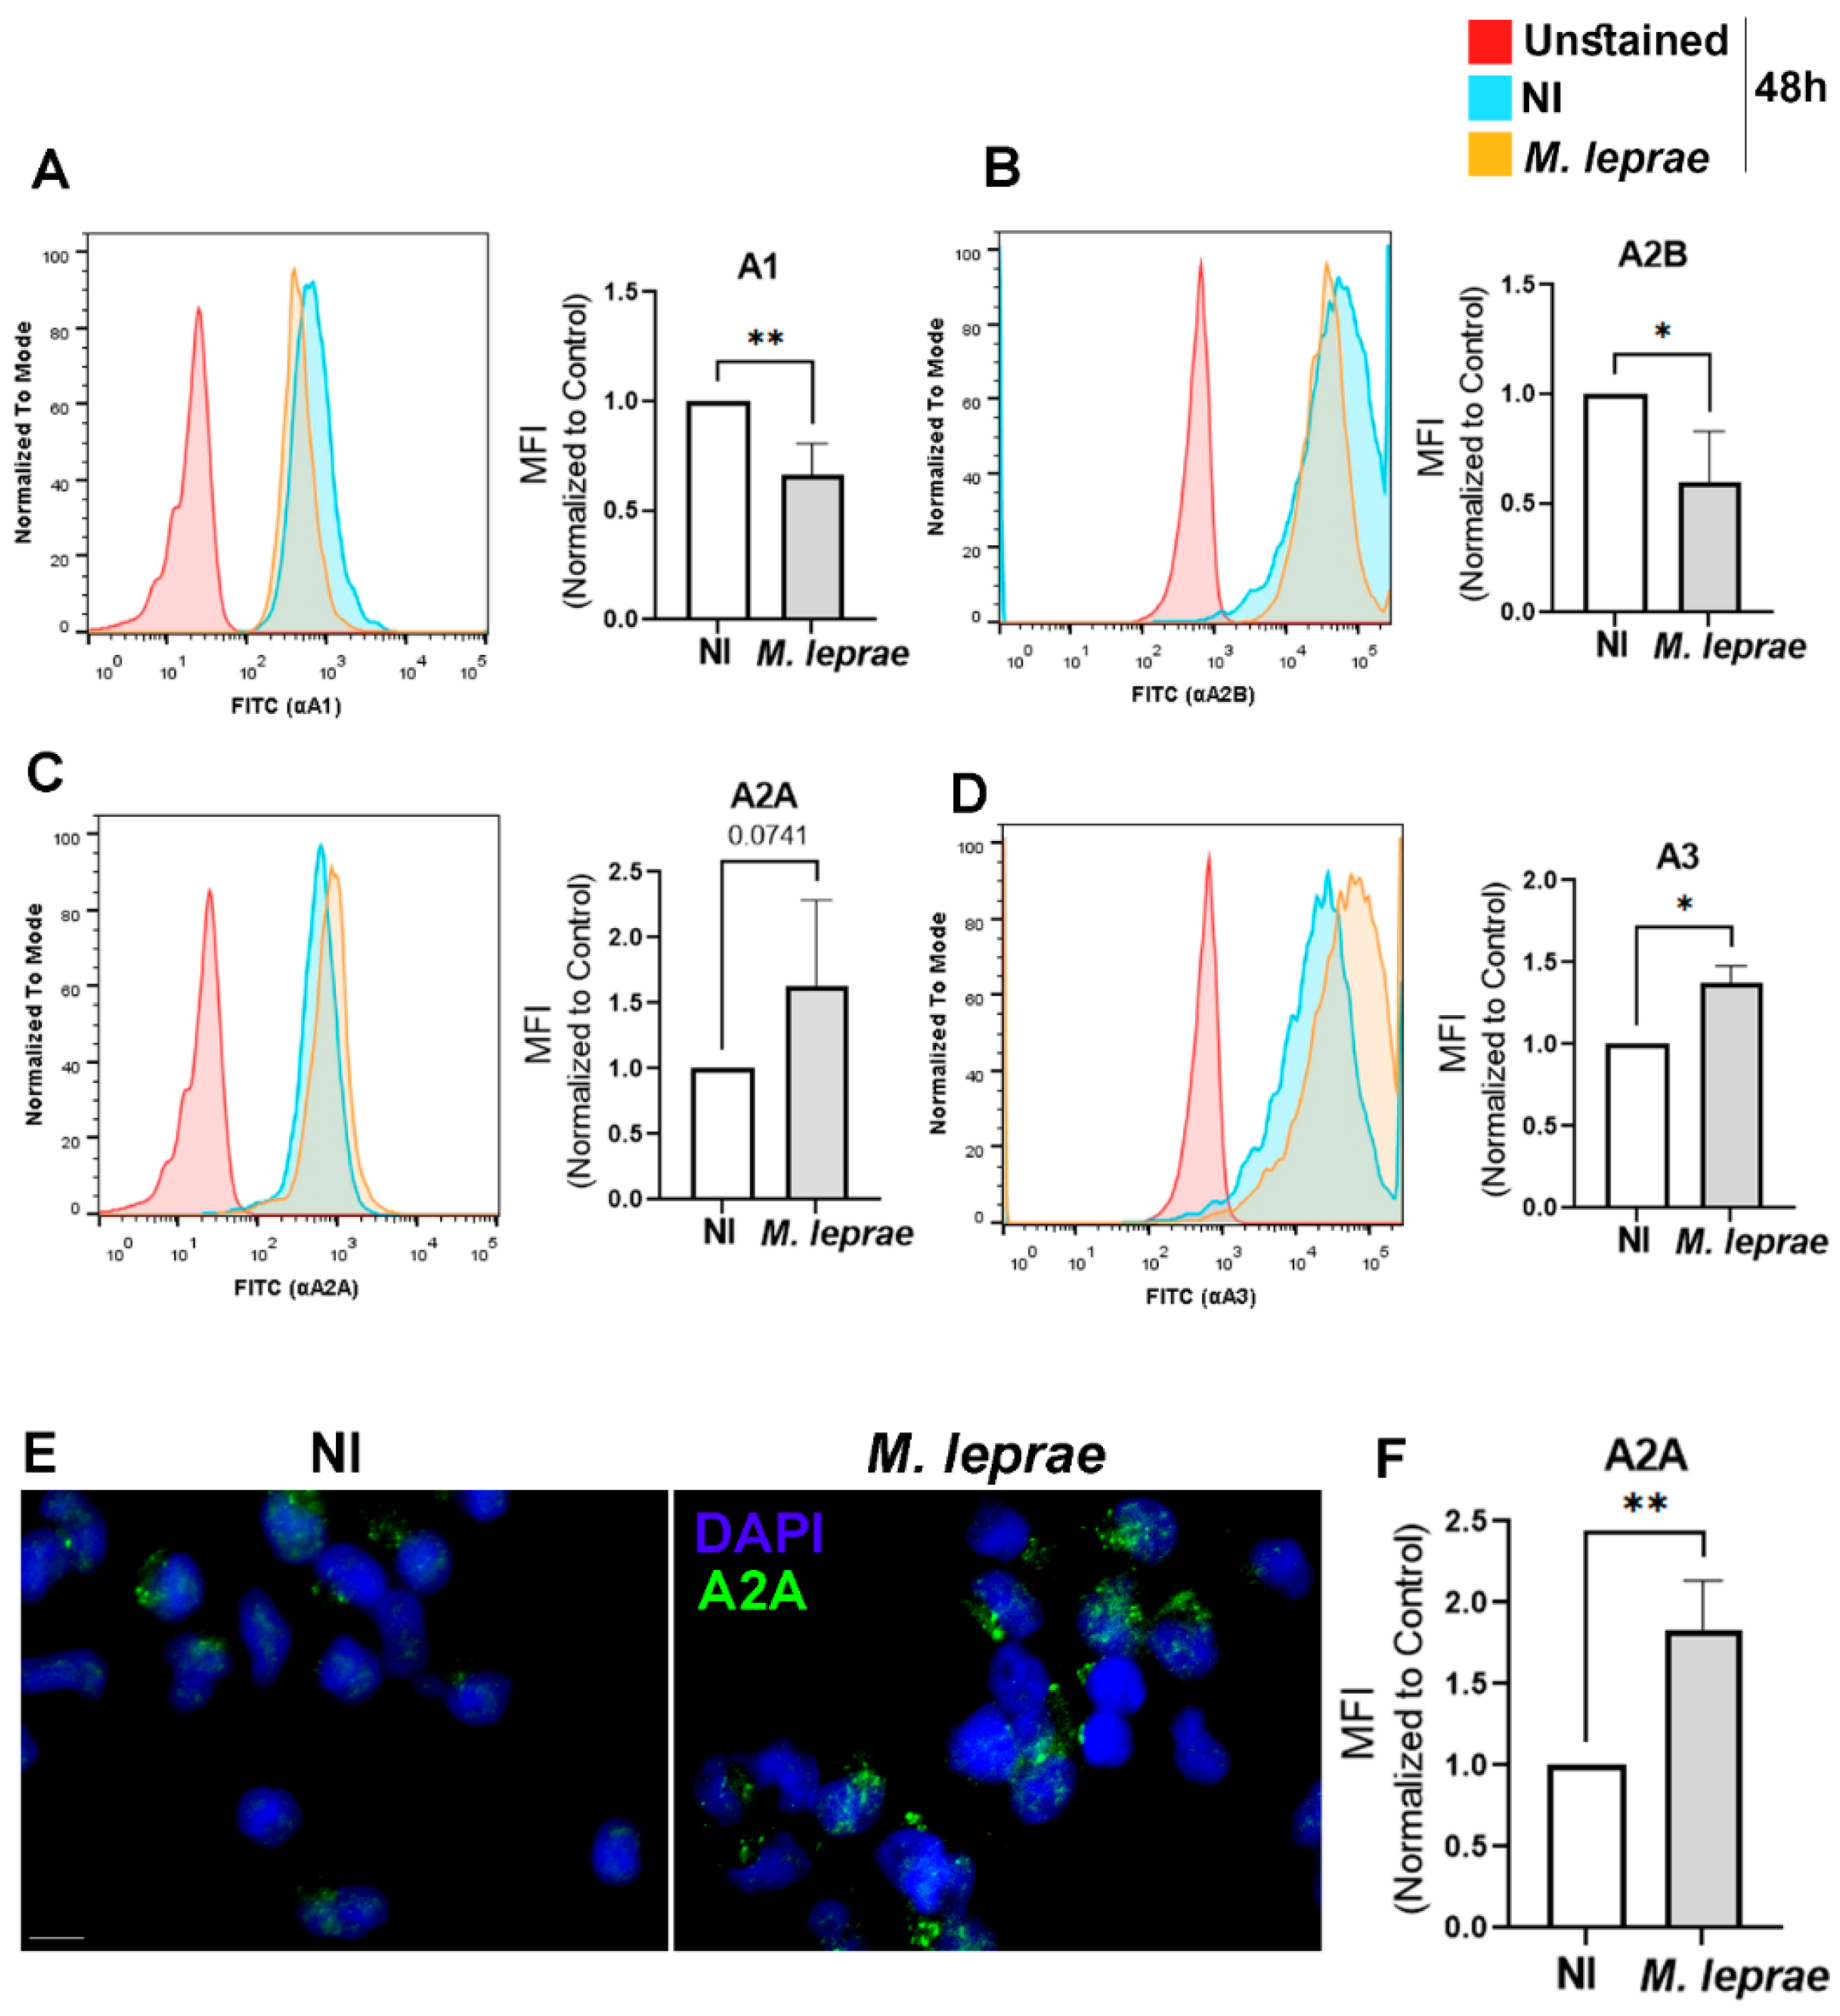
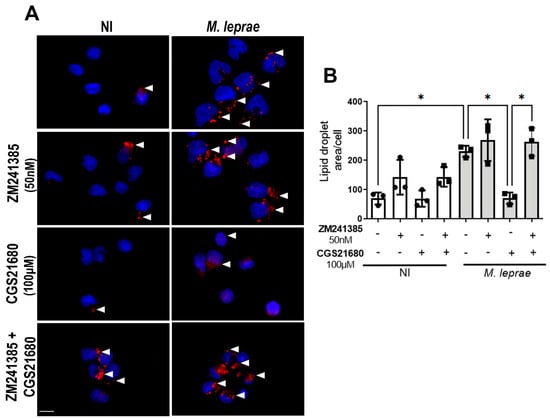
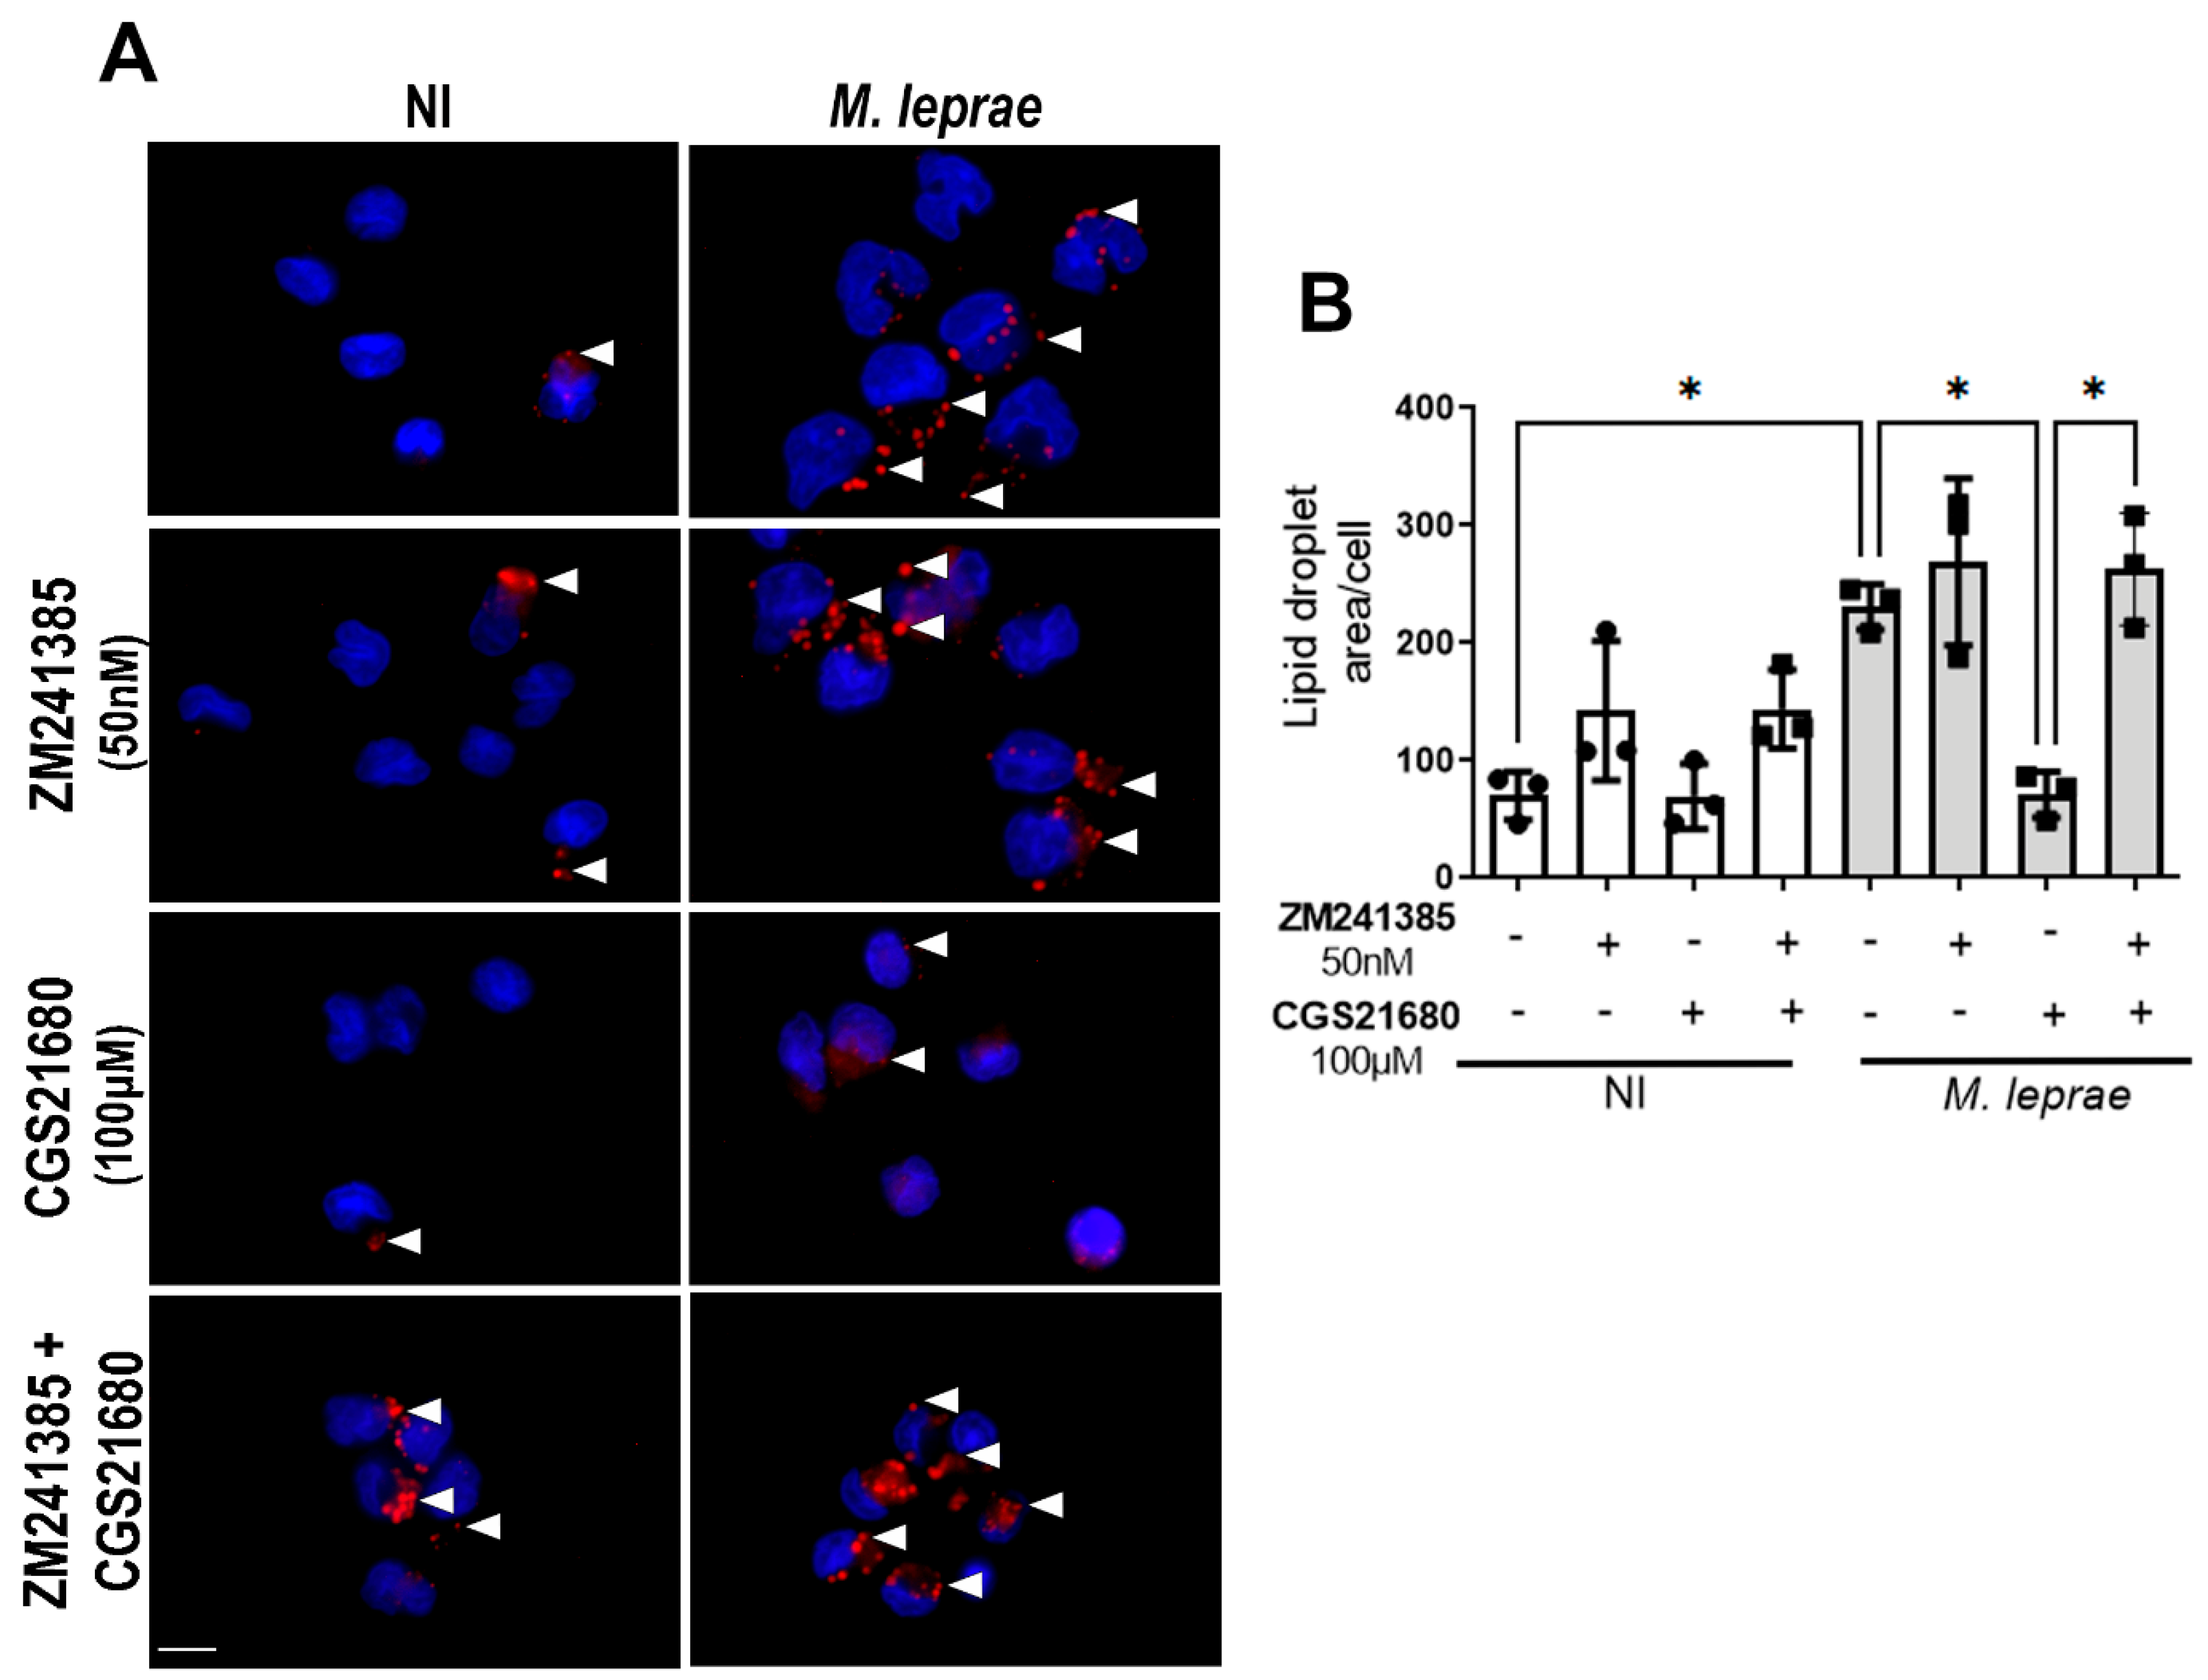
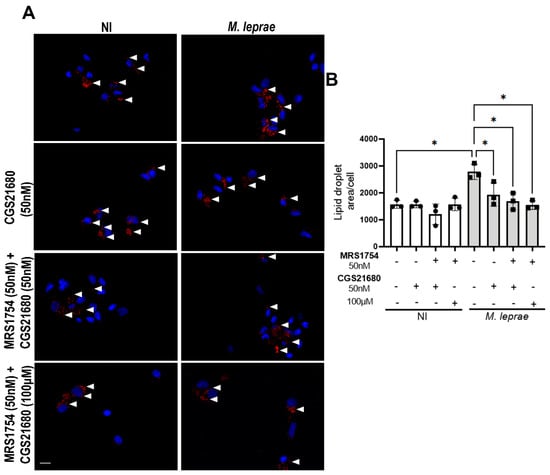
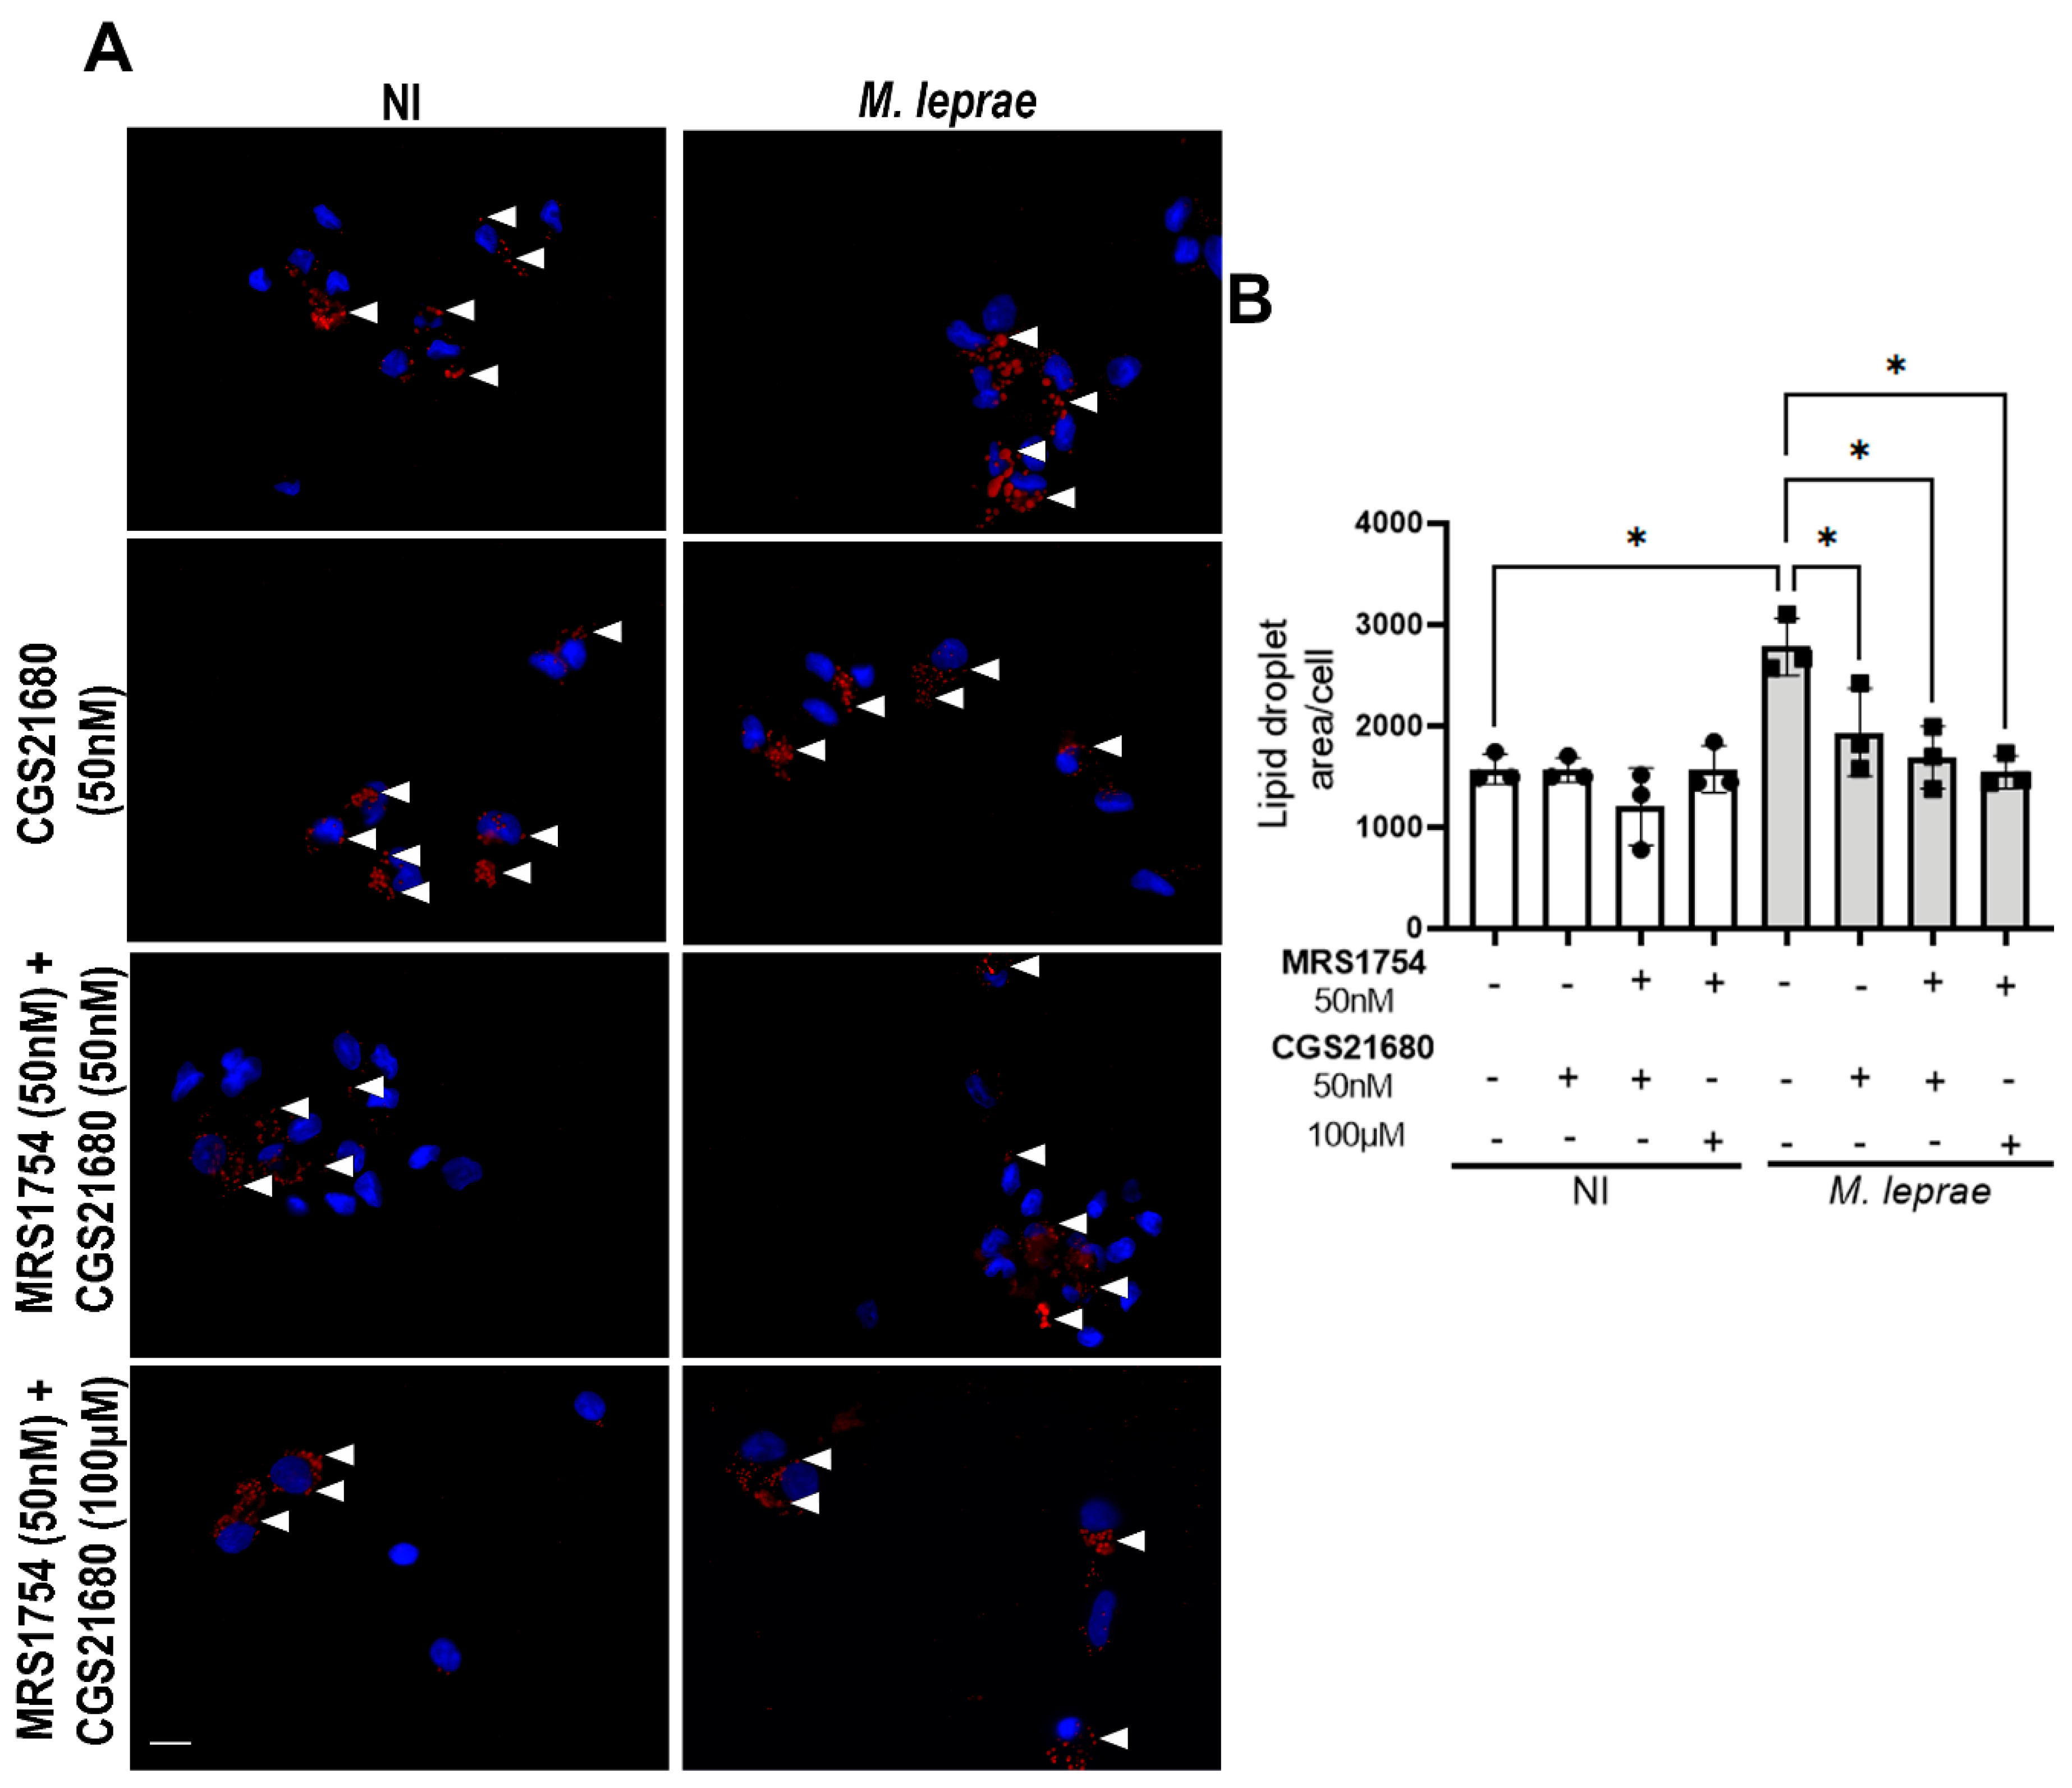
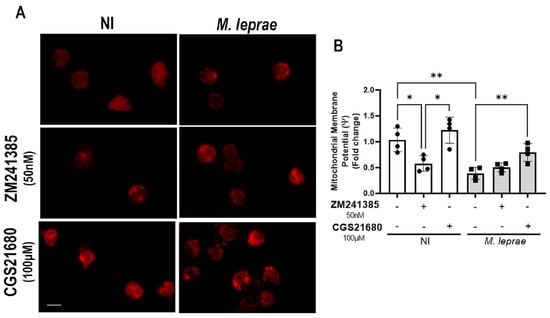
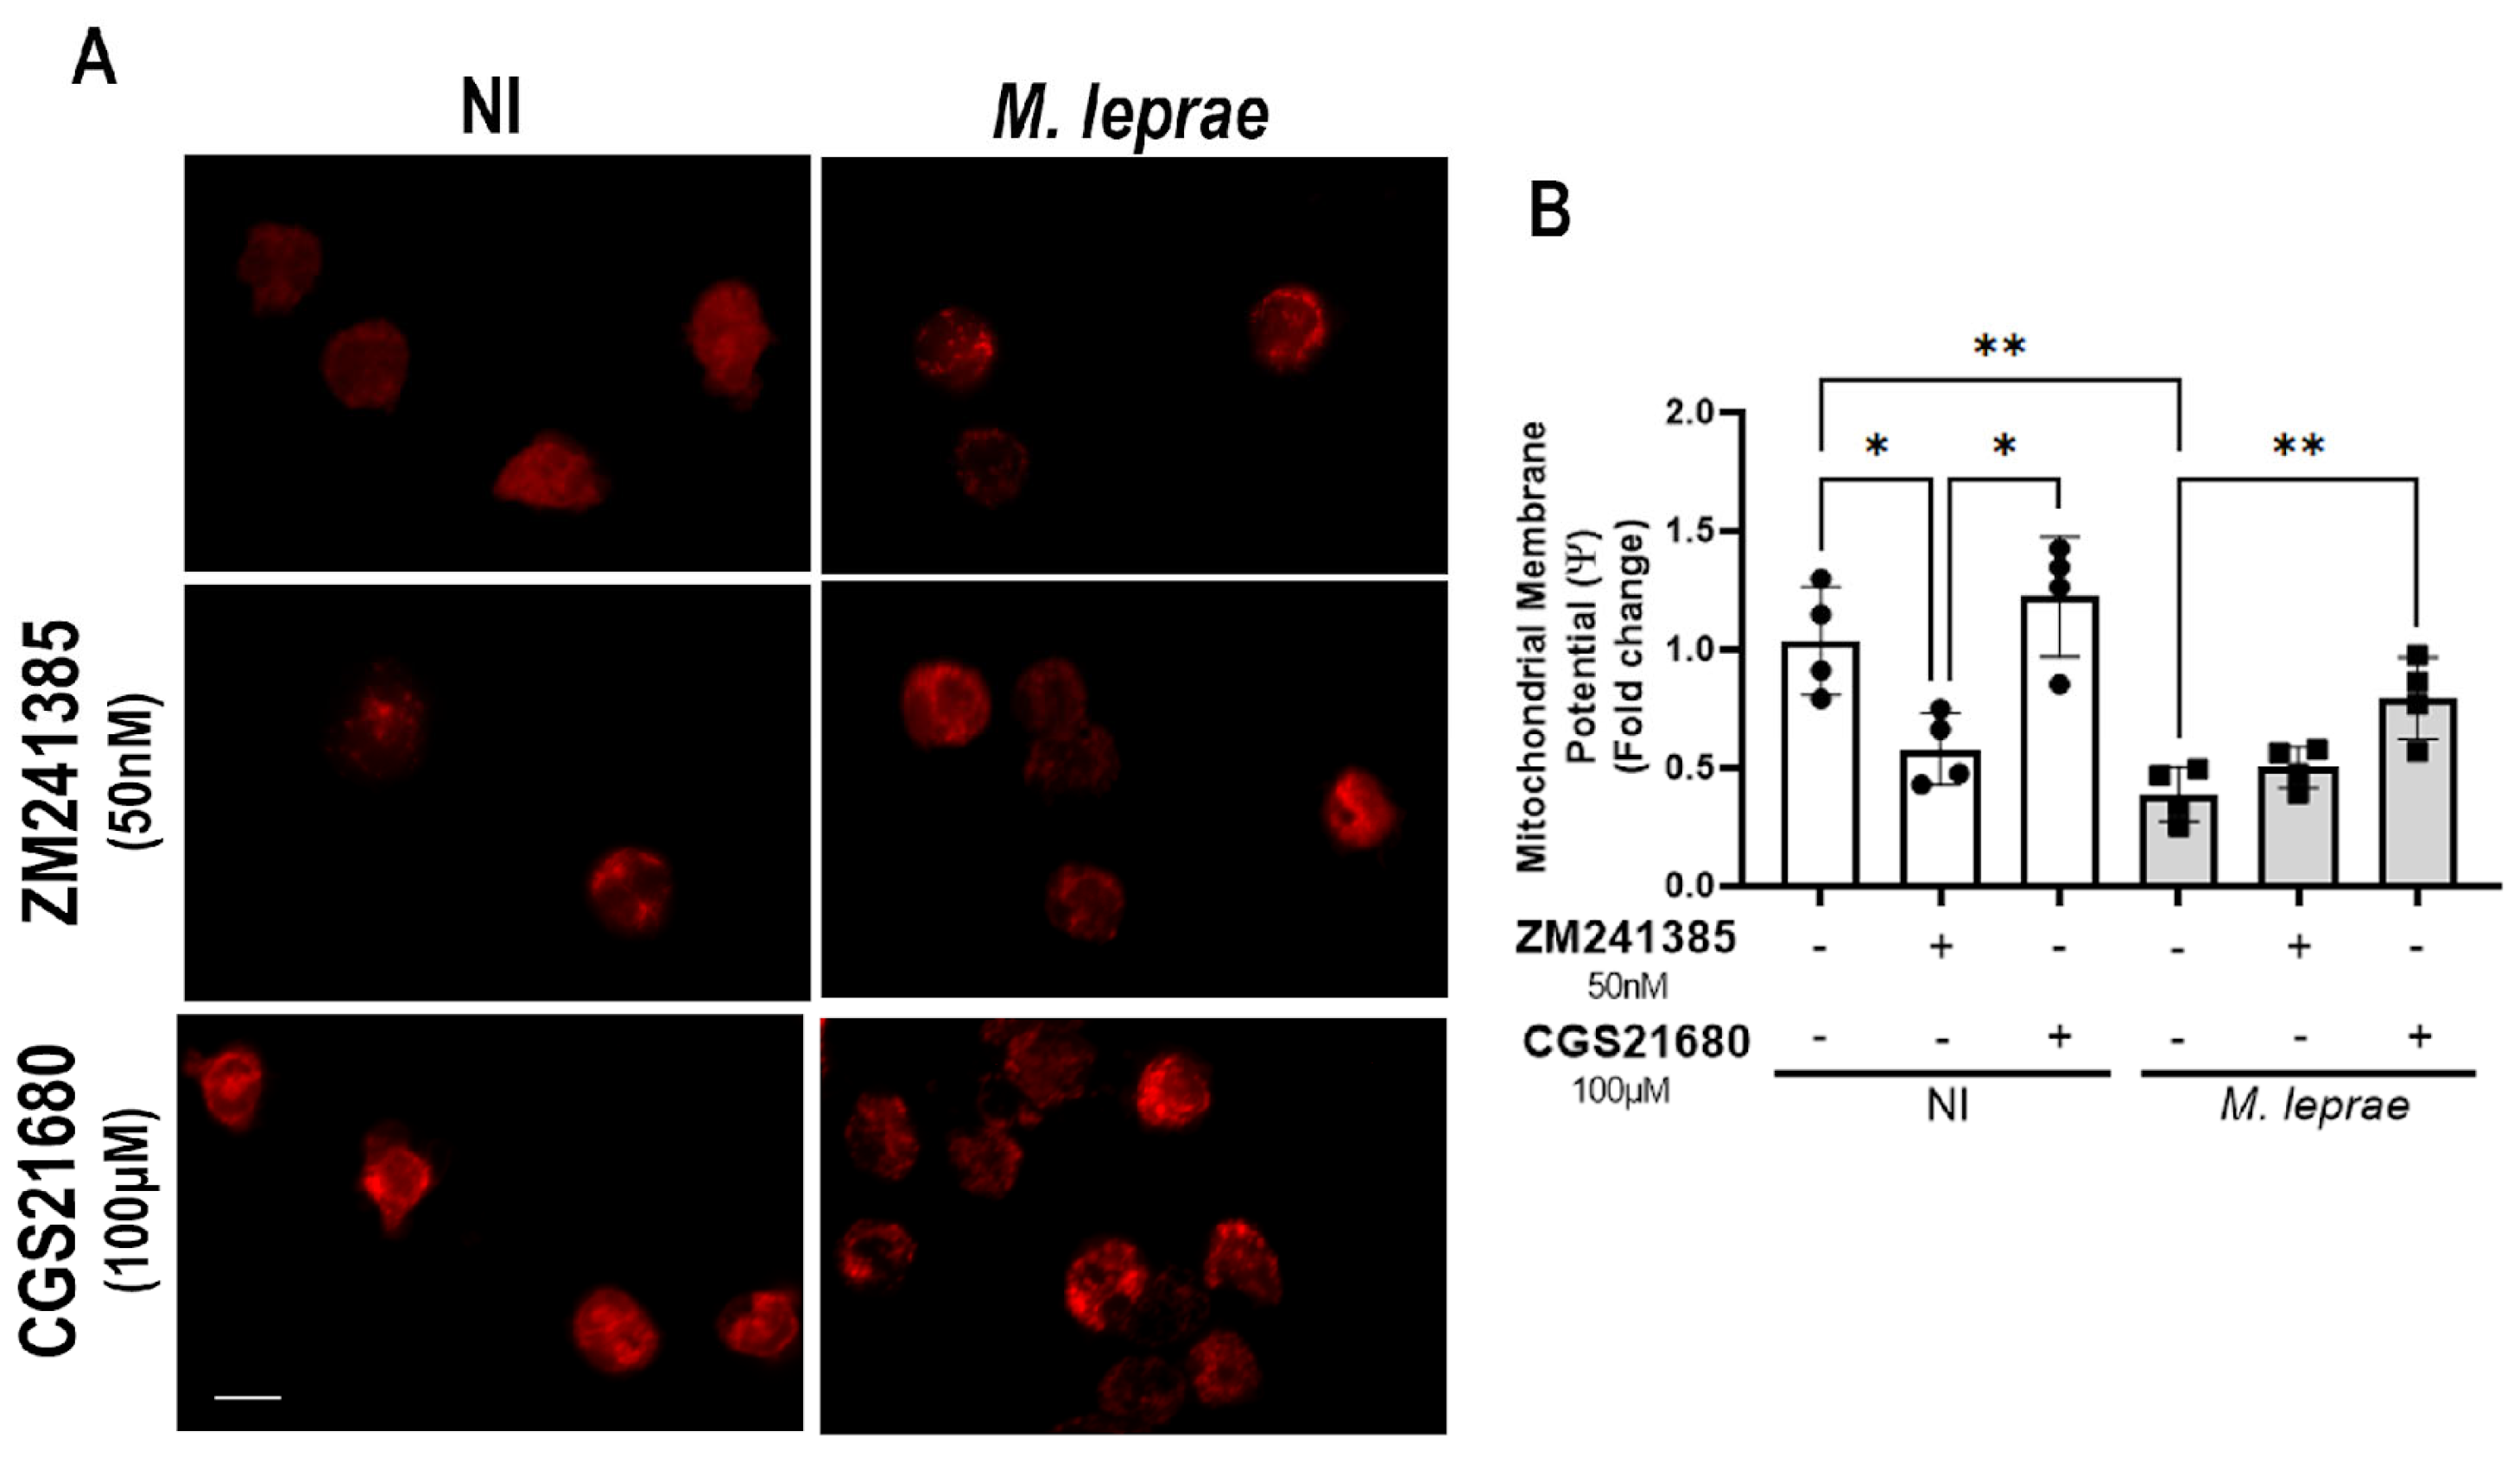
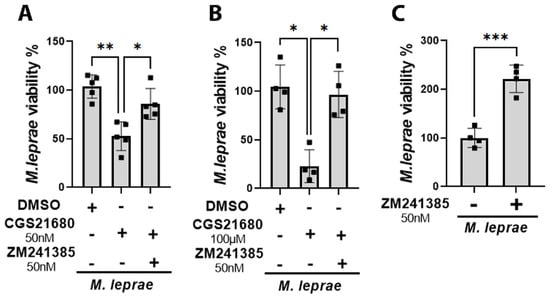
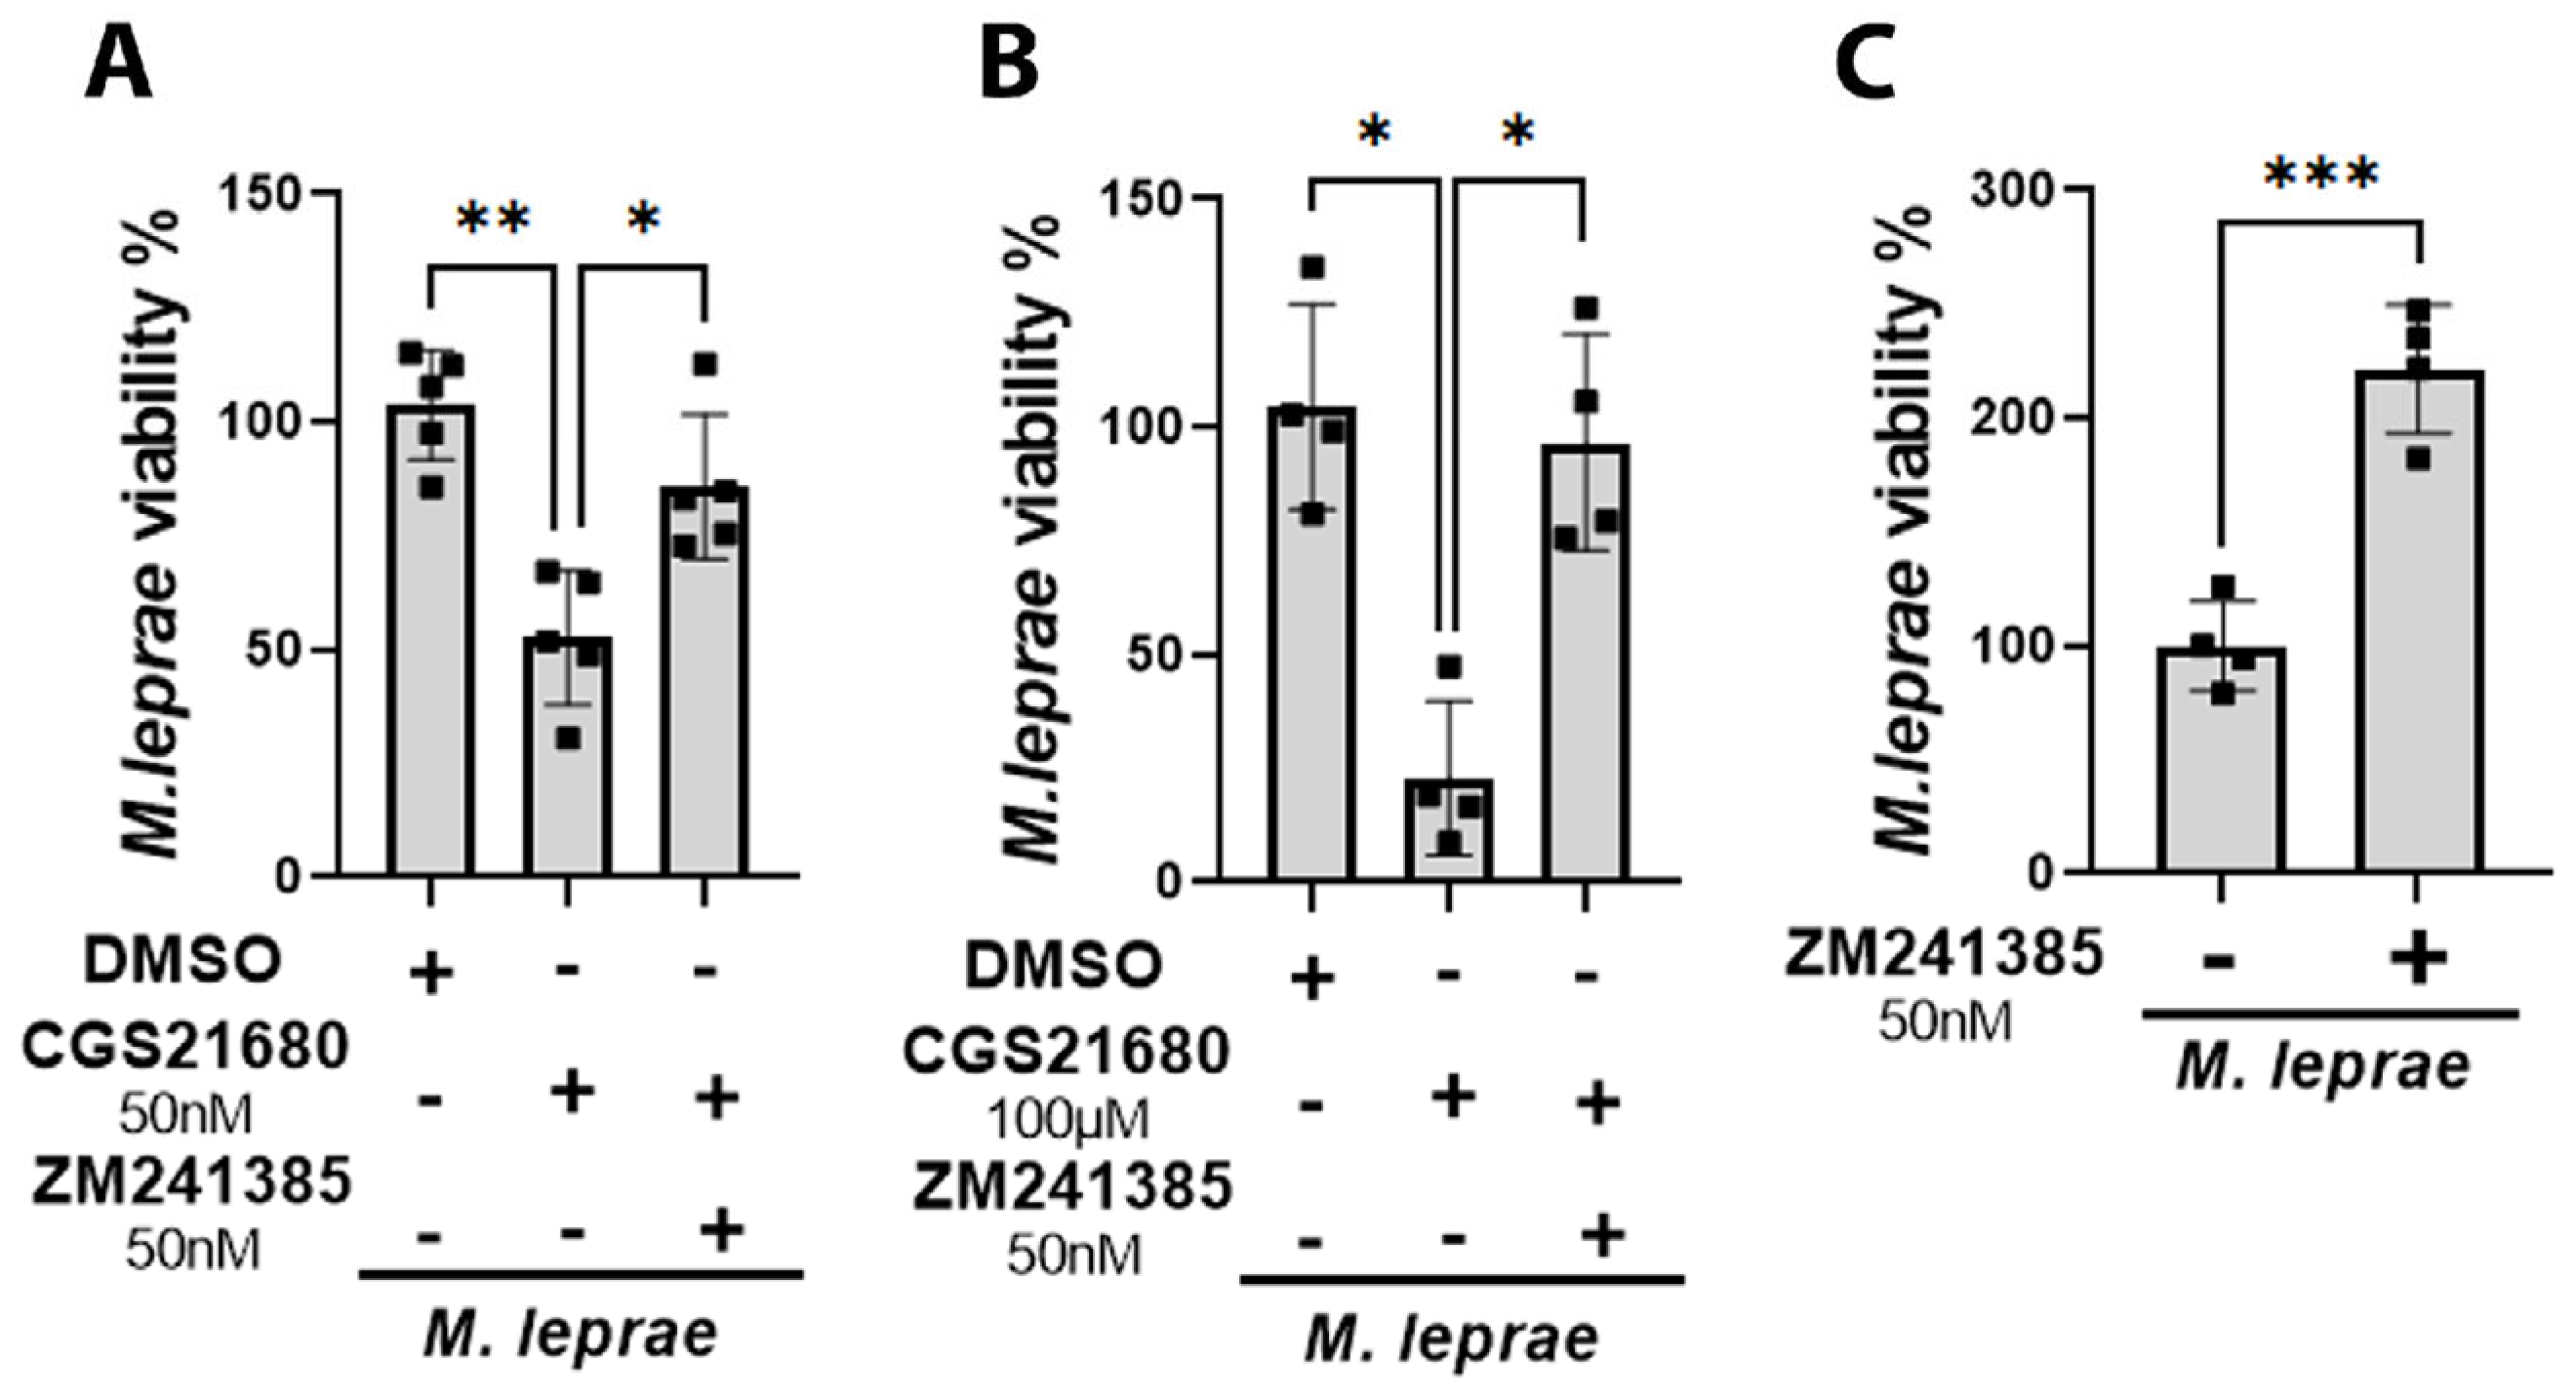
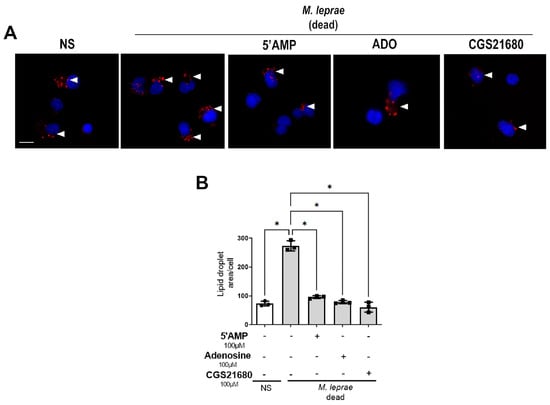
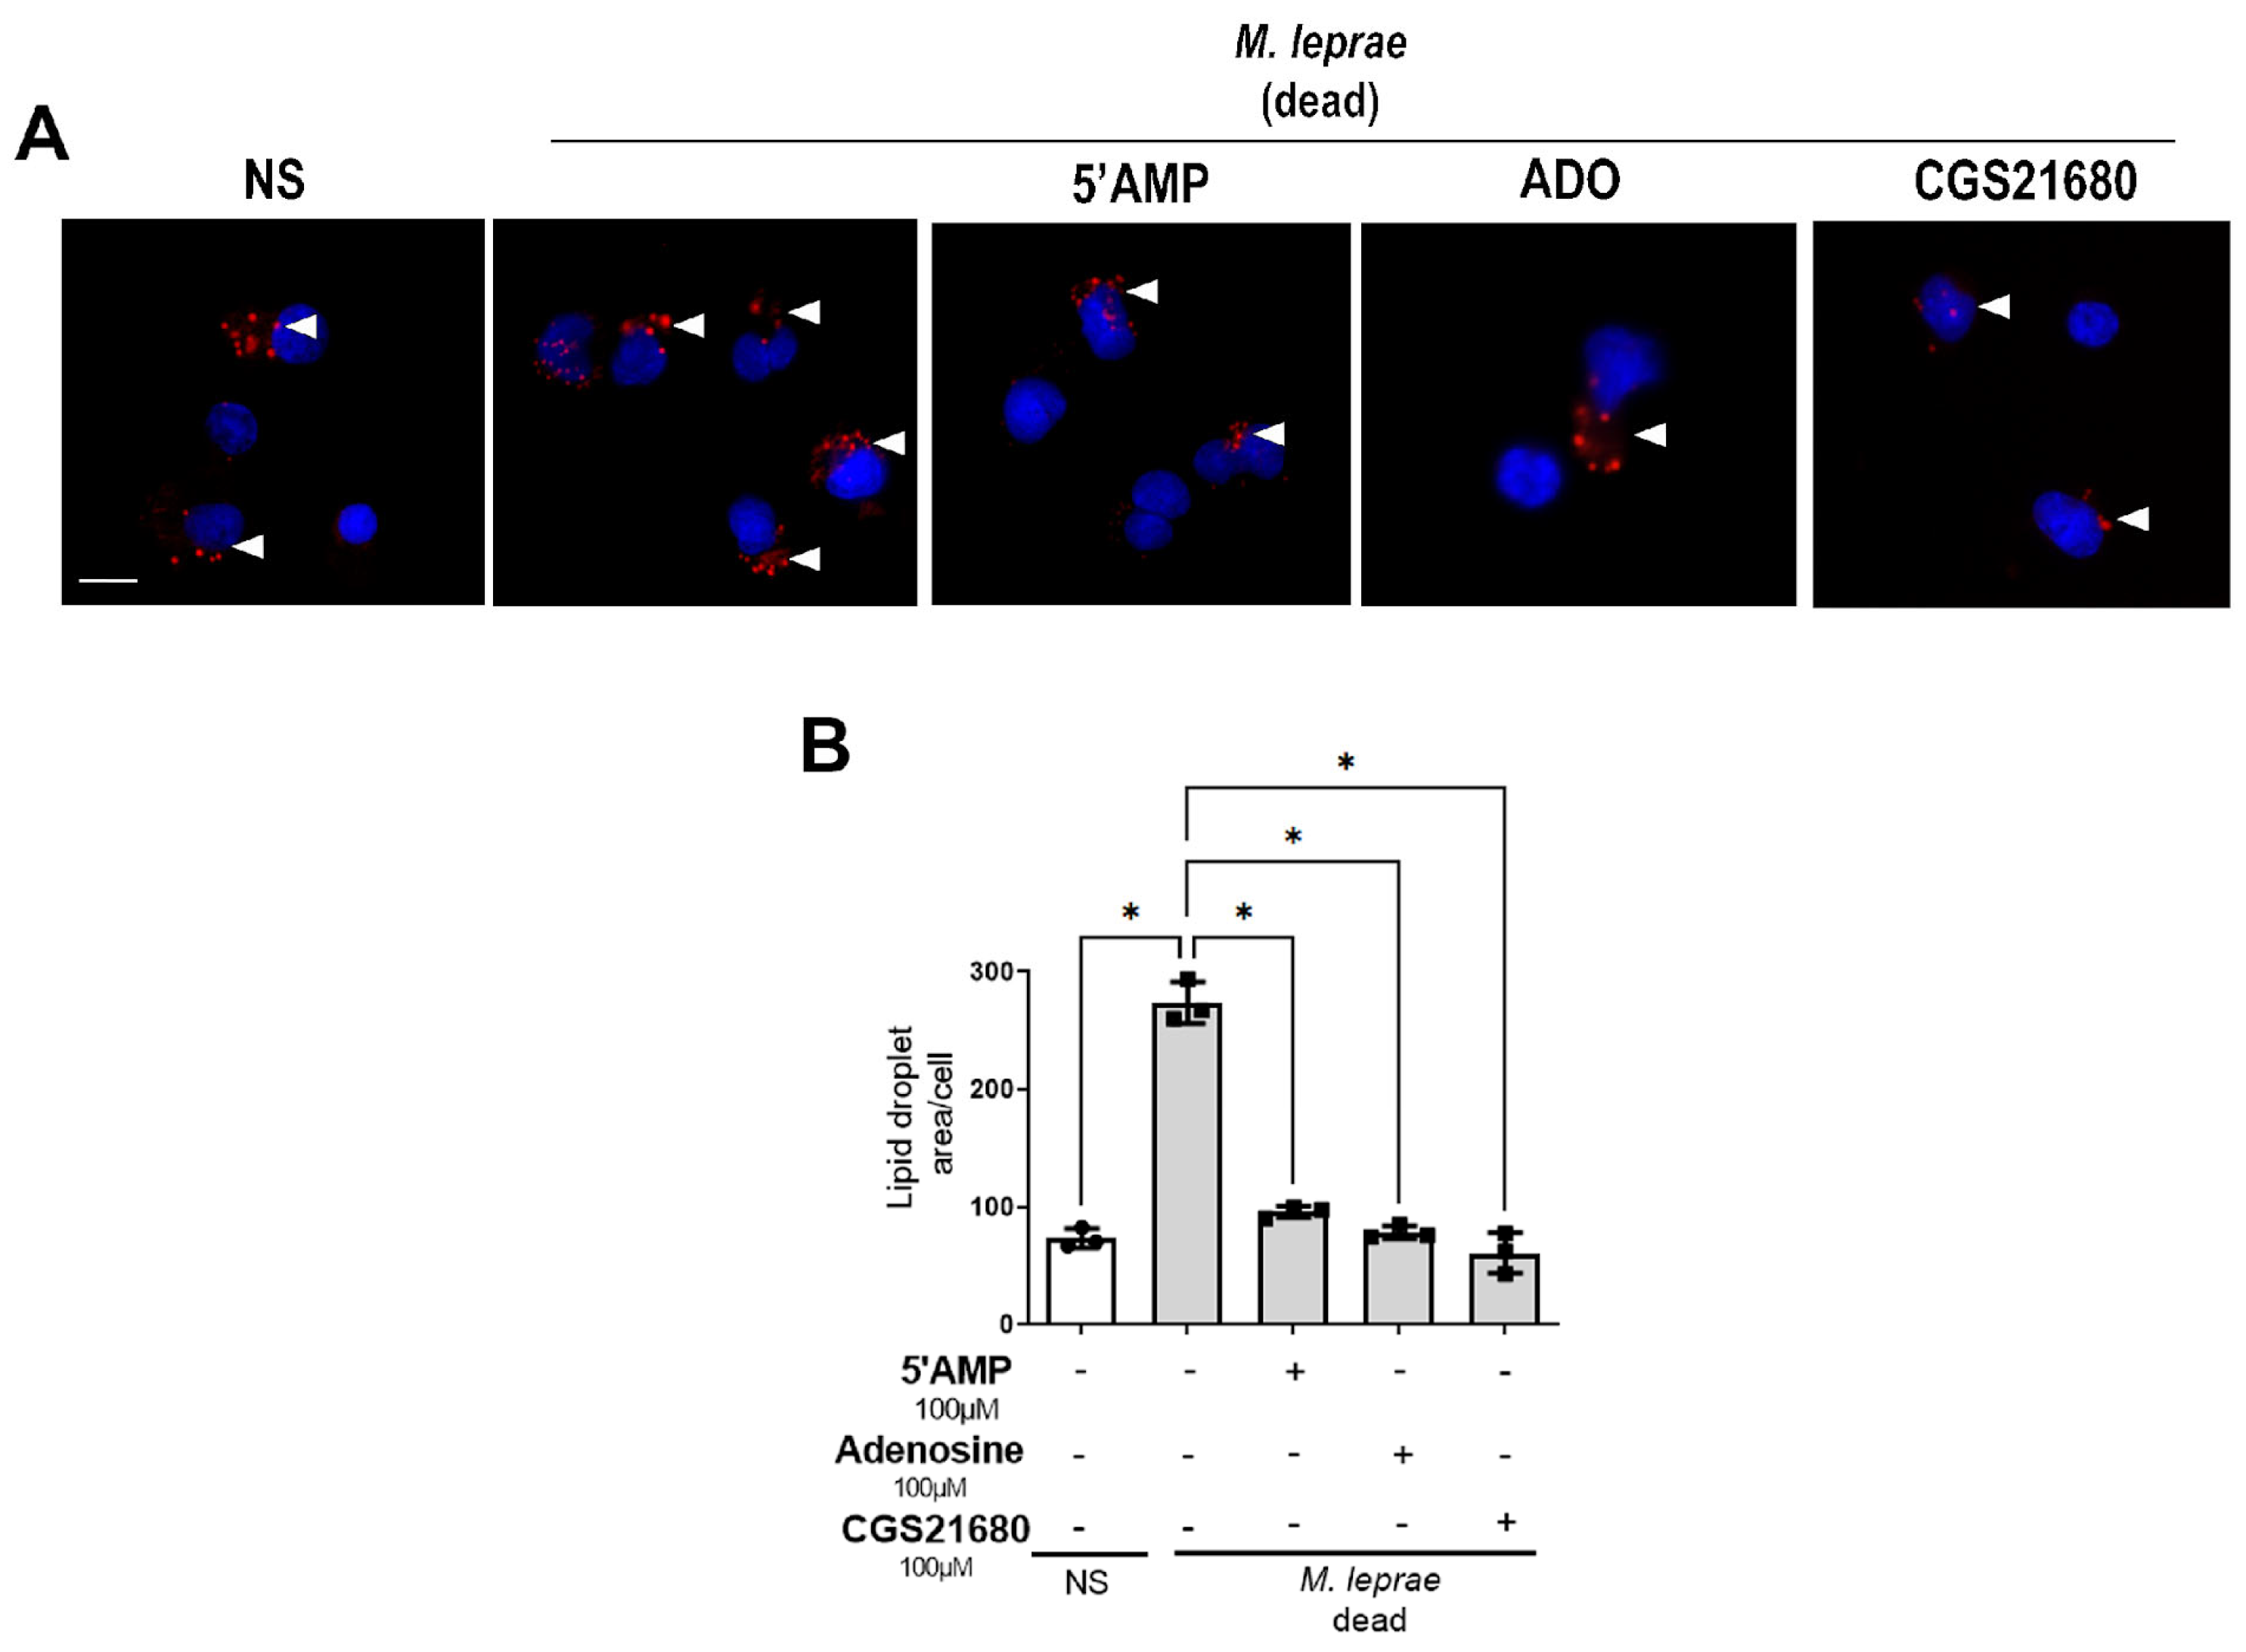
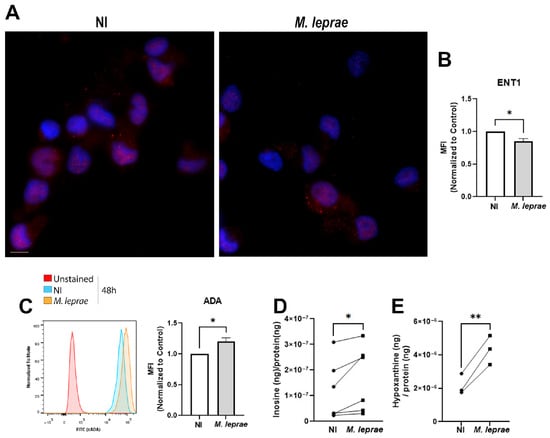
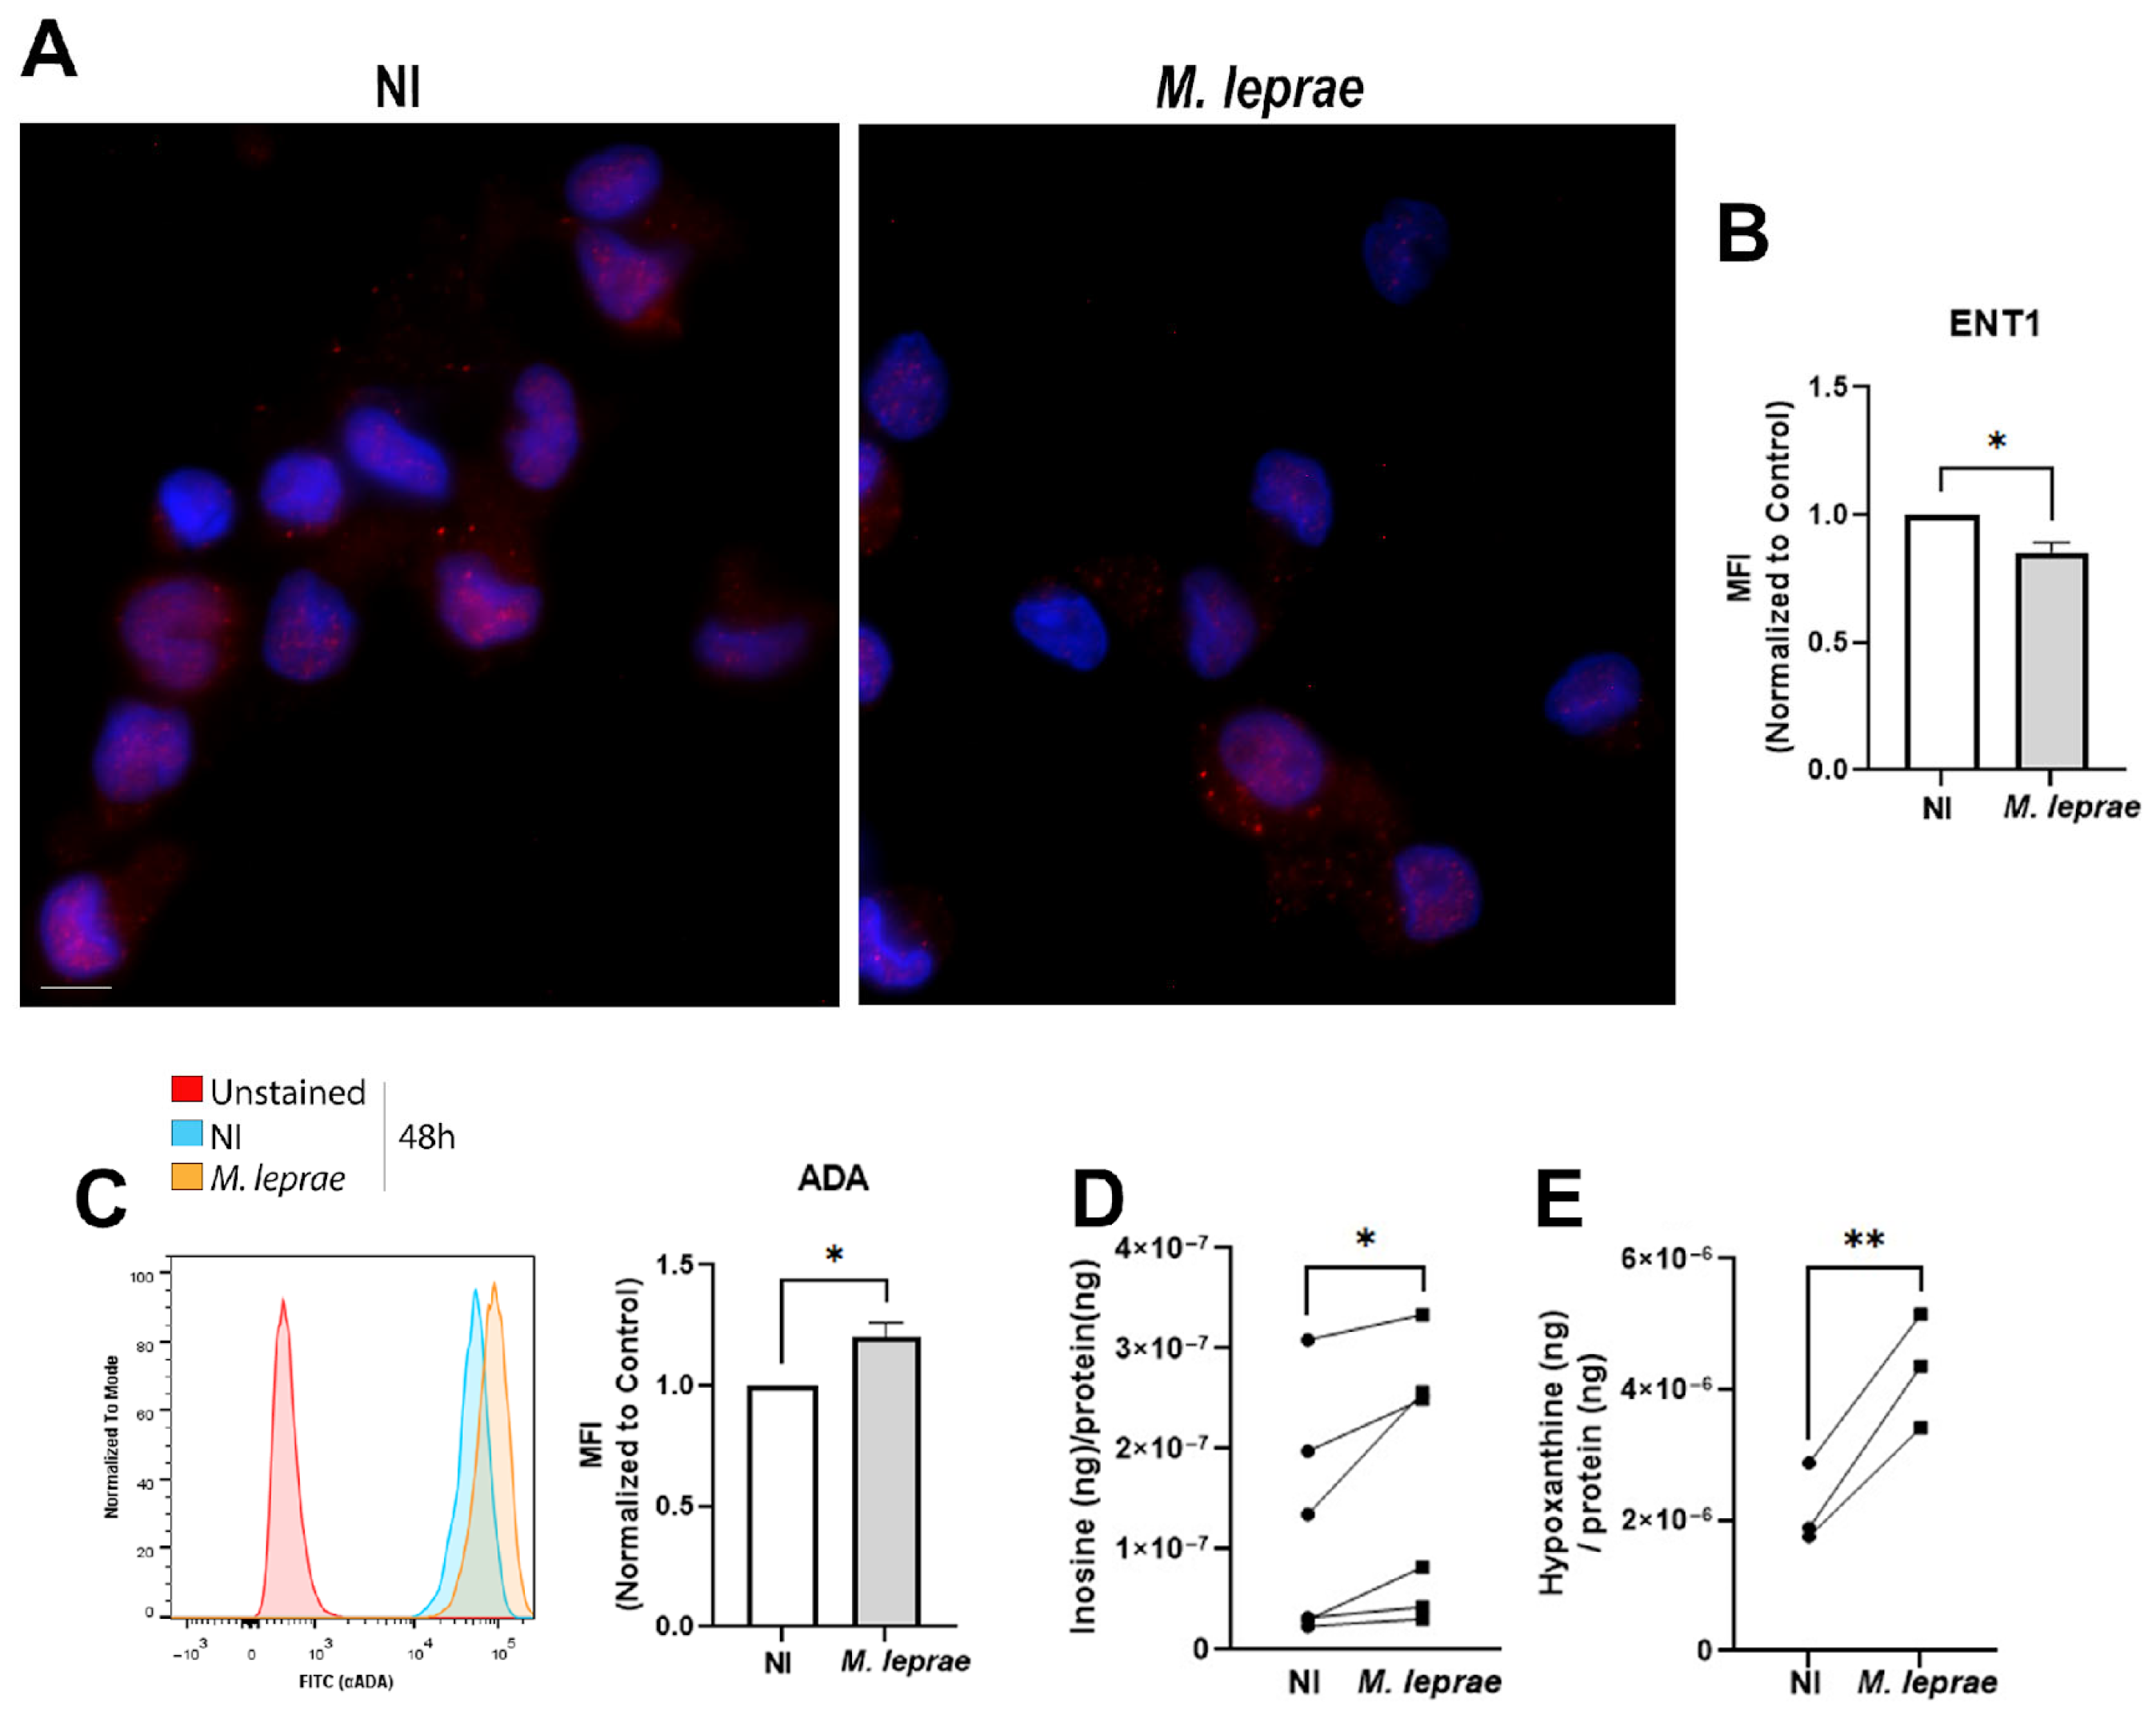
Disclaimer/Publisher’s Note: The statements, opinions and data contained in all publications are solely those of the individual author(s) and contributor(s) and not of MDPI and/or the editor(s). MDPI and/or the editor(s) disclaim responsibility for any injury to people or property resulting from any ideas, methods, instructions or products referred to in the content. |
© 2026 by the authors. Licensee MDPI, Basel, Switzerland. This article is an open access article distributed under the terms and conditions of the Creative Commons Attribution (CC BY) license.