


Abstract
Background: Acute metabolic responses to individualized blood flow restriction pressures remain incompletely characterized in trained athletes. Methods: Twenty-four male sprinters were randomized to blood flow-restricted resistance training (BFR-RT) at 50% or 80% of individual venous occlusion pressure (VOP; n = 12 each). Biochemical and untargeted plasma metabolomic responses were assessed before and after the first BFR-RT session. Strength, muscle morphology, and jump performance were assessed before and after four weeks. Results: Both groups showed acute lactate and growth hormone increases and cortisol decreases. Acute between-pressure biochemical differences did not remain significant after multiple-testing correction. Exploratory metabolomics identified shared candidate response patterns with differing mean amplitudes between pressures. Back-squat strength increased in both groups, while most functional changes showed no detected between-pressure difference. Conclusions: Both VOP prescriptions were accompanied by short-term strength gains. Candidate metabolic patterns characterized variation in the acute circulating response under the two pressure conditions.
1. Introduction
Sprint performance depends on the capacity to generate and transmit high forces within short ground-contact times, making lower-limb strength a central target of training for sprinters [1,2]. Resistance training develops this capacity, although the mechanical cost of additional high-load work must be integrated with sprint, technical, and recovery demands. Blood flow-restricted resistance training (BFR-RT) combines low external loads with proximal limb compression and can stimulate muscle protein synthesis, anabolic signaling, strength, and muscle growth [3,4,5,6]. These properties have encouraged its use as a complementary strategy in athletic programs, where the desired stimulus must be balanced against the total training load [7,8].
Cuff pressure is a major determinant of the internal stimulus produced by blood flow restriction (BFR) exercise. The vascular effects of a given cuff pressure depend on cuff characteristics and individual limb properties, supporting individualized pressure prescription [9]. Acute studies show that higher relative pressures can increase muscle deoxygenation, neuromuscular fatigue, and perceptual demand [10,11]. Training responses across pressure levels show a context-dependent pattern. Comparable gains have been reported across widely separated arterial occlusion pressures [12], while interactions between pressure and external load have been observed for muscle growth [13]. Evidence in high-performance athletes further emphasizes the need to position pressure within the complete exercise prescription [14]. Most pressure-comparison studies have used arterial or total limb occlusion pressure as the reference. Prescriptions based on venous occlusion pressure (VOP) use a distinct venous-flow reference for selecting cuff pressure. VOP-referenced exercise has been investigated in individuals with incomplete spinal cord injury [15]. Acute circulating responses and short-term training outcomes under different VOP-referenced prescriptions remain less well characterized in trained sprinters.
Acute circulating measurements and longitudinal functional assessments capture complementary dimensions of the response to resistance exercise. Biochemical measurements characterize the systemic response to an exercise bout, while strength, muscle morphology, and jump performance describe changes across training. Acute endocrine responses have shown limited associations with subsequent gains in muscle size and strength [16], supporting their evaluation alongside functional outcomes at distinct timescales.
Plasma metabolomics extends this framework by profiling coordinated changes across multiple biochemical domains. Human studies have identified broad exercise-responsive signatures involving glycolytic intermediates, tricarboxylic-acid-cycle metabolites, amino acids, acylcarnitines, and lipids [17]. Time-resolved multi-omics has further shown that acute exercise produces temporally ordered molecular responses across circulation and recovery [18], while large-cohort and exercise-mode comparisons demonstrate both shared and context-dependent metabolic patterns [19,20]. Metabolomics has also characterized early responses to low-load BFR exercise in trained men [21]. However, comparisons of participant-matched acute metabolic changes between individualized cuff-pressure prescriptions remain limited, particularly for VOP-referenced exercise in trained sprinters. Combining acute plasma profiling with longitudinal functional assessments provides an opportunity to characterize these responses within the context of a short-term training intervention.
Accordingly, this study compared acute biochemical and plasma metabolic responses between two individualized VOP-referenced cuff-pressure prescriptions (50% and 80%) in male sprinters performing the same prescribed low-load resistance exercise protocol. Blood samples were collected before and immediately after the first BFR-RT session. Strength, muscle morphology, and jump performance were assessed before and after training, and fasting serum biochemical profiles were assessed at baseline and on the morning after the final training session. Exploratory analyses examined associations between initial acute metabolic changes, concurrent biochemical responses, and subsequent functional changes.
2. Materials and Methods
2.1. Study Design and Participants
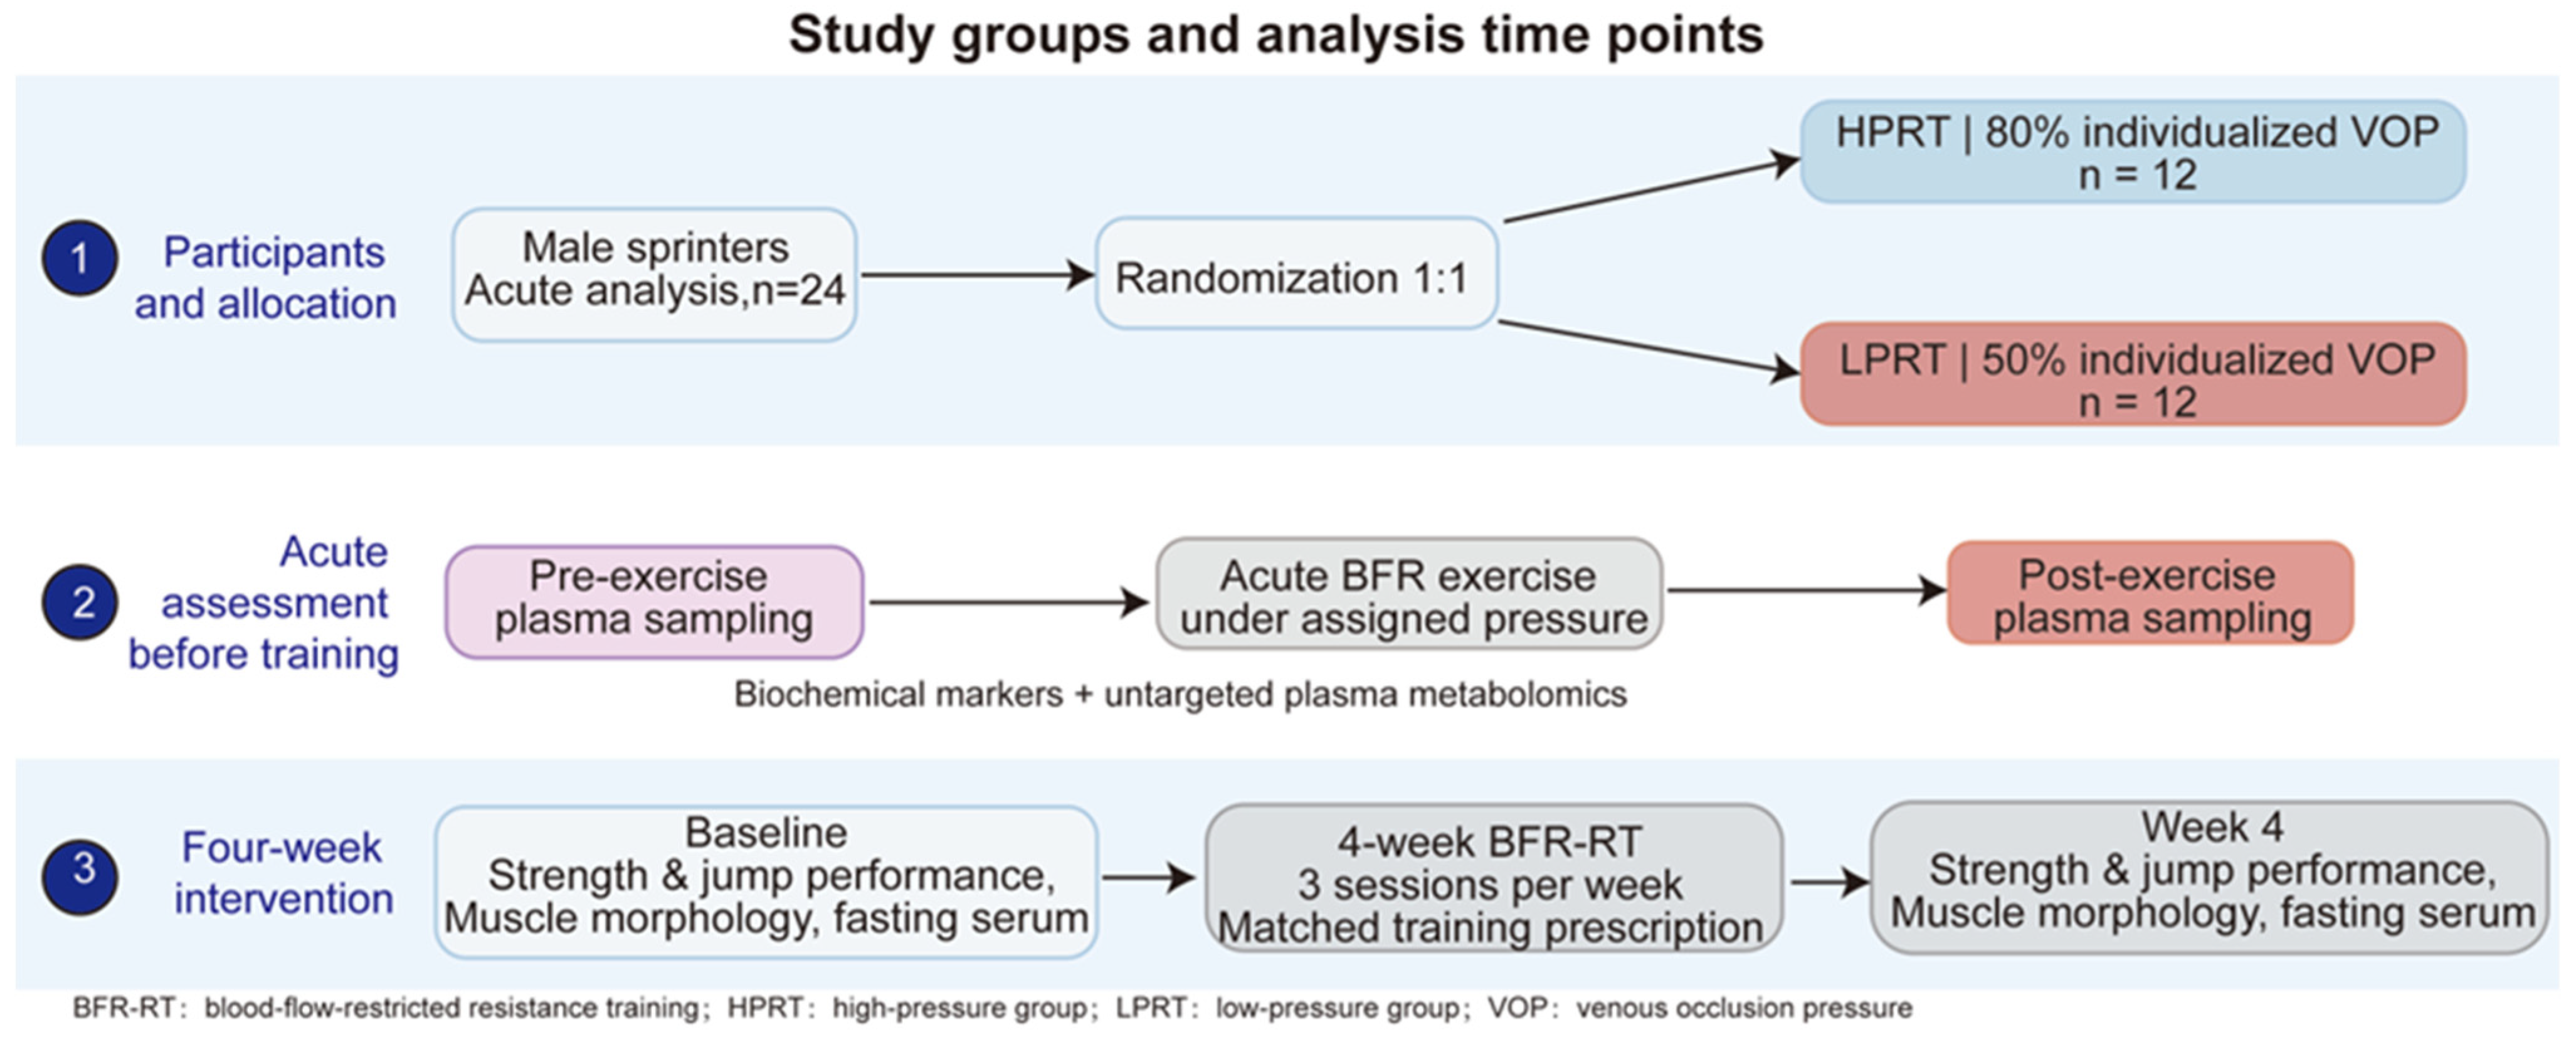
This randomized, parallel-group study assessed acute responses during the first BFR-RT session and functional changes over a four-week intervention (Figure 1). Twenty-four male sprinters aged 18–23 years who met the Chinese national second-class athlete standard and had at least one year of resistance-training experience were included. Exclusion criteria included cardiovascular, metabolic, or renal disease; hypertension; smoking within the preceding three months; use of anabolic agents or medications affecting exercise adaptation; and musculoskeletal injury limiting participation. Participants were randomized in a 1:1 ratio to the high-pressure resistance training group (HPRT; 80% individual VOP; n = 12) or the low-pressure resistance training group (LPRT; 50% individual VOP; n = 12) using a computer-generated allocation sequence produced in IBM SPSS Statistics, version 32.0 (IBM Corp., Armonk, NY, USA) The sample size reflected the available cohort of eligible sprinters, and the analyses were exploratory.
Figure 1.
Study design and assessment timeline. Twenty-four male sprinters were randomized to HPRT or LPRT (n = 12 per group). Plasma was collected before and immediately after the first BFR-RT session for biochemical and metabolomic analyses. Training comprised three prescribed sessions per week for four weeks, including the initial acute assessment session. Functional and muscle morphology assessments were performed at baseline and after four weeks. Fasting serum was collected at baseline and on the morning after the final session. Acute analyses included 24 participants; longitudinal functional and serum analyses included 23 participants (HPRT, n = 11; LPRT, n = 12). Acute biochemical and plasma metabolomic responses were assessed immediately before and after the first BFR-RT session. Strength, muscle morphology, and jump performance were assessed at baseline and after four weeks. Fasting serum samples were obtained at baseline and on the morning after the final training session. The study was approved by the Ethics Committee for Sports Science Experiments of Beijing Sport University (approval no. 2024160H), and all participants provided written informed consent. Arrows indicate participant allocation and the sequence of study procedures. BFR, blood flow restriction; BFR-RT, blood flow-restricted resistance training; HPRT, high-pressure resistance training; LPRT, low-pressure resistance training; VOP, venous occlusion pressure.
2.2. BFR-RT Protocol
Both groups were prescribed three supervised sessions per week on nonconsecutive days for four weeks, comprising 12 scheduled sessions. Each session began with a 15-min warm-up consisting of 10 min of jogging and 5 min of dynamic stretching. Participants performed four sets of barbell back squats using a 30–15–15–15 repetition scheme and 60-s inter-set rest. The load was fixed at 30% of baseline back-squat one-repetition maximum (1RM) throughout the intervention. Squats were performed with a controlled eccentric phase and a rapid concentric phase, with the upper thigh passing below horizontal at the bottom of each repetition. Pneumatic cuffs measuring 5 cm in width were placed bilaterally around the proximal thighs and connected to a KAATSU-Master pressure device (KAATSU Master, Yidongkang, Beijing, China). Cuffs were inflated to the assigned VOP-referenced pressure, remained inflated throughout all four sets and inter-set rest, and were deflated after the final set. Cuff-pressure readings on the device were checked before each set. The prescribed relative load, repetition scheme, rest intervals, and cuff placement were standardized between groups. Participants were monitored for pain, numbness, dizziness, and other adverse symptoms. The first BFR-RT session was used for the acute assessment, and the assigned pressure condition was retained throughout the intervention.
2.3. Determination of VOP
Resting VOP was measured in the dominant leg by a physician from the ultrasound department of a tertiary hospital using Doppler ultrasonography (Vivid 7, GE, Chicago, IL, USA). After 5 min of prone rest, a 5-cm-wide cuff was placed around the proximal thigh and connected to the same KAATSU-Master device used during training. A linear-array transducer (GE, Chicago, IL, USA) was used to monitor popliteal venous flow while cuff pressure was increased in 10-mmHg increments. VOP was defined operationally as the lowest cuff pressure at which the popliteal venous Doppler flow signal was no longer detectable. The cuff was then deflated. Training pressures were calculated as 80% of individual VOP for HPRT and 50% for LPRT, with the dominant-leg-derived pressure applied bilaterally. Both prescribed pressures were below the measured resting VOP threshold. The initial VOP reference was retained for the first BFR-RT session and throughout the four-week intervention. Doppler verification of arterial and venous flow at the assigned exercise pressures was not performed.
2.4. Muscle Morphology and Physical Performance
Assessments were performed at baseline and after four weeks. Participants were familiarized with the tests before baseline assessment, and the same trained assessors, blinded to pressure-group allocation, performed the corresponding measurements at both visits.
Bilateral rectus femoris thickness and cross-sectional area (CSA) were assessed using Vivid 7 ultrasound at a marked site one-fifth of the distance from the patellar center toward the anterior superior iliac spine. Participants were supine with their legs relaxed, and minimal transducer pressure was applied. Three transverse B-mode images showing the complete muscle contour were acquired per leg. Thickness was measured between the superficial and deep fasciae, and CSA was determined by tracing the inner epimysial boundary. Measurements were averaged across the three images.
Standing long-jump performance was recorded as the best of three valid attempts. Countermovement jumps (CMJs) and squat jumps (SJs) were assessed using a calibrated Kistler force platform (Kistler, Winterthur, Switzerland), with five valid trials per jump type and 45-s inter-trial rest. Trials were ranked by jump height; the highest and lowest trials were excluded, and all jump outcomes were averaged across the same remaining three trials. Peak take-off force (N), peak power (W), and jump height (m) were obtained from the force-platform outputs. Modified reactive strength index (RSI-mod) was calculated as jump height divided by the time from movement onset to take-off, expressed in m·s−1 [22].
Back-squat 1RM was recorded as the greatest load successfully lifted with the upper thigh passing below horizontal, followed by full hip and knee extension [23]. Progressive warm-up sets preceded incremental single attempts, with 3–5 min of rest between maximal attempts. Bilateral knee-extension and knee-flexion peak torque (PT; N·m) was measured using an ISOmed 2000 dynamometer (ISOMED GmbH, Heidelberg, Germany) with standardized seated positioning, stabilization, axis alignment, and gravity correction. Testing covered 0–90° of knee flexion and included concentric contractions at 60°·s−1 and 180°·s−1 and eccentric contractions at 60°·s−1. Two sets of five repetitions were performed per condition, with 1-min inter-set and 2-min inter-condition rest. The highest valid PT was analyzed. Between-group differences in individual changes were compared using Welch’s t-tests. Baseline-adjusted sensitivity analyses used analysis of covariance (ANCOVA), with the week-4 measurement as the dependent variable and pressure group and baseline measurement as predictors. Benjamini–Hochberg (BH) correction was applied across the 26 outcomes separately for each analysis.
2.5. Blood Collection and Biochemical Analyses
Acute biochemical and metabolomic responses were assessed before and after the first BFR-RT session. Participants fasted overnight for at least 8 h and avoided strenuous exercise for 72 h before this session. Resting blood samples were collected between 08:00 and 09:00 after 10 min of seated rest, and post-exercise samples were collected within 2 min after cuff release following the final set. Fasting serum samples were collected at baseline and on the morning after the final training session, within the same morning sampling window. The morning-after serum measurements characterized early recovery following the four-week training intervention. Participants maintained their habitual diet and hydration, avoided alcohol and caffeine for 24 h, and obtained at least 7 h of sleep before morning sampling. Acute samples were collected into sodium-heparin tubes for plasma biochemical and metabolomic analyses, whereas longitudinal samples were collected into additive-free tubes for serum analysis. Plasma was separated by centrifugation at 3000 rpm for 10 min at 4 °C, and serum was separated after clotting. Aliquots were stored at −80 °C until analysis. Paired samples for each marker were analyzed within the same assay batch.
Creatine kinase (CK) was measured using a UniCel DxC 800 clinical chemistry system (Beckman Coulter, Brea, CA, USA), and human growth hormone (hGH), testosterone, and cortisol were measured using a UniCel DxI 800 immunoassay system (Beckman Coulter, Brea, CA, USA). Interleukin-6 (IL-6) and insulin-like growth factor 1 (IGF-1) were measured using enzyme-linked immunosorbent assays (ELISAs). Commercial kits were used to measure C-reactive protein (CRP), nitric oxide synthase 3 (NOS3), insulin, heat shock protein family A member 2 (HSPA2), and lactate according to the manufacturers’ instructions. NOS3 was quantified as circulating protein concentration and expressed in pg/mL. Kit-based assays were performed in duplicate.
Between-pressure differences in individual changes were assessed using Welch’s t-tests. BH correction was applied separately across the 11 acute biochemical markers and the 10 longitudinal serum markers to control the false discovery rate (FDR). The longitudinal panel comprised CK, CRP, hGH, testosterone, cortisol, IL-6, NOS3, insulin, IGF-1, and HSPA2. Concentrations were analyzed without correction for exercise-induced changes in plasma volume.
2.6. Untargeted Plasma Metabolomics and Integrative Analyses
Untargeted metabolomics was performed on 48 plasma samples comprising 24 participant-matched pre–post pairs from the first BFR-RT session. Plasma (100 μL) was extracted with 400 μL of precooled methanol/acetonitrile (1:1, v/v), centrifuged, dried, and reconstituted in 50% acetonitrile. Analysis used a Nexera X2 ultra-high-performance liquid chromatography (UHPLC) system (Shimadzu Corporation, Kyoto, Japan) coupled to a Q Exactive Plus mass spectrometer (Thermo Fisher Scientific, Bremen, Germany) with an HSS T3 column (2.1 × 100 mm, 1.8 μm; Waters Corporation, Milford, MA, USA) in positive- and negative-ionization modes. Pooled quality-control (QC) samples were prepared from equal aliquots of all study samples and processed identically. Detailed extraction and acquisition conditions are provided in the Supplementary Methods.
MS-DIAL (version 4.90) was used for peak detection, alignment, retention-time correction, and peak-area extraction. Features missing from more than 50% of samples in any experimental group were excluded, and positive- and negative-ionization datasets were normalized separately by total ion current. Principal component analysis (PCA) and orthogonal partial least-squares discriminant analysis (OPLS-DA) used mean centering and Pareto scaling. Exploratory screening used variable importance in projection (VIP) > 1 and nominal p < 0.05 from two-sided independent-samples Student’s t-tests of untransformed feature intensities. BH-adjusted results were calculated across the 1753 feature records in each comparison and are reported alongside the screening results in Table S3.
For trajectory analysis, intensities in the 53-candidate matrix were log2(x + 1)-transformed and standardized within each candidate across all 48 samples. The four group-by-time means were clustered using Ward linkage and Euclidean distance. Cluster number was evaluated using internal validity and bootstrap stability indices. All 53 candidates contributed to clustering; annotation-based putative endogenous classification was subsequently used for biological interpretation and phenotype integration. Cluster-level KEGG over-representation analysis used unique compound identifiers, a detected-and-mappable human metabolic background, a one-sided hypergeometric test, and BH correction.
The first principal component (PC1) of standardized acute changes in the 22 putatively endogenous Cluster 2 candidates summarized module variation. Group-adjusted partial Spearman correlations used complete cases, with separate BH correction across 132 metabolite–biochemical, 176 metabolite–training, and 14 module–phenotype associations. The eight training phenotypes comprised back-squat 1RM, standing long jump, bilateral quadriceps PT, and bilateral rectus femoris CSA and thickness. Candidate prioritization combined four equally weighted ranks: absolute PC1 loading, the strongest absolute biochemical correlation, the strongest absolute training-outcome correlation, and nominal between-group evidence for differences in individual acute changes. Participant influence was assessed using leave-one-participant-out analyses. Candidate annotations, cluster assignments, and complete association results are reported in Tables S5 and S6.
2.7. Statistical Analysis
Continuous variables are presented as mean ± standard deviation (SD). Within-group longitudinal changes were assessed using paired t-tests. Between-group differences were reported in the original units with 95% confidence intervals (CIs) and as Hedges’ g, calculated using the pooled SD of individual changes with a small-sample correction. Approximate 95% CIs for Hedges’ g used the normal approximation. Analyses included participants with the paired measurements required for each outcome. All tests were two-sided; p < 0.05 indicated nominal significance, and FDR-adjusted q < 0.05 indicated significance after multiple-testing correction.
3. Results
3.1. Participant Flow and Baseline Characteristics
Twenty-four male sprinters were randomized to HPRT or LPRT, with 12 participants per group. All participants provided paired plasma samples before and after the first BFR-RT session, yielding 48 samples for acute metabolomic profiling. One HPRT participant missed the four-week functional assessment owing to injury, leaving 23 participants for these analyses (HPRT, n = 11; LPRT, n = 12). Longitudinal serum data were also available for 23 participants, comprising 11 in HPRT and 12 in LPRT. The study design and assessment timeline are summarized in Figure 1, and baseline characteristics of all randomized participants are presented in Table 1. Participant-level baseline characteristics and longitudinal biochemical measurements are provided in Table S7.
Table 1.
Baseline characteristics of the participants.
3.2. Biochemical Responses to Acute Exercise and During Post-Training Recovery
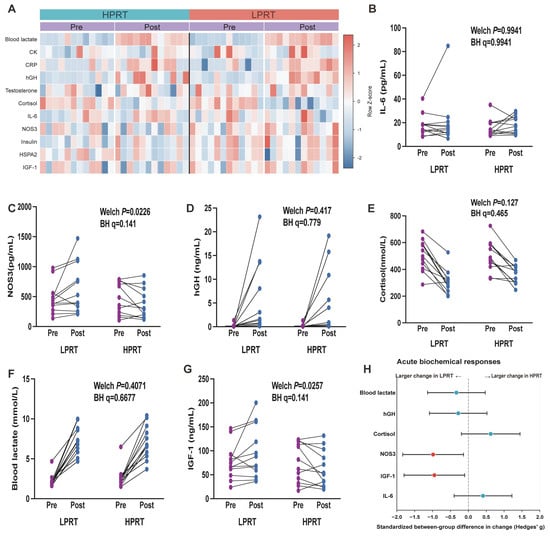
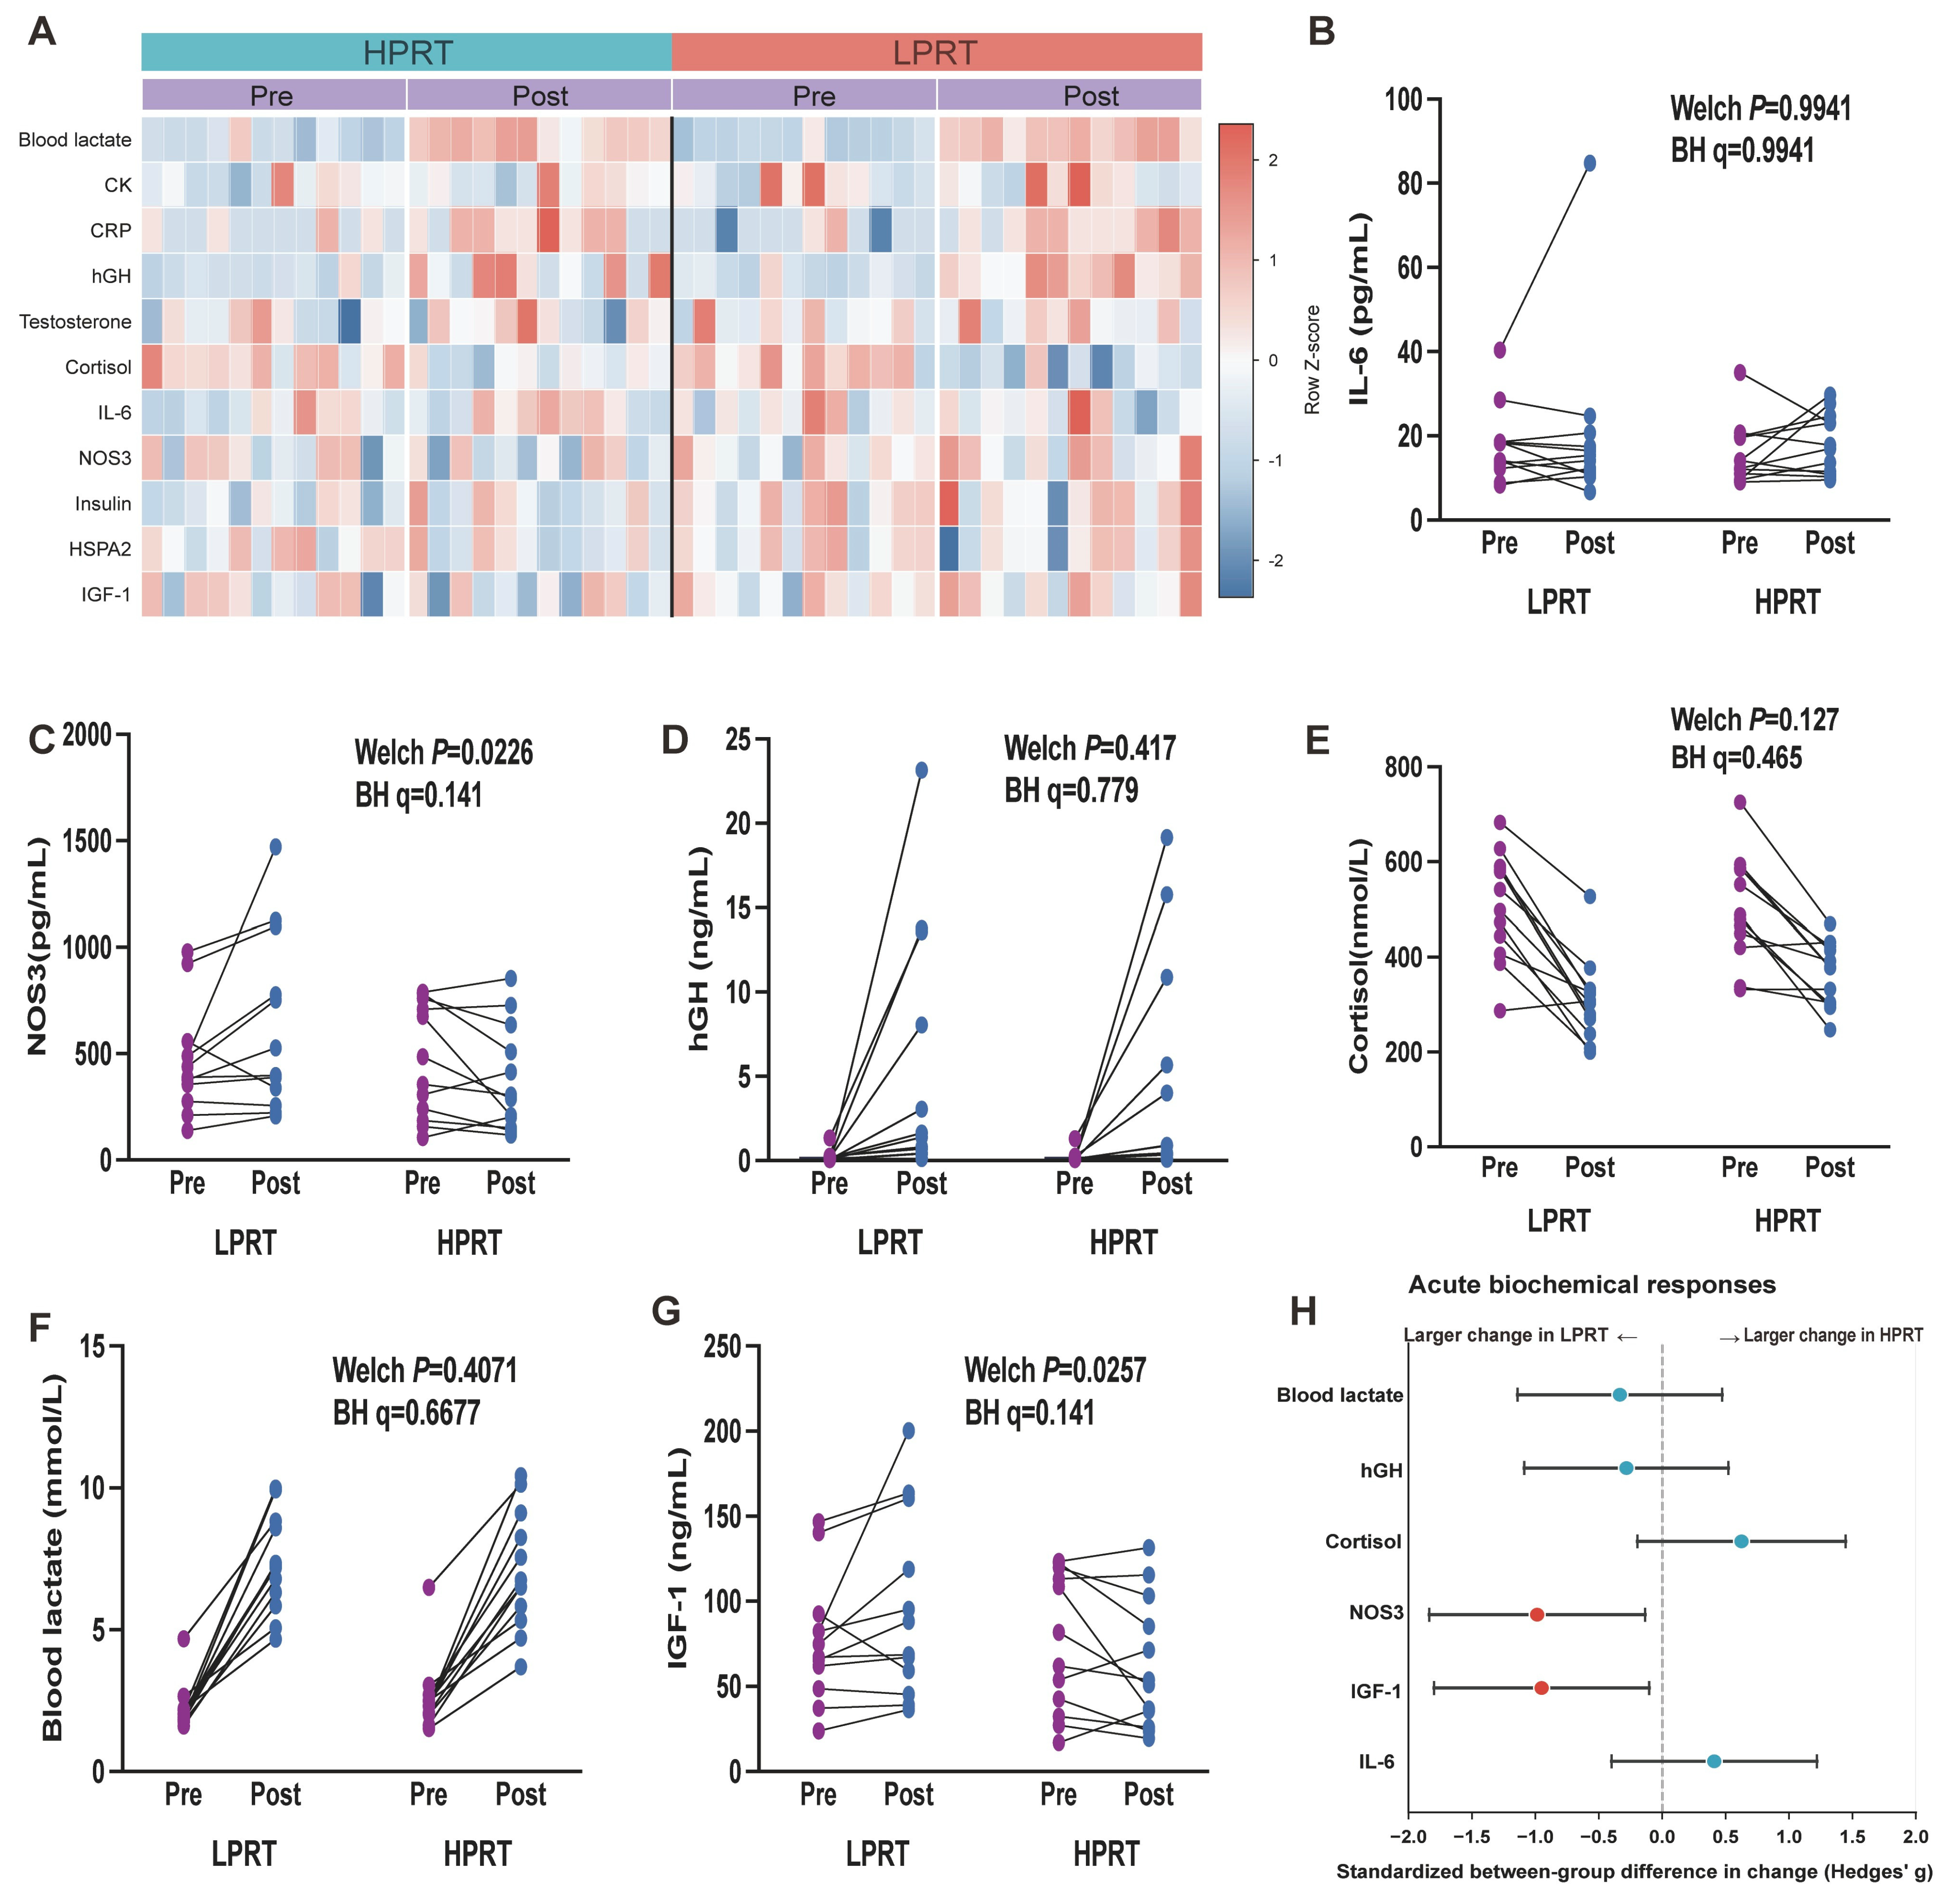
The 11-marker heatmap summarized individual biochemical responses to the first BFR-RT session (Figure 2A). Mean lactate and hGH concentrations increased in both groups, while mean cortisol concentrations decreased (Figure 2D–F). Acute NOS3 changes differed nominally between groups, with a mean decrease in HPRT and an increase in LPRT (p = 0.023, q = 0.141); IGF-1 showed a similar directional contrast (p = 0.026, q = 0.141; Figure 2C,G). IL-6 changes showed substantial individual variation (p = 0.994, q = 0.994; Figure 2B). None of the 11 acute between-group comparisons met the FDR threshold (Figure S2A). From baseline to the morning after the final training session, serum NOS3 and IGF-1 decreased in HPRT and increased in LPRT, with between-group differences in change retained after BH correction (NOS3: p = 0.0035, q = 0.019; IGF-1: p = 0.0038, q = 0.019). HSPA2 showed a greater decrease in HPRT (p = 0.0117, q = 0.039), while the remaining seven longitudinal markers had q > 0.05. Individual acute and longitudinal biochemical measurements are provided in Tables S1 and S7, respectively. These profiles combined shared acute responses with selected between-pressure differences during early recovery after training.
Figure 2.
Acute biochemical responses to the first BFR-RT session. (A) Row-scaled heatmap of 11 circulating markers. (B–G) Individual paired concentrations of IL-6, NOS3, hGH, cortisol, lactate, and IGF-1, respectively. Lines connect measurements from the same participant. (H) Between-group differences in individual changes, expressed as Hedges’ g for HPRT–LPRT with approximate 95% CIs. Arrows indicate larger numerical changes in LPRT on the left and HPRT on the right. Changes were calculated as Post–Pre. p values were obtained using two-sided Welch tests, with BH correction across all 11 markers. Red estimates indicate nominal p < 0.05. Pre and Post refer to sampling before and after the first BFR-RT session. All analyses included 12 paired participants per group. CK, creatine kinase; CRP, C-reactive protein; hGH, human growth hormone; IL-6, interleukin-6; NOS3, nitric oxide synthase 3; HSPA2, heat shock protein family A member 2; IGF-1, insulin-like growth factor 1; CI, confidence interval; BH, Benjamini–Hochberg.
3.3. Four-Week Changes in Strength, Muscle Morphology, and Performance
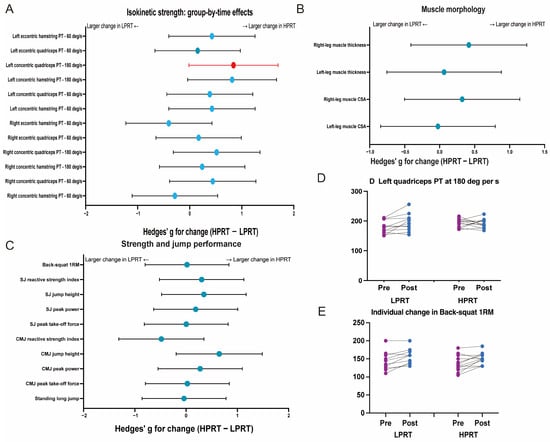
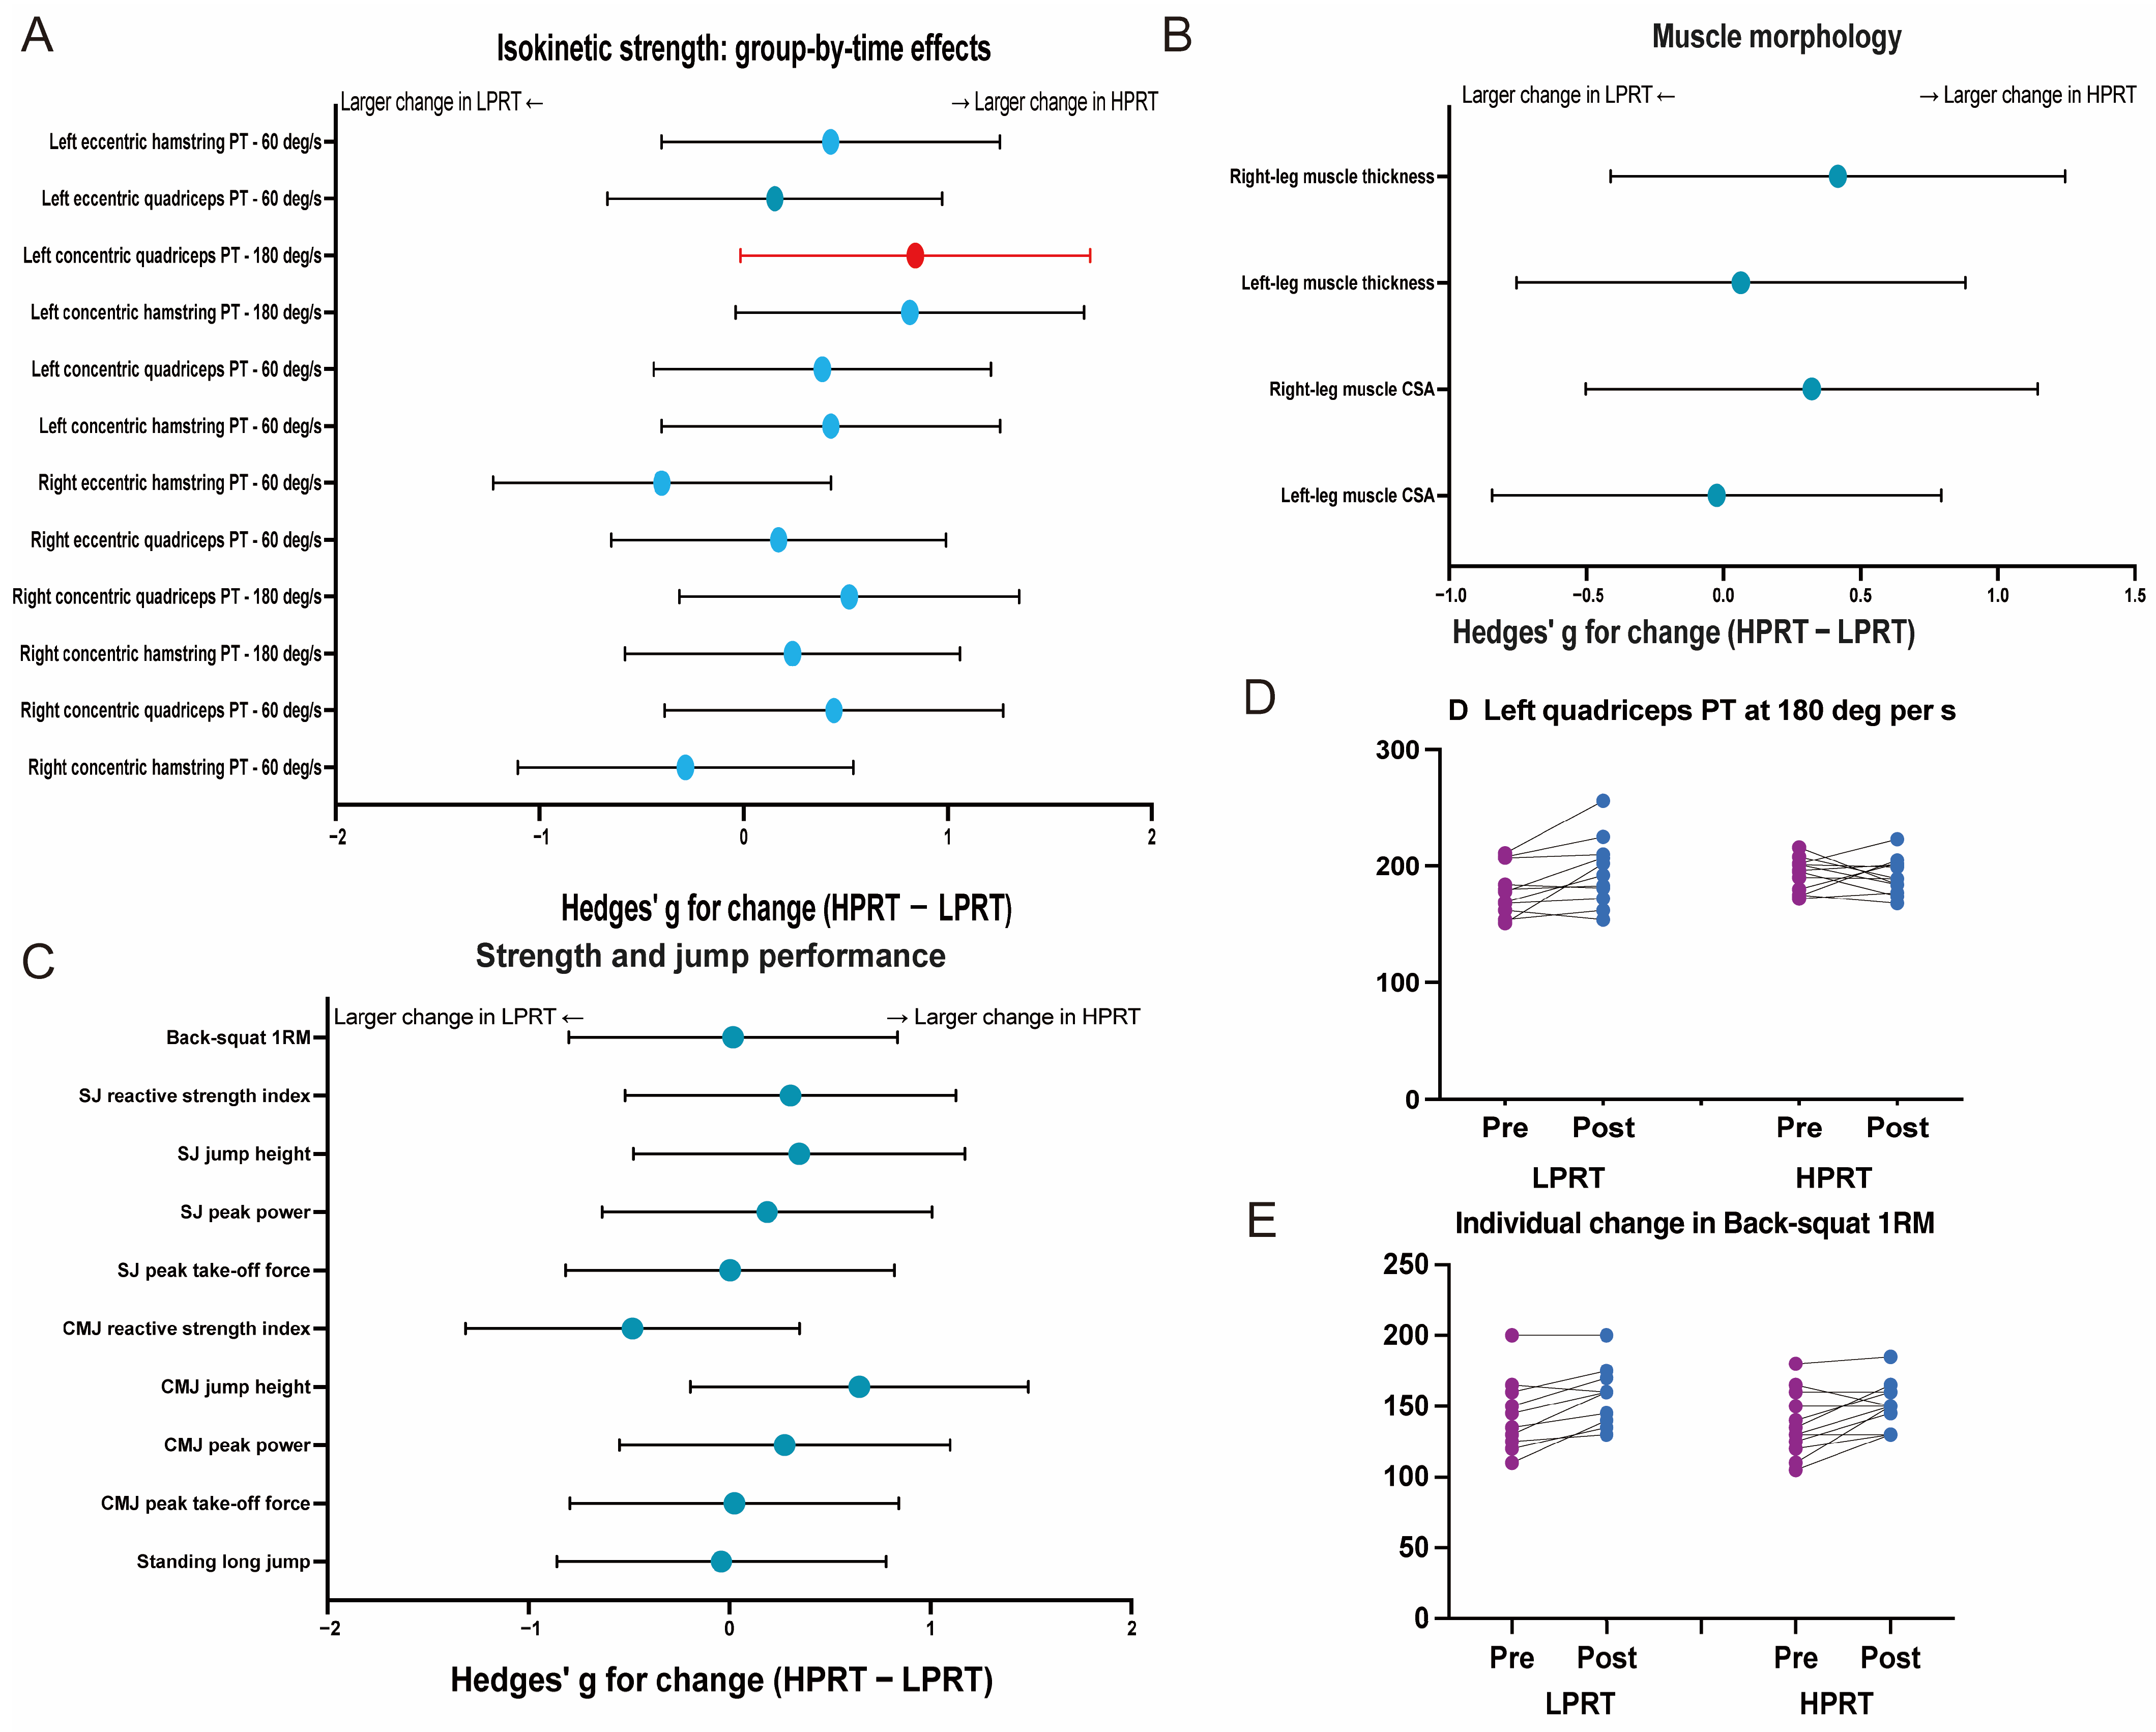
Back-squat 1RM increased by 13.18 ± 11.02 kg in HPRT and 12.92 ± 15.59 kg in LPRT (Figure 3E). The between-group difference in change was 0.27 kg (95% CI, −11.41 to 11.94; p = 0.963, q = 0.993), and the baseline-adjusted estimate was 2.36 kg (95% CI, −6.98 to 11.70; p = 0.604). Changes in bilateral rectus femoris thickness and CSA showed no significant between-group differences (Figure 3B). Left quadriceps concentric PT at 180°·s−1 showed a nominal difference in change (g = 0.842, p = 0.049, q = 0.783; Figure 3A,D), with p = 0.130 in the baseline-adjusted analysis. Standing long-jump, SJ, and CMJ outcomes showed no significant between-group differences in change (Figure 3C). None of the 26 outcomes met the FDR threshold in either analysis (Table S2; Figure S1A–C). Four weeks of training were accompanied by increased strength in the practiced back-squat task in both groups.
Figure 3.
Four-week changes in muscle morphology, strength, and jump performance. (A–C) Between-group differences in changes in isokinetic strength (A), rectus femoris morphology (B), and strength and jump performance (C), expressed as Hedges’ g for HPRT–LPRT with approximate 95% CIs. Changes were calculated as week 4–baseline. Arrows indicate larger numerical changes in LPRT on the left and HPRT on the right. Red and blue points indicate nominal p < 0.05 and p ≥ 0.05, respectively. BH correction was applied across all 26 outcomes. (D,E) Individual paired measurements of left quadriceps concentric PT at 180°·s−1 and back-squat 1RM, respectively. Purple and blue points represent baseline and week 4; lines connect measurements from the same participant. Analyses included 11 HPRT and 12 LPRT participants. PT, peak torque; CSA, cross-sectional area; 1RM, one-repetition maximum; SJ, squat jump; CMJ, countermovement jump.
3.4. Acute Plasma Metabolic Profiles Within the Two Pressure Conditions
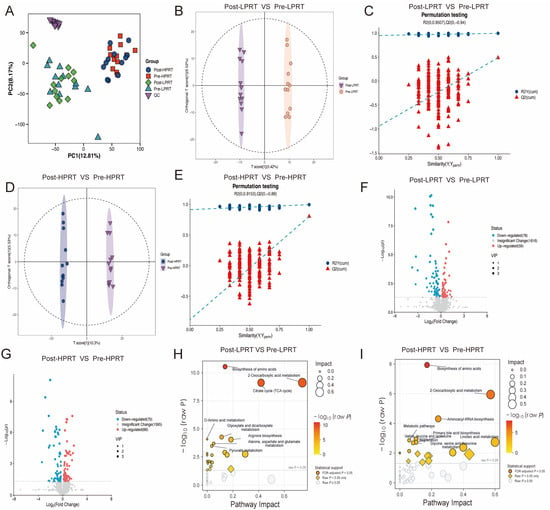
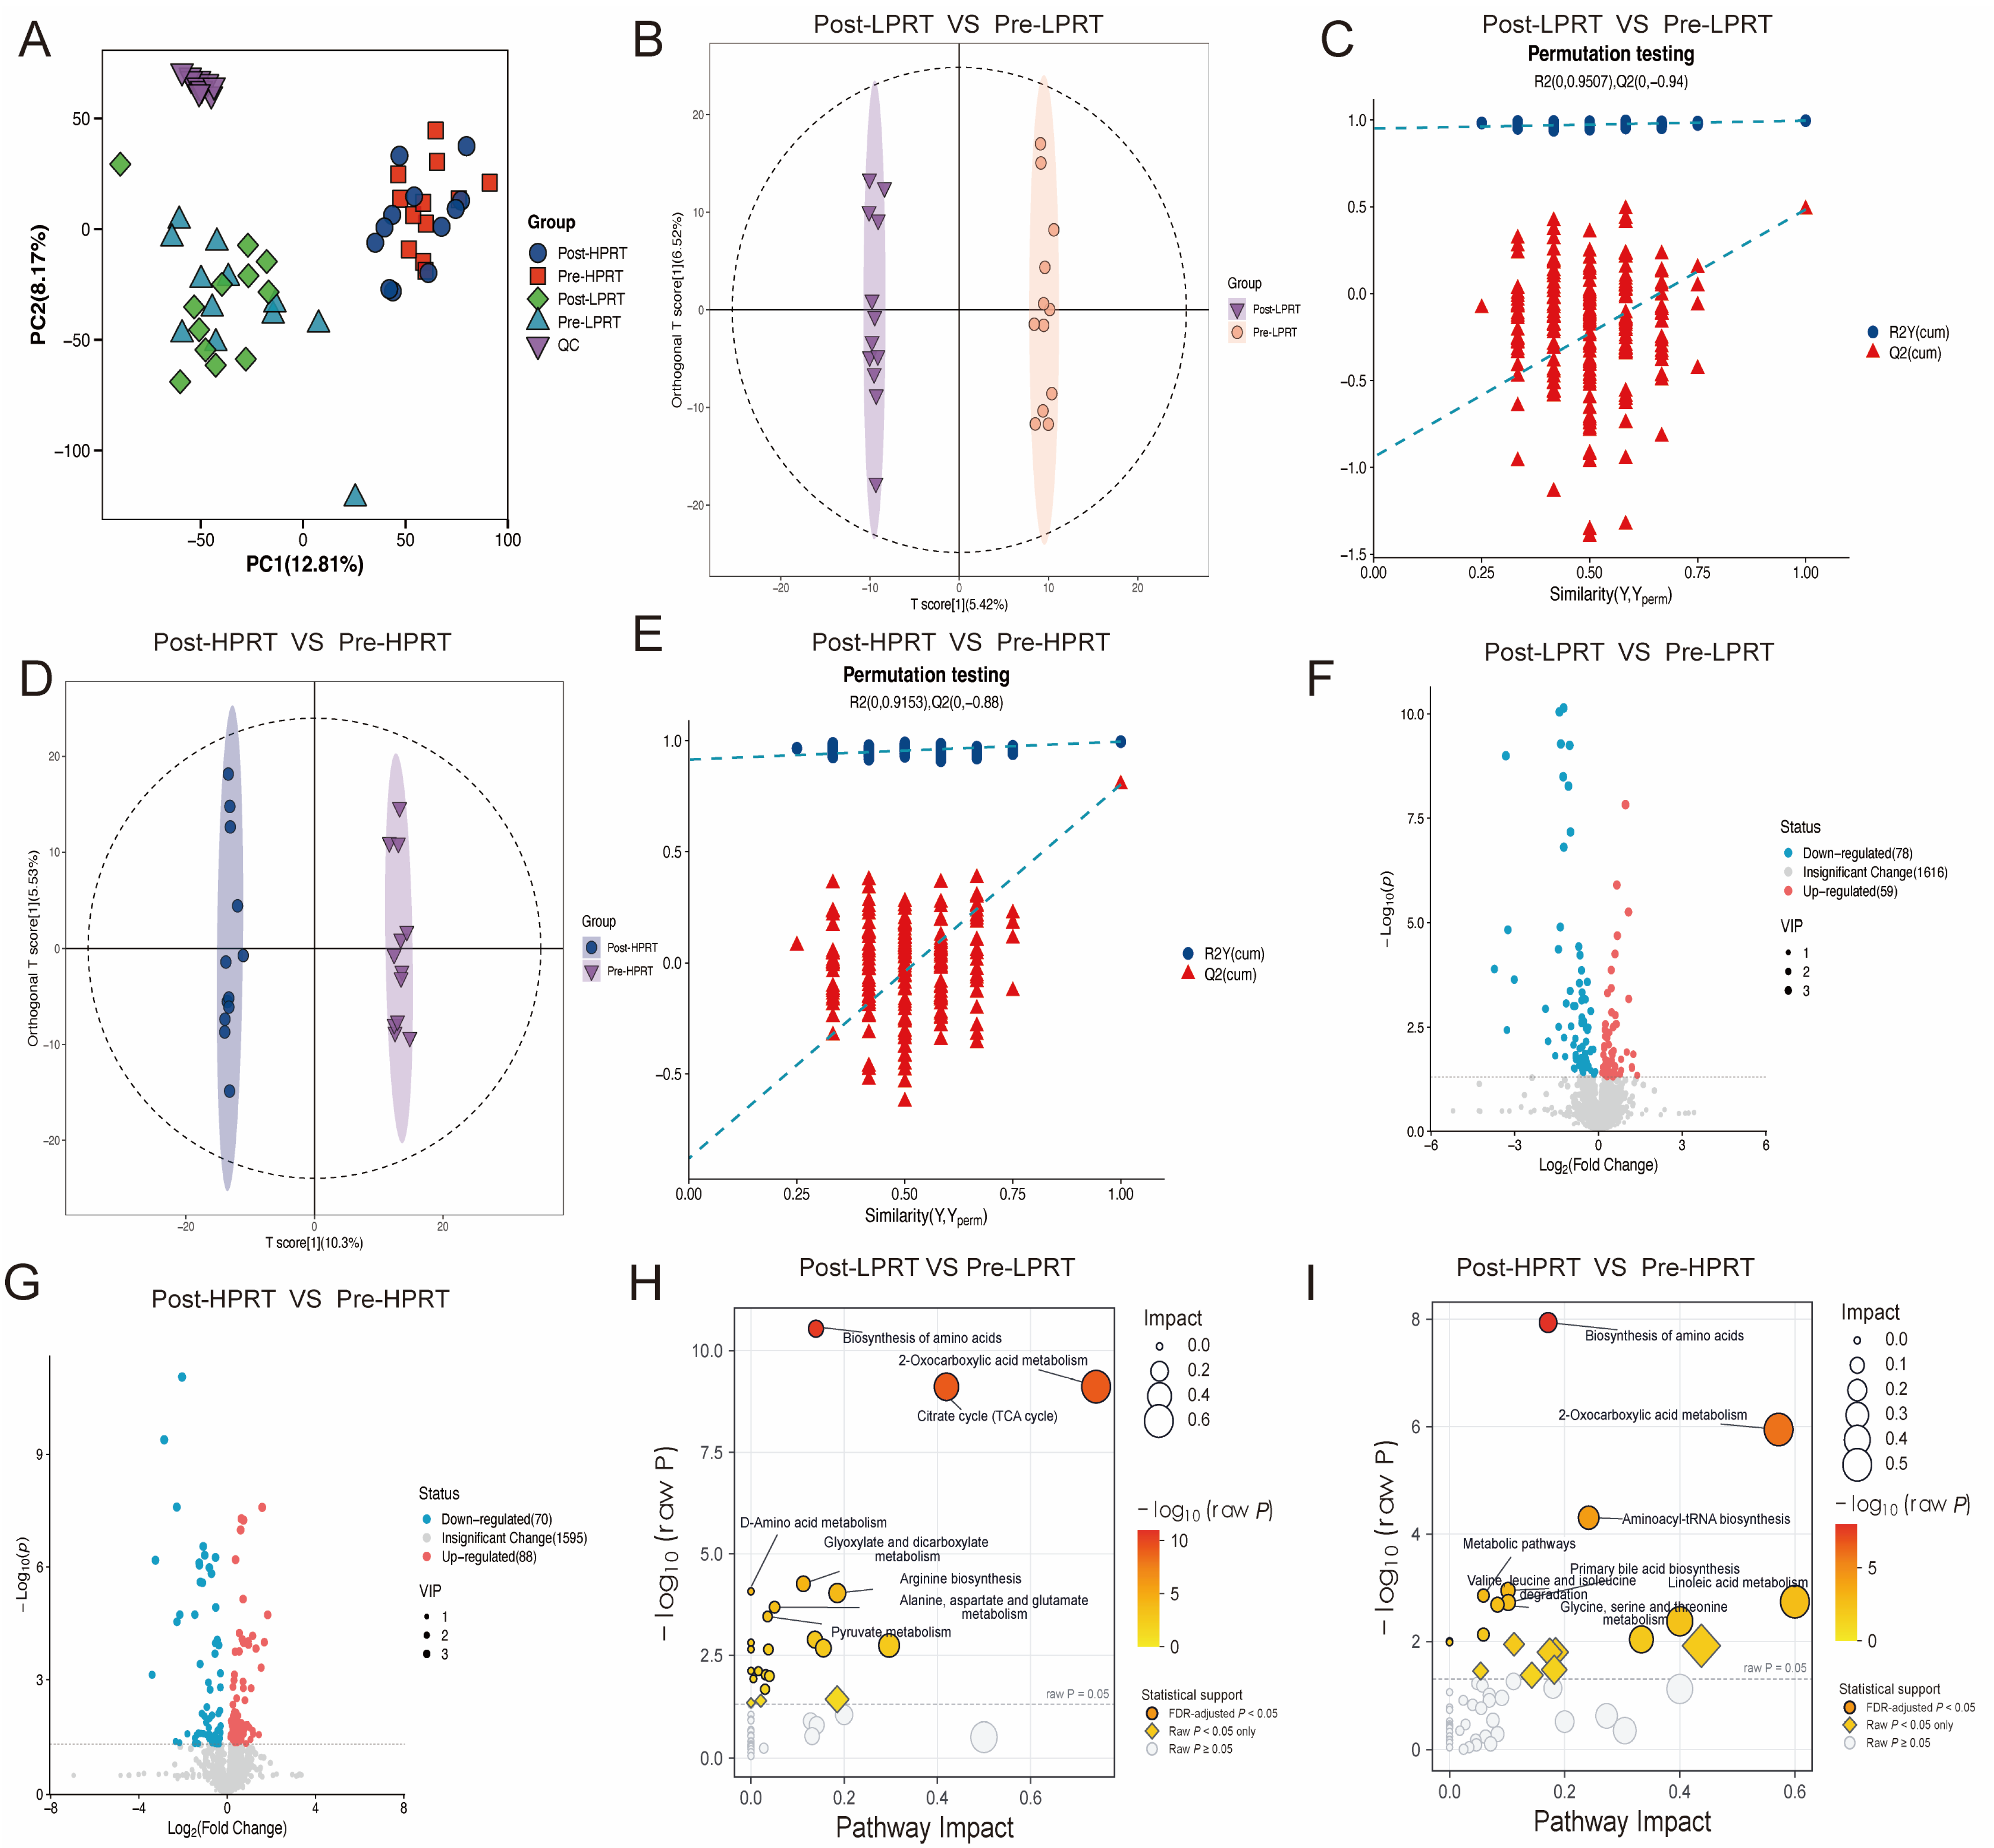
Untargeted profiling yielded 21,820 aligned features across the positive- and negative-ionization modes. PCA showed group-related structure at both sampling times, overlapping pre- and post-exercise distributions within each group, and clustering of pooled QC samples (Figure 4A). Group-specific OPLS-DA score plots and corresponding permutation analyses are presented for LPRT and HPRT in Figure 4B–E. Exploratory screening of 1753 feature records per comparison identified 137 candidate records in LPRT and 158 in HPRT, corresponding to 125 and 146 distinct annotation names, respectively (Figure 4F,G; Table S3). KEGG mapping highlighted amino acid-related pathways and central carbon metabolism in both candidate sets (Figure 4H,I; Table S4). These analyses characterized exploratory acute metabolic patterns within each pressure condition.
Figure 4.
Acute plasma metabolic profiles and within-group exercise responses. (A) PCA of experimental and pooled QC samples. (B,C) OPLS-DA score plot and permutation analysis for the LPRT pre–post comparison. (D,E) Corresponding analyses for HPRT. Dashed ellipses in (B,D) indicate the score-plot confidence regions. Dashed lines in (C,E) show linear fits of R2Y and Q2 against the similarity between the original and permuted class labels. (F,G) Volcano plots for LPRT and HPRT, respectively; point size indicates VIP, and colors distinguish screening categories. Candidate screening used VIP > 1 and nominal p < 0.05. (H,I) KEGG enrichment and topology analyses for the LPRT and HPRT candidate sets, respectively. Bubble size indicates pathway impact, and color indicates −log10(raw p). Filled circles denote BH-adjusted q < 0.05, diamonds denote raw p < 0.05 with q ≥ 0.05, and open circles denote raw p ≥ 0.05. Each group included 12 participants sampled before and after the first BFR-RT session. PCA, principal component analysis; PC1 and PC2, first and second principal components; QC, quality control; OPLS-DA, orthogonal partial least-squares discriminant analysis; VIP, variable importance in projection; KEGG, Kyoto Encyclopedia of Genes and Genomes; FDR, false discovery rate.
3.5. Post-Exercise Metabolic Profiles and Candidate Response Patterns
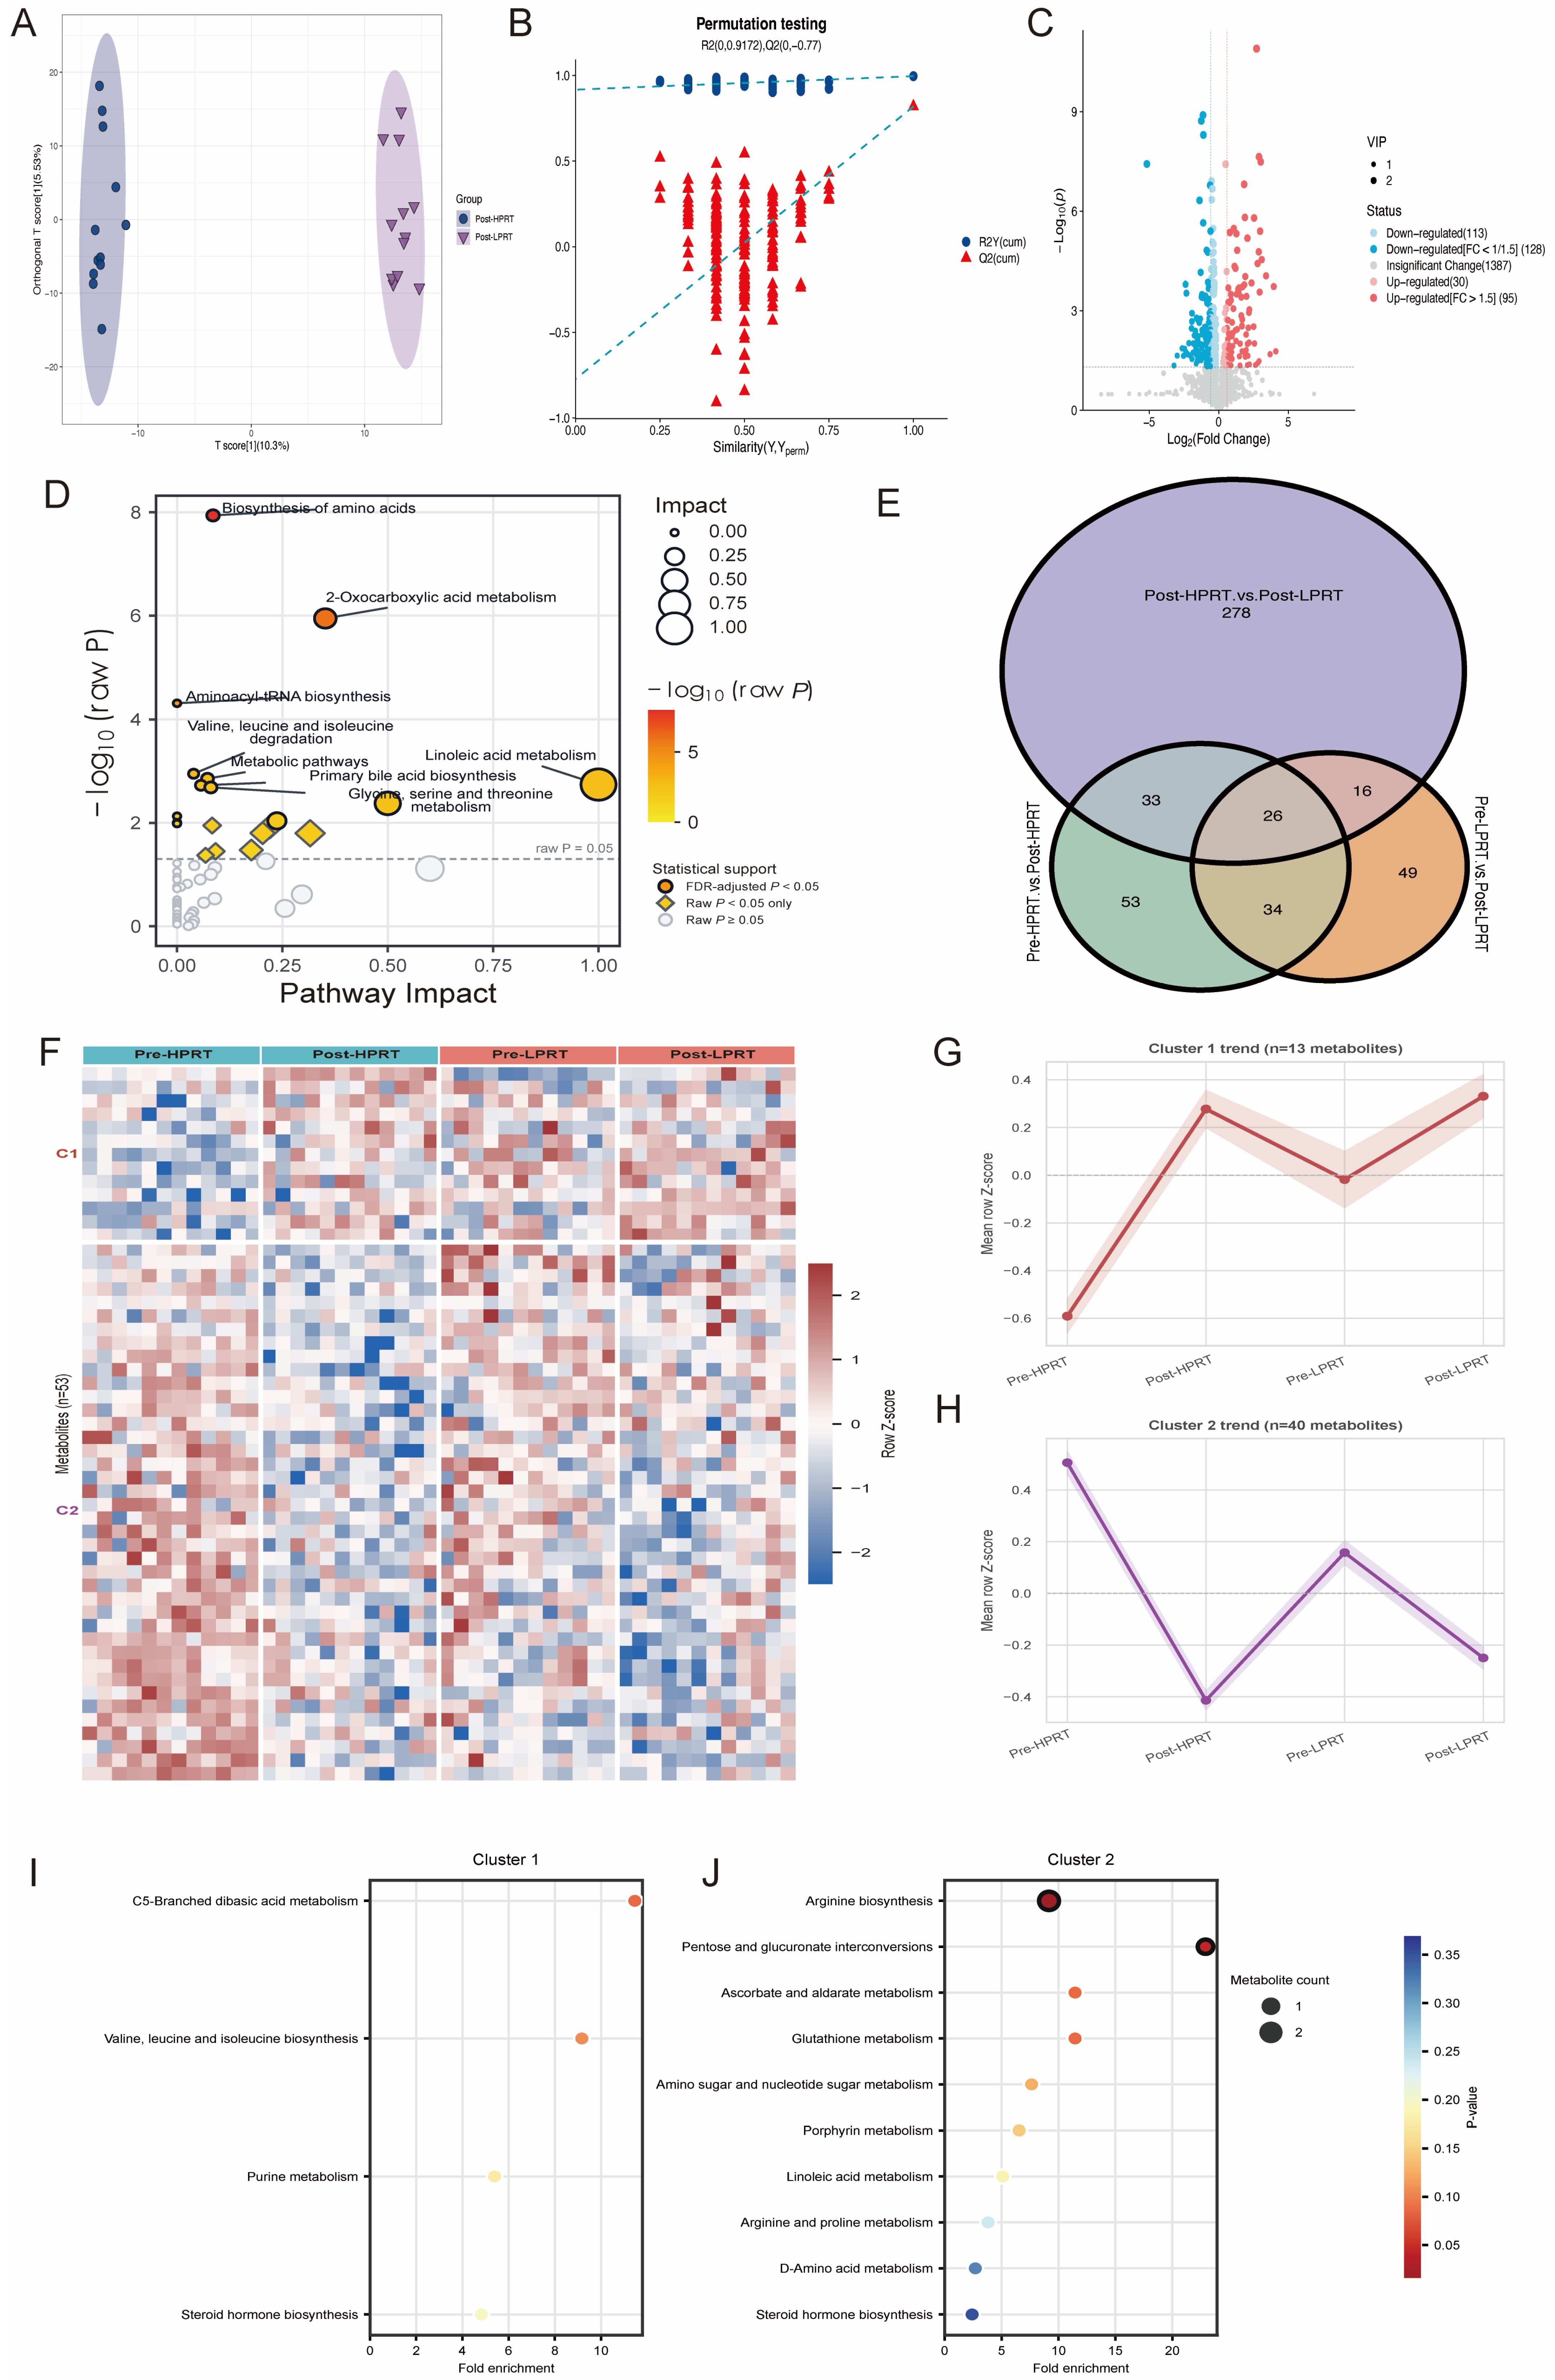
OPLS-DA visualized the post-exercise distributions of HPRT and LPRT, and exploratory screening identified 366 candidate feature records corresponding to 353 distinct annotation names (Figure 5A–C; Table S3). Pathway mapping and overlap among the three screening sets are presented in Figure 5D,E. Clustering of the 53-candidate matrix resolved two response patterns across the four group-by-time conditions (Figure 5F). Cluster 1 contained 13 candidates, including seven classified as putatively endogenous, and showed increased mean standardized abundance after exercise in both groups. Cluster 2 contained 40 candidates, including 22 putatively endogenous candidates, and showed decreased mean abundance in both groups. Both clusters had larger mean pre–post shifts in HPRT, alongside different pre-exercise standardized means between groups (Figure 5G,H; Figure S2B). Candidate annotations included citrulline, ornithine, dipeptides, LPC(18:2), 9-OxoODE, corticosterone, and bilirubin. Cluster-based KEGG mapping included arginine biosynthesis, glutathione metabolism, and linoleic acid metabolism; all cluster-based pathway results had q ≥ 0.05 (Figure 5I,J; Table S4). The selected matrix therefore captured shared response directions with differing mean amplitudes across pressure conditions.
Figure 5.
Post-exercise metabolic profiles and exploratory candidate response patterns. (A,B) OPLS-DA score plot and permutation analysis comparing post-exercise HPRT and LPRT profiles. In (B), blue circles and red triangles represent R2Y and Q2, respectively; dashed lines show their linear fits against the similarity between the original and permuted class labels. (C) Volcano plot of the post-exercise comparison; point size indicates VIP, and colors distinguish screening categories. Candidate screening used VIP > 1 and nominal p < 0.05. (D) KEGG enrichment and topology analysis; bubble size indicates pathway impact, and color indicates −log10(raw p). Filled circles, diamonds, and open circles indicate q < 0.05, raw p < 0.05 with q ≥ 0.05, and raw p ≥ 0.05, respectively. (E) Overlap among the three candidate screening sets. Purple, green, and orange circles represent the post-exercise HPRT–LPRT, HPRT pre–post, and LPRT pre–post comparisons, respectively. Black outlines delineate the sets, and overlapping regions indicate shared candidates. (F) Row-scaled heatmap of the 53-candidate matrix. (G,H) Mean standardized profiles of Clusters 1 and 2; shading indicates the standard error of the mean (SEM) across candidate-specific condition means within each cluster. (I,J) KEGG enrichment of mapped putatively endogenous candidates from Clusters 1 and 2. Bubble size indicates mapped compound count, color indicates raw p, and black outlines denote raw p < 0.05. All cluster-based pathway results in (I,J) had q ≥ 0.05. Profiling included 24 participants with paired samples.
3.6. Associations of Initial Metabolic Responses with Biochemical and Training Outcomes
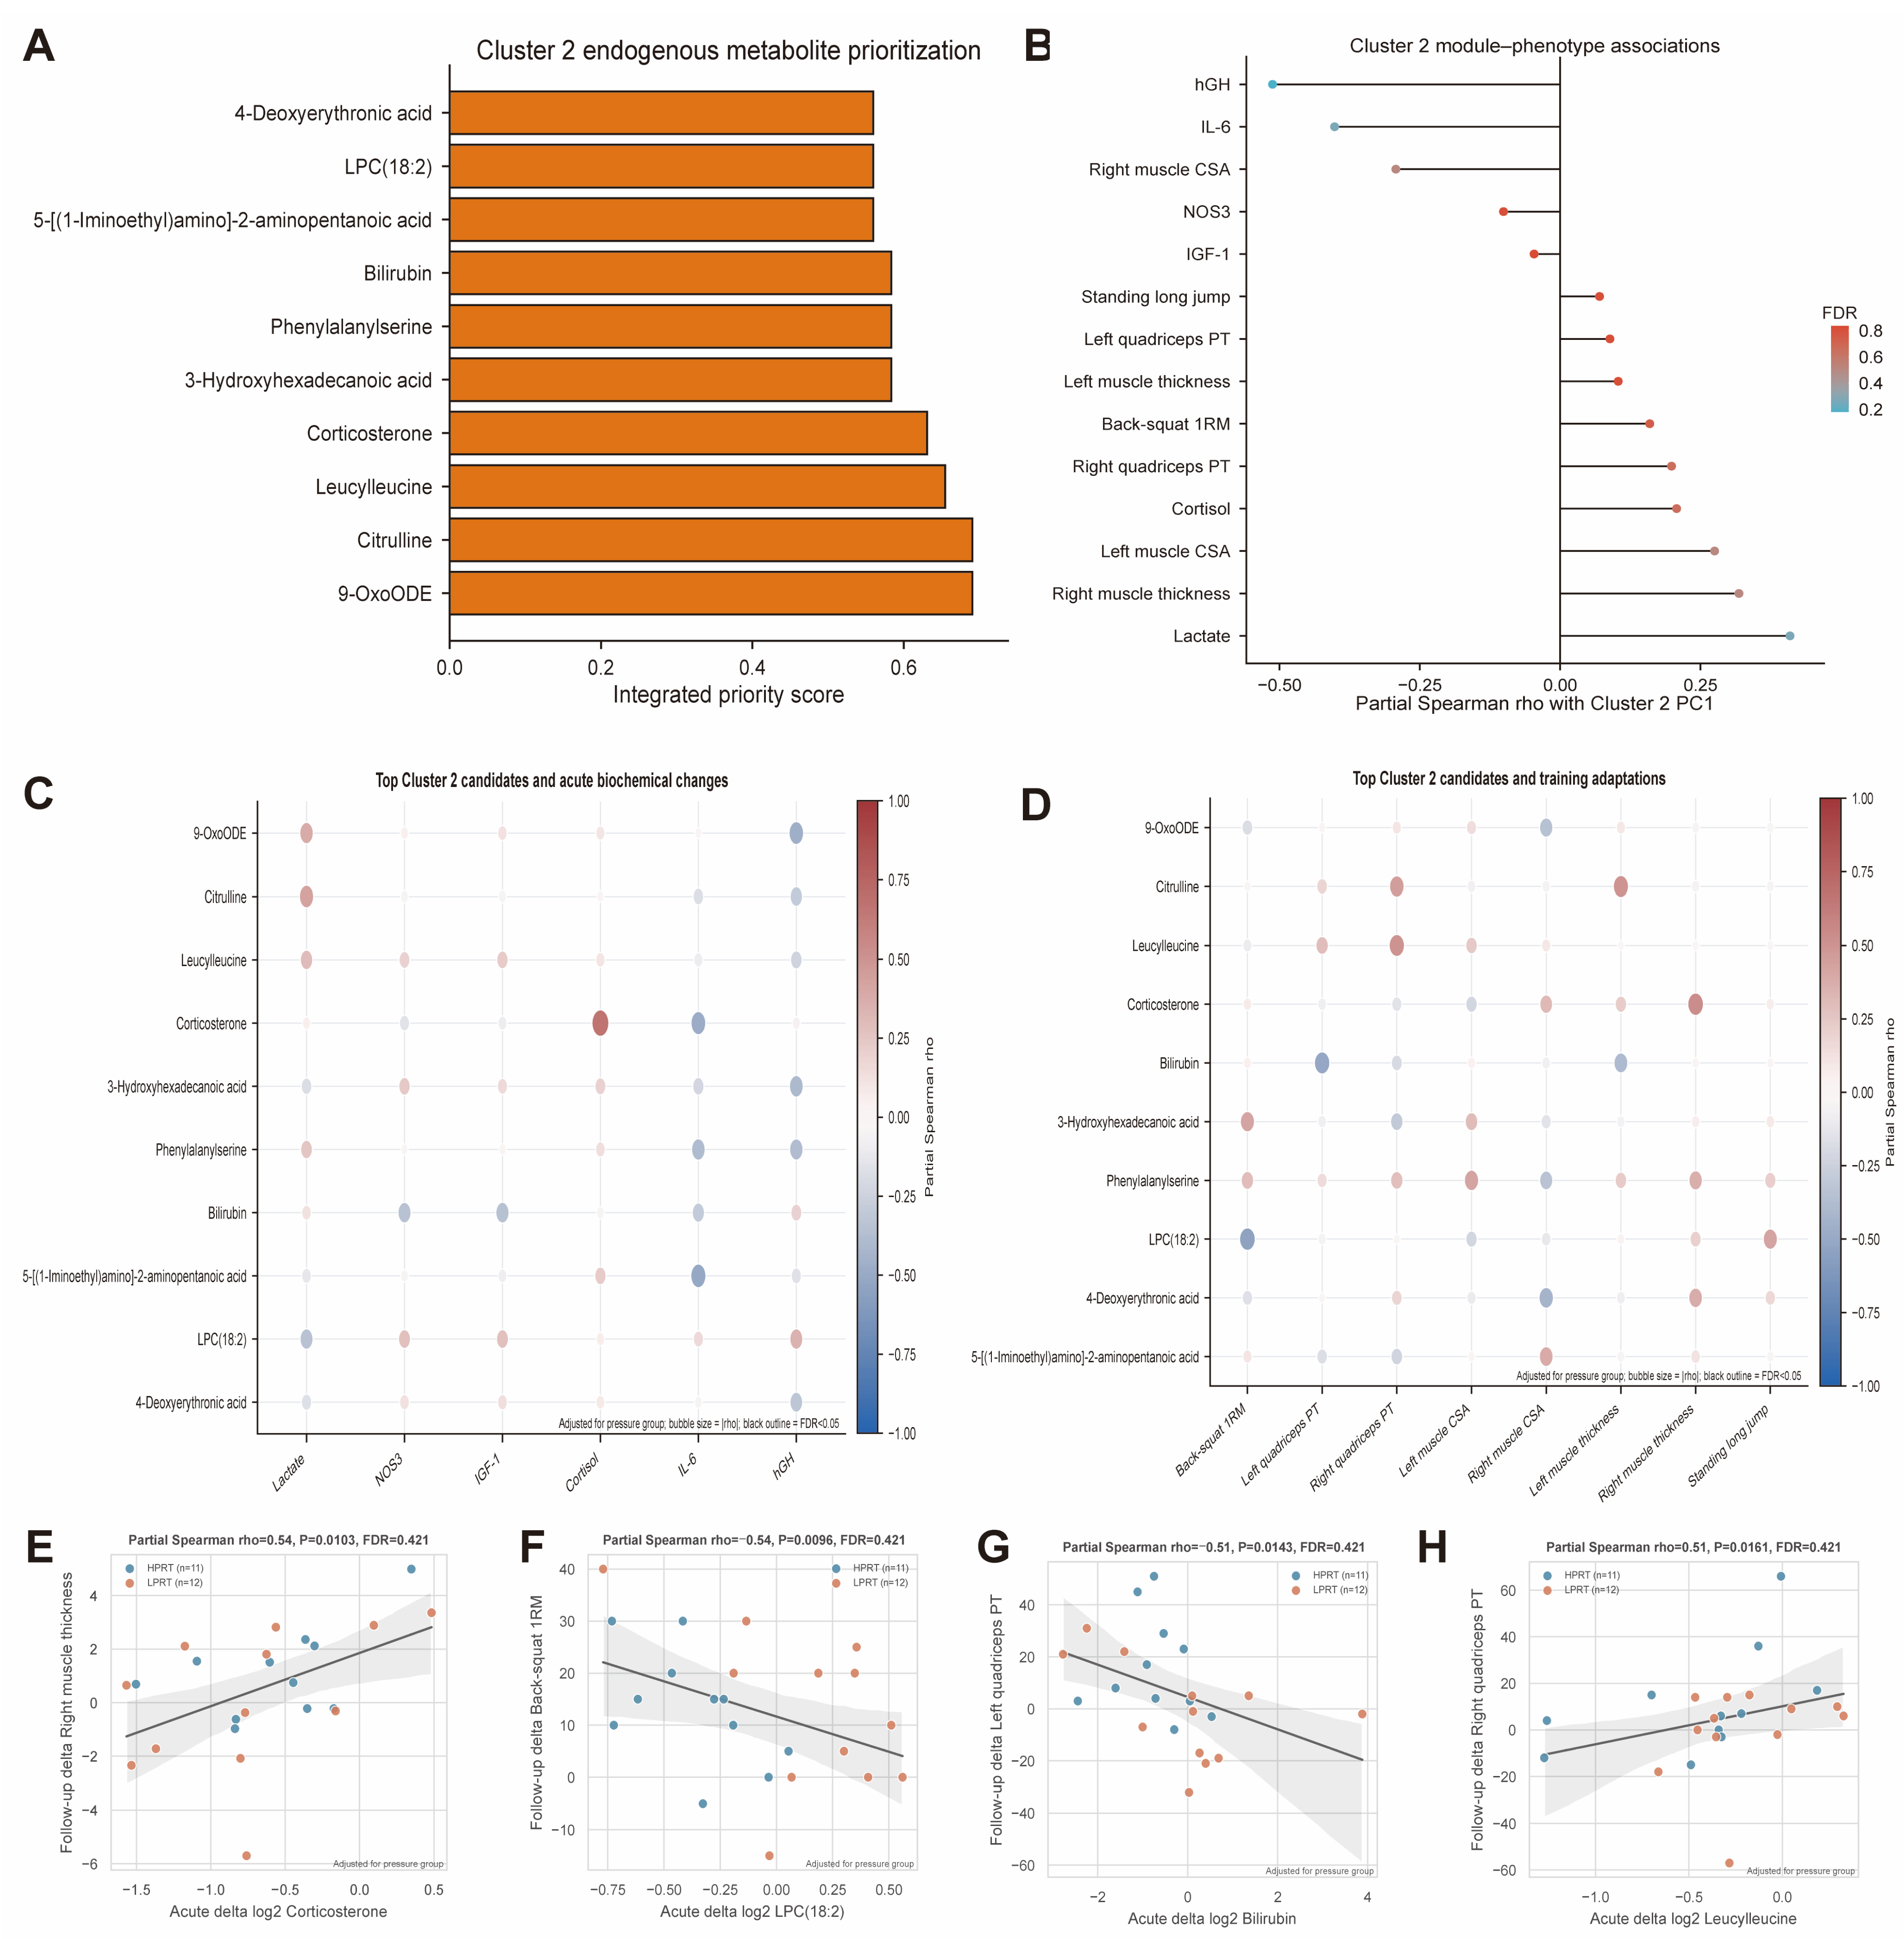
PC1 of acute changes in the 22 putatively endogenous Cluster 2 candidates explained 22.6% of their variance. Its strongest group-adjusted association was with acute hGH change (partial Spearman ρ = −0.512, p = 0.0124, q = 0.174; Figure 6B). Integrated prioritization placed 9-OxoODE and citrulline highest among the candidates (Figure 6A). Corticosterone change was positively associated with acute cortisol change (ρ = 0.668, p = 0.00049, q = 0.065; Figure 6C). Displayed associations with four-week outcomes included corticosterone with right rectus femoris thickness (ρ = 0.535), LPC(18:2) with back-squat 1RM (ρ = −0.539), bilirubin with left quadriceps PT (ρ = −0.514), and leucylleucine with right quadriceps PT (ρ = 0.507); all four had q = 0.421 (Figure 6D–H). None of the 132 metabolite–biochemical, 176 metabolite–training, or 14 module–phenotype associations met the FDR threshold (Table S5; Figures S2C,D and S3). These analyses identified exploratory covariation between initial metabolic responses, concurrent biochemical changes, and subsequent functional outcomes.
Figure 6.
Exploratory associations of initial metabolic responses with biochemical and four-week training outcomes. (A) Ten highest-ranked putatively endogenous Cluster 2 candidates; bar length indicates the integrated priority score. (B) Group-adjusted partial Spearman correlations between Cluster 2 PC1 and phenotype changes. Horizontal segments connect zero to each estimate; point color indicates BH-adjusted q. (C,D) Associations of the ten prioritized candidates with acute biochemical changes and four-week training changes, respectively. Red and blue indicate positive and negative correlations; bubble size represents |ρ|, and black outlines denote q < 0.05. (E–H) Individual associations of corticosterone with right rectus femoris thickness (E), LPC(18:2) with back-squat 1RM (F), bilirubin with left quadriceps PT (G), and leucylleucine with right quadriceps PT (H). Point colors identify pressure groups; solid lines show fitted trends, and gray shading indicates 95% confidence bands around the fitted lines. Metabolite changes were calculated as log2(Post intensity + 1) − log2(Pre intensity + 1), biochemical changes as Post−Pre, and training changes as week 4−baseline. Correlations were adjusted for pressure group, with separate BH correction across 132, 176, and 14 tests for the biochemical, training, and module analyses, respectively. Acute analyses included 24 participants; training analyses included 23 participants (HPRT, n = 11; LPRT, n = 12). LPC, lysophosphatidylcholine; 9-OxoODE, 9-oxooctadecadienoic acid.
4. Discussion
We examined first-session circulating responses alongside four-week functional changes under two individualized VOP-referenced pressure prescriptions in male sprinters. Both conditions elicited acute lactate and hGH responses and were accompanied by increased back-squat strength. Exploratory metabolomics identified shared response patterns among selected amino acid-, lipid-, steroid-, and heme-related candidates, with differences in their mean trajectories across pressure conditions. Most functional outcomes showed no detected between-pressure difference in change. Together, these observations place the initial circulating response within a short training period characterized by improvements in the practiced strength task.
Cuff pressure contributes to the local exercise stimulus through changes in intramuscular metabolic stress, tissue oxygenation, and neuromuscular demand [24,25,26]. Cuff characteristics and individual limb properties influence the pressure required to produce a vascular effect [27]. In our protocol, individualized pressure was referenced to venous-flow cessation at rest, providing a common physiological basis for the two prescriptions. The lactate and hGH increases indicate that both conditions elicited systemic responses consistent with previous low-load exercise studies using vascular restriction [28,29]. The endocrine profile also reflects the timing of exercise and sampling. Circadian variation in cortisol secretion and responsiveness provides a physiological context for the decrease observed during morning testing [30]. For hGH, pulsatile secretion and post-exercise kinetics influence the concentration captured by a single sample. Serial sampling during BFR exercise has shown that peak concentrations and integrated exposure describe different aspects of the hGH response [31]. The nominal NOS3 and IGF-1 contrasts add candidate pressure-associated signals to this shared biochemical response and identify circulating proteins for further study alongside local vascular and muscular measurements.
The functional findings connect pressure selection with external load, repeated exercise exposure, and training specificity. Counts et al. reported comparable improvements following training at 40% and 90% of arterial occlusion pressure [12], while Lixandrão et al. found that the contribution of higher pressure to muscle growth depended on exercise intensity [13]. These studies place cuff pressure within a broader relationship between pressure and mechanical loading. Their arterial reference and the venous reference used here anchor the prescriptions to distinct vascular endpoints. Evidence linking muscle deoxygenation with hypertrophy [32], together with short-term training studies in athletes [8,33,34], further emphasizes the contribution of the accumulated exercise stimulus. Pressure adjustment across an intervention adds a temporal dimension to its delivery [35]. Within our program, repeated practice of the back squat provides a plausible basis for early gains through improved neural recruitment and coordination [36,37]. Circulating endocrine responses represent one component of this adaptation process and have shown limited correspondence with subsequent strength and hypertrophy in resistance-trained men [16,38]. Early morphological changes also incorporate tissue remodeling and fluid-related changes [39,40]. The functional pattern observed here is therefore consistent with an early phase of task-specific strength development, during which performance and morphological outcomes can follow different time courses.
The metabolic findings extend this interpretation to circulating substrate handling. Exercise profiling and regional sampling show that plasma metabolite concentrations integrate changing release and uptake across exercising muscle and other tissues [41,42]. Exercise-responsive acylcarnitines illustrate the sensitivity of the circulating pool to changes in energy substrate metabolism [43]. Within our candidate set, putative citrulline and ornithine annotations connect part of the response to the arginine metabolic network [44], while amino acid derivatives and dipeptides broaden this pattern to amino acid handling. LPC(18:2) and 9-OxoODE contribute phospholipid-related and oxidized linoleate signals. Previous studies have documented exercise-responsive linoleate products and associations between lipid-related metabolites and systemic physiological responses [45,46]. Targeted oxylipin profiling has also identified 9-oxo-ODE among the circulating species responsive to prolonged exercise [47]. Bilirubin adds a heme-derived compound with antioxidant activity demonstrated in chemical and membrane model systems [48], and corticosterone contributes a steroid-related candidate. Redox biology also intersects with mitochondrial energy metabolism. In renal transcriptomic analyses, ergothioneine-associated expression signatures opposed conserved mitochondrial injury programs involving oxidative phosphorylation and mitochondrial translation [49]. This literature supports examining our lipid- and heme-related candidates alongside nitrogen handling and steroid metabolism as complementary components of the acute circulating response. The pathway mappings provide an exploratory biochemical organization of these compounds.
Our sampling scheme connects the initial exercise bout with early recovery after four weeks of training. Within the first session, the module–hGH and corticosterone–cortisol associations describe concurrent variation in metabolic and endocrine responses. Candidate associations involving LPC(18:2), bilirubin, leucylleucine, and subsequent functional changes extend this analysis across the training period. Exercise-induced metabolic profiles can change substantially during early recovery [50], and human muscle profiling has identified distinct responses to initial and repeated resistance exercise [51]. Repeated exposure therefore provides a changing physiological context for each exercise bout. In our study, first-session plasma samples characterized the immediate response at entry to the intervention, while next-morning serum measurements characterized early recovery at the end of the training block. The serum NOS3, IGF-1, and HSPA2 differences add a circulating protein profile to this second sampling window. Together, these observations provide a temporal framework for following candidate responses across successive training sessions.
Our four-week study of 24 male sprinters focused on early responses to two active BFR-RT prescriptions. Larger cohorts and longer interventions can refine estimates of smaller between-pressure effects, while a conventional-training comparison can quantify the additional contribution of cuff application. Vascular characterization comprised resting dominant-leg VOP, which was used to prescribe bilateral cuff pressures; direct perfusion measurements during exercise would extend this characterization. The acute metabolomic analyses captured one immediate post-exercise time point without plasma-volume correction. Candidate selection and association testing used the same cohort, which showed baseline metabolic differences, and compound identities were assigned putatively. Independent replication, serial sampling, and targeted identification can extend these observations within established metabolomics quality and reporting frameworks [52,53,54].
5. Conclusions
Both VOP-referenced cuff-pressure prescriptions were accompanied by acute biochemical responses and increased back-squat strength over four weeks in male sprinters. Exploratory metabolomics identified coordinated candidate response patterns across the two pressure conditions. Most functional outcomes showed no detected between-pressure difference in change. These findings characterize acute circulating responses alongside short-term functional changes under two individualized pressure prescriptions.
Supplementary Materials
The following supporting information can be downloaded at https://www.mdpi.com/article/10.3390/metabo16110905/s1; Supplementary Methods: Additional procedures for untargeted plasma metabolomics; Figures S1–S3: Figure S1A: Four-week changes in isokinetic strength; Figure S1B: Four-week changes in muscle morphology; Figure S1C: Four-week changes in strength and jump performance; Figure S2A: Acute biochemical responses to the first BFR-RT session; Figure S2B: Standardized profiles of the 53 candidates across two clusters; Figure S2C: Associations between Cluster 2 candidates and acute biochemical changes; Figure S2D: Associations between Cluster 2 candidates and four-week training changes; Figure S3: Associations between the Cluster 2 module and phenotype changes; Tables S1–S7: Table S1: Acute biochemical results; Table S2: Results for all 26 motor performance and muscle morphology indices; Table S3: Results of global metabolome comparison; Table S4: Results of complete pathway enrichment; Table S5: Full correlation analysis results; Table S6: Annotations and identification evidence for candidate features; Table S7: Participant-level baseline characteristics and longitudinal biochemical data.
Author Contributions
Conceptualization, Y.Z. and J.H.; methodology, Y.Z. and W.L.; investigation, Y.Z. and W.L.; formal analysis, Y.Z. and Y.L.; data curation, Y.Z. and W.L.; visualization, Y.L.; writing—original draft preparation, Y.Z.; writing—review and editing, W.L., Y.L. and J.H.; supervision, J.H.; project administration, J.H. All authors have read and agreed to the published version of the manuscript.
Funding
This research received no external funding. The APC was funded by the authors.
Institutional Review Board Statement
The study was conducted in accordance with the Declaration of Helsinki and approved by the Ethics Committee for Sports Science Experiments of Beijing Sport University (protocol code: 2024160H and date of approval: 16 May 2024).
Informed Consent Statement
Written informed consent was obtained from all participants before their participation in the study.
Data Availability Statement
The original contributions presented in this study are included in the article/Supplementary Material. Further inquiries can be directed to the corresponding author.
Acknowledgments
The authors thank the participating athletes and the technical staff who assisted with sample analyses.
Conflicts of Interest
The authors declare no conflicts of interest.
References
- Morin, J.-B.; Bourdin, M.; Edouard, P.; Peyrot, N.; Samozino, P.; Lacour, J.-R. Mechanical determinants of 100-m sprint running performance. Eur. J. Appl. Physiol. 2012, 112, 3921–3930. [Google Scholar] [CrossRef] [Scilit] [PubMed]
- Suchomel, T.J.; Nimphius, S.; Stone, M.H. The Importance of Muscular Strength in Athletic Performance. Sports Med. 2016, 46, 1419–1449. [Google Scholar] [CrossRef] [Scilit] [PubMed]
- Fujita, S.; Abe, T.; Drummond, M.J.; Cadenas, J.G.; Dreyer, H.C.; Sato, Y.; Volpi, E.; Rasmussen, B.B. Blood flow restriction during low-intensity resistance exercise increases S6K1 phosphorylation and muscle protein synthesis. J. Appl. Physiol. 2007, 103, 903–910. [Google Scholar] [CrossRef] [Scilit] [PubMed]
- Lixandrão, M.E.; Ugrinowitsch, C.; Berton, R.; Vechin, F.C.; Conceição, M.S.; Damas, F.; Libardi, C.A.; Roschel, H. Magnitude of Muscle Strength and Mass Adaptations Between High-Load Resistance Training Versus Low-Load Resistance Training Associated with Blood-Flow Restriction: A Systematic Review and Meta-Analysis. Sports Med. 2018, 48, 361–378. [Google Scholar] [CrossRef] [Scilit] [PubMed]
- Sato, Y. The history and future of KAATSU Training. Int. J. KAATSU Train. Res. 2005, 1, 1–5. [Google Scholar] [CrossRef] [Scilit]
- Loenneke, J.; Abe, T.; Wilson, J.; Thiebaud, R.; Fahs, C.; Rossow, L.; Bemben, M. Blood flow restriction: An evidence based progressive model. Acta Physiol. Hung. 2012, 99, 235–250. [Google Scholar] [CrossRef] [Scilit] [PubMed]
- Scott, B.R.; Loenneke, J.P.; Slattery, K.M.; Dascombe, B.J. Blood flow restricted exercise for athletes: A review of available evidence. J. Sci. Med. Sport 2016, 19, 360–367. [Google Scholar] [CrossRef] [Scilit] [PubMed]
- Huang, Q.; Xiao, L.; Zheng, S.; Meng, L.; Yue, S. Muscle hypertrophy and strength improvements following blood flow restriction combined with resistance training in team-athletes: A systematic review and meta-analysis. Front. Physiol. 2026, 17, 1812707. [Google Scholar] [CrossRef] [Scilit] [PubMed]
- Hughes, L.; Rolnick, N.; Franz, A.; Owens, J.; Swain, P.M.; Centner, C.; Loenneke, J.P.; Warmington, S.A. Blood flow restriction: Methods and apparatus still matter. Br. J. Sports Med. 2025, 59, 623–625. [Google Scholar] [CrossRef] [Scilit] [PubMed]
- Ilett, M.J.; Rantalainen, T.; Keske, M.A.; May, A.K.; Warmington, S.A. The Effects of Restriction Pressures on the Acute Responses to Blood Flow Restriction Exercise. Front. Physiol. 2019, 10, 1018. [Google Scholar] [CrossRef] [Scilit] [PubMed]
- Zhang, X.; Zhang, X.; Liu, S.; Lu, B.; Sun, X.; Zhang, Z. Acute neuromuscular and short-term recovery responses to low-load exercise with individualized blood flow restriction in elite male volleyball players. Sci. Rep. 2026, 16, 24191. [Google Scholar] [CrossRef] [Scilit] [PubMed]
- Counts, B.R.; Dankel, S.J.; Barnett, B.E.; Kim, D.; Mouser, J.G.; Allen, K.M.; Thiebaud, R.S.; Abe, T.; Bemben, M.G.; Loenneke, J.P. Influence of relative blood flow restriction pressure on muscle activation and muscle adaptation. Muscle Nerve 2016, 53, 438–445. [Google Scholar] [CrossRef] [Scilit] [PubMed]
- Lixandrão, M.E.; Ugrinowitsch, C.; Laurentino, G.; Libardi, C.A.; Aihara, A.Y.; Cardoso, F.N.; Tricoli, V.; Roschel, H. Effects of exercise intensity and occlusion pressure after 12 weeks of resistance training with blood-flow restriction. Eur. J. Appl. Physiol. 2015, 115, 2471–2480. [Google Scholar] [CrossRef] [Scilit] [PubMed]
- Pignanelli, C.; Christiansen, D.; Burr, J.F. Blood flow restriction training and the high-performance athlete: Science to application. J. Appl. Physiol. 2021, 130, 1163–1170. [Google Scholar] [CrossRef] [Scilit] [PubMed]
- Stavres, J.; Singer, T.J.; Brochetti, A.; Kilbane, M.J.; Brose, S.W.; McDaniel, J. The Feasibility of Blood Flow Restriction Exercise in Patients with Incomplete Spinal Cord Injury. PM&R 2018, 10, 1368–1379. [Google Scholar] [CrossRef] [Scilit] [PubMed]
- Laurentino, G.C.; Loenneke, J.P.; Ugrinowitsch, C.; Aoki, M.S.; Soares, A.G.; Roschel, H.; Tricoli, V. Blood-Flow-Restriction-Training-Induced Hormonal Response is not Associated with Gains in Muscle Size and Strength. J. Hum. Kinet. 2022, 83, 235–243. [Google Scholar] [CrossRef] [Scilit] [PubMed]
- Lewis, G.D.; Farrell, L.; Wood, M.J.; Martinovic, M.; Arany, Z.; Rowe, G.C.; Souza, A.; Cheng, S.; McCabe, E.L.; Yang, E.; et al. Metabolic signatures of exercise in human plasma. Sci. Transl. Med. 2010, 2, 33ra37. [Google Scholar] [CrossRef] [Scilit] [PubMed]
- Contrepois, K.; Wu, S.; Moneghetti, K.J.; Hornburg, D.; Ahadi, S.; Tsai, M.-S.; Metwally, A.A.; Wei, E.; Lee-McMullen, B.; Quijada, J.V.; et al. Molecular Choreography of Acute Exercise. Cell 2020, 181, 1112–1130.e16. [Google Scholar] [CrossRef] [Scilit] [PubMed]
- Nayor, M.; Shah, R.V.; Miller, P.E.; Blodgett, J.B.; Tanguay, M.; Pico, A.R.; Murthy, V.L.; Malhotra, R.; Houstis, N.E.; Deik, A.; et al. Metabolic Architecture of Acute Exercise Response in Middle-Aged Adults in the Community. Circulation 2020, 142, 1905–1924. [Google Scholar] [CrossRef] [Scilit] [PubMed]
- Morville, T.; Sahl, R.E.; Moritz, T.; Helge, J.W.; Clemmensen, C. Plasma Metabolome Profiling of Resistance Exercise and Endurance Exercise in Humans. Cell Rep. 2020, 33, 108554. [Google Scholar] [CrossRef] [Scilit] [PubMed]
- Valério, D.F.; Berton, R.; Conceição, M.S.; Canevarolo, R.R.; Chacon-Mikahil, M.P.T.; Cavaglieri, C.R.; Meirelles, G.V.; Zeri, A.C.; Libardi, C. A Early metabolic response after resistance exercise with blood flow restriction in well-trained men: A metabolomics approach. Appl. Physiol. Nutr. Metab. 2018, 43, 240–246. [Google Scholar] [CrossRef] [Scilit] [PubMed]
- Ebben, W.P.; Petushek, E.J. Using the reactive strength index modified to evaluate plyometric performance. J. Strength Cond. Res. 2010, 24, 1983–1987. [Google Scholar] [CrossRef] [Scilit] [PubMed]
- Grgic, J.; Lazinica, B.; Schoenfeld, B.J.; Pedisic, Z. Test-Retest Reliability of the One-Repetition Maximum (1RM) Strength Assessment: A Systematic Review. Sports Med. Open 2020, 6, 31. [Google Scholar] [CrossRef] [Scilit] [PubMed]
- Suga, T.; Okita, K.; Morita, N.; Yokota, T.; Hirabayashi, K.; Horiuchi, M.; Takada, S.; Omokawa, M.; Kinugawa, S.; Tsutsui, H. Dose effect on intramuscular metabolic stress during low-intensity resistance exercise with blood flow restriction. J. Appl. Physiol. 2010, 108, 1563–1567. [Google Scholar] [CrossRef] [Scilit] [PubMed]
- Reis, J.F.; Fatela, P.; Mendonca, G.V.; Vaz, J.R.; Valamatos, M.J.; Infante, J.; Mil-Homens, P.; Alves, F.B. Tissue Oxygenation in Response to Different Relative Levels of Blood-Flow Restricted Exercise. Front. Physiol. 2019, 10, 407. [Google Scholar] [CrossRef] [Scilit] [PubMed]
- Fatela, P.; Reis, J.F.; Mendonca, G.V.; Avela, J.; Mil-Homens, P. Acute effects of exercise under different levels of blood-flow restriction on muscle activation and fatigue. Eur. J. Appl. Physiol. 2016, 116, 985–995. [Google Scholar] [CrossRef] [Scilit] [PubMed]
- Jessee, M.B.; Buckner, S.L.; Dankel, S.J.; Counts, B.R.; Abe, T.; Loenneke, J.P. The Influence of Cuff Width, Sex, and Race on Arterial Occlusion: Implications for Blood Flow Restriction Research. Sports Med. 2016, 46, 913–921. [Google Scholar] [CrossRef] [Scilit] [PubMed]
- Takarada, Y.; Nakamura, Y.; Aruga, S.; Onda, T.; Miyazaki, S.; Ishii, N. Rapid increase in plasma growth hormone after low-intensity resistance exercise with vascular occlusion. J. Appl. Physiol. 2000, 88, 61–65. [Google Scholar] [CrossRef] [Scilit] [PubMed]
- Reeves, G.V.; Kraemer, R.R.; Hollander, D.B.; Clavier, J.; Thomas, C.; Francois, M.; Castracane, V.D. Comparison of hormone responses following light resistance exercise with partial vascular occlusion and moderately difficult resistance exercise without occlusion. J. Appl. Physiol. 2006, 101, 1616–1622. [Google Scholar] [CrossRef] [Scilit] [PubMed]
- Bird, S.P.; Tarpenning, K.M. Influence of circadian time structure on acute hormonal responses to a single bout of heavy-resistance exercise in weight-trained men. Chronobiol. Int. 2004, 21, 131–146. [Google Scholar] [CrossRef] [Scilit] [PubMed]
- Manini, T.M.; Yarrow, J.F.; Buford, T.W.; Clark, B.C.; Conover, C.F.; Borst, S.E. Growth hormone responses to acute resistance exercise with vascular restriction in young and old men. Growth Horm. IGF Res. 2012, 22, 167–172. [Google Scholar] [CrossRef] [Scilit] [PubMed]
- Biazon, T.M.P.C.; Ugrinowitsch, C.; Soligon, S.D.; Oliveira, R.M.; Bergamasco, J.G.; Borghi-Silva, A.; Libardi, C.A. The Association Between Muscle Deoxygenation and Muscle Hypertrophy to Blood Flow Restricted Training Performed at High and Low Loads. Front. Physiol. 2019, 10, 446. [Google Scholar] [CrossRef] [Scilit] [PubMed]
- Cook, C.J.; Kilduff, L.P.; Beaven, C.M. Improving strength and power in trained athletes with 3 weeks of occlusion training. Int. J. Sports Physiol. Perform. 2014, 9, 166–172. [Google Scholar] [CrossRef] [Scilit] [PubMed]
- Manimmanakorn, A.; Hamlin, M.J.; Ross, J.J.; Taylor, R.; Manimmanakorn, N. Effects of low-load resistance training combined with blood flow restriction or hypoxia on muscle function and performance in netball athletes. J. Sci. Med. Sport 2013, 16, 337–342. [Google Scholar] [CrossRef] [Scilit] [PubMed]
- Cerqueira, M.S.; Costa, E.C.; Oliveira, R.S.; Pereira, R.; Vieira, W.H.B. Blood Flow Restriction Training: To Adjust or Not Adjust the Cuff Pressure Over an Intervention Period? Front. Physiol. 2021, 12, 678407. [Google Scholar] [CrossRef] [Scilit] [PubMed]
- Egan, B.; Zierath, J.R. Exercise metabolism and the molecular regulation of skeletal muscle adaptation. Cell Metab. 2013, 17, 162–184. [Google Scholar] [CrossRef] [Scilit] [PubMed]
- Folland, J.P.; Williams, A.G. The adaptations to strength training: Morphological and neurological contributions to increased strength. Sports Med. 2007, 37, 145–168. [Google Scholar] [PubMed]
- Morton, R.W.; Oikawa, S.Y.; Wavell, C.G.; Mazara, N.; McGlory, C.; Quadrilatero, J.; Baechler, B.L.; Baker, S.K.; Phillips, S.M. Neither load nor systemic hormones determine resistance training-mediated hypertrophy or strength gains in resistance-trained young men. J. Appl. Physiol. 2016, 121, 129–138. [Google Scholar] [CrossRef] [Scilit] [PubMed]
- Damas, F.; Phillips, S.M.; Libardi, C.A.; Vechin, F.C.; Lixandrão, M.E.; Jannig, P.R.; Costa, L.A.R.; Bacurau, A.V.; Snijders, T.; Parise, G.; et al. Resistance training-induced changes in integrated myofibrillar protein synthesis are related to hypertrophy only after attenuation of muscle damage. J. Physiol. 2016, 594, 5209–5222. [Google Scholar] [CrossRef] [Scilit] [PubMed]
- Damas, F.; Phillips, S.M.; Lixandrão, M.E.; Vechin, F.C.; Libardi, C.A.; Roschel, H.; Tricoli, V.; Ugrinowitsch, C. Early resistance training-induced increases in muscle cross-sectional area are concomitant with edema-induced muscle swelling. Eur. J. Appl. Physiol. 2016, 116, 49–56. [Google Scholar] [CrossRef] [Scilit] [PubMed]
- Davison, G.; Vinaixa, M.; McGovern, R.; Beltran, A.; Novials, A.; Correig, X.; McClean, C. Metabolomic Response to Acute Hypoxic Exercise and Recovery in Adult Males. Front. Physiol. 2018, 9, 1682. [Google Scholar] [CrossRef] [Scilit] [PubMed]
- Hu, C.; Hoene, M.; Plomgaard, P.; Hansen, J.S.; Zhao, X.; Li, J.; Wang, X.; Clemmesen, J.O.; Secher, N.H.; Häring, H.U.; et al. Muscle-Liver Substrate Fluxes in Exercising Humans and Potential Effects on Hepatic Metabolism. J. Clin. Endocrinol. Metab. 2020, 105, 1196–1209. [Google Scholar] [CrossRef] [Scilit] [PubMed]
- Lehmann, R.; Zhao, X.; Weigert, C.; Simon, P.; Fehrenbach, E.; Fritsche, J.; Machann, J.; Schick, F.; Wang, J.; Hoene, M.; et al. Medium chain acylcarnitines dominate the metabolite pattern in humans under moderate intensity exercise and support lipid oxidation. PLoS ONE 2010, 5, e11519. [Google Scholar] [CrossRef] [Scilit] [PubMed]
- Morris, S.M., Jr. Arginine metabolism: Boundaries of our knowledge. J. Nutr. 2007, 137, 1602s–1609s. [Google Scholar] [CrossRef] [Scilit] [PubMed]
- Nieman, D.C.; Shanely, R.A.; Luo, B.; Meaney, M.P.; Dew, D.A.; Pappan, K.L. Metabolomics approach to assessing plasma 13- and 9-hydroxy-octadecadienoic acid and linoleic acid metabolite responses to 75-km cycling. Am. J. Physiol. Regul. Integr. Comp. Physiol. 2014, 307, R68–R74. [Google Scholar] [CrossRef] [Scilit] [PubMed]
- Nieman, D.C.; Sha, W.; Pappan, K.L. IL-6 Linkage to Exercise-Induced Shifts in Lipid-Related Metabolites: A Metabolomics-Based Analysis. J. Proteome Res. 2017, 16, 970–977. [Google Scholar] [CrossRef] [Scilit] [PubMed]
- Nieman, D.C.; Gillitt, N.D.; Chen, G.-Y.; Zhang, Q.; Sakaguchi, C.A.; Stephan, E.H. Carbohydrate intake attenuates post-exercise plasma levels of cytochrome P450-generated oxylipins. PLoS ONE 2019, 14, e0213676. [Google Scholar] [CrossRef] [Scilit] [PubMed]
- Stocker, R.; Yamamoto, Y.; McDonagh, A.F.; Glazer, A.N.; Ames, B.N. Bilirubin is an antioxidant of possible physiological importance. Science 1987, 235, 1043–1046. [Google Scholar] [CrossRef] [Scilit] [PubMed]
- Chen, Y.; Gui, H.; Xue, X.; Liu, M.; Zhang, Z.; Tang, S.; Ma, K.; Wang, M.; Yang, R. Ergothioneine-Associated Transcription Opposes Conserved Mitochondrial Injury Programs in Proximal Tubules. Antioxidants 2026, 15, 1239. [Google Scholar] [CrossRef] [Scilit] [PubMed]
- Pellegrino, J.K.; Anthony, T.G.; Gillies, P.; Arent, S.M. The exercise metabolome: Acute aerobic and anaerobic signatures. J. Int. Soc. Sports Nutr. 2022, 19, 603–622. [Google Scholar] [CrossRef] [Scilit] [PubMed]
- Gehlert, S.; Weinisch, P.; Römisch-Margl, W.; Jaspers, R.T.; Artati, A.; Adamski, J.; Dyar, K.A.; Aussieker, T.; Jacko, D.; Bloch, W.; et al. Effects of Acute and Chronic Resistance Exercise on the Skeletal Muscle Metabolome. Metabolites 2022, 12, 445. [Google Scholar] [CrossRef] [Scilit] [PubMed]
- Broadhurst, D.; Goodacre, R.; Reinke, S.N.; Kuligowski, J.; Wilson, I.D.; Lewis, M.R.; Dunn, W.B. Guidelines and considerations for the use of system suitability and quality control samples in mass spectrometry assays applied in untargeted clinical metabolomic studies. Metabolomics 2018, 14, 72. [Google Scholar] [CrossRef] [Scilit] [PubMed]
- Sumner, L.W.; Amberg, A.; Barrett, D.; Beale, M.H.; Beger, R.; Daykin, C.A.; Fan, T.W.M.; Fiehn, O.; Goodacre, R.; Griffin, J.L.; et al. Proposed minimum reporting standards for chemical analysis Chemical Analysis Working Group (CAWG) Metabolomics Standards Initiative (MSI). Metabolomics 2007, 3, 211–221. [Google Scholar] [PubMed]
- Schrimpe-Rutledge, A.C.; Codreanu, S.G.; Sherrod, S.D.; McLean, J.A. Untargeted Metabolomics Strategies-Challenges and Emerging Directions. J. Am. Soc. Mass. Spectrom. 2016, 27, 1897–1905. [Google Scholar] [CrossRef] [Scilit] [PubMed]

Disclaimer/Publisher’s Note: The statements, opinions and data contained in all publications are solely those of the individual author(s) and contributor(s) and not of MDPI and/or the editor(s). MDPI and/or the editor(s) disclaim responsibility for any injury to people or property resulting from any ideas, methods, instructions or products referred to in the content. |
© 2026 by the authors. Licensee MDPI, Basel, Switzerland. This article is an open access article distributed under the terms and conditions of the Creative Commons Attribution (CC BY) license.