


Abstract
Background/Objectives: BMI does not capture prior weight trajectory. We assessed whether historical weight difference from self-reported lifetime maximum weight and erythrocyte sedimentation rate (ESR) were associated with all-cause mortality in type 2 diabetes mellitus (T2DM). Methods: We retrospectively analysed 1566 patients with T2DM admitted in 2016–2018. Maximum weight was self-reported; timing and intentionality of subsequent change were unknown. Vital status on 31 December 2022 was analysed by logistic regression adjusted for age, sex, admission year, eGFR, HbA1c, hypertension and cardiovascular disease. Results: Overall, 332 patients (21.2%) died. Mortality was 19.8%, 19.0% and 26.8% for weight differences of ≤5, >5–15 and >15 kg (p = 0.008). A difference > 15 kg remained associated with mortality (OR 1.70, 95% CI 1.21–2.39), as did ESR (OR 1.27 per SD, 95% CI 1.08–1.49); current BMI was not. ESR remained associated after inverse-probability weighting. Both associations attenuated after haemoglobin and GGT were added. An exploratory four-item score modestly improved discrimination (optimism-corrected AUC 0.759 to 0.778). Conclusions: Historical weight difference and ESR were associated with mortality in hospitalised adults with T2DM. Weight history may complement BMI in risk characterisation, but prospective validation is needed.
1. Introduction
Diabetes affected an estimated 589 million adults worldwide in 2024 [1]. Type 2 diabetes mellitus (T2DM) is characterised not only by disturbances in glucose metabolism but also by chronic low-grade inflammation [2]. Contemporary cohort data show that inflammatory activity carries prognostic information in T2DM: circulating IL-6 and high-sensitivity C-reactive protein have been associated with all-cause mortality independently of conventional cardiovascular risk factors, while population studies using readily available inflammatory indices have reported similar associations [3,4]. Together, these studies support inflammation as a marker of systemic risk in T2DM.
Body weight is more difficult to interpret from a single measurement. A current BMI value cannot distinguish long-term weight stability from substantial preceding weight reduction. This is relevant to the apparent obesity paradox reported in T2DM, in which reverse causation and disease-related weight loss may contribute to the association between lower BMI and higher mortality [5,6]. A meta-analysis in T2DM found higher mortality with weight loss exceeding 10%, while more moderate loss was not associated with a significant increase; large cohort studies have also linked weight variability to adverse outcomes [7,8].
Self-reported lifetime maximum weight provides a simple historical reference, although it does not indicate when the maximum occurred, how quickly weight changed, or whether the reduction was intentional. We use the difference between lifetime maximum and current weight as a measure of weight history. The present study uses the current weight-history database from the same institutional research programme as a previously published mortality-prediction analysis [9]. The earlier publication included 1969 patients, while the present source database contains 1981 records, so the cohorts partially overlap. The earlier analysis used machine learning to predict all-cause mortality from routinely collected variables; it did not examine the lifetime-maximum-to-current weight difference as a predefined exposure, compare its incremental contribution beyond current BMI, or address informative ESR missingness.
We examined, primarily in patients with T2DM, whether the difference between self-reported lifetime maximum body weight and current admission weight was associated with all-cause mortality, whether it added information beyond current BMI, and how ESR related to outcome. We also evaluated an exploratory four-item multimarker score combining a large weight difference, elevated ESR, anaemia and elevated GGT. Patients with type 1 diabetes were analysed separately because of the clinical differences between diabetes types and the small number of deaths in that subgroup.
2. Materials and Methods
2.1. Study Design and Population
We retrospectively analysed a patient-level database of patients with diabetes mellitus admitted to Craiova County Emergency Hospital between January 2016 and December 2018. Because the source database was patient-level rather than admission-level, no selection among duplicate eligible admissions was required: each individual appeared once, and the hospitalisation represented by that record served as the index observation. Repeat cardiology admissions, where present, were summarised in dedicated variables and were not entered as separate study records. The 2016–2018 period corresponds to the source cohort previously assembled for institutional mortality research [9] and was retained because baseline data and subsequent vital-status linkage through 2022 were available for this cohort.
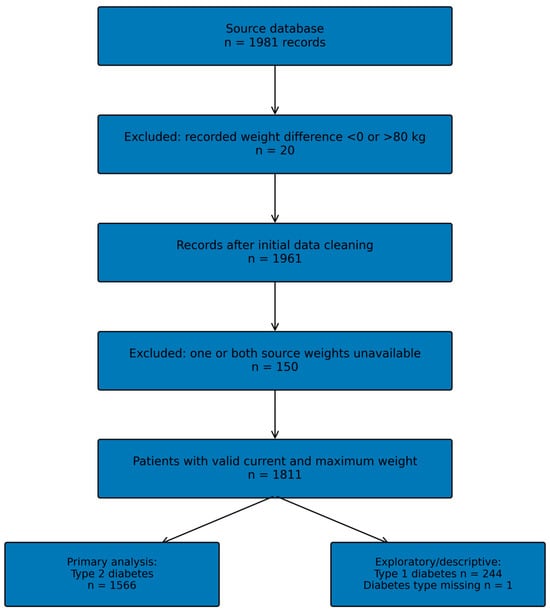
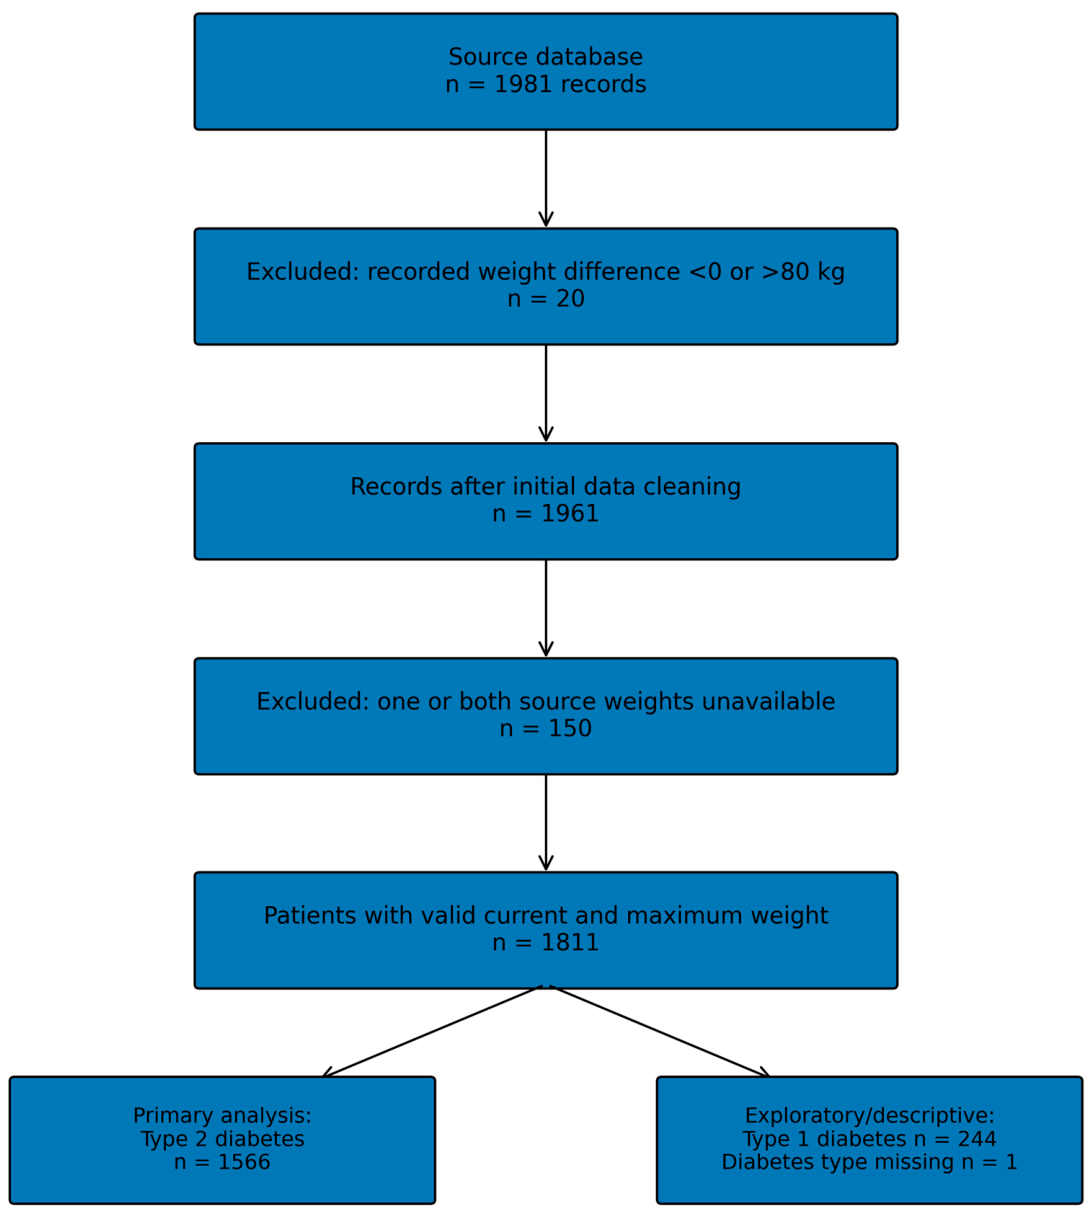
Eligibility for the weight-history analysis required a hospital diagnosis of diabetes mellitus and availability of both current and self-reported lifetime maximum body weight. The source database contained 1981 records. Twenty records with a derived weight difference outside the data-cleaning range (<0 or >80 kg) were removed. Among the remaining 1961 records, 150 had one or both source weights unavailable despite a value being present in the derived weight-difference field and were excluded to avoid treating missing data as weight stability. The resulting cohort contained 1811 patients. Diabetes type was available for 1810 patients. Primary multivariable analyses were restricted to the 1566 patients with T2DM, all of whom were adults. The 244 patients with type 1 diabetes were summarised separately; one patient had diabetes type missing and was not included in diabetes-type-specific models (Figure 1).
Figure 1.
Study flow diagram and definition of the primary analytical cohort.
2.2. Variables
Current weight was recorded at admission, whereas lifetime maximum weight was obtained by patient report. Absolute weight difference was calculated as maximum minus current weight. For descriptive and categorical analyses, pragmatic groups of ≤5 kg, >5 to ≤15 kg, and >15 kg were used to separate small, intermediate and larger historical differences while retaining adequate numbers in each group; the categories were not derived from the spline analysis. Percentage difference was calculated as (maximum weight − current weight)/maximum weight × 100 and categorised as <5%, 5–10% inclusive, and >10%. Categories were assigned from the unrounded calculated values. Percentage difference was included because consensus definitions of cachexia use proportional weight loss, although the absence of information on timing and intentionality means that this measure cannot diagnose cachexia [10]. Current and maximum BMI were calculated from recorded height and weight.
Systemic inflammation was indexed by the first-hour erythrocyte sedimentation rate (ESR), analysed continuously and descriptively as ≤20, 21–40 and >40 mm/h. Laboratory variables included haemoglobin (g/dL), GGT (U/L), HbA1c (%), and eGFR (mL/min/1.73 m2). Anaemia was defined as haemoglobin < 13.0 g/dL in men and <12.0 g/dL in women. Hypertension was considered present when documented in the source database. Cardiovascular disease was defined as documented heart failure, atrial fibrillation/flutter, stroke, or myocardial infarction/angina. The database also contained information on neoplasm and selected glucose-lowering therapies, including insulin and biguanides; these variables were used in sensitivity analyses. A standardised principal admission diagnosis and an acute-illness severity score were not available in a sufficiently complete form for adjustment; the cause of a first cardiology admission was recorded in only 203/1566 (13.0%) patients with T2DM. Systematic information on active infection, autoimmune disease, alcohol-related liver disease, hepatic enzyme-inducing drugs, nutritional status or a standardised frailty index was not available.
2.3. Exploratory Multimarker Score
A four-item score was examined as an exploratory summary measure. One point was assigned for each of the following: absolute weight difference > 15 kg, ESR > 40 mm/h, anaemia, and GGT > 34 U/L. The components were selected after the primary analyses to summarise complementary routinely available features associated with adverse outcomes in this cohort. The >15 kg category corresponded to the highest descriptive weight-difference group, ESR > 40 mm/h to the upper ESR category, and anaemia used sex-specific clinical thresholds. GGT > 34 U/L was the median of the full 1811-patient source cohort and was retained unchanged for the T2DM analysis; the median within T2DM was 36 U/L. The 34 U/L value is therefore a cohort-derived cut-off, not a clinical hepatology reference limit. Equal weighting was chosen for simplicity; it does not imply biological equivalence between components. Because the components and thresholds were selected and evaluated in the same dataset, the score was considered exploratory throughout.
2.4. Outcome
The endpoint was all-cause mortality status on 31 December 2022, determined from hospital records and, when required, the National Registry of Persons. Vital status at this fixed date was ascertained for all 1811 patients in the weight-history cohort. Exact dates or years of death were unavailable for most deceased participants. Survival times were therefore not imputed, and Kaplan–Meier or Cox regression was not used. The reported odds ratios describe death status at the fixed ascertainment date; they are not hazard ratios and do not represent uniform follow-up.
2.5. Statistical Analysis
Continuous variables are reported as median (interquartile range, IQR) and were compared using the Mann–Whitney U test. Categorical variables are reported as counts and percentages and were compared using Pearson’s chi-square test. The primary analytical cohort comprised patients with T2DM. Multivariable logistic regression adjusted for age, sex, admission year, eGFR, HbA1c, hypertension and cardiovascular disease. Admission year was included because potential observation time differed for patients admitted in 2016, 2017 and 2018. Patients with type 1 diabetes were analysed descriptively because only 22 deaths occurred, which was insufficient for stable multivariable modelling with the planned covariate set. In the full cohort, diabetes-type-by-weight-difference interaction terms were additionally tested.
Absolute and percentage weight-difference categories were modelled separately. ESR and BMI were examined as continuous predictors. Continuous laboratory predictors used in regression were winsorised at the 1st and 99th percentiles and standardised; corresponding odds ratios are expressed per one standard deviation. Cubic B-spline models with 4 degrees of freedom were compared with linear terms using likelihood-ratio tests to assess non-linearity; they were not used to select a cut-point. A sensitivity model in T2DM additionally included neoplasm, insulin use, biguanide use and the number of oral antidiabetic drug classes available in the source database.
Because ESR was ordered at the clinician’s discretion and its availability differed by observed clinical characteristics and outcome, we first compared patients with and without ESR measurements (Supplementary Table S1). As a sensitivity analysis, we modelled the probability of ESR availability from fully observed baseline variables (age, sex, admission year, percentage weight difference, hypertension, cardiovascular disease, neoplasm and biguanide use) and repeated the ESR model using inverse-probability-of-observation weights truncated at the 1st and 99th percentiles. Vital status was not included in the weighting model because it occurred after ESR ordering. This approach, like multiple imputation, assumes that missingness is ignorable conditional on measured predictors. We chose it because it directly models the probability that ESR was obtained. Unmeasured determinants of ESR testing remain a source of uncertainty.
To assess whether weight history added information beyond BMI, nested models were compared in the same complete-case population: a clinical model plus current BMI and the same model with absolute weight-difference categories added. Model fit was compared by likelihood-ratio testing, discrimination by AUC, and overall prediction error by Brier score. The exploratory multimarker score was assessed in the same manner. For both the clinical model and the model containing the score, 1000 bootstrap resamples were used to estimate optimism-corrected AUC and Brier score; calibration intercept and slope were also estimated for the score model. Reporting followed the STROBE recommendations for observational studies and relevant TRIPOD + AI principles for the exploratory score; a reporting map is provided in Supplementary File S1. ChatGPT (GPT-5.6 Sol; OpenAI, San Francisco, CA, USA) was used during manuscript preparation to assist with statistical code development and verification and with language editing; all code, analyses and outputs were reviewed by the authors. All tests were two-sided, with p < 0.05 considered statistically significant. Analyses were performed in Python 3.13 (Python Software Foundation, Wilmington, DE, USA) using NumPy, SciPy, statsmodels, scikit-learn and patsy.
3. Results
3.1. Cohort Characteristics
The cleaned cohort comprised 1811 patients: 1566 with T2DM, 244 with type 1 diabetes, and 1 with diabetes type missing. The primary T2DM cohort included 332 deaths (21.2%). Compared with survivors, deceased patients were older, more frequently had hypertension, cardiovascular disease, anaemia and neoplasm, and had lower haemoglobin and eGFR. Absolute and percentage weight differences were greater among deceased patients, whereas maximum BMI did not differ materially between groups (Table 1).
Table 1.
Baseline characteristics of the primary T2DM cohort according to vital status.
3.2. Weight History and Mortality
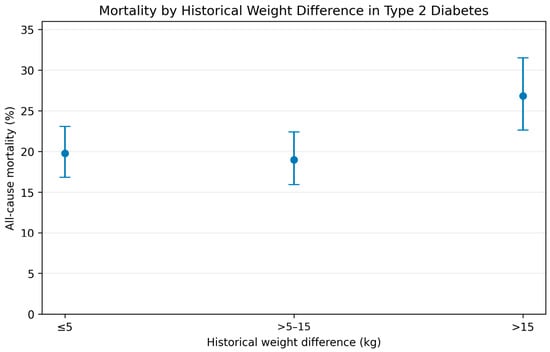
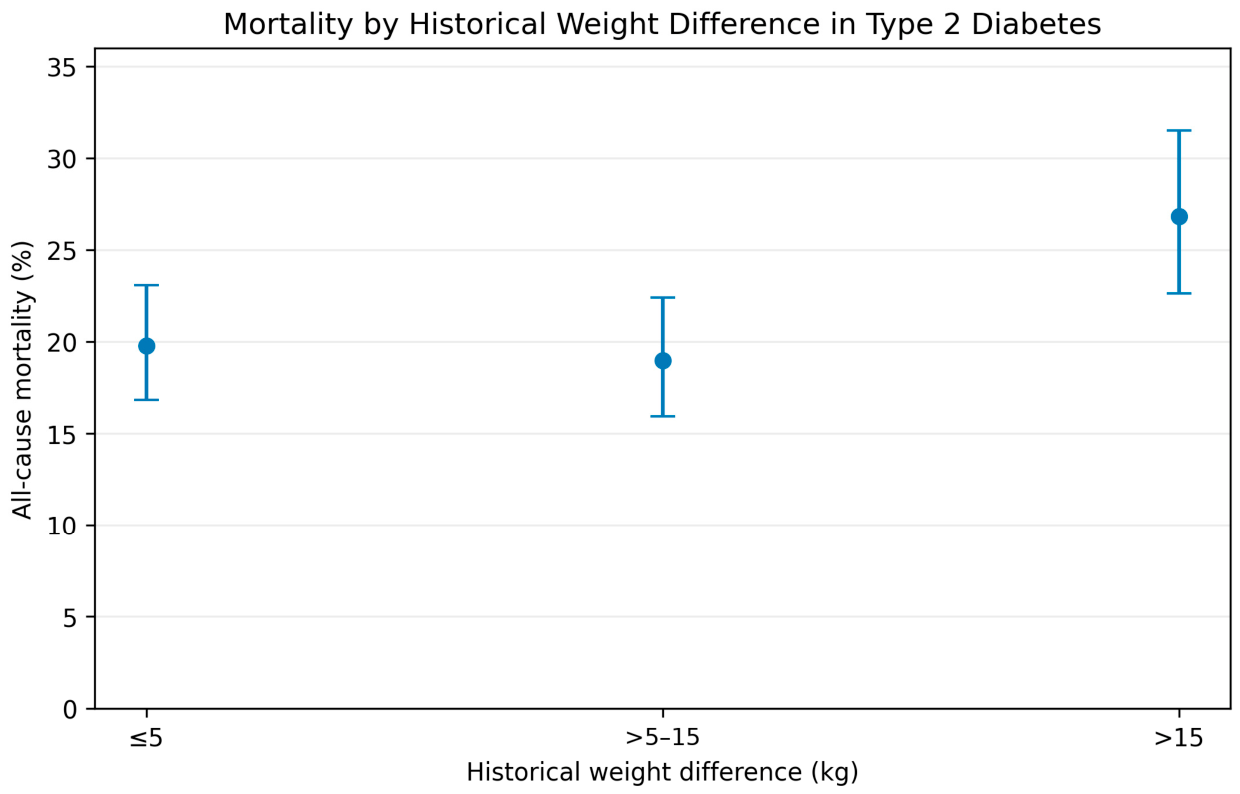
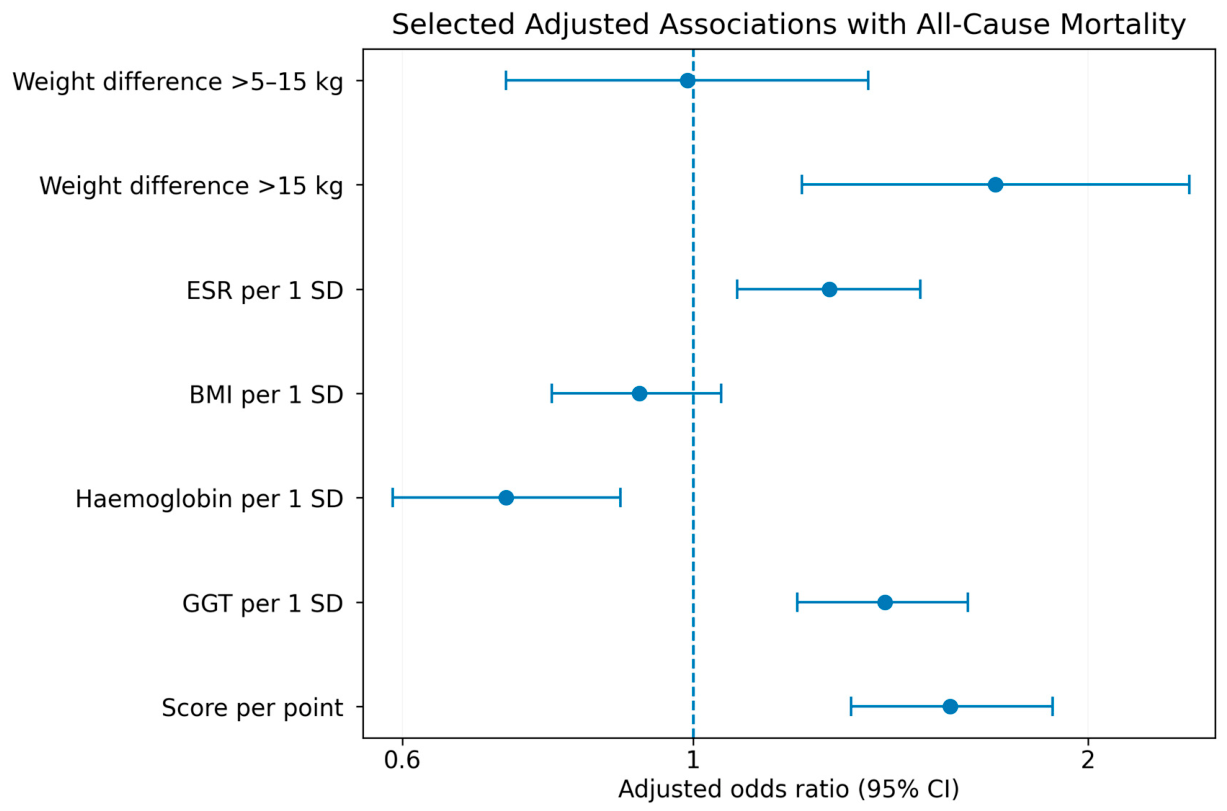
In T2DM, mortality was 19.8% among patients with an absolute weight difference ≤ 5 kg, 19.0% for >5 to ≤15 kg, and 26.8% for >15 kg (overall p = 0.008; Figure 2). After adjustment for age, sex, admission year, eGFR, HbA1c, hypertension and cardiovascular disease, a difference > 15 kg remained associated with mortality (OR 1.70, 95% CI 1.21–2.39; p = 0.002), whereas the >5–15 kg category did not (OR 0.99, 95% CI 0.72–1.36; p = 0.963).
Figure 2.
Observed all-cause mortality by absolute difference between self-reported lifetime maximum body weight and admission weight in T2DM. Points represent observed mortality and bars represent 95% Wilson confidence intervals. The categories are descriptive.
Percentage weight difference showed a similar pattern. Mortality was 20.0%, 17.3% and 24.1% in the <5%, 5–10% and >10% groups, respectively (overall p = 0.030). After adjustment, >10% was associated with mortality (OR 1.37, 95% CI 1.01–1.86; p = 0.043). Cubic B-spline models showed overall associations with absolute weight difference (p = 0.012) and percentage weight difference (p = 0.0018), with no evidence of non-linearity (p = 0.809 and p = 0.409, respectively). The >15 kg category is therefore retained as a descriptive grouping, not as a biological or spline-derived threshold.
Among the 244 patients with type 1 diabetes, only 22 deaths occurred. Mortality across the ≤5, >5–15 and >15 kg categories was 8.5%, 8.6% and 11.1%, respectively. Multivariable subgroup modelling was not pursued because of the low event count. In the full cohort, the joint interaction between diabetes type and the absolute weight-difference categories was not significant (likelihood-ratio p = 0.991). Diabetes-type-specific results are shown in Supplementary Table S4.
3.3. Systemic Inflammation, BMI, and Incremental Information from Weight History
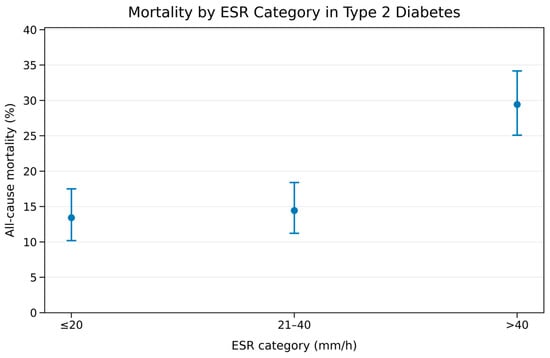
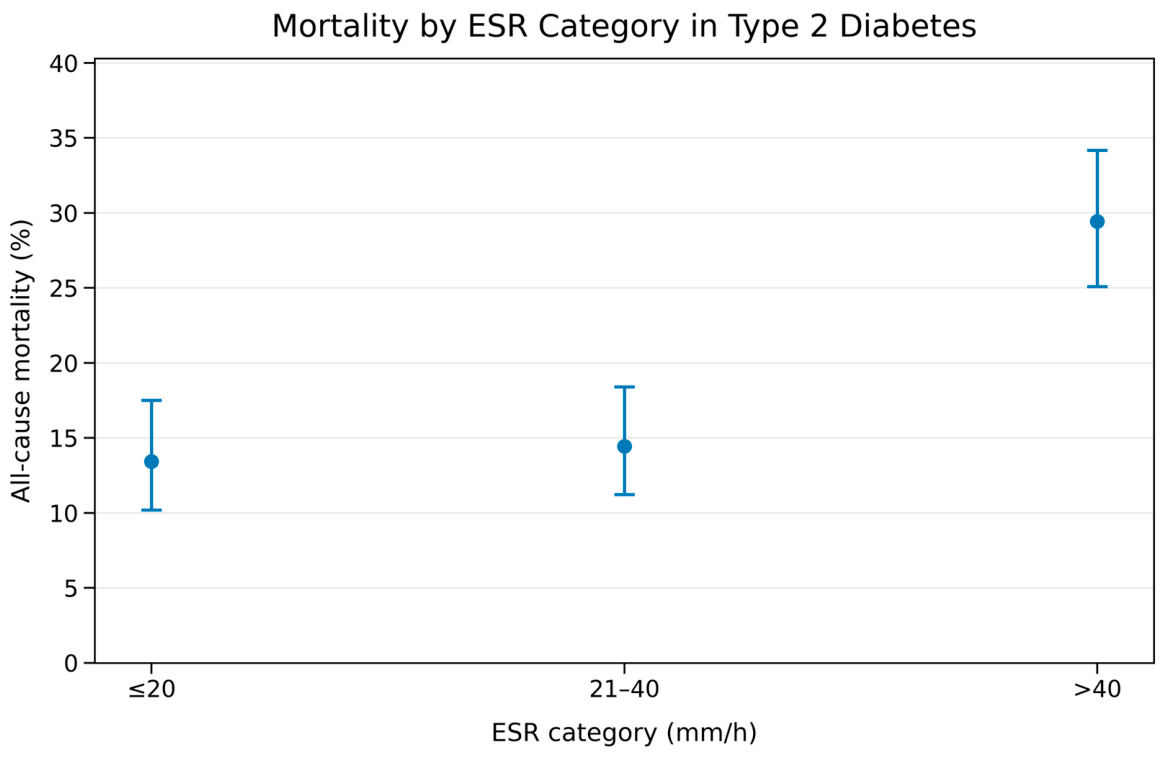
ESR was available in 1086 patients with T2DM. Mortality increased from 13.4% at ESR ≤ 20 mm/h to 14.4% at 21–40 mm/h and 29.4% above 40 mm/h (p < 0.001; Figure 3). After clinical adjustment, each SD increase in ESR was associated with higher odds of death (OR 1.27, 95% CI 1.08–1.49; p = 0.004). Current BMI was not independently associated with mortality (OR 0.91 per SD, 95% CI 0.78–1.05; p = 0.206).
Figure 3.
Observed all-cause mortality across ESR categories in T2DM. Points represent observed mortality and bars represent 95% Wilson confidence intervals.
In 1541 patients with complete data for the clinical covariates and BMI, the clinical-plus-BMI model had an AUC of 0.769 and Brier score of 0.1384. Adding absolute weight-difference categories improved model fit (likelihood-ratio p = 0.005) and reduced the Brier score slightly to 0.1371, but the increase in AUC was small (0.769 to 0.773; ΔAUC 0.004, bootstrap 95% CI −0.002 to 0.011). Thus, weight history contributed statistically detectable information but did not materially improve discrimination.
3.4. Extended and Sensitivity Models
When absolute weight-difference category, ESR, BMI, haemoglobin and GGT were entered together with the clinical covariates, 1004 complete T2DM cases were available. The association with a weight difference > 15 kg was attenuated to OR 1.36 (95% CI 0.86–2.17; p = 0.192), and the association with ESR was OR 1.07 per SD (95% CI 0.89–1.29; p = 0.463). Lower haemoglobin (OR 0.72 per SD, 95% CI 0.59–0.88; p = 0.001) and higher GGT (OR 1.40 per SD, 95% CI 1.20–1.62; p < 0.001) remained independently associated with mortality. The attenuation indicates overlapping prognostic information; the design cannot distinguish confounding, mediation or correlated manifestations of underlying illness.
A separate sensitivity model additionally adjusted for neoplasm, insulin use, biguanide use and the number of oral antidiabetic drug classes available in the database. In 1540 T2DM patients, the >15 kg category remained associated with mortality (OR 1.63, 95% CI 1.15–2.31; p = 0.006). These analyses address only measured comorbidity and treatment variables; active infection, autoimmune disease, alcohol exposure, enzyme-inducing medications and formal frailty measures were not available (Supplementary Table S3).
3.5. Performance of the Exploratory Multimarker Score
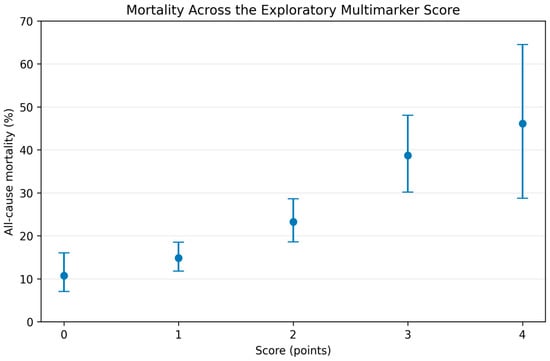
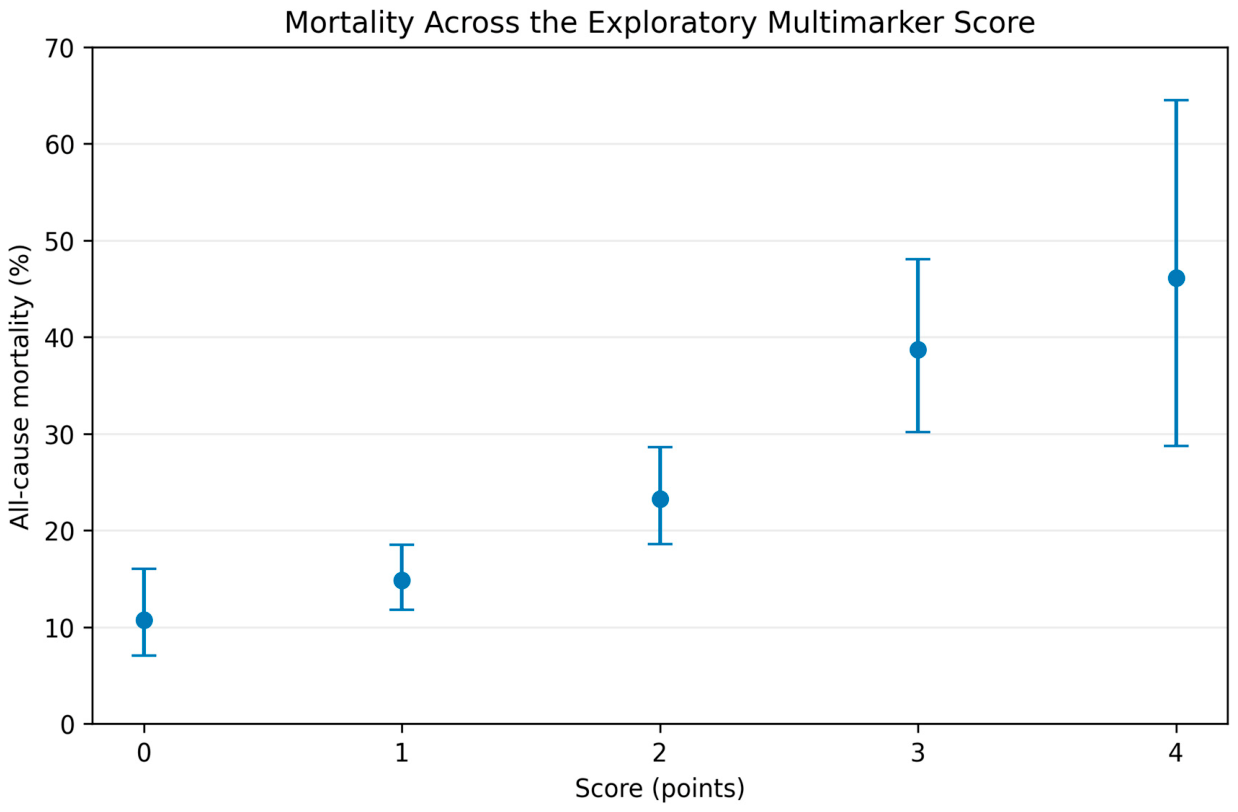
All four score components were available in 1019 patients with T2DM. Scores of 0, 1, 2, 3 and 4 were present in 186, 425, 271, 111 and 26 patients, respectively. Mortality increased from 10.8% at score 0 to 14.8%, 23.2%, 38.7% and 46.2% at scores 1–4 (p < 0.001; Figure 4). The score alone had an AUC of 0.646. In 1009 patients with complete clinical covariates, each additional score point was associated with mortality (adjusted OR 1.57, 95% CI 1.32–1.88; p < 0.001).
Figure 4.
Observed mortality across the exploratory, internally derived four-item multimarker score in T2DM. One point was assigned for weight difference > 15 kg, ESR > 40 mm/h, anaemia and GGT > 34 U/L. The >15 kg component reflects the descriptive category used in this cohort and was not derived from the spline analysis.
In the same analytical population, the clinical model had an apparent AUC of 0.770 and Brier score of 0.1314. Adding the score increased apparent AUC to 0.790 and reduced the Brier score to 0.1288. After 1000-sample bootstrap internal validation, optimism-corrected AUCs were 0.759 for the clinical model and 0.778 for the clinical-plus-score model (corrected ΔAUC 0.019); corrected Brier scores were 0.1347 and 0.1325, respectively. For the combined model, the optimism-corrected calibration intercept was −0.060 and the calibration slope 0.941. Bootstrap resampling re-estimated model coefficients but did not repeat the post hoc selection of score components or thresholds. External validation is therefore needed.
3.6. Missing ESR and Admission-Year Sensitivity Analyses
ESR was missing in 480 of 1566 T2DM patients (30.7%). Mortality was higher among patients without ESR than among those with ESR available (25.2% vs. 19.4%; p = 0.010). Patients without ESR also differed in sex distribution, diabetes duration, HbA1c, GGT, percentage weight difference, hypertension and biguanide use (Supplementary Table S1). In the inverse-probability-of-observation weighted sensitivity analysis, the association between ESR and mortality persisted (OR 1.36 per SD, 95% CI 1.20–1.53; p < 0.001), compared with OR 1.27 in the complete-case model. Truncated observation weights ranged from 1.01 to 3.50 (effective sample size 865). Because the weighted estimate was slightly larger, complete-case analysis may, if anything, have modestly underestimated the ESR association. The multimarker score remained a complete-case analysis: mortality was 19.7% among patients with all score components available and 23.9% among those with incomplete score data (p = 0.059), so selection bias cannot be excluded.
Mortality differed by admission year, consistent with unequal potential observation time: 27.3% for patients admitted in 2016, 18.9% in 2017 and 13.6% in 2018. In admission-year-specific adjusted analyses, the >15 kg category was associated with mortality in 2016 (OR 1.85, 95% CI 1.16–2.97; p = 0.010) and 2017 (OR 2.09, 95% CI 1.07–4.08; p = 0.031), but not in 2018 (OR 1.07, 95% CI 0.48–2.37; p = 0.872), when fewer deaths had accrued. A formal weight-category-by-admission-year interaction was not significant (p = 0.342). These analyses reinforce the limitation imposed by unequal observation windows and the absence of event dates (Supplementary Table S2).
Selection related to availability of the source weight measurements was also evident. Among the 132 patients with T2DM excluded because one or both source weights were unavailable, 52 (39.4%) were deceased, compared with 332/1566 (21.2%) in the primary T2DM cohort (p < 0.001). Excluded patients were older and had lower haemoglobin, among other differences (Supplementary Table S5). These findings further limit generalisability to patients in whom weight history can be reconstructed. Observed mortality across the categorical analyses is summarised in Table 2; the main adjusted estimates are reported in Table 3 and displayed in Figure 5.
Table 2.
Observed mortality in the primary T2DM cohort.
Table 3.
Key multivariable logistic regression results in T2DM.
Figure 5.
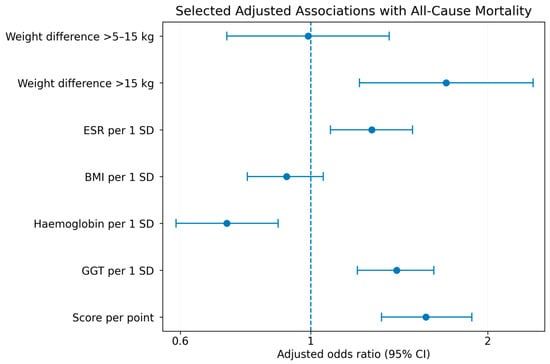
Selected adjusted associations with all-cause mortality in T2DM. Weight-difference, ESR and BMI estimates are from their respective clinically adjusted models; haemoglobin and GGT are from the extended biomarker model; the score estimate is from the clinical model plus score. The vertical dashed line indicates the null value (OR = 1).
4. Discussion
In this hospital-based cohort of patients with T2DM, a large difference between self-reported lifetime maximum weight and admission weight was associated with death status at the end of 2022, while current BMI was not independently associated with outcome. ESR also showed an adjusted association with mortality. Both associations weakened when haemoglobin and GGT were included in the same model, indicating that these routinely available measures capture partly overlapping prognostic information.
The weight-history result is broadly consistent with previous observational evidence. Ingram and Mussolino compared measured current weight with self-reported maximum weight and found higher mortality among individuals with large proportional reductions from maximum weight [11]. In T2DM, Huang et al. reported higher mortality with weight loss > 10%, while 5–10% loss was not significantly associated with mortality [7]. In our T2DM cohort, both the >15 kg absolute category and >10% proportional category were associated with mortality after adjustment. The spline analyses showed no evidence of non-linearity across the observed range.
Intentionality remains central to interpretation. Gregg et al. found that unintentional weight loss in adults with diabetes was associated with higher mortality, while attempting to lose weight was associated with lower mortality [12]. Similarly, intensive lifestyle intervention in Look AHEAD did not increase long-term mortality, and substantial intentional weight loss was associated with favourable outcomes in selected analyses [13]. Conversely, steep weight loss during postintervention follow-up occurred more often in older and frailer participants with multimorbidity and was associated with high mortality [14]. Because our exposure does not distinguish intentional from illness-related change, reverse causation remains a plausible explanation for part of the observed association.
Nested model comparison showed that weight-difference categories improved likelihood-based model fit beyond current BMI, but the change in discrimination was small: AUC increased by about 0.004 and the bootstrap confidence interval included zero. Weight history therefore appears to add prognostic information mainly at the level of association, with little improvement in discrimination. This is consistent with methodological work on the obesity paradox, which highlights the inability of a single BMI measurement to reconstruct preceding illness-related changes in weight [5,6,15].
Inflammation is also a plausible marker of adverse prognosis in T2DM. Recent work has linked IL-6, hsCRP and several blood-count-derived inflammatory indices to all-cause mortality [3,4]. ESR is less specific and is influenced by age, anaemia and other inflammatory or deficiency states [16]. In our cohort, ESR remained associated with mortality after standard clinical adjustment and in the inverse-probability weighted analysis, but the estimate weakened after haemoglobin and GGT were added. Anaemia has been associated with mortality in T2DM independently of chronic kidney disease [17], while higher GGT has been linked to all-cause and cardiovascular mortality in diabetes [18]. These markers can reflect different aspects of systemic illness: ESR may rise with infection or autoimmune disease, anaemia with renal disease, deficiency or chronic illness, and GGT with hepatic disease, alcohol exposure or medication effects. ESR was measured during hospitalisation and may also reflect acute illness; a standardised index-admission diagnosis and acute-illness severity score were not available for adjustment.
The sensitivity model that included neoplasm and available glucose-lowering therapy indicators produced a similar estimate for the >15 kg category. Important potential confounders were still unavailable, including active infection, autoimmune disease, alcohol exposure, enzyme-inducing drugs, nutritional impairment and standardised frailty. Diabetes-related muscle wasting and sarcopenia provide relevant biological context [19,20], and frailty is strongly associated with mortality in diabetes [21], but these states were not directly assessed in this cohort.
The multimarker score was exploratory. Mortality increased with the number of components, and adding the score to the clinical model produced a modest improvement in AUC. Bootstrap correction suggested limited optimism and reasonably preserved calibration. However, the score was constructed and evaluated in the same cohort, two thresholds were cohort-derived, and the components have different biological meanings. Similar inflammatory–nutritional indices have shown prognostic associations in diabetes [22,23]. Clinical utility was not evaluated with decision-curve analysis, and external validation is needed before the score can be considered for practice.
We analysed T1DM separately because only 22 deaths occurred in that subgroup, which was insufficient for stable adjustment with the same covariate set. Mortality did not show a clear gradient across weight-difference categories in T1DM, although the estimates were imprecise. Formal interaction testing did not show evidence that the association differed by diabetes type.
5. Limitations
This study has several limitations. It was retrospective and single-centre, and the population consisted of hospitalised patients, limiting generalisability to community T2DM. The 2016–2018 recruitment period also predates current treatment patterns and may limit direct applicability to contemporary T2DM care. Lifetime maximum weight was self-reported, and the time at which that maximum occurred, the rate of subsequent change and whether weight reduction was intentional were unknown. The exposure therefore reflects historical weight difference, not measured longitudinal weight loss, and cannot diagnose cachexia. Direct measures of body composition, muscle strength, appetite, dietary intake, nutritional status and frailty were unavailable.
Residual confounding remains important. Although the database allowed adjustment for cardiovascular disease, renal function, glycaemic control, neoplasm and selected glucose-lowering therapies, it did not systematically capture active infection, autoimmune/inflammatory disease, alcohol-related liver disease, vitamin B12 deficiency, use of hepatic enzyme-inducing medications, nutritional impairment or standardised frailty. ESR was measured once during hospitalisation and may reflect acute illness; a standardised principal admission diagnosis and acute-illness severity score were not available for adjustment. ESR was also missing in 30.7% of T2DM patients, and missingness was associated with clinical characteristics and outcome. Inverse-probability weighting gave a similar association but could not account for unmeasured determinants of testing. CRP, IL-6, TNF-α and metabolomic measurements were unavailable. The GGT score component used a single sex-independent threshold derived from the full source cohort, while sex-specific reference limits and relevant hepatic exposures could not be fully addressed.
Follow-up was incompletely characterised because vital status was assessed at a fixed date and exact death dates were unavailable for most deceased patients. Patients admitted earlier therefore had longer potential observation. Adjustment for admission year and year-stratified analyses partly addressed this difference but could not reproduce time-to-event analysis. The 132 T2DM patients excluded because source weight measurements were unavailable had substantially higher mortality than the primary analytical cohort, indicating selection related to reconstructable weight history. The exploratory score was derived and evaluated in the same cohort; bootstrap correction re-estimated model coefficients but did not repeat the post hoc selection of components and thresholds, so residual optimism may remain. Decision-curve analysis was not performed.
6. Conclusions
A substantial difference between remembered lifetime maximum weight and current weight may identify hospitalised patients with T2DM whose weight history warrants closer clinical assessment. This measure was associated with mortality even when current BMI was not, but the context of the weight change remains essential: intentional therapeutic loss and illness-related decline are clinically different trajectories. Prospective studies with serial measured weight, body composition, standardised frailty and nutritional assessment, specific inflammatory biomarkers and complete event timing are needed to determine whether weight history can improve clinical risk assessment.
Supplementary Materials
The following supporting information can be downloaded at: https://www.mdpi.com/article/10.3390/metabo16110891/s1, Supplementary Table S1: characteristics of T2DM patients with and without available ESR measurements and inverse-probability weighting details; Supplementary Table S2: admission-year sensitivity analyses; Supplementary Table S3: sensitivity model additionally adjusted for neoplasm and available glucose-lowering therapy variables; Supplementary Table S4: diabetes-type-specific weight-difference analyses; Supplementary Table S5: comparison of included T2DM patients with patients excluded because source weight measurements were unavailable; Supplementary File S1: STROBE and TRIPOD+AI reporting map.
Author Contributions
Conceptualisation, M.-L.I. and I.D.; methodology, M.-L.I., O.M. and I.D.; formal analysis, I.D.; investigation, M.-L.I. and D.-R.H.; data curation, M.-L.I. and D.-R.H.; writing—original draft preparation, M.-L.I. and I.D.; writing—review and editing, D.-R.H., O.M. and I.D.; visualisation, M.-L.I. and I.D.; supervision, I.D.; project administration, I.D. All authors have read and agreed to the published version of the manuscript.
Funding
This research received no external funding.
Institutional Review Board Statement
The study was conducted in accordance with the Declaration of Helsinki and approved by the Ethics Committee of Craiova County Emergency Hospital (no. 74 of 7 September 2020).
Informed Consent Statement
All patients sign a general informed consent form on admission that includes agreement to the use of anonymised medical data for scientific purposes.
Data Availability Statement
The data are not publicly available because they contain potentially identifiable clinical information. De-identified data may be made available by the corresponding author upon reasonable request and subject to institutional and ethical approval.
Acknowledgments
During the preparation of this manuscript, the authors used ChatGPT (OpenAI, GPT-5.6 Sol; accessed October 2026) to assist with statistical code development and verification and with language editing. All code, analyses and outputs were reviewed by the authors, who take full responsibility for the content of the manuscript.
Conflicts of Interest
I.D. is a Guest Editor of the Special Issue and had no role in the editorial handling or peer review of this manuscript. The authors declare no other conflicts of interest.
References
- Genitsaridi, I.; Salpea, P.; Salim, A.; Sajjadi, S.F.; Tomic, D.; James, S.; Thirunavukkarasu, S.; Issaka, A.; Chen, L.; Basit, A.; et al. 11th edition of the IDF Diabetes Atlas: Global, regional, and national diabetes prevalence estimates for 2024 and projections for 2050. Lancet Diabetes Endocrinol. 2026, 14, 149–156. [Google Scholar] [CrossRef] [Scilit] [PubMed]
- Ahmad, E.; Lim, S.; Lamptey, R.; Webb, D.R.; Davies, M.J. Type 2 diabetes. Lancet 2022, 400, 1803–1820. [Google Scholar] [CrossRef] [Scilit] [PubMed]
- Domazet, S.L.; Sharfo, A.; Olesen, T.B.; Stidsen, J.V.; Nielsen, J.S.; Thomsen, R.W.; Jessen, N.; Vestergaard, P.; Andersen, M.K.; Hansen, T.; et al. Low-grade inflammation predicts major cardiovascular events and mortality in recently diagnosed type 2 diabetes: A Danish nationwide cohort study. Eur. J. Prev. Cardiol. 2026; Epub ahead of print. [CrossRef] [Scilit] [PubMed]
- Zhang, J.; Fan, X.; Xu, Y.; Wang, K.; Xu, T.; Han, T.; Hu, C.; Li, R.; Lin, X.; Jin, L. Association between inflammatory biomarkers and mortality in individuals with type 2 diabetes: NHANES 2005–2018. Diabetes Res. Clin. Pract. 2024, 209, 111575. [Google Scholar] [CrossRef] [Scilit] [PubMed]
- Costanzo, P.; Cleland, J.G.; Pellicori, P.; Clark, A.L.; Hepburn, D.; Kilpatrick, E.S.; Perrone-Filardi, P.; Zhang, J.; Atkin, S.L. The obesity paradox in type 2 diabetes mellitus: Relationship of body mass index to prognosis: A cohort study. Ann. Intern. Med. 2015, 162, 610–618. [Google Scholar] [CrossRef] [Scilit] [PubMed]
- Lajous, M.; Bijon, A.; Fagherazzi, G.; Boutron-Ruault, M.C.; Balkau, B.; Clavel-Chapelon, F.; Hernán, M.A. Body mass index, diabetes, and mortality in French women: Explaining away a paradox. Epidemiology 2014, 25, 10–14. [Google Scholar] [PubMed]
- Huang, S.; Shi, K.; Ren, Y.; Wang, J.; Yan, W.-F.; Qian, W.-L.; Yang, Z.-G.; Li, Y. Association of magnitude of weight loss and weight variability with mortality and major cardiovascular events among individuals with type 2 diabetes mellitus: A systematic review and meta-analysis. Cardiovasc. Diabetol. 2022, 21, 78. [Google Scholar] [CrossRef] [Scilit] [PubMed]
- Nam, G.E.; Kim, W.; Han, K.; Lee, C.-W.; Kwon, Y.; Han, B.; Park, S.; Park, J.-H.; Kim, Y.-H.; Kim, D.-H.; et al. Body weight variability and the risk of cardiovascular outcomes and mortality in patients with type 2 diabetes: A nationwide cohort study. Diabetes Care 2020, 43, 2234–2241. [Google Scholar] [CrossRef] [Scilit] [PubMed]
- Mirea, O.; Ghelich Oghli, M.; Neagoe, O.; Berceanu, M.; Țieranu, E.; Moraru, L.; Raicea, V.; Donoiu, I. All-cause mortality prediction in subjects with diabetes mellitus using a machine learning model and Shapley values. Diabetology 2025, 6, 5. [Google Scholar] [CrossRef] [Scilit]
- Evans, W.J.; Morley, J.E.; Argilés, J.; Bales, C.; Baracos, V.; Guttridge, D.; Jatoi, A.; Kalantar-Zadeh, K.; Lochs, H.; Mantovani, G.; et al. Cachexia: A new definition. Clin. Nutr. 2008, 27, 793–799. [Google Scholar] [CrossRef] [Scilit] [PubMed]
- Ingram, D.D.; Mussolino, M.E. Weight loss from maximum body weight and mortality: The Third National Health and Nutrition Examination Survey Linked Mortality File. Int. J. Obes. 2010, 34, 1044–1050. [Google Scholar] [CrossRef] [Scilit] [PubMed]
- Gregg, E.W.; Gerzoff, R.B.; Thompson, T.J.; Williamson, D.F. Trying to lose weight, losing weight, and 9-year mortality in overweight U.S. adults with diabetes. Diabetes Care 2004, 27, 657–662. [Google Scholar] [CrossRef] [Scilit] [PubMed]
- Look AHEAD Research Group. Effects of intensive lifestyle intervention on all-cause mortality in older adults with type 2 diabetes and overweight/obesity: Results from the Look AHEAD Study. Diabetes Care 2022, 45, 1252–1259. [Google Scholar] [CrossRef] [Scilit] [PubMed]
- Wing, R.R.; Neiberg, R.H.; Bahnson, J.L.; Clark, J.M.; Espeland, M.A.; Hill, J.O.; Johnson, K.C.; Knowler, W.C.; Olson, K.; Steinburg, H.; et al. Weight change during the postintervention follow-up of Look AHEAD. Diabetes Care 2022, 45, 1306–1314. [Google Scholar] [CrossRef] [Scilit] [PubMed]
- Tobias, D.K.; Manson, J.E. The obesity paradox in type 2 diabetes and mortality. Am. J. Lifestyle Med. 2018, 12, 244–251. [Google Scholar] [CrossRef] [Scilit] [PubMed]
- Fest, J.; Ruiter, R.; Mooijaart, S.; Ikram, M.A.; van Eijck, C.H.J.; Stricker, B.H. Erythrocyte sedimentation rate as an independent prognostic marker for mortality: A prospective population-based cohort study. J. Intern. Med. 2019, 285, 341–348. [Google Scholar] [CrossRef] [Scilit] [PubMed]
- Zoppini, G.; Targher, G.; Chonchol, M.; Negri, C.; Stoico, V.; Pichiri, I.; Lippi, G.; Muggeo, M.; Bonora, E. Anaemia, independent of chronic kidney disease, predicts all-cause and cardiovascular mortality in type 2 diabetic patients. Atherosclerosis 2010, 210, 575–580. [Google Scholar] [CrossRef] [Scilit] [PubMed]
- Chung, G.E.; Jeong, S.; Yu, S.J.; Yoo, J.; Cho, Y.; Lee, K.; Shin, D.W.; Kim, Y.J.; Yoon, J.; Han, K.; et al. Gamma-glutamyl transferase and the risk of all-cause and disease-specific mortality in patients with diabetes: A nationwide cohort study. J. Diabetes 2024, 16, e13551. [Google Scholar] [CrossRef] [Scilit] [PubMed]
- Qiao, R.; Guo, J.; Zhang, C.; Wang, S.; Fang, J.; Geng, R.; Kang, S.-G.; Huang, K.; Tong, T. Diabetes-induced muscle wasting: Molecular mechanisms and promising therapeutic targets. Crit. Rev. Food Sci. Nutr. 2025, 65, 4007–4023. [Google Scholar] [CrossRef] [Scilit] [PubMed]
- Du, J.; Shu, X.; Lin, T.; Liao, H.; Zhang, L.; Yue, J. Sarcopenia and mortality, cardiovascular and renal outcomes in type 2 diabetes: A systematic review and meta-analysis. Endocr. Pract. 2026, 32, 1290–1302. [Google Scholar] [CrossRef] [Scilit] [PubMed]
- Miao, Z.; Zhang, Q.; Yin, J.; Li, L.; Feng, Y. Impact of frailty on mortality, hospitalization, cardiovascular events, and complications in patients with diabetes mellitus: A systematic review and meta-analysis. Diabetol. Metab. Syndr. 2024, 16, 116. [Google Scholar] [CrossRef] [Scilit] [PubMed]
- Wang, J.; Chen, L.; Huang, Z.; Lu, J.; Yang, Y.; Zhao, X.; Tu, J.; Pan, Y.; Bao, K.; Chen, W.; et al. A synergistic association between inflammation, malnutrition, and mortality in patients with diabetics. Front. Nutr. 2022, 9, 872512. [Google Scholar] [CrossRef] [Scilit] [PubMed]
- Yuan, J.; Song, W.; Cheng, Z.; Zhu, H. Temporal risk stratification using inflammation–nutrition indices in adults with diabetes. Sci. Rep. 2026, 16, 29926. [Google Scholar] [CrossRef] [Scilit] [PubMed]

Disclaimer/Publisher’s Note: The statements, opinions and data contained in all publications are solely those of the individual author(s) and contributor(s) and not of MDPI and/or the editor(s). MDPI and/or the editor(s) disclaim responsibility for any injury to people or property resulting from any ideas, methods, instructions or products referred to in the content. |
© 2026 by the authors. Licensee MDPI, Basel, Switzerland. This article is an open access article distributed under the terms and conditions of the Creative Commons Attribution (CC BY) license.