


Abstract
Background/Objectives: Hereditary hemolytic anemias (HHAs) are rare genetic disorders characterized by chronic hemolysis, systemic oxidative stress, and inflammation. Altered lipid homeostasis has previously been reported in HHAs; however, untargeted plasma lipidomic studies comparing HHA subtypes remain limited. This exploratory study aimed to characterize shared and subtype-specific plasma lipid alterations across five HHA subtypes. Methods: Forty-eight participants were enrolled, including 29 patients with HHA (6 with β-thalassemia, 5 with hereditary xerocytosis, 7 with hereditary spherocytosis, 5 with sickle cell disease, and 6 with congenital dyserythropoietic anemia) and 19 healthy controls. Plasma lipids were analyzed by untargeted liquid chromatography–quadrupole time-of-flight mass spectrometry, followed by multivariate, univariate, and lipid pathway analyses. Results: A total of 375 lipid species were putatively annotated, revealing both shared and putative subtype-specific lipid alterations across the five HHA subtypes. The putatively annotated species Cer 59:7;4O and PC 46:1 remained significantly altered after false discovery rate correction, whereas species such as PC 34:4 and Cer 42:3;2O showed only nominal subtype-specific differences. Mostly nominal alterations in individual ceramide, triglyceride, and phosphatidylcholine species were observed across most hemolytic groups relative to controls. Congenital dyserythropoietic anemia exhibited the fewest nominal differences from controls. Among the 25 species with nominal Kruskal–Wallis differences, SM 37:1;2O was the only lipid species that nominally differed from controls exclusively in this subtype. Conclusions: These exploratory, hypothesis-generating findings suggest that plasma lipidomics may help characterize lipid alterations accompanying chronic hemolysis. However, the candidate lipid species and predicted pathways require validation in larger, age-matched, independent cohorts.
1. Introduction
Hereditary hemolytic anemias (HHAs) constitute a heterogeneous group of rare inherited disorders characterized by chronic hemolysis and persistent systemic metabolic stress resulting from ongoing erythrocyte destruction [1,2,3,4,5]. These conditions are unified by premature red blood cell (RBC) destruction leading to chronic anemia but differ substantially in their underlying pathophysiology. Hemoglobinopathies such as β-thalassemia (BT) and sickle cell disease (SCD) are characterized by abnormal hemoglobin (Hb) production and chronic intravascular hemolysis, whereas membranopathies including hereditary spherocytosis (HS) and hereditary xerocytosis (HX) arise from defects in cytoskeletal or membrane transport proteins [6,7]. Congenital dyserythropoietic anemia (CDA) is characterized by ineffective erythropoiesis: despite erythroid bone marrow hyperactivity, erythrocyte output is inadequate, and elevated growth differentiation factor 15 (GDF15) promotes secondary iron overload [8]. Across HHA subtypes, elevated serum lactate dehydrogenase (LDH) and indirect bilirubin levels, together with reduced Hb and erythrocyte counts, serve as systemic biomarkers of chronic hemolytic burden, whereas high serum ferritin is related to increased intestinal iron absorption and transfusions [9].
Chronic hemolysis releases Hb and heme into the circulation, generating reactive oxygen species (ROS) and activating lipid peroxidation pathways [10,11]. This oxidative milieu drives sphingomyelinase activation, ceramide generation, and lipoprotein lipid remodeling. Elevated ceramides have been implicated as triggers of eryptosis (programmed erythrocyte death), promoting phosphatidylserine exposure on the RBC surface and accelerating erythrophagocytosis [12,13,14,15]. These lipid-driven pathways may therefore contribute to the chronic hemolysis characteristic of HHA.
While lipid alterations are implicated in HHA pathophysiology, comprehensive lipidomic profiling remains scarce. Prior investigations have been largely restricted to single HHA subtypes and have focused predominantly on erythrocyte-based matrices rather than plasma. A liquid chromatography–tandem mass spectrometry (LC-MS/MS)-based untargeted RBC membrane lipidomics study of 50 BT patients identified significant alterations in phosphatidylcholines, ceramides, and phosphatidic acids that were actively modulated by the XMN1-HBG2 polymorphism (rs7482144) and hydroxyurea therapy [16]. In a targeted plasma metabolomics study of transfusion-dependent BT, 41 altered metabolites tracked with heme metabolism, redox potential, short-chain fatty acids, and nitric oxide bioavailability [17]. In SCD, targeted analysis confirmed decreased serum sphingomyelins and ceramides, whereas untargeted erythrocyte lipidomics identified 241 lipid species, over 24% of which differed significantly from controls, driven by prominent increases in ceramides, diacylglycerols, and acylcarnitines [18,19]. At the plasma level, the largest SCD metabolomics study analyzed 596 patients, identifying acylcarnitines, urate, kynurenine, and free fatty acids as metabolic correlates of hemolysis severity, cardiorenal dysfunction, and mortality [20]. A recent nuclear magnetic resonance (NMR)-based metabolomics study of 26 patients with homozygous HbS (HbSS) identified 11 dysregulated plasma metabolites: elevated pyruvate, lactate, and succinate reflected hypoxic stress, while depleted glycine and carnitine indicated altered glycolysis and glutathione homeostasis [21]. Current HS literature includes a metabolic mouse study but completely lacks lipidomic data [22].
In this study, we investigated the untargeted plasma lipidomic profiles of patients with five HHA subtypes, including BT, SCD, HS, HX, and CDA, compared with healthy controls. To our knowledge, this is one of the first studies to encompass such a diverse spectrum of HHA etiologies, notably including patients with the ultra-rare subtypes CDA and HX.
2. Materials and Methods
2.1. Study Design and Participants
The HHA cohort (N = 29) comprised 21 pediatric (≤18 years) and 8 adult (>18 years) patients, all of whom had been followed at the Department of Pediatric Hematology, Hacettepe University, since childhood. The group consisted of transfusion-dependent BT (n = 6), non-transfusion-dependent CDA (n = 6), HS (n = 7, including one transfusion-dependent patient), non-transfusion-dependent HX (n = 5), and chronically transfused SCD (n = 5) patients. Molecular findings for all patients are summarized in Table S2. All BT patients carried biallelic HBB variants, except one patient, whose genetic testing had been performed at another center and whose report was not available. Among the CDA patients, two had CDA type I (homozygous CDAN1 variant) and two had CDA type II (homozygous SEC23B variants); in the remaining two patients, SEC23B testing (and, in one patient, PKLR testing) was negative, and the diagnosis was based on characteristic bone marrow morphology. All HX patients carried PIEZO1 variants. The SCD group comprised four patients with homozygous HbS (HbSS) and one patient with compound heterozygous HbS/β+-thalassemia. In the HS group, molecular testing was performed in three patients (one heterozygous SPTB and two heterozygous ANK1 variants); in the remaining four HS patients, the diagnosis was established using conventional RBC membrane tests, including osmotic fragility testing and eosin-5-maleimide (EMA) binding assay. Eleven patients belonged to five families: two sibling pairs with HX, a twin pair with HS, a sibling pair with CDA, and three siblings with SCD (Table S2). Five of the 29 patients (17.2%) were splenectomized. The splenectomized patients comprised two BT, two HS, and one CDA patient. Twelve patients (all BT and SCD patients and one HS patient) were transfusion-dependent. Per-patient data on iron chelation and hydroxyurea exposure at the time of sampling were not available for this analysis.
Healthy control individuals (N = 19) were asymptomatic, were non-hospitalized at the time of sampling, had normal complete blood counts, and reported no history of chronic illness. The control group comprised 10 pediatric and 9 adult participants.
2.2. Sample Collection
Following an overnight fast, venous blood was collected into EDTA tubes. In transfusion-dependent patients, blood samples were obtained immediately before transfusion on the day of transfusion. The study was designed to characterize the plasma lipidome of patients in their current, real-world clinical state, that is, under their ongoing treatment (transfusion, iron chelation, or hydroxyurea) and including prior splenectomy, rather than to separate disease effects from treatment effects. Patients were therefore not excluded on the basis of treatment or splenectomy status. Because regular transfusion is part of the standard management of the BT and SCD patients in this cohort, these patients were studied in their usual transfusion-dependent state. The potential effects of disease-modifying therapies, including hydroxyurea, iron chelation, and chronic transfusion exposure, on plasma lipid profiles could not be fully controlled because of the limited sample size.
2.3. Lipid Extraction
Lipids were extracted from 50 µL of plasma from each participant using the methyl-tert-butyl ether (MTBE) method [23]. Quality control (QC) samples were prepared by pooling 10 µL from each individual sample. Samples were extracted in a randomized order and injected in the same randomized sequence to minimize batch and run-order effects. Pooled QC samples were injected regularly throughout the analytical sequence, after every 8–10 study samples, to monitor instrument performance.
2.4. Lipidomic Analysis
Lipidomic analysis was performed by liquid chromatography–quadrupole time-of-flight mass spectrometry (LC-qTOF-MS; Agilent 6530 Accurate-Mass Q-TOF, Agilent Technologies, Santa Clara, CA, USA) in both positive and negative ionization modes as described previously [24]. Data processing—including peak deconvolution, alignment, and retention time correction—was performed using MS-DIAL (v4.92; RIKEN Center for Sustainable Resource Science, Yokohama, Japan) with default parameters. Lipids were annotated against the RIKEN MS/MS Spectral Lipid Database, and raw intensities were normalized using MS Total Useful Signal (MSTUS). From the normalized MS-DIAL alignment output, only features annotated by MS/MS spectral matching were retained, yielding the 375 lipid species used in the statistical analyses, and missing values were replaced by half of the minimum value of each lipid species. Lipid identification was based on accurate mass and MS/MS spectral matching and was not confirmed with authentic chemical standards; the annotations are therefore putative, and lipid names indicate the sum composition where individual acyl chains could not be resolved. These annotations correspond to level 2 (putatively annotated compounds) of the Metabolomics Standards Initiative. Lipid names follow the MS-DIAL output: names such as “PC 46:1|PC 11:0_35:1” give the sum composition first and then the most likely molecular species, where “_” indicates that the position of the fatty acyl chains is unknown, and “/” indicates a defined linkage (e.g., between the sphingoid base and the N-acyl chain of ceramides). No internal standards were added, and no QC-based relative standard deviation (RSD) filtering was applied; the reported values are MSTUS-normalized relative abundances rather than absolute concentrations.
2.5. Statistical Analysis
Multivariate analyses were performed using MetaboAnalyst (v6.0; Xia Lab, McGill University, Montreal, QC, Canada). Lipid class analyses were conducted using LipidOne (v2.4; University of Perugia, Perugia, Italy), while pathway analyses were performed using the open-access web-based tools BioPAN (LIPID MAPS; Babraham Institute, Cambridge, UK) and LipidOne. Univariate analyses were carried out using jamovi (version 2.7; The jamovi project, Sydney, Australia) and R (version 4.5.3; R Foundation for Statistical Computing, Vienna, Austria). Because most variables were non-normally distributed, data are presented as the median and interquartile range (IQR). The only exception is the lipid class-level data (Section 3.2 and Section 3.3). Each class value is the sum of the MSTUS-normalized abundances of all species in that class; class values were generated with LipidOne and compared with parametric tests (Student’s t-test for two groups and one-way ANOVA for six groups). For consistency with these tests, class-level data are presented as mean ± standard error of the mean (SEM); in addition, the class composition (“Amount (%)”) is calculated from group means so that the class shares add up to 100%. Because summing many species into class totals is expected to reduce skewness, parametric tests were considered acceptable at the class level, whereas all species-level data were analyzed with nonparametric tests. Group comparisons for lipid species were performed using the Mann–Whitney U test for two-group comparisons and the Kruskal–Wallis test followed by Dunn’s post hoc test for multiple-group comparisons, which were implemented using the onewaytests package in R. p-values were adjusted for multiple testing using the Benjamini–Hochberg false discovery rate (FDR) method, applied separately to each family of tests: (i) for the two-group (controls vs. HHA; Mann–Whitney U) and six-group (Kruskal–Wallis) comparisons at the lipid species level, correction was applied across all 375 annotated species (375 hypotheses per comparison); (ii) for the lipid class-level comparisons (Student’s t-test and one-way ANOVA), correction was applied across the 26 lipid classes and total lipids (27 hypotheses per comparison); and (iii) Dunn’s post hoc test was performed only for the 25 species with a nominal Kruskal–Wallis p < 0.05, and within each species, the Benjamini–Hochberg correction was applied across the 15 pairwise group comparisons. A p-value less than 0.05 after adjustment was considered statistically significant. Because the Dunn comparisons were conditional on a nominal (unadjusted) Kruskal–Wallis screen, pairwise differences were considered supported by FDR control only for species whose Kruskal–Wallis q-value was <0.05; all other differences with a raw p < 0.05 are reported as nominal and exploratory. Accordingly, throughout the manuscript, “significant” refers to an FDR-adjusted q < 0.05, whereas “nominal” (nominally significant) refers to a raw p < 0.05 that did not remain significant after FDR correction; all lipid species names denote putative annotations (MSI level 2; Section 2.4). PLS-DA models were evaluated by cross-validation (R2, Q2, and accuracy). Before multivariate analysis, data were autoscaled (mean-centered and divided by the standard deviation of each variable). The optimal number of PLS-DA components was selected by leave-one-out cross-validation (LOOCV), and R2, Q2, and classification accuracy are reported for each number of components (Figure 1D and Figure 2C,G). Model validity was additionally assessed by permutation testing (1000 random permutations of the class labels, using prediction accuracy during training as the test statistic); an empirical permutation p < 0.05 was taken to indicate that the observed separation was unlikely to have arisen by chance. Because the number of components was selected with the same LOOCV procedure that was used to estimate model performance (i.e., cross-validation was not nested), the reported Q2 and accuracy values are likely to be optimistic. Given the small sample size, the empirical permutation p-values should also be interpreted with caution; using the separation distance (B/W) as an alternative test statistic did not change these results. Because training accuracy approaches 1.0 even for permuted class labels when the number of variables greatly exceeds the number of samples, this test has limited ability to detect true separation; its results were therefore used only to support the descriptive use of PLS-DA. Because supervised methods such as PLS-DA are prone to overfitting when the number of variables greatly exceeds the number of samples, all inference in this study was based on univariate tests with FDR correction (Mann–Whitney U and Kruskal–Wallis tests at the species level, and Student’s t-test and one-way ANOVA at the class level). Because the number of variables (n = 375) greatly exceeded the number of samples (n = 48), PLS-DA was used only to visualize group structure and to rank lipid species by variable importance in projection (VIP), not for inference or feature selection; a large gap between R2 and Q2 was interpreted as a sign of potential overfitting. Associations between age and lipid levels were assessed using Spearman’s rank correlation with Benjamini–Hochberg correction. This analysis was performed for the 25 species with nominal Kruskal–Wallis differences, which include all species that were FDR-significant in the two-group or six-group comparisons (Table S4). Pathway analyses (LipidOne and BioPAN) were performed mainly at the lipid class (subclass) level. Although BioPAN can also operate at the molecular species (fatty acyl) level, such analysis requires species resolved to their fatty acyl composition, whereas many species in our dataset were annotated only at the sum-composition level (e.g., PC 46:1), which limits reliable species-level pathway inference. In addition, aggregating species into classes reduces dimensionality and analytical noise in a small cohort, in which species-level pathway testing across 375 species would greatly inflate the multiple-testing burden. Differences at the molecular species level were evaluated separately by univariate testing (Section 3.3 and Table S1), and chain-level patterns were examined by LipidOne building block analysis (Figure S4).
Figure 1.
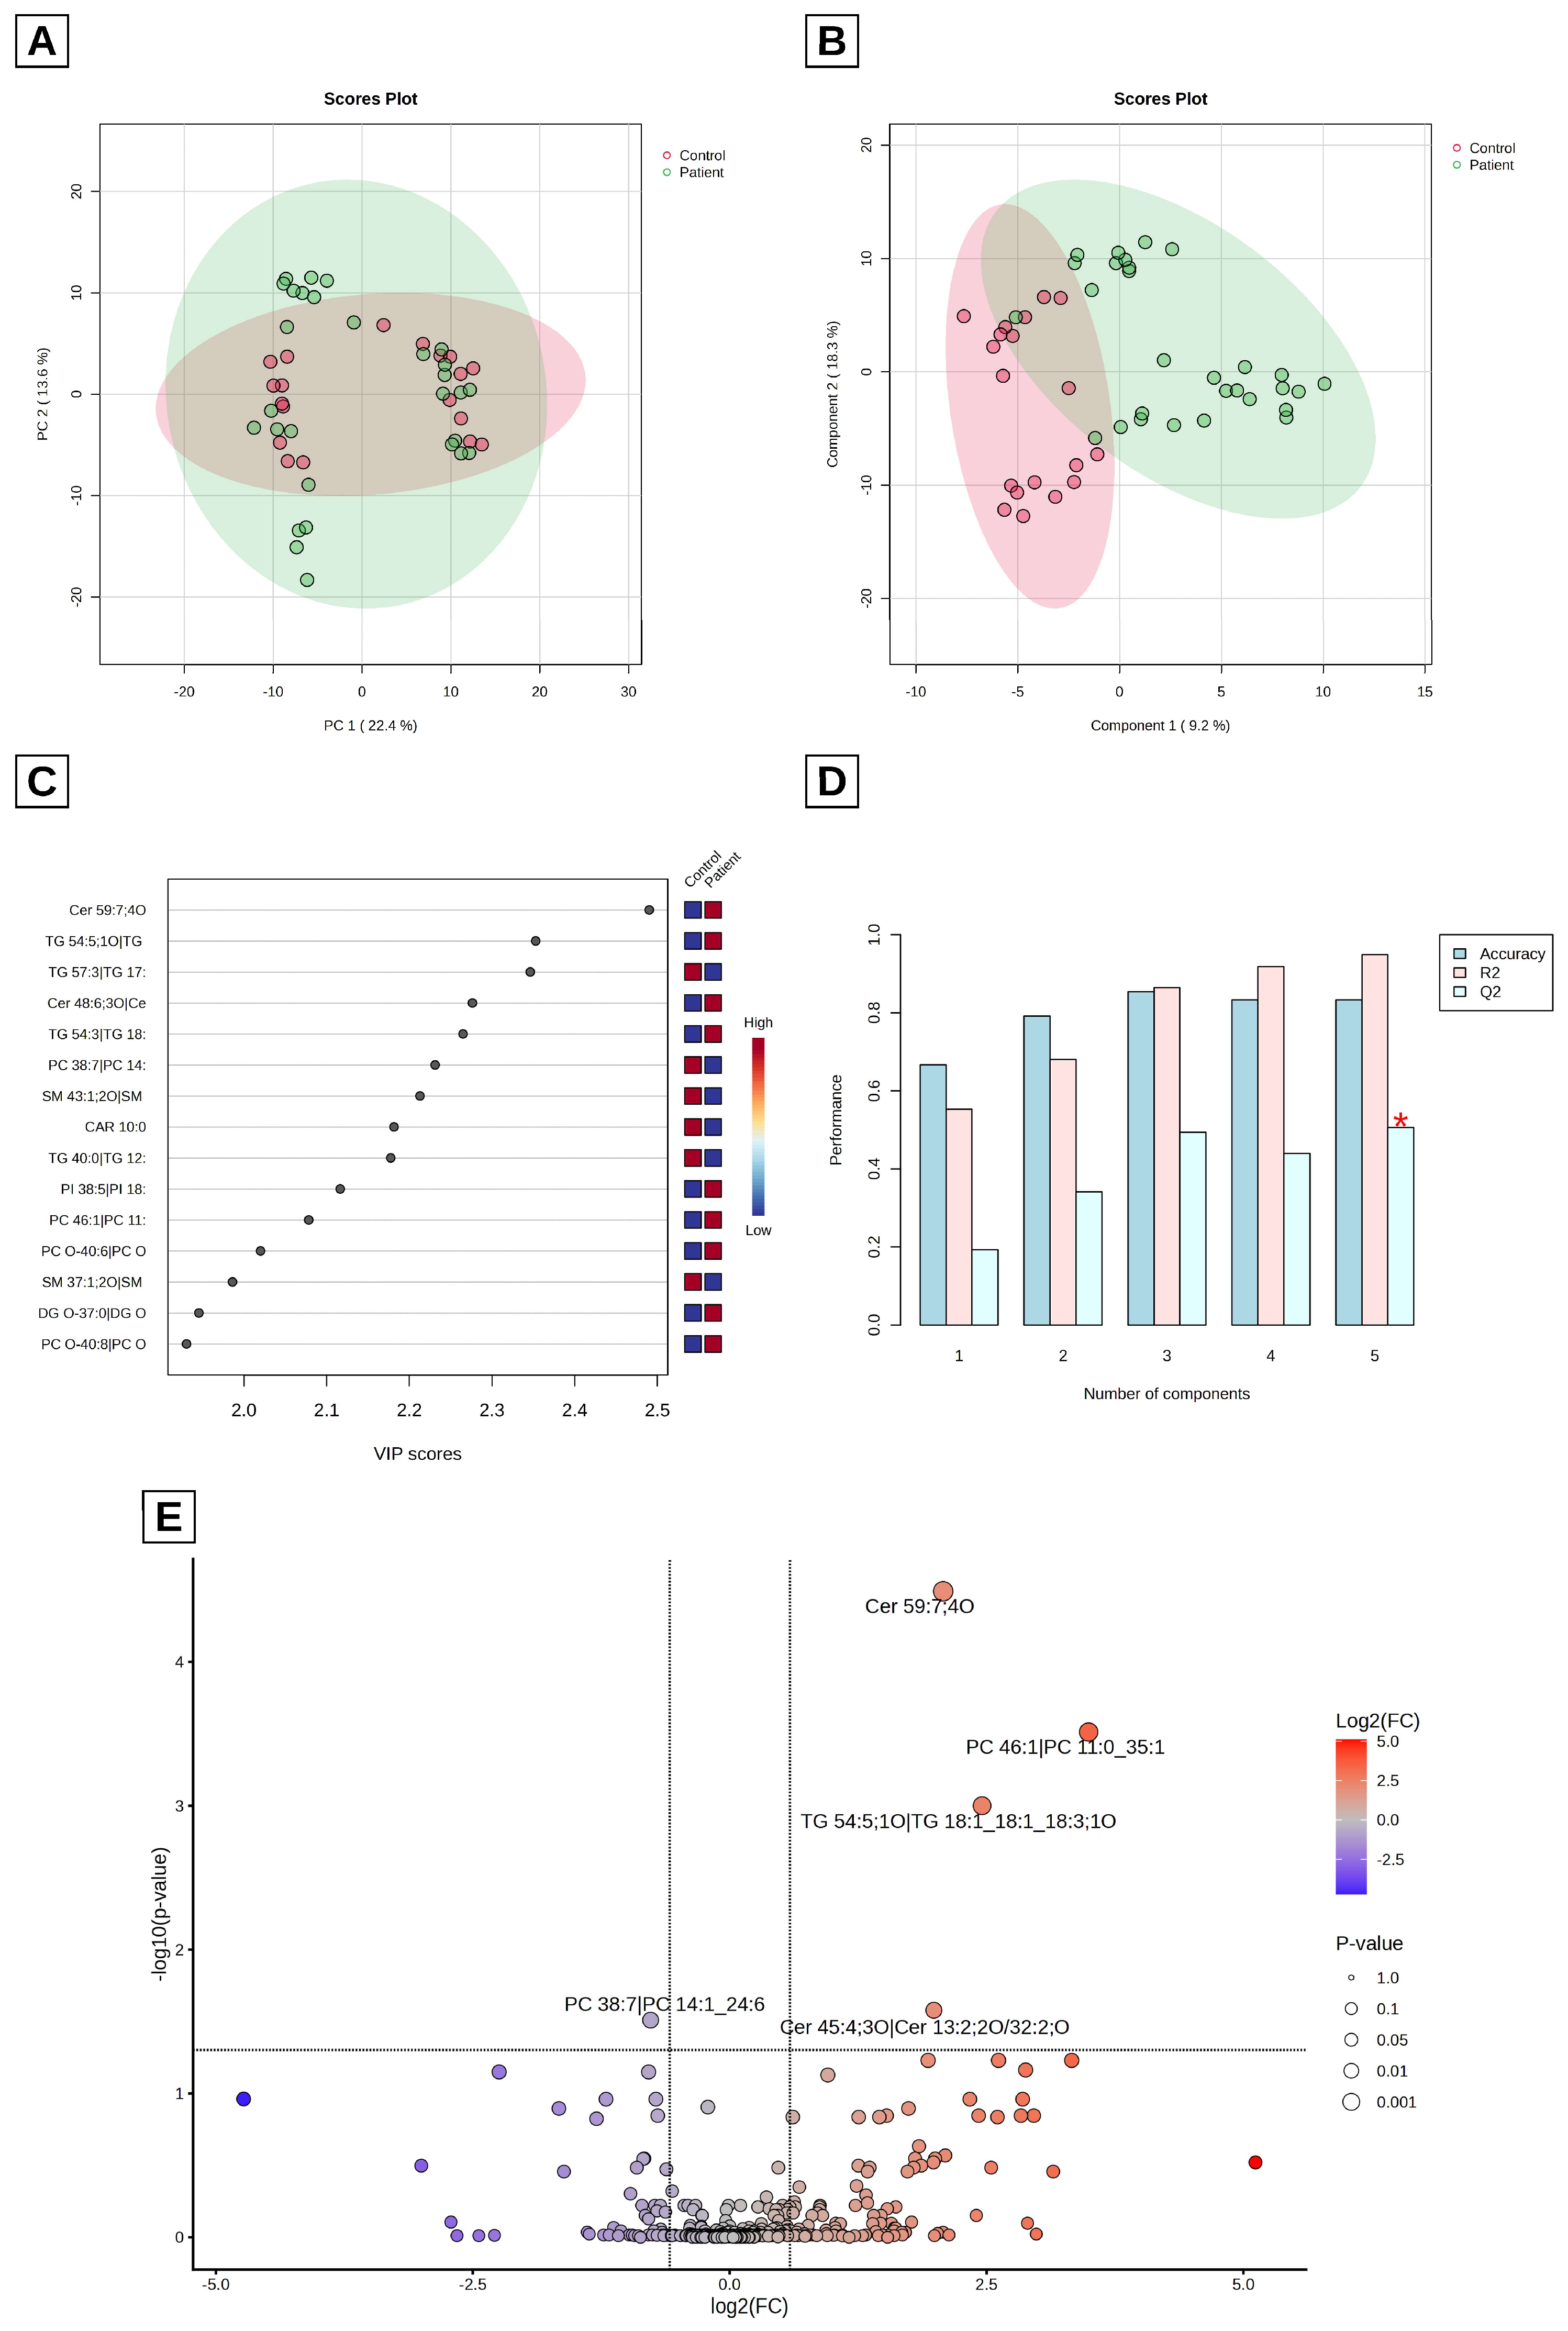
Multivariate and univariate analyses of lipid species in healthy controls and patients with hereditary hemolytic anemia (HHA). (A) Principal component analysis (PCA) score plot; (B) partial least squares–discriminant analysis (PLS-DA) score plot; (C) variable importance in projection (VIP) score plot indicating the most discriminative lipid species; (D) cross-validation results showing model performance (accuracy, R2 and Q2) and optimal component selection; (E) volcano plot comparing all HHA patients with healthy controls (fold-change threshold 1.5; FDR-adjusted q < 0.05). The red asterisk in (D) indicates the optimal number of components (highest Q2).
In BioPAN, reactions and pathways were considered significantly active or suppressed at |Z| > 1.645 (corresponding to p < 0.05, one-tailed), using the default settings of the software. BioPAN does not apply correction for multiple testing [25]; therefore, the reported Z-scores are unadjusted, and the pathway results should be interpreted as exploratory.
3. Results
3.1. Baseline Demographic and Clinical Characteristics of the Study Cohort
The general characteristics and laboratory parameters of healthy controls, the overall HHA cohort, and the HHA subtypes (BT, CDA, HS, HX, and SCD) are presented in Table 1. Age did not differ significantly between controls and the total HHA group (p = 0.052); however, given the small sample size, this reflects a lack of definitive evidence of a difference rather than comparability, and a meaningful age difference cannot be ruled out. Because controls were not individually age-matched to patients, age was evaluated as a potential confounding variable in the statistical analysis.
Table 1.
Sex, age, and laboratory parameters of healthy controls and patients with hereditary hemolytic anemia (HHA) subtypes, including β-thalassemia (BT), congenital dyserythropoietic anemia (CDA), hereditary spherocytosis (HS), hereditary xerocytosis (HX), and sickle cell disease (SCD).
3.2. Comparative Lipid Profiles Between Controls and All HHA Patients
A total of 375 lipid species across 26 classes were putatively annotated. Lipid class data are expressed as mean ± standard error of the mean (SEM) in Table 2, because class-level values were compared with parametric tests in LipidOne (Section 2.5). Total lipid levels were approximately 14% higher in HHA patients than in healthy controls (raw p = 0.046); however, this difference did not remain significant after FDR correction (q = 0.269). The classes with the highest relative abundances were ceramide (Cer), sphingomyelin (SM), diacylglycerol (DG), phosphatidylcholine (PC), triacylglycerol (TG), and N-acylethanolamine (NAE). Cholesteryl esters (CE), ether-linked diacylglycerols (DG-O), ether-linked phosphatidylcholines (PC-O), and phosphatidylinositols (PI) showed nominally higher levels in HHA patients than in controls (raw p < 0.05), although none of these differences remained significant after FDR correction (Table 2). Lipid class distribution and differential abundance between healthy controls (A) and HHA patients (B) are also presented as relative abundance (% of total lipid content) (LipidOne) in Figure S1.
Table 2.
Comparison of lipid class relative abundances (MSTUS-normalized; mean ± SEM) between healthy controls and patients with hereditary hemolytic anemia (HHA).
Principal component analysis (PCA) and partial least squares–discriminant analysis (PLS-DA) were applied to interpret the 375 lipid species (Figure 1). The PCA score plot (Figure 1A) showed all samples within 95% confidence ellipses, indicating no evident outliers. Subsequent PLS-DA (Figure 1B) showed partial separation between controls and patients, although several patients overlapped with the control cluster. Cross-validation (Figure 1D) yielded an accuracy of 0.83, an R2 of 0.95, and a Q2 of 0.51 with five components, indicating a good model fit but only moderate predictive ability; because cross-validation was not nested, these values are likely to be optimistic. Permutation testing (1000 permutations; prediction accuracy during training) yielded p = 0.962 (962/1000; Figure S6A): models fitted to randomly permuted class labels reached the same training accuracy as the observed model. Thus, the separation between controls and HHA patients was not better than expected by chance. Because training accuracy can approach 1.0 even for permuted labels when variables greatly outnumber samples, this permutation test has limited power; therefore, the PLS-DA model does not provide reliable evidence of predictive discrimination. The substantial gap between R2 and Q2 (>0.3) suggests that the model is overfitted, as expected when 375 variables are analyzed in 48 samples. The limited separation between the HHA and control groups may partly reflect the heterogeneity introduced by pooling five etiologically distinct HHA subtypes with different lipid profiles (see Section 3.3) into a single HHA group, including the CDA subgroup, which showed the fewest nominal differences from controls. The small and unevenly sized subgroups, together with heterogeneity in age and treatment exposure, may have further contributed to the observed overlap. Accordingly, PLS-DA was used to visualize group structure and to rank lipid species by VIP score (Figure 1C), rather than for inferential purposes or definitive biomarker selection. Given the limited discrimination in the PLS-DA model, univariate analyses were performed to identify lipid species differing between healthy controls and HHA patients. A total of 51 lipid species showed nominal significance (raw p < 0.05) (Table S1); however, only five remained significant after FDR correction (q < 0.05) across all 375 species. As illustrated in the volcano plot in Figure 1E, application of a fold-change threshold of 1.5 demonstrated that Cer 59:7;4O, Cer 45:4;3O, PC 46:1, and TG 54:5;1O were elevated whereas PC 38:7 was decreased in the patient samples relative to controls.
3.3. Comparative Lipid Profiles Among Healthy Controls and HHA Subtypes
Lipid class analysis was performed to evaluate differences among the six groups (controls, BT, CDA, HS, HX, and SCD). As shown in Table 3, nominally significant differences (raw p < 0.05) were observed in the CE, DG-O, and PC-O classes; after FDR correction, only the difference in CE remained significant (q = 0.004). Pairwise comparisons of these three lipid classes indicated nominally higher levels (raw p < 0.05) in the BT group than in the control group (Figure S2), and CE levels were also nominally higher in BT than in CDA.
Table 3.
Comparison of lipid class relative abundances (MSTUS-normalized; mean ± SEM) among healthy controls and hereditary hemolytic anemia (HHA) subtypes, including β-thalassemia (BT), congenital dyserythropoietic anemia (CDA), hereditary spherocytosis (HS), hereditary xerocytosis (HX), and sickle cell disease (SCD).
When the relative abundance of lipid categories and classes was evaluated across HHA subtypes, distinct distribution patterns were observed, as illustrated in the pie charts (Figure S3). In BT, SCD, HS, and HX, glycerophospholipids (GPL) represented the most abundant lipid category. In BT and SCD, glycerolipids (GL) were the second most abundant category, whereas in HS and HX, sphingolipids (SP) ranked second, as in controls. In contrast, CDA exhibited a distinct lipid distribution pattern, with SP representing the predominant category, followed by GPL and GL (Figure S3).
PCA and PLS-DA were applied to assess group separation among BT, CDA, HS, HX, SCD, and healthy controls. However, due to the limited sample size within subgroups, the PLS-DA model indicated overfitting, as reflected by a negative Q2 value.
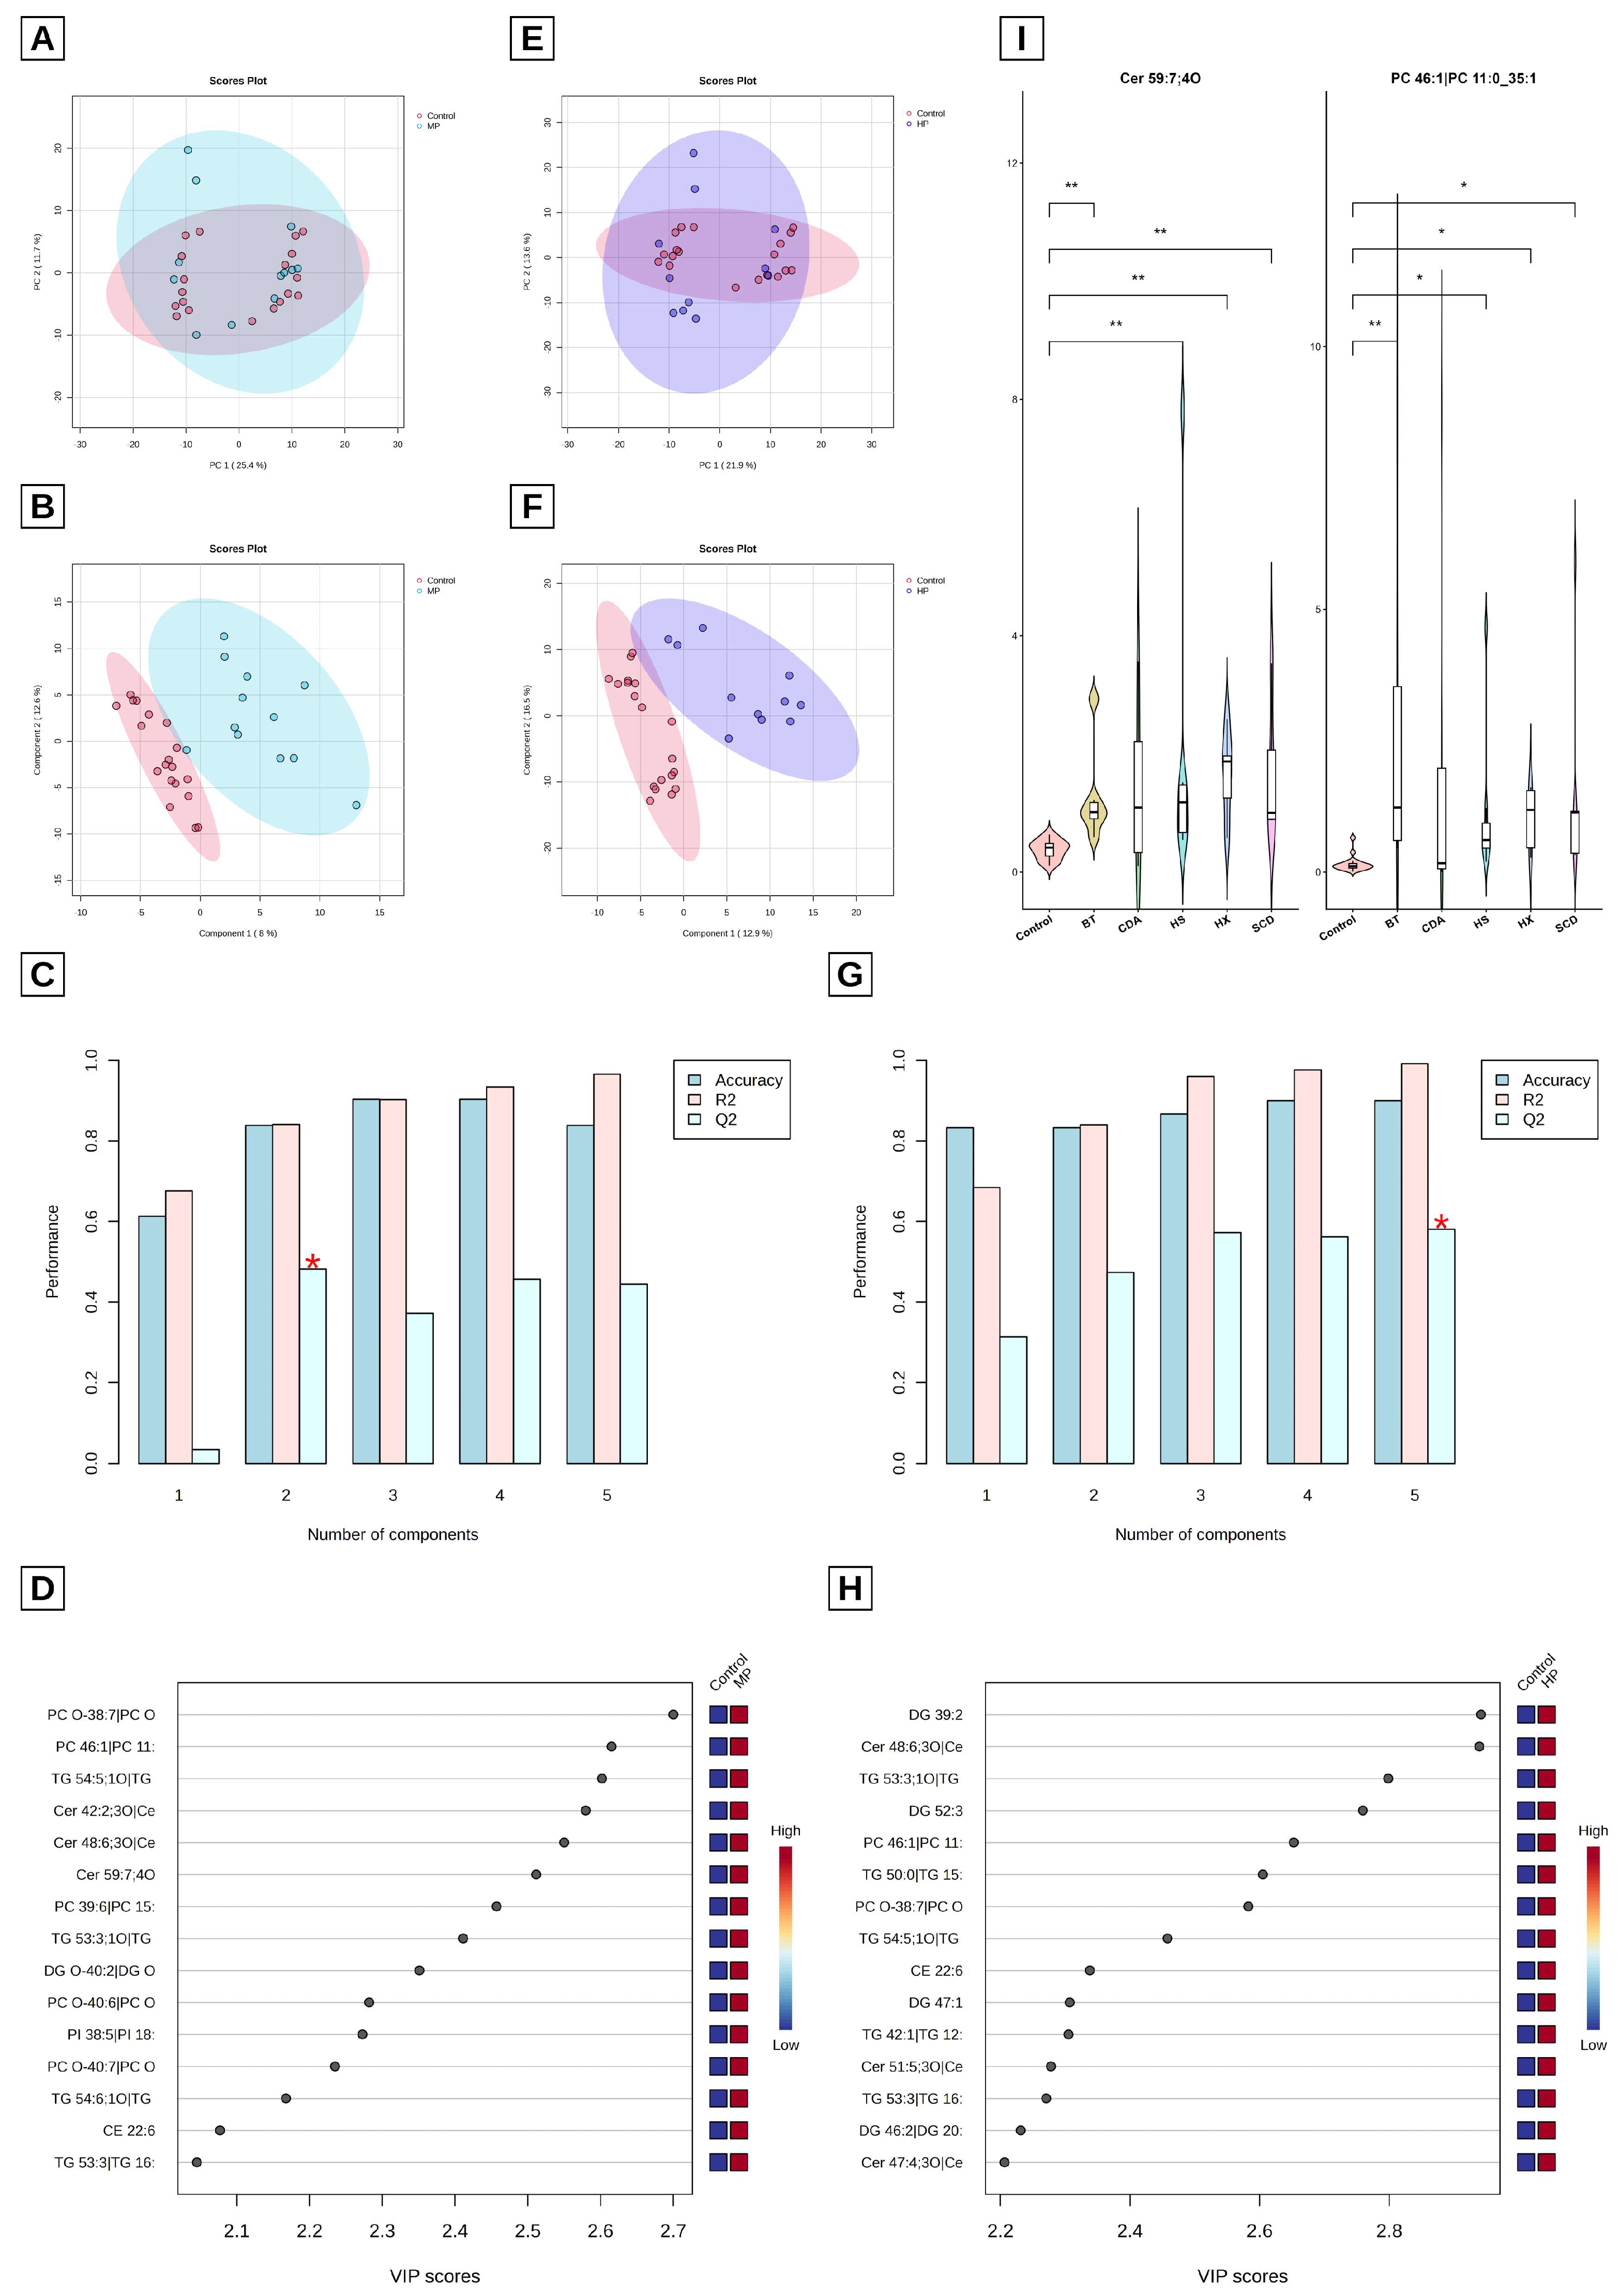
To address this limitation, patients were reclassified into broader categories based on disease type, with HS and HX grouped as membranopathies and BT and SCD as hemoglobinopathies. This regrouping was defined post hoc, after the six-group model had failed, on the basis of the shared pathophysiological mechanism (membrane defect vs. abnormal hemoglobin), and is therefore exploratory; CDA, which has a distinct dyserythropoietic mechanism, was not assigned to either group. Subsequent analyses were performed to evaluate separation between controls and these redefined groups. In the PCA score plots, no clear separation was observed; however, all samples remained within the 95% confidence ellipses, indicating no evident outliers. In contrast, PLS-DA score plots showed visual separation between controls and both membranopathy and hemoglobinopathy groups (Figure 2A–D and Figure 2E–H, respectively).
Lipid category distributions were similar across hemoglobinopathies, where GL represented the second most abundant category (Figure S3). Conversely, SP was the second most predominant category in membranopathies. Among all subtypes, CDA exhibited the most distinct lipid category distribution pattern, although it showed the fewest nominal species-level differences from controls (Table 4). These descriptive patterns suggest that lipidomic remodeling may differ among membranopathies, hemoglobinopathies, and CDA.
Table 4.
Lipid species with nominal Kruskal–Wallis differences and at least one pairwise difference (Dunn’s test, adjusted p < 0.05) among healthy controls and hereditary hemolytic anemia (HHA) subtypes, including β-thalassemia (BT), congenital dyserythropoietic anemia (CDA), hereditary spherocytosis (HS), hereditary xerocytosis (HX), and sickle cell disease (SCD).
Model performance metrics for the membranopathy group showed a Q2 of 0.48, R2 of 0.84, and accuracy of 0.84, whereas for the hemoglobinopathy group, Q2 was 0.58, R2 was 0.99, and accuracy was 0.90; however, the R2–Q2 gaps (0.36 and 0.41, respectively) again indicate potential overfitting, and these models are considered descriptive only. Permutation testing yielded p = 0.413 (413/1000) for the membranopathy model and p = 1.000 (1000/1000) for the hemoglobinopathy group (Figure S6B,C); thus, neither model separated the groups better than expected by chance. Given the limited power of this permutation test (Section 2.5), these PLS-DA models do not provide reliable evidence of predictive discrimination. Given the small number of patients in these models (n = 12 and n = 11 patients, respectively), the cross-validated accuracies of these models (0.84 and 0.90, respectively), which were not derived from nested cross-validation, are likely to be optimistic. Age differed significantly across the original groups; after reclassification into membranopathy and hemoglobinopathy groups, the difference was no longer statistically significant (Table S3). However, given the small group sizes, a residual age effect cannot be excluded. In addition, none of the 25 lipid species identified by the Kruskal–Wallis test was significantly correlated with age after FDR correction (Spearman’s rank correlation; Table S4). Because the study was primarily designed as an exploratory analysis of disease-associated lipidomic remodeling patterns, no age-adjusted biomarker modeling was performed. These 25 species include all five species that were FDR-significant in the comparison of controls with all HHA patients (Cer 59:7;4O, Cer 45:4;3O, PC 46:1, TG 54:5;1O, and PC 38:7); none of them was significantly associated with age after FDR correction.
Lipid species differing across the six groups were first identified using the Kruskal–Wallis test, with 25 lipids reaching nominal significance (raw p < 0.05). After Benjamini–Hochberg correction across all 375 species, only Cer 59:7;4O and PC 46:1 remained statistically significant (q = 0.035 for both; Table 4 and Figure 2I); TG 55:5;1O and TG 54:5;1O showed borderline q-values (0.089 for both), and the remaining 21 species had q-values > 0.20. For the 25 nominally significant species, Dunn’s post hoc test with Benjamini–Hochberg correction across the 15 pairwise comparisons identified at least one pairwise difference with an adjusted p < 0.05 for 15 species (Table 4). Except for those involving Cer 59:7;4O and PC 46:1, these pairwise (subtype-specific) differences are nominal and exploratory, because the omnibus test for the corresponding species did not survive FDR correction. Among these species, SM 37:1;2O was the only one for which CDA was the sole subtype that differed from controls (Dunn’s test), and its values in CDA were imputed at the detection limit (Kruskal–Wallis q = 0.619).
Figure 2.
Multivariate analyses and six-group univariate comparisons of plasma lipid profiles. (A–D) Multivariate analysis of control and membranopathy groups (HS and HX combined): (A) principal component analysis (PCA) score plot, (B) partial least squares–discriminant analysis (PLS-DA) score plot, (C) cross-validation results showing model performance (accuracy, R2 and Q2) and optimal component selection, and (D) variable importance in projection (VIP) score plot indicating the most discriminative lipid species. (E–H) Multivariate analysis of control and hemoglobinopathy groups (BT and SCD combined): (E) PCA score plot, (F) PLS-DA score plot, (G) cross-validation results, and (H) VIP score plot. The red asterisks in (C) and (G) indicate the optimal number of components (highest Q2). (I) Violin plots with embedded boxplots showing the distribution of the two lipid species that remained significant after FDR correction (Cer 59:7;4O and PC 46:1) across all six groups. Statistical significance was assessed using the Kruskal–Wallis test followed by Dunn’s post hoc test with Benjamini–Hochberg correction. Both species had a Kruskal–Wallis q = 0.035 (Benjamini–Hochberg correction across 375 species); pairwise differences for all other species are nominal (Table 4). Asterisks denote Dunn’s adjusted p-values: * p < 0.05, ** p < 0.01. BT, β-thalassemia; CDA, congenital dyserythropoietic anemia; HP, hemoglobinopathy; HS, hereditary spherocytosis; HX, hereditary xerocytosis; MP, membranopathy; SCD, sickle cell disease.
3.4. Pathway Analysis
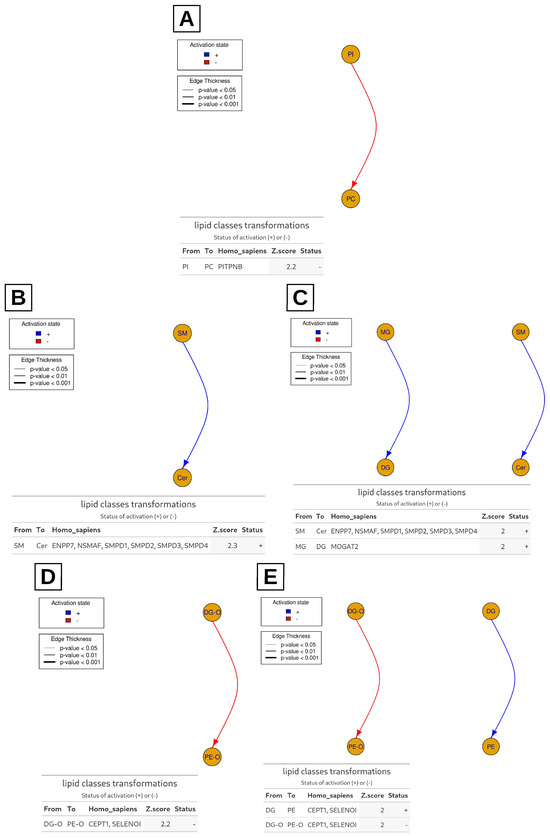
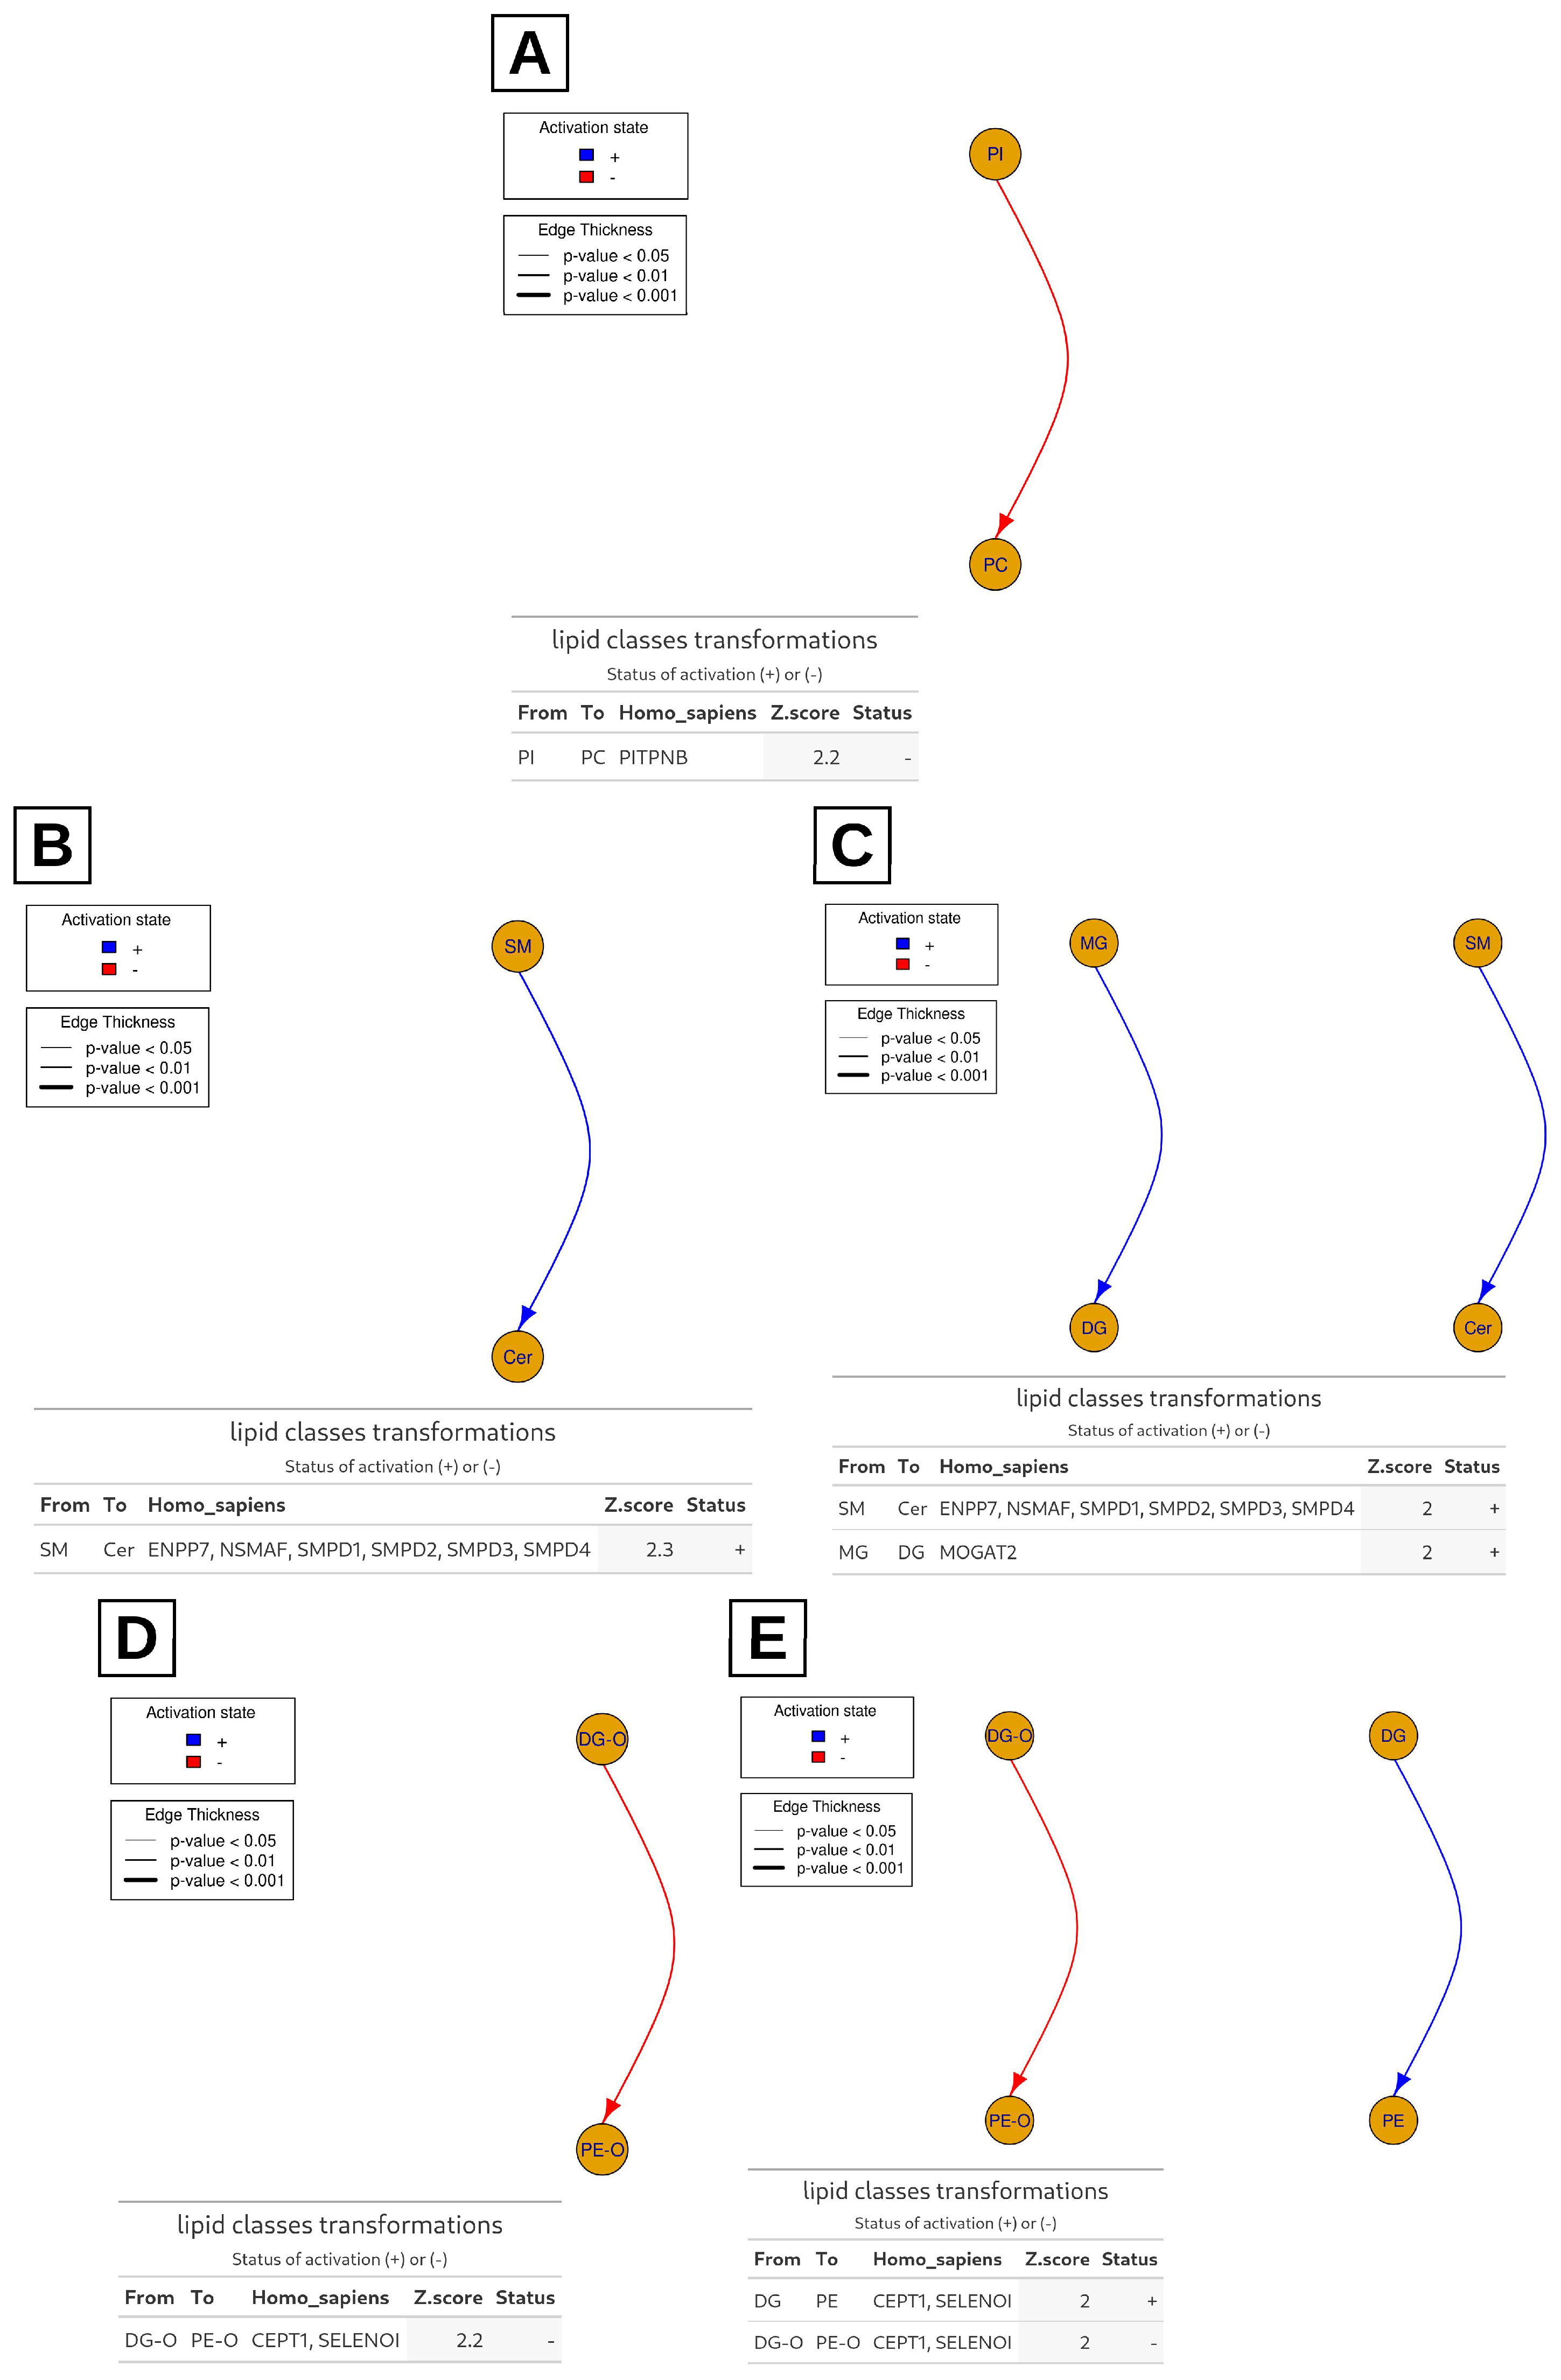
Lipid class-level pathway analysis predicted altered metabolic conversions across HHA subgroups compared to controls (Figure 3). PI-to-PC conversion was reduced in the overall HHA group. In subgroup analyses, SM-to-Cer metabolism was enhanced in both BT and SCD. While both CDA and HS exhibited down-regulated ether-linked DG-to-phosphatidylethanolamine (PE) pathways, HS uniquely demonstrated an up-regulated standard DG-to-PE conversion. These pathway results are computational predictions based on unadjusted statistics and should be regarded as hypothesis-generating. These analyses were performed at the lipid class level; species-level differences were assessed separately by univariate testing (Table 4 and Table S1).
Figure 3.
Lipid pathway analysis based on lipid class (LipidOne). Comparisons were performed between controls and (A) all HHA patients, (B) BT, (C) SCD, (D) CDA, and (E) HS. No significant transformations were detected in the comparison between controls and HX; therefore, HX is not shown. BT, β-thalassemia; CDA, congenital dyserythropoietic anemia; HHA, hereditary hemolytic anemia; HS, hereditary spherocytosis; HX, hereditary xerocytosis; SCD, sickle cell disease.
3.5. Lipid Building Block Analysis
Lipid building block analysis suggested an increase in the conversion of C24 to C22 carbon chain lipids in the overall HHA cohort compared to controls (Figure S4). This observation may reflect altered flux through β-oxidation-related pathways. In the LipidOne reaction database, this chain-shortening step is annotated to the β-oxidation enzymes acyl-CoA dehydrogenases (ACADs), enoyl-CoA hydratase short chain 1 (ECHS1), hydroxyacyl-CoA dehydrogenase trifunctional protein subunit alpha (HADHA), and hydroxyacyl-CoA dehydrogenase (HADH). These enzymes are listed only as the annotated catalysts of the predicted reactions; their activity or expression was not measured, and this prediction requires confirmation by enzymatic or flux-based studies. Because building block analysis operates at the level of constituent fatty acyl chains, it provided a complementary, chain-level view of the class-level pathway results.
4. Discussion
To our knowledge, this exploratory study is among the first to compare untargeted plasma lipidomic profiles across multiple HHA subtypes, including ultra-rare conditions such as CDA and HX. By including both hemoglobinopathies and membranopathies, our findings may offer additional insight into shared and subtype-specific lipid remodeling patterns associated with chronic hemolytic stress. An important methodological consideration is that the biological matrix profiled was plasma, a routine sample in clinical chemistry, whose lipids are thought to represent the net output of hepatic lipid metabolism, peripheral lipolysis, lipoprotein remodeling, and lipid release from hemolyzed erythrocytes and their microvesicles into the circulation [26,27].
HX affects fewer than 1 in 50,000 individuals worldwide, while CDA encompasses several ultra-rare subtypes with estimated prevalences below 1 in 1,000,000 in Europe [5,28]. Prior plasma and erythrocyte lipidomic investigations in HHAs have predominantly focused on SCD or BT in isolation, and comparative cross-subtype data remain limited [29,30,31].
Because of the small subgroup sizes, the findings of this study differ considerably in the strength of their statistical support. As summarized in Table S5, only a few results were robust to FDR correction: five species in the comparison of all HHA patients with controls, Cer 59:7;4O and PC 46:1 in the six-group comparison, and the CE class in the six-group class-level comparison. All subtype-specific species-level differences, most class-level differences, and all pathway-level results were nominal or computational predictions and should be considered hypothesis-generating.
Compared with controls, Cer 59:7;4O and PC 46:1 were significantly altered in all HHA subtypes except CDA (Dunn’s test, adjusted p < 0.05; Figure 2I), which may point to a distinct plasma lipidomic profile of CDA relative to the other groups. Similarly, among lipids with a Kruskal–Wallis q < 0.1, TG 55:5;1O was highest in CDA, intermediate in HS, and lower in BT, HX, and SCD, whereas TG 54:5;1O was elevated in BT, HX, and SCD but remained comparable to control levels in CDA and HS (Table 4). Although these TG species did not reach FDR significance, their subtype-specific distributions raise the possibility that lipid remodeling reflects disease-specific metabolic adaptations rather than hemolytic severity alone. The similar distributions of these TG species in CDA and HS could be consistent with partly overlapping metabolic remodeling, in line with their known clinical resemblance [32].
In addition, several ceramides (including Cer 59:7;4O, Cer 45:4;3O, Cer 48:6;3O, and Cer 51:5;3O) tended to be higher in HHA subtypes than in controls. Ceramides are involved in the regulation of apoptosis, oxidative stress, inflammation, and membrane microdomain architecture [33,34], and their plasma concentrations reflect the balance between hepatic de novo synthesis, sphingomyelinase-driven sphingomyelin hydrolysis, and metabolic clearance [33,35]. The observed elevations may therefore arise from hepatic sphingolipid metabolism, lipoprotein remodeling, erythrocyte microvesicle release, or direct release of membrane lipids from lysed erythrocytes. These possibilities cannot be distinguished in the present study because erythrocytes were not profiled in parallel. Chronic hemolysis is associated with a hypercatabolic state via stress erythropoiesis, in which rapid membrane turnover may contribute to systemic lipid remodeling [36]. Mechanistically, hemolysis-released free heme has been shown to activate acid and neutral sphingomyelinases, accelerating sphingomyelin-to-ceramide hydrolysis [12,14]. Iron overload may further amplify this process by generating ROS, which can promote ceramide synthesis and impair its clearance. This mechanism may also partly explain why hemoglobinopathies showed more nominal species-level differences from controls than membranopathies (Table 4). Hemoglobinopathies were associated with higher ferritin levels than membranopathies (median, 1051 vs. 164 ng/mL), although this difference was not significant after multiple-testing correction (Table S3), potentially reflecting greater transfusion requirements. Higher iron burden could promote ROS production and lipid peroxidation, potentially contributing to the distinct ceramide, triglyceride, and phosphatidylcholine profiles in these patients, and raising the possibility that iron status influences the plasma lipidome beyond hemolysis alone. However, this interpretation remains speculative, because hemoglobinopathy patients also differed from membranopathy patients in transfusion exposure and possibly in iron chelation, factors that could not be disentangled in this cohort. By contrast, splenectomy was equally represented in the two groups (two patients each). Moreover, ferritin was also high in CDA (median 814 ng/mL), which showed the fewest nominal differences from controls, which argues against iron burden as the sole explanation.
Whether the altered plasma lipid signatures represent a systemic metabolic response or arise partly from the release of erythrocyte membrane lipids during hemolysis cannot be determined from the present study. Some of our observations nevertheless argue against a purely membrane-derived origin. First, cholesteryl esters (the only lipid class that remained significant after FDR correction in the six-group comparison; Table 3) and triacylglycerols (TG 54:5;1O was among the five FDR-significant species; Table S1) are primarily associated with plasma lipoproteins rather than being major constituents of erythrocyte membranes. In contrast, SM and PE, both abundant in erythrocyte membranes, did not differ significantly between patients and controls (Table 2 and Table 3). Second, despite markedly higher LDH and bilirubin levels than controls (Table S3), patients with CDA showed the fewest nominal differences from controls (Table 4). This discordance may suggest that the observed lipid alterations do not simply reflect the degree of hemolysis, although part of the hemolysis in CDA is intramedullary (ineffective erythropoiesis) and may influence plasma lipids differently. However, these findings provide only indirect evidence and do not exclude a contribution from erythrocyte membrane-derived lipids. Distinguishing systemic metabolic changes from membrane-derived contributions will require parallel lipidomic profiling of plasma, intact erythrocytes, and erythrocyte-derived microvesicles, together with analyses correlating lipid levels with hemolysis markers. Such investigations will also help establish the clinical relevance of these lipid signatures across HHA subtypes. A paired plasma–erythrocyte lipidomic analysis is planned as a follow-up study.
Individual ceramide species showed nominally different patterns across HHA subtypes. Cer 42:3;2O showed nominally lower levels in HX than in controls and CDA (Table 4); however, this species did not survive FDR correction (Kruskal–Wallis q = 0.577), and its values in HX were imputed at the detection limit, so this observation is exploratory. If confirmed, it might indicate selective, species-specific sphingolipid remodeling rather than uniform regulation of the ceramide pool. In PIEZO1-mutant HX erythrocytes, aberrant calcium flux might modulate sphingomyelinase activity differently from the heme-driven activation proposed in hemoglobinopathies [37,38,39].
Subgroup analyses showed nominally higher PC O-38:7 levels in BT and HS (Kruskal–Wallis q = 0.217), which may suggest subtype-specific PC remodeling under hemolytic stress. A recent metabolomic study in BT reported upregulation of lysophosphatidylcholines (LPCs) and polyunsaturated fatty acid (PUFA)-containing PCs via the phospholipase A2/LPC–arachidonic acid pathway [40]. In addition, PC 34:4 was nominally higher in the SCD subgroup (Kruskal–Wallis q = 0.567), which would be consistent with the reported role of PC remodeling in vascular adhesion pathology in SCD [41,42].
Pathway analysis by BioPAN (Figure S5) predicted diacylglycerol O-acyltransferase 2 (DGAT2)-mediated diacylglycerol-to-triglyceride biosynthesis as the most active predicted reaction (Z-score = 2.242). Together with the TG profiles, this may suggest that enhanced TG synthesis contributes to altered neutral lipid turnover in HHA; whether TG clearance is also impaired could not be determined because lipoprotein kinetics were not assessed, and this interpretation should be considered hypothesis-generating. Furthermore, LipidOne analysis suggested enriched C24-to-C22 chain shortening across the HHA cohort (Figure S4), which may point to altered fatty acid oxidation under hemolytic stress. This observation is in keeping with reports linking ECHS1 deficiency to fatty acid oxidation defects and HADH dysregulation to adaptive metabolic reprogramming [43,44].
In addition, BioPAN and LipidOne analyses suggested remodeling of PC metabolism across the overall HHA cohort (Figure 3A and Figure S5). Predicted upregulation of choline phosphotransferase 1 (CHPT1)-mediated DG-to-PC conversion would be consistent with activation of Kennedy pathway PC synthesis. However, phosphatidylethanolamine N-methyltransferase (PEMT)-mediated PE methylation and phosphatidylinositol transfer protein beta (PITPNB)-dependent PI-to-PC remodeling were predicted to be suppressed (Z-scores = −1.878 and −2.2, respectively). This pattern may reflect a metabolic shift favoring the Kennedy pathway for rapid PC production under hemolytic stress, with relative downregulation of alternative PE- and PI-derived biosynthetic routes. The Kennedy pathway provides a direct, energetically efficient route for PC generation, while PEMT methylation serves as an alternative homeostatic mechanism [45,46], and PI pools primarily govern membrane signaling and downstream phospholipid remodeling [47]. BioPAN analysis also predicted altered LPC-to-PC-to-DG-to-TG conversion activity (Z-score = 2.666) (Figure S5), potentially linked to lysophosphatidylcholine acyltransferase 1/2/3 (LPCAT1/2/3)-mediated phospholipid reacylation. As core components of Lands’ cycle, LPCATs contribute to membrane remodeling by reacylating LPC into PC. Impaired Lands’ cycle homeostasis—characterized by LPC accumulation and elevated phospholipase A2 (PLA2) activity—has been described in SCD under hemolytic and hypoxic conditions [48]. Accordingly, the predicted increase in LPC-to-PC conversion in our cohort may reflect a compensatory, but potentially insufficient, response to chronic membrane injury associated with ongoing hemolysis. However, these pathway-level findings are computational predictions based on lipid abundance data and require validation through enzymatic or flux-based studies. Although pathway analyses were conducted at the lipid class level to reduce dimensionality and noise in this small cohort, this approach limits the resolution of species-specific effects. Exploratory subgroup pathway analyses via LipidOne (unadjusted Z-scores) suggested subtype-specific remodeling patterns, with altered sphingolipid metabolism in BT and SCD and disrupted ether and non-ether phospholipid remodeling in CDA and HS, which may be consistent with impaired plasmalogen homeostasis under chronic oxidative stress (Figure 3). Previous studies in SCD have similarly reported substantial disturbances in sphingolipid metabolism associated with oxidative stress, inflammation, hemolysis, and vaso-occlusive complications [49,50,51,52]. In addition to their structural roles, sphingolipids function as bioactive signaling molecules involved in the regulation of cellular stress responses and inflammation [53].
This study has several limitations. The relatively small subgroup sample sizes limited statistical power, so inter-subgroup comparisons should be regarded as exploratory, and only a few lipid species remained significant after multiple-testing correction. Consequently, all subtype-specific species-level differences reported here are nominal and should be regarded as hypotheses rather than established subtype signatures (Table S5). Because the number of lipid variables greatly exceeded the number of samples, the PLS-DA models showed signs of overfitting (large R2–Q2 gaps) and were used for visualization only. None of the PLS-DA models was supported by permutation testing; moreover, because cross-validation was not nested, the reported Q2 and accuracy values are likely to be optimistic, and permutation testing based on training accuracy has limited power when variables greatly outnumber samples. The PLS-DA results therefore do not provide reliable evidence of predictive discrimination, and the multivariate findings should be regarded as exploratory. Enrolling substantially larger cohorts is difficult for ultra-rare disorders such as HX and CDA, and the findings should be confirmed in larger, age-matched cohorts. In addition, the potential effects of disease-modifying therapies, including hydroxyurea, iron chelation, and chronic transfusion, could not be fully controlled. Furthermore, no age-adjusted modeling was performed, and because age distributions differed across subgroups and controls were not individually age-matched, residual confounding by age cannot be excluded. This is particularly relevant because plasma lipid profiles change with age and pubertal development. Because the study was designed to profile patients in their current clinical state, the observed lipid profiles reflect the combined effects of the disease and its management. Transfusion dependence (n = 12) was largely confined to the hemoglobinopathy subtypes, the number of splenectomized patients (n = 5) was too small to evaluate the effect of splenectomy separately, and data on iron chelation and hydroxyurea exposure were not available; therefore, part of the differences attributed to disease subtype may reflect treatment exposure rather than intrinsic disease biology. This applies in particular to the CE class, the only lipid class that remained significant after FDR correction, whose difference was driven mainly by the BT subgroup, in which all patients were transfusion-dependent and two were splenectomized. In four of the seven HS patients and in two CDA patients, the diagnosis was based on phenotypic criteria (RBC membrane tests or bone marrow morphology) without molecular confirmation, so the inclusion of atypical or overlapping hereditary hemolytic disorders in these subgroups cannot be ruled out. Furthermore, 11 of the 29 patients belonged to five distinct families; thus, observations within the HX, HS, CDA, and SCD subgroups were not fully independent due to shared familial background. A sensitivity analysis retaining only one member per family was not feasible, because it would have reduced the HX and SCD subgroups to three patients each; the independence assumption of the statistical tests was therefore not fully met, and subgroup findings, particularly in HX and SCD, should be interpreted with caution. In addition, the sex distribution was unbalanced across subgroups (e.g., one male and six female patients in the HS group), and sex effects on plasma lipids cannot be excluded.
Importantly, patients were compared only with healthy controls. Although, based on previous studies, the observed lipidomic shifts may be related to hemolysis, erythrocyte membrane turnover, and iron-induced oxidative stress, the observational design does not allow causal or mechanistic conclusions. Moreover, some of these alterations may reflect nonspecific effects of chronic disease or inflammation that could also occur in patients with non-hemolytic chronic conditions. Erythrocyte lipids were not analyzed in parallel, and the pathway findings are based on computational predictions. Moreover, lipid annotations were based on MS/MS spectral matching and were not confirmed with authentic chemical standard. No targeted or absolute quantification of the significantly altered species was performed; all annotations should therefore be regarded as putative (MSI level 2), particularly for species with atypical acyl-chain compositions. In addition, because no internal standards were used and no QC-based RSD filtering was applied, the values are relative abundances, and analytical variability was not formally filtered. Pathway analyses were restricted mainly to the lipid class level and may mask species-specific effects. Moreover, no independent validation cohort was available; therefore, none of the candidate lipid species or predicted pathways can yet be regarded as disease-specific biomarkers or established mechanisms. Given these limitations, the present findings should be regarded as exploratory and hypothesis-generating rather than confirmatory, and they are not sufficient to establish clinical utility. Nevertheless, this cohort provides a valuable window into rare HHA phenotypes.
5. Conclusions
Using an untargeted plasma lipidomics approach, we observed both shared and putative subtype-specific lipid alterations across five distinct HHA etiologies. The putatively annotated species Cer 59:7;4O and PC 46:1, which were altered in all subtypes except CDA, remained significant after FDR correction, and a small panel of species, such as PC 34:4 and Cer 42:3;2O, showed nominal subtype-specific differences that warrant validation. Alterations in individual ceramide, triglyceride, and phosphatidylcholine species were observed in the broader hemolytic cohort relative to controls, whereas CDA showed the fewest nominal differences from controls, and among the 25 species with nominal Kruskal–Wallis differences, SM 37:1;2O was the only one that nominally differed from controls exclusively in CDA.
Overall, these hypothesis-generating findings suggest that plasma lipidomics may help characterize lipid alterations accompanying chronic hemolysis, but they do not establish clinical utility. The pathway findings are computational predictions, and none of the lipid species identified here should be considered a disease-specific biomarker until confirmed in an independent cohort. Larger, age-matched multicenter longitudinal studies integrating paired plasma and RBC lipidomics, together with targeted, standard-based quantitative validation, are warranted to confirm these molecular signatures and to clarify their potential across HHA subtypes.
Supplementary Materials
The following supporting information can be downloaded at: https://www.mdpi.com/article/10.3390/metabo16110817/s1, Figure S1: Lipid class distribution in healthy controls and HHA patients; Figure S2: Pairwise comparisons of lipid classes across study groups; Figure S3: Lipid category and class distribution across HHA subtypes; Figure S4: Lipid building block analysis (LipidOne); Figure S5: BioPAN lipid network analysis; Figure S6: Permutation tests of the PLS-DA models; Table S1: Lipid species with nominal significance between healthy controls and HHA patients; Table S2: Molecular characterization of patients; Table S3: Demographic and clinical characteristics across the reclassified diagnostic groups; Table S4: Correlation between age and the lipid species identified by Kruskal–Wallis analysis; Table S5: Summary of the main findings according to the strength of statistical evidence.
Author Contributions
Conceptualization, Y.O.; formal analysis, N.A.D.; investigation, N.A.D.; lipidomic investigation, N.A.D., T.R., E.N.; patient selection, C.C. and S.U.; writing—original draft preparation, N.A.D.; writing—review and editing, Y.O. and S.U.; funding acquisition, Y.O. All authors have read and agreed to the published version of the manuscript.
Funding
This research was funded by the Hacettepe University Scientific Research Projects Coordination Unit, grant number THD-2024-20908.
Institutional Review Board Statement
The study was conducted in accordance with the Declaration of Helsinki and approved by the Health Sciences Research Ethics Committee of Hacettepe University (protocol code GO 23/463 and date of approval 6 June 2023).
Informed Consent Statement
Written informed consent was obtained from all participants or their legal guardians involved in the study.
Data Availability Statement
The data presented in this study are available on request from the corresponding author. The data are not publicly available due to patient privacy and ethical restrictions.
Acknowledgments
During the preparation of this manuscript, the authors used Gemini 3.6 (Google LLC, Mountain View, CA, USA) for the purposes of language editing to improve readability. The authors have reviewed and edited the output and take full responsibility for the content of this publication.
Conflicts of Interest
The authors declare no conflicts of interest. The funders had no role in the design of the study; in the collection, analyses, or interpretation of data; in the writing of the manuscript; or in the decision to publish the results.
Abbreviations
The following abbreviations are used in this manuscript:
| ACAD | acyl-CoA dehydrogenase |
| BT | β-thalassemia |
| CDA | congenital dyserythropoietic anemia |
| CE | cholesteryl ester |
| Cer | ceramide |
| CHPT1 | choline phosphotransferase 1 |
| DG | diacylglycerol |
| DG-O | ether-linked diacylglycerol |
| DGAT2 | diacylglycerol O-acyltransferase 2 |
| ECHS1 | enoyl-CoA hydratase short chain 1 |
| FDR | false discovery rate |
| GDF15 | growth differentiation factor 15 |
| GL | glycerolipids |
| GPL | glycerophospholipids |
| HADH | hydroxyacyl-CoA dehydrogenase |
| HADHA | hydroxyacyl-CoA dehydrogenase trifunctional protein subunit alpha |
| Hb | hemoglobin |
| HbSS | homozygous hemoglobin S |
| HHA | hereditary hemolytic anemia |
| HS | hereditary spherocytosis |
| HX | hereditary xerocytosis |
| IQR | interquartile range |
| LC-MS/MS | liquid chromatography–tandem mass spectrometry |
| LC-qTOF-MS | liquid chromatography–quadrupole time-of-flight mass spectrometry |
| LDH | lactate dehydrogenase |
| LPC | lysophosphatidylcholine |
| LPCAT | lysophosphatidylcholine acyltransferase |
| MSTUS | MS total useful signal |
| MTBE | methyl-tert-butyl ether |
| NAE | N-acylethanolamine |
| NMR | nuclear magnetic resonance |
| PC | phosphatidylcholine |
| PC-O | ether-linked phosphatidylcholine |
| PCA | principal component analysis |
| PE | phosphatidylethanolamine |
| PEMT | phosphatidylethanolamine N-methyltransferase |
| PI | phosphatidylinositol |
| PITPNB | phosphatidylinositol transfer protein beta |
| PLA2 | phospholipase A2 |
| PLS-DA | partial least squares–discriminant analysis |
| PUFA | polyunsaturated fatty acid |
| QC | quality control |
| RBC | red blood cell |
| ROS | reactive oxygen species |
| SCD | sickle cell disease |
| SEM | standard error of the mean |
| SM | sphingomyelin |
| SP | sphingolipids |
| TG | triacylglycerol |
| VIP | variable importance in projection |
References
- Taher, A.T.; Musallam, K.M.; Cappellini, M.D. β-Thalassemias. N. Engl. J. Med. 2021, 384, 727–743. [Google Scholar] [CrossRef] [Scilit] [PubMed]
- Kavanagh, P.L.; Fasipe, T.A.; Wun, T. Sickle Cell Disease: A Review. JAMA 2022, 328, 57–68. [Google Scholar] [CrossRef] [Scilit] [PubMed]
- Perrotta, S.; Gallagher, P.G.; Mohandas, N. Hereditary spherocytosis. Lancet 2008, 372, 1411–1426. [Google Scholar] [CrossRef] [Scilit] [PubMed]
- Iolascon, A.; Andolfo, I.; Russo, R. Congenital dyserythropoietic anemias. Blood 2020, 136, 1274–1283. [Google Scholar] [CrossRef] [Scilit] [PubMed]
- Andolfo, I.; Russo, R.; Gambale, A.; Iolascon, A. New insights on hereditary erythrocyte membrane defects. Haematologica 2016, 101, 1284–1294. [Google Scholar] [CrossRef] [Scilit] [PubMed]
- Risinger, M.; Kalfa, T.A. Red cell membrane disorders: Structure meets function. Blood 2020, 136, 1250–1261. [Google Scholar] [CrossRef] [Scilit] [PubMed]
- Agarwal, A.M.; Rets, A.V. Molecular diagnosis of hereditary hemolytic anemias: Recent updates. Int. J. Lab. Hematol. 2023, 45, 79–86. [Google Scholar] [CrossRef] [Scilit] [PubMed]
- Heimpel, H.; Schwarz, K.; Ebnöther, M.; Goede, J.S.; Heydrich, D.; Kamp, T.; Plaumann, L.; Rath, B.; Roessler, J.; Schildknecht, O.; et al. Congenital dyserythropoietic anemia type I (CDA I): Molecular genetics, clinical appearance, and prognosis based on long-term observation. Blood 2006, 107, 334–340. [Google Scholar] [CrossRef] [Scilit] [PubMed]
- Barcellini, W.; Fattizzo, B. Clinical Applications of Hemolytic Markers in the Differential Diagnosis and Management of Hemolytic Anemia. Dis. Markers 2015, 2015, 635670. [Google Scholar] [CrossRef] [Scilit] [PubMed]
- Fibach, E.; Rachmilewitz, E. The role of oxidative stress in hemolytic anemia. Curr. Mol. Med. 2008, 8, 609–619. [Google Scholar] [CrossRef] [Scilit] [PubMed]
- Orrico, F.; Laurance, S.; Lopez, A.C.; Lefevre, S.D.; Thomson, L.; Möller, M.N.; Ostuni, M.A. Oxidative Stress in Healthy and Pathological Red Blood Cells. Biomolecules 2023, 13, 1262. [Google Scholar] [CrossRef] [Scilit] [PubMed]
- Lang, K.S.; Myssina, S.; Brand, V.; Sandu, C.; Lang, P.A.; Berchtold, S.; Huber, S.M.; Lang, F.; Wieder, T. Involvement of ceramide in hyperosmotic shock-induced death of erythrocytes. Cell Death Differ. 2004, 11, 231–243. [Google Scholar] [CrossRef] [Scilit] [PubMed]
- Föller, M.; Huber, S.M.; Lang, F. Erythrocyte programmed cell death. IUBMB Life 2008, 60, 661–668. [Google Scholar] [CrossRef] [Scilit] [PubMed]
- Lang, E.; Lang, F. Triggers, inhibitors, mechanisms, and significance of eryptosis: The suicidal erythrocyte death. BioMed Res. Int. 2015, 2015, 513518. [Google Scholar] [CrossRef] [Scilit] [PubMed]
- Kuypers, F.A.; Lewis, R.A.; Hua, M.; Schott, M.A.; Discher, D.; Ernst, J.D.; Lubin, B.H. Detection of altered membrane phospholipid asymmetry in subpopulations of human red blood cells using fluorescently labeled annexin V. Blood 1996, 87, 1179–1187. [Google Scholar] [CrossRef] [Scilit]
- Khan, M.B.N.; Iftikhar, F.; Ali, M.; Danish, A.; Shamsi, T.; Musharraf, S.G.; Siddiqui, A.J. XMN polymorphism along with HU administration renders alterations to RBC membrane lipidome in β-thalassemia patients. Chem. Phys. Lipids 2022, 244, 105195. [Google Scholar] [CrossRef] [Scilit] [PubMed]
- Theocharaki, K.; Anastasiadi, A.T.; Delicou, S.; Tzounakas, V.L.; Barla, I.; Rouvela, S.; Kazolia, E.; Tzafa, G.; Mpekoulis, G.; Gousdovas, T.; et al. Cellular and biochemical heterogeneity contributes to the phenotypic diversity of transfusion-dependent β-thalassemia. Blood Adv. 2025, 9, 2091–2107. [Google Scholar] [CrossRef] [Scilit] [PubMed]
- Aslan, M.; Kıraç, E.; Kaya, S.; Özcan, F.; Salim, O.; Küpesiz, O.A. Decreased Serum Levels of Sphingomyelins and Ceramides in Sickle Cell Disease Patients. Lipids 2018, 53, 313–322. [Google Scholar] [CrossRef] [Scilit] [PubMed]
- Alabed, H.B.R.; Gorello, P.; Pellegrino, R.M.; Lancioni, H.; La Starza, R.; Taddei, A.A.; Urbanelli, L.; Buratta, S.; Fernandez, A.G.L.; Matteucci, C.; et al. Comparison between Sickle Cell Disease Patients and Healthy Donors: Untargeted Lipidomic Study of Erythrocytes. Int. J. Mol. Sci. 2023, 24, 2529. [Google Scholar] [CrossRef] [Scilit] [PubMed]
- D’Alessandro, A.; Nouraie, S.M.; Zhang, Y.; Cendali, F.; Gamboni, F.; Reisz, J.A.; Zhang, X.; Bartsch, K.W.; Galbraith, M.D.; Espinosa, J.M.; et al. Metabolic signatures of cardiorenal dysfunction in plasma from sickle cell patients as a function of therapeutic transfusion and hydroxyurea treatment. Haematologica 2023, 108, 3418–3432. [Google Scholar] [CrossRef] [Scilit] [PubMed]
- Pradhan, L.; Sahoo, C.K.; Varghese, B.; Purohit, P.; Patro, M.K.; Behera, S.K.; Mukherjee, S.P. Exploring Dysregulated Plasma Metabolites in Sickle-Cell Disease Patients Using Comparative NMR-Based Metabolomics. Magn. Reson. Chem. 2026, 64, 5–11. [Google Scholar] [CrossRef] [Scilit] [PubMed]
- Matte, A.; Wilson, A.B.; Gevi, F.; Federti, E.; Recchiuti, A.; Ferri, G.; Brunati, A.M.; Pagano, M.A.; Russo, R.; Leboeuf, C.; et al. Mitapivat reprograms the RBC metabolome and improves anemia in a mouse model of hereditary spherocytosis. JCI Insight 2023, 8, e172656. [Google Scholar] [CrossRef] [Scilit] [PubMed]
- Matyash, V.; Liebisch, G.; Kurzchalia, T.V.; Shevchenko, A.; Schwudke, D. Lipid extraction by methyl-tert-butyl ether for high-throughput lipidomics. J. Lipid Res. 2008, 49, 1137–1146. [Google Scholar] [CrossRef] [Scilit] [PubMed]
- Muratoğlu, B.; Özdemir, C.; Eylem, C.C.; Reçber, T.; Nemutlu, E.; Alpdündar-Bulut, E.; Vargel, İ.; Uçkan-Çetinkaya, D. Detailed characterization of bone marrow adipose tissue mesenchymal stem cells in healthy donor, Fanconi anemia, and acute myeloid leukemia. Bone 2025, 193, 117413. [Google Scholar] [CrossRef] [Scilit] [PubMed]
- Gaud, C.; Sousa, B.C.; Nguyen, A.; Fedorova, M.; Ni, Z.; O’Donnell, V.B.; Wakelam, M.J.O.; Andrews, S.; Lopez-Clavijo, A.F. BioPAN: A web-based tool to explore mammalian lipidome metabolic pathways on LIPID MAPS. F1000Research 2021, 10, 4. [Google Scholar] [CrossRef] [Scilit] [PubMed]
- Quehenberger, O.; Armando, A.M.; Brown, A.H.; Milne, S.B.; Myers, D.S.; Merrill, A.H., Jr.; Bandyopadhyay, S.; Jones, K.N.; Kelly, S.; Shaner, R.L.; et al. Lipidomics reveals a remarkable diversity of lipids in human plasma. J. Lipid Res. 2010, 51, 3299–3305. [Google Scholar] [CrossRef] [Scilit] [PubMed]
- Yalcinkaya, A.; Unal, S.; Oztas, Y. Altered HDL particle in sickle cell disease: Decreased cholesterol content is associated with hemolysis, whereas decreased Apolipoprotein A1 is linked to inflammation. Lipids Health Dis. 2019, 18, 225. [Google Scholar] [CrossRef] [Scilit] [PubMed]
- Iolascon, A.; Esposito, M.R.; Russo, R. Clinical aspects and pathogenesis of congenital dyserythropoietic anemias: From morphology to molecular approach. Haematologica 2012, 97, 1786–1794. [Google Scholar] [CrossRef] [Scilit] [PubMed]
- Botta, A.; Forest, A.; Daneault, C.; Pantopoulos, K.; Tantiworawit, A.; Phrommintikul, A.; Chattipakorn, S.; Chattipakorn, N.; Des Rosiers, C.; Sweeney, G. Identification of Circulating Endocan-1 and Ether Phospholipids as Biomarkers for Complications in Thalassemia Patients. Metabolites 2021, 11, 70. [Google Scholar] [CrossRef] [Scilit] [PubMed]
- Zhang, Y.; Berka, V.; Song, A.; Sun, K.; Wang, W.; Zhang, W.; Ning, C.; Li, C.; Zhang, Q.; Bogdanov, M.; et al. Elevated sphingosine-1-phosphate promotes sickling and sickle cell disease progression. J. Clin. Investig. 2014, 124, 2750–2761. [Google Scholar] [CrossRef] [Scilit] [PubMed]
- Darghouth, D.; Koehl, B.; Madalinski, G.; Heilier, J.-F.; Bovee, P.; Xu, Y.; Olivier, M.-F.; Bartolucci, P.; Benkerrou, M.; Pissard, S.; et al. Pathophysiology of sickle cell disease is mirrored by the red blood cell metabolome. Blood 2011, 117, e57–e66. [Google Scholar] [CrossRef] [Scilit] [PubMed]
- Sanyal, K.; Jai Kumar, K.; Kotru, M.; Aggarwal, M.; Dewan, P. Congenital dyserythropoietic anemia masquerading as hereditary spherocytosis. Pediatr. Hematol. Oncol. J. 2024, 9, 173–175. [Google Scholar] [CrossRef] [Scilit]
- Hannun, Y.A.; Merrill, A.H., Jr.; Luberto, C. The bioactive sphingolipid playbook. A primer for the uninitiated as well as sphingolipidologists. J. Lipid Res. 2025, 66, 100813. [Google Scholar] [CrossRef] [Scilit] [PubMed]
- Slotte, J.P. Biological functions of sphingomyelins. Prog. Lipid Res. 2013, 52, 424–437. [Google Scholar] [CrossRef] [Scilit] [PubMed]
- Meikle, P.J.; Summers, S.A. Sphingolipids and phospholipids in insulin resistance and related metabolic disorders. Nat. Rev. Endocrinol. 2017, 13, 79–91. [Google Scholar] [CrossRef] [Scilit] [PubMed]
- Țichil, I.; Mitre, I.; Zdrenghea, M.T.; Bojan, A.S.; Tomuleasa, C.I.; Cenariu, D. A Review of Key Regulators of Steady-State and Ineffective Erythropoiesis. J. Clin. Med. 2024, 13, 2585. [Google Scholar] [CrossRef] [Scilit] [PubMed]
- de Wilde, J.R.A.; Ruiter, T.J.J.; van Dooijeweert, B.; Eijkelenboom-Bos, J.; van Oirschot, B.A.; Doeven, T.; van Straaten, S.; Wind-Rotolo, M.; van Solinge, W.W.; Glenthøj, A.; et al. Red blood cell properties in hereditary xerocytosis and their response to ex vivo pyruvate kinase activation: A preliminary study. Blood Red Cells Iron 2025, 1, 100024. [Google Scholar] [CrossRef] [Scilit]
- Rosato, B.E.; D’Onofrio, V.; Marra, R.; Nostroso, A.; Esposito, F.M.; Iscaro, A.; Lasorsa, V.A.; Capasso, M.; Iolascon, A.; Russo, R.; et al. RAS signaling pathway is essential in regulating PIEZO1-mediated hepatic iron overload in dehydrated hereditary stomatocytosis. Am. J. Hematol. 2025, 100, 52–65. [Google Scholar] [CrossRef] [Scilit] [PubMed]
- Andolfo, I.; Iolascon, A.; Russo, R. The evolving landscape of hereditary stomatocytosis. Blood 2025, 145, 3089–3100. [Google Scholar] [CrossRef] [Scilit] [PubMed]
- Makis, A.; Hatzimichael, E.; Palianopoulos, T.; Papagiannaki, D.; Kapsali, E.; Gikas, E.; Sakkas, V. Serum Metabolomic Signatures Indicate Oxidative Membrane Lipid Remodeling in β-Thalassemia. Metabolites 2026, 16, 170. [Google Scholar] [CrossRef] [Scilit] [PubMed]
- Setty, B.N.Y.; Kulkarni, S.; Stuart, M.J. Role of erythrocyte phosphatidylserine in sickle red cell-endothelial adhesion. Blood 2002, 99, 1564–1571. [Google Scholar] [CrossRef] [Scilit] [PubMed]
- Clark, M.R.; Shohet, S.B.; Gottfried, E.L. Hereditary hemolytic disease with increased red blood cell phosphatidylcholine and dehydration: One, two, or many disorders? Am. J. Hematol. 1993, 42, 25–30. [Google Scholar] [CrossRef] [Scilit] [PubMed]
- Wang, X.; Song, H.; Liang, J.; Jia, Y.; Zhang, Y. Abnormal expression of HADH, an enzyme of fatty acid oxidation, affects tumor development and prognosis (Review). Mol. Med. Rep. 2022, 26, 355. [Google Scholar] [CrossRef] [Scilit] [PubMed]
- Sharpe, A.J.; McKenzie, M. Mitochondrial Fatty Acid Oxidation Disorders Associated with Short-Chain Enoyl-CoA Hydratase (ECHS1) Deficiency. Cells 2018, 7, 46. [Google Scholar] [CrossRef] [Scilit] [PubMed]
- Vance, D.E. Phospholipid methylation in mammals: From biochemistry to physiological function. Biochim. Biophys. Acta 2014, 1838, 1477–1487. [Google Scholar] [CrossRef] [Scilit] [PubMed]
- Gibellini, F.; Smith, T.K. The Kennedy pathway—De novo synthesis of phosphatidylethanolamine and phosphatidylcholine. IUBMB Life 2010, 62, 414–428. [Google Scholar] [CrossRef] [Scilit] [PubMed]
- Di Paolo, G.; De Camilli, P. Phosphoinositides in cell regulation and membrane dynamics. Nature 2006, 443, 651–657. [Google Scholar] [CrossRef] [Scilit] [PubMed]
- Wu, H.; Bogdanov, M.; Zhang, Y.; Sun, K.; Zhao, S.; Song, A.; Luo, R.; Parchim, N.F.; Liu, H.; Huang, A.; et al. Hypoxia-mediated impaired erythrocyte Lands’ Cycle is pathogenic for sickle cell disease. Sci. Rep. 2016, 6, 29637. [Google Scholar] [CrossRef] [Scilit]
- Awojoodu, A.O.; Keegan, P.M.; Lane, A.R.; Zhang, Y.; Lynch, K.R.; Platt, M.O.; Botchwey, E.A. Acid sphingomyelinase is activated in sickle cell erythrocytes and contributes to inflammatory microparticle generation in SCD. Blood 2014, 124, 1941–1950. [Google Scholar] [CrossRef] [Scilit] [PubMed]
- Tkachenko, A.; Alfhili, M.A.; Alsughayyir, J.; Attanzio, A.; Al Mamun Bhuyan, A.; Bukowska, B.; Cilla, A.; Quintanar-Escorza, M.A.; Föller, M.; Havranek, O.; et al. Current understanding of eryptosis: Mechanisms, physiological functions, role in disease, pharmacological applications, and nomenclature recommendations. Cell Death Dis. 2025, 16, 467. [Google Scholar] [CrossRef] [Scilit] [PubMed]
- Alp, G.; Oztas, Y.; Yalcinkaya, A.; Ozel, S.; Yildirim, N.; Unal, S. Plasma sphingolipids in patients with sickle cell disease: Multiple-site vaso-occlusive crises could be associated with lower sphingolipid levels. Lipids 2024, 59, 75–82. [Google Scholar] [CrossRef] [Scilit] [PubMed]
- Yildirim, N.; Unal, S.; Yalcinkaya, A.; Karahan, F.; Oztas, Y. Evaluation of the relationship between intravascular hemolysis and clinical manifestations in sickle cell disease: Decreased hemopexin during vaso-occlusive crises and increased inflammation in acute chest syndrome. Ann. Hematol. 2022, 101, 35–41. [Google Scholar] [CrossRef] [Scilit] [PubMed]
- Schneider-Schaulies, S.; Schumacher, F.; Wigger, D.; Schöl, M.; Waghmare, T.; Schlegel, J.; Seibel, J.; Kleuser, B. Sphingolipids: Effectors and Achilles Heals in Viral Infections? Cells 2021, 10, 2175. [Google Scholar] [CrossRef] [Scilit] [PubMed]

Disclaimer/Publisher’s Note: The statements, opinions and data contained in all publications are solely those of the individual author(s) and contributor(s) and not of MDPI and/or the editor(s). MDPI and/or the editor(s) disclaim responsibility for any injury to people or property resulting from any ideas, methods, instructions or products referred to in the content. |
© 2026 by the authors. Licensee MDPI, Basel, Switzerland. This article is an open access article distributed under the terms and conditions of the Creative Commons Attribution (CC BY) license.