


Abstract
Background/Objectives: Excessive accumulation of visceral adipose tissue (VAT) is a significant contributor to the pathogenesis of metabolic dysfunction-associated steatotic liver disease (MASLD). We aimed to evaluate the diagnostic accuracy of the Metabolic Score for Visceral Fat (METS-VF) in identifying patients with MASLD compared with vibration-controlled transient elastography (FibroScan®) in the Slovak (Caucasian) population. Methods: A cross-sectional study of 156 obese/overweight patients, 61 males and 95 females, aged 33–78 years, treated for T2DM or prediabetes and MASLD, on oral antidiabetic medication, was conducted. We performed sex-stratified correlation analyses between METS-VF, the Controlled Attenuation Parameter (CAP) determined by FibroScan®, the Hepatic Steatosis Index (HSI), fat mass and lean mass parameters derived from dual-energy X-ray absorptiometry (DXA), and potential covariates. We fitted multiple linear regression models with CAP as the dependent variable and METS-VF as the independent variable, adjusted for age, sex, and the HOMA index. We then plotted ROC curves using HSI = 36 or a CAP value of 248 dB/m as a steatosis classifier. We then used logistic regression to evaluate the diagnostic value of METS-VF with a CAP of 248 dB/m. Results: We found a significant positive correlation between METS-VF and CAP (r = 0.26, p ≤ 0.001), HSI (r = 0.57, p ≤ 0.001), android fat% (r = 0.29, p ≤ 0.001), and total body fat% (r = 0.18, p ≤ 0.002). The AUC for the CAP in the model calculated from METS-VF and adjusted for the HOMA index, with HSI = 36 as a classifier, was 0.793 (95% CI 0.67–0.91). In the logistic regression analysis 1 SD increase in METS-VF was related to a 1.63-fold greater chance of MASLD in the whole group, (95% CI:1.08–2.46, p ≤ 0.02), AUC 0.661 (CI 0.52–0.79); and a 2.31-fold greater chance of MASLD in females (95% CI:1.20–4.44, p ≤ 0.01), AUC 0.795 (CI 0.66–0.93); in males the OR was statistically not significant (OR = 1.41, 95% CI: 0.76–2.62, p = 0.27), AUC 0.588 (CI 0.38–0.79). Conclusions: Our results demonstrated that METS-VF had a reasonable ability to correctly discriminate patients with MASLD, but with higher performance in the female group only.
1. Introduction
Metabolic dysfunction-associated steatotic liver disease (MASLD) is the most prevalent liver disease, with a prevalence of nearly 25%, which is considered to be the liver manifestation of the metabolic syndrome, representing a major public health concern [1,2,3].
MASLD represents a wide spectrum of different conditions, varying from straightforward steatosis to steatohepatitis (NASH) and fibrosis, with the possibility of progression to cirrhosis and hepatocellular carcinoma [4,5].
In concordance with the redefinition of Nonalcoholic fatty liver disease (NAFLD) as MASLD, different metabolic phenotypes are specified based on metabolic dysfunction, with excess adiposity, prediabetes, or type 2 diabetes [6].
Obesity, in particular excessive accumulation of visceral adipose tissue (VAT), is a significant contributor and the most important modifiable risk factor for MASLD and may also be a key driver of the development of MASLD in lean individuals [7,8], as well as overweight persons [9,10]. Additionally, VAT has been shown to play a crucial role in the progression of liver inflammation and fibrosis, which is more significant than that of subcutaneous fat tissue [11,12,13]. Therefore, accurate VAT measurement is essential for diagnosing MASLD and predicting prognosis [14,15]. The high economic burden of MRI technology, the gold standard for VAT assessment, limits the ability to precisely determine the extent of VAT accumulation [16]. Furthermore, VAT surrogate markers based on simple anthropometric measures provide only approximate estimates of VAT content from the perspective of body fat distribution [17]; they also do not reflect the metabolic impact of VAT [18,19].
Bello-Chavolla et al. recently developed a new adiposity score that includes BMI, fasting blood glucose, HDL-cholesterol, and triglyceride levels, in addition to waist-to-hip ratio, and have shown it to be superior to widely used obesity indicators for estimating VAT in the Mexican population [20]. The Metabolic Score for Visceral Fat (METS-VF) accounts for age and sex differences in VAT and provides a thorough estimate of the content, distribution, and metabolic impact of VAT [21]. Kapoor et al. validated the usefulness of METS-VF as a surrogate marker of visceral adiposity in the South Indian population with morbid obesity [22].
METS-VF also showed superior predictive performance for diabetes [23], hypertension [24], hyperuricemia [25], and chronic kidney disease [26]. Recently, Kuang et al. reported that METS-VF may also be a reliable tool for identifying patients with MASLD [27]. They conducted a multivariate logistic regression analysis that evaluated the predictive value of METS-VF with Hepatic Steatosis Index as a classifier of liver steatosis in the Chinese population; however, generalising their results to the European population is difficult.
Therefore, our study aimed to assess the value of METS-VF in identifying European (Slovak) patients with MASLD diagnosed by vibration-controlled transient elastography (VCTE; FibroScan®, Echosens, Paris, France) as a non-invasive alternative to liver biopsy, and to differentiate the extent of steatosis. To the best of our knowledge, this is the first study to investigate the diagnostic accuracy of METS-VF in patients with MASLD established by VCTE.
2. Materials and Methods
2.1. Data Collection
In this cross-sectional observational study, we analysed data from 156 patients (95 females and 61 males). The average age was 63.17 ± 11.2 years, with 62.13 ± 11.5 years in males and 63.8 ± 11.0 years in females. All participants were of Caucasian descent and resided in the Eastern Slovakian region. We enrolled patients during their regular control examinations, performed every three months, and obtained informed consent. All patients underwent a basic clinical examination, had anthropometric parameters measured, and completed a self-administered questionnaire. Participants completed a self-administered questionnaire on basic characteristics and biometric values, which was updated at each visit. Data were available only for persons authorised by the Ethical Committee of Kosice University Hospital; approval Nr. is 529-165/EK/21. We collected each patient’s venous blood sample for analysis after a 12 h fast. We performed laboratory evaluations, dual-energy X-ray absorptiometry, and transient elastography between September 2024 and January 2025. Vitamin D levels were determined in all patients in September 2024.
The inclusion and exclusion criteria were as follows:
| Inclusion criteria: |
| Patients with MASLD with the diagnosis previously established by plain ultrasonography who underwent transient elastography and with newly diagnosed T2DM or prediabetic states, or patients with MASLD initially treated with antidiabetic medication. These patients were regularly checked and treated in the Diabetes Outpatient Clinic of the Košice University Hospital, using the following therapeutic modalities: a. low-carbohydrate diet therapy (150 g/day) b. peroral antidiabetic medications including one or more of the following groups: Metformin, sulphonylureas (Gliclazide), and DPP-4 inhibitors (Sitagliptin, Linagliptin). |
| Exclusion criteria: |
| 1. Any insulin or insulin analogue therapy regimen (basal or postprandial) administered separately or in combination with a GLP-1 analogue. |
| 2. Any antidiabetic medication that may have impacted the development of steatosis (GLP-1 analogues (Liraglutide, Semaglutide, Dulaglutide), SGLT2 inhibitors (Dapagliflozin, Empagliflozin), pioglitazone. |
| 3. Any type of autoimmune diabetes (positive for GADA, IAA, or ICA). |
| 4. Alcohol abuse (Alcoholic fatty liver disease) authenticated by the determination of CDT levels or by levels of typical parameters measured in the blood count (Mean corpuscular volume of red blood cells ≥96 fL and platelet count ≤150 × 109/L detected together. Any clinical symptoms or laboratory markers typical of liver cirrhosis. Alcohol consumption was recognised to be significant if it was more than 1 drink per day (20 g) in females and more than 2 drinks per day (30 g) in males on average within the last year, meeting the criteria of metabolic dysfunction-associated steatotic liver disease with moderate (increased) alcohol consumption (MetALD). |
| 5. Any underlying or concomitant liver disease different from MASLD, i.e., viral hepatitis based on the surface antigen of hepatitis B and hepatitis C virus, detected by automatic immunoassay (Roche Diagnostic GmbH, DE). |
| 7. Participants in whom steatogenic drugs, e.g., corticosteroids, amiodarone, methotrexate, sodium valproate, or tamoxifen, were given. |
| 8. Conditions that could substantially affect bone and muscle metabolism, body composition, or nutritional status, such as rheumatologic and hematologic diseases, thyroid dysfunction, hyperparathyroidism, hypercortisolism, inflammatory bowel disease (IBD), or any malabsorption, pancreatic disorders, and any malignancy. |
| 9. Severe renal dysfunction with serum creatinine ≥150 µmol/L. |
| 10. Gravidity |
We established the diagnosis of diabetes according to the criteria of the European Association for the Study of Diabetes (EASD) and the American Diabetes Association (ADA). Regarding diagnostic criteria, we refer to our previous article [5].
Based on laboratory parameters and anthropometric values, we selected patients at high risk of MASLD. We established a preliminary diagnosis of MASLD by plain ultrasonography. Afterward, the diagnosed patients underwent transient elastography. The patient-flow diagram published as a supplementary file shows the number of recruited and evaluated patients (Supplementary Figure S1).
We assessed liver stiffness measurement (LSM) and controlled attenuation parameter (CAP) using vibration-controlled transient elastography (VCTE) with a FibroScan® Compact 530 device (Echosens, Paris, France). We selected the M or XL probe based on the patient’s body habitus. We performed all examinations after at least 3 h of fasting. An acceptable LSM examination required at least 10 valid measurements and an interquartile range-to-median ratio (IQR/median) of <0.10. We expressed LSM as the median value in kPa, and reported CAP in dB/m. According to EASLD-EASD-EASO guidelines, liver stiffness >7.0 kPa was considered significant liver fibrosis, and CAP >248 dB/m was the cutoff for steatosis. The device software automatically rejected invalid individual acquisitions, and they were not counted toward the required 10 valid measurements. No separate predefined CAP SD threshold was used as an acceptability criterion. A single operator certified in the use of the device performed all examinations and was blinded to participants’ METS-VF scores, clinical information, and laboratory results at the time of measurement.
2.2. Laboratory Analysis
Serum glucose and lipid parameters were routinely measured using an automatic laboratory biochemical analyser (Roche Diagnostics GmbH, Basel, Switzerland). Insulin concentrations were measured by immunoradiometric assays (Beckman Coulter, Inc., Brea, CA, USA). HbA1c was measured using the latex turbidimetric method and calculated using DCCT measures; the remaining biochemical parameters were measured in the Biochemistry Laboratory of Košice University Hospital.
2.3. Analysis of Body Composition
Total body composition analysis was performed via dual-energy X-ray absorptiometry (DXA) using a Lunar Prodigy Advance enCORE 2011 (GE Healthcare, Chicago, Illinois, USA) X-ray densitometer at the 1st Department of Internal Medicine at Košice University Hospital (software version 13.60.033), which categorises the scans into fat mass, lean mass and bone mass, and delineates fat mass into android and gynoid regions. The imaging machine was calibrated each day before measurements, and certified radiologists performed the scans; patient data were anonymised.
To determine which parameters had the best performance in the discrimination of patients with MASLD, i.e., explained more of the variance in the outcome as evaluated by the CAP, and thus resulted in a better model fit, the following lean mass/fat mass distribution parameters and indices were used for the analysis:
Absolute and relative measures (stated in grams):
- Lean arm mass (LAM)
- Lean leg mass (LLM)
- Appendicular lean mass (ALM) was calculated as the sum of lean arm mass (LAM) and lean leg mass (LLM).
- The appendicular lean mass index (ALMI) was calculated from the appendicular lean mass (ALM) as ALM/height2.
Relative measures of fat mass (stated in percentage):
- Total body fat % (%BF)
- Android fat % (Android FM%)
- Android/gynoid fat mass ratio (AGR)
Android fat % determined by the Lunar Prodigy Advance enCORE 2011 corresponds to the total fat mass in the upper body, approximately from the top edge of the pelvis upward, and includes subcutaneous and visceral adipose tissue.
2.4. Statistical Analysis
We evaluated the normality of continuous variables using the Shapiro–Wilk test and the homogeneity of variances using Levene’s test. We used the two-sample Student’s t-test to compare groups when data were normally distributed; we used the Mann–Whitney U test when data were non-normally distributed. For comparisons between three groups, we used one-way ANOVA. We evaluated relationships between outcome variables and independent variables using the Pearson correlation test for parametric distributions and Spearman’s correlation test for non-parametric distributions. We used the chi-square test to assess relationships between categorical variables.
We used unadjusted bivariate regression analyses to assess associations between METS-VF, CAP, HSI, and potential covariates. To identify the contribution of METS-VF and potential confounders to MASLD, as assessed by CAP, we constructed stepwise multiple linear regression models. We evaluated potential multicollinearity among predictor variables using a correlation matrix and VIF values. Before our analysis, we selected 14 laboratory parameters and body composition indices as potential confounders of MASLD.
If a strong correlation was found between the two explanatory variables, we removed one of the variables. Consequently, we prepared receiver operating characteristic (ROC) curves for the specificity and sensitivity of the calculated CAP, using HSI = 36 or a CAP value of 248 dB/m as the classifier for liver steatosis. This index accounts for the presence of DM and reflects not only its presence but also the degree of steatosis. We calculated the AUC for all models to assess their diagnostic utility. Based on sensitivity, specificity, and the Akaike information criterion, we further considered only the model variants with the highest diagnostic utility and the strongest explanation of variation in CAP as the outcome variable.
We then used logistic regression to predict MASLD class, using a widely accepted CAP of 248 dB/m, which the EASL-EASD-EASO guidelines identify as the cutoff for steatosis grade S1. Because ultrasonography has lower diagnostic value for MASLD than VCTE, we included patients with CAP <248 dB/m as the control group in the logistic regression analysis. Because METS-VF already includes the effects of sex groups, metabolic parameters, and body composition evaluated by waist-to-height ratio, we adjusted our logistic regression models for HOMA index and age only in the sex-stratified analysis. To evaluate METS-VF’s ability to discriminate patients with MASLD, we also conducted receiver operating characteristic (ROC) analysis.
The value of the HSI is calculated as follows [28]:
8 × ALT/AST + BMI + 2 (in each case for the presence of T2DM) + 2 in the case of the female sex.
The value of the METS-VF is calculated as follows [20]:
4.466 + 0.011 × [(Ln ((Ln (2 × FPG + TG) × BMI)/Ln (HDL)))3] + 3.239 × [(Ln(WHtR))3] + 0.319 × sex + 0.594 × [Ln (age)].
Note: Sex in the equation is a binary variable (male = 1, female = 0).
For METS-VF calculation, the following units were used: FPG (mmol/L), TG (mmol/L), HDL (mmol/L).
The value of the FIB4 index, which is a noninvasive indicator of liver fibrosis, is calculated as follows [29]:
FIB 4 = (Age × AST)/(Platelet count × √ALT)
For the calculation of the Fib-4, we used the following units: age (years), AST (µkat/L), ALT (µkat/L), and platelet count (platelets/µL).
We considered only two-sided p-values statistically significant at p < 0.05, and we conducted analyses using SAS statistical software version 9.4 (SAS Institute Inc., Cary, CA, USA).
3. Results
3.1. Clinical and Biochemical Characteristics
Table 1 presents basic descriptive characteristics of anthropometric parameters and body composition indices by sex.
Table 1.
Basic descriptive statistics of the controlled attenuation parameter (CAP), anthropometric variables, and body composition parameters.
124 patients had CAP > 248 (45 males and 79 females), and 32 had CAP < 248 (14 males and 18 females). A total of 37.1% of patients were overweight (58 out of 156), and 52.5% were obese (82 out of 156) based on BMI ≥ 30, and 88.4% (138 out of 156) were obese based on % BF ≥ 30. A total of 80.1% (125 out of 156) of the patients were insulin resistant based on the HOMA-IR > 2.5.
As shown in Table 1, the sex-stratified groups differed in weight, Android FM %, Android/gynoid ratio (AGR), Total body fat %, ALM/height2, and METS-VF.
Table 2 presents basic descriptive characteristics of the laboratory variables and calculated liver indices for participants classified by sex-stratified groups.
Table 2.
Basic descriptive statistics of the laboratory variables and the calculated liver indices.
As shown in Table 2, the sex-stratified groups differed in HDL cholesterol, ferritin, and platelet levels.
3.2. Baseline Characteristics Across Tertiles
We divided the data into MET-VF tertiles and evaluated differences between groups.
Table 3 presents basic descriptive statistics for the evaluated variables by METS-VF index tertile.
Table 3.
Basic descriptive statistics of the evaluated variables based on the METS-VF index tertiles.
Because FBG, triglycerides, BMI, HDL cholesterol, WHtR, and age are included in METS-VF, differences across tertiles are expected for these parameters. Participants in higher METS-VF tertiles had a higher degree of steatosis, as evaluated by CAP (p ≤ 0.005) and HSI (p ≤ 0.001), than those in lower tertiles. They also had higher total body fat % (p ≤ 0.03), android/gynoid ratio (p ≤ 0.04), ALM/height2 (p ≤ 0.001), and triglyceride levels (p ≤ 0.05). They also had higher BMI (p ≤ 0.001), waist circumference (p ≤ 0.001), and waist-to-height ratio (p ≤ 0.001), and lower HDL cholesterol (p ≤ 0.001), but these findings were expected because METS-VF was calculated from these parameters. Fibrosis score was higher in the highest METS-VF tertile, but the difference was not significant (p ≤ 0.06).
Android fat % (p ≤ 0.001), HOMA index, and insulin levels were slightly higher in tertile T2 than in tertile T3. However, vitamin D levels decreased across tertiles (p ≤ 0.05).
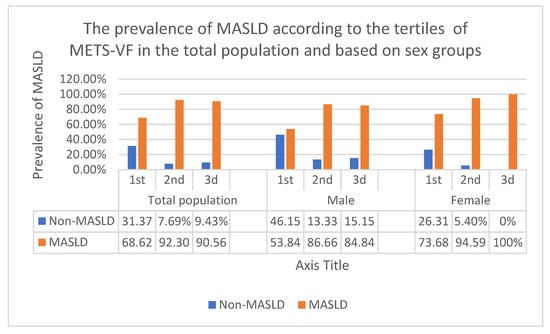
Figure 1 presents differences in MASLD prevalence by METS-VF tertile in the total population and by sex.
Figure 1.
The differences in the prevalence of MASLD according to the tertiles of METS-VF in the total population and in sex groups. Abbreviations: MASLD: Metabolic dysfunction-associated steatotic liver disease. METS-VF: Metabolic score of visceral fat. Values are presented as frequency (percentage).
Using the chi-square test for categorical variables, MASLD prevalence differed significantly by METS-VF tertile in each group: p = 0.001 for the total group, p = 0.04 for the male group, and p = 0.003 for the female group.
According to the chi-square test for categorical variables, the prevalence of MASLD by CAP values across METS-VF tertiles differed significantly in each group: p = 0.001 for the total group, p = 0.04 for the male group, and p = 0.003 for the female group.
3.3. Simple Regression Analysis Between METS-VF, CAP and HSI
After evaluating participants’ clinical parameters, we examined relationships among the three liver steatosis parameters, their associations with lean mass and fat mass components, and potential confounders among laboratory parameters. This was accomplished via correlation matrices. As shown in Table 1, body composition parameters differed significantly between males and females; therefore, we evaluated associations in the whole group and by gender (Table 4).
Table 4.
Simple regression analysis between laboratory parameters and lean/fat mass indices and METS-VF, CAP and HSI in the overall and sex stratified cohorts (significant correlations are bold).
As shown in Table 4, METS-VF was positively correlated with android fat % (r = 0.29, r = 0.64, r = 0.53, p ≤ 0.001) and total body fat % (r = 0.18, r = 0.55, r = 0.71, p ≤ 0.001) in all groups, respectively, with AGR (r = 0.24, p ≤ 0.002) and (r = 0.28, p ≤ 0.005), ALM/height2 (r = 0.44, p ≤ 0.001) and (r = 0.40, p ≤ 0.001), CAP (r = 0.26, p ≤ 0.001) and (r = 0.30, p ≤ 0.003), uric acid (r = 0.22, p ≤ 0.005) and (r = 0.31, p ≤ 0.002), and HOMA index (r = 0.18, p ≤ 0.02) and (r = 0.28, p ≤ 0.006) in the whole group and the female group, respectively, and negatively correlated with HDL cholesterol in the whole group (r = −0.37, p ≤ 0.001) and the female group (r = −0.39, p ≤ 0.001) and with vitamin D levels in the whole group (r = −0.18, p ≤ 0.02).
As shown in Table 4, CAP was positively correlated with the HOMA index (r = 0.25, p ≤ 0.001) (r = 0.21, p ≤ 0.04), (r = 0.36, p ≤ 0.004), and HSI (r = 0.36, r = 0.34, r = 0.39, p ≤ 0.001), in all groups, respectively, with BMI in the whole group (r = 0.29, p ≤ 0.001) and female group (r = 0.31, p ≤ 0.002), with ALT (r = 0.21, p ≤ 0.009) and (r = 0.34, p ≤ 0.006), triglyceride (r = 0.19, p ≤ 0.02) and (r = 0.35, p ≤ 0.004), and GGT (r = 0.25, p ≤ 0.001) and (r = 0.33, p ≤ 0.008) levels in the whole group and male group, respectively. with uric acid (r = 0.23, p ≤ 0.02) and ALM/height2 (r = 0.26, p ≤ 0.01) in the female group and with android fat % (r = 0.20, p ≤ 0.01) and AST (r = 0.16, p ≤ 0.04) in the whole group.
CAP was negatively correlated with HDL cholesterol in the entire group (r = −0.26, p ≤ 0.001) and in the female group (r = −0.28, p ≤ 0.006).
As shown in Table 4, HSI was positively correlated with HOMA index (r = 0.20, p ≤ 0.009), (r = 0.23, p ≤ 0.05), (r = 0.33, p ≤ 0.009), ALM/height2 (r = 0.32, r = 0.49, r = 0.49, p ≤ 0.001), android fat % (r = 0.53, r = 0.62, r = 0.62, p ≤ 0.001), total body fat % (r = 0.44, r = 0.53, r = 0.61, p ≤ 0.001), and CAP (r = 0.36, r = 0.40, r = 0.34, p ≤ 0.001) in all groups, respectively, with triglyceride levels in the male group (r = 0.36, p ≤ 0.01), and negatively correlated with vitamin D (r = −0.24, p ≤ 0.002), (r = −0.25, p ≤ 0.001) and (r = −0.26, p ≤ 0.01) in all groups, respectively, and with HDL (r = −0.24, p ≤ 0.001) and (r = −0.28, p ≤ 0.005) in the whole group and male group, respectively.
3.4. Multivariate Analysis
To evaluate the contribution of METS-VF to MASLD, as assessed by CAP, after adjusting for potential confounders, we constructed multiple linear regression models. Because METS-VF already includes the effects of sex groups, age, and metabolic parameters (e.g., blood glucose, triglycerides, BMI, HDL cholesterol, and body composition evaluated by waist-to-height ratio), we adjusted the equation only for the HOMA index and age.
A multiple linear regression model in the whole group demonstrated a significant association between CAP and METS-VF, adjusted for the HOMA index.
CAP = 49.95 + 31.19 (METS-VF) + 2.73 (HOMA-index);
Partial correlation between CAP and METS-VF (r = 0.23, p ≤ 0.001);
Partial correlation between CAP and HOMA-index (r = 0.22, p ≤ 0.001);
Model selection: p ≤ 0.001 F = 9.74 R2 = 0.11 Radj2 = 0.10.
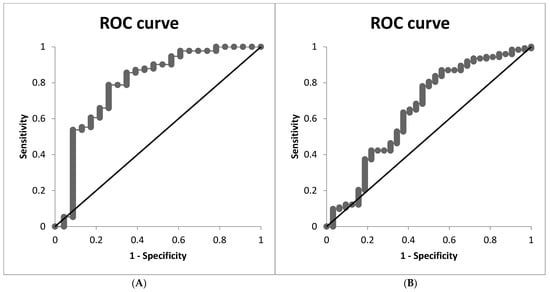
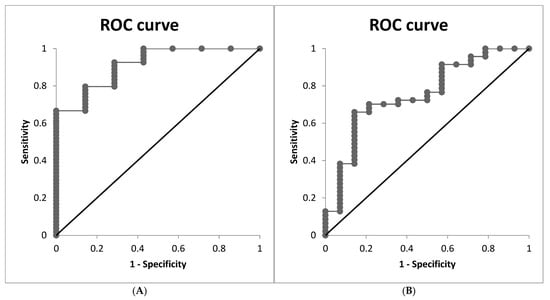
Consequently, we prepared ROC curves for the specificity and sensitivity of the calculated CAP, where HSI= 36 or CAP of 248 dB/m was considered a classifier of liver steatosis.
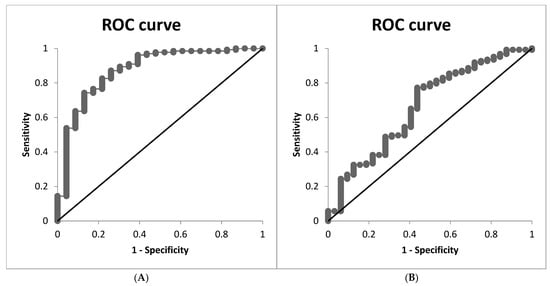
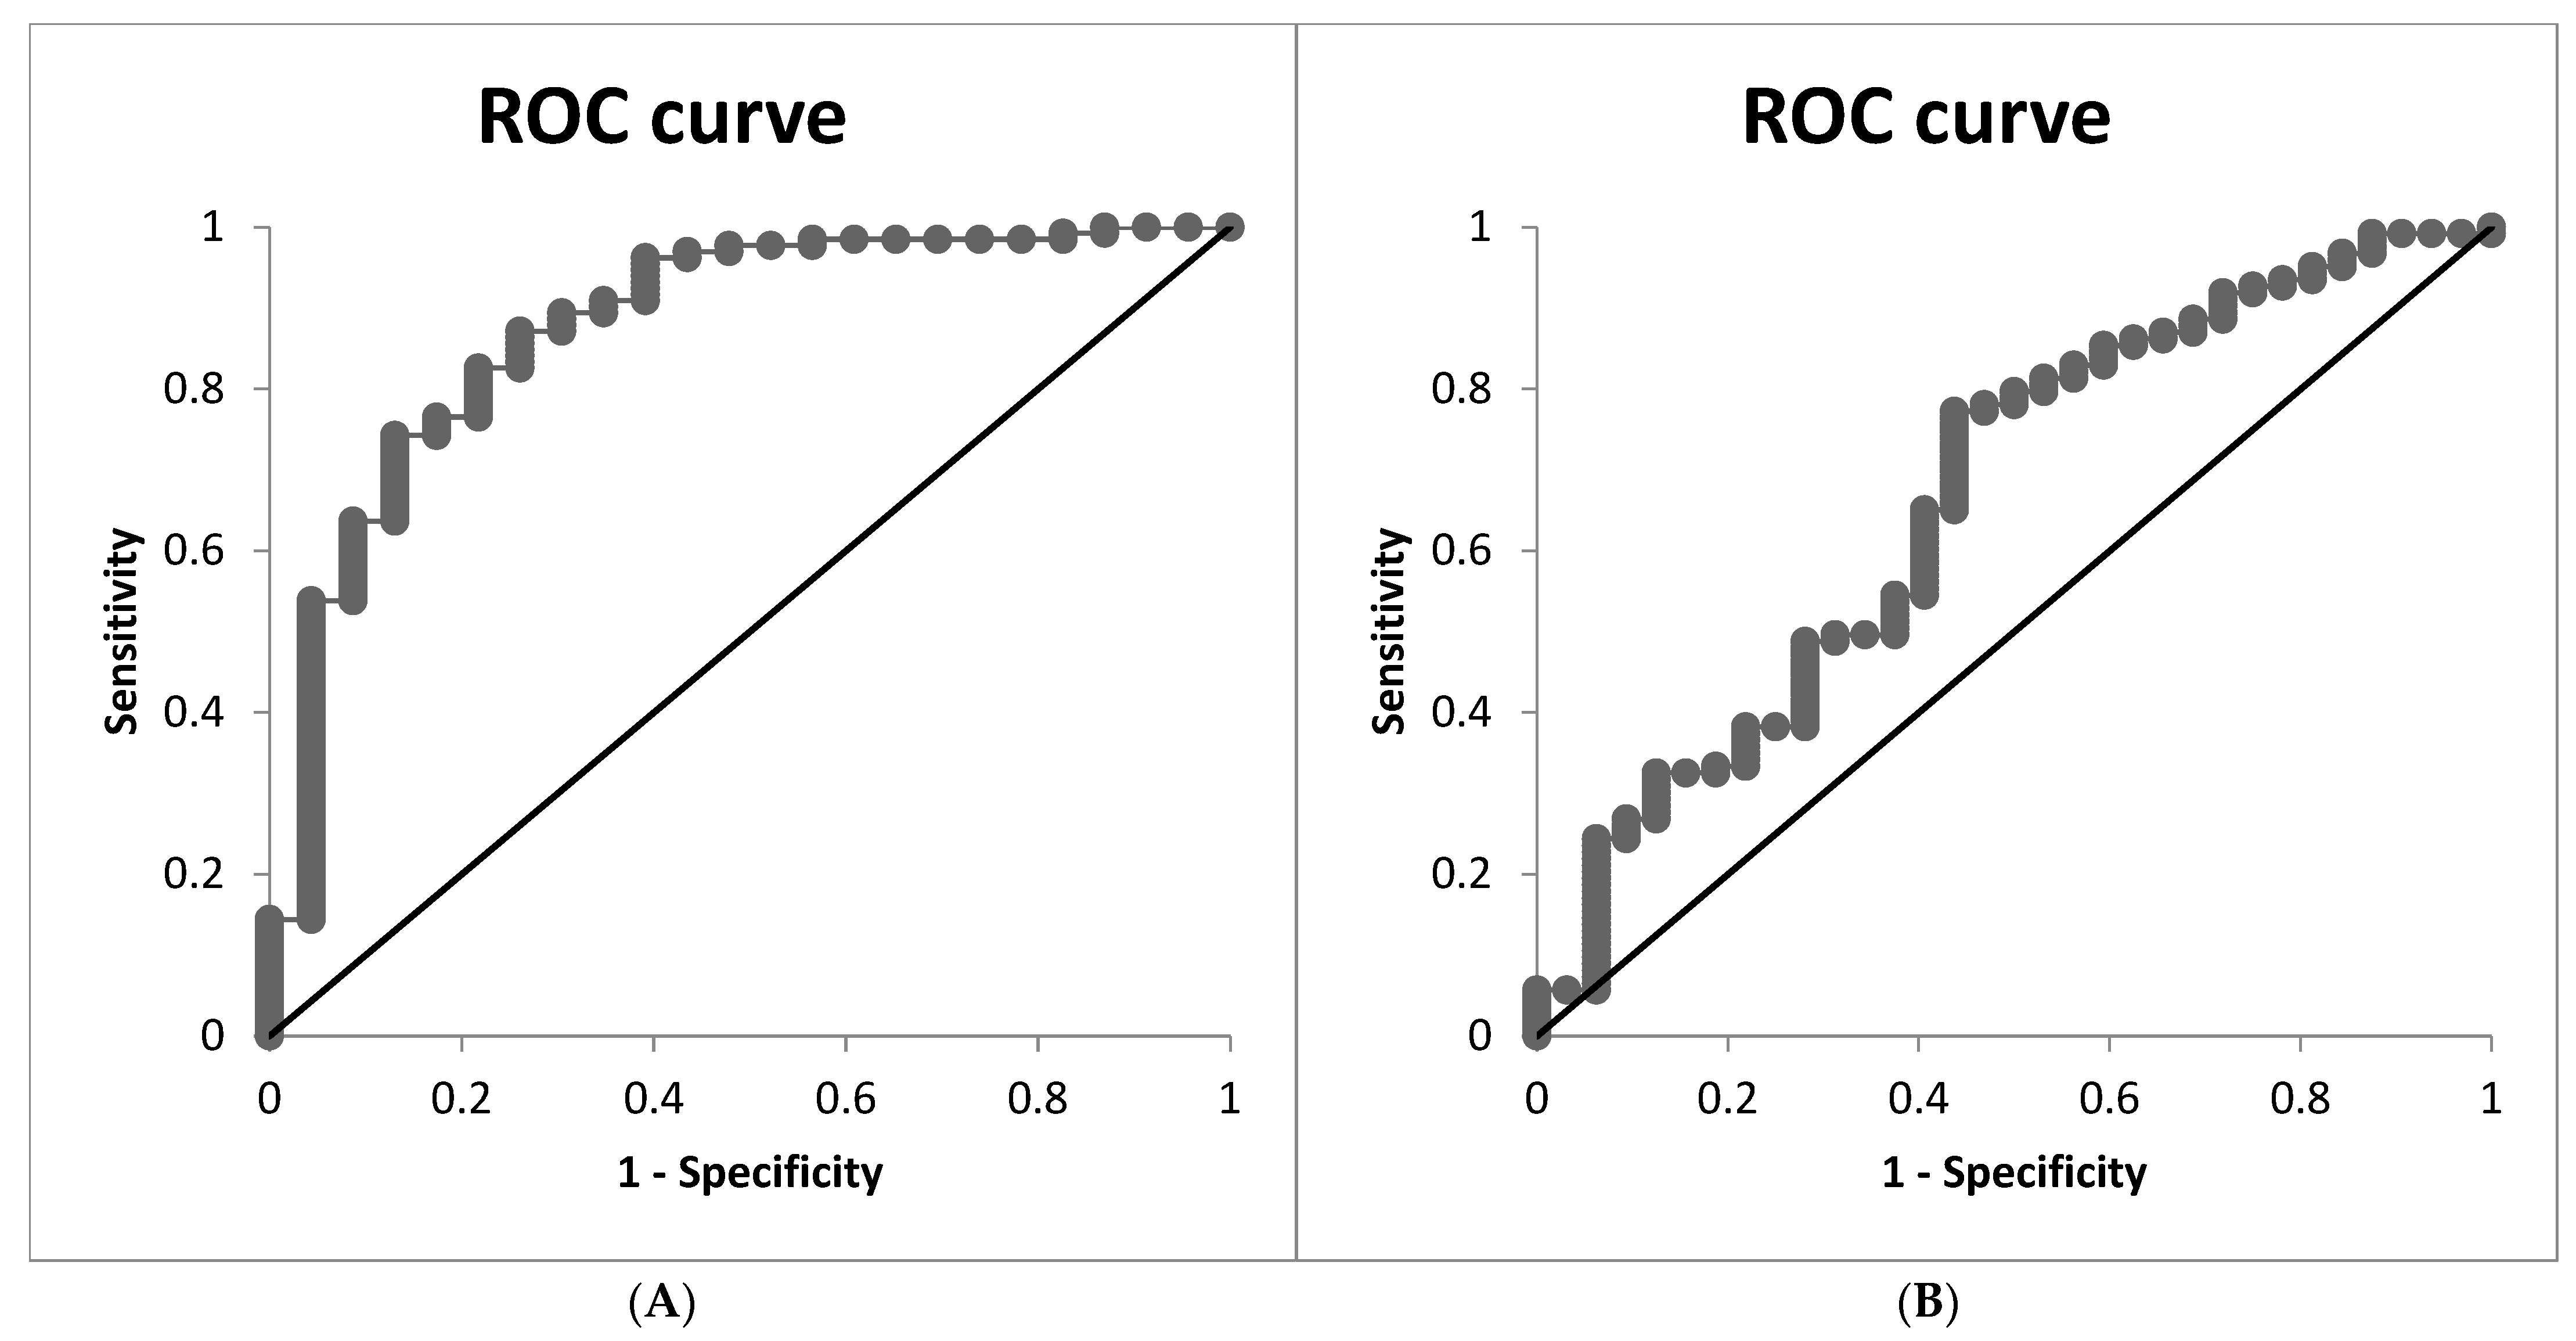
When HSI = 36 was used as the classifier for liver steatosis, the AUC for CAP in the model calculated from METS-VF was 0.793 (95% CI 0.67–0.91), with a sensitivity of 78.03% and specificity of 73.91%. The CAP cutoff value was 286.61.
Figure 2A depicts the ROC curve. The VIF value of 1.03 indicates low collinearity between METS-VF and the HOMA index.
Figure 2.
The ROC curve of the model for CAP, calculated from METS-VF and adjusted for HOMA index in the entire group. (A) The ROC curve for the CAP model, calculated from METS-VF and adjusted for the HOMA index in the entire group, where HSI = 36 was considered a classifier of liver steatosis. (B) The ROC curve for the CAP model, calculated from METS-VF and adjusted for the HOMA index in the entire group, where CAP = 248 dB/m is considered a classifier of liver steatosis.
We also prepared an ROC curve for the specificity and sensitivity of the calculated CAP, using a cutoff of 248 dB/m for measured CAP as the classifier for liver steatosis.
The AUC for CAP in the model calculated from METS-VF was 0.649 (95% CI 0.49–0.80), with a sensitivity of 80.48% and specificity of 50.00%. The CAP cutoff value was 285.53.
Figure 2B depicts the ROC curve. The VIF value of 1.03 indicated low collinearity between METS-VF and the HOMA index.
The sex-stratified models with the inclusion of the HOMA index were not significant.
For the evaluation of the interaction between METS-VF and age, we performed an interaction analysis between these parameters, and we found that the interaction is not significant (in the whole group p = 0.16, R2 = 0.13, Radj2 = 0.11; in males p = 0.40, R2 = 0.14, Radj2 = 0.10; in females p = 0.39, R2 = 0.13, Radj2 = 0.10).
A multiple linear regression model in the whole group demonstrated a significant association between CAP and METS-VF, adjusted for age.
In the whole group:
CAP = 52.00 + 43.09 (METS-VF) − 1.18 (Age);
Partial correlation between CAP and METS-VF (r = 0.31, p ≤ 0.001);
Partial correlation between CAP and age (r = −0.23, p ≤ 0.003);
Model selection: p ≤ 0.001 F= 10.48 R2 = 0.12 Radj2 = 0.11.
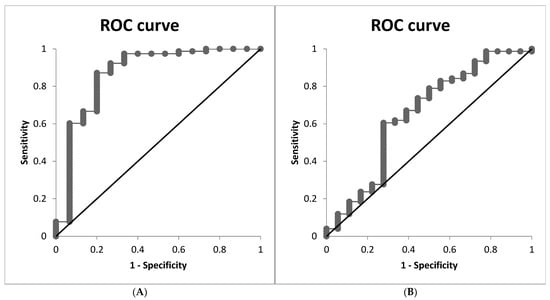
When HSI = 36 was used as the classifier for liver steatosis, the AUC for CAP in the model calculated from METS-VF was 0.874 (95% CI 0.79–0.96), with a sensitivity of 82.57% and specificity of 78.26%. The CAP cutoff value was 284.49.
Figure 3A depicts the ROC curve. The VIF value of 1.04 indicated low collinearity between METS-VF and age.
Figure 3.
The ROC curve of the model for CAP, calculated from METS-VF and adjusted for age in the entire group. (A) The ROC curve for the CAP model, calculated from METS-VF and adjusted for age, in the entire group where HSI = 36 is considered a classifier of liver steatosis. (B) The ROC curve for the CAP model, calculated from METS-VF and adjusted for age in the entire group, where CAP = 248 dB/m is considered a classifier of liver steatosis.
We also prepared an ROC curve for the specificity and sensitivity of the calculated CAP, using a cutoff of 248 for the measured CAP as the classifier for liver steatosis.
The AUC for CAP in the model calculated from METS-VF was 0.662 (95% CI 0.55–0.77), with a sensitivity of 77.23% and specificity of 56.25%. The CAP cutoff value was 286.46.
Figure 3B depicts the ROC curve. A VIF of 1.03 indicates low collinearity between METS-VF and the HOMA index.
In the female group:
CAP = 34.43 + 43.30 (METS-VF) − 0.86 (Age);
Partial correlation between CAP and METS-VF (r = 0.33, p ≤ 0.001);
Partial correlation between CAP and age (r = −0.18, p = 0.05);
Model selection: p ≤ 0.003 F= 6.07 R2 = 0.12 Radj2 = 0.10.
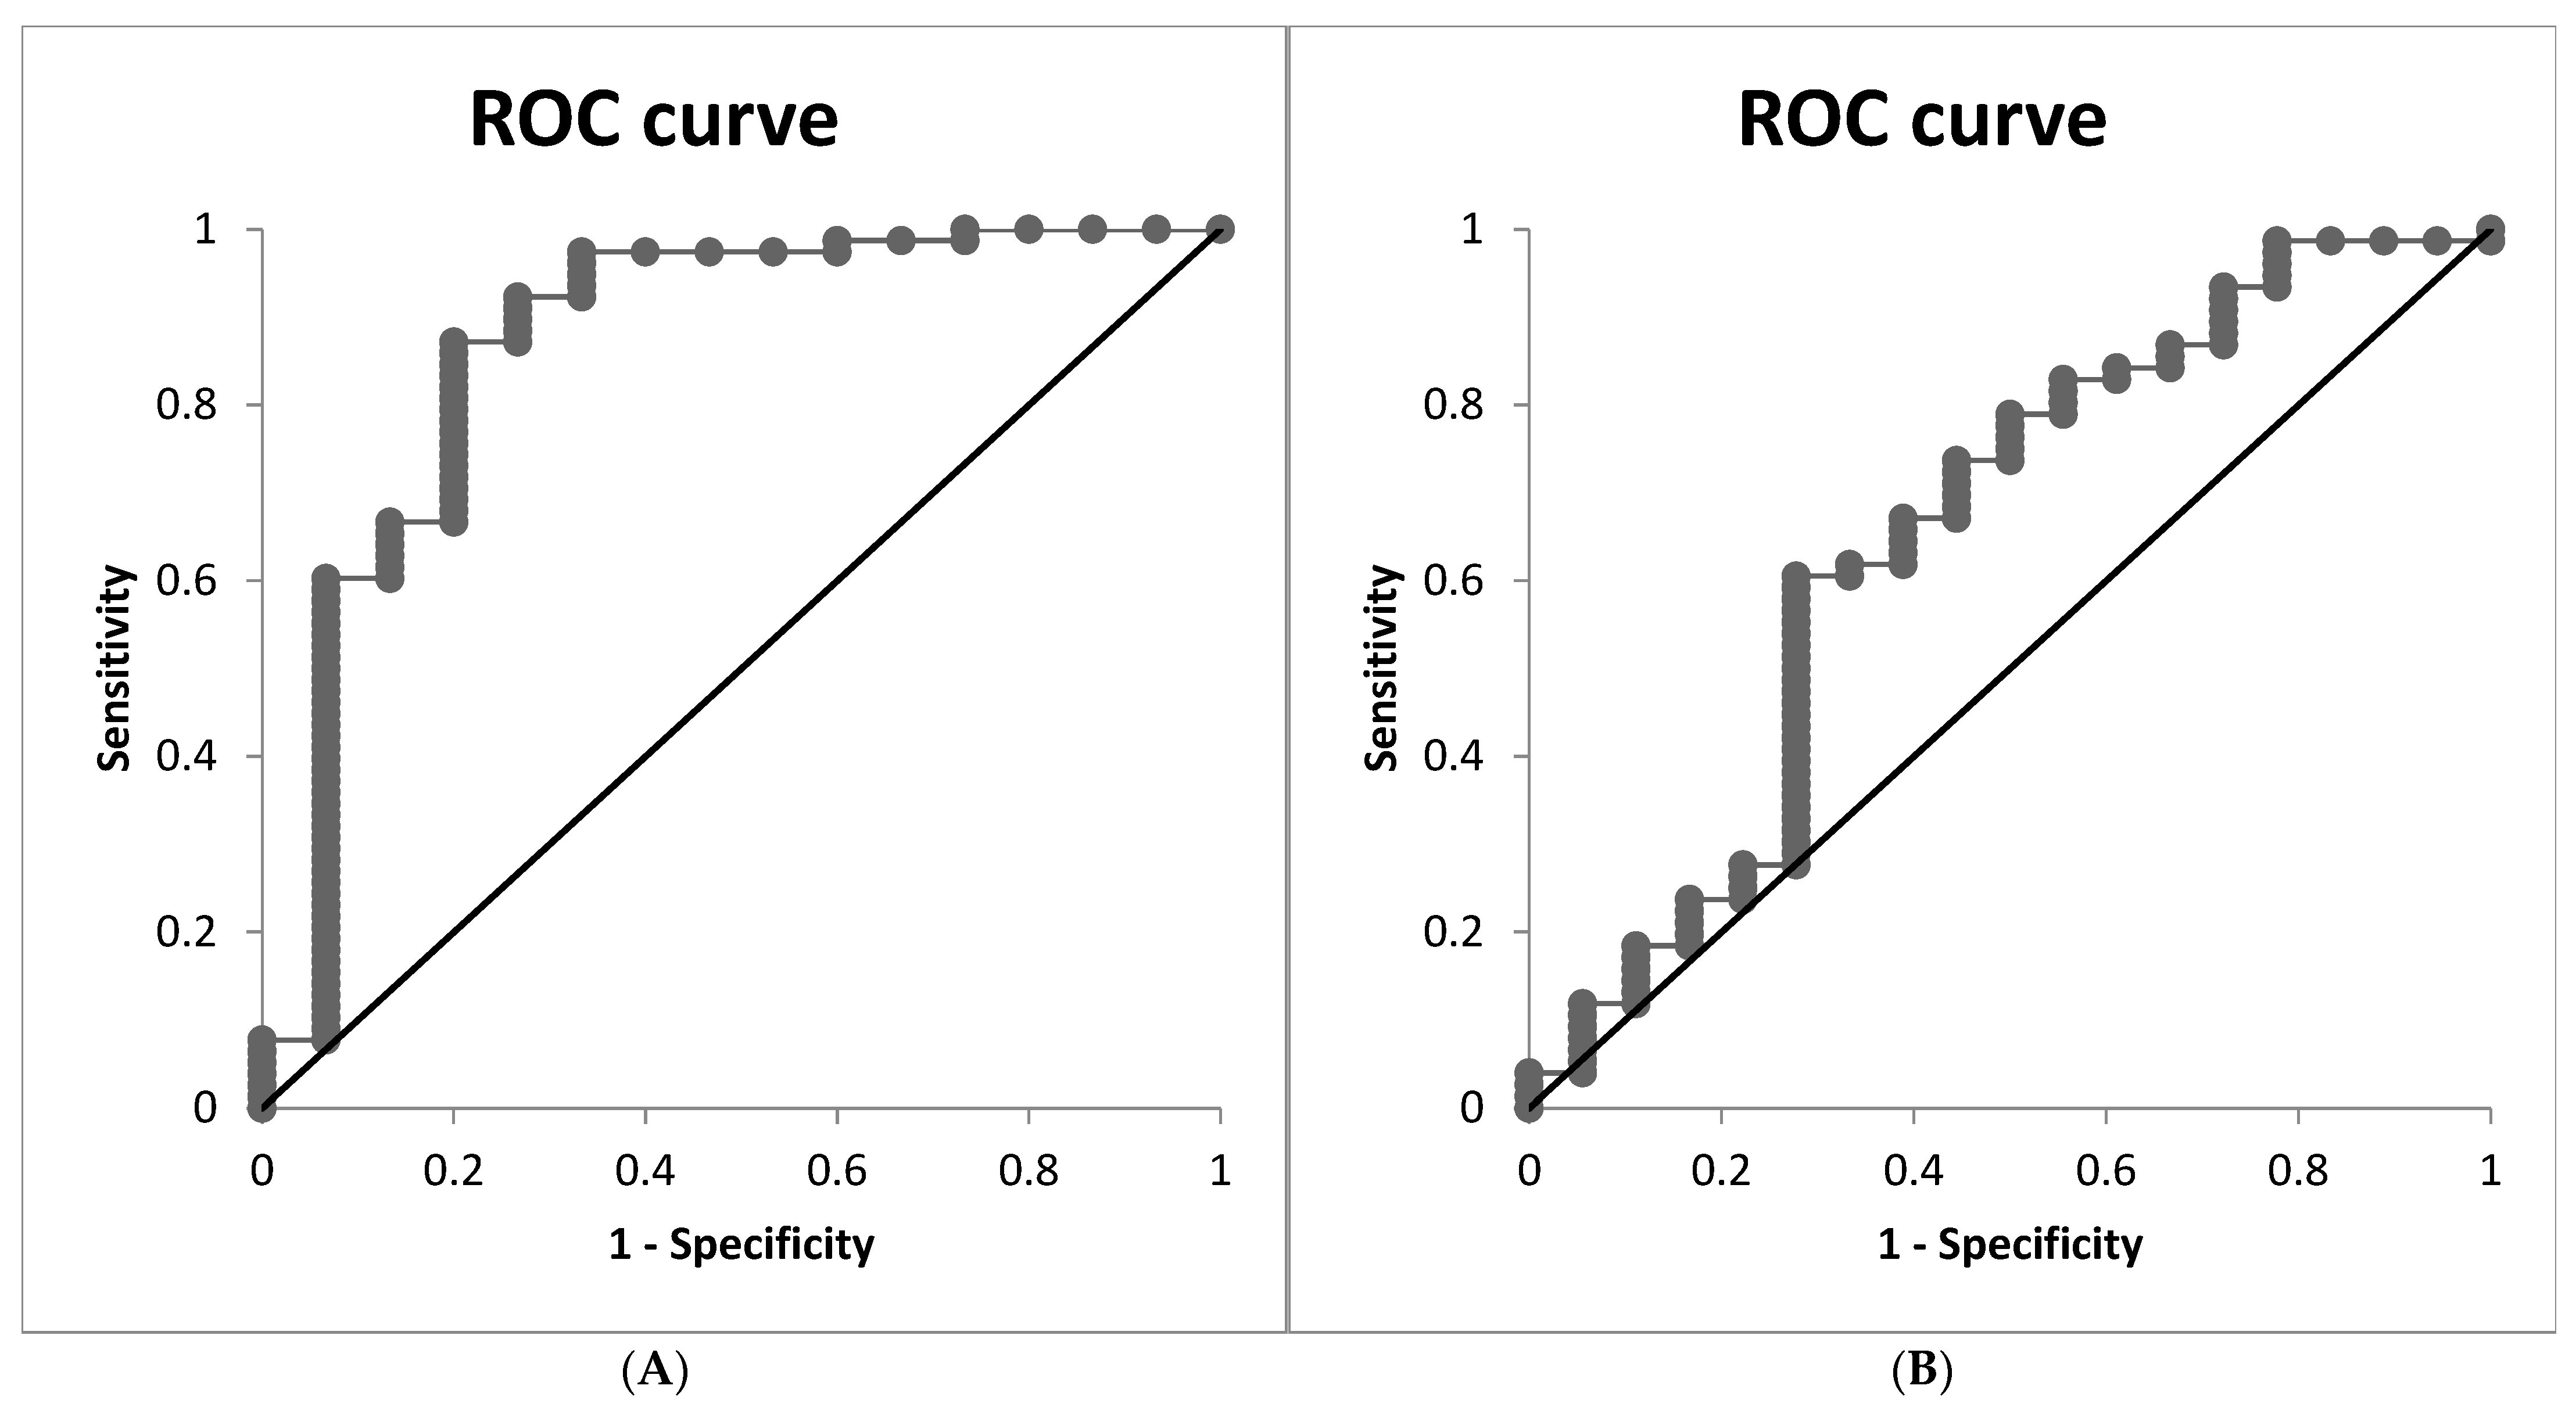
When HSI = 36 was used as the classifier for liver steatosis, the AUC for CAP in the model calculated from METS-VF was 0.867 (95% CI 0.74–0.99), with a sensitivity of 87.17% and specificity of 80.00%. The CAP cutoff value was 286.05.
Figure 4A depicts the ROC curve. The VIF value of 1.04 indicated low collinearity between METS-VF and age.
Figure 4.
The ROC curve of the model for CAP, calculated from METS-VF and adjusted for age in the female group. (A) The ROC curve for the CAP model, calculated from METS-VF and adjusted for age in the female group, where HSI = 36 is considered a classifier of liver steatosis. (B) The ROC curve for the CAP model, calculated from METS-VF and adjusted for age in the female group, where CAP = 248 dB/m is considered a classifier of liver steatosis.
We also prepared an ROC curve for the specificity and sensitivity of the calculated CAP, where a cutoff of 248 for measured CAP was considered a classifier of liver steatosis.
The AUC for CAP in the model calculated from METS-VF was 0.649 (95% CI 0.49–0.80), with a sensitivity of 78.94% and specificity of 50.00%. The CAP cutoff value was 285.67.
Figure 4B depicts the ROC curve. The VIF value of 1.03 indicates low collinearity between METS-VF and age.
In the male group:
CAP = −8.61 + 54.48 (METS-VF) − 1.67 (Age);
Partial correlation between CAP and METS-VF (r = 0.31, p = 0.02);
Partial correlation between CAP and age (r = −0.31, p = 0.02);
Model selection: p ≤ 0.01 F = 4.59 R2 = 0.13 Radj2 = 0.11.
We prepared an ROC curve for the specificity and sensitivity of the calculated CAP, where HSI = 36 was considered a classifier of liver steatosis.
The AUC for CAP in the model calculated from METS-VF was 0.912 (95% CI 0.81–0.99), with a sensitivity of 79.62% and specificity of 85.71%. The CAP cutoff value was 287.09.
Figure 5A depicts the ROC curve. A VIF of 1.13 indicates low collinearity between METS-VF and age.
Figure 5.
The ROC curve of the model for CAP, calculated from METS-VF and adjusted for age in the male group. (A) The ROC curve for the CAP model, calculated from METS-VF and adjusted for age in the male group, where HSI = 36 is considered a classifier of liver steatosis. (B) The ROC curve for the CAP model, calculated from METS-VF and adjusted for age in the male group, where CAP = 248 dB/m is considered a classifier of liver steatosis.
When HSI = 36 was used as the classifier for liver steatosis, the AUC for CAP in the model calculated from METS-VF was 0.755 (95% CI 0.61–0.90), with a sensitivity of 76.59% and specificity of 50.00%. The CAP cutoff value was 289.36.
Figure 5B depicts the ROC curve. The VIF value of 1.13 indicated low collinearity between METS-VF and age.
To compare AUCs between the male and female groups, we calculated a modified z-test for two independent groups for AUCs with both classifiers. The z-values were 0.55 and 0.98, respectively, indicating that AUCs did not differ significantly between the female and male groups.
We also adjusted the relationship for the ALM/height2 index and android fat %, but these adjustments were not significant.
As shown in those equations, CAP remained significantly associated with METS-VF after adjustment for the HOMA index and age. Because age is included in METS-VF, this interpretative difficulty should be considered.
3.5. Logistic Regression Analysis
After identifying the relationships between CAP and METS-VF using multiple linear regression, we evaluated the diagnostic accuracy of METS-VF for discriminating patients with steatosis using logistic regression analysis, with a widely accepted CAP of 248 dB/m as the cutoff value for steatosis.
As shown in Table 5, each 1 SD increase in METS-VF was associated with a 1.63-fold greater chance (95% CI: 1.08–2.46, p ≤ 0.02) of MASLD as assessed by CAP. In sex-stratified analysis, each 1 SD increment was associated with 2.31-fold greater MASLD odds in females (95% CI: 1.20–4.44, p ≤ 0.01); however, in the male group, the relationship was no longer statistically significant (OR = 1.41, 95% CI: 0.76–2.62, p = 0.27).
Table 5.
The association between MET-VF and the odds of MASLD as evaluated by CAP in the whole population and in the sex-stratified analysis.
Because METS-VF already includes the effects of sex groups, metabolic parameters, and body composition evaluated by waist-to-height ratio, we adjusted the logistic regression model for the HOMA index only, but the relationship was not significant in any group.
3.6. Diagnostic Performance of METS-VF
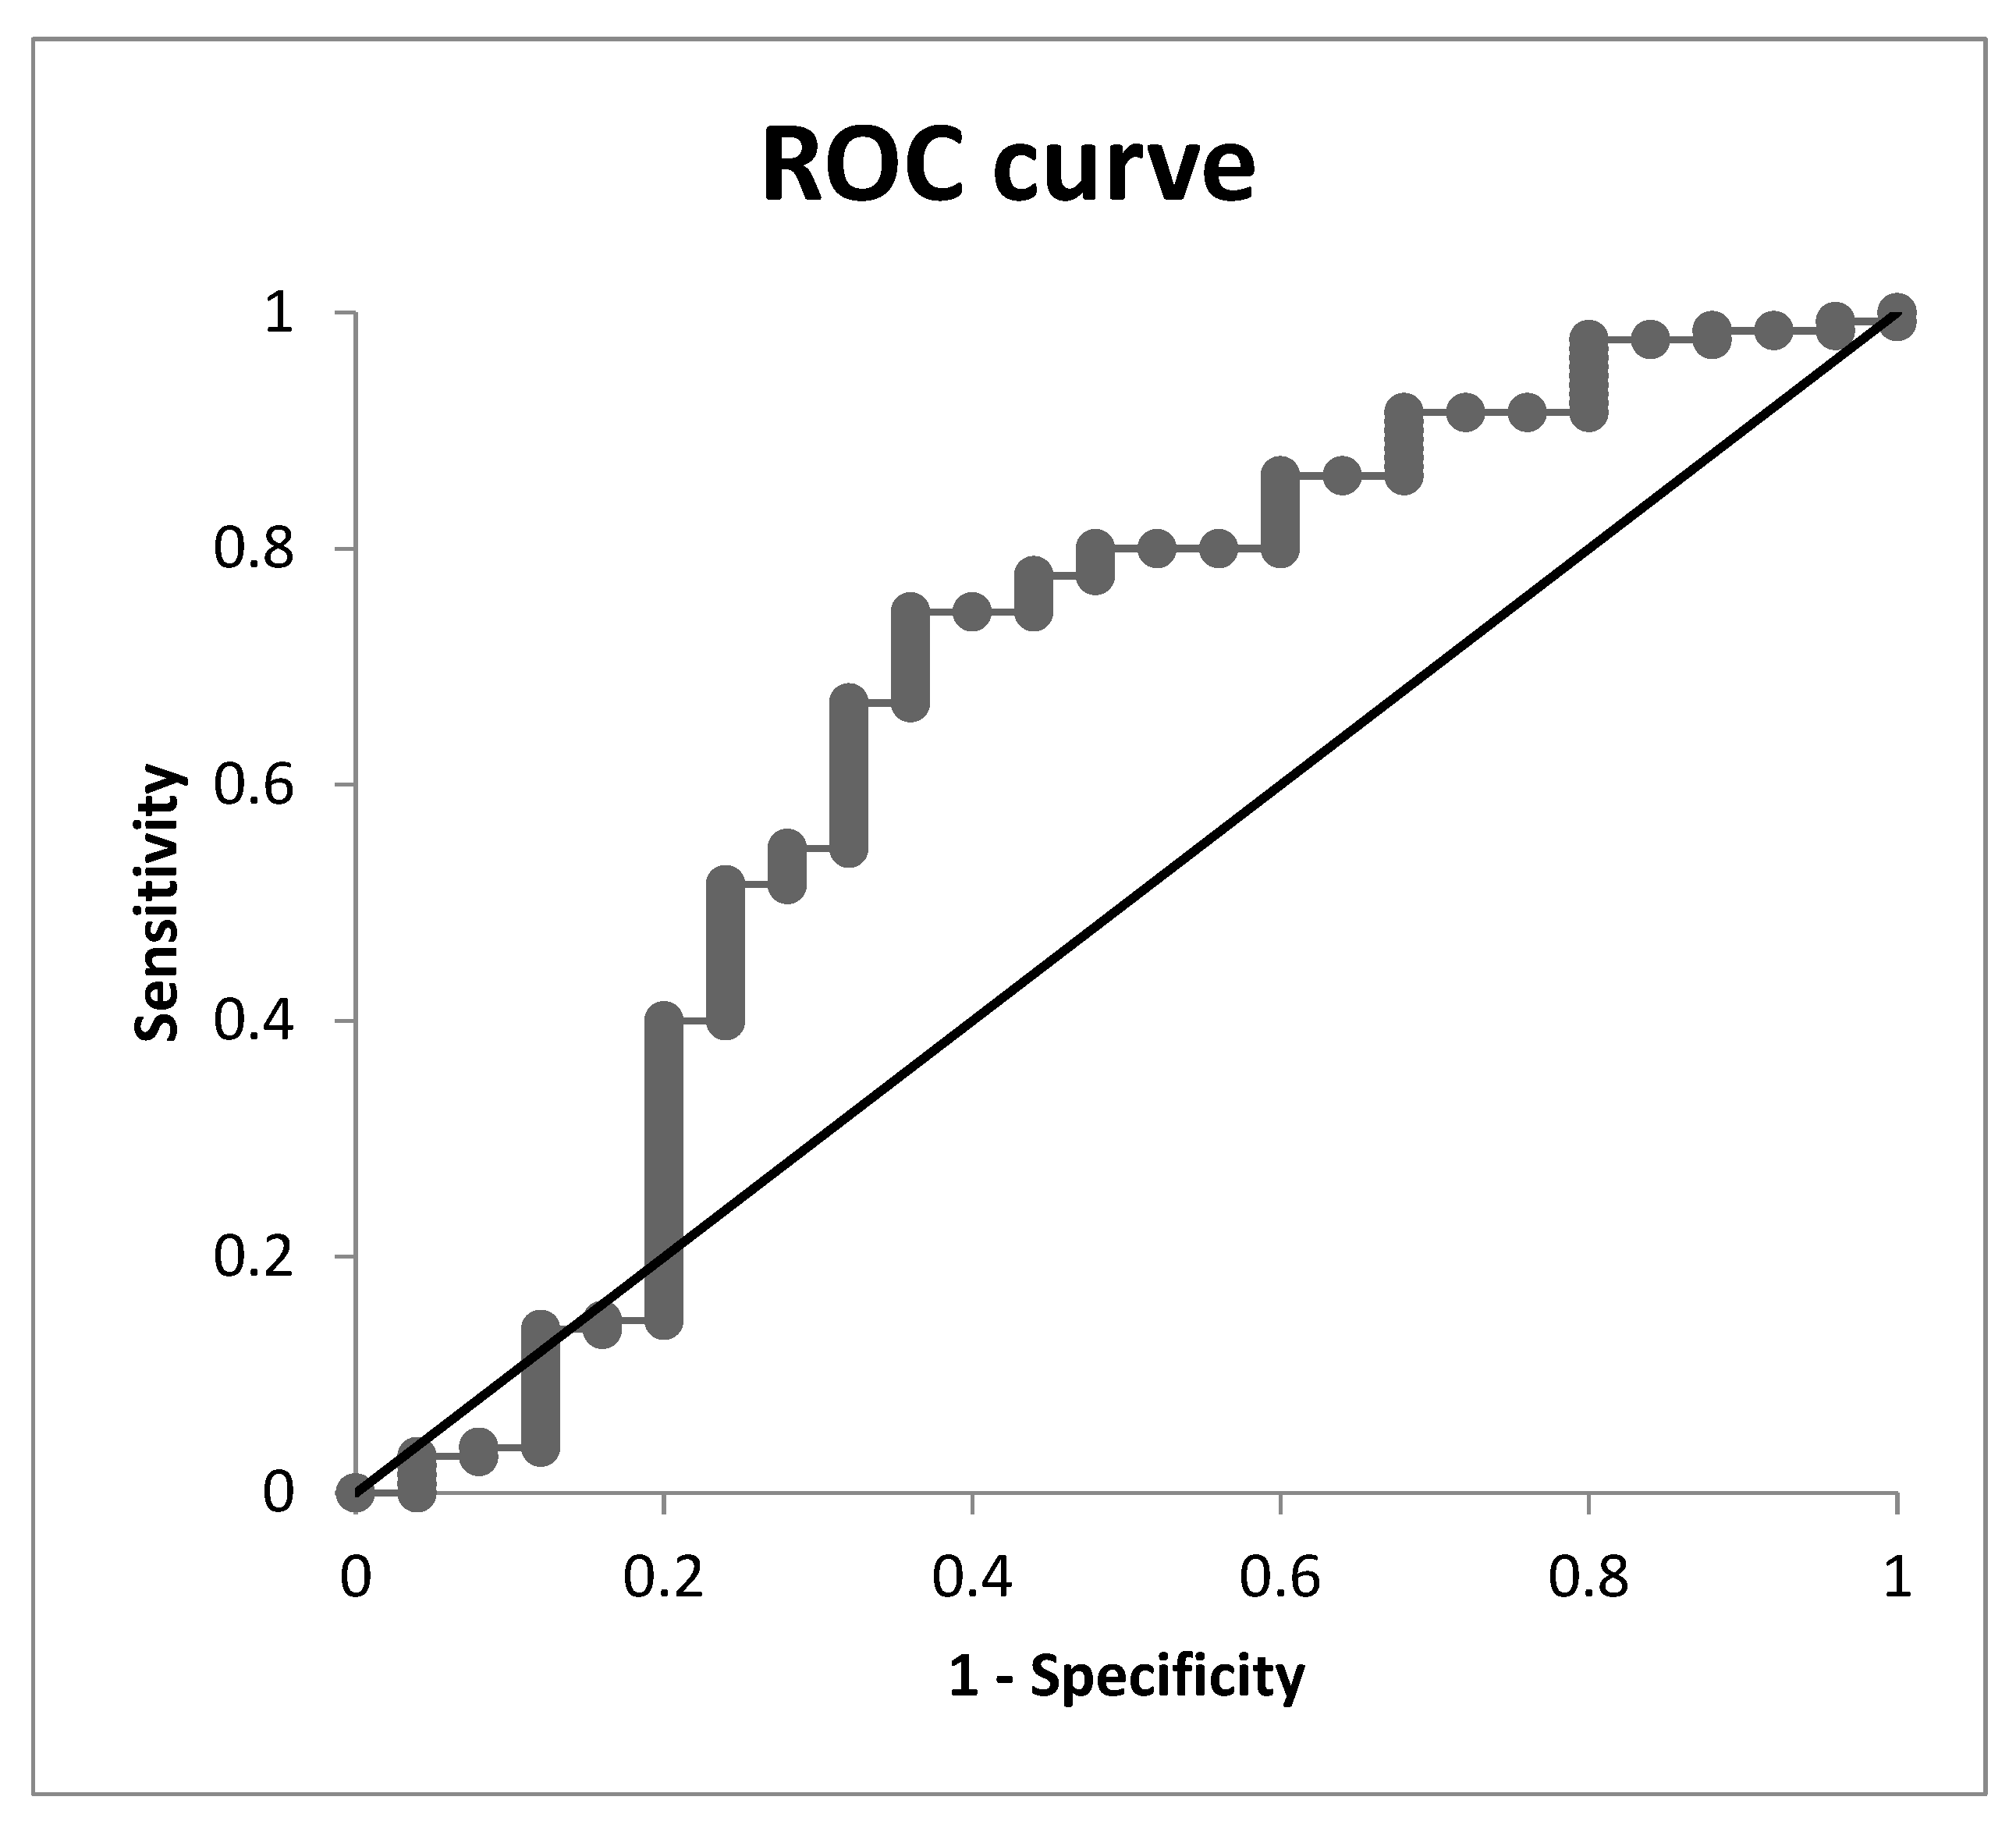
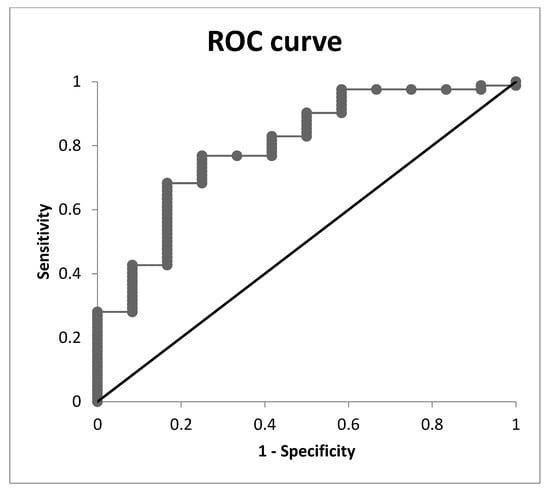
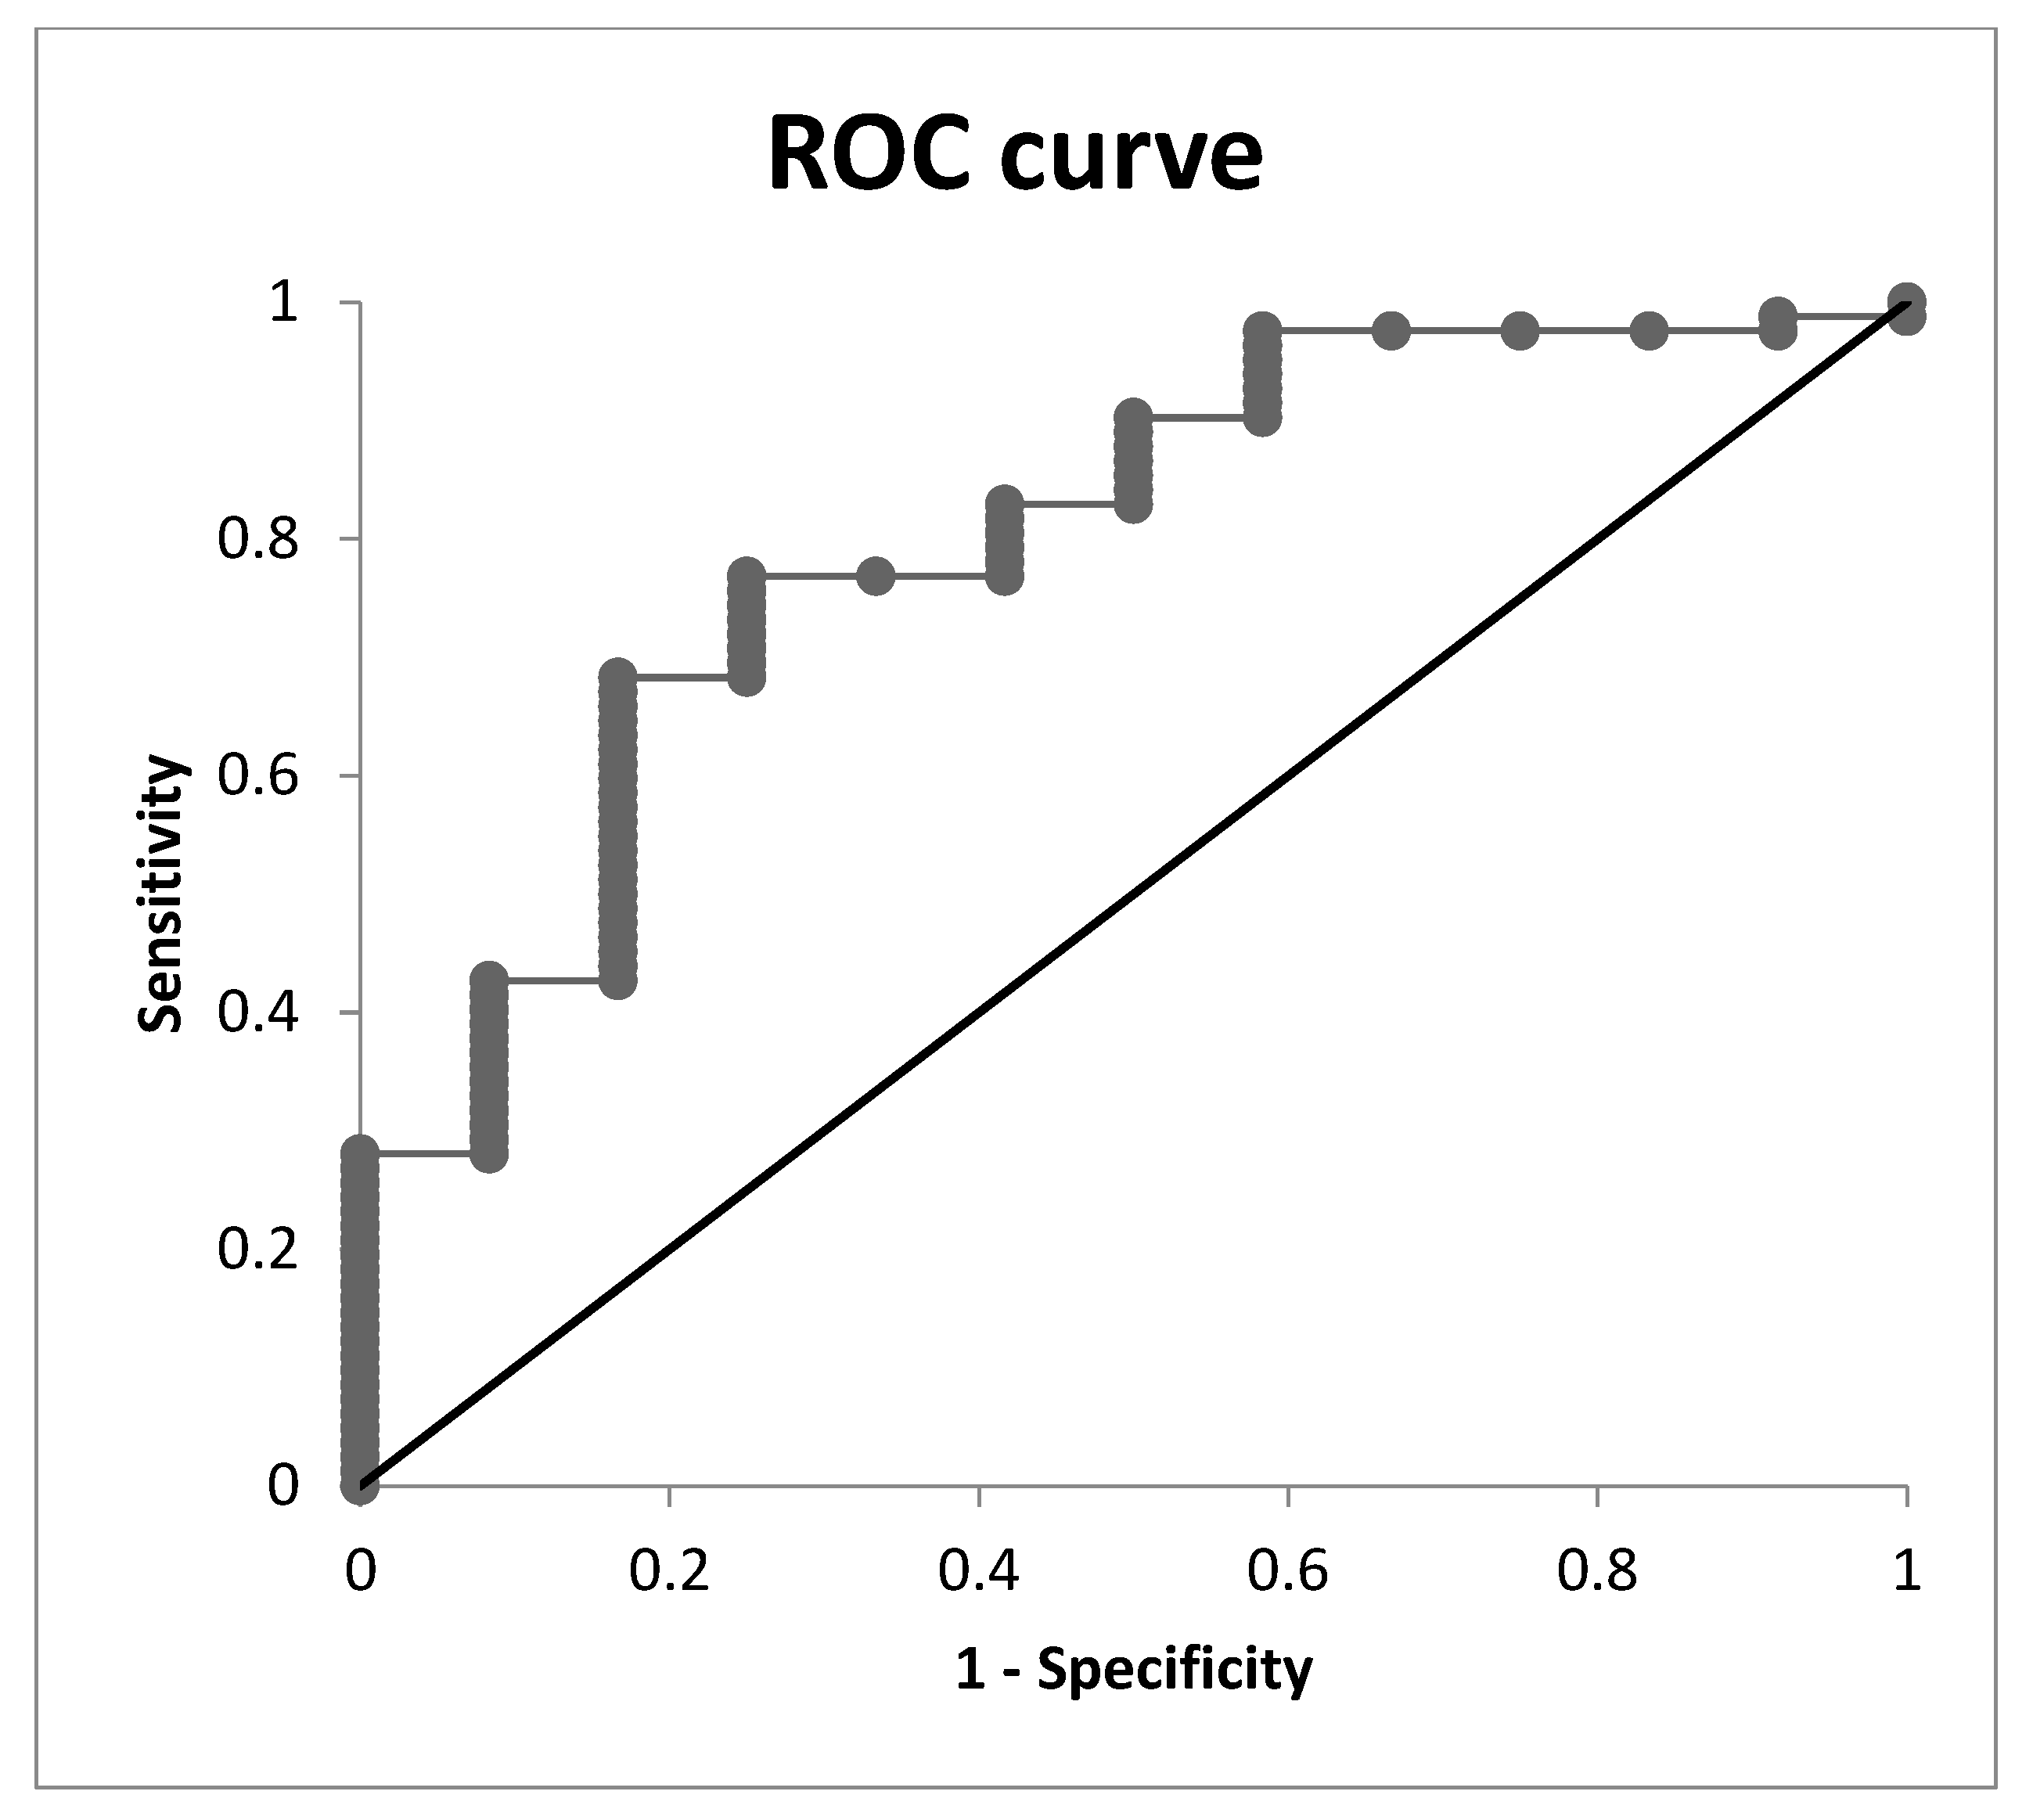
To evaluate METS-VF’s ability to discriminate patients with MASLD, we performed receiver operating characteristic (ROC) analysis (Table 6). To determine the optimal cutoff value between sensitivity and specificity, we calculated the Youden index for all possible cutoff values and selected the point with the highest index value. In the whole group, METS-VF showed an AUC of 0.661, with an optimal cutoff score of 7.66, a sensitivity of 0.746, and a specificity of 0.640 (Figure 6).
Table 6.
The AUC for METS-VF to discriminate MASLD patients in the whole population and in sex-stratified analysis.
Figure 6.
The ROC curve of the logistic regression model for the predictive value of METS-VF to discriminate patients with MASLD in the whole group.
METS-VF performed best in females, with an AUC of 0.795, a cutoff of 7.59, a sensitivity of 0.768, and a specificity of 0.750 (Figure 7).
Figure 7.
The ROC curve of the logistic regression model for the predictive value of METS-VF to discriminate patients with MASLD in the female group.
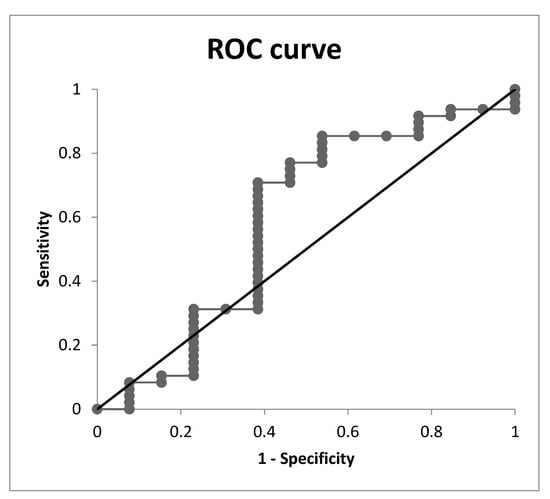
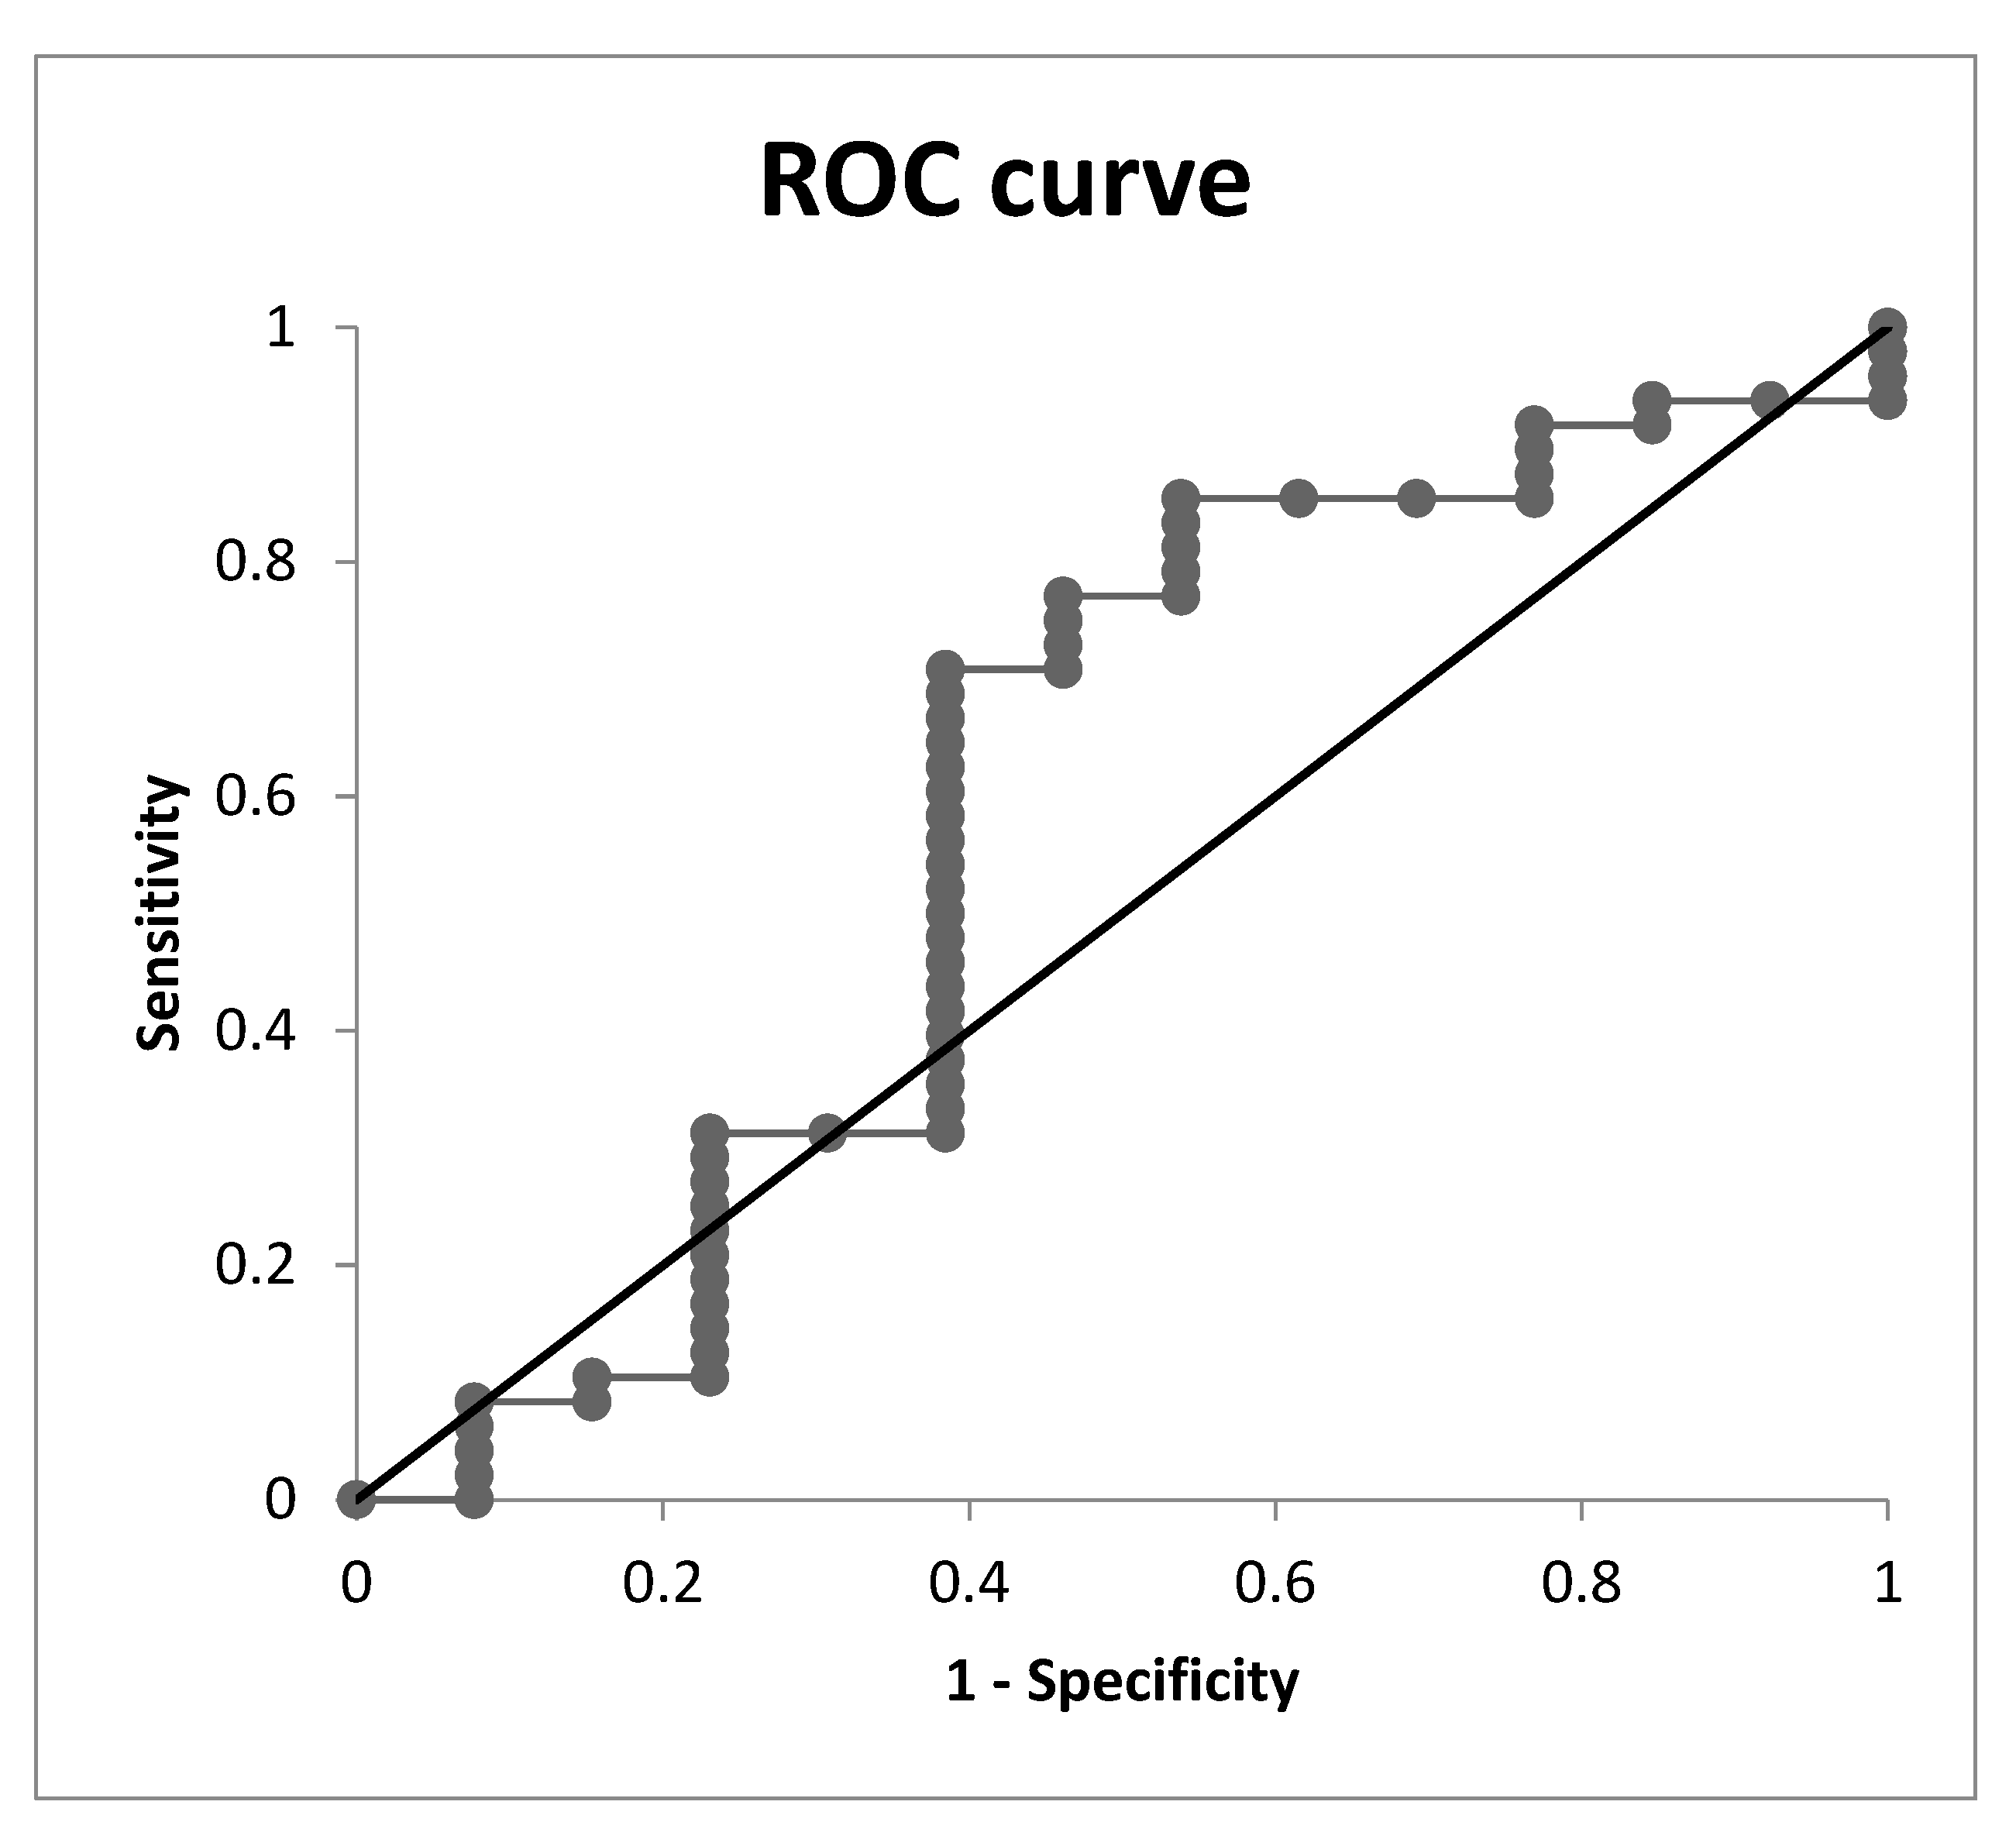
In males, the AUC was 0.588, and the diagnostic performance was not significant (Figure 8).
Figure 8.
The ROC curve of the logistic regression model for the predictive value of METS-VF to discriminate patients with MASLD in the male group.
These findings indicate that METS-VF can reasonably discriminate patients with MASLD only in females.
4. Discussion
We aimed to evaluate the diagnostic performance of the METS-VF index for diagnosing MASLD in patients with newly diagnosed T2DM or prediabetic states, or patients initially treated with antidiabetic medication. Based on their laboratory markers, patients underwent plain abdominal ultrasonography for preliminary diagnosis of MASLD; afterward, VCTE was performed to confirm the diagnosis.
First, we found significant differences between groups across METS-VF tertiles in CAP, HSI, BMI, waist circumference, waist/height ratio, total body fat %, android/gynoid ratio, ALM/height2, HOMA index, insulin, Vitamin D, HDL cholesterol, and triglyceride levels. Differences in LSM fibrosis score approached statistical significance. Because FBG, triglycerides, BMI, HDL cholesterol, WHtR and age are included in METS-VF, differences across tertiles are expected in these parameters.
METS-VF was positively correlated with android fat % and total body fat % in all groups; with AGR, ALM/height2, CAP, uric acid, and HOMA index in the whole group and the female group; and negatively correlated with HDL cholesterol in the whole group and the female group; and with vitamin D levels in the whole group.
To evaluate the contribution of METS-VF to MASLD, as assessed by CAP after adjusting for potential confounders, we constructed multiple linear regression models. Consequently, we prepared ROC curves for the specificity and sensitivity of the calculated CAP, using a cutoff of 248 dB/m for directly measured CAP or HSI = 36 as the classifier for liver steatosis. Among models with HSI as a classifier, the best-performing model included age alone, with an AUC of 0.874 (95% CI 0.79–0.96). In the model including the HOMA index, the AUC was 0.793 (95% CI 0.67–0.91) in the whole group. Our models indicate that METS-VF, along with the HOMA index, has clinically valuable diagnostic accuracy for MASLD diagnosis, as assessed by CAP, and that the relationship between METS-VF and CAP appears independent of the HOMA index. These results highlight a substantial contribution of the parameters included in METS-VF to the diagnosis of MASLD as evaluated by CAP.
After identifying the relationships between CAP and METS-VF using logistic regression, we evaluated METS-VF’s discriminative ability to distinguish patients with steatosis. Because ultrasonography has lower diagnostic value for MASLD than VCTE, we included patients with CAP < 248 dB/m as the control group in the logistic regression analysis. Each 1 SD increase in METS-VF was related to a 1.63-fold greater chance (95% CI: 1.08–2.46, p ≤ 0.02) of MASLD, as assessed by CAP. In the sex-stratified analysis, each 1 SD increment was associated with 2.31-fold higher MASLD odds in females (95% CI: 1.20–4.44, p ≤ 0.01); however, in males, the relationship was no longer statistically significant (OR = 1.41, 95% CI: 0.76–2.62, p = 0.27).
To evaluate METS-VF’s ability to discriminate patients with MASLD, we calculated the AUC. In the whole group, METS-VF had an AUC of 0.661 (95% CI 0.53–0.79) and performed best in females, with an AUC of 0.795 (95% CI 0.66–0.93). In males, the AUC was 0.588 (95% CI 0.39–0.79), so diagnostic performance was not significant (p = 0.27). These findings indicate that, according to our analysis, METS-VF had a reasonable ability to correctly discriminate patients with MASLD, but with high performance only in the female group. The non-significant diagnostic value in the male group may also be caused by a relatively small number of patients and wide confidence intervals in this group.
Regarding the predictive value of METS-VF for assessing visceral adipose tissue (VAT), Bello-Chavolla et al. reported in their validation study that METS-VF showed a strong correlation with lower adiponectin and higher FGF-21 levels; therefore, METS-VF classifies patients according to metabolic profiles of increased VAT [20]. Kapoor et al. found a significant correlation between METS-VF and the VAT area as measured by DXA (r = 0.517, 95% CI: 0.31–0.67, p < 0.001), with an AUC of 0.782 (95% CI: 0.72–0.85) and optimal cutoff value of 7.3, with a sensitivity of 86.2% and specificity of 59.8% for the ability of METS-VF to predict VAT [22].
The improved performance of METS-VF in discriminating patients with increased VAT compared with its components alone may also be because anthropometric indices such as BMI, WHR, WHtR, and WC explain variability in both subcutaneous and visceral adipose tissue, thereby overestimating the effect of visceral adiposity [30]. In addition, including a component that evaluates the degree of IR in the equation may improve VAT estimation in patients without significant laboratory disturbances attributable to VAT [31]. Based on this, METS-VF has shown superiority over the EVA index, recently validated by Wander et al. [32].
The advantage of METS-VF over VAI and LAP, as validated in the last decade, is that the validity of these indices may be affected by ethnic-specific variations in body composition [33,34].
Notably, the Hepatic Steatosis Index (HSI) and Fatty Liver Index (FLI) are widely used to screen for MASLD in clinical settings. On the one hand, HSI takes into consideration liver enzyme levels, BMI, and the presence of clinically diagnosed T2DM; on the other hand, FLI assesses BMI, waist circumference, triglyceride and GGT levels, but neither of them assesses the degree of insulin resistance and the derangements in glucose metabolism at a subclinical level.
In this context, several mechanisms have been proposed to explain the relationship between MASLD and the METS-VF index. METS-VF is an indicator of abdominal obesity, which correlates with chronic inflammation, adipocyte dysfunction with compromised adiponectin production, and increased insulin resistance. These processes increase FFA and cytokine (Il-6, Il-8, TNF-) release into the bloodstream, followed by FFA accumulation in the liver [35]. As a consequence, oxidative stress promotes increased fibrogenesis in hepatic stellate cells via lipid peroxidation and leptin via Toll-like receptor 4 [36]. Consequently, glycogen synthesis and glucose oxidation in the liver are also compromised [37]. Thus, central obesity is associated with pronounced histological progression of MASLD in individuals with significant visceral fat accumulation.
In our study, we found a cutoff value of 7.66 for the calculated AUC of 0.661, with an optimal sensitivity of 0.746 and an optimal specificity of 0.64 in the whole group, and a cutoff value of 7.59 for the calculated AUC of 0.795, with an optimal sensitivity of 0.768 and an optimal specificity of 0.75 in the female group. In the male group, the calculated AUC was 0.618; the cutoff was 7.79, with an optimal sensitivity of 0.77 and an optimal specificity of 0.538. These cutoff values are higher than those reported by Kuang et al. (5.80 in females and 6.22 in males) in South Asian individuals [27]. The differences found may be attributed to ethnic-specific differences, in particular to a higher propensity of individuals in the Asian population to develop metabolic disturbances at a lower degree of obesity [38]. The above-mentioned authors evaluated the association between METS-VF and non-alcoholic fatty liver disease (NAFLD) across age groups in a sex-stratified cross-sectional analysis based on typical ultrasonographic findings and using HSI and FLI to classify NAFLD [27]. They were the first to report a significant positive correlation between METS-VF and NAFLD, with METS-VF emerging as an independent predictor, and concluded that METS-VF surpassed other VAT surrogate markers in diagnostic efficacy for NAFLD. They also found that age significantly affected the METS-VF-related odds of NAFLD and METS-VF’s diagnostic performance for NAFLD in both sexes. Consistent with our results, the ROC analysis showed that, compared with other VAT surrogate markers, METS-VF had the highest diagnostic accuracy for NAFLD in females.
Gender differences in METS-VF diagnostic performance may be partly explained by differences in fat deposition patterns, where estrogen’s protective effect in women of childbearing age promotes adipose deposition in the thighs and hips rather than visceral organs. Some in vitro studies suggest that estrogen’s protective effect involves inhibiting visceral fat cell proliferation, reducing hepatic lipid accumulation by enhancing hepatocyte mitochondrial function, and counterbalancing leptin resistance and testosterone-induced adiponectin suppression [39]. However, because this effect gradually declines with age in females by 60 years, MASLD odds are higher in older age groups, similar to males, and are driven by VAT in combination with age. These findings suggest that we should be aware of gender differences in MASLD diagnosis and management [40].
Our findings highlight the importance of METS-VF as a cost-effective, practical tool for identifying women at risk of MASLD because it uses simple, readily available clinical parameters, whereas transient elastography is often unavailable in most clinical settings. However, the diagnostic value of METS-VF for MASLD needs validation in prospective studies with external validation.
Notably, according to Bello-Chavolla et al., patients who developed T2DM and hypertension had higher METS-VF values at baseline independent of BMI, suggesting a possible clinical application of this index in subjects for whom BMI may be insufficient for cardio-metabolic risk assessment [20].
The major strength of our study is that we evaluated these associations in the Slovak (European) population only and took into account a wide variety of potential confounders. This eliminated racial differences in body composition and minimised their confounding effect. Furthermore, the diagnosis of MASLD was confirmed by VCTE (FibroScan®), which is a non-invasive alternative to liver biopsy, also regarding the assessment of the degree of steatosis. To the best of our knowledge, this is the first study to evaluate the discriminative capacity of METS-VF in patients in whom VCTE established the diagnosis of MASLD.
The main limitation of our study is its cross-sectional design, which does not allow definitive conclusions about causality and makes longitudinal studies necessary to clarify the diagnostic capacity of METS-VF. Second, our analysis was a single-centre study conducted exclusively in a Caucasian population, with a relatively small number of participants, and it lacked external validation and long-term clinical outcomes. In addition, the diagnosis of MASLD was not confirmed by liver biopsy. Notably, the HSI used in our investigation is a screening instrument approved by EASL for large-scale studies. It has very high predictive value, taking into consideration the diagnosis of diabetes and reflecting not only the likelihood of MASLD but also the degree of steatosis. However, HSI is a surrogate index and shares metabolic and anthropometric components with METS-VF.
Third, excluding patients taking medications with a potential causal effect on MASLD treatment may limit the applicability of our findings to patients on these therapeutic regimens, as they may be less likely to develop MASLD. Fourth, we did not assess chronic inflammation markers as potential confounders. Fifth, we did not account for diet, physical activity, or diabetes duration.
5. Conclusions
METS-VF showed a significant positive correlation with CAP as a measure of MASLD evaluated by VTCE and with parameters reflecting visceral adipose tissue. Our models indicated that METS-VF, along with the HOMA index, has clinically valuable discriminative capacity for diagnosing MASLD, as assessed by CAP in females, and that the relationship between METS-VF and CAP appears independent of the HOMA index. Our findings underscore a substantial contribution of the parameters included in METS-VF to the diagnosis of MASLD. In summary, our study is the first to show that METS-VF can reasonably discriminate patients with MASLD identified by CAP on transient elastography and may have clinical value, with higher performance in the female group; performance in males is lower. More prospective studies with larger sample sizes are needed to confirm these findings.
Supplementary Materials
The following supporting information can be downloaded at: https://www.mdpi.com/article/10.3390/diseases14110434/s1. Figure S1: n = number of participants in the cross-sectional study, with the numbers of recruited and evaluated patients during the phases of enrollment to the study.
Author Contributions
The corresponding author certifies that the final version of the manuscript submitted was approved by all authors and by the responsible authorities. They warrant that the article is their original work, has not received prior publication, and is not under consideration for publication elsewhere. E.F. conceived the idea, determined the study design, collected the data, performed the statistical analysis, and drafted and revised the manuscript. M.K. drafted and revised the manuscript as an endocrinology expert. T.K. performed the FibroScan measurements, collected the data as a specialist in Hepatology, and drafted the manuscript. I.L. drafted and revised the manuscript. All authors have read and agreed to the published version of the manuscript.
Funding
This research received no external funding.
Institutional Review Board Statement
The study received approval from the University Hospital Ethical Committee (Etická komisia pri Univerzitnej nemocnici Louisa Pasteura Košice), approval No. 529-165/EK/21, issued on 30 October 2021 and is in line with the principles of the Declaration of Helsinki. All patients provided informed consent to participate in the study.
Informed Consent Statement
Patients participated in the study after providing informed consent.
Data Availability Statement
The datasets used and/or analysed during the current study are available from the corresponding author on reasonable request. Access to data is possible only for persons authorised by the University Hospital Ethical Committee.
Acknowledgments
The authors are indebted to Slávka Pacáková for performing DXA scans.
Conflicts of Interest
The authors declare no conflicts of interest.
Abbreviations
| MASLD | Metabolic dysfunction-associated steatotic liver disease |
| VAT | visceral adipose tissue |
| VAI | visceral adipose index |
| LAP | lipid accumulation product |
| METS-VF | Metabolic Score for Visceral Fat |
| FLI | Fatty Liver Index |
| HSI | Hepatic Steatosis Index |
| CAP | Controlled Attenuation Parameter |
| VCTE | Vibration-controlled transient elastography |
| DXA | Dual-energy X-ray absorptiometry |
| HOMA-IR | Homeostasis Model Assessment index |
| AUC | Area Under the Curve |
| ROC | Receiver operating characteristic |
| FM | fat mass |
| LM | lean mass |
| LAM | lean arm mass |
| LLM | lean leg mass |
| % BF | total body fat ratio |
| AGR | android to gynoid fat ratio |
| ALM | appendicular lean mass |
| ALMI | appendicular lean mass index |
| DPP-4 | Inhibitors of dipeptidyl peptidase 4 |
| GLP-1 | Glucagon-like peptide-1 (GLP-1) receptor agonist |
| SGLT2 | Sodium-dependent glucose cotransporter |
References
- Chalasani, N.; Younossi, Z.; Lavine, J.E.; Charlton, M.; Cusi, K.; Rinella, M.; Harrison, S.A.; Brunt, E.M.; Sanyal, A.J. The diagnosis and management of nonalcoholic fatty liver disease: Practice guidance from the American Association for the Study of Liver Diseases. Hepatology 2018, 67, 328–357. [Google Scholar] [CrossRef] [Scilit] [PubMed]
- Wong, M.C.S.; Huang, J.; Wang, J.; Chan, P.S.F.; Lok, V.; Chen, X.; Leung, C.; Wang, H.H.X.; Lao, X.Q.; Zheng, Z.J. Global, regional and time-trend prevalence of central obesity: A systematic review and meta-analysis of 13.2 million subjects. Eur. J. Epidemiol. 2020, 35, 673–683. [Google Scholar] [CrossRef] [Scilit] [PubMed]
- Powell, E.E.; Wong, V.W.; Rinella, M. Non-alcoholic fatty liver disease. Lancet 2021, 397, 2212–2224. [Google Scholar] [CrossRef] [Scilit] [PubMed]
- Chan, W.K.; Chuah, K.H.; Rajaram, R.B.; Lim, L.L.; Ratnasingam, J.; Vethakkan, S.R. Metabolic Dysfunction-Associated Steatotic Liver Disease (MASLD): A State-of-the-Art Review. J. Obes. Metab. Syndr. 2023, 32, 197–213. [Google Scholar] [CrossRef] [Scilit] [PubMed]
- Fraenkel, E.; Koky, T.; Štellmach, S.; Lazúrová, I. Associations between DXA-derived parameters of body composition and metabolic dysfunction-associated steatotic liver disease in patients with T2DM and prediabetic states. Minerva Endocrinol. 2026, 51, 136–149. [Google Scholar] [CrossRef] [Scilit] [PubMed]
- European Association for the Study of the Liver (EASL); European Association for the Study of Diabetes (EASD); European Association for the Study of Obesity (EASO). EASL-EASD-EASO Clinical Practice Guidelines on the management of metabolic dysfunction-associated steatotic liver disease (MASLD). J. Hepatol. 2024, 81, 492–542. [Google Scholar] [CrossRef] [Scilit] [PubMed]
- Rotaru, A.; Stratina, E.; Huiban, L.; Girleanu, I.; Minea, H.; Sfarti, C.; Chiriac, S.; Trifan, A.V. Beyond BMI: Revealing metabolic risk in lean MASLD. Arch. Clin. Cases 2025, 12, 110–118. [Google Scholar] [CrossRef] [Scilit] [PubMed]
- Kim, H.K.; Bae, S.J.; Lee, M.J.; Kim, E.H.; Park, H.; Kim, H.S.; Cho, Y.K.; Jung, C.H.; Lee, W.J.; Choe, J. Association of Visceral Fat Obesity, Sarcopenia, and Myosteatosis with Non-Alcoholic Fatty Liver Disease without Obesity. Clin. Mol. Hepatol. 2023, 29, 987–1001. [Google Scholar] [CrossRef] [Scilit] [PubMed]
- Kumar, A.; Arora, A.; Sharma, P.; Jan, S.; Ara, I. Visceral Fat and Diabetes: Associations With Liver Fibrosis in Metabolic Dysfunction-Associated Steatotic Liver Disease. J. Clin. Exp. Hepatol. 2025, 15, 102378. [Google Scholar] [CrossRef] [Scilit] [PubMed]
- Hanlon, C.L.; Yuan, L. Nonalcoholic Fatty Liver Disease: The Role of Visceral Adipose Tissue. Clin. Liver Dis. 2022, 19, 106–110. [Google Scholar] [CrossRef] [Scilit] [PubMed]
- Yu, S.J.; Kim, W.; Kim, D.; Yoon, J.H.; Lee, K.; Kim, J.H.; Cho, E.J.; Lee, J.H.; Kim, H.Y.; Kim, Y.J.; et al. Visceral Obesity Predicts Significant Fibrosis in Patients With Nonalcoholic Fatty Liver Disease. Medicine 2015, 94, e2159. [Google Scholar] [CrossRef] [Scilit] [PubMed]
- Mai, Z.; Chen, Y.; Mao, H.; Wang, L. Association between the skeletal muscle mass to visceral fat area ratio and metabolic dysfunction-associated fatty liver disease: A cross-sectional study of NHANES 2017–2018. J. Diabetes 2024, 16, e13569. [Google Scholar] [CrossRef] [Scilit] [PubMed]
- Lee, J.J.; Pedley, A.; Hoffmann, U.; Massaro, J.M.; Levy, D.; Long, M.T. Visceral and Intrahepatic Fat Are Associated with Cardiometabolic Risk Factors Above Other Ectopic Fat Depots: The Framingham Heart Study. Am. J. Med. 2018, 131, 684–692.e12. [Google Scholar] [CrossRef] [Scilit] [PubMed]
- Flagiello, V.; Gallo, P.; Terracciani, F.; Falcomatà, A.; De Vincentis, A.; Pasquale, G.D.; Avagliano, J.; Tavaglione, F.; Sparapano, S.; Daniels, S.J.; et al. Ultrasound-derived visceral adipose tissue as a reliable marker of hepato-metabolic risk in patients with MASLD. Dig. Liver Dis. 2026, 58, 113–118. [Google Scholar] [CrossRef] [Scilit] [PubMed]
- Perna, S.; Mazzola, G.; Patta, E.; Rondanelli, M. DXA-derived regional adiposity identifies hidden liver-metabolic risk beyond BMI in non-obese older adults: A cross-sectional study. Clin. Nutr. ESPEN 2026, 75, 103385. [Google Scholar] [CrossRef] [Scilit] [PubMed]
- Ismaiel, A.; Jaaouani, A.; Leucuta, D.C.; Popa, S.L.; Dumitrascu, D.L. The Visceral Adiposity Index in Non-Alcoholic Fatty Liver Disease and Liver Fibrosis-Systematic Review and Meta-Analysis. Biomedicines 2021, 9, 1890. [Google Scholar] [CrossRef] [Scilit] [PubMed]
- Zhou, T.; Ding, X.; Chen, L.; Huang, Q.; He, L. Visceral adiposity index as a predictor of metabolic dysfunction-associated steatotic liver disease: A cross-sectional study. BMC Gastroenterol. 2025, 25, 326. [Google Scholar] [CrossRef] [Scilit] [PubMed]
- Mari, L.; Lazzer, S.; Gatti, A.; D’Alleva, M.; Zaccaron, S.; Stafuzza, J.; Rejc, E.; Vandoni, M.; Bondesan, A.; Caroli, D.; et al. Visceral Adiposity, Anthropometric and Liver Function Indexes for Identifying Metabolic Dysfunction Associated Steatotic Liver Disease (MASLD) in Adolescents with Obesity: Which Performs Better? J. Clin. Med. 2025, 14, 2085. [Google Scholar] [CrossRef] [Scilit] [PubMed]
- Bansal, S.; Vachher, M.; Arora, T.; Kumar, B.; Burman, A. Visceral fat: A key mediator of NAFLD development and progression. Human. Nutr. Metab. 2023, 33, 200210. [Google Scholar] [CrossRef] [Scilit]
- Bello-Chavolla, O.Y.; Antonio-Villa, N.E.; Vargas-Vázquez, A.; Viveros-Ruiz, T.L.; Almeda-Valdés, P.; Gómez-Velasco, D.; Mehta, R.; Elías-López, D.; Cruz-Bautista, I.; Roldán-Valadez, E.; et al. Metabolic Score for Visceral Fat (METS-VF), a novel estimator of intra-abdominal fat content and cardio-metabolic health. Clin. Nutr. 2020, 39, 1613–1621. [Google Scholar] [CrossRef] [Scilit] [PubMed]
- Thomson, E.S.; Oommen, A.T.; SSV; Pillai, G. Comparison of Non-invasive Liver Fat Scoring Systems as Markers of Metabolic Dysfunction-Associated Liver Disease. Cureus 2024, 16, e72222. [Google Scholar] [CrossRef] [Scilit] [PubMed]
- Kapoor, N.; Jiwanmall, S.A.; Nandyal, M.B.; Kattula, D.; Paravathareddy, S.; Paul, T.V.; Furler, J.; Oldenburg, B.; Thomas, N. Metabolic Score for Visceral Fat (METS-VF) Estimation—A Novel Cost-Effective Obesity Indicator for Visceral Adipose Tissue Estimation. Diabetes Metab. Syndr. Obes. 2020, 13, 3261–3267. [Google Scholar] [CrossRef] [Scilit] [PubMed]
- Feng, Y.; Yang, X.; Li, Y.; Wu, Y.; Han, M.; Qie, R.; Huang, S.; Wu, X.; Zhang, Y.; Zhang, J.; et al. Metabolic Score for Visceral Fat: A novel predictor for the risk of type 2 diabetes mellitus. Br. J. Nutr. 2022, 128, 1029–1036. [Google Scholar] [CrossRef] [Scilit] [PubMed]
- Feng, Y.; Yang, X.; Li, Y.; Wu, Y.; Han, M.; Qie, R.; Huang, S.; Wu, X.; Zhang, Y.; Liu, D.; et al. Metabolic Score for Visceral Fat: A reliable indicator of visceral obesity for predicting risk for hypertension. Nutrition 2022, 93, 111443. [Google Scholar] [CrossRef] [Scilit] [PubMed]
- Liu, X.Z.; Chen, D.S.; Xu, X.; Li, H.H.; Liu, L.Y.; Zhou, L.; Fan, J. Longitudinal associations between metabolic score for visceral fat and hyperuricemia in non-obese adults. Nutr. Metab. Cardiovasc. Dis. 2020, 30, 1751–1757. [Google Scholar] [CrossRef] [Scilit] [PubMed]
- Yu, P.; Meng, X.; Kan, R.; Wang, Z.; Yu, X. Association between metabolic scores for visceral fat and chronic kidney disease: A cross-sectional study. Front. Endocrinol. 2022, 13, 1052736. [Google Scholar] [CrossRef] [Scilit] [PubMed]
- Kuang, M.; Qiu, J.; Li, D.; Hu, C.; Zhang, S.; Sheng, G.; Zou, Y. The newly proposed Metabolic Score for Visceral Fat is a reliable tool for identifying non-alcoholic fatty liver disease, requiring attention to age-specific effects in both sexes. Front. Endocrinol. 2023, 14, 1281524. [Google Scholar] [CrossRef] [Scilit] [PubMed]
- Lee, J.H.; Kim, D.; Kim, H.J.; Lee, C.H.; Yang, J.I.; Kim, W.; Kim, Y.J.; Yoon, J.H.; Cho, S.H.; Sung, M.W.; et al. Hepatic steatosis index: A simple screening tool reflecting nonalcoholic fatty liver disease. Dig. Liver Dis. 2010, 42, 503–508. [Google Scholar] [CrossRef] [Scilit] [PubMed]
- Lee, J.; Vali, Y.; Boursier, J.; Spijker, R.; Anstee, Q.M.; Bossuyt, P.M.; Zafarmand, M.H. Prognostic accuracy of FIB-4, NAFLD fibrosis score and APRI for NAFLD-related events: A systematic review. Liver Int. 2021, 41, 261–270. [Google Scholar] [CrossRef] [Scilit] [PubMed]
- Duren, D.L.; Sherwood, R.J.; Czerwinski, S.A.; Lee, M.; Choh, A.C.; Siervogel, R.M.; Cameron Chumlea, W. Body composition methods: Comparisons and interpretation. J. Diabetes Sci. Technol. 2008, 2, 1139–1146. [Google Scholar] [CrossRef] [Scilit] [PubMed]
- Pinho, C.P.S.; Diniz, A.D.S.; de Arruda, I.K.G.; Leite, A.P.D.L.; Petribú, M.M.V.; Rodrigues, I.G. Predictive models for estimating visceral fat: The contribution from anthropometric parameters. PLoS ONE 2017, 12, e0178958. [Google Scholar] [CrossRef] [Scilit] [PubMed]
- Wander, P.L.; Hayashi, T.; Sato, K.K.; Uehara, S.; Hikita, Y.; Leonetti, D.L.; Kahn, S.E.; Fujimoto, W.Y.; Boyko, E.J. Design and validation of a novel estimator of visceral adipose tissue area and comparison to existing adiposity surrogates. J. Diabetes Complicat. 2018, 32, 1062–1067. [Google Scholar] [CrossRef] [Scilit] [PubMed]
- Amato, M.C.; Giordano, C.; Galia, M.; Criscimanna, A.; Vitabile, S.; Midiri, M.; Galluzzo, A.; AlkaMeSy Study Group. Visceral Adiposity Index: A reliable indicator of visceral fat function associated with cardiometabolic risk. Diabetes Care 2010, 33, 920–922. [Google Scholar] [PubMed]
- Li, H.; Zhang, Y.; Luo, H.; Lin, R. The lipid accumulation product is a powerful tool to diagnose metabolic dysfunction-associated fatty liver disease in the United States adults. Front. Endocrinol. 2022, 13, 977625. [Google Scholar] [CrossRef] [Scilit] [PubMed]
- Syed-Abdul, M.M. Lipid Metabolism in Metabolic-Associated Steatotic Liver Disease (MASLD). Metabolites 2023, 14, 12. [Google Scholar] [CrossRef] [Scilit] [PubMed]
- Polyzos, S.A.; Kountouras, J.; Mantzoros, C.S. Obesity and nonalcoholic fatty liver disease: From pathophysiology to therapeutics. Metabolism 2019, 92, 82–97. [Google Scholar] [CrossRef] [Scilit] [PubMed]
- Fujii, H.; Kawada, N.; Japan Study Group of NAFLD (Jsg-NAFLD). The Role of Insulin Resistance and Diabetes in Nonalcoholic Fatty Liver Disease. Int. J. Mol. Sci. 2020, 21, 3863. [Google Scholar] [PubMed]
- Kapoor, N.; Furler, J.; Paul, T.V.; Thomas, N.; Oldenburg, B. Normal Weight Obesity: An Underrecognized Problem in Individuals of South Asian Descent. Clin. Ther. 2019, 41, 1638–1642. [Google Scholar] [CrossRef] [Scilit] [PubMed]
- Bjune, J.I.; Strømland, P.P.; Jersin, R.Å.; Mellgren, G.; Dankel, S.N. Metabolic and Epigenetic Regulation by Estrogen in Adipocytes. Front. Endocrinol. 2022, 13, 828780. [Google Scholar] [CrossRef] [Scilit] [PubMed]
- Lonardo, A.; Suzuki, A. Sexual Dimorphism of NAFLD in Adults. Focus on Clinical Aspects and Implications for Practice and Translational Research. J. Clin. Med. 2020, 9, 1278. [Google Scholar] [CrossRef] [Scilit] [PubMed]

Disclaimer/Publisher’s Note: The statements, opinions and data contained in all publications are solely those of the individual author(s) and contributor(s) and not of MDPI and/or the editor(s). MDPI and/or the editor(s) disclaim responsibility for any injury to people or property resulting from any ideas, methods, instructions or products referred to in the content. |
© 2026 by the authors. Licensee MDPI, Basel, Switzerland. This article is an open access article distributed under the terms and conditions of the Creative Commons Attribution (CC BY) license.