


Abstract
Software-defined networking (SDN) provides a flexible solution to manage complex networks on demand by centralized control and programmability. However, efficiently optimizing network configurations to achieve load balance and improve service quality remains challenging. In this paper, we propose a novel SDN network state awareness and dynamic routing optimization method, termed DGSFN-DR. Hereby, we leverage a Graph Attention Network (GAT) to model the spatial dependencies of the network topology for its link graph. Then, we employ a Recurrent Neural Network (RNN) to capture the temporal dependencies of link states, including the lagged temporal features induced by routing algorithms, to improve the prediction accuracy of future link states. Our algorithm dynamically adjusts routing strategies to optimize network performance according to the predicted link weights with the dual graph spatiotemporal fusion prediction network (DG-SFN). Experimental results demonstrate that our DGSFN-DR outperforms other methods in various network traffic intensities and topologies. Specifically, it achieves improvements of to in latency, jitter, packet loss, and available bandwidth. In particular, the DGSFN-DR exhibits superior adaptability and optimization potential under high traffic loads and complex network topologies. This work expands dynamic routing optimization theory for SDN and new insights for practical network management.
1. Introduction
Modern network infrastructure has become increasingly complex, posing greater demands on network management as exponential growth in network devices and the rapid increase in data traffic. Software-defined networking (SDN) offers a viable solution to address these challenges by providing centralized control and programmability [1,2]. SDN decouples the control plane from the data plane for flexibility and programmability in network operations. Network administrators can configure, monitor, and optimize network behavior through a unified control interface in SDN [3,4]. However, conventional routing algorithms based on static metrics may fail to adapt to dynamic traffic variations, leading to network congestion and a decline in Quality of Service (QoS).
Recently, deep learning techniques have shown remarkable potential for predicting network traffic, especially with complex spatiotemporal data [5]. Existing studies mainly focus on leveraging neural networks for traffic prediction to optimize routing decisions in SDN. However, challenges remain regarding scalability and real-time performance in large-scale networks. Effectively integrating traffic predictions for future network states with routing optimization techniques remains an open problem [6].
In this paper, we propose a dual-graph spatiotemporal prediction framework for SDN network state-aware dynamic routing optimization. Our method provides a granular characterization of the network’s physical and logical structure by representing the network topology as a node adjacency matrix and a link-based vertex adjacency matrix. Real-time network metrics, e.g., latency, packet loss rate, bandwidth, and jitter, are collected through the ONOS platform. We generate spatiotemporal feature embeddings for both nodes and links by a Graph Attention Network (GAT). These embeddings are organized into t-step time-series slices. Then, we fed these embeddings into a Recurrent Neural Network (RNN) for future network state prediction. We dynamically adjust the SDN routing strategies using the prediction results to determine optimal paths by minimizing link weights. Our method enhances network resource utilization to improve the QoS.
The main contributions of this paper are as follows:
- We design a dual-graph spatiotemporal prediction framework for dynamic network state prediction.
- We present a dynamic routing optimization algorithm to integrate the network state predictions for the SDN.
- Extensive experiments are conducted to evaluate the proposed method’s effectiveness in improving network performance. The experimental results demonstrate our method achieves to improvements compared with commonly-used methods.
The rest of this paper is organized as follows. In Section 2, we briefly review the related works, and the problem description is presented in Section 3. Section 4 presents a dual-graph spatiotemporal prediction framework (DG-SFP) and the routing optimization method named DGSFN-DR. In Section 5, we validate the accuracy of the prediction model and the effectiveness of the prediction-based DGSFN-DR algorithm through extensive experiments conducted under various network topologies and different traffic intensity scenarios. In Section 6, we conclude and discuss future work.
2. Related Work
In software-defined networking (SDN), network state prediction technologies, graph neural network (GNN)-based temporal network state data processing, and dynamic routing optimization enable efficient network management [7,8]. Existing research has made notable progress in these areas, particularly leveraging deep learning techniques for traffic prediction and routing optimization [9,10]. However, these approaches face limitations of scalability in large-scale networks and comprehensive optimization of multiple performance metrics. Network state awareness for SDN dynamic routing optimization by spatiotemporal fusion network state prediction promises to provide a more intelligent and efficient solution [11].
2.1. Network State Awareness and Prediction Technologies
Network State Awareness and Prediction Technologies play a pivotal role in SDN, enabling network administrators to monitor and predict traffic dynamics in real-time. In recent years, deep learning techniques have been widely applied to network traffic prediction. They mainly use recurrent neural networks (RNNs) and their variants, such as gated recurrent units (GRUs), to process time-series data. These techniques analyze historical network performance metrics, such as latency, jitter, and bandwidth, to predict future network states, thereby supporting dynamic routing decisions.
For instance, Tang et al. [12] propose a novel deep learning algorithm based on a deep belief architecture and convolutional neural networks (CNNs) to predict potential traffic loads and network congestion.
They further integrated the deep learning-based prediction algorithm with a channel allocation algorithm to intelligently control routing traffic.
Similarly, Ferriol et al. [13] introduce a customized GNN model, RouteNet-Fermi, which aligns with queuing theory principles and can accurately predict network latency, jitter, and packet loss. Almasan et al. [14] incorporate graph neural networks into a deep reinforcement learning (DRL) agent, designing a problem-specific action space to enable learning and generalization across arbitrary network topologies. These machine learning and deep learning-based approaches are also frequently utilized to address state awareness and prediction challenges in 5G/6G networks [15,16,17].
However, existing research has not fully integrated real-time and continuous network state monitoring data, leading to reduced prediction accuracy in dynamically changing network environments.
2.2. Spatiotemporal Data Fusion Techniques Based on Graph Neural Networks
The introduction of Graph Neural Networks (GNNs) and Graph Convolutional Networks (GCNs) has marked a transformative shift in modeling relationships within non-Euclidean spaces [18,19,20]. Spatiotemporal data fusion models based on GNNs leverage graph structures to represent the topology of real-world networks, effectively capturing logical spatial dependencies that conventional Convolutional Neural Networks (CNNs) cannot process. Models such as Spatiotemporal Graph Convolutional Networks (STGCN) [21] and those employing Dynamic Time Warping (DTW) matrices for semantic understanding, as well as ASTGCN [22], have demonstrated outstanding performance in extracting spatial features.
To address spatiotemporal fusion in sequential data, Li et al. [23] proposed an innovative Spatiotemporal Fusion Graph Neural Network (STFGNN), which enhances the modeling capacity for complex spatiotemporal data by introducing temporal graphs and spatiotemporal fusion mechanisms. This approach overcomes the limitations of existing models in learning spatiotemporal dependencies. Similarly, Yang et al. [24] introduce an improved Spatiotemporal Adaptive Fusion Graph Network (STFAGN). This model integrates convolutional layers with a novel adaptive dependency matrix for end-to-end training, capturing hidden spatiotemporal dependencies in the data to supplement incomplete information.
The further development of graph learning frameworks, such as GMAN [25] and AGCRN [26], establish mechanisms for dynamically learning optimal graph structures. The Graph Multi-Attention Network (GMAN) employs an encoder-decoder architecture, where the encoder and decoder consist of multiple spatiotemporal attention modules to model the influence of spatiotemporal factors. The encoder encodes the input traffic features, while the decoder predicts the output sequence. A transform attention layer is also applied to mitigate error propagation across prediction time steps [25].
Bai et al. [26] proposed the Adaptive Graph Convolutional Recurrent Network (AGCRN), which enhances the capability of GCNs by introducing two key modules: the Node Adaptive Parameter Learning module and the Data Adaptive Graph Generation module. These modules allow AGCRN to automatically capture fine-grained spatiotemporal correlations in time-series data without requiring a predefined spatial connectivity graph.
While these methods excel at optimizing node embeddings and graph matrices to capture the evolving relationships in temporal data, their real-time responsiveness to sudden events or anomalies remains an area for further improvement. In addition to latency, anomaly-driven decision and explanation pipelines may also introduce privacy and data-leakage risks through AI outputs, especially when telemetry-derived information is processed or exposed in real time. A survey on data security and privacy protection in artificial intelligence models summarizes key challenges and defense mechanisms against data leakage in AI outputs [27], which supports the need to consider privacy-aware data handling when deploying network-intelligent systems that respond to anomalies.
2.3. Dynamic Routing Optimization Techniques
Heuristic and optimization-based methods are widely used in dynamic routing optimization. Binsahaq et al. [28] propose a QoS-aware routing algorithm that incorporates latency constraints into the objective function and reduces the solution search space. Their method supports latency-sensitive SDN services and achieves results with low computational overhead. Zhang et al. [29] evaluate the performance of Dijkstra’s shortest path algorithm on two SDN controllers, RYU and POX, using QoS metrics as evaluation criteria. Their study examines packet capture and transmission strategies based on shortest path and minimum load path, offering valuable insights into SDN routing performance.
Mohammadi et al. [30] propose a novel and efficient algorithm to address link failure issues, utilizing the Bidirectional Forwarding Detection(BFD) protocol to detect and proactively update backup paths. The Shared Risk Link Group (SRLG) algorithm was employed to identify disjoint paths by considering latency and link utilization as cost metrics.
Heuristic and optimization-based methods have made significant advancements in dynamic routing optimization. However, these methods encounter challenges when applied to large-scale networks, particularly in terms of scalability and efficiency. Specifically, challenges remain in optimizing routing decisions under dynamically changing network environments while considering multiple performance metrics.
2.4. Summary of Limitations in Prior Work and Our Key Distinction
Although existing studies provide valuable designs for traffic/state prediction and routing optimization, they often share three limitations with respect to SDN network state-aware dynamic routing. First, many prediction-oriented approaches model spatiotemporal dependencies from one structural view (e.g., node-centric topology graphs) or rely on graph representations that are not explicitly aligned with the edge-level coupling required by path construction. As a result, even when prediction accuracy is high, the induced link-weight patterns along candidate paths may be inconsistent with routing objectives. Second, several graph-based spatiotemporal fusion methods focus on improving node/link embeddings and dynamic graph learning, but do not provide a mechanism to translate the learned representations into a coherent, routing-relevant link-state space for multi-QoS weight construction. Third, routing optimization methods (including heuristic/optimization and shortest-path variants) commonly compute decisions based on current link weights or hand-crafted metrics, and do not explicitly integrate a prediction-to-weight coupling pipeline.
In contrast, this paper proposes DGSFN-DR with an explicit dual-graph spatiotemporal fusion design and a routing-aligned coupling mechanism. We construct a physical topology graph and a line/edge adjacency graph , and introduce a feature alignment/fusion strategy to produce coherent edge-level representations for future link-state prediction. Subsequently, the predicted future link states are deterministically mapped to link weights via , and routing decisions are obtained by minimizing the predicted end-to-end path cost using a Dijkstra-based procedure. Importantly, the routing stage follows an identical rule across variants in our ablation studies, so the downstream QoS gains can be attributed to how the dual-graph fusion improves prediction-to-weight consistency rather than changing the routing mechanism.
3. Preliminaries
3.1. Problem Description
Figure 1 illustrates an application scenario of an SDN network, where the SDN controller separates the network control plane from the data plane. This separation enables flexible network management and configuration, centralized network control, and dynamic resource allocation, enhancing the network’s manageability and scalability. The dual-graph spatiotemporal prediction framework for the intelligent management of SDN networks aims to predict and optimize network states by collecting and analyzing historical data.
Figure 1.
Application Scenario of SDN Networks Based on a Prediction Framework.
In operational SDN settings, routing issues and abnormal QoS patterns are not only decision-triggering signals but also require actionable interpretation by network operators. Therefore, beyond predicting future link states, the SDN intelligent control engine should provide clear, evidence-backed explanations grounded in telemetry data. A recent line of work on explainable anomaly detection in cloud-native systems shows that telemetry can be used as a basis for anomaly explanation, and retrieval-enhanced techniques can support transparent and case-specific rationale [31]. Motivated by this, our SDN Intelligent Engine is designed to treat telemetry as both (i) the input evidence for spatiotemporal fusion prediction and (ii) the underlying support for interpreting detected routing problems, improving the practical usability of prediction-guided routing decisions. As shown in Figure 1, the primary task is accomplished by deploying and implementing the prediction framework in the SDN network as follows.
3.2. Real-Time Data Collection
In the SDN architecture, the network controller collects real-time performance data from various nodes and links within the network. These data include the state of nodes (e.g., CPU utilization , memory usage ), the attributes of links (e.g., bandwidth , latency , packet loss rate , jitter ), and other relevant performance metrics. The network state at time t is represented as a state vector:
where , and N denotes the set of nodes (routers or switches) in the SDN network.
3.3. Intelligent Prediction and Network State Awareness
The historical network state dataset collected by the SDN is analyzed, and the Dual-Graph Spatiotemporal Fusion Prediction Network (DG-SFN) is utilized to predict the network state at a future time step . The DG-SFN model can be defined as:
where for . f represents the neural network model corresponding to DG-SFN. denotes the set of parameters in the neural network. The output of the model, , represents the network state at the future time step . This model integrates spatiotemporal data features to enable accurate prediction and awareness of future network states.
3.4. Dynamic Path Optimization
Based on the predicted network state information, the SDN intelligent control engine calculates the link weight coefficients and searches for the minimum weighted path between node pairs to solve the path optimization problem dynamically. The link weight coefficient function is defined as:
where represents the link weight coefficient for the Link between adjacent nodes i and j. Based on the predicted results , the objective function for the minimum weighted path optimization problem is defined as:
where P denotes a path between two nodes, and represents the set of all possible paths between the source node and the destination node d.
- (1)
- Prediction Target and Prediction-to-Weight Definition
Our routing optimization is performed on predicted link weights derived from the prediction target. Let denote the predicted link-state vector of link at time , where corresponds to latency, jitter, packet loss rate (PLR), and available bandwidth (ABW).
- (2)
- Link-weight construction ().
Given , we compute the corresponding link weight via the mapping function in Equation (3), i.e., . Concretely, each QoS component is first normalized to a common scale to avoid a mismatch caused by heterogeneous units. For each component , we apply
where and are computed from the training set as described in Section 4.6.1. The normalized components are then combined into a scalar link cost as
where are non-negative weights determining the relative emphasis on each QoS objective.
- (3)
- Relation to end-to-end QoS objectives.
We then route packets by minimizing the accumulated predicted path cost in Equation (4). For a path , the predicted path weight is . This corresponds to an end-to-end delay proxy because latency and jitter are modeled as link-level additive contributions over the path. PLR is represented by a link-level loss rate component that increases the path cost (via its contribution in ), and ABW is mapped to a cost term that penalizes low available bandwidth. Therefore, the shortest-path objective on provides a direct mechanism to reduce delay/jitter/PLR while favoring routes with higher bandwidth.
- (4)
- Optimization objective.
Finally, the Dijkstra-based decision procedure in Algorithm 1 selects the route with the smallest predicted path cost, ensuring that routing decisions are explicitly aligned with the end-to-end QoS objectives encoded in .
| Algorithm 1 Dynamic Shortest Path Decision for SDN Networks: DGSFN-DR |
| Require: Initial priority queue Q, link weight array , source node u, destination node v |
| Ensure: Shortest distance , path information |
|
- (5)
- End-to-end coupling via prediction-to-weight path objective.
Although the routing decision uses a Dijkstra-based shortest-path solver, the optimization mechanism is not limited to the classical path search. Our end-to-end design couples prediction to routing through an explicit prediction-to-weight construction and a routing-aligned path-cost objective: (i) the predicted link-state metrics at are transformed into link weights by the mapping function (Equations (3)–(6)), (ii) routing then selects the path by minimizing the accumulated predicted path cost (Equation (4)) using the same predicted weights inside Algorithm 1. Therefore, the routing decision is aligned with the end-to-end QoS proxy encoded in the predicted link weights. To validate that the observed routing QoS gains are attributed to this tight prediction-to-routing coupling (rather than using a graph-based predictor alone), we conduct dual-graph ablations in Section 5.3. With the routing rule kept fixed, differences among GP-only/GL-only/Dual-w/o Fusion/Full Dual lead to consistent improvements in routing QoS (Table 1 and Table 2) and path-level selection alignment (Figures 6 and 7). In particular, the gap between Full Dual and Dual-w/o Fusion indicates that the proposed fusion/alignment is essential for producing prediction outputs that translate into path-relevant link-weight patterns.
Table 1.
Routing QoS under Dual-Graph Ablation on the NSFNET Topology.
Table 2.
Routing QoS under Dual-Graph Ablation on the NYC Topology.
3.5. Dynamic Adjustment and Control
The SDN controller updates the network control parameters and dynamically reconfigures the network settings according to the prediction and optimization results. This includes adjusting routing paths, bandwidth allocation, and prioritization to ensure optimal network performance and guarantee quality of service (QoS).
4. Methodology
4.1. Overview of Network State Prediction Framework
The Dual-Graph Spatiotemporal Fusion Prediction Network (DG-SFN) enables effective perception of the Software-Defined Networking (SDN) system state. Optimize dynamic routing strategies by leveraging spatiotemporal data fusion and graph-based modeling to improve the accuracy and efficiency of decision-making. Figure 2 illustrates the architecture of the DG-SFN framework, which integrates spatio-temporal features through a multilevel structural design. Using graph neural networks (GNNs) and recurrent neural networks (RNNs), the framework achieves accurate predictions of network states and facilitates dynamic adjustments to routing policies.
Figure 2.
Overall Architecture of the Dual-Graph Spatiotemporal Fusion Network State Prediction Framework.
Although GATs for spatial feature extraction and RNN-family networks for temporal modeling are standard components in spatiotemporal learning, we emphasize that their selection in DGSFN-DR is aligned with our dual-graph formulation and the routing-aware prediction-to-weight pipeline. First, our spatial reasoning operates on two complementary graphs: the physical topology graph and the line/edge adjacency graph . Within each graph, attention-based message passing (GAT) is particularly suitable because it learns edge- (or node-) level importance from neighbor aggregation, which is consistent with our need to model shared-endpoint coupling and congestion-related propagation across traversed links. Second, our temporal module predicts link-state metrics at from a fixed historical window, and the prediction is subsequently mapped to link weights via and consumed by a deterministic Dijkstra-based routing rule (Equations (3) and (4) and Algorithm 1). In this closed-loop setting, modeling the temporal evolution of link states with an RNN provides stable sequence dependency capture without altering the downstream routing mechanism. Finally, we note that more advanced temporal/spatiotemporal alternatives (e.g., Transformer-based predictors) are included in the baseline comparisons under a unified protocol (Table 5). The experimental results (Tables 8–11) show that simply adopting a more complex backbone does not guarantee better prediction-to-routing effectiveness. Under the same routing pipeline constraint, the proposed GAT+RNN backbone, together with dual-graph spatiotemporal fusion, achieves consistent gains across prediction metrics and end-to-end routing QoS, supporting the adequacy of our design choice.
As illustrated in Figure 2, our framework introduces an innovative approach to spatial-temporal feature extraction and dynamic optimization strategies, offering new methodologies and technical pathways to efficiently manage software-defined network (SDN) systems. The primary components of the dual-graph spatiotemporal fusion network state prediction framework are as follows.
We first conduct a dual-graph embedding of node and link. The network topology is mapped into a dual representation consisting of a node adjacency graph and a link adjacency graph to capture the intrinsic spatio-temporal dependencies of complex network structures. This dual-graph logical representation not only characterizes the physical connectivity of the network but also captures the complex interactions at the network level.
Using the ONOS platform, real-time multidimensional network metric data is collected, including latency, packet loss rate, bandwidth, and jitter. The network node and link features are embedded in a high-dimensional feature space using MLP() and MLP(), respectively, providing a rich foundation for subsequent feature extraction.
Second, we extract spatiotemporal features of the nodes and links by graph attention network. We slice the spatiotemporal embeddings of nodes and links at each time step. Then, we employ GATs to capture the spatio-temporal features of two types of spatial propagation characteristics. The GAT effectively identifies and highlights critical connections and interactions by using the attention mechanism, providing high-quality spatio-temporal feature representations. The spatio-temporal embeddings of nodes in the dual-graph representation are subsequently transformed into time-series slices, reflecting the network state’s dynamic evolution and propagation dependencies.
Third, we make network state predictions using a recurrent neural network. The DG-SFG (Dual-Graph Spatiotemporal Fusion GAT) generates the node propagation feature embeddings. Then, we construct spatio-temporal feature embeddings from such node propagation feature embeddings. The spatio-temporal feature embeddings are used as input features for the RNN to perform time-series prediction. The RNN predicts the future network state at by effectively capturing long-term dependencies in the time-series data. After that, we minimize link weights to select the optimal path according to the RNN prediction results to perform the dynamic routing optimization. Thus, it significantly improves the efficiency of network resource utilization and the quality of service.
Last, we employ the network state to determine the data link. We use the prediction results to calculate the data link weight coefficients for adjacent node pairs through a weighted path optimization strategy. We determine the optimized node-to-node data links in the traffic matrix using the shortest data link search algorithm. We employ an optimized dynamic routing table for the SDN controller to enable real-time network adjustment and optimization, forming a closed-loop feedback mechanism. Our dynamic optimization mechanism allows the network to continuously adapt to changes in network state and maintain optimal performance.
4.2. Dual-Graph Embedding of Node and Link
The computer network topology and the links within the network topology can be represented as a graph. Graph neural networks (GNNs) [32], such as GATs [33], GCNs [34], and other variants, are effective in capturing the interconnections and transmission dependencies between nodes in the graph [35]. To capture the spatiotemporal dependencies between nodes and links in the network, we propose a dual graph-based node and link representation embedding method: (1) Node Adjacency Matrix. The network’s physical topology is mapped into a node adjacency matrix representation. This matrix is processed using a multilayer perceptron (MLP()) to extract the feature embeddings of the nodes. (2) Link Adjacency Matrix. The network’s logical link structure is represented as a link adjacency matrix (edge graph/Line graph). Similarly, this matrix is processed using a multilayer perceptron (MLP()) to generate the feature embeddings of the links. The dual-graph representation and link mapping method in the SDN network is shown in Figure 3.
Figure 3.
Illustration of the Dual-Graph Representation and Link Mapping Method in SDN Networks.
Figure 3 illustrates mapping the network topology into two graphs: the physical topology graph and the link-associated vertex graph . The dual-graph representation captures representation and propagation characteristics, providing a foundation for accurate network state perception and dynamic routing optimization. The corresponding definitions of the graphs are as follows:
- The physical topology graph of the network is defined as , representing the actual physical connections within the network, where is the set of nodes, representing switches or routers in the network; is the set of edges, representing physical links. Each node and is connected by an edge , which denotes the direct physical connection between the nodes. The edge is also referred to as a link.
- The link graph is defined as , representing the adjacency relationships of edges in the original graph . Each vertex in the link graph corresponds to an edge in the original graph . Specifically:
- −
- Vertex set: , where is the vertex in corresponding to the edge e in .
- −
- Edge set:In , there exists an edge between two vertices and if and only if their corresponding edges and in the original graph share a common vertex u or v.
- −
- Edge mapping: : If two edges and in the original graph share a common vertex, then there exists an edge in between the corresponding vertices and .
As illustrated in the example in Figure 3, the topology graph of the SDN network is defined as , where and . The corresponding link graph is defined as , where and .
Based on the port statistics data of the SDN network, the current time-slot network state information, represented by the graphs and , is embedded through MLP() and MLP(). Let denote the node data (network state information) of and , respectively. The final embedding space has a dimensionality of , and the mapping of node embeddings is defined as:
The embedding process is defined as follows:
where, and are learnable weight matrices for projecting to the embedding space, while are the corresponding bias terms. The activation function is the Sigmoid function, and represent the resulting embedding representations.
4.3. Dynamic Collection of SDN Network State Data
In software-defined networks (SDNs), the ONOS controller can capture information about network nodes and links. First, the Link Layer Discovery Protocol (LLDP) is used to identify adjacent switches and links, thereby constructing the network topology. Subsequently, the network controller retrieves detailed information about devices, including flow tables and port states, through the OpenFlow protocol. Active probing, such as sending probe packets (e.g., ICMP Echo Requests), can be employed to measure latency and jitter along the path. Using the flow tables of SDN switches, packet counts can be periodically collected, and by comparing the number of transmitted and received packets, the packet loss rate can be calculated. Additionally, by monitoring the traffic load on ports, the current bandwidth utilization can be estimated, and the remaining bandwidth can be calculated.
Through these methods, the SDN controller can specify source and destination nodes to compute round-trip time and jitter. Monitoring port states and traffic statistics can assess the real-time connectivity and load status of links while also listening to network events to update the topology promptly. The collected information enables the controller to construct a global network view, facilitating more optimal decisions in traffic management and policy deployment. The corresponding algorithmic steps are shown in Algorithms 2 and 3.
| Algorithm 2 SDN Network State Acquisition Based on ONOS Controller |
| Require: ONOS Controller instance |
| Ensure: Real-time network state data |
|
| Algorithm 3 Active Probing-Based Metric Collection for SDN Network State Estimation |
| Require: Mininet topology and SDN controller |
| Ensure: Metrics: Delay, Jitter, etc. |
|
4.4. Spatiotemporal Feature Extraction
4.4.1. Node-GATs and Link-GATs
The vertex embeddings of and , along with their corresponding adjacency matrices, are used as inputs to the GAT module in the DG-SFP framework to capture spatial dependencies among nodes and links.
Since the Number of nodes in the SDN network and the Number of nodes in the line graph representing the links differ, two separate GATs are employed to process node features and link features, respectively. Let the node features and link graph node information at time step be represented as and , respectively. These features are learned using the corresponding K-head GATs.
- The Node-GAT model takes the input feature matrix as input. For the l-th layer and each attention head k, the attention mechanism is defined as:where is the learnable self-attention vector for each node pair in the l-th layer and k-th head, is the learnable linear transformation matrix, and represent the features of nodes i and j, respectively. Node i and node j are adjacent in the graph.
- After obtaining the attention coefficients between node pairs, the normalized attention coefficient is computed as:where represents the set of neighboring nodes of node i, derived from the adjacency matrix of the SDN network topology graph .
- The node features are updated as follows:where the attention coefficients are used to aggregate the features of neighboring nodes.
- The multi-head aggregation and update are defined as:where represents the output feature of node i after applying the normalized attention weights to aggregate features from its neighbors. The nonlinear activation function is implemented as the ReLU function.
- The Link-GAT model, which processes link features, takes the input feature matrix . For the l-th layer and each attention head k, the computation of attention coefficients is defined similarly to Node-GAT. The attention coefficient is denoted as , and the linear transformation matrix is represented as . The input graph corresponds to the line graph of the SDN network, denoted as , with its adjacency matrix given by .
4.4.2. Node and Link Feature Alignment
Due to the mismatch in the Number of features between nodes and links (), feature alignment is required. Since DG-SFP predicts the future states of links, feature alignment is performed by aggregating features based on the nodes corresponding to the line graph of links. This process ultimately generates fused node features based on the line graph .
Let the output node features and link features after L layers of Node-GAT and Link-GAT be and , respectively. DG-SFP aligns these features using a weighted averaging method applied to concatenated features. The alignment is defined as:
where represents the features of all network topology nodes related to node i in the line graph (i.e., , which are the features of nodes in ). denotes the average of the features of all nodes related to Link i. The operator indicates the feature concatenation. After the alignment, the resulting features satisfy , and the feature matrix of the entire graph becomes .
4.5. Spatiotemporal Fusion Based Link State Prediction
The node representations at each time step are concatenated into a historical time series of T steps, forming the input in the time-series format:
where represents the feature matrix of the entire graph at the i-th time step.
In DG-SFN, the RNN propagates and updates its hidden states across time steps as follows:
where is the initial hidden state; represents the hidden state at the t-th step; is the weight matrix for input-to-hidden connections; is the weight matrix for hidden-to-hidden connections; is the bias term; and is the activation function, implemented as ReLU.
The prediction model employs an MLP to forecast the future state of each Link, with the output representing the predicted future state for each individual Link. The output layer of the MLP prediction is defined as:
where is the weight matrix of the output layer, responsible for transforming the RNN hidden state into the link state, and is the bias term.
If predictions are made for multiple future time T steps, the total output dimension becomes . Here, m denotes the Number of features for each link.
The loss function of the entire DG-SFP model is defined as:
where is the hyperparameter for the L1 regularization term, , which controls the intensity of regularization. The L1 regularization penalizes all weights, forcing some unimportant weights to approach zero. The total loss function minimizes both the primary loss and the regularization loss simultaneously.
In this study, to improve prediction efficiency, we set and . In our loss formulation, the coefficient controls the strength of the L1 regularization term that encourages sparsity. We set in the final configuration because, in our prediction-to-routing framework, enforcing sparsity on the intermediate representations is not aligned to preserve spatiotemporal structure for accurate link-state forecasting. More importantly, during preliminary tuning, we observed that enabling the L1 term does not improve the prediction-to-routing performance under our metrics and may introduce additional optimization bias by over-penalizing non-sparse feature components. Therefore, we disable the L1 regularization by choosing for the reported results.
4.6. Dynamic Shortest Path Routing Decision
For the network link features predicted by DG-SFP, let the Number of features associated with each link be denoted as m. For example, if , the four features may include jitter, network latency, packet loss rate, and residual bandwidth. These four main features can be used to compute the weight of each link during SDN network configuration. The final routing strategy selects the optimal/shortest routing configuration based on these weights.
4.6.1. Link State Weight Coefficient Calculation
To comprehensively account for multiple network link features (e.g., jitter, network latency, packet loss rate, and residual bandwidth) and unify them into a single weight coefficient for each link, a weighted normalization method that adapts to different feature distributions is employed. This method can be defined as:
- Z-score data standardization is applied to each feature to eliminate the influence of different units, and it can be formulated as:where represents the j-th feature value of the i-th link (, ); and are the mean and standard deviation of the j-th feature, respectively.
- These features are normalized using inverse normalization or direct normalization, respectively. The corresponding formula is defined as:where represents the set of features where larger values are preferred (e.g., Bandwidth), while denotes the set of features where smaller values are preferred (e.g., Latency and Jitter).
- The formula for calculating the entropy of each feature is defined as:where is introduced to prevent computational errors.
- The weight of each feature, which reflects the impact of the corresponding feature on link performance, is calculated as:where represents the optimization weight of the j-th feature for a link, and .
- The link weight coefficient, which integrates the normalized values of each feature with their corresponding weights, is calculated as follows:
Based on the data distributions of each feature, the link weight coefficient is computed by comprehensively considering the influence of different features on network performance. Equations (22)–(24) not only account for the directionality of the features but also dynamically adjust their weights using the entropy weight method. This approach ensures that the path selection process is more rational and efficient.
4.6.2. Link Weight Coefficients Based Shortest Path Decision
Based on the computed link weight coefficients, the objective of the shortest path decision is to identify the path with the minimum total link weight coefficient for a given link set between node pair . This can be expressed as:
where u and v () are two distinct nodes in the network topology. The objective is to find the shortest/optimal path between u and v among all possible paths.
Since Dijkstra’s algorithm has been proven to possess universal optimality [29,36], the model employs a Dijkstra-based dynamic routing decision algorithm, referred to as DGSFN-DR, shown in Algorithm 1, for determining the dynamic shortest/optimal path.
5. Experiments
5.1. Experimental Environment and Configuration Description
We evaluate the DG-SFN prediction model and the DGSFN-DR dynamic routing optimization algorithm. We simulate network traffic on two classical topologies. We select NSFNet [37] and NYC [38] as the foundational network structures for our experiments. The objective is to evaluate the network performance through long-term time-series simulation. During the simulation, a combination of the gravity model and traffic classification methods (Mice flows and Elephant flows) [37] was employed. To obtain network state data, multiple traffic intensities set at , , , and were tested.
In our evaluation, we focus on the routing task defined by our framework: forecasting link-state metrics at , mapping them to link weights via , and then performing dynamic shortest-path routing using the induced predicted weights (Equations (3) and (4) and Algorithm 1). Therefore, rather than comparing against heterogeneous routing policies that operate under different decision interfaces, we conduct controlled comparisons at the predictor-to-routing interface by integrating various spatiotemporal predictors under the same routing pipeline. This design ensures that the reported improvements reflect the ability to produce routing-relevant link-weight predictions for QoS-driven path selection, which directly matches our SDN routing objective (Table 1 and Table 2).
The descriptions of the network topologies are as follows.
- 1.
- NSFNet Topology [37]: This topology consists of 14 nodes and 21 links derived from the U.S. National Science Foundation Network’s framework. It is commonly utilized to simulate efficient data transmission. The topology structure is shown in Figure 4.Figure 4. NSFNet Networks Topology.
- 2.
- NYC Topology [38,39]: This topology comprises 14 nodes and 28 links and is designed to emulate the high-connectivity structure commonly observed in enterprise networks and data centers. The topology structure is presented in Figure 5.Figure 5. NYC Networks Topology.
The detailed experimental data and parameter settings are summarized in Table 3.
Table 3.
Simulation Environment Parameter Settings.
Traffic Matrix Generation Rules: In the experiments, traffic matrices with varying traffic intensities (TI) were generated using a gravity model. The traffic intensities were set to occupy 10%, 50%, 70%, and 90% of the network bandwidth, respectively. For each TI level, multiple traffic matrices were generated. The gravity model is defined as:
where represents the traffic intensity between the node pair ; 10%, 50%, 70%, 90% denotes the selected traffic intensity level, randomly chosen among the four levels; and are the degrees of nodes s and d, respectively; is the total number of links in the network; and is a random perturbation factor uniformly distributed in the range .
The Google Trace dataset [40] was used as a basis for task arrival rates, serving as seeds for both temporal and task intensity simulations. This approach enables the generation of network traffic data that more closely approximates real-world network conditions.
Traffic Matrix Generation for Mice and Elephant Flows: When the node pair corresponds to either Mice flows or Elephant flows, the traffic matrix generation formulas are defined as follows:
where represents the maximum bandwidth of the link. The parameter is the scaling factor for Mice flows, and the generated is determined by a randomly selected value of . Similarly, is the scaling factor for Elephant flows, and the generated is determined by a randomly selected value of .
5.2. Datasets and Prediction Model Parameters
5.2.1. Datasets
The core of the DG-SFP framework is its prediction model, DG-SFN. To obtain the training data for DG-SFN, we utilized the Mininet simulator in an environment supported by the ONOS controller. The NSFNet and NYC network topologies, along with their associated data, were employed in the experiments. Following the experimental configurations in Table 3, network state data—including node states and link states—were collected over 34,560 consecutive time steps (with each time step lasting 5 s, corresponding to approximately 48 h of sequential data) for both network topologies.
The normalized data set was structured so that each time step corresponded to one instance. Based on the total number of time steps in each dataset, the samples were divided into training, testing, and validation sets in a ratio of 7:2:1. This resulted in 24,292 training cases, 6912 testing cases, and 3456 validation cases. Dataset split protocol: All datasets are split based on temporal order to avoid information leakage. Specifically, the earliest segments are used for training, the subsequent segments for validation, and the latest segments for testing.
5.2.2. Prediction Model Parameters
The experimental environment was configured as follows: the CPU used was an Intel Xeon(R) Platinum 8255C, and the GPU was an NVIDIA RTX V100 with 24 GB of memory. The operating system was Ubuntu. The software environment included Python 3.8, with the deep learning framework PyTorch 1.9.0 and TorchVision 0.10.0. GPU acceleration was enabled using CUDA 11.0.
The parameter settings for the DG-SFN model are summarized in Table 4.
Table 4.
Model Parameter Configurations of DG-SFN.
Performance Evaluation Metrics: (1) Mean Absolute Error (MAE); (2) Root Mean Squared Error (RMSE); (3) R-squared (); and (4) Pearson Coefficient (). The corresponding formulas are defined as follows:
where denotes the total number of observable samples, represents the true value of the i-th sample, and represents the predicted value of the i-th sample.
5.2.3. Fairness of Baseline Comparisons
We acknowledge that fair baseline comparison is critical for interpreting the percentage improvements reported in this paper. In this study, all compared baselines—FC-LSTM, GRU, Transformer, STFAGN, and GL-STGTN—are evaluated under a unified experimental protocol with respect to data split, feature set, prediction horizon, and routing-decision pipeline.
- (1)
- Same data split.
For all methods, the dataset is partitioned into training, validation, and testing sets using the same ratio of 7:2:1, where each time step corresponds to one instance extracted from the collected network state time series. No method uses additional data beyond this shared split.
- (2)
- Same input feature set and normalization.
We use the same underlying link-state variables for prediction (latency, jitter, packet loss rate (PLR), and available bandwidth (ABW)) and construct the input samples using identical temporal windows. All models receive inputs processed with the same normalization/standardization scheme as specified in Section 4.6.1. For graph-based baselines that require graph structure (e.g., STFAGN and GL-STGTN), the same topology graphs are employed to build their graph inputs; however, the subsequent routing stage remains identical for all methods (see below).
- (3)
- Same prediction horizon.
The prediction horizon is fixed across all methods. Specifically, we predict future link-state metrics at the same time offset as used by DG-SFN (e.g., with the corresponding time-step duration in Table 4). Thus, differences in routing performance cannot be attributed to mismatched forecast horizons.
- (4)
- Same routing-decision pipeline from predicted link states to paths.
Crucially, all methods—including DG-SFN-DR and the baselines—follow the same routing pipeline. Let the predicted future link-state metrics be denoted by . We compute link weight coefficients using the same mapping function as in Equation (3) and then select routes by minimizing the accumulated predicted path weight using the same Dijkstra-based shortest-path decision procedure (Equation (4) and Algorithm 3). Therefore, the only difference across methods lies in the prediction model generating ;the routing rule and optimization objective are identical. The Fairness protocol for baseline comparisons is summarized in Table 5.
Table 5.
Fairness protocol for baseline comparisons.
With the above unified protocol, the reported relative gains reflect differences in prediction quality and its effect on routing under the same optimization objective, rather than being artifacts of inconsistent retraining settings or heterogeneous routing pipelines.
Because the compared baselines already include a set of representative time-series sequence modeling methods (FC-LSTM, GRU, and Transformer) as well as spatiotemporal graph/time-series variants (STFAGN and GL-STGTN), the effectiveness evaluation was originally designed to examine how different prediction modules translate into routing decisions. Under the unified evaluation protocol (same data split, feature set with , prediction horizon , and the same mapping function followed by the identical Equation (4) Dijkstra routing pipeline), the reported percentage gains reflect differences in predictive modeling capacity rather than discrepancies in experimental settings. Therefore, we do not introduce new ablation experiments solely for fairness verification; instead, we provide the explicit fairness constraints and pipeline alignment summarized in Table 5.
5.3. Ablation Studies on Dual-Graph Construction for Routing Optimization
To verify whether the reported gains are mainly attributable to the proposed dual-graph spatiotemporal fusion (rather than simply using a graph-based predictor), we perform an ablation that isolates the effects of graph construction and the feature fusion/alignment strategy. In all variants, the spatiotemporal forecasting backbone remains the same (a GAT+RNN), and the routing stage follows the same dynamic shortest-path formulation where link weights are computed from predicted link-state metrics at . Accordingly, the only differences among variants lie in the graph construction and the feature alignment/fusion policy used for encoding.
We consider four variants: (i) GP-only: node-domain graph GP with a GAT encoder, (ii) GL-only: line-domain graph GL with a GAT encoder, (iii) Dual-w/o Fusion: dual graphs are constructed, but the proposed alignment/fusion strategy is removed, and (iv) Full Dual (DGSFN): the complete dual-graph spatiotemporal fusion model. The routing decision is made by minimizing the accumulated predicted path weight. In this setting, performance degradation can arise not only from marginal prediction errors but also from inconsistencies in the predicted link weights along a candidate path, which may lead to suboptimal path selection.
The dual-graph design provides complementary structural views of link-state evolution. GP captures node-centric spatial dependencies, while GL is constructed from edge adjacency and captures shared-endpoint coupling among links, which characterizes how congestion propagation and load/queue dynamics at intermediate switches may affect multiple traversed links. Therefore, improving routing performance requires the predictor to generate link-weight patterns that are more consistent with the path-level optimization objective, not only to reduce standalone prediction error.
The ablation results below quantify the contributions of (a) using dual graphs versus a single graph view, and (b) applying the fusion/alignment strategy versus naive dual encoding.
5.3.1. Prediction Accuracy and Correlation Effects from Dual-Graph Construction
Table 6 and Table 7 report the prediction metrics on four link-state features (Latency, Jitter, Packet Loss Rate (PLR), and Available Bandwidth (ABW)) under the four variants. Across both topologies, the Full Dual model attains the strongest regression quality, indicating that the dual-graph fusion improves both error magnitude and predictive alignment with the true dynamics.
Table 6.
Statistical Metrics of Features under Dual-Graph Ablation on the NSFNET Topology.
Table 7.
Statistical Metrics of Features under Dual-Graph Ablation on the NYC Topology.
On NSFNET, Full Dual yields the best MAE/RMSE for all four features: Latency improves from Dual-w/o Fusion ( MAE, RMSE) to MAE and RMSE; Jitter improves from MAE and RMSE to MAE and RMSE; PLR decreases from MAE/ RMSE to MAE/ RMSE; ABW improves from MAE/ RMSE to MAE/ RMSE. The correlation indicators follow the same trend: Full Dual achieves Pearson with for Latency, and reaches Pearson with for ABW. Similar dominance holds on NYC: Full Dual reduces Latency MAE from (Dual-w/o Fusion) to while increasing correlation (Pearson vs. ), and improves ABW to MAE/ RMSE with Pearson .
These results already suggest that the dual-graph fusion is doing more than aggregating information from a single view: it improves not only the magnitude of prediction errors but also the consistency between predicted trajectories and observed link-state evolution (reflected by and Pearson correlation).
5.3.2. Routing-Specific Benefit: Linking Dual-Graph Improvements to QoS
A key point is that the routing decision in our DGSFN-DR does not directly access future ground-truth link metrics. Instead, at each time step, DG-SFN predicts the future link-state: (Equation (2)), and the routing layer deterministically derives the link weight coefficients from the predicted future states: (Equation (3)). The shortest-path objective is then computed by minimizing the accumulated predicted path weight (Equation (4)).
Therefore, in the dual-graph ablations (GP-only/GL-only/Dual-w/o Fusion/Full Dual), the routing mechanism remains the same, and the only varying component is the quality/structure of the predicted link states, which induces different predicted link-weight patterns. This enables a clean separation in the end-to-end analysis: (1) Table 6 and Table 7 quantify how dual-graph fusion improves prediction accuracy and correlation, (2) Table 1 and Table 2) show that, under the same routing formulation that consumes predicted weights, the downstream QoS improves accordingly, and (3) Figure 6 and Figure 7 further validate that the predicted-weight-driven paths exhibit stronger alignment with the true optimal path tendency via path-level statistics (TPW/path selection accuracy).
Figure 6.
Scatter of Total Path Weight (TPW) Across Four Different Paths in NSFNET.
Figure 7.
Specific Example of Shortest Path Routing for s3 → s10 Over Four Time Steps.
While improved prediction accuracy is encouraging, routing optimization requires that predicted link weights lead to better path selection. Table 1 and Table 2 provide downstream evidence by reporting routing QoS under increasing traffic intensities (LOW/MID/HIGH). The results show a consistent advantage for Full Dual across all metrics and traffic levels, with the largest relative improvements appearing under HIGH traffic, where the system is more sensitive to prediction-induced bias.
Importantly, the routing stage always computes paths by minimizing the predicted link weights from DG-SFN outputs (Equations (3) and (4)). Thus, the observed QoS gains in Table 1 and Table 2 are not attributable to changing the routing rule, but to the improved prediction-induced weight patterns produced by dual-graph fusion. To further connect prediction quality with routing effectiveness, Figure 6 and Figure 7 report path-level statistics showing that the selected paths under predicted weights are more correlated with the true optimal tendency than those under DSP.
On NSFNET under HIGH traffic (60%), Full Dual achieves Latency ms, reducing it from DSP ms and Dual-w/o Fusion ms; it also reduces Jitter from ms (DSP) and ms (Dual-w/o Fusion) to ms. The packet loss decreases from (DSP) and (Dual-w/o Fusion) to , while available bandwidth increases from Mbps (DSP) and Mbps (Dual-w/o Fusion) to Mbps. A similar pattern is observed on NYC under HIGH traffic: Full Dual achieves Latency ms (vs. ms for DSP and ms for Dual-w/o Fusion), Jitter ms (vs. ms for DSP and ms for Dual-w/o Fusion), packet loss (vs. for DSP and for Dual-w/o Fusion), and available bandwidth Mbps (vs. Mbps for DSP and Mbps for Dual-w/o Fusion).
Crucially, these downstream improvements are not reproduced by the single-graph baselines with comparable strength. For instance, on NSFNET under HIGH traffic, Full Dual improves latency relative to GP-only (from ms to ms) and relative to GL-only (from ms to ms). This supports the premise that routing gains are not simply an artifact of using graph learning, but depend on the structural properties of the encoded dependencies and the way the two views are fused.
5.3.3. Quantifying the Specific Contribution of Dual-Graph Fusion
To visualize where the dual-graph design translates into routing advantage, Figure 8 summarizes the gain patterns of Full Dual relative to DSP and the graph variants across traffic levels, topologies, and QoS metrics. The heatmap indicates that Full Dual consistently delivers positive gains and that the improvement remains robust when traffic grows, matching the numerical trend in Table 1 and Table 2. More importantly, the gaps between Full Dual and Dual-w/o Fusion demonstrate that constructing two graphs alone is insufficient; the alignment/fusion strategy is what enables the predictor to produce link-weight patterns that better serve path-level optimization.
Figure 8.
Routing Ablation Heatmap: Full Dual Gains (%) vs. DSP/Graph Variants.
Put together, the dual-graph contribution has two distinct aspects supported by data: (1) using both node-domain and line-domain dependency structures yields better QoS than either single-graph view alone (GP-only or GL-only), and (2) applying the proposed fusion/alignment strategy further improves both prediction quality (Table 6 and Table 7) and routing QoS (Table 1 and Table 2), with the most pronounced benefits under HIGH traffic.
5.3.4. Module-Level Importance Within DGSFN-DR
The ablation study also clarifies why the overall architecture is necessary for routing optimization. The forecasting backbone (GAT+RNN) provides temporal prediction capacity, but the effectiveness of routing hinges on how predicted link states are transformed into a coherent set of link weights. The dual-graph spatiotemporal fusion module supplies the structural inductive bias required to model inter-link coupling around shared endpoints and nodes. Finally, the routing stage converts the predicted link-state metrics into a dynamic path decision by minimizing the accumulated predicted path weight. Therefore, the architecture components are complementary: the forecasting module alone improves link-state estimates, while the dual-graph fusion specifically enhances the path-relevant consistency of predicted weights, which is reflected directly in downstream latency/jitter/packet loss and available bandwidth improvements.
The novelty of DGSFN-DR is not limited to combining commonly used components (GATs, RNNs, and Dijkstra). Instead, it lies in the dual-graph spatiotemporal fusion mechanism designed to improve prediction-to-weight coupling for routing optimization. Concretely, we construct two complementary structural views: the node-domain physical topology graph and the line-domain edge adjacency (line graph) . More importantly, we introduce an explicit feature alignment/fusion strategy (Equation (15)) that maps link-domain representations back to a coherent, fused node-centric space, enabling consistent modeling of inter-link coupling around shared endpoints. This design goal is distinct from single-graph predictors, where spatial dependencies are learned from only one structural view.
To convincingly demonstrate the benefit of dual-graph modeling over single-graph and other GNN-based time-series predictors, we perform dual-graph ablation with four variants (GP-only, GL-only, Dual-w/o Fusion, Full Dual). The routing decision procedure remains identical across variants and consumes only the predicted link states through the same mapping and Dijkstra-based shortest path objective (Equations (3) and (4) and Algorithm 1). Therefore, performance differences can be attributed to how the prediction module produces link-weight patterns. The results show that Full Dual consistently outperforms both single-graph variants and Dual-w/o Fusion, indicating that (i) using both and yields a stronger inductive bias for spatiotemporal link evolution, and (ii) the proposed alignment/fusion is essential to obtain path-relevant coherent link-weight trajectories.
5.4. Analysis of Experimental Data for the Prediction Model
The performance of the proposed link state prediction model, DG-SFN, was evaluated on three datasets. The results were compared with those obtained by FC-LSTM [41], GRU [42], Transformer [43], STFAGN [24], and GL-STGTN [44]. The detailed results are presented in Table 8, Table 9, Table 10 and Table 11.
Table 8.
Statistical Metrics of Features on the NSFNET Network Topology.
Table 9.
Overall Performance Results of Different Models on the NSFNET Network Topology.
Table 10.
Experimental Results on the NYC Network Topology.
Table 11.
Overall Performance Results of Different Models on the NYC Network Topology.
Based on the results presented in Table 8 and Table 10, the proposed DG-SFN demonstrates significant superiority in predicting the four features across both the NSFNET and NYC network topologies. These findings validate the effectiveness of DG-SFN compared to other models. From the statistical perspective, although the prediction results for each feature are relatively close due to the minimal variation in data packet loss rates, all models exhibit strong performance on the PLR and ABW features, particularly in terms of the and Pearson correlation coefficient metrics. This indicates that these models possess robust fitting capabilities for these two features, and the predicted results show a strong and significant correlation with the actual observations.
Compared to other models, the DG-SFN model demonstrates outstanding performance across all statistical metrics, with particularly significant advantages in MAE and RMSE. For example, in Latency prediction, the MAE of DG-SFN is 2.7530 on the NSFNET topology and 3.199 on the NYC topology. On the NSFNET topology, this represents a reduction of 21.59% compared to LSTM, 21.59% compared to GRU, 25.75% compared to Transformer, 9.55% compared to STFAGN (a model with a graph neural network architecture), and 6.53% compared to GL-STGTN.
In terms of and Pearson correlation coefficient, the DG-SFN model also achieves the best results among all models, with values exceeding 0.64 and reaching a maximum close to 0.9, and Pearson values exceeding 0.78 and reaching a maximum greater than 0.93. These metrics highlight the superior ability of DG-SFN to capture data variability and reflect network states.
Overall, these results indicate that the DG-SFN model effectively captures network state variations while demonstrating excellent stability and prediction accuracy.
The overall performance comparison of the models is presented in Table 9 and Table 11, while the statistical improvement of DG-SFN across different features is detailed in Figure 9, Figure 10, Figure 11 and Figure 12. Based on the results of the four statistical metrics, DG-SFN demonstrates the most significant overall improvement compared to the Transformer model. Specifically, on the NSFNET topology, the improvements are 35.41%, 33.37%, 54.51%, and 17.61% for the respective metrics. On the NYC topology, the corresponding improvements are 36.57%, 37.47%, 63.92%, and 21.40%. Compared to STFAGN and GL-STGTN, the improvement margins of DG-SFN range from 3.5% to 8.7%, further validating its superior capability in capturing network state variations.
Figure 9.
Performance Improvement Rates of DG-SFN Compared to Other Models for Each Feature on the NSFNET Network Topology.
Figure 10.
Overall Performance Improvement Rates of DG-SFN Compared to Other Models on the NSFNET Network Topology.
Figure 11.
Performance Improvement Rates of DG-SFN Compared to Other Models for Each Feature on the NYC Network Topology.
Figure 12.
Overall Performance Improvement Rates of DG-SFN Compared to Other Models on the NYC Networks Topology.
The comprehensive statistical results suggest that the Transformer model may fail to effectively model network topological structures when processing temporal data, leading to suboptimal prediction performance. While LSTM and GRU perform well in time-series prediction, STFAGN and GL-STGTN, which incorporate graph neural network architectures, may offer better performance in network state awareness. In contrast, the DG-SFN model more effectively captures variability and correlations within the network, providing robust decision support for state awareness and dynamic routing optimization in software-defined networking (SDN).
5.5. Experimental Analysis of Routing with DGSFN-DR
Simulation experiments offer significant advantages over physical network tests. They provide precise control over traffic loads and network configurations, ensure repeatability, and lower both cost and risk. Prior research validates simulation as a reliable approach for evaluating network protocols, and our experimental setup follows rigorous standards that closely mimic real-world dynamics.
We evaluate routing optimization performance of the DGSFN-DR algorithm in dynamic network environments. We perform comparative experiments on NSFNET and NYC network topologies with the Mininet simulation platform. We compare our approach with the conventional OSPF-based routing algorithm, referred to as DSP. DSP configures routing based solely on current link weights.
The DG-SFN model leverages deep learning to predict future link states by forecasting key metrics such as bandwidth, latency, and packet loss rate. Using these predictions, the DGSFN-DR algorithm constructs the shortest path between source and destination nodes. Following the experimental setup outlined in Section 4.1, we simulate two network topologies for 4 h (approximately 3450 time steps). At each time step, the DG-SFN model outputs predicted link states, and the DGSFN-DR algorithm computes the optimal path based on these predictions, while DSP calculates routes using current link weights. We acknowledge the inherent limitations of simulation experiments and plan to validate our findings in real network environments in future work.
In the comparative experiments, the performance of the algorithms was evaluated from the following perspectives:
- 1.
- Total Path Weight (TPW): This metric measures the overall cost of the path from the source to the destination.
- 2.
- Path Selection Accuracy: This evaluates the differences in path selection performance between DGSFN-DR and DSP under actual link states.
Figure 13 shows the average total weights of the shortest paths selected by DGSFN-DR for routes s0 → s10, s0 → s9, s2 → s11, and s1 → s12. We record average weights of 0.13, 0.11, 0.12, and 0.11, respectively. In contrast, DSP produces a weight of 0.14 for every path. DGSFN-DR outperforms DSP in terms of median values and standard deviations. Figure 6 shows the scatter distribution of total path weights for shortest path selection. DGSFN-DR achieves correlation coefficients of 0.25, 0.34, 0.34, and 0.37. These coefficients exceed those of DSP and indicate a stronger correlation with the true optimal paths. Figure 14 illustrates a specific example of shortest path routing for s2 → s11 over four time steps.
Figure 13.
Boxplot of Total Path Weight (TPW) Distribution Across Four Different Paths in NSFNET.
Figure 14.
Specific Example of Shortest Path Routing for s2 → s11 Over Four Time Steps.
In the four-time-step routing selections presented in Figure 14, three of the time steps align with the optimal routing. Overall, on the NSFNET network topology, DGSFN-DR demonstrates better performance in path selection under actual link states compared to DSP. Similar results are observed on the NYC topology, as shown in Figure 7, Figure 8, Figure 9, Figure 10, Figure 11, Figure 12, Figure 13, Figure 14 and Figure 15.
Figure 15.
Boxplot of Total Path Weight (TPW) Distribution Across Four Different Paths in NYC.
The scatter plots in Figure 6 and Figure 16 illustrate the distribution of total path weights and the corresponding correlation coefficients for several complex paths in the two network topologies. These results validate the high correlation between the DGSFN-DR algorithm and the actual optimal paths, demonstrating superior stability and accuracy.
Figure 16.
Scatter of Total Path Weight (TPW) Across Four Different Paths in NYC.
Figure 7 and Figure 14 present examples of routing selections at specific time steps, providing an intuitive demonstration of the DGSFN-DR algorithm’s path optimization capability in dynamic network environments. On both the NSFNET and NYC network topologies, the DGSFN-DR algorithm selects routes that align with the true optimal paths in most time steps, further confirming its practical value in dynamic routing optimization.
Figure 17 illustrates the link delays, the corresponding true link weights of the NSFNET network at a specific time step during the experiment, and the link weights utilized by the DSP and DGSFN-DR algorithms. Links with higher delays consistently exhibit larger weights, which decreases their likelihood of being selected. For example, links such as s10 → s11, s0 → s1, and s3 → s4 demonstrate higher delays and larger weights. In contrast, links such as s10 → s9 and s5 → s12 show smaller weights, indicating lower delays.
Figure 17.
Link Delays and Corresponding Link Weights in the NSFNET Network.
However, regarding the selection probabilities of these links, DSP tends to select links with probabilities that are inconsistent with the actual optimal choices. Overall, the predicted link weights generated by DGSFN-DR align more closely with the trends of the true link weights, whereas the weights used by DSP deviate significantly from the true weights. As a result, DGSFN-DR is able to identify paths that are closer to the optimal ones.
In the experiment, the number of times each link was selected and its usage proportion in the shortest path was recorded for the DGSFN-DR algorithm when configuring the s0 → s9 route in the NSFNET network. The statistical results are shown in Figure 18.
Figure 18.
Link Utilization for the s0 → s9 Route Configured by the DGSFN-DR Algorithm in the NSFNET Network.
Based on Table 12 and Figure 18, it can be observed that in the computation of the s0 → s9 route using the DGSFN-DR algorithm, the most frequently utilized link is s0 → s3, with the highest proportion of 10.6%, followed by s3 → s8 with a proportion of 9.1%. The most frequently used path is s0 → s3 → s8 → s9, accounting for approximately 30.78%.
Table 12.
Statistical Results and Proportions of the Top 10 Most Frequently Used Paths for the s0 → s9 Route by the DGSFN-DR Algorithm.
5.6. Analysis of the Application Results of Dynamic Routing with DGSFN-DR
Using the gravity model corresponding to Equation (23), traffic matrices of varying intensities were generated with TI = {20%, 40%, 60%}, representing 20%, 40%, and 60% of the network bandwidth, respectively. The DGSFN-DR and DSP algorithms were applied to these traffic matrices, and the overall network performance was evaluated. The statistical results are presented in the following Table 13.
Table 13.
Network Performance Evaluation of NSFNET and NYC Under Different Traffic Loads Using DGSFN-DR.
Table 13 presents the experimental results comparing the prediction-based DGSFN-DR algorithm with the DSP algorithm across two network topologies. The DGSFN-DR algorithm consistently achieves better performance than DSP under all traffic intensities. For latency, DGSFN-DR reduces the average latency by over 6% across all traffic levels, with reductions of 8.427% and 10.969% observed under high-traffic conditions in the NSFNET and NYC topologies, respectively. For jitter, DGSFN-DR achieves significant improvements, reducing jitter by over 5% across all traffic intensities and achieving a 13.516% reduction under high-traffic conditions in the NYC topology. Packet loss and available bandwidth also show improvements, with performance gains ranging from 4% to 15%.
Under high-load conditions across various network topologies, the DGSFN-DR algorithm consistently achieves superior adaptability and optimization compared to DSP. In the smaller NSFNET topology, DGSFN-DR delivers moderate performance improvements under low traffic conditions, with more pronounced gains observed at medium and high traffic levels. In contrast, the more complex NYC topology benefits significantly from DGSFN-DR, which achieves substantial reductions in latency, improved bandwidth utilization, and lower packet loss rates. These findings emphasize the algorithm’s capability to handle complex, high-traffic scenarios and its potential for optimizing large-scale network deployments.
The DG-SFP framework incorporates the dual-graph spatiotemporal link state prediction model (DG-SFN) to enhance routing performance. By leveraging the adjacency matrices of both the network topology and its line graph representation, the GAT effectively captures the spatial distribution and propagation dependencies of network traffic across links. Simultaneously, the RNN models the temporal trends and magnitude variations of network traffic. This integration of spatiotemporal dependency features enables the DGSFN-DR algorithm to adapt to the spatial dependencies of diverse network topologies and account for the temporal delays introduced by routing algorithms, improving its flexibility and adaptability.
The experimental results further validate the routing optimization capabilities of the DGSFN-DR algorithm under high-traffic conditions. The algorithm dynamically selects optimal paths by leveraging its flow-awareness and adaptability, significantly reducing overall network costs. It achieves these improvements without requiring extensive modifications to the existing network infrastructure or control mechanisms, demonstrating its practicality for real-world deployments.
5.7. Simulation Realism and Practical Deployment Considerations
We recognize that our evaluation is conducted in simulated SDN environments on benchmark topologies (e.g., NSFNET and NYC). Consequently, our empirical results should be interpreted with respect to the modeling assumptions adopted in the simulation. To strengthen deployment relevance, we intentionally avoid a purely stationary synthetic workload. In particular, the traffic workload is generated using Google trace statistics, and routing performance is evaluated under multiple pressure levels (LOW/MID/HIGH), following the experimental protocol used throughout the manuscript. This setting allows us to examine the proposed prediction-guided routing framework across different congestion intensities, rather than reporting performance at a single operating point.
A central feature of our approach is the prediction-to-weight optimization pipeline: DG-SFN predicts future link-state metrics at time , and DGSFN-DR derives routing decisions by minimizing the accumulated predicted path weight computed from the predicted link weights (Equations (3) and (4)). Accordingly, the key assumption for practical applicability is not that the controller/actuation delay is negligible, but that the information produced within the considered prediction horizon remains informative for the routing decision at the corresponding time scale. Under this time-scale consistency, improvements are meaningful because the routing computation is explicitly driven by prediction-derived weights, and the gains are observed consistently across different traffic regimes.
While the current simulation framework does not fully reproduce all system-level effects in real deployments (e.g., detailed controller/actuation delays, device-specific queueing behaviors, and rare failure/recovery dynamics), our results provide evidence under traffic patterns grounded in real-world measurements and under varying congestion pressures. In future work, we will further study implementation-specific factors such as controller sampling granularity and time misalignment between prediction and actuation, and evaluate the method on real SDN controllers and testbeds to quantify their impact at finer time scales.
Robustness under adversarial or malicious traffic (limitation): our current simulation framework validates the prediction-to-routing pipeline under realistic but non-adversarial workload generation (gravity model traffic matrices seeded by Google trace statistics). In real SDN deployments, the observed telemetry and derived link-state metrics may be affected by adversarial or malicious traffic patterns, leading to distribution shift and potentially biased predictions. Concretely, such interference may impact (i) the telemetry-derived feature statistics used by DG-SFN, (ii) the mapping from predicted link-state metrics to link weights , and consequently (iii) the routing decision derived from Dijkstra on predicted weights. Therefore, the reported performance should be interpreted as evidence of effectiveness under normal traffic variability rather than robustness against adversarial manipulations. As future work, we plan to conduct robustness evaluations under explicit threat models, for example, by injecting controlled traffic bursts and distribution shifts (to emulate anomalous workloads), and by simulating telemetry corruption/noise or systematic metric bias before DG-SFN inference to measure how performance degrades and whether additional stabilization strategies (e.g., prediction smoothing or uncertainty-aware weighting) are needed.
Limitation regarding cybersecurity threats (e.g., web shells and jailbreak attacks): the current evaluation primarily focuses on prediction-to-routing performance under realistic network traffic and system operations, and does not include direct assessment against cybersecurity threats such as web shells or jailbreak attacks. These threats typically require threat-specific modeling and additional detection/mitigation mechanisms (e.g., application-layer compromise detection or model-behavior containment), which are beyond the scope of our current study on spatiotemporal fusion-based QoS prediction and dynamic routing optimization. Nevertheless, we note that certain cybersecurity incidents can indirectly affect the proposed pipeline by altering telemetry measurements and inducing distribution shift, potentially leading to biased predicted link states and suboptimal routing decisions. Therefore, the reported results should be interpreted as effectiveness under non-adversarial operational conditions. As future work, we plan to extend evaluation with explicit threat models, including telemetry-level perturbations (e.g., measurement noise/bias and controlled workload anomalies) to assess robustness of the prediction-to-routing pipeline under malicious interference, and—if additional LLM-based components are introduced for explanation—an evaluation of safety/robustness against prompt-manipulation and jailbreak-like behaviors.
Privacy and ethical evaluation scope: While our experiments primarily report performance-oriented metrics (e.g., latency and jitter) to validate the effectiveness of spatiotemporal prediction and prediction-guided routing, we acknowledge that modern edge-based AI systems must also consider privacy and ethical aspects when handling network telemetry and producing routing decisions. In this work, we treat privacy and ethical considerations as deployment constraints and provide a corresponding design rationale rather than conducting a comprehensive privacy/ethics benchmark. Specifically, our edge-integrated pipeline mitigates potential privacy exposure by processing telemetry-derived information as task-oriented features for prediction, and by restricting the decision outputs to the optimization-related artifacts (predicted link states and routing actions) instead of retaining unnecessary raw measurements. Moreover, ethical usability requires that routing decisions can be interpreted by operators when abnormal behaviors are detected, so that automated control remains accountable and aligned with operational intent. We leave a systematic privacy/ethics evaluation (e.g., quantifying information leakage from outputs and conducting operator-centric usability/interpretability studies) as future work, where concrete threat models and governance-oriented evaluation protocols can be defined for edge SDN deployments.
Data integrity and privacy protection in multi-tenant SDN: In multi-tenant SDN environments, multiple stakeholders share the same physical infrastructure while requiring isolation of their data and control decisions. To support this setting, our framework is designed such that privacy-preserving preprocessing is applied to telemetry measurements before they are consumed by the inference pipeline, thereby reducing the exposure of tenant-specific raw measurements during feature preparation and prediction. Moreover, the privacy wrapper parameterized by can be instantiated with standard mechanisms (e.g., clipping/noise addition and/or encryption-oriented preprocessing), which helps prevent unauthorized inference from raw telemetry and limits information leakage across tenants. On the data integrity side, the predicted link-state outputs and derived routing decisions are generated from the transformed inputs within the edge decision cycle, which constrains the influence of cross-tenant interference to the modeled feature space rather than allowing direct manipulation of routing logic with untrusted raw telemetry. In practice, multi-tenant integrity can be further strengthened by enforcing tenant-scoped access control to telemetry streams, separating per-tenant control parameters, and validating the freshness and consistency of measurements used for prediction and routing. Together, these design choices support privacy-aware and integrity-preserving operation of the prediction-to-routing pipeline in multi-tenant SDN deployments, aligning with international expectations for responsible AI system data handling.
5.8. Scalability with Topology Size and Traffic Load
To evaluate practical scalability, we report a unified assessment that jointly considers (i) the decision-cycle runtime decomposition into QoS prediction and routing (Dijkstra on predicted edge weights), (ii) peak controller memory (peak RSS), and (iii) controller overhead under dynamic traffic demand using a throughput-based proxy. All numeric results are summarized in Table 14, and the combined visualization is given in Figure 19 (left: runtime, middle: memory, right: controller overhead).
Table 14.
Scalability analysis on NYC-like topologies: runtime decomposition, peak memory, and controller throughput under load.
Figure 19.
Scalability summary (runtime/peak memory/controller overhead).
(1) Runtime scaling (decision-cycle decomposition). As shown in the left panel of Figure 19, the decision-cycle time is dominated by the QoS prediction stage, while Dijkstra routing time is orders of magnitude smaller. As topology size increases from to , the prediction time remains nearly constant at 9.999–9.738 ms (about variation), whereas the routing time stays in a very small range of 0.042–0.030 ms. Therefore, within the evaluated scale, the overall decision-cycle latency does not exhibit meaningful degradation as the topology becomes larger and denser.
(2) Memory scaling (peak controller RSS). The middle panel of Figure 19 reports peak controller memory. Peak RSS increases slightly from 1378.63 MB to 1381.57 MB as grows from 9 to 28, staying within a narrow band of 1378.63–1381.57 MB. This indicates stable memory behavior and no observed memory bottleneck when scaling to denser topologies.
(3) Controller overhead under traffic load. The right panel of Figure 19 assesses controller overhead under dynamic demand. Throughput (decisions/s) remains high across load levels 1–16, ranging from 96.57 to 99.94 decisions/s (Table 14). Although there is a temporary dip at load level 4 (96.57 decisions/s), throughput recovers at higher loads and reaches the peak near load 12 (99.94 decisions/s), and only decreases slightly at load 16 (98.59 decisions/s). Overall, the small variation in throughput suggests that the controller does not experience throughput collapse under increased request pressure.
(4) Mechanism interpretability (QoS-to-weight contribution). To provide interpretability for the scalable routing step, we visualize the contribution of QoS components to the constructed link cost in Figure 20. This highlights how QoS-aware predicted weights are formed while keeping the routing stage computationally light.
Figure 20.
Edge weight theta breakdown (sampled edges): average contribution of latency, jitter, plr, and bw cost to the constructed link cost.
5.9. Privacy-Preserving and GDPR-Aware Real-World Deployment Feasibility
In edge-integrated SDN deployments, practical realization requires not only accurate spatiotemporal prediction and effective dynamic routing, but also that the end-to-end decision cycle remains feasible under data-handling requirements. In this regard, privacy-preserving mechanisms are commonly applied before the inference pipeline consumes network state measurements. In our prediction-to-routing architecture (DG-SFN followed by DGSFN-DR), we model the privacy effect at the runtime level as an additional preprocessing overhead within the edge decision cycle. Specifically, privacy-enabled inference can be expressed as
where denotes a privacy-preserving transformation (e.g., clipping/noise addition and/or privacy-oriented preprocessing) with privacy-related parameters . Accordingly, the edge-side decision-cycle latency can be decomposed as
where is the additional runtime overhead induced by privacy-preserving preprocessing, is the DG-SFN inference latency, and is the routing time (Dijkstra on predicted link weights).
(1) Effect on inference speed and real-time feasibility. Our scalability results indicate that the routing component is orders of magnitude smaller than the QoS prediction component (i.e., ), meaning that privacy mainly affects the decision cycle through the additive term within the prediction stage budget. To maintain control-loop real-time constraints, edge-integrated SDN systems require so that stays within the sampling interval. Under the tested topology scales, the prediction-time range remains approximately – ms, while the routing time stays in – ms. Therefore, even when privacy-preserving preprocessing is enabled, the overall decision-cycle latency remains dominated by DG-SFN inference and does not alter the routing-time bottleneck structure, supporting the practical applicability of the prediction-guided routing strategy.
(2) GDPR-oriented real-world deployment considerations. Beyond timing feasibility, real-world SDN operations must also align with regulatory requirements such as the General Data Protection Regulation (GDPR). Although our work primarily focuses on spatiotemporal fusion and dynamic routing optimization, the proposed edge-integrated design facilitates GDPR-aware deployment practices by clarifying where data is processed and how it is utilized. In our pipeline, the network state used by DG-SFN is treated as telemetry-derived features for predicting future link states, and the inference and routing decisions are executed in an edge-integrated SDN environment. This reduces reliance on centralized aggregation of raw telemetry and supports data minimization by using only the feature representations required for prediction and decision-making. Moreover, the predicted link-state outputs and routing decisions are used for the explicit purpose of network dynamic routing optimization and QoS improvement (latency/jitter/packet loss/bandwidth). Practical deployments can further follow storage limitation principles (e.g., short-term buffering aligned with the decision interval and avoiding unnecessary retention of raw measurements), which helps limit potential regulatory risk.
Overall, this section bridges the gap between deployment feasibility and regulatory-aware operation by (i) explaining how privacy-related preprocessing contributes additively to the edge decision latency without changing the routing bottleneck, and (ii) positioning the edge-integrated pipeline as a natural fit for GDPR-oriented data-handling practices.
6. Conclusions
The centralized control and programmability of SDNs enable flexible and optimized on-demand complex network control and management for load balancing and QoS improvement. This paper proposes a network state-aware dual graph spatiotemporal prediction framework (DG-SFP) for SDN dynamic routing optimization (DGSFN-DR). In our framework, we first represent the network topology as a node adjacency matrix and a link adjacency matrix corresponding to the line graph of the network topology to capture the physical and logical structures of the network. Then, we employ GATs to generate spatiotemporal feature embeddings for nodes and links according to real-time network metric data collected from the SDN, e.g., latency, packet loss rate, bandwidth, and jitter. Subsequently, we slice these embeddings into t-step time series and leverage a GNN to extract the spatial dependency features of traffic across links. These features are then fed into an RNN to capture temporal dependency features between links to predict future network states. The DGSFN-DR dynamically adjusts routing strategies in the SDN according to the DG-SFN prediction results to achieve optimal path selection by minimizing the link weights. We conduct extensive simulation experiments to evaluate the effectiveness of the DG-SFN. The DG-SFN achieves over improvement of four performance metrics compared to the classical models of FC-LSTM, GRU, and Transformer, and achieves approximately improvement compared to SOTA graph-based models, such as STFAGN and GL-STGTN. Furthermore, the DGSFN-DR demonstrates superior flow awareness on network links compared to the DSP algorithm under three different traffic intensities and two distinct network topologies. The DGSFN-DR selects optimal paths according to the predicted link weights more effectively than DSP, achieving a to improvement on NSFNET and a to improvement on NYC, with particularly significant optimization effects under high traffic intensity and complex network topologies.
Author Contributions
Conceptualization, J.Z. (Jiaxian Zhu) and J.Z. (Jialing Zhao); methodology, W.B.; software, Z.L.; validation, C.Z. and T.Z.; writing—original draft preparation, J.Z. (Jiaxian Zhu); writing—review and editing, T.Z. All authors have read and agreed to the published version of the manuscript.
Funding
The research was supported by the National Natural Science Foundation (No. 62462021), the Guangxi Natural Science Foundation (No. 2026GXNSFAA00641306), the Guangdong Province University Key Field (No. 2023ZDZX3041), the Philosophy and Social Sciences Planning Project of Zhejiang Province (No. 25JCXK006YB), the Hainan Provincial Natural Science Foundation of China (No. 625RC716), the Guangdong Basic and Applied Basic Research Foundation (No. 2025A1515010197), Zhaoqing University Innovation Research Team Grant Project, and University-Level High-Caliber Training Project of Zhaoqing University (NO. gcc202607).
Data Availability Statement
The data and source code of the model presented in this paper can be obtained from the corresponding authors for non-commercial use.
Conflicts of Interest
The authors declare no conflicts of interest.
References
- Jain, S.; Kumar, A.; Mandal, S.; Ong, J.; Poutievski, L.; Singh, A.; Venkata, S.; Wanderer, J.; Zhou, J.; Zhu, M.; et al. B4: Experience with a globally-deployed software defined WAN. ACM SIGCOMM Comput. Commun. Rev. 2013, 43, 3–14. [Google Scholar] [CrossRef] [Scilit]
- Hong, C.Y.; Kandula, S.; Mahajan, R.; Zhang, M.; Gill, V.; Nanduri, M.; Wattenhofer, R. Achieving high utilization with software driven WAN. In Proceedings of the ACM SIGCOMM 2013 Conference on SIGCOMM, Hong Kong, China, 12–16 August 2013; pp. 15–26. [Google Scholar]
- Chen, Y.R.; Rezapour, A.; Tzeng, W.G.; Tsai, S.C. RL-routing: An SDN routing algorithm based on deep reinforcement learning. IEEE Trans. Netw. Sci. Eng. 2020, 7, 3185–3199. [Google Scholar] [CrossRef] [Scilit]
- Masoudi, R.; Ghaffari, A. Software defined networks: A survey. J. Netw. Comput. Appl. 2016, 67, 1–25. [Google Scholar] [CrossRef] [Scilit]
- Mao, B.; Tang, F.; Fadlullah, Z.M.; Kato, N. An intelligent route computation approach based on real-time deep learning strategy for software-defined communication systems. IEEE Trans. Emerg. Top. Comput. 2019, 9, 1554–1565. [Google Scholar] [CrossRef] [Scilit]
- Ding, M.; Guo, Y.; Huang, Z.; Lin, B.; Luo, H. GROM: A generalized routing optimization method with graph neural network and deep reinforcement learning. J. Netw. Comput. Appl. 2024, 229, 103927. [Google Scholar] [CrossRef] [Scilit]
- Rusek, K.; Suárez-Varela, J.; Mestres, A.; Barlet-Ros, P.; Cabellos-Aparicio, A. Unveiling the potential of graph neural networks for network modeling and optimization in SDN. In Proceedings of the 2019 ACM Symposium on SDN Research, San Jose, CA, USA, 3–4 April 2019; pp. 140–151. [Google Scholar]
- Rusek, K.; Suárez-Varela, J.; Almasan, P.; Barlet-Ros, P.; Cabellos-Aparicio, A. RouteNet: Leveraging graph neural networks for network modeling and optimization in SDN. IEEE J. Sel. Areas Commun. 2020, 38, 2260–2270. [Google Scholar] [CrossRef] [Scilit]
- Yang, S.; Liu, Y.; Cui, L.; Peng, Y.; Li, Z.; Leung, V.C. ER-OCN: Toward efficient network routing in ocean city based on deep reinforcement learning. Comput. Commun. 2024, 222, 97–107. [Google Scholar] [CrossRef] [Scilit]
- Zhang, X.; Zhang, J.; Si, W.; Liu, K. Dynamic Weight Adjusting Deep Q-Networks for Real-Time Environmental Adaptation. arXiv 2024, arXiv:2411.02559. [Google Scholar]
- Huang, L.; Ye, M.; Xue, X.; Wang, Y.; Qiu, H.; Deng, X. Intelligent routing method based on Dueling DQN reinforcement learning and network traffic state prediction in SDN. Wirel. Netw. 2024, 30, 4507–4525. [Google Scholar] [CrossRef] [Scilit]
- Tang, F.; Fadlullah, Z.M.; Mao, B.; Kato, N. An intelligent traffic load prediction-based adaptive channel assignment algorithm in SDN-IoT: A deep learning approach. IEEE Internet Things J. 2018, 5, 5141–5154. [Google Scholar] [CrossRef] [Scilit]
- Ferriol-Galmés, M.; Paillisse, J.; Suárez-Varela, J.; Rusek, K.; Xiao, S.; Shi, X.; Cheng, X.; Barlet-Ros, P.; Cabellos-Aparicio, A. RouteNet-Fermi: Network modeling with graph neural networks. IEEE/ACM Trans. Netw. 2023, 31, 3080–3095. [Google Scholar] [CrossRef] [Scilit]
- Almasan, P.; Suárez-Varela, J.; Rusek, K.; Barlet-Ros, P.; Cabellos-Aparicio, A. Deep reinforcement learning meets graph neural networks: Exploring a routing optimization use case. Comput. Commun. 2022, 196, 184–194. [Google Scholar] [CrossRef] [Scilit]
- Mao, B.; Tang, F.; Kawamoto, Y.; Kato, N. AI models for green communications towards 6G. IEEE Commun. Surv. Tutor. 2021, 24, 210–247. [Google Scholar] [CrossRef] [Scilit]
- Tang, F.; Kawamoto, Y.; Kato, N.; Liu, J. Future intelligent and secure vehicular network toward 6G: Machine-learning approaches. Proc. IEEE 2019, 108, 292–307. [Google Scholar] [CrossRef] [Scilit]
- Noor-A-Rahim, M.; Liu, Z.; Lee, H.; Khyam, M.O.; He, J.; Pesch, D.; Moessner, K.; Saad, W.; Poor, H.V. 6G for vehicle-to-everything (V2X) communications: Enabling technologies, challenges, and opportunities. Proc. IEEE 2022, 110, 712–734. [Google Scholar] [CrossRef] [Scilit]
- Asif, N.A.; Sarker, Y.; Chakrabortty, R.K.; Ryan, M.J.; Ahamed, M.H.; Saha, D.K.; Badal, F.R.; Das, S.K.; Ali, M.F.; Moyeen, S.I.; et al. Graph neural network: A comprehensive review on non-euclidean space. IEEE Access 2021, 9, 60588–60606. [Google Scholar] [CrossRef] [Scilit]
- Wu, Z.; Pan, S.; Chen, F.; Long, G.; Zhang, C.; Philip, S.Y. A comprehensive survey on graph neural networks. IEEE Trans. Neural Netw. Learn. Syst. 2020, 32, 4–24. [Google Scholar] [CrossRef] [Scilit]
- Wu, K.; Xu, C.; Yan, J.; Wang, F.; Lin, Z.; Zhou, T. Error-distribution-free kernel extreme learning machine for traffic flow forecasting. Eng. Appl. Artif. Intell. 2023, 123, 106411. [Google Scholar] [CrossRef] [Scilit]
- Yu, B.; Yin, H.; Zhu, Z. Spatio-temporal graph convolutional networks: A deep learning framework for traffic forecasting. arXiv 2017, arXiv:1709.04875. [Google Scholar]
- Guo, S.; Lin, Y.; Feng, N.; Song, C.; Wan, H. Attention based spatial-temporal graph convolutional networks for traffic flow forecasting. In Proceedings of the AAAI Conference on Artificial Intelligence, Honolulu, HI, USA, 29–31 January 2019; Volume 33, pp. 922–929. [Google Scholar]
- Li, M.; Zhu, Z. Spatial-temporal fusion graph neural networks for traffic flow forecasting. In Proceedings of the AAAI Conference on Artificial Intelligence, Online, 2–9 February 2021; Volume 35, pp. 4189–4196. [Google Scholar]
- Yang, S.; Li, H.; Luo, Y.; Li, J.; Song, Y.; Zhou, T. Spatiotemporal adaptive fusion graph network for short-term traffic flow forecasting. Mathematics 2022, 10, 1594. [Google Scholar] [CrossRef] [Scilit]
- Zheng, C.; Fan, X.; Wang, C.; Qi, J. Gman: A graph multi-attention network for traffic prediction. In Proceedings of the AAAI Conference on Artificial Intelligence, New York, NY, USA, 7–12 February 2020; Volume 34, pp. 1234–1241. [Google Scholar]
- Bai, L.; Yao, L.; Li, C.; Wang, X.; Wang, C. Adaptive graph convolutional recurrent network for traffic forecasting. Adv. Neural Inf. Process. Syst. 2020, 33, 17804–17815. [Google Scholar]
- Tumma, C.; Azmeera, R.; Ayyamgari, S.; Thumma, B.Y.R. Data security and privacy protection in artificial intelligence models: Challenges and defense mechanisms. Int. J. Sci. Res. Eng. Manag. 2025, 9, 1–9. [Google Scholar] [CrossRef] [Scilit]
- BinSahaq, A.; Sheltami, T.; Mahmoud, A.; Nasser, N. Fast and efficient algorithm for delay-sensitive QoS provisioning in SDN networks. Wirel. Netw. 2024, 30, 4607–4628. [Google Scholar] [CrossRef] [Scilit]
- Zhang, Y.; Chen, M. Performance evaluation of Software-Defined Network (SDN) controllers using Dijkstra’s algorithm. Wirel. Netw. 2022, 28, 3787–3800. [Google Scholar] [CrossRef] [Scilit]
- Mohammadi, R.; Javidan, R. EFSUTE: A novel efficient and survivable traffic engineering for software defined networks. J. Reliab. Intell. Environ. 2022, 8, 247–260. [Google Scholar]
- Devarajulu, V.S.; Kanipakam, S.; Kavarakuntla, T. Explainable Anomaly Detection in Cloud-Native Systems via RAG-Enhanced Vector Retrieval. In Proceedings of the 2025 6th International Conference on Information Science, Parallel and Distributed Systems (ISPDS); IEEE: New York, NY, USA, 2025; pp. 181–185. [Google Scholar]
- Zhou, J.; Cui, G.; Hu, S.; Zhang, Z.; Yang, C.; Liu, Z.; Wang, L.; Li, C.; Sun, M. Graph neural networks: A review of methods and applications. AI Open. 2020, 1, 57–81. [Google Scholar] [CrossRef] [Scilit]
- Velickovic, P.; Cucurull, G.; Casanova, A.; Romero, A.; Lio, P.; Bengio, Y. Graph attention networks. Stat 2017, 1050, 10-48550. [Google Scholar]
- Chen, M.; Wei, Z.; Huang, Z.; Ding, B.; Li, Y. Simple and deep graph convolutional networks. In Proceedings of the International Conference on Machine Learning, Virtual, 13–18 July 2020; pp. 1725–1735. [Google Scholar]
- Wang, X.; Bo, D.; Shi, C.; Fan, S.; Ye, Y.; Philip, S.Y. A survey on heterogeneous graph embedding: Methods, techniques, applications and sources. IEEE Trans. Big Data 2022, 9, 415–436. [Google Scholar] [CrossRef] [Scilit]
- Haeupler, B.; Hladík, R.; Rozhoň, V.; Tarjan, R.E.; Tetĕk, J. Universal optimality of dijkstra via beyond-worst-case heaps. In Proceedings of the 2024 IEEE 65th Annual Symposium on Foundations of Computer Science (FOCS); IEEE: New York, NY, USA, 2024; pp. 2099–2130. [Google Scholar]
- Al-Saadi, M.; Khan, A.; Kelefouras, V.; Walker, D.J.; Al-Saadi, B. SDN-based routing framework for elephant and mice flows using unsupervised machine learning. Network 2023, 3, 218–238. [Google Scholar] [CrossRef] [Scilit]
- Sharma, P.; Bhatia, V.; Prakash, S. Impact of fragmentation in quantum signal channel of quantum key distribution enabled optical networks. IET Quantum Commun. 2024, 5, 164–172. [Google Scholar] [CrossRef] [Scilit]
- Gunavathie, M.; Umamaheswari, S. Traffic-aware optimal routing in software defined networks by predicting traffic using neural network. Expert Syst. Appl. 2024, 239, 122415. [Google Scholar] [CrossRef] [Scilit]
- Reiss, C.; Tumanov, A.; Ganger, G.R.; Katz, R.H.; Kozuch, M.A. Towards understanding heterogeneous clouds at scale: Google trace analysis. Intel Sci. Technol. Cent. Cloud Comput. 2012, 84, 1–21. [Google Scholar]
- Ma, X.; Tao, Z.; Wang, Y.; Yu, H.; Wang, Y. Long short-term memory neural network for traffic speed prediction using remote microwave sensor data. Transp. Res. Part C Emerg. Technol. 2015, 54, 187–197. [Google Scholar]
- Dey, R.; Salem, F.M. Gate-variants of gated recurrent unit (GRU) neural networks. In Proceedings of the 2017 IEEE 60th International Midwest Symposium on Circuits and Systems (MWSCAS); IEEE: New York, NY, USA, 2017; pp. 1597–1600. [Google Scholar]
- Vaswani, A. Attention is all you need. In Advances in Neural Information Processing Systems; Curran Associates, Inc.: Red Hook, NY, USA, 2017. [Google Scholar]
- Li, Z.; Zhou, J.; Lin, Z.; Zhou, T. Dynamic spatial aware graph transformer for spatiotemporal traffic flow forecasting. Knowl.-Based Syst. 2024, 297, 111946. [Google Scholar] [CrossRef] [Scilit]
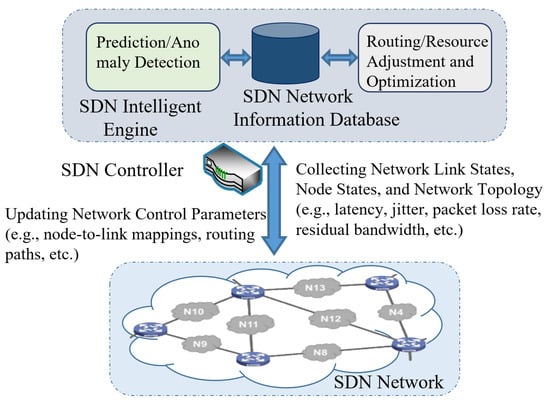
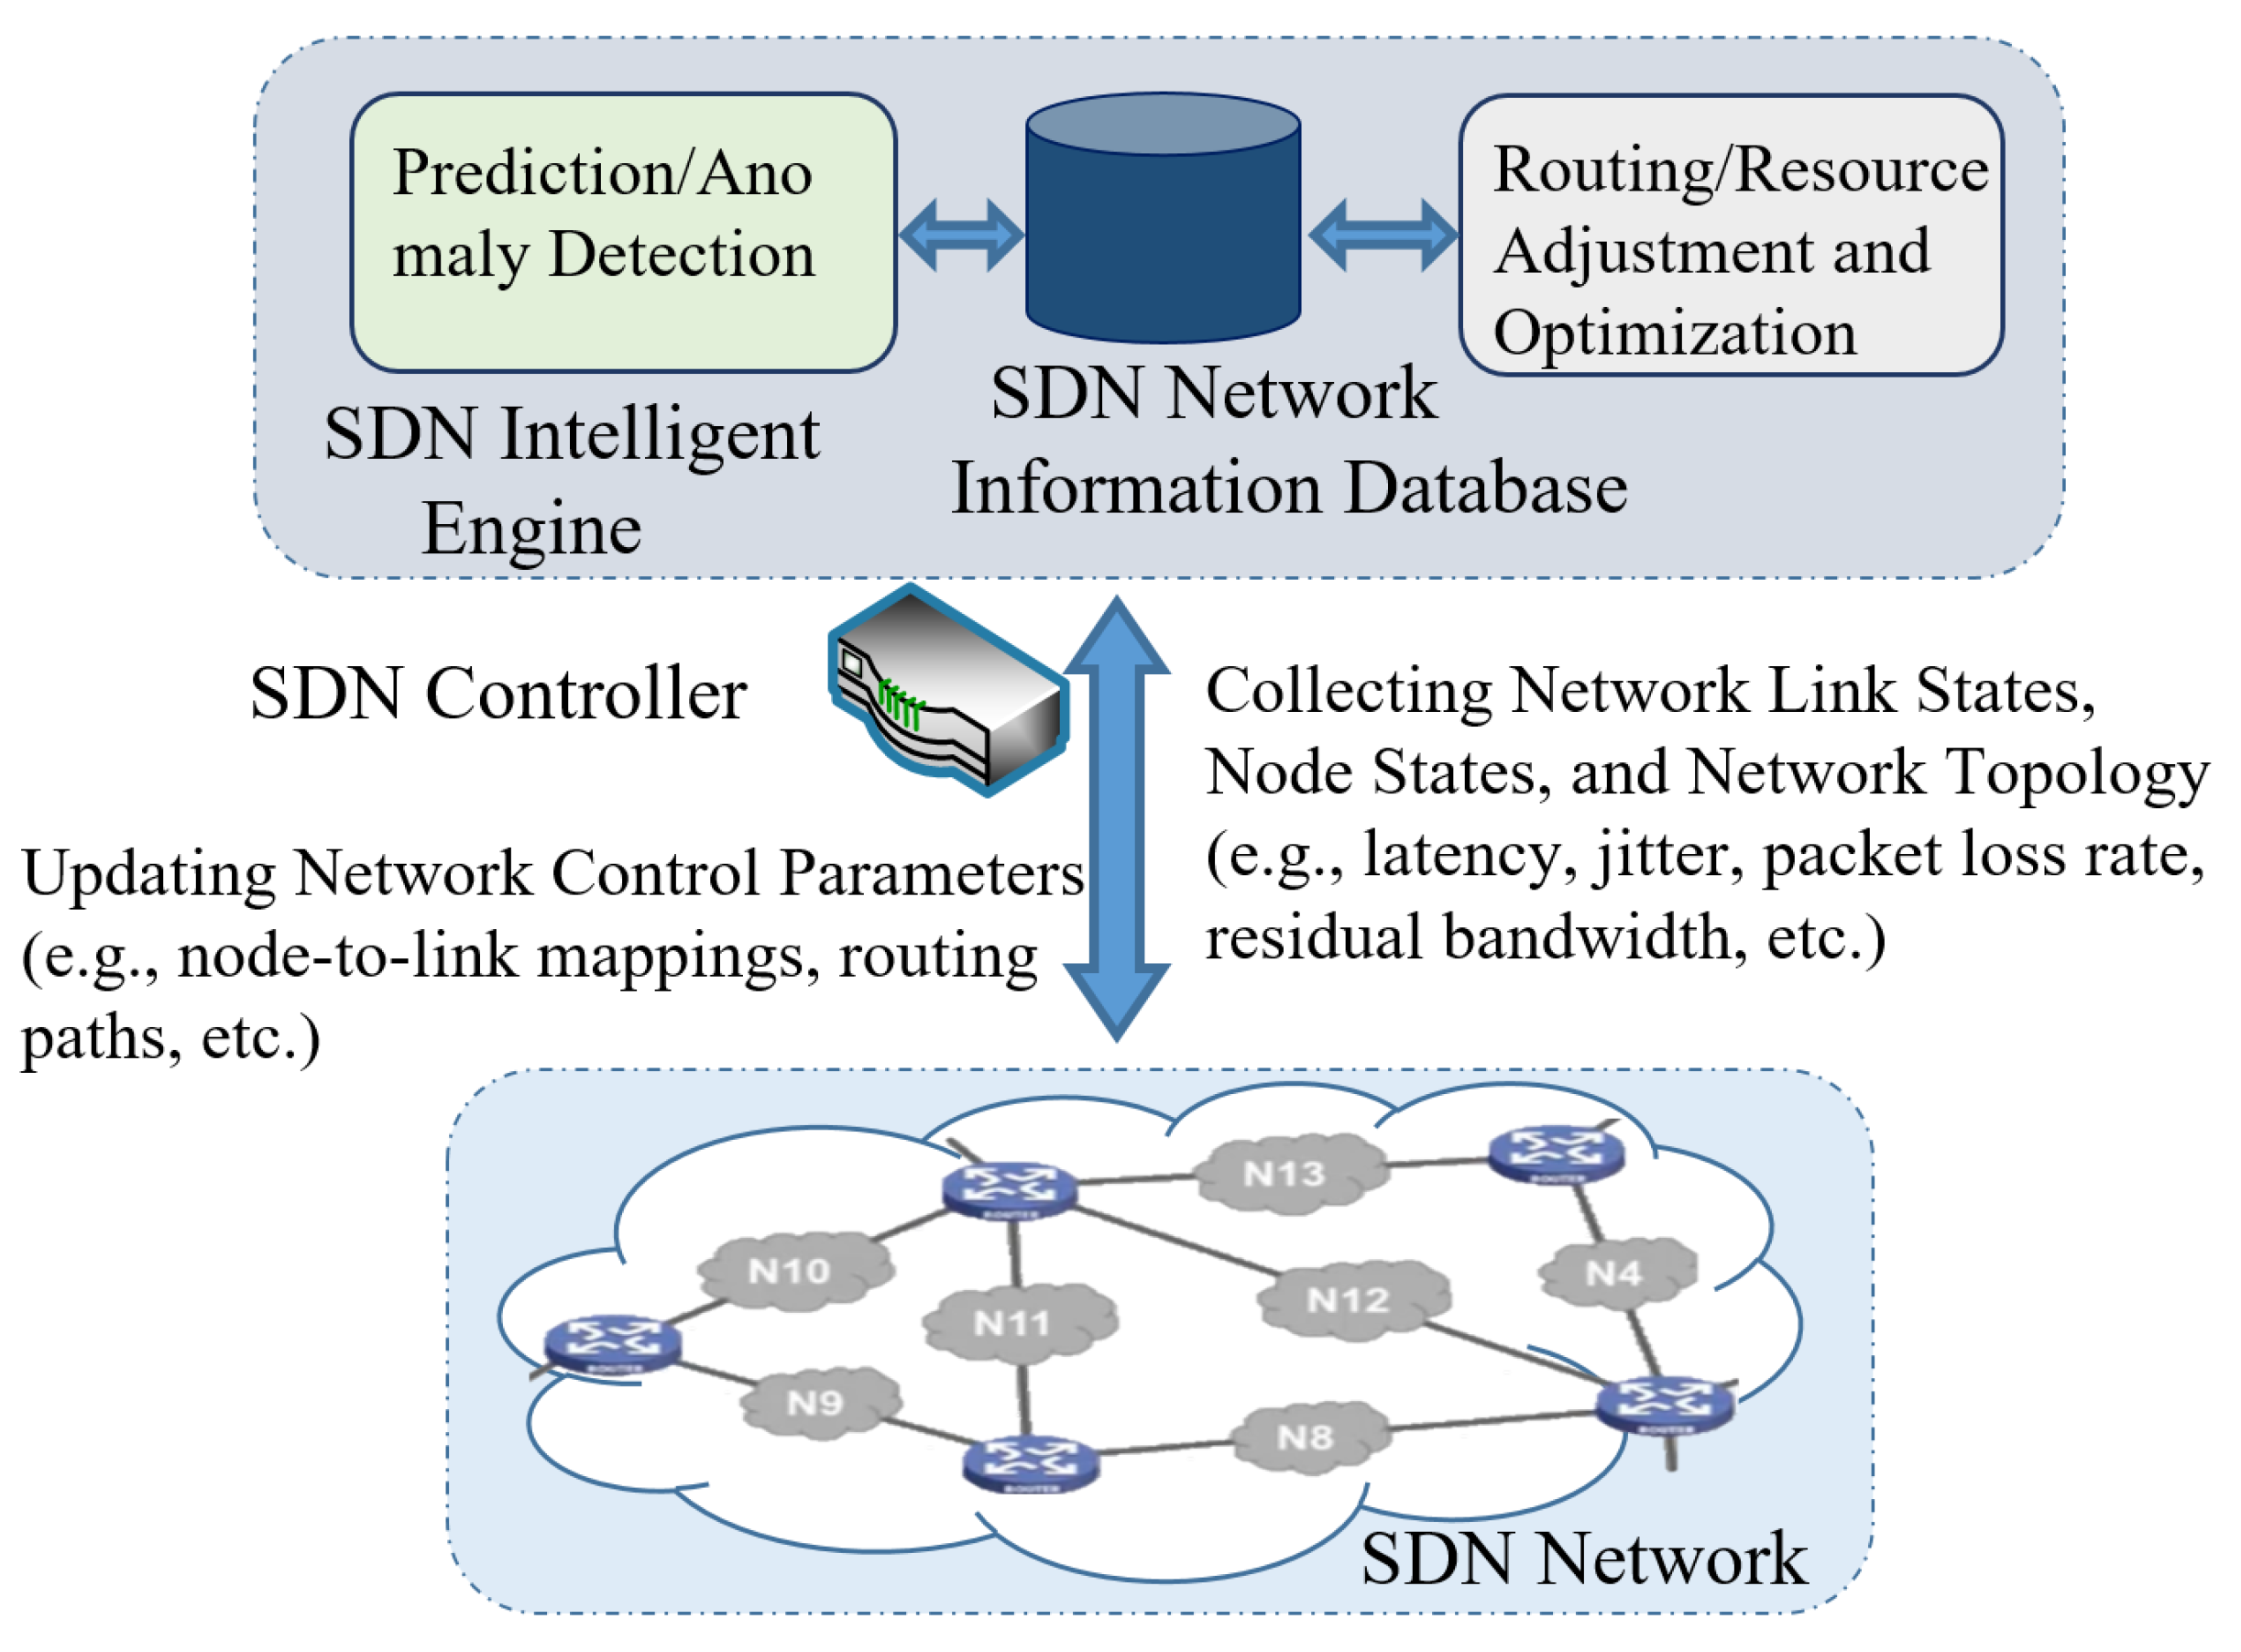
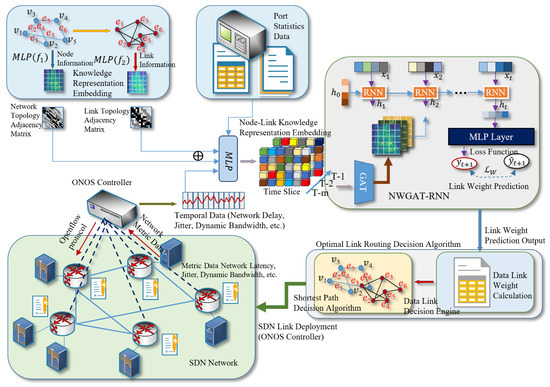
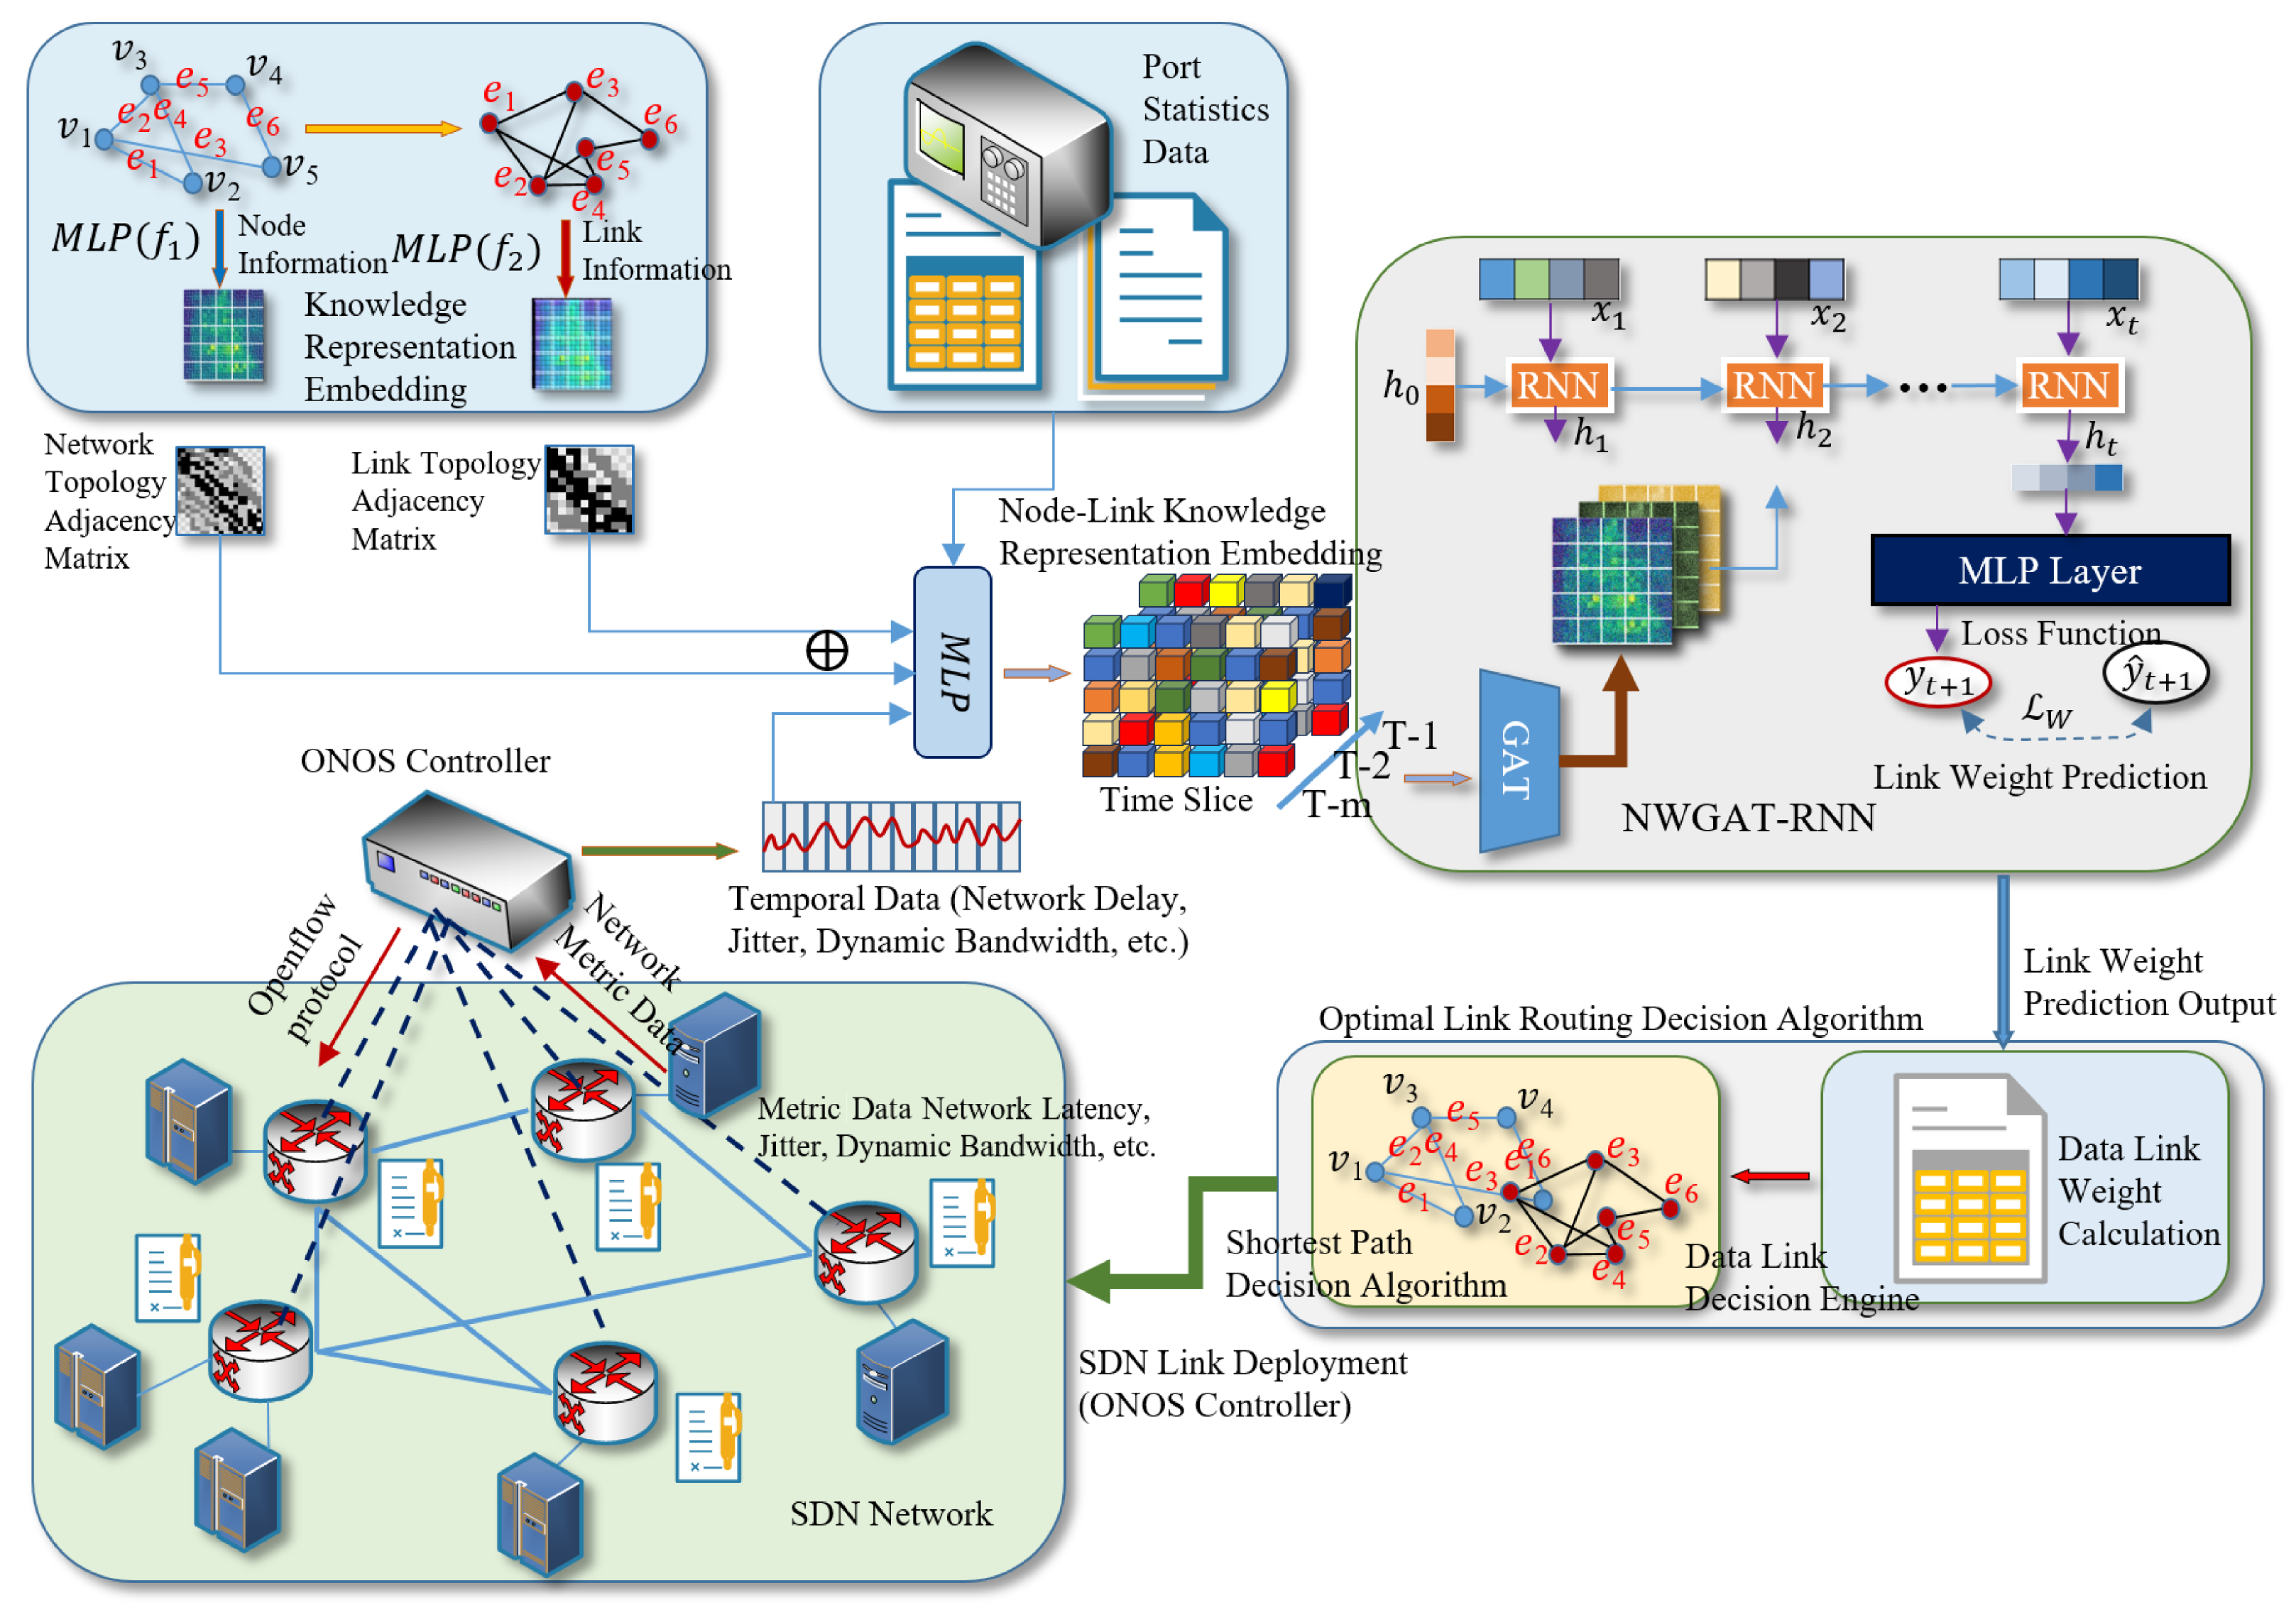
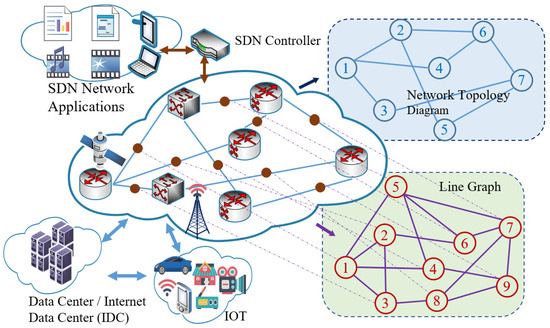
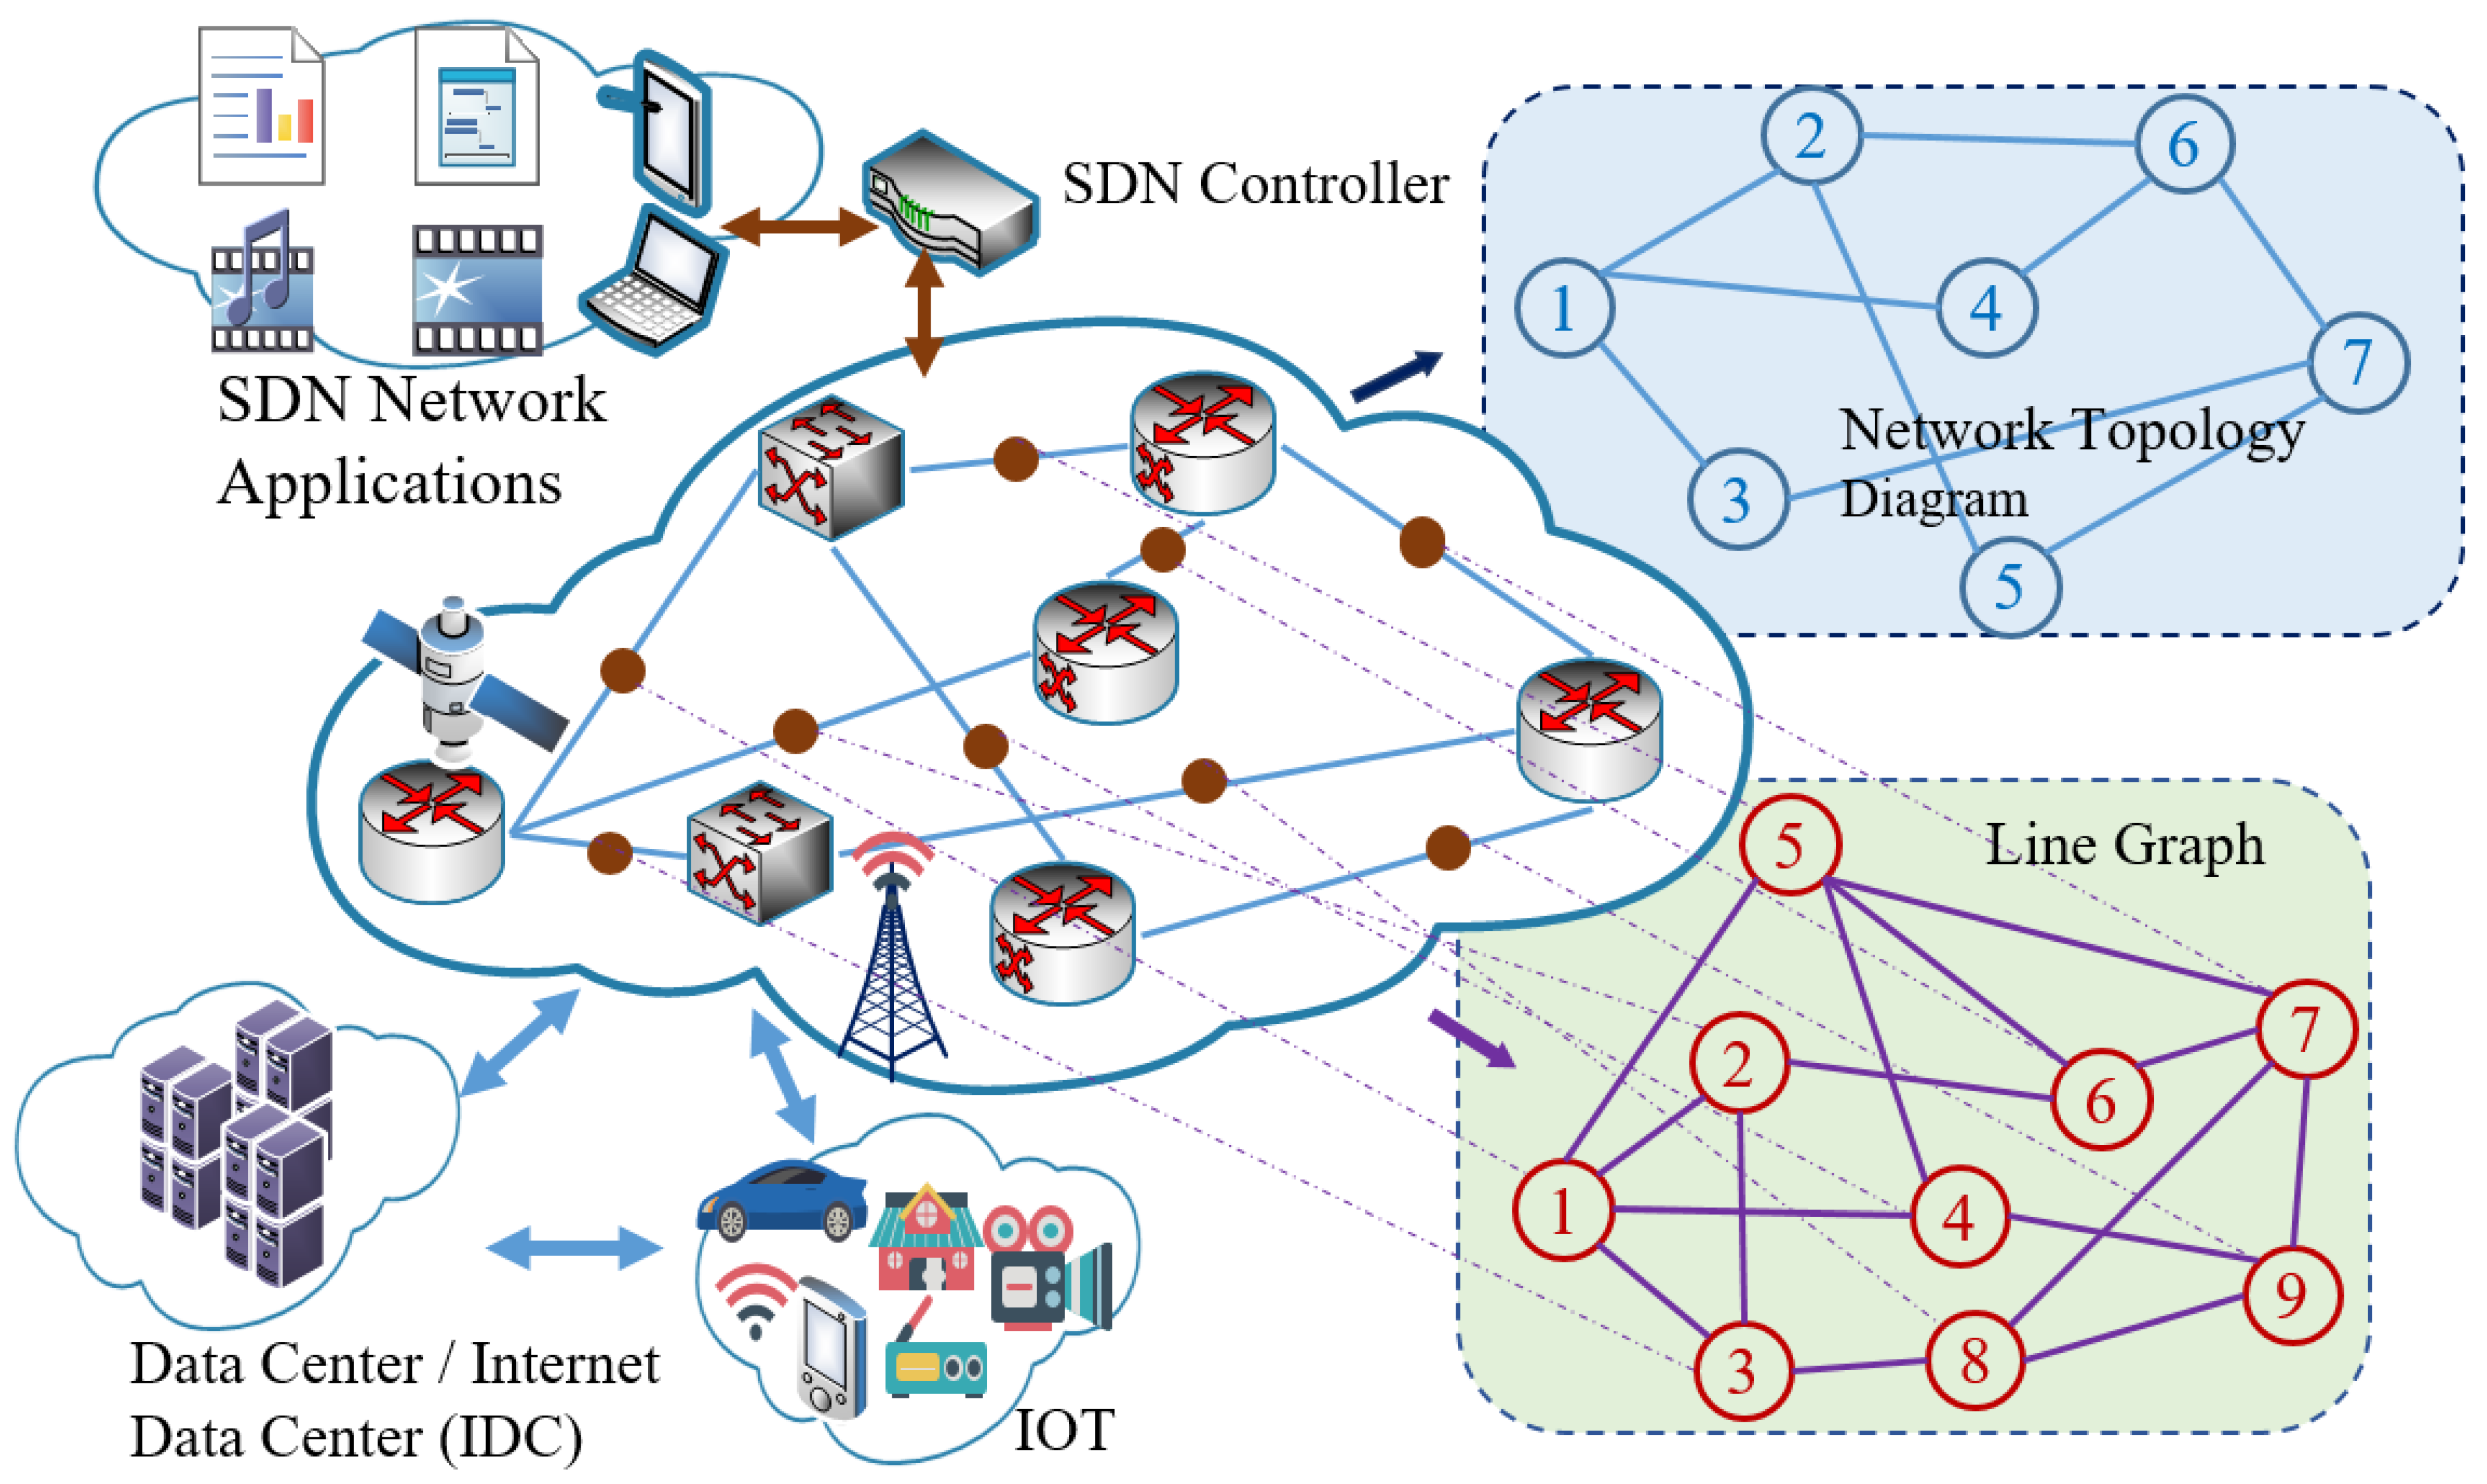
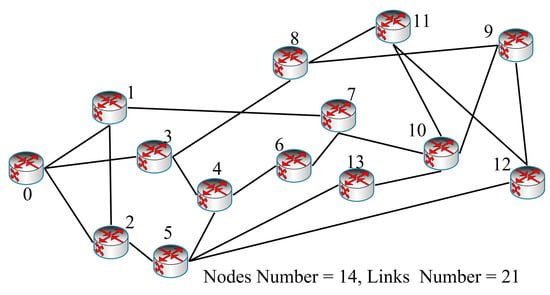
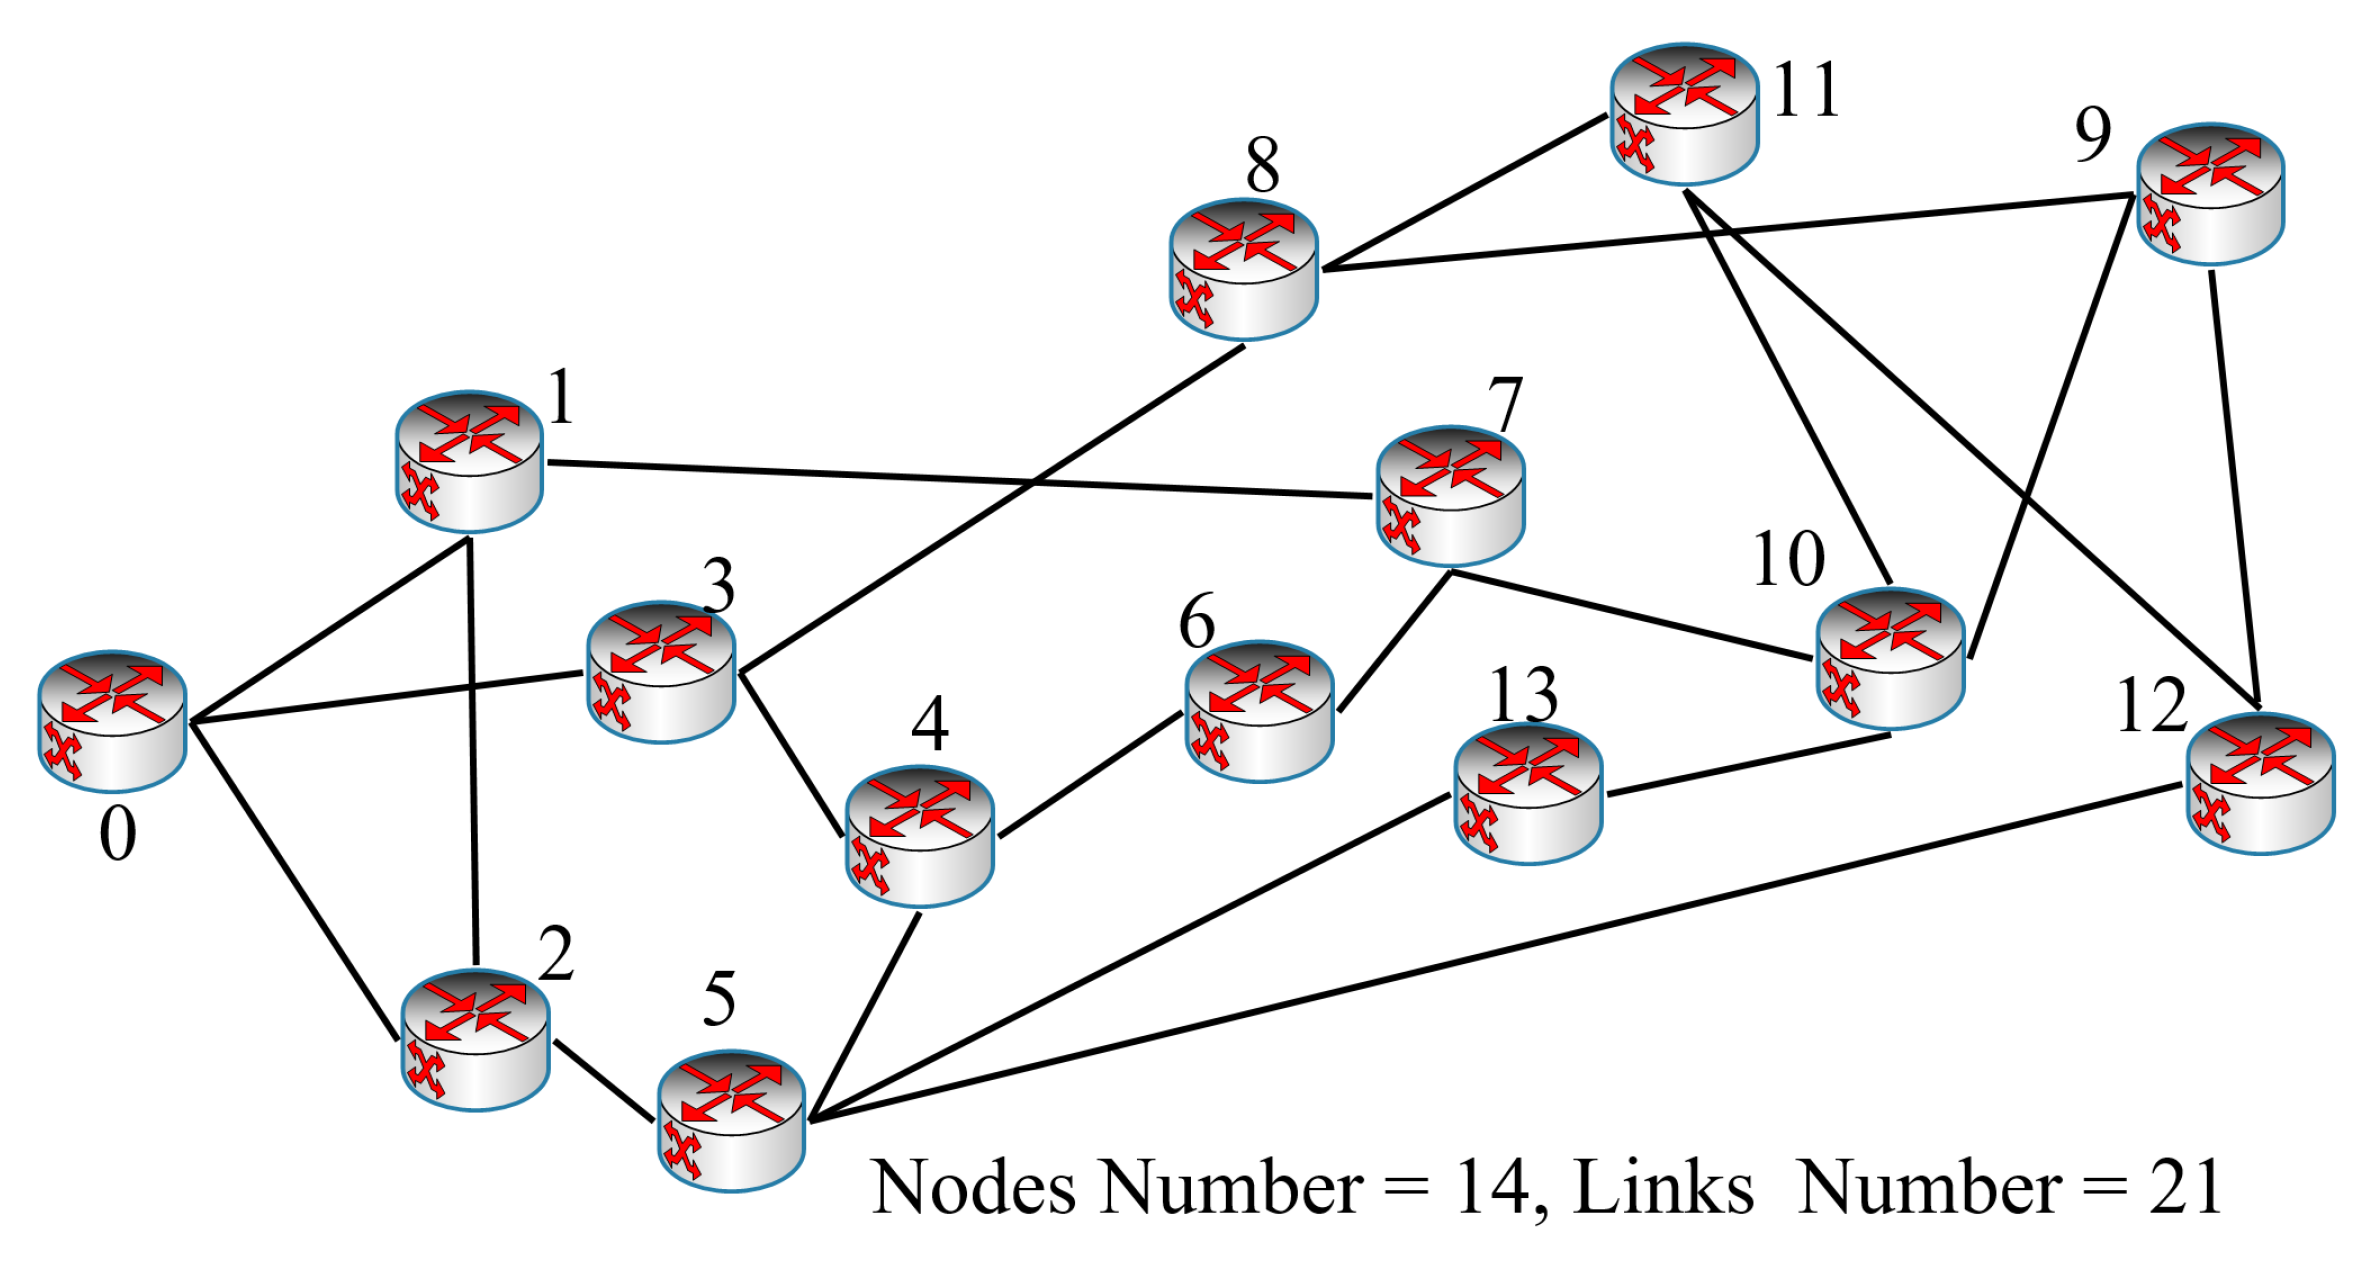
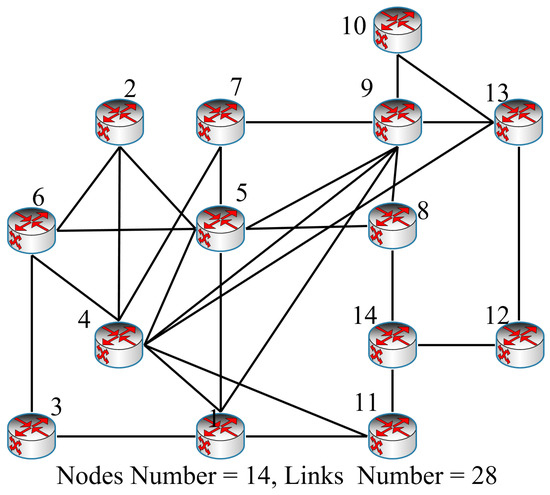
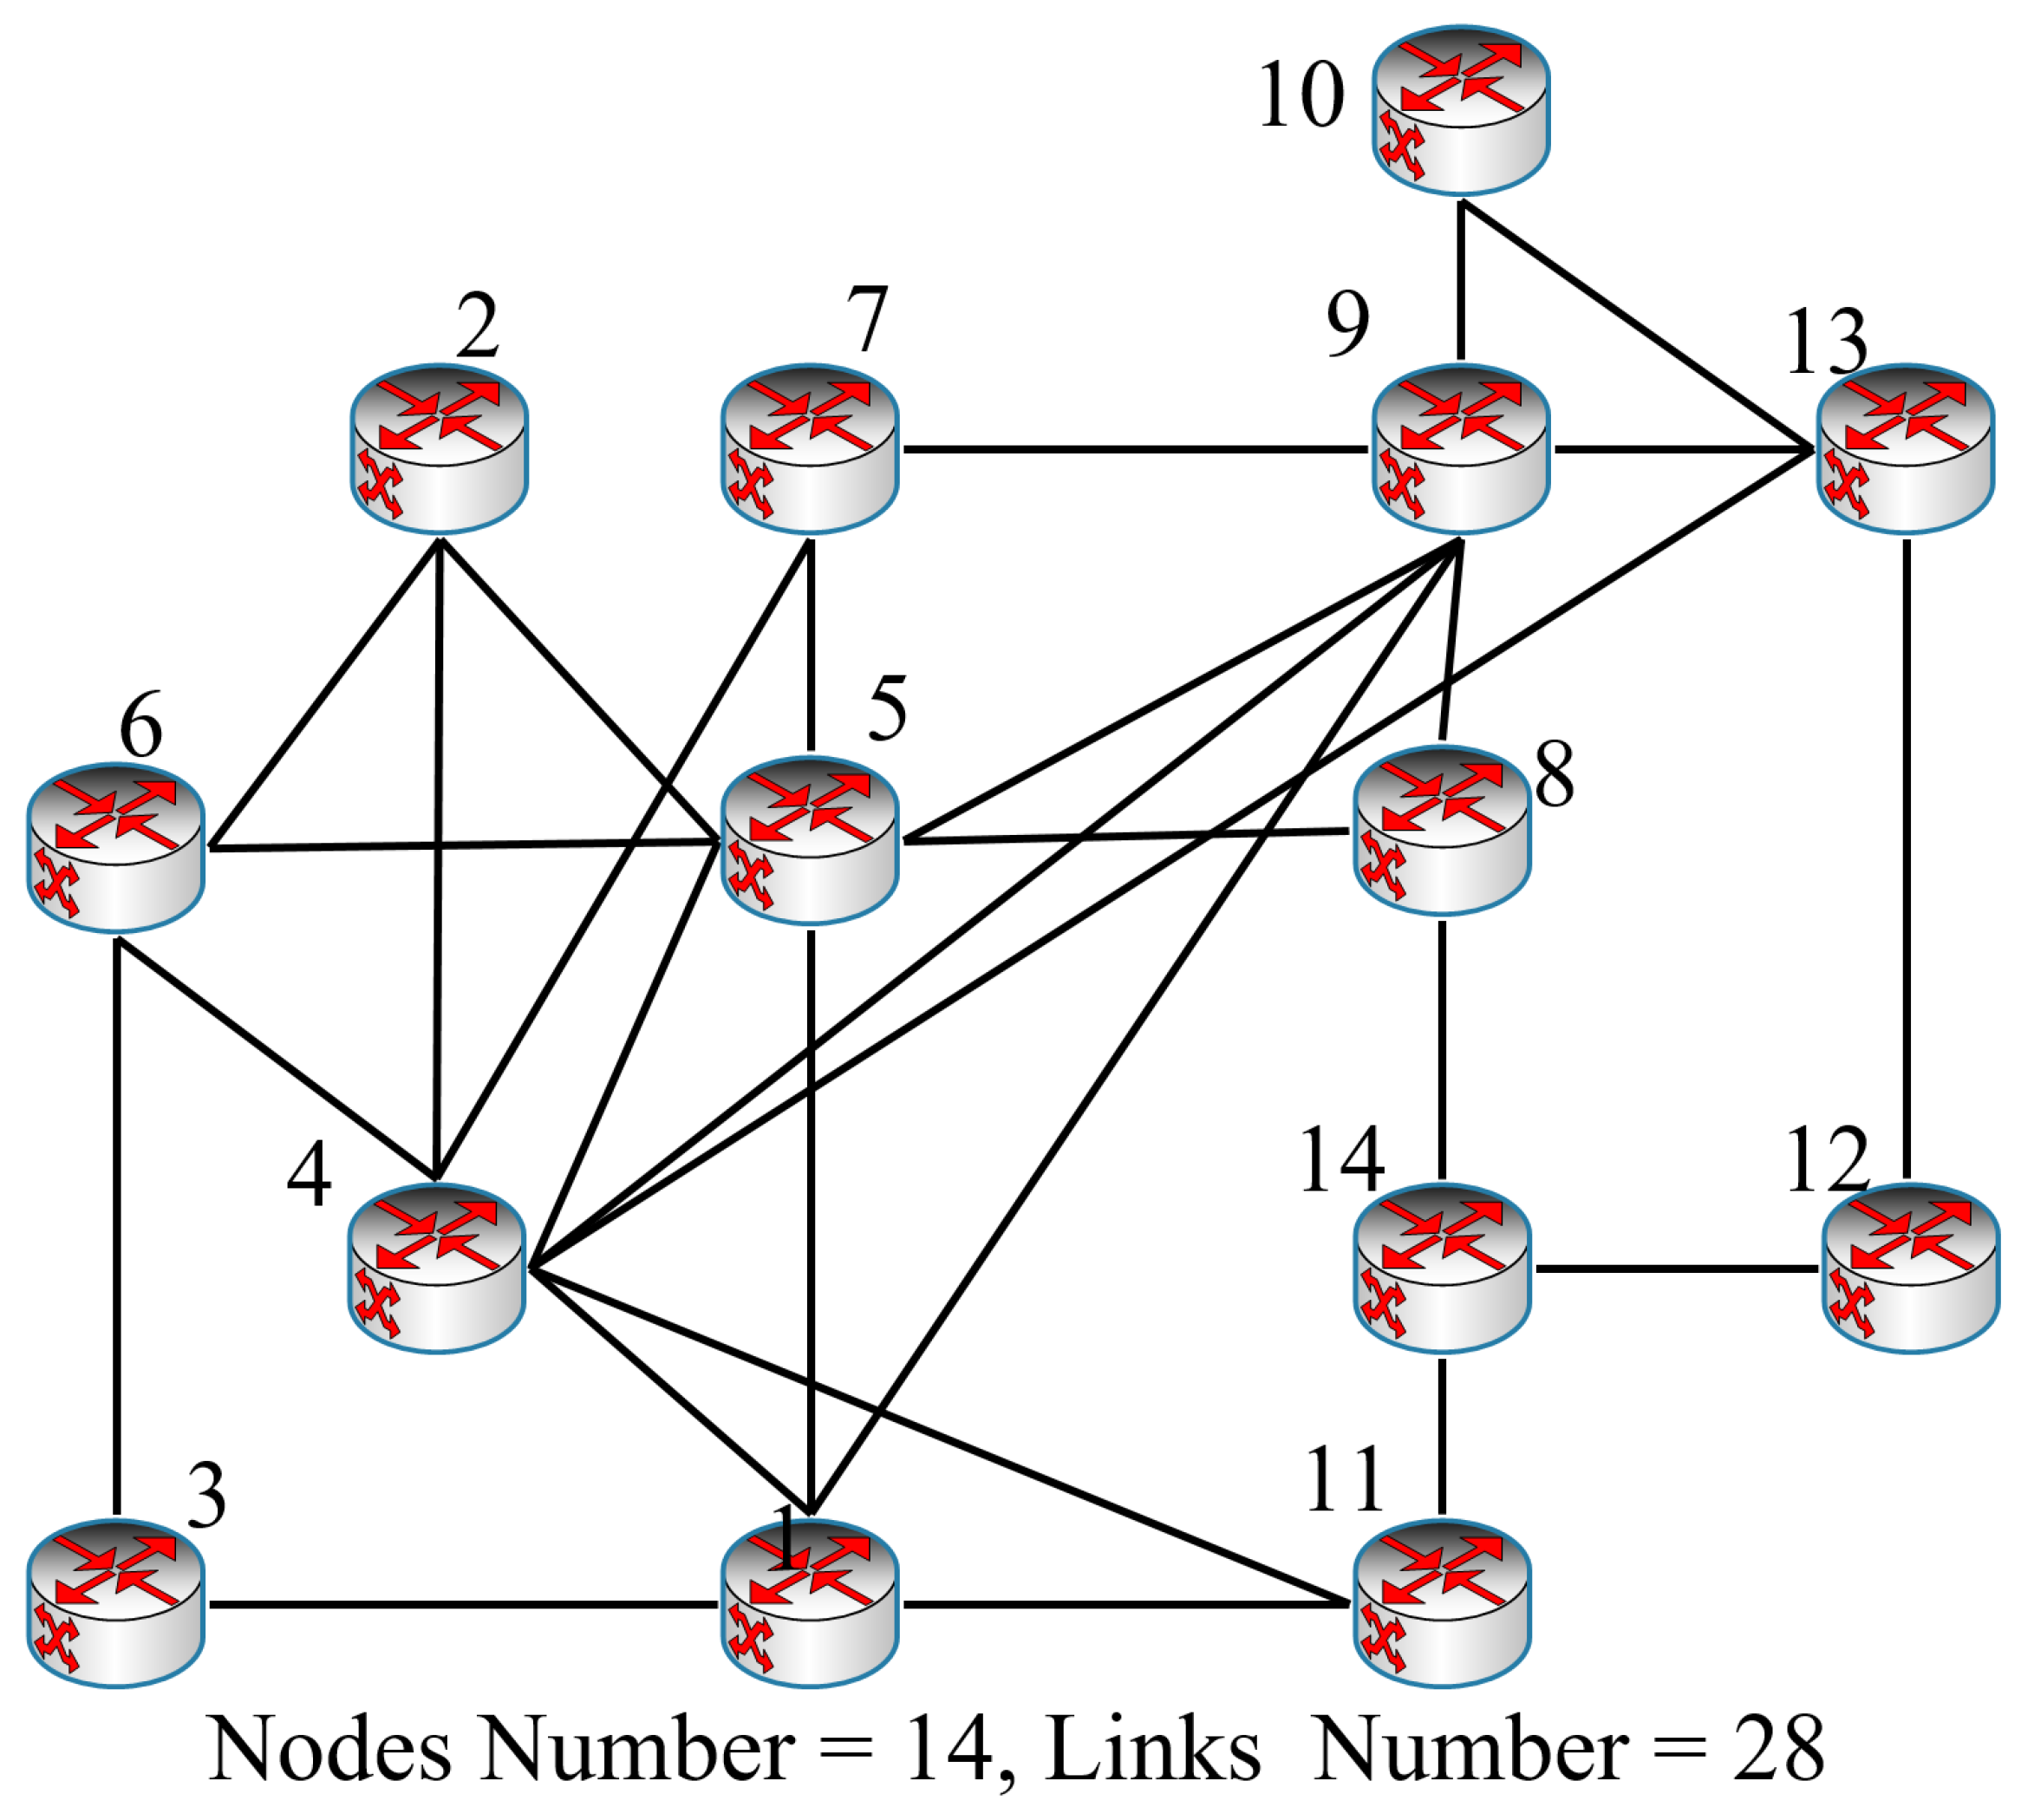
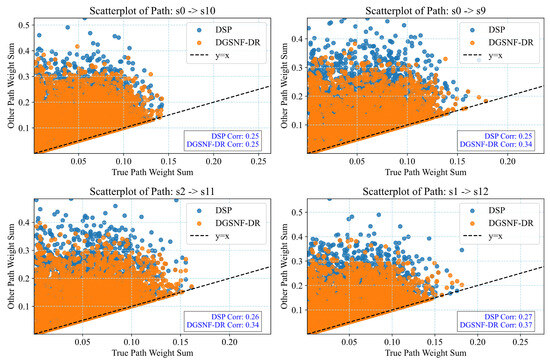
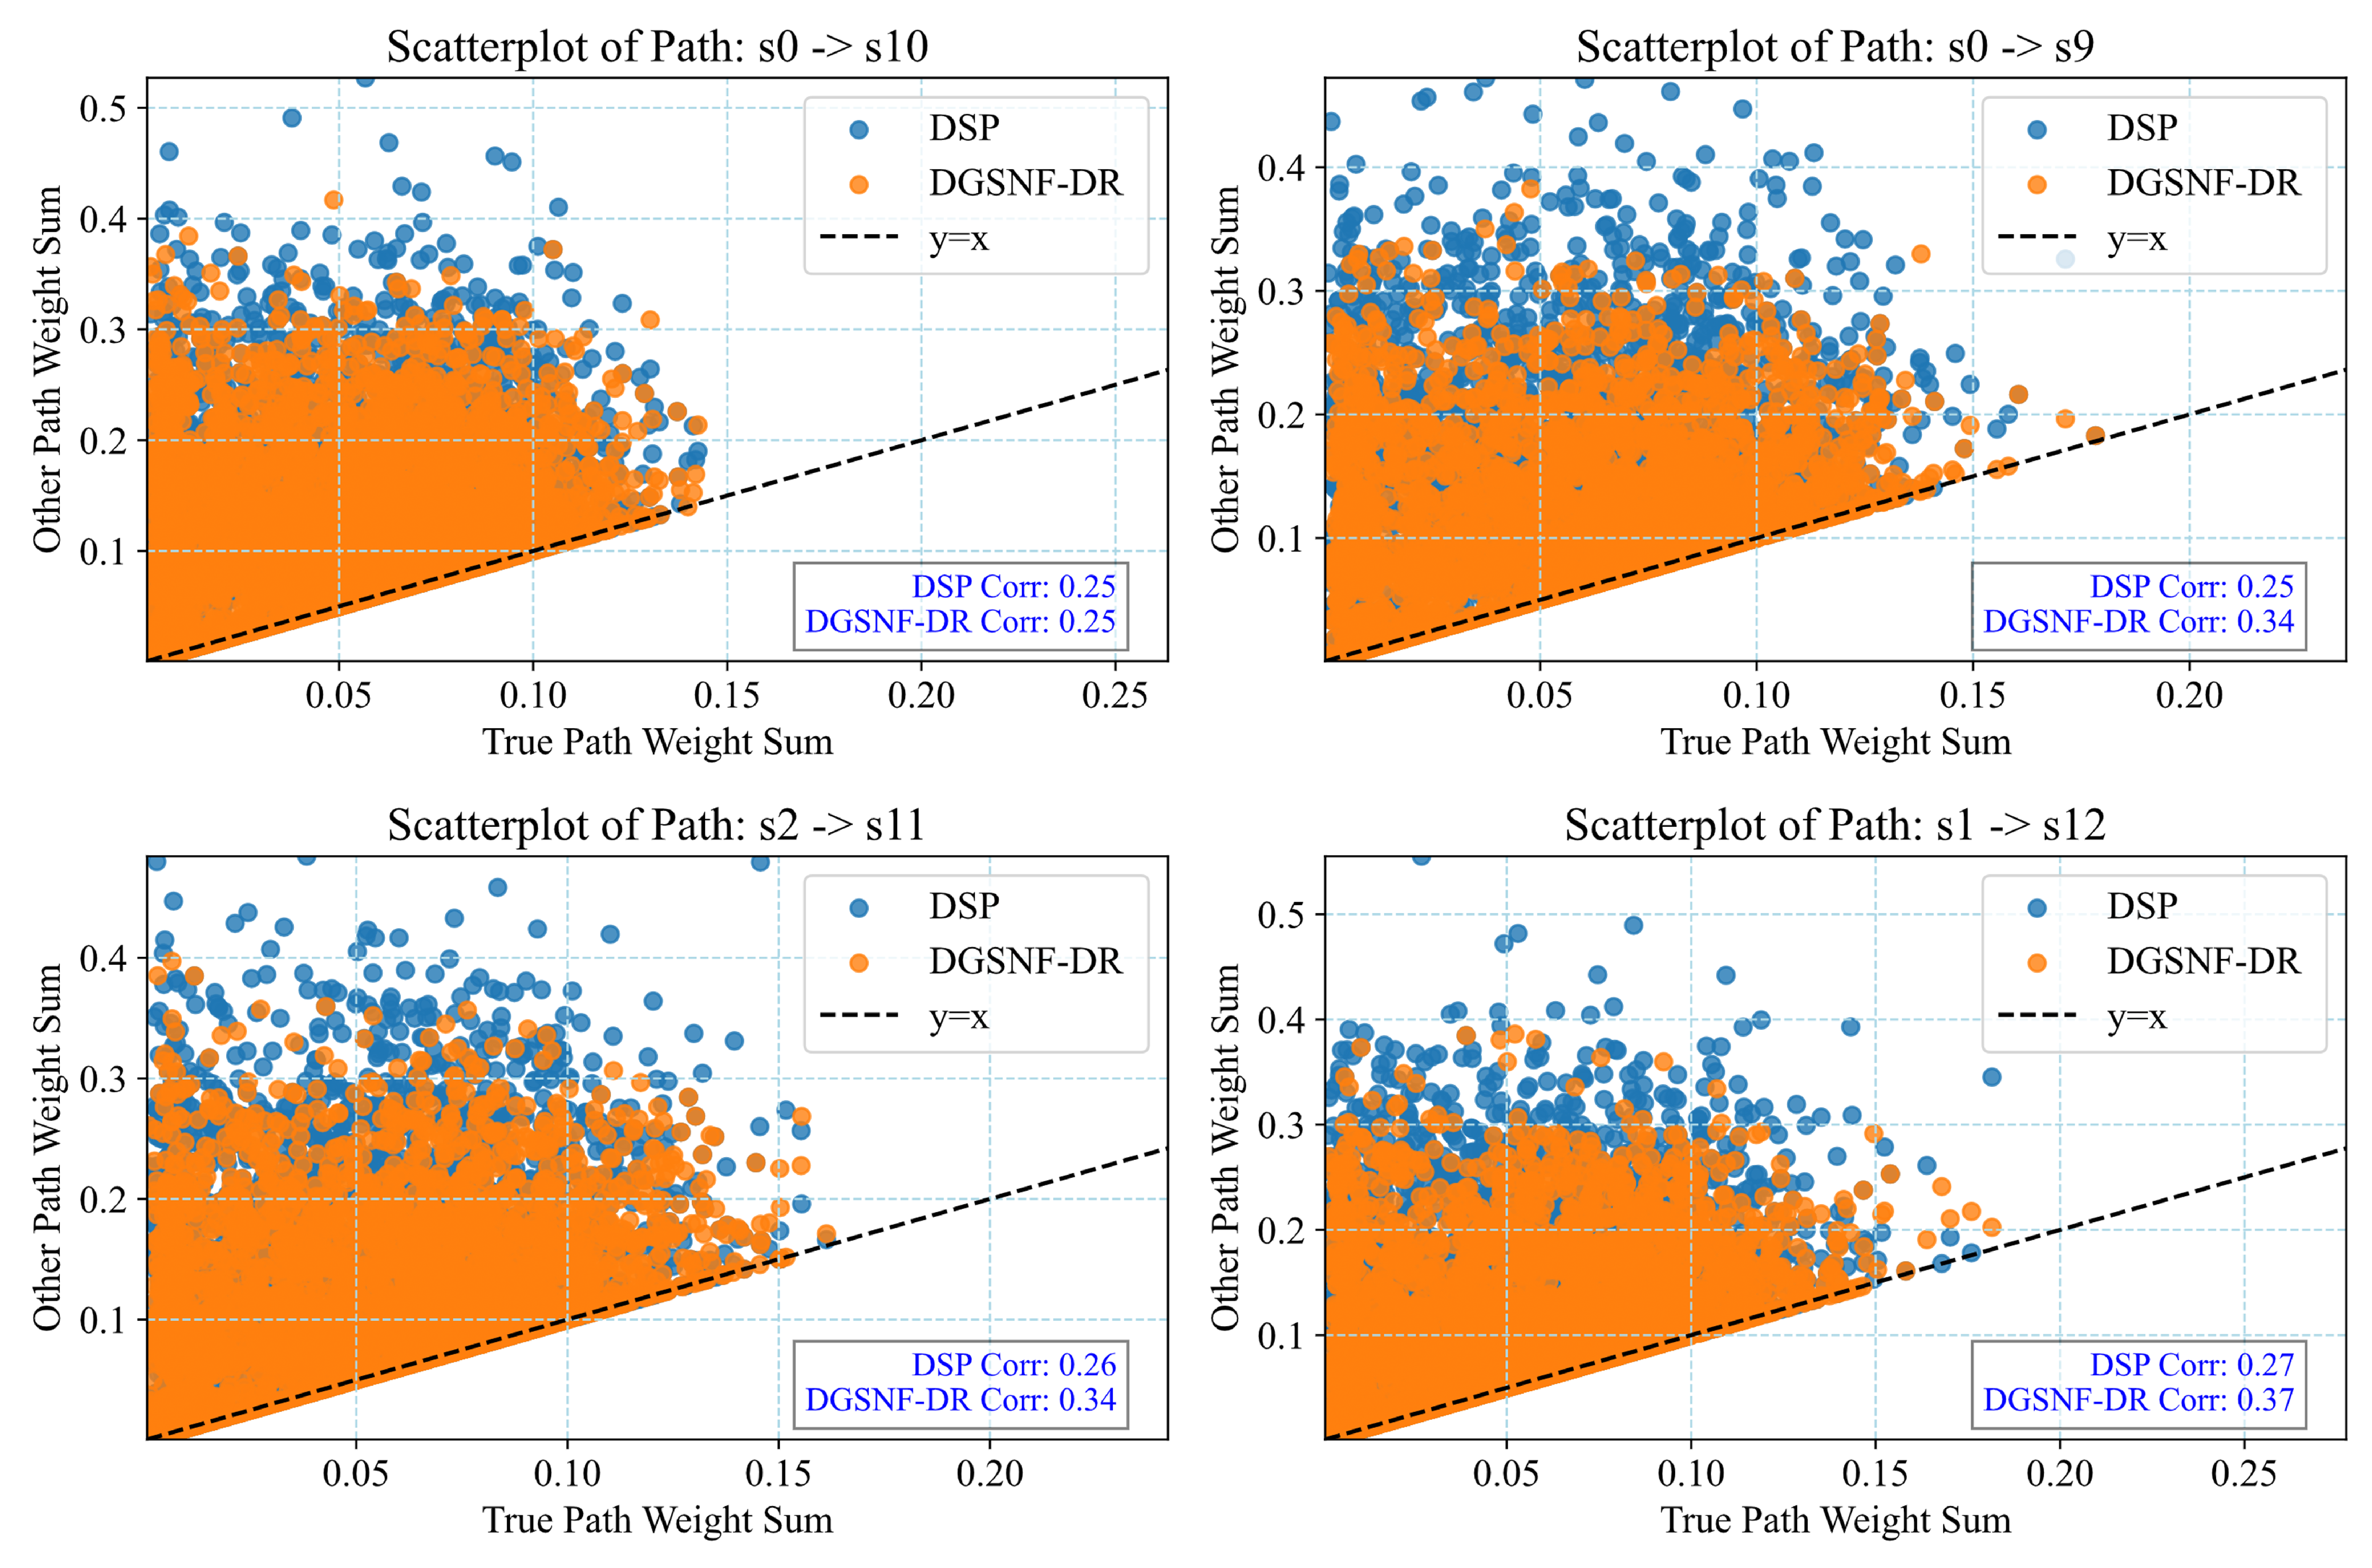
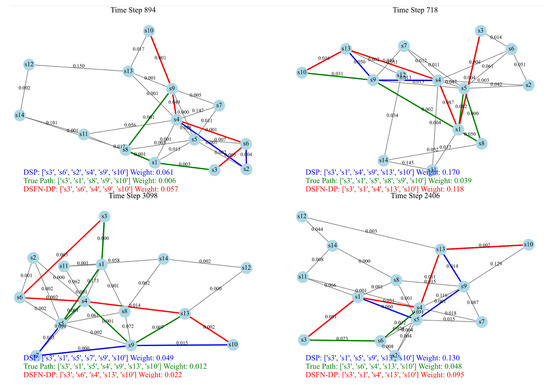
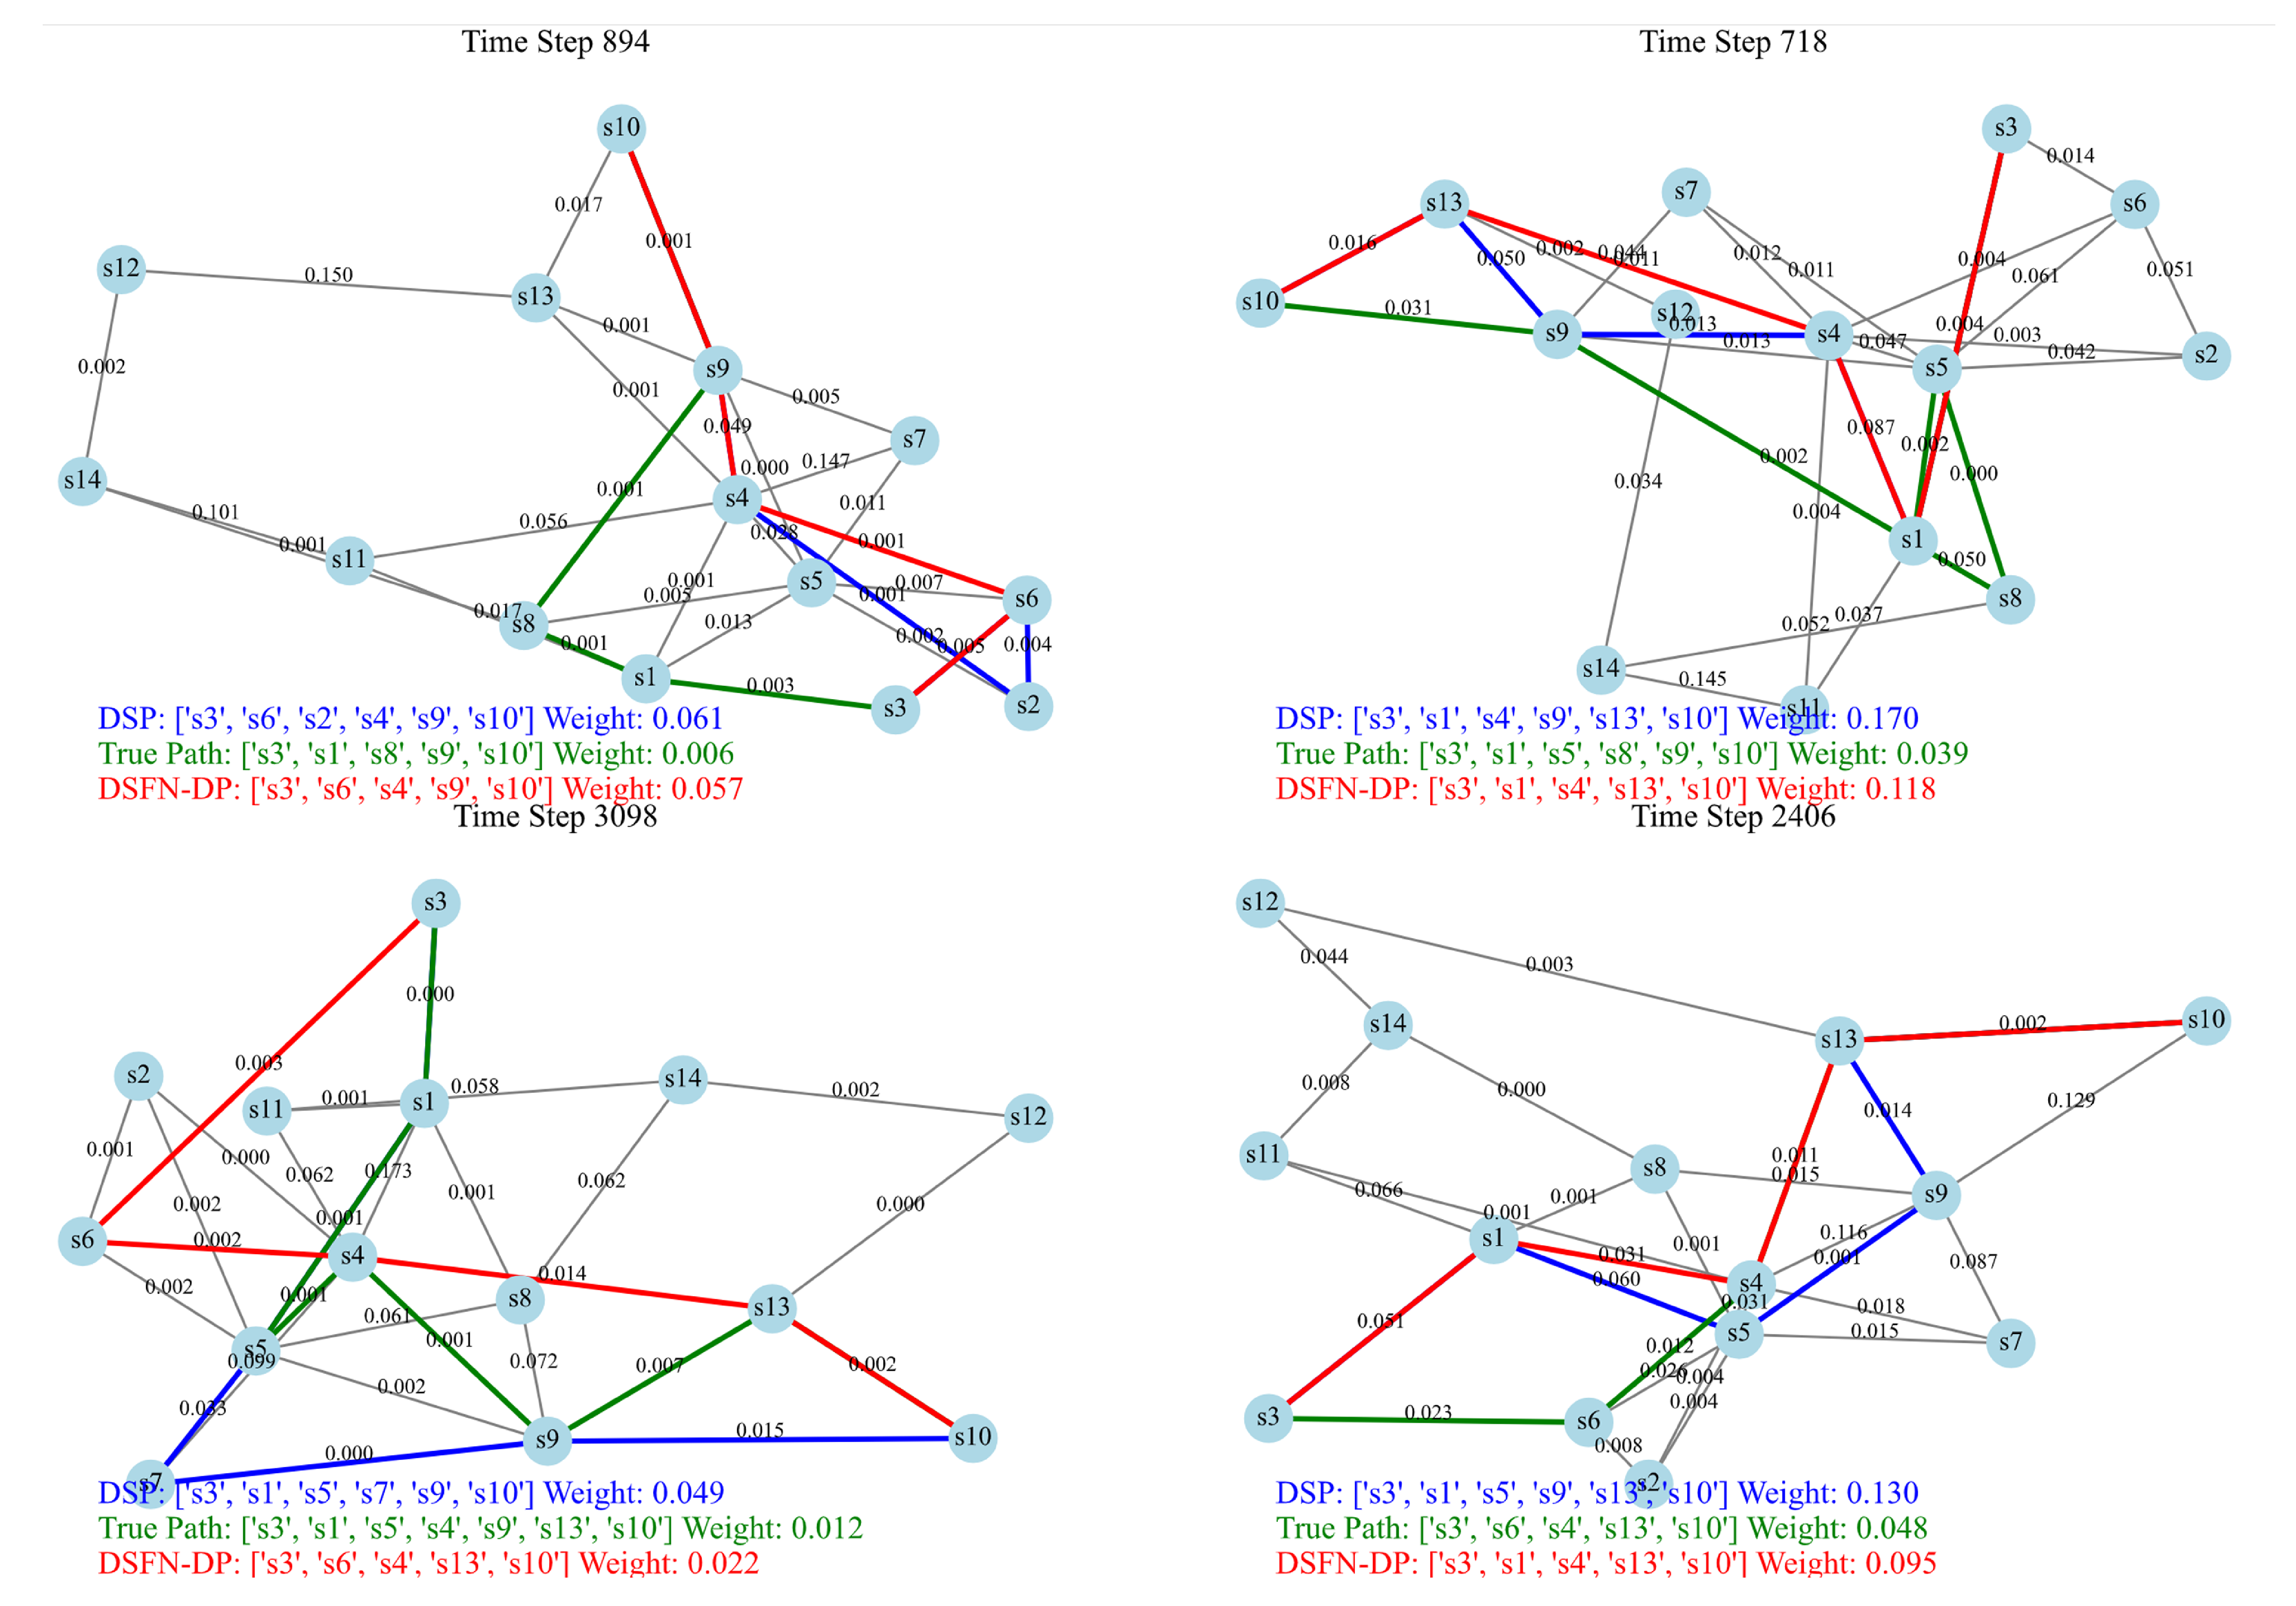
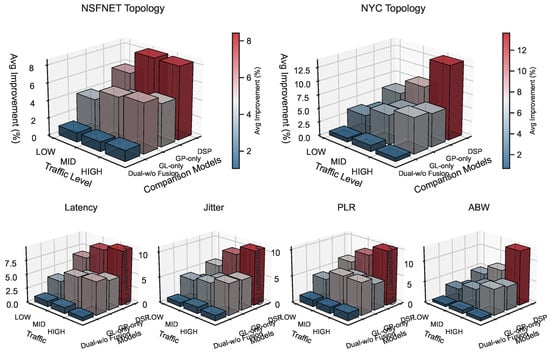
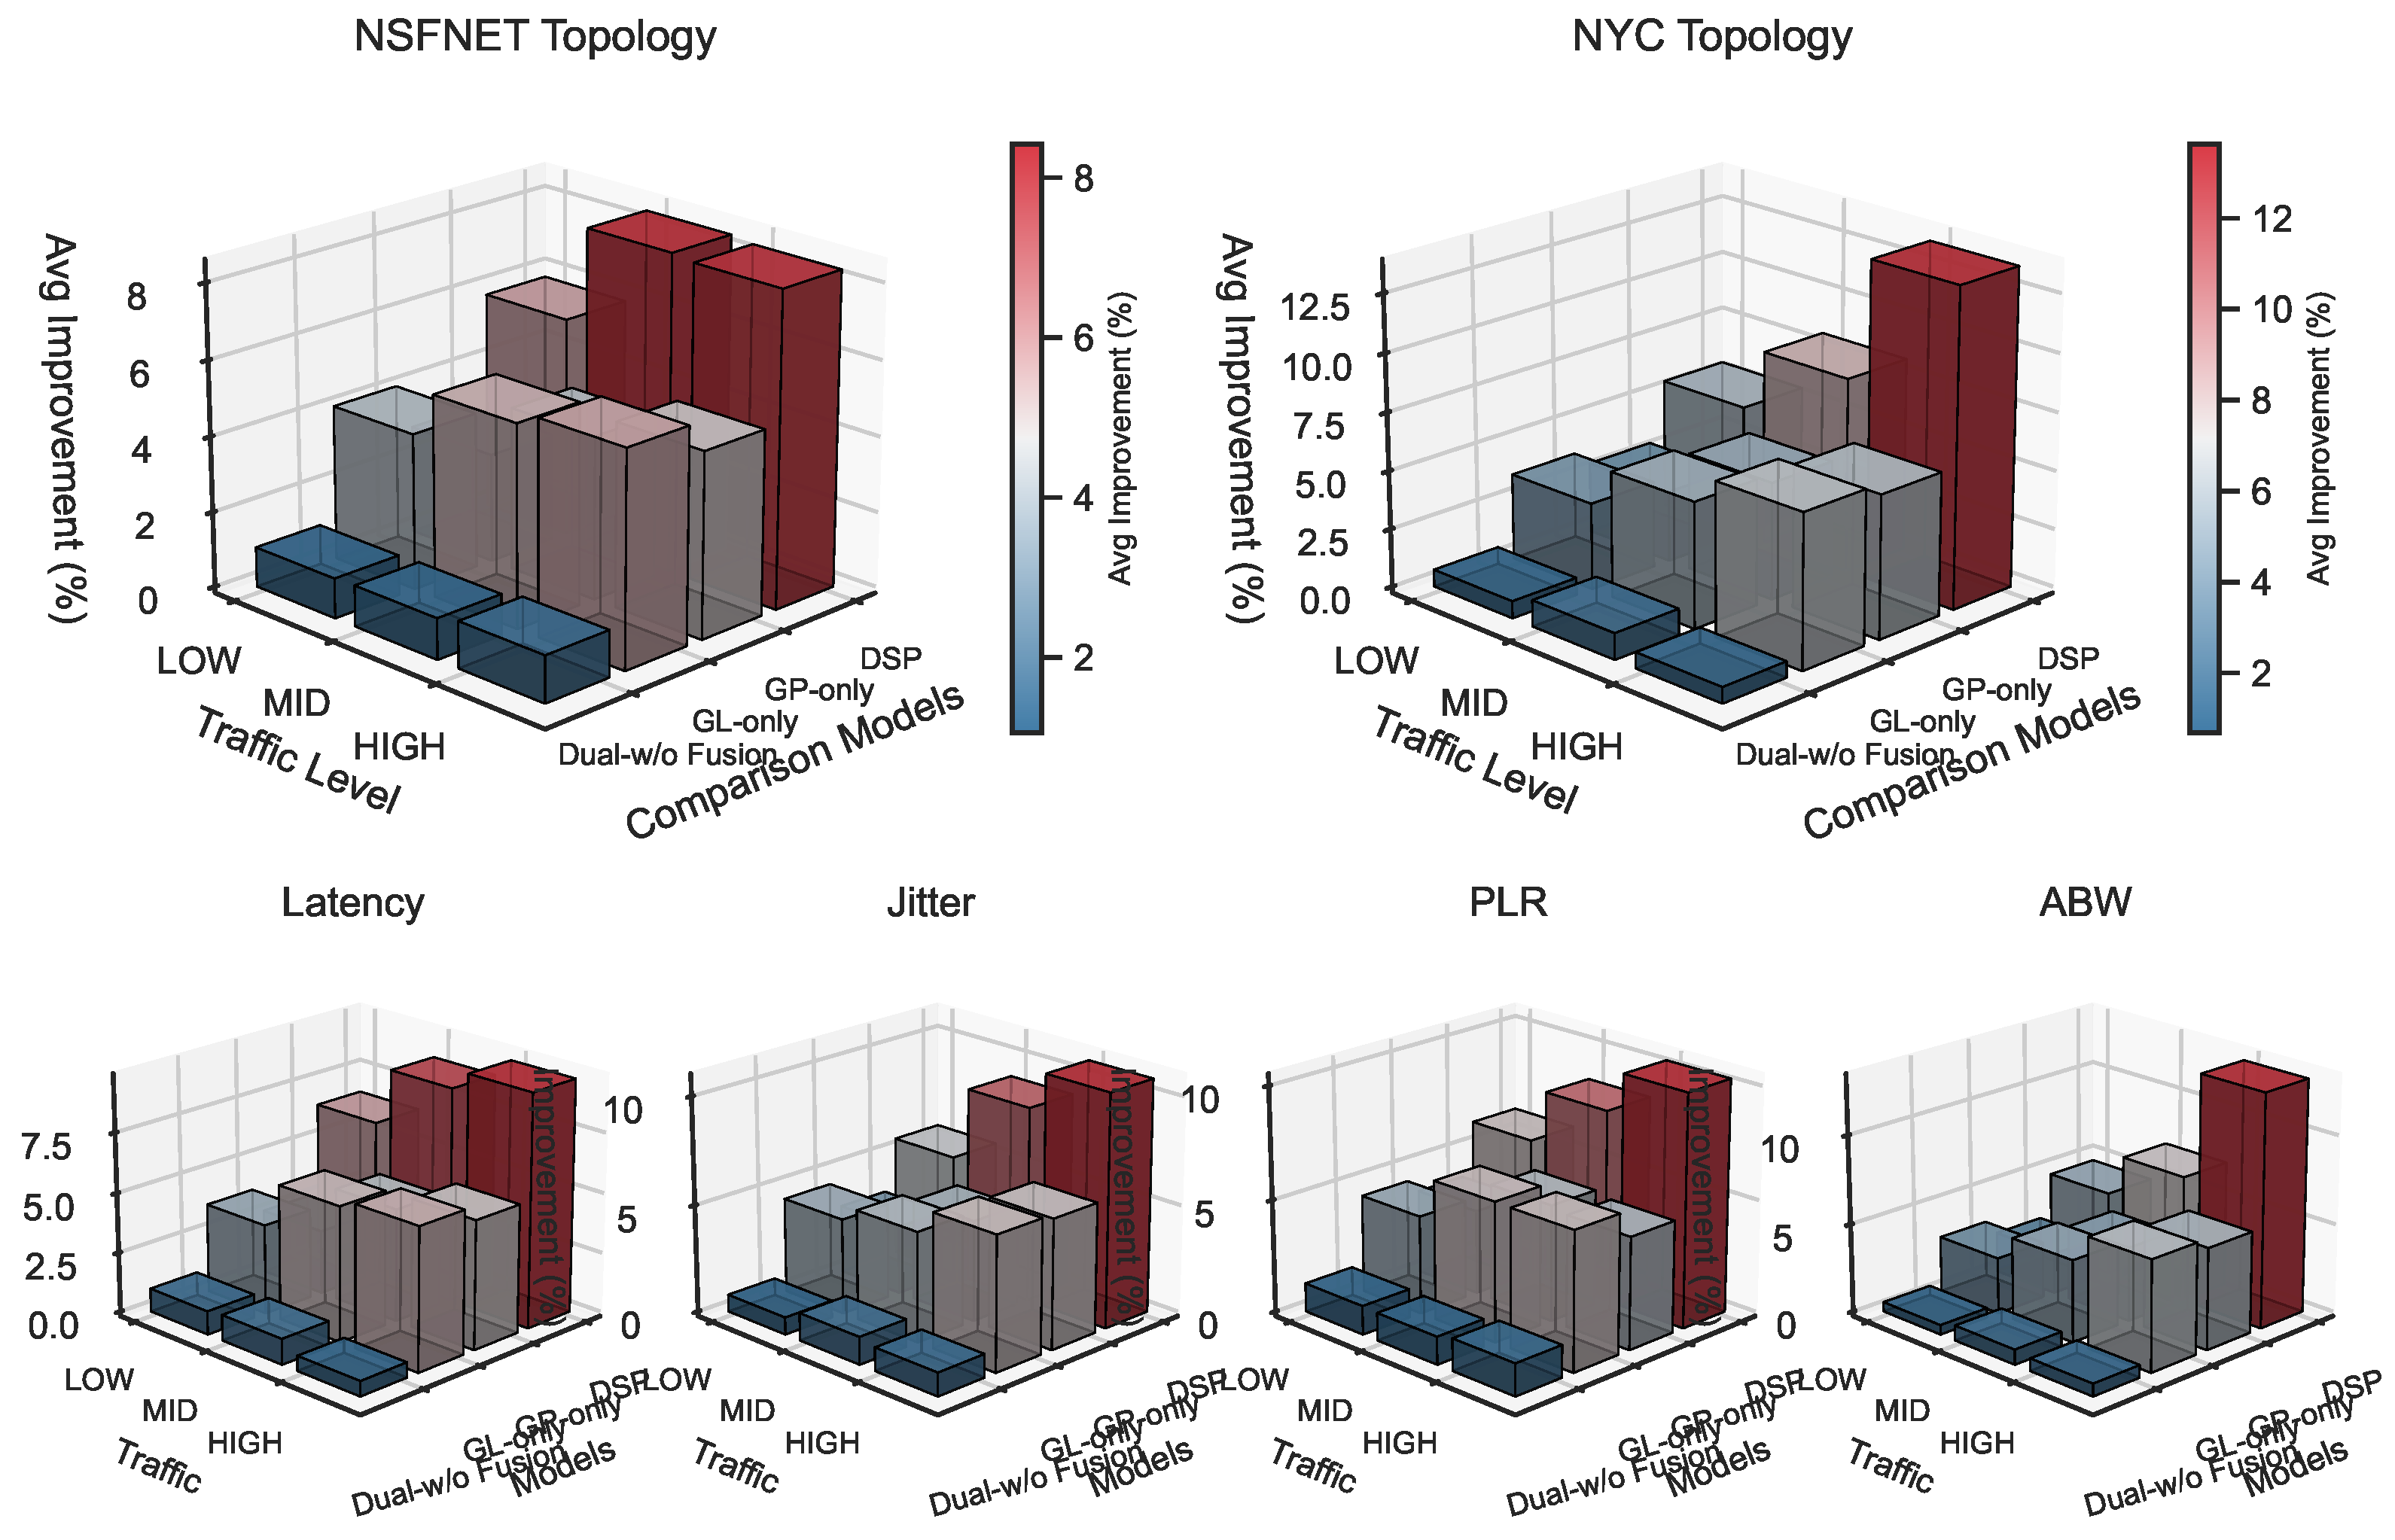
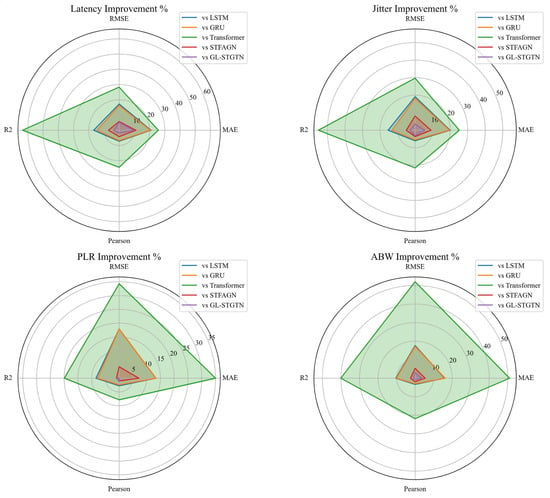
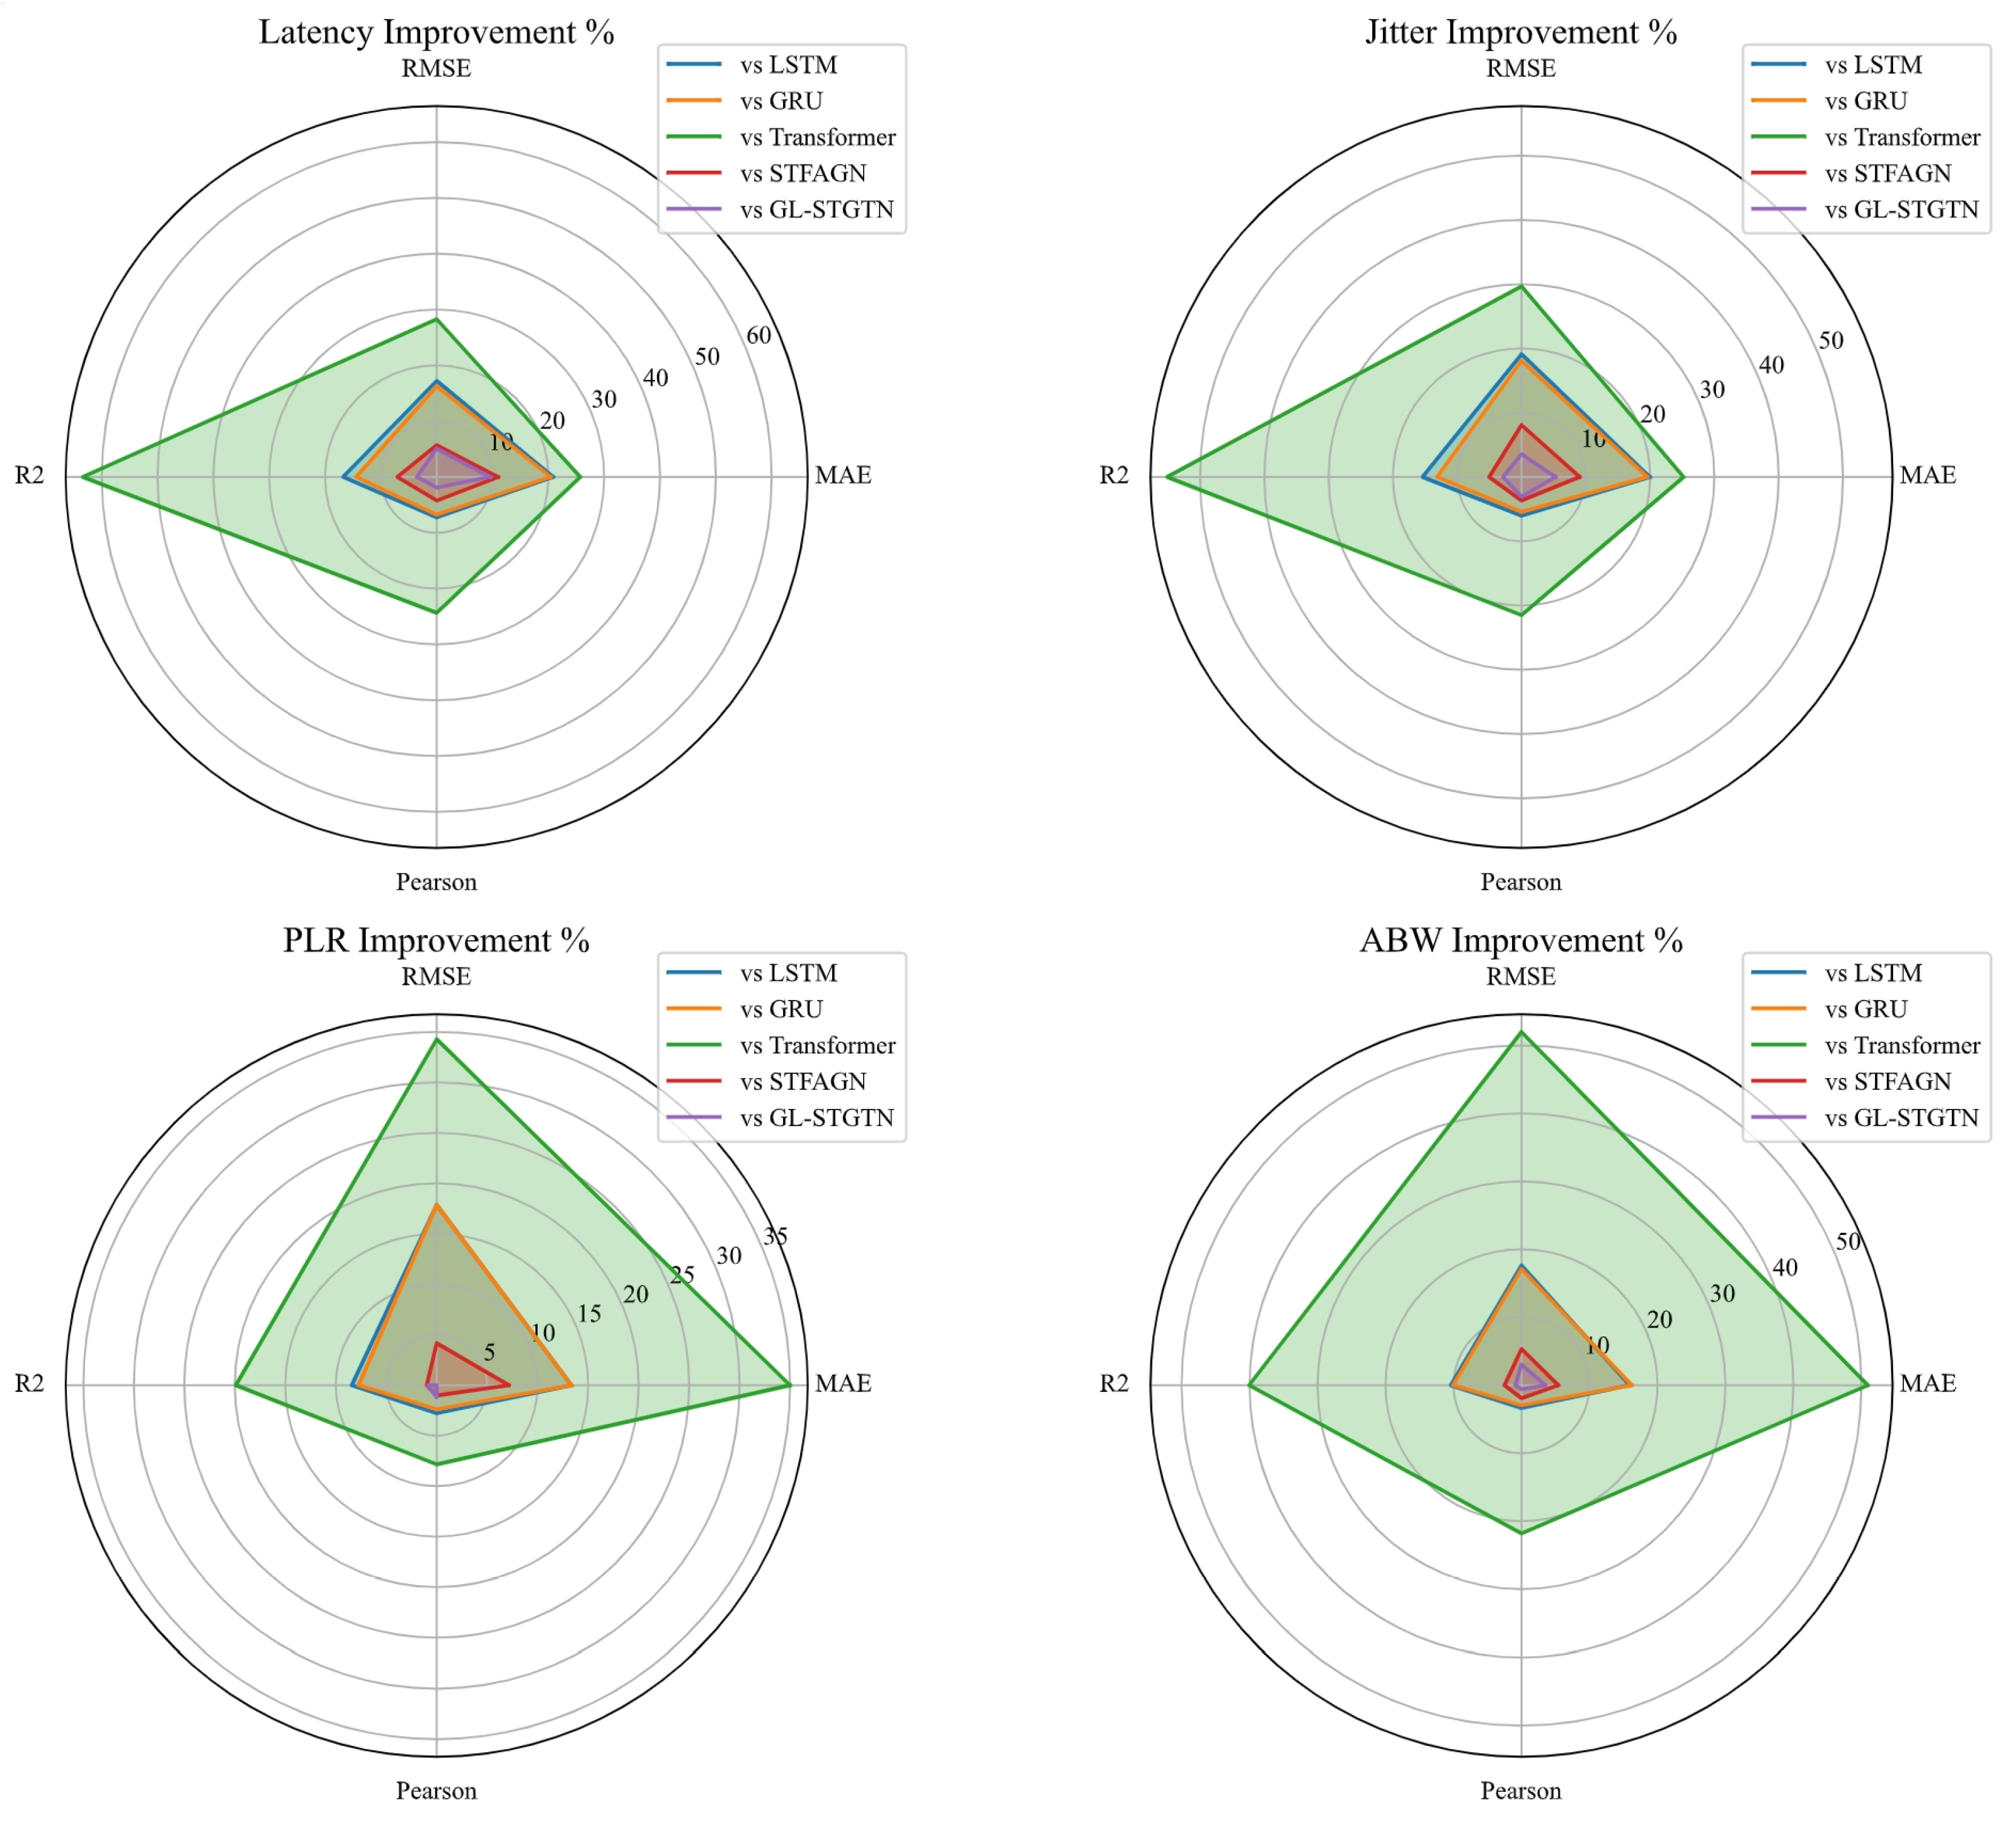
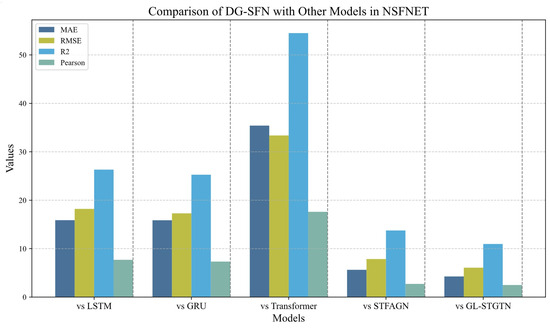
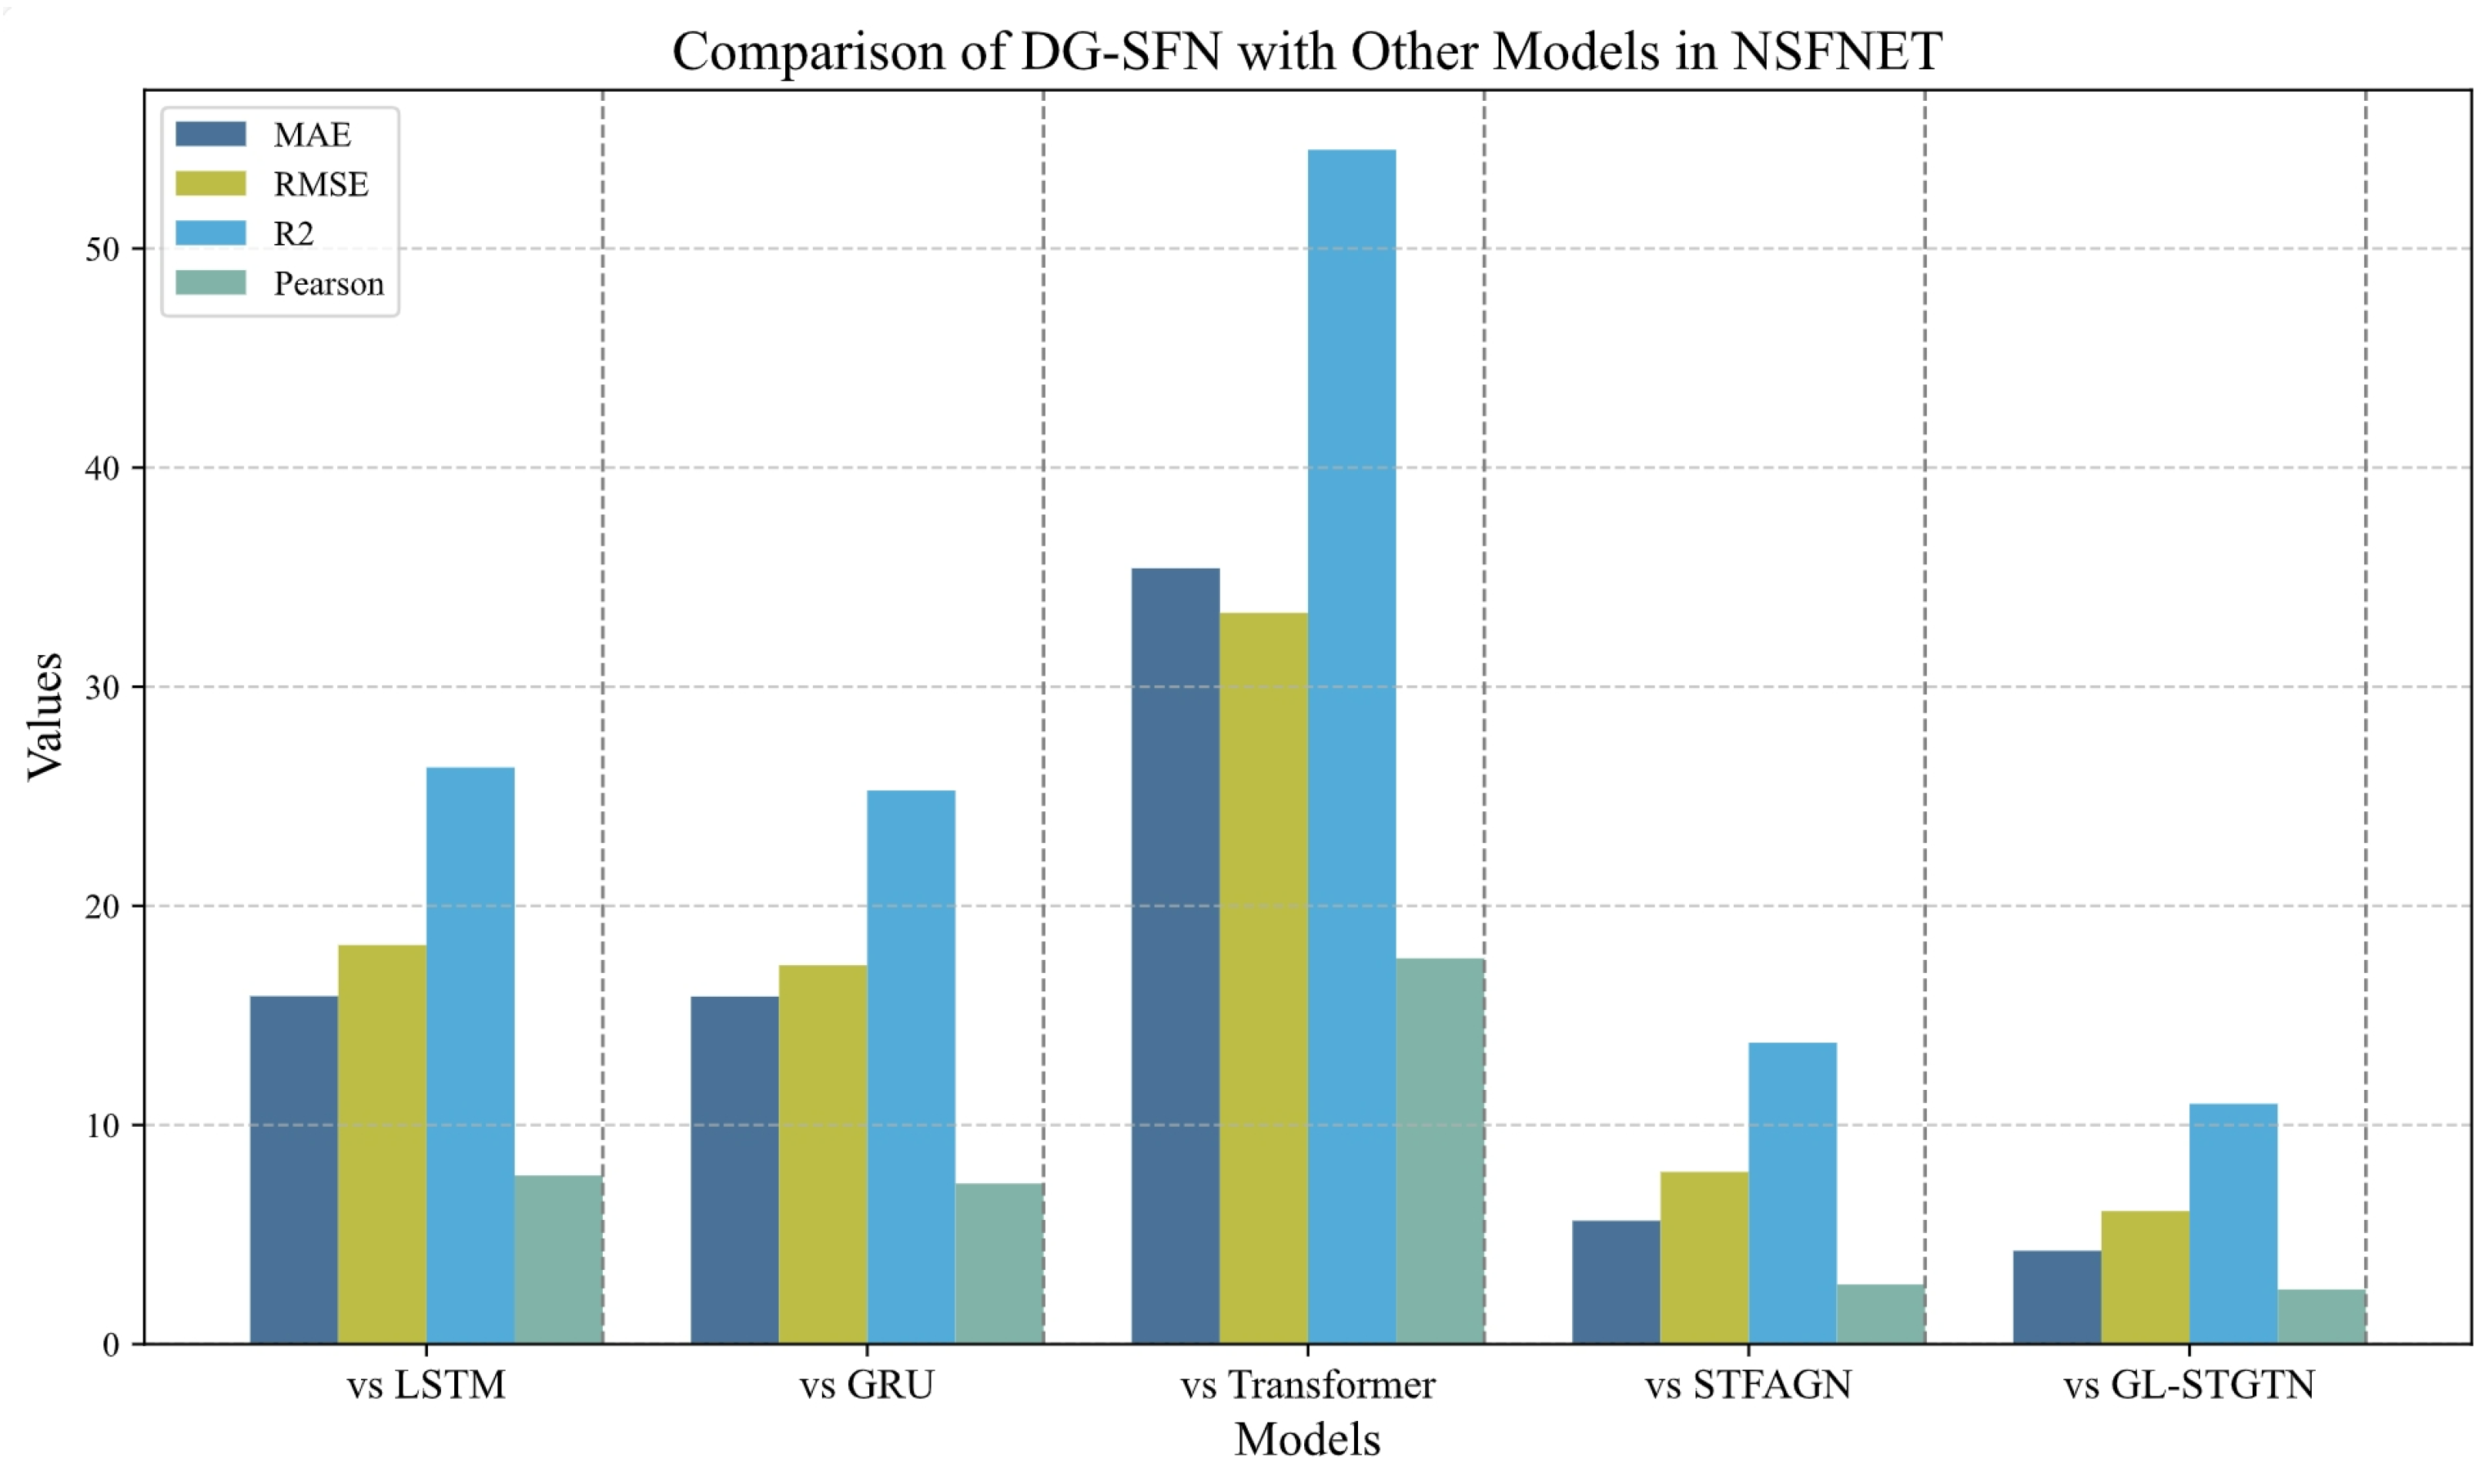
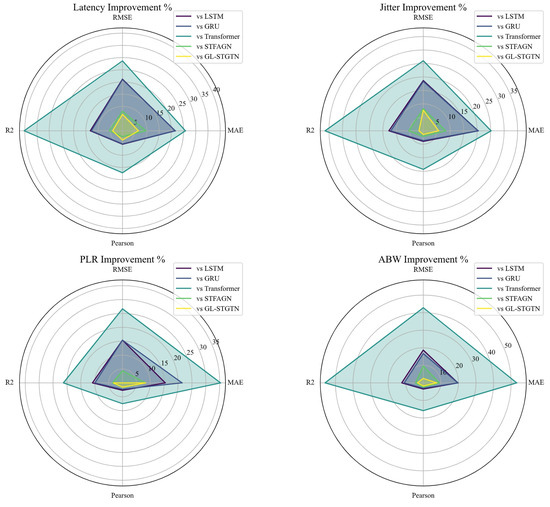
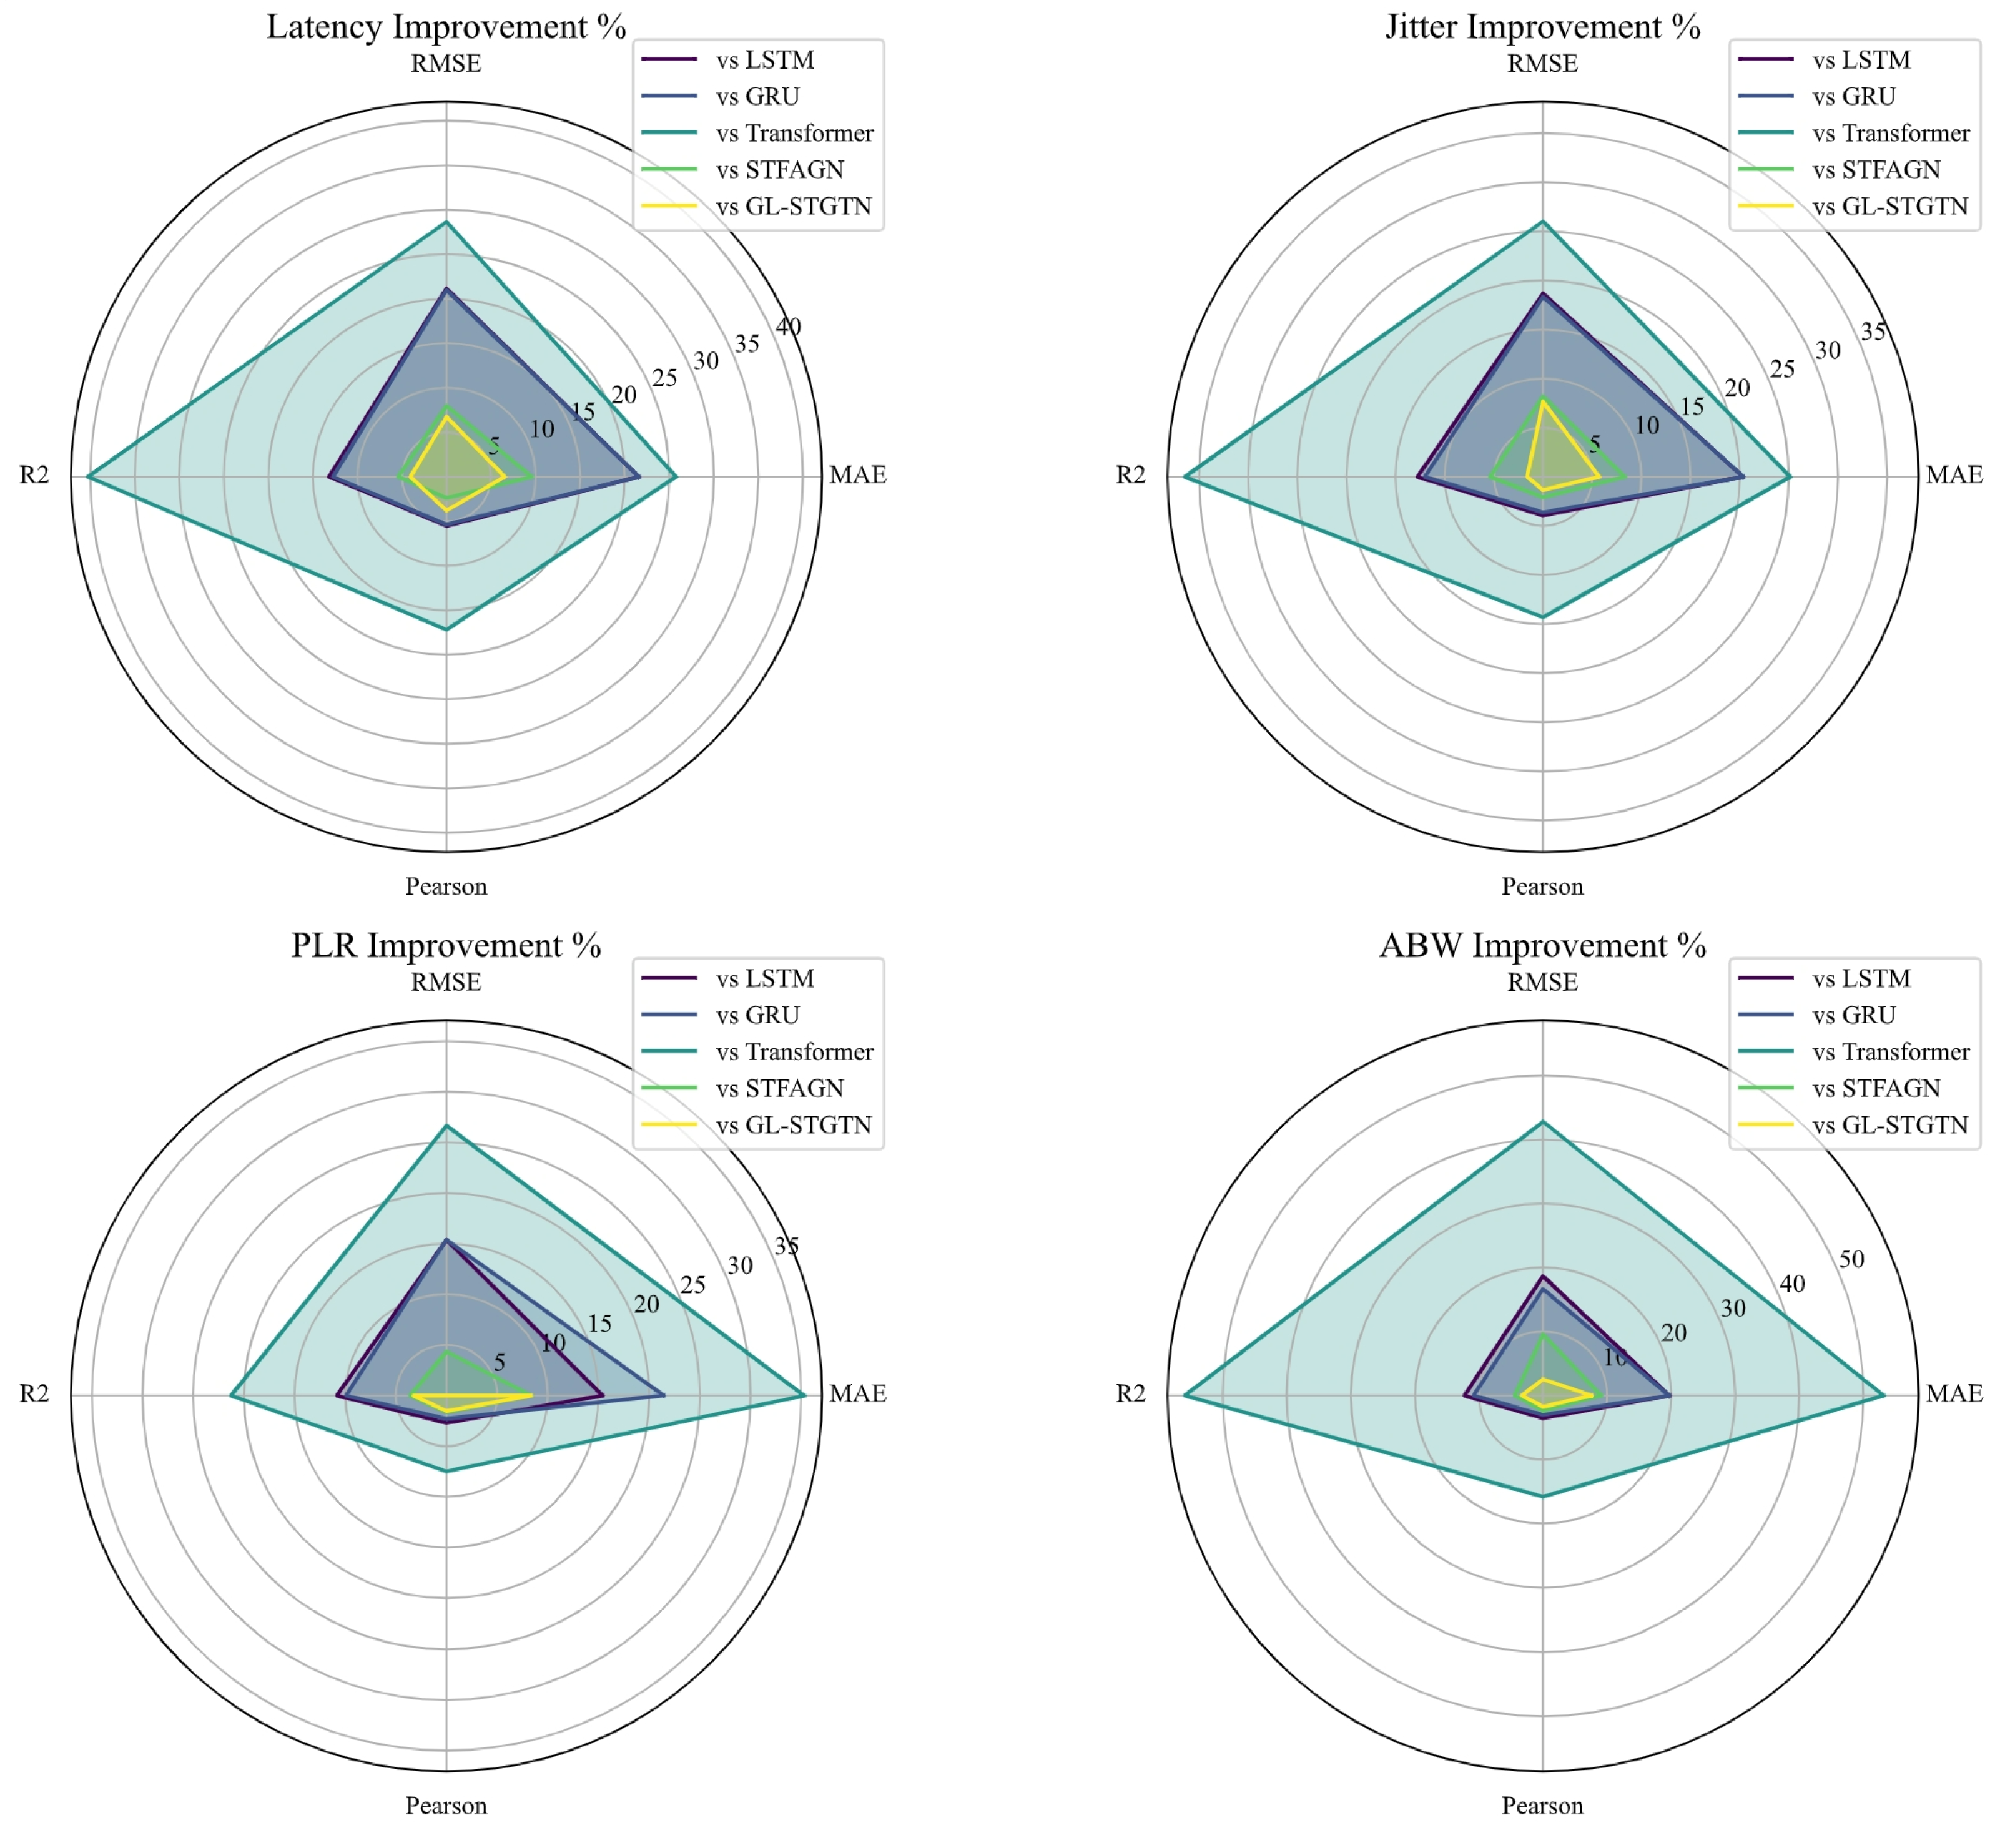
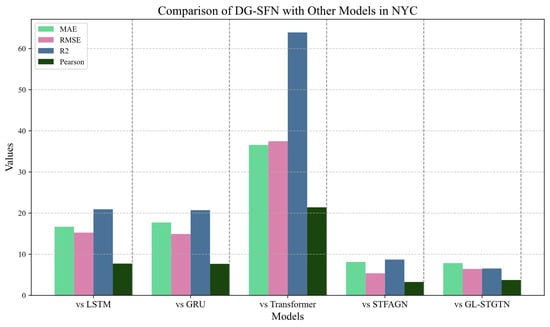
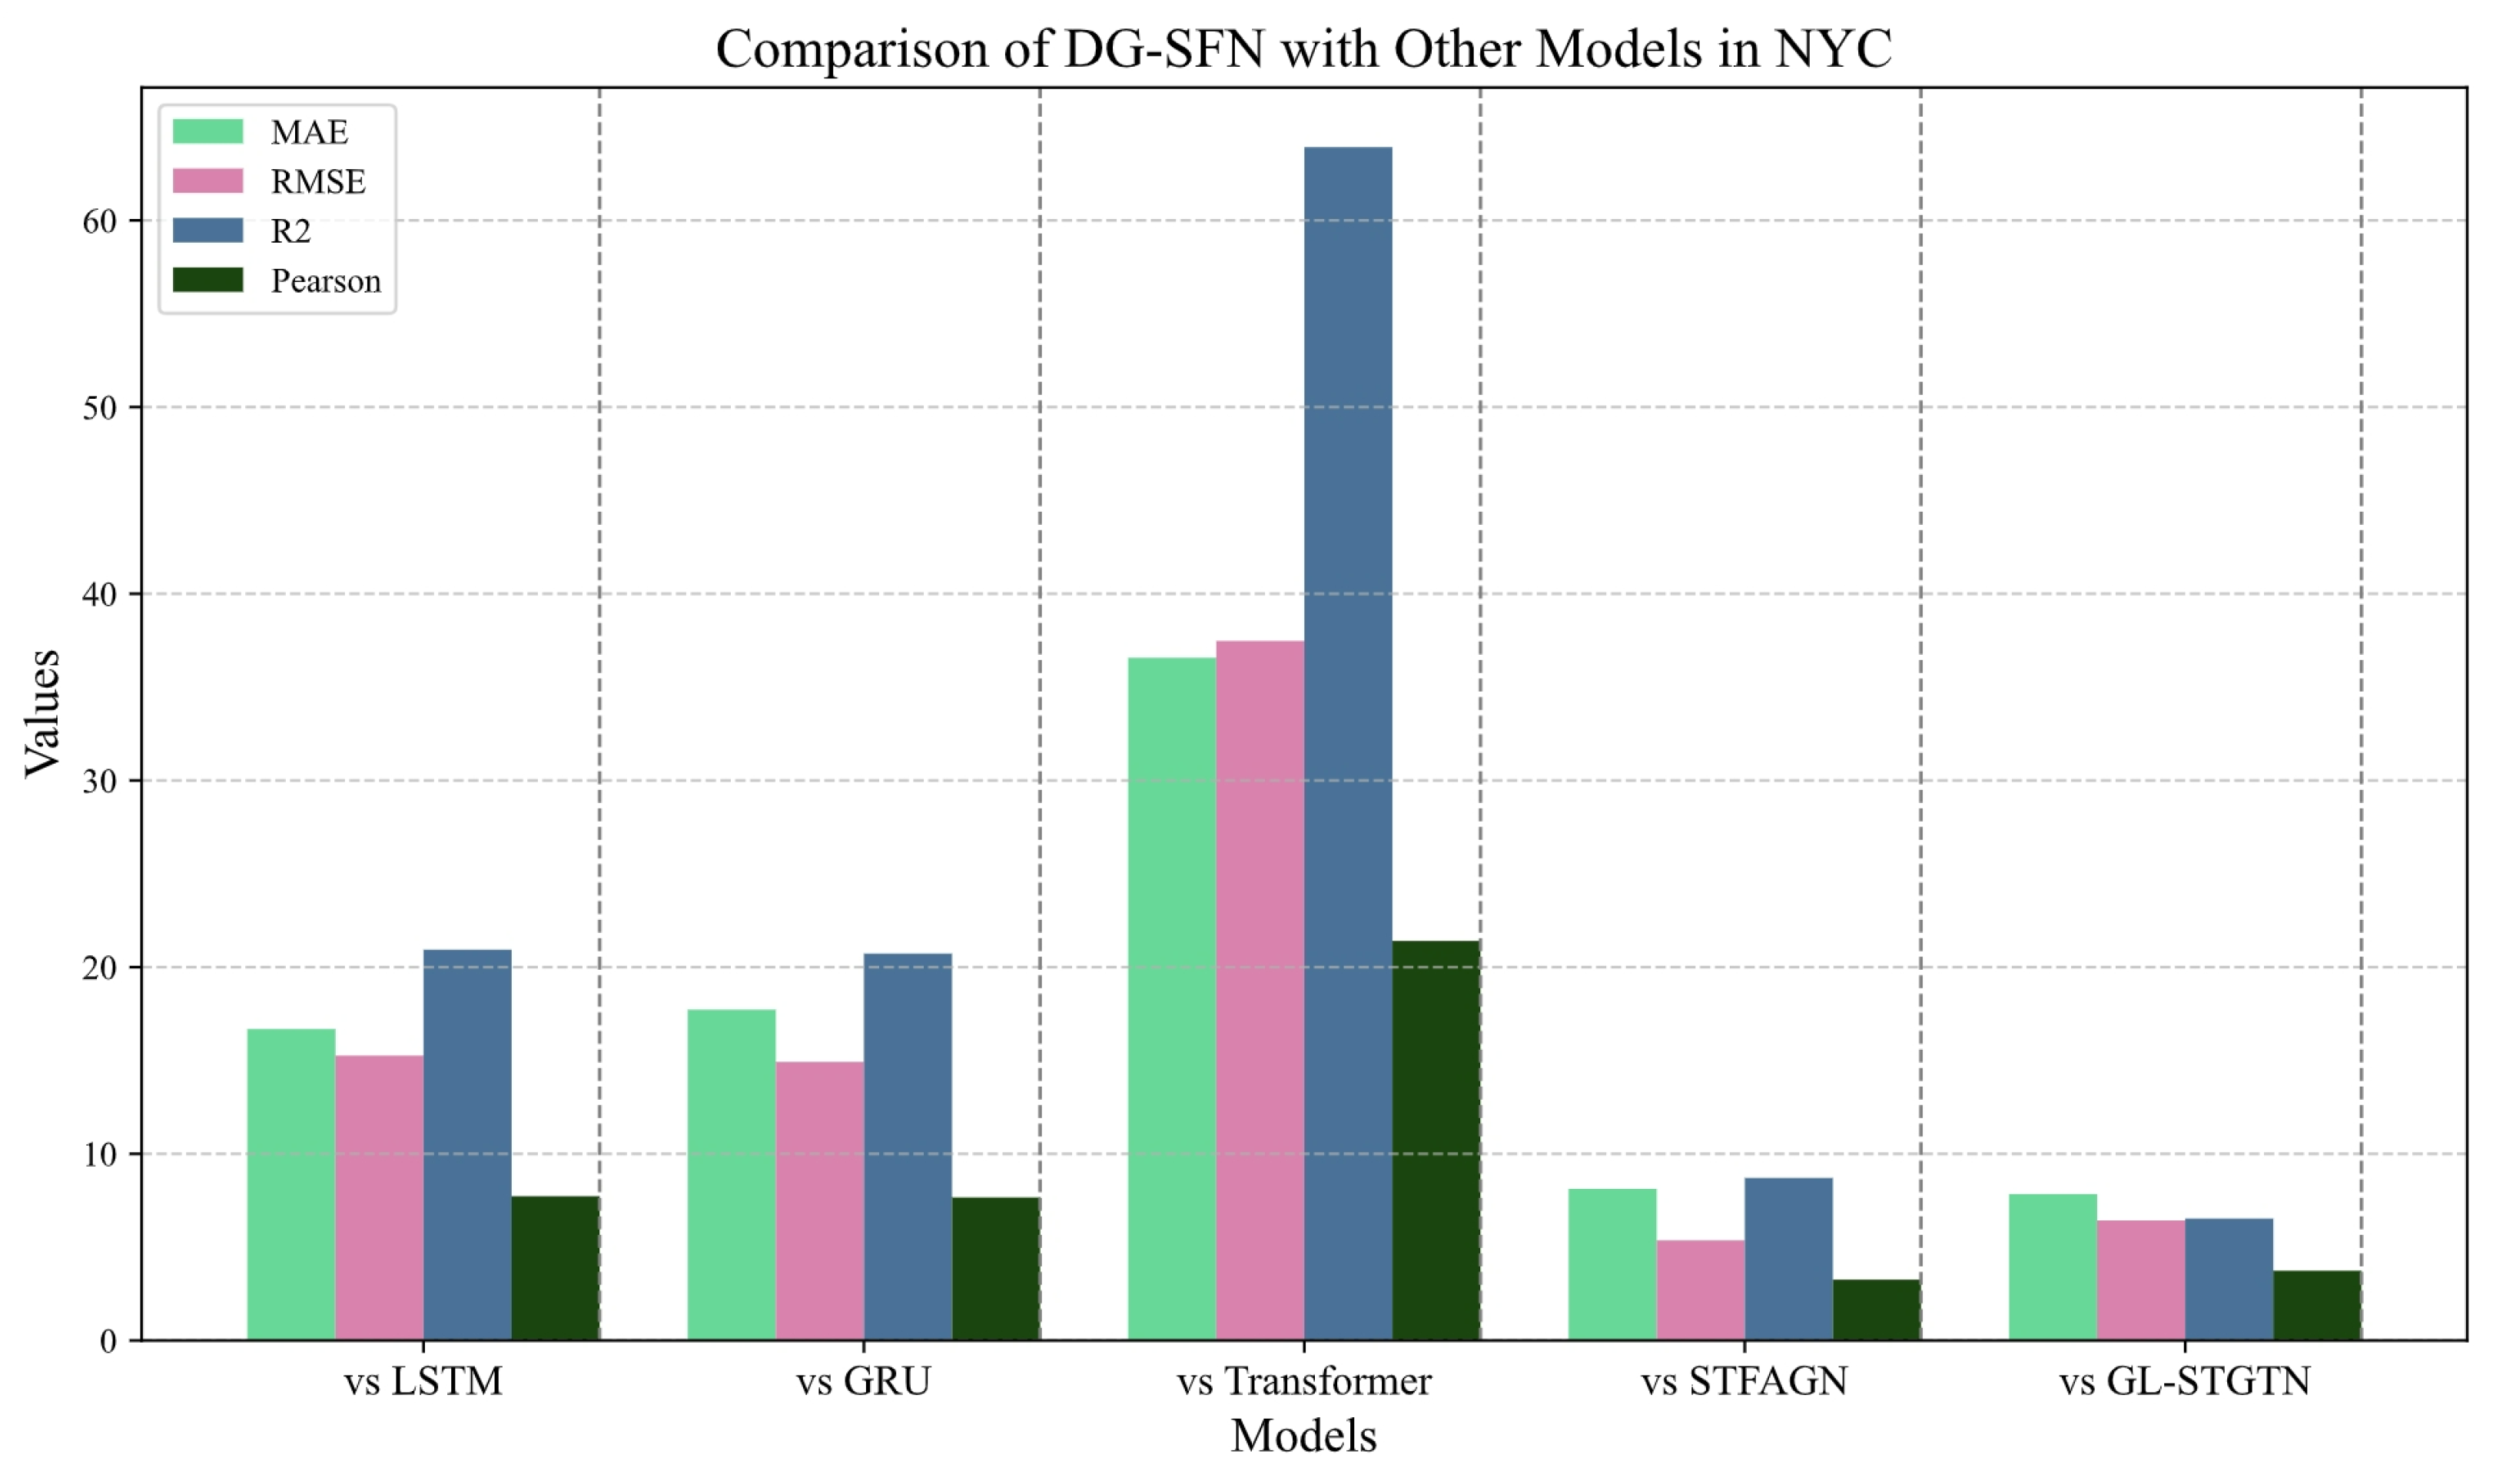
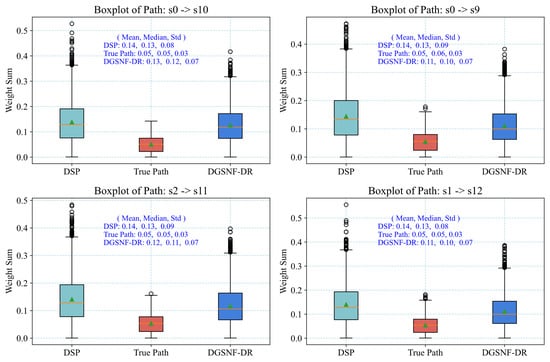
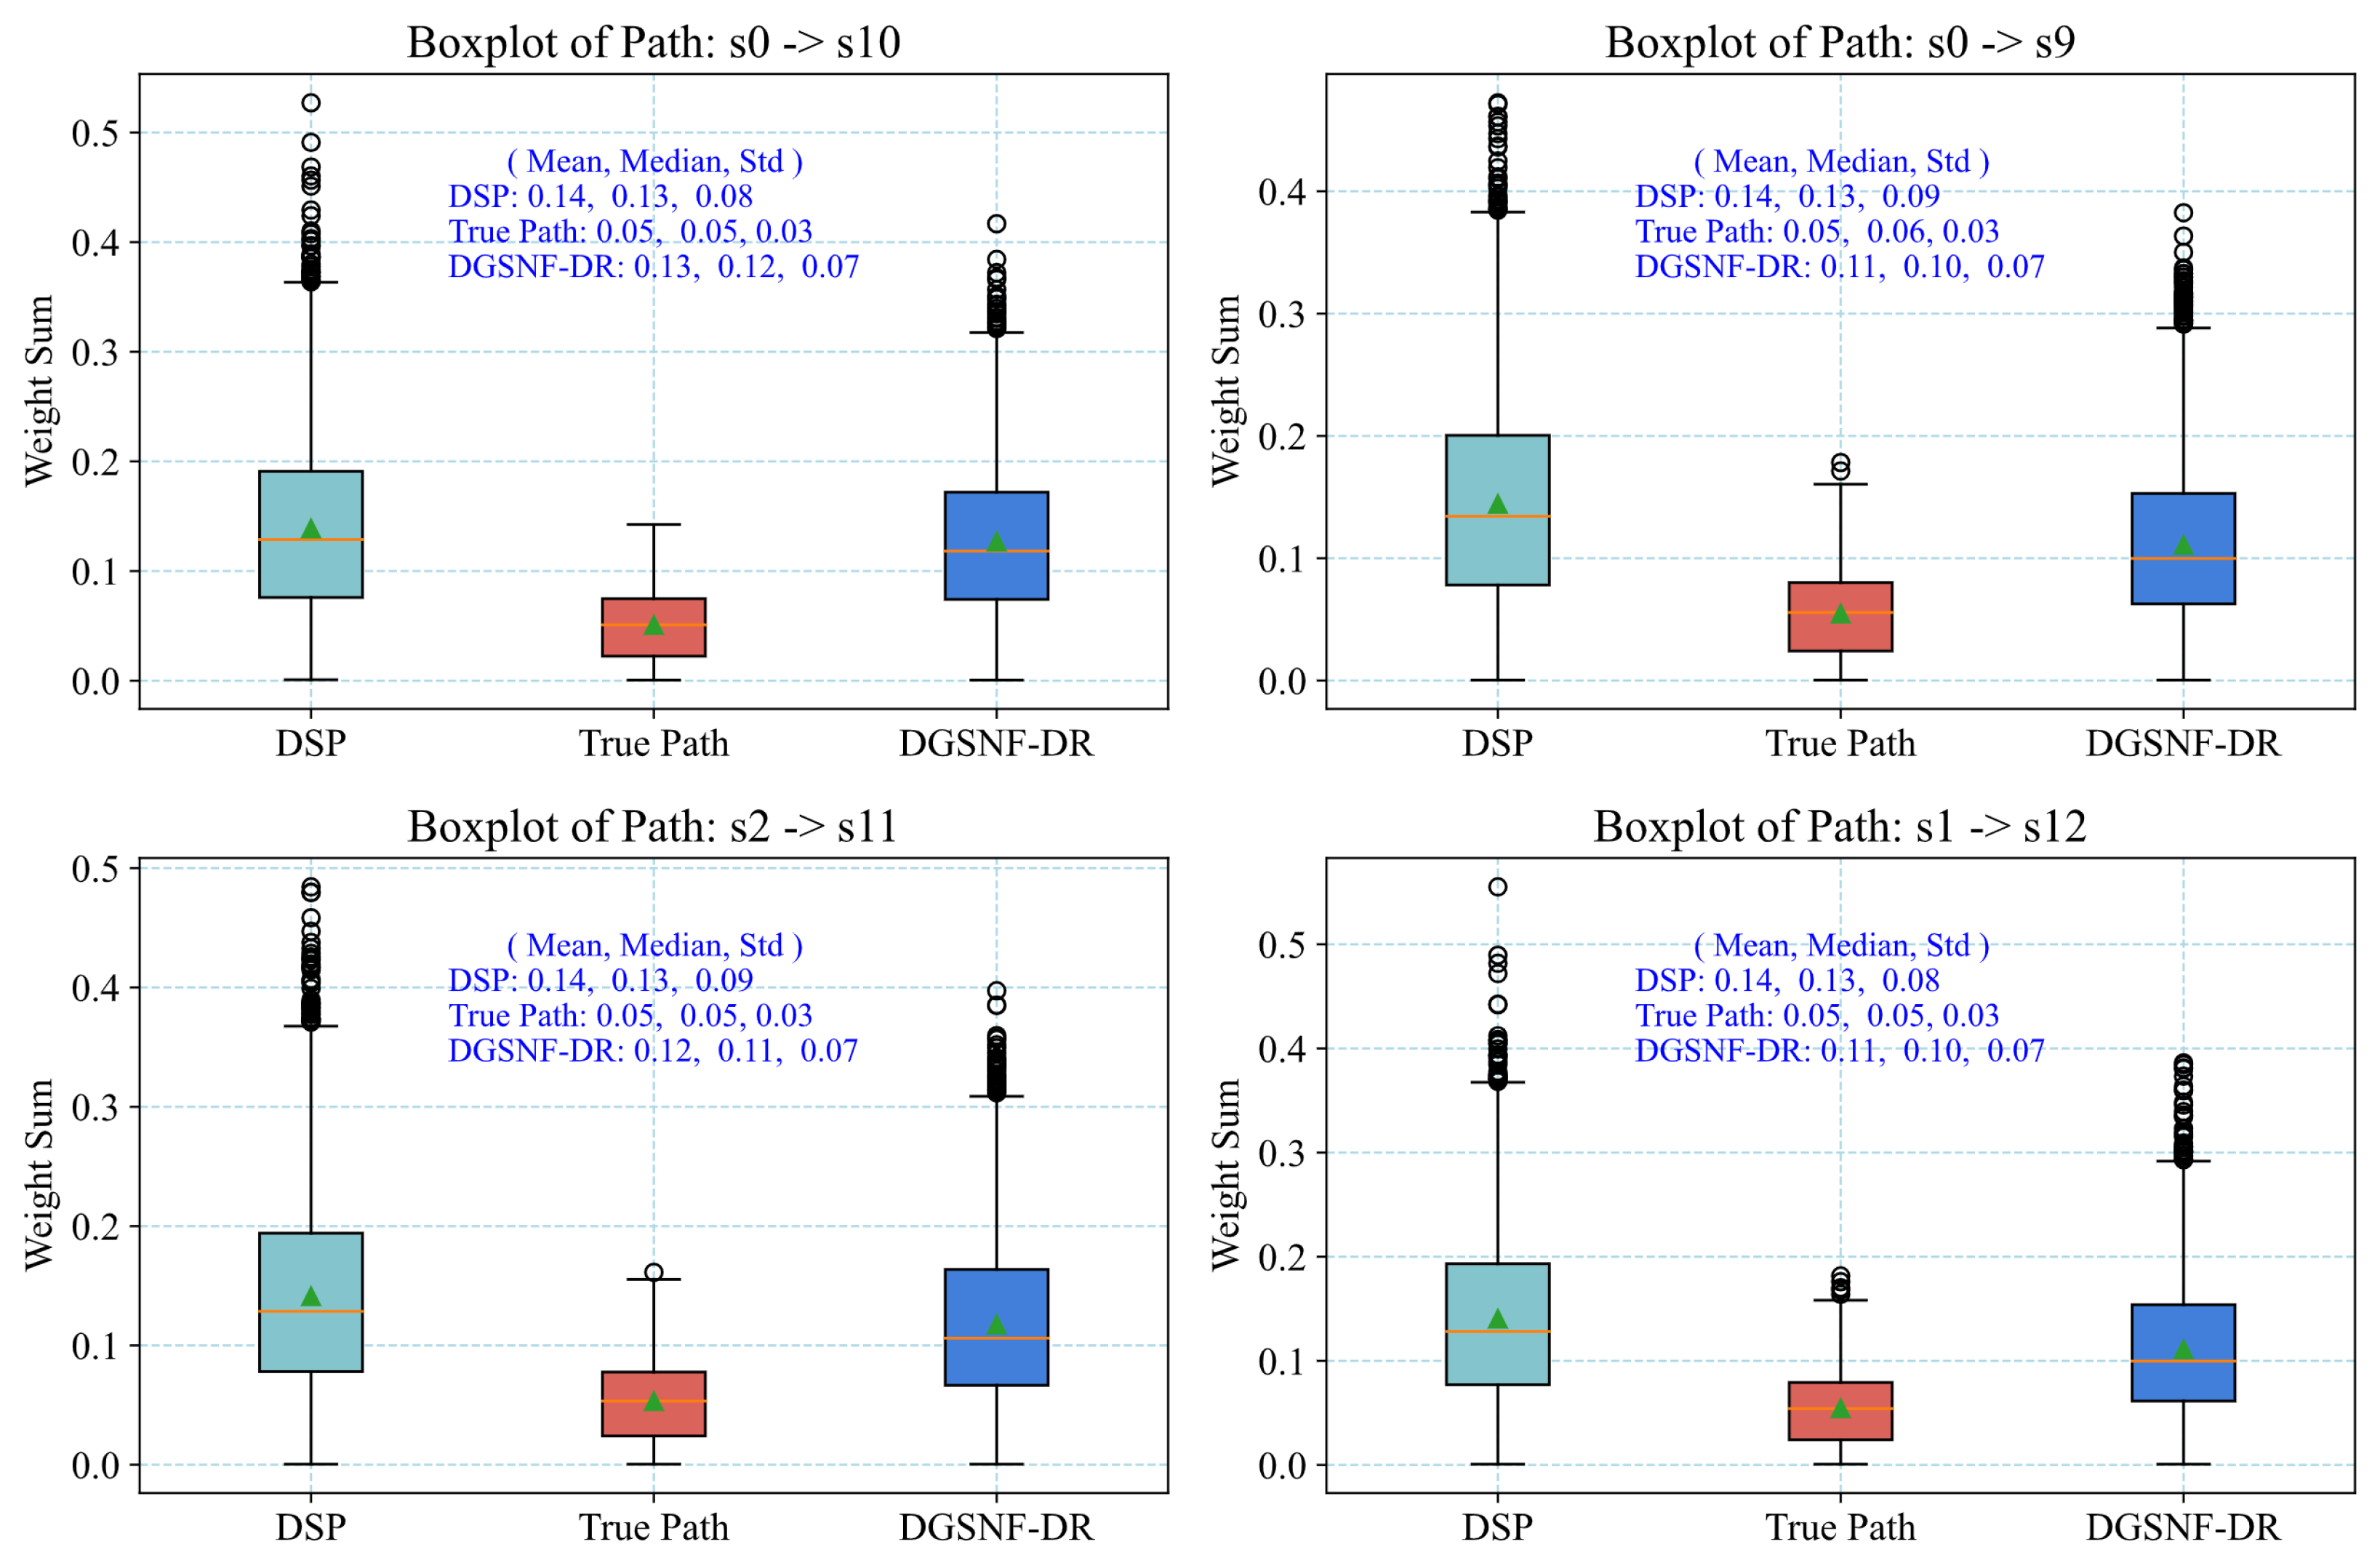
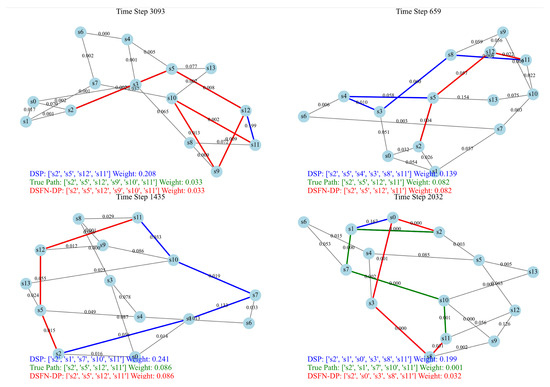
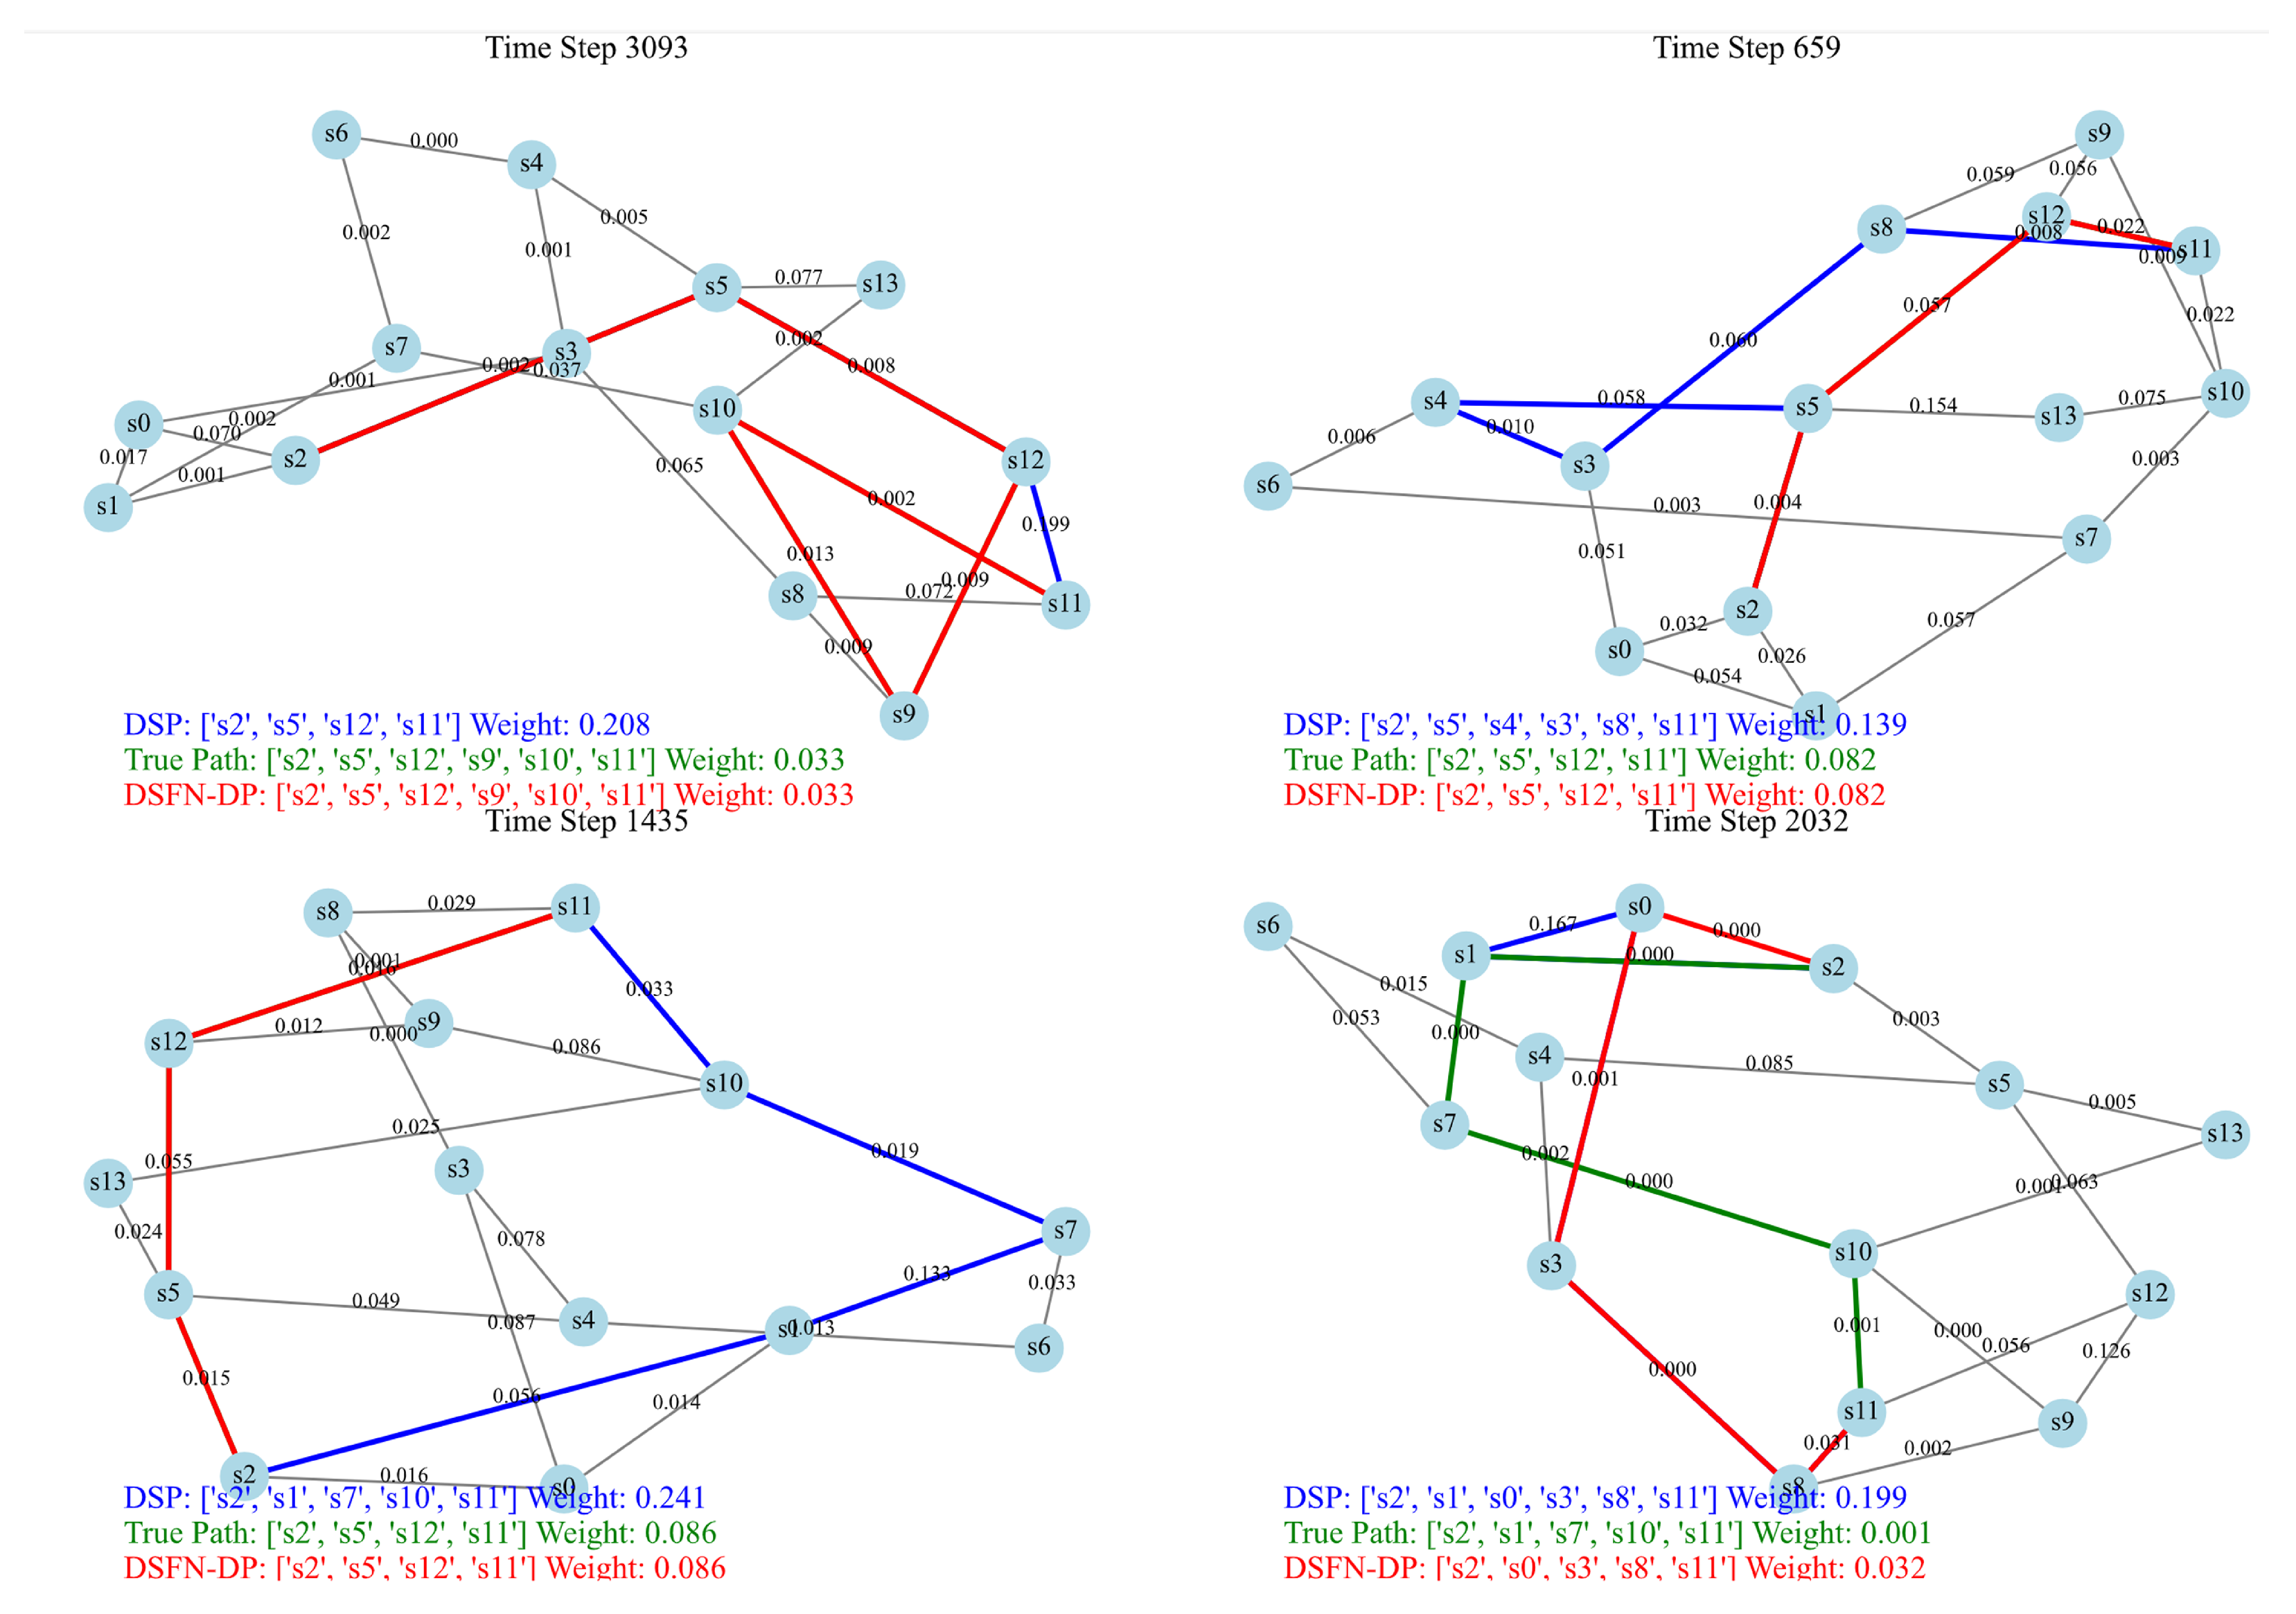
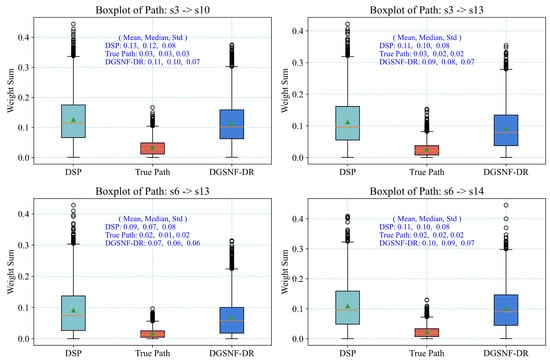
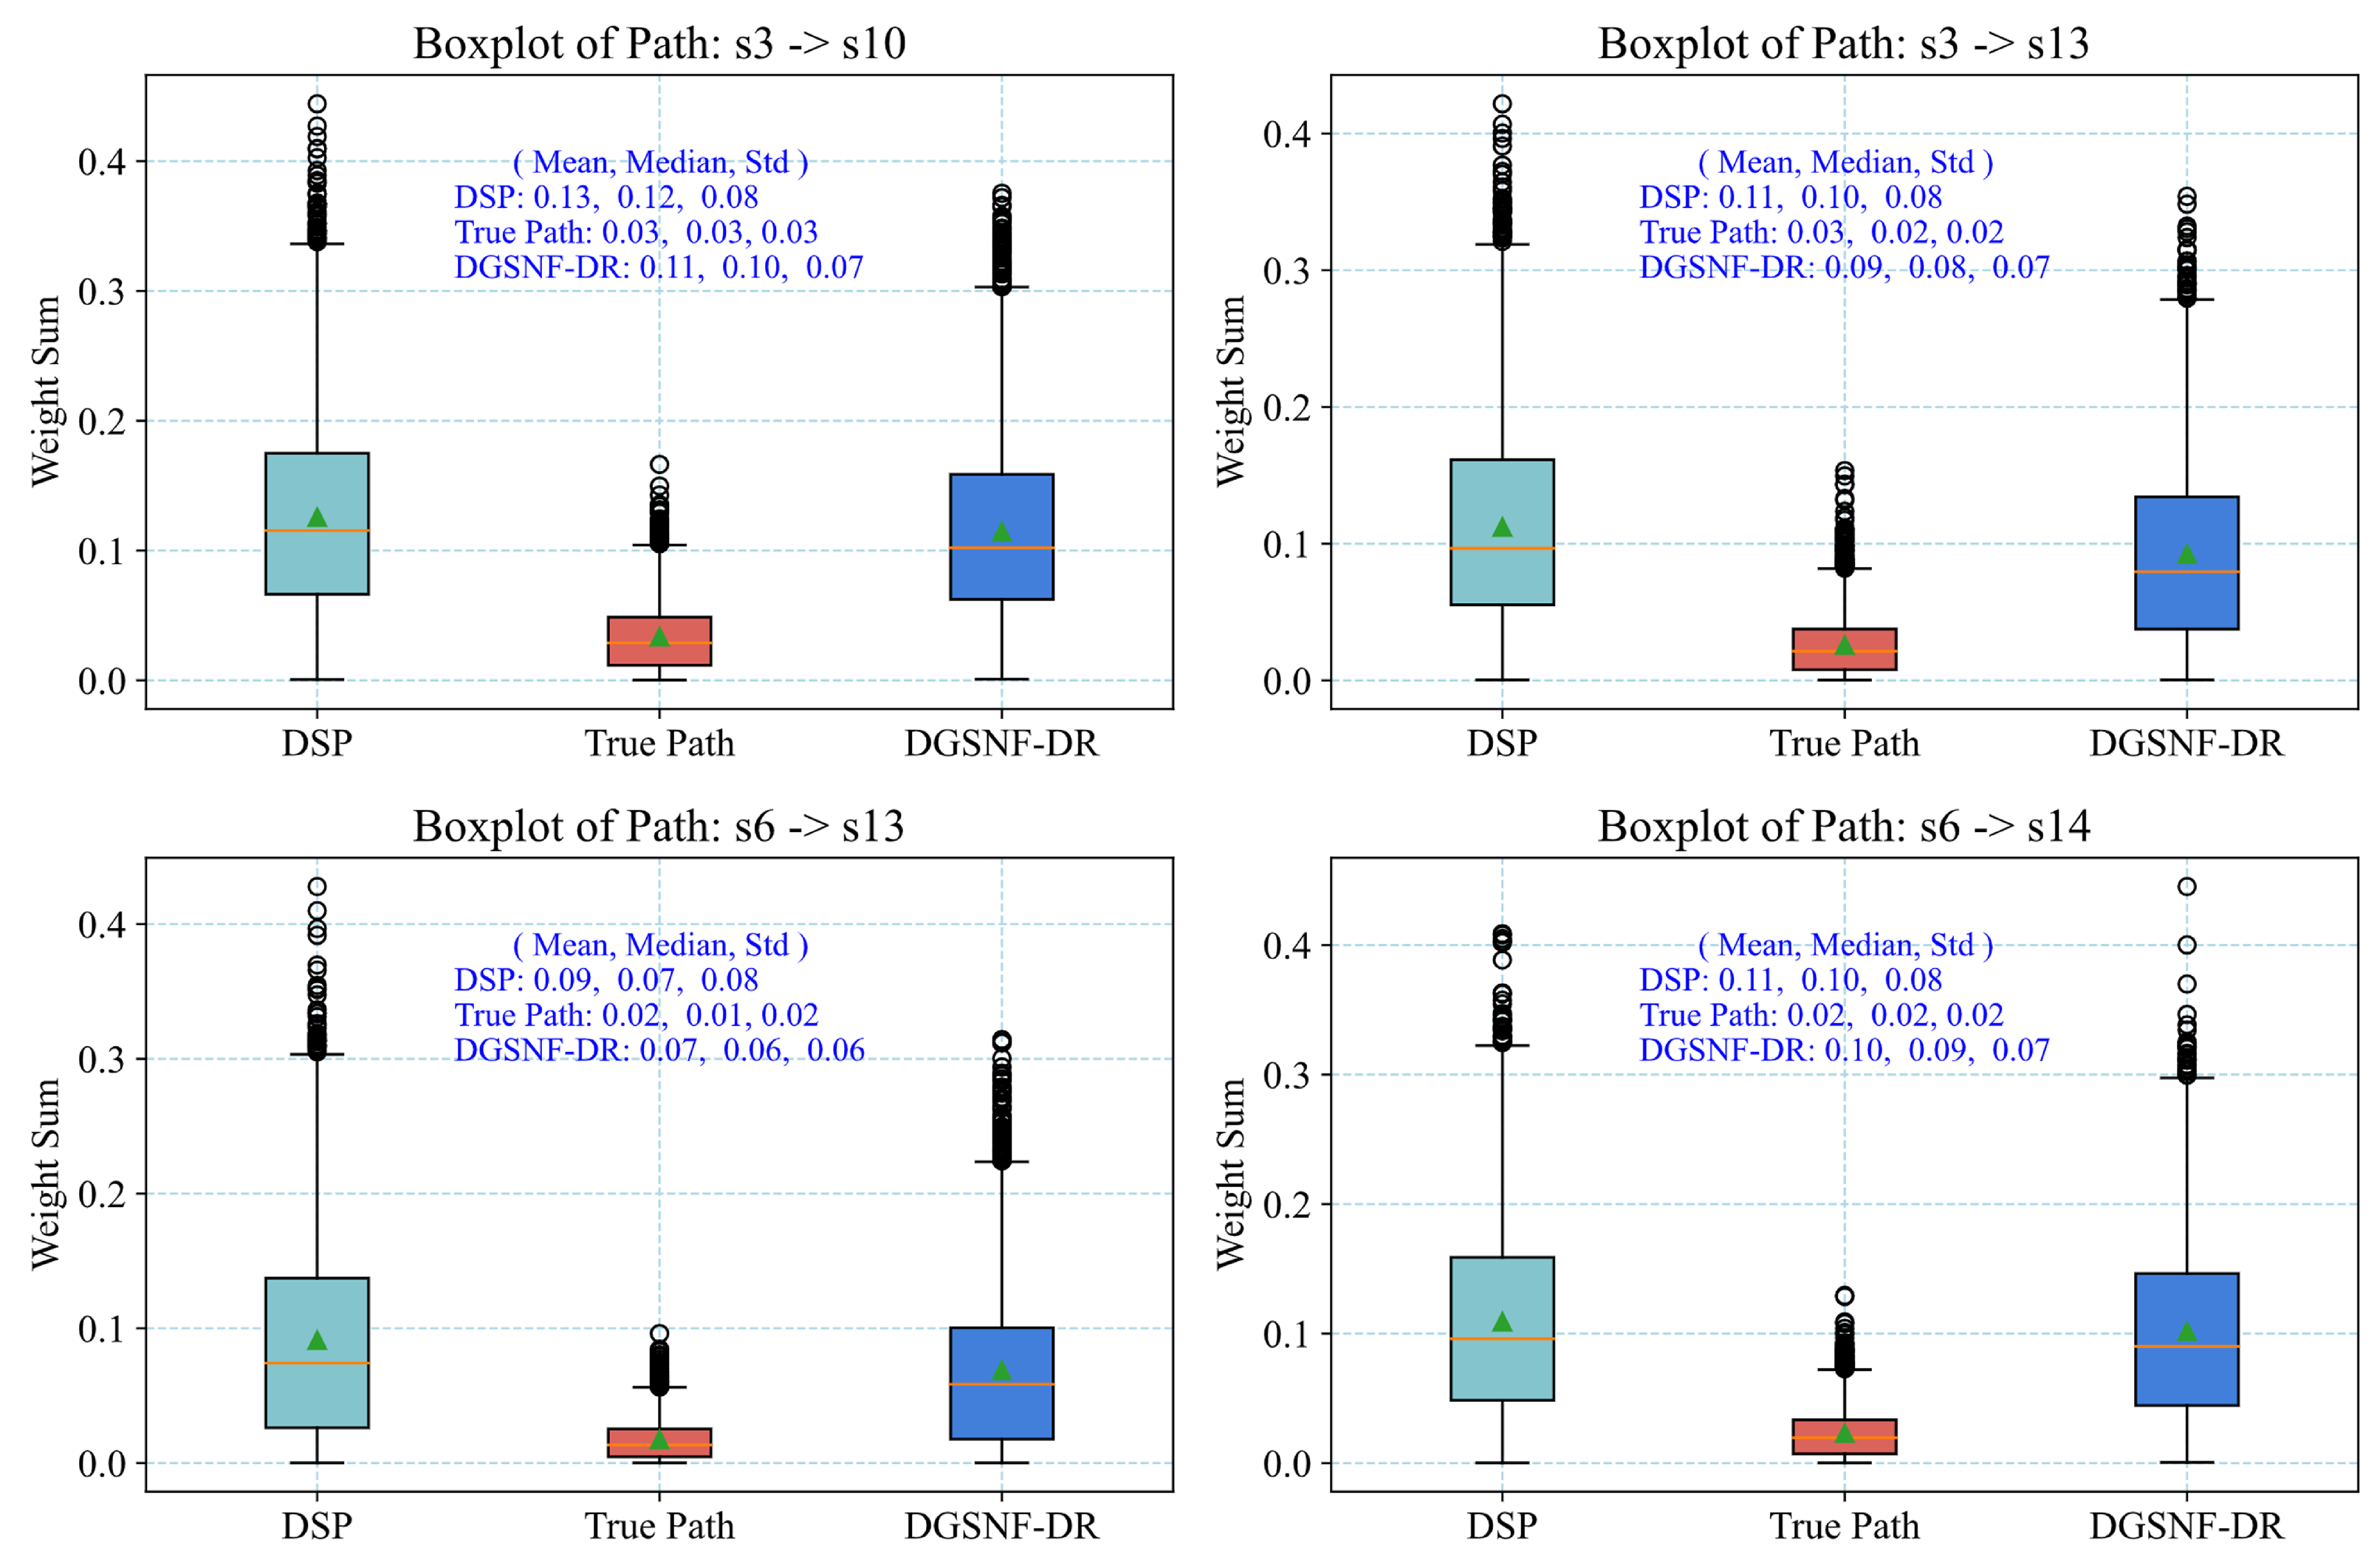
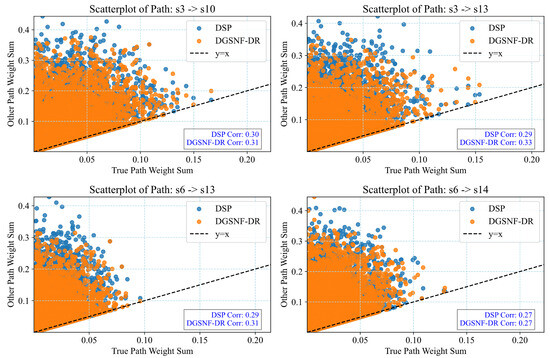
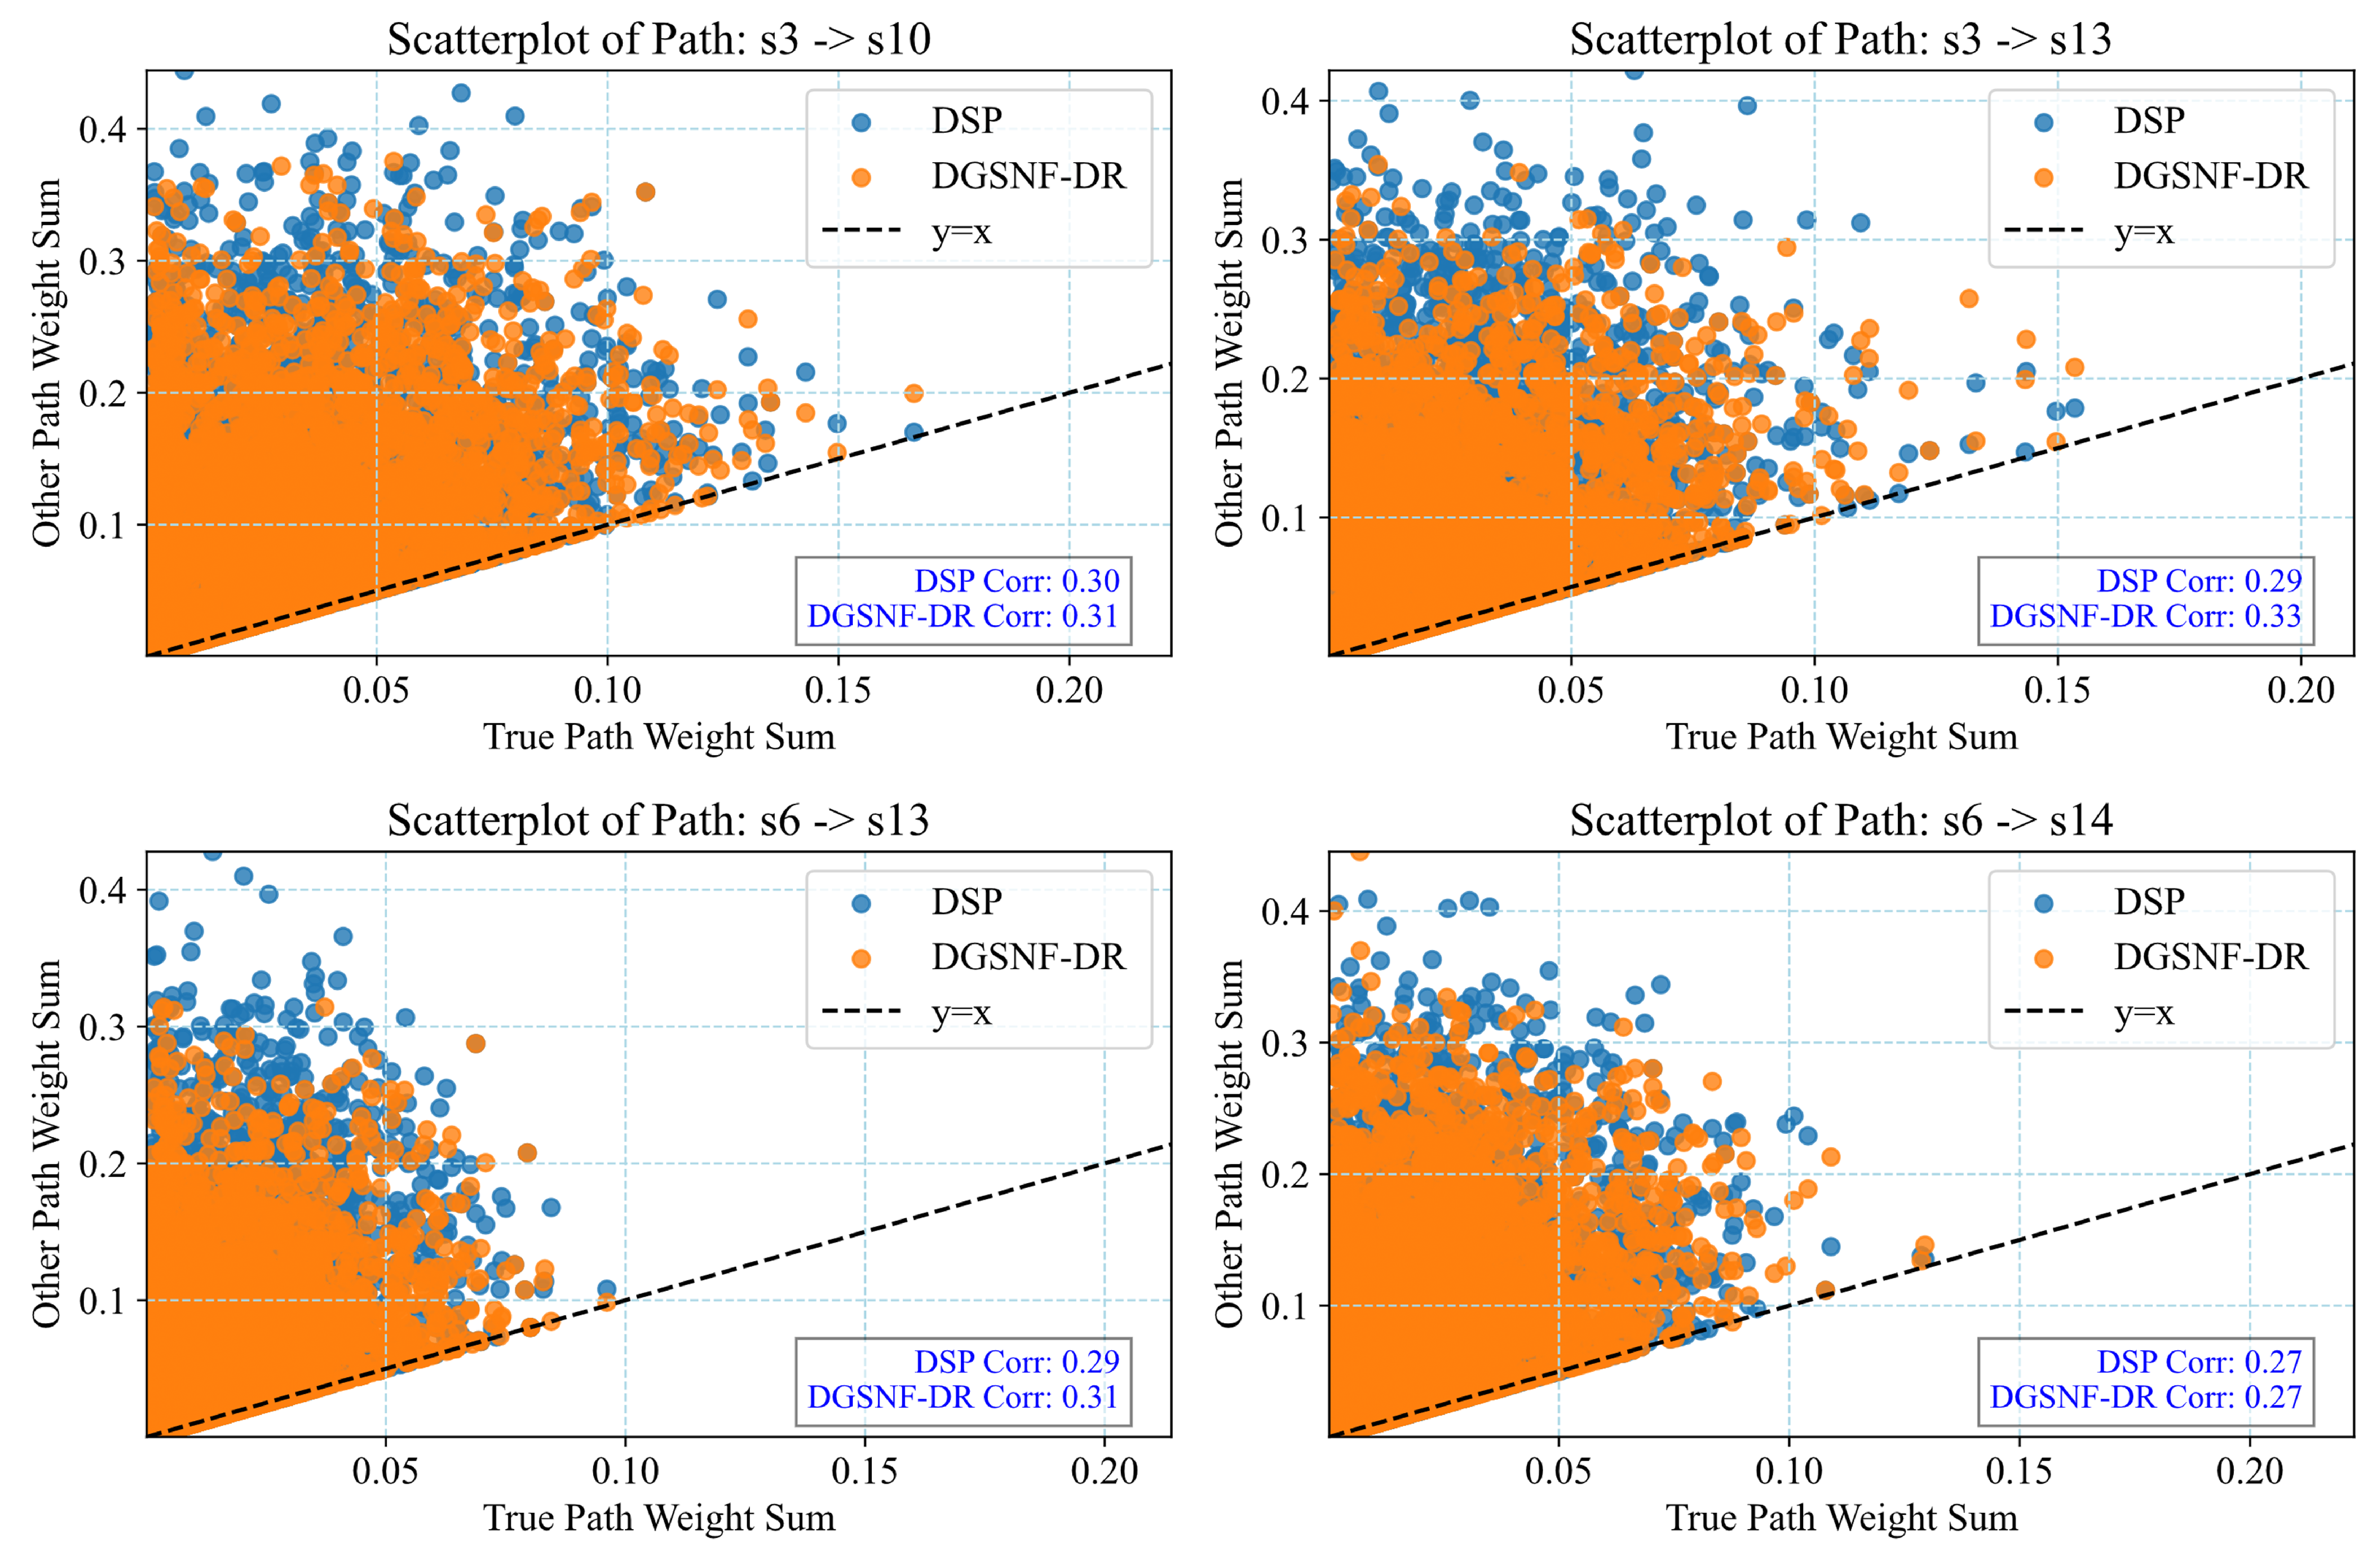
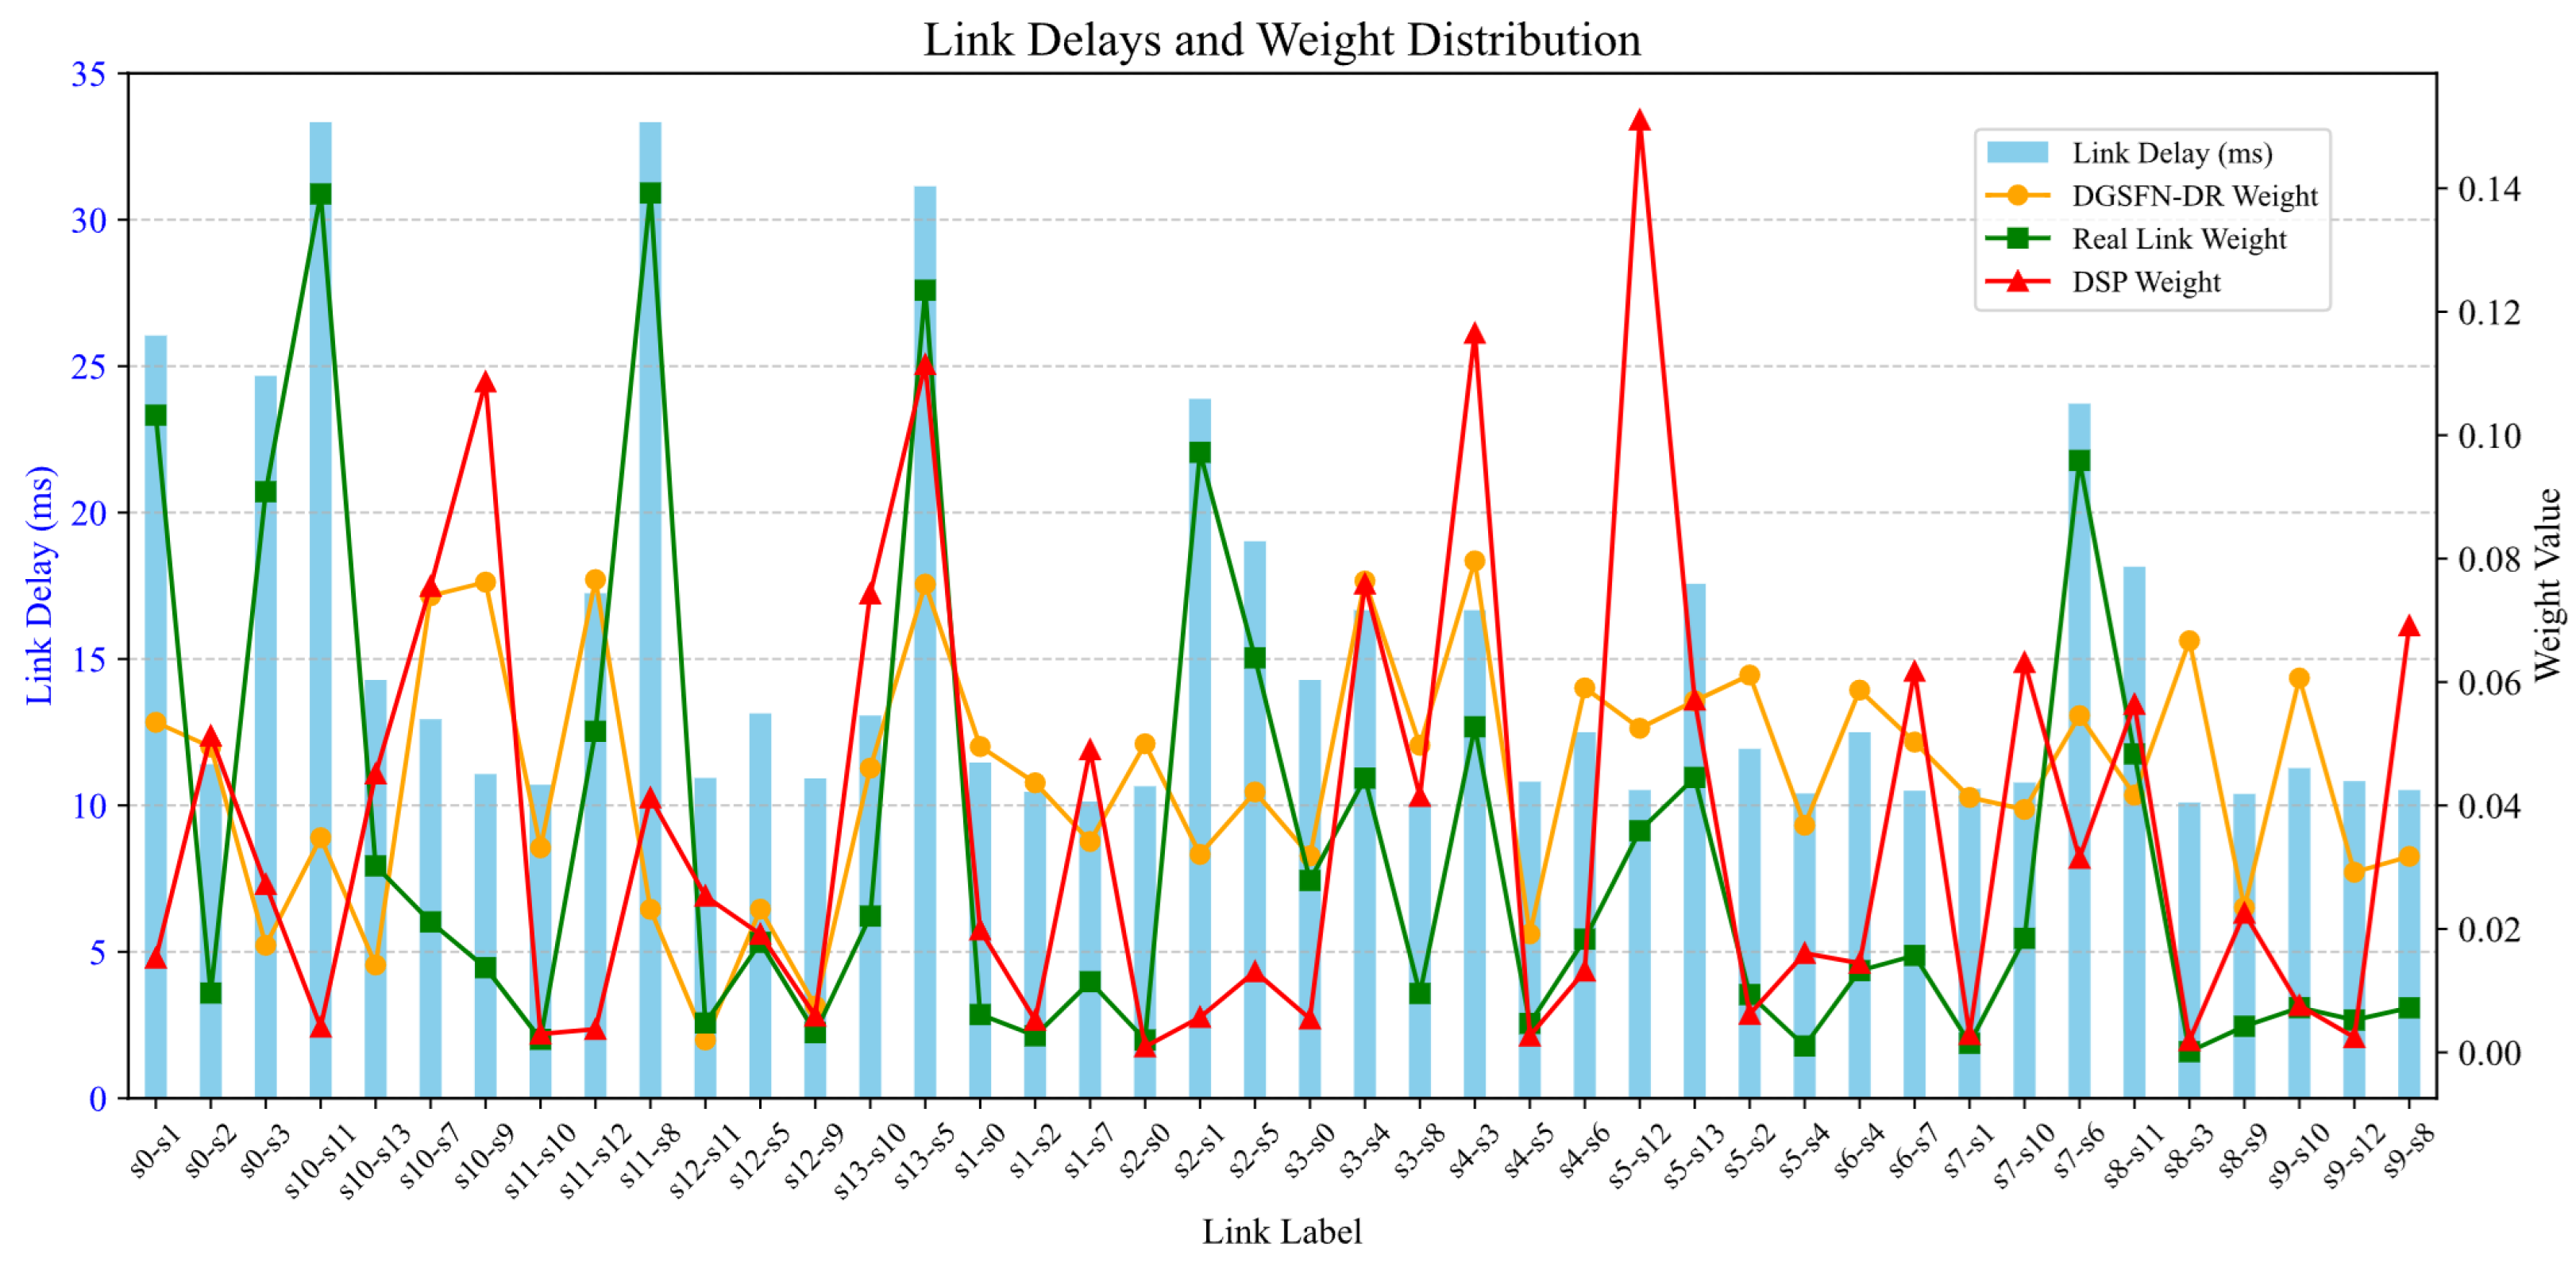
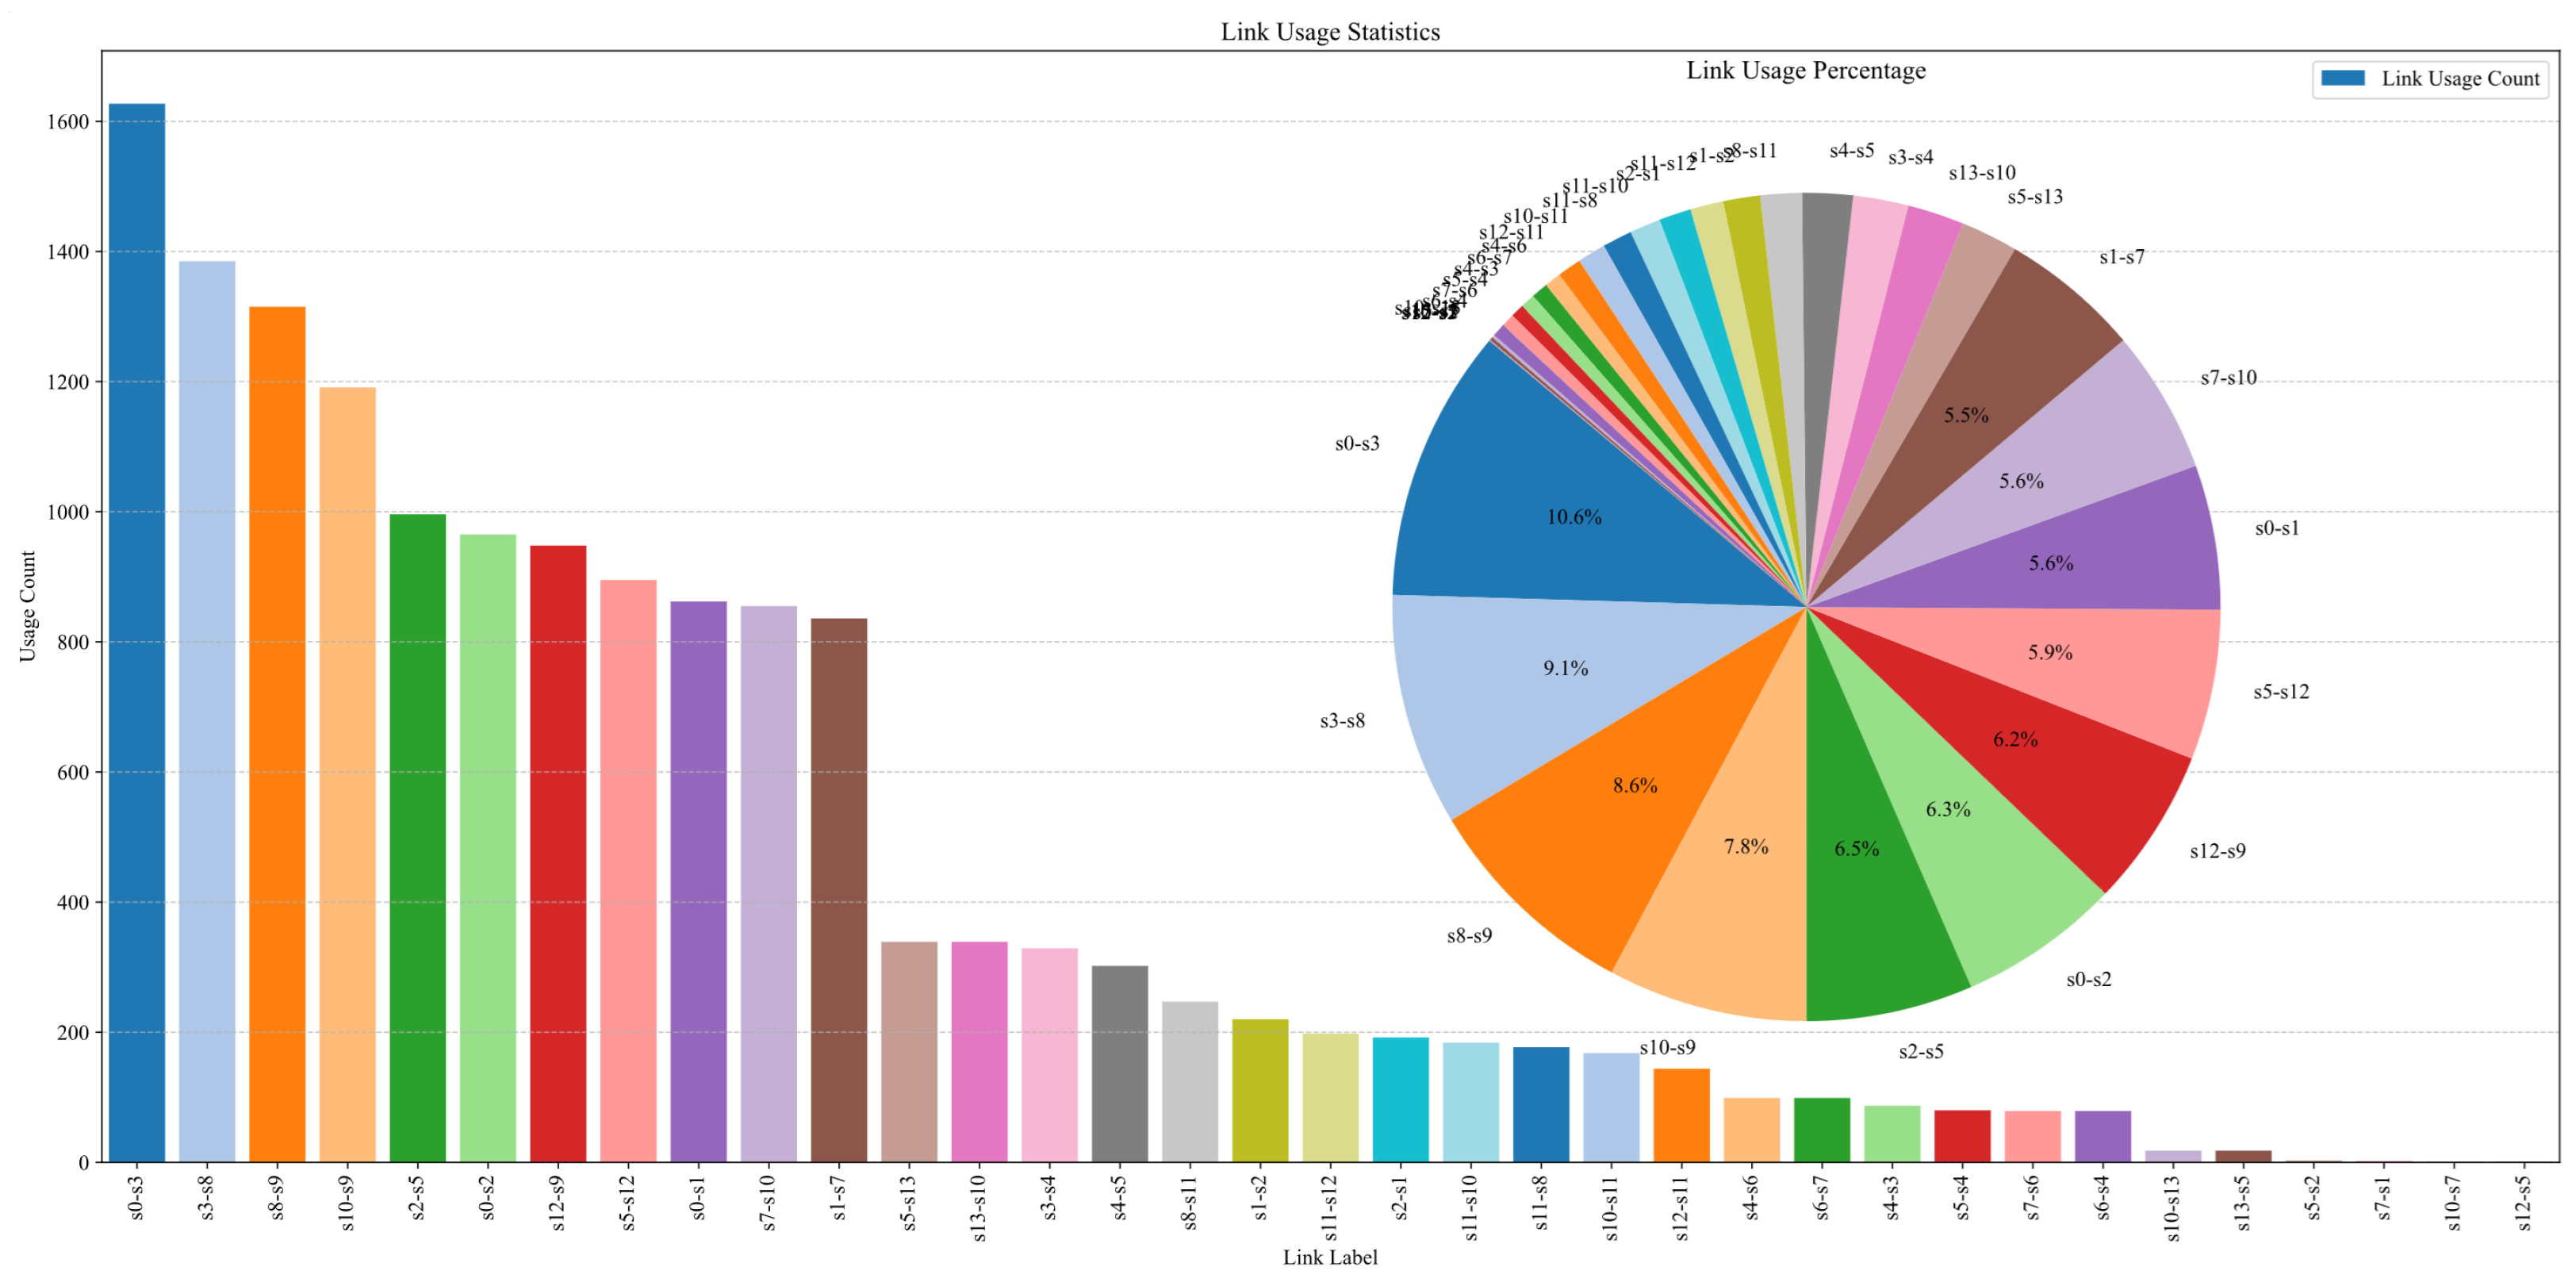
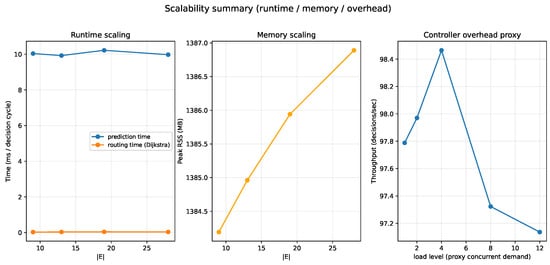
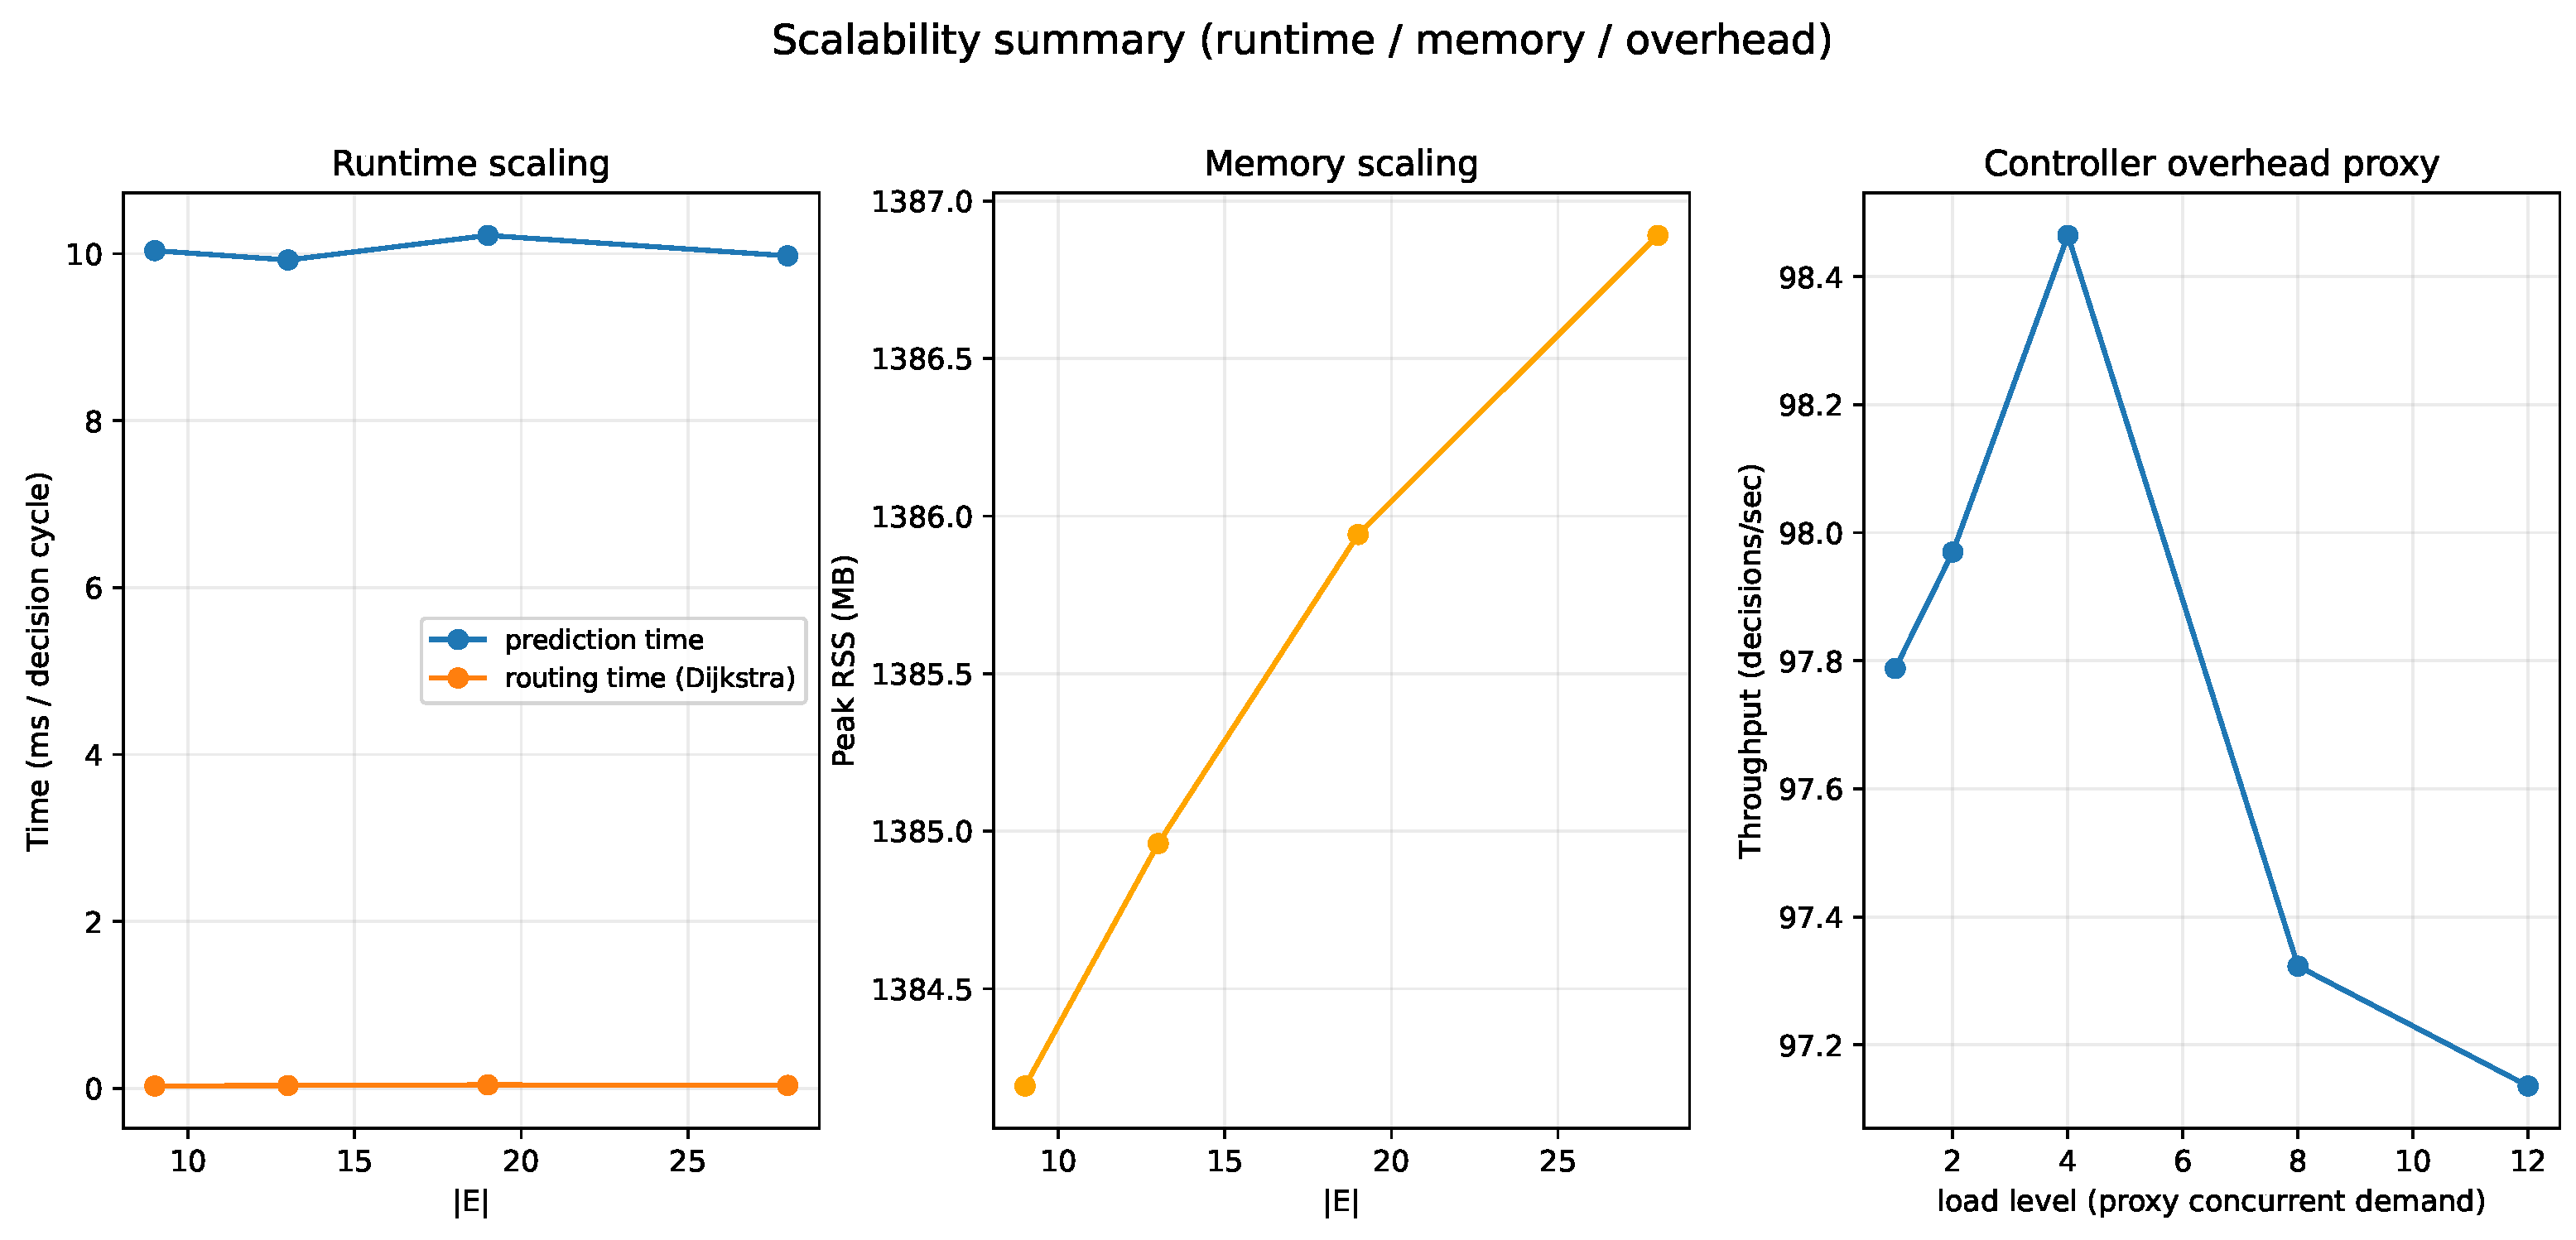
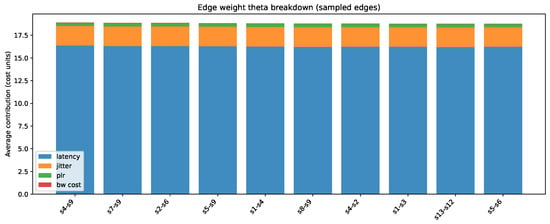
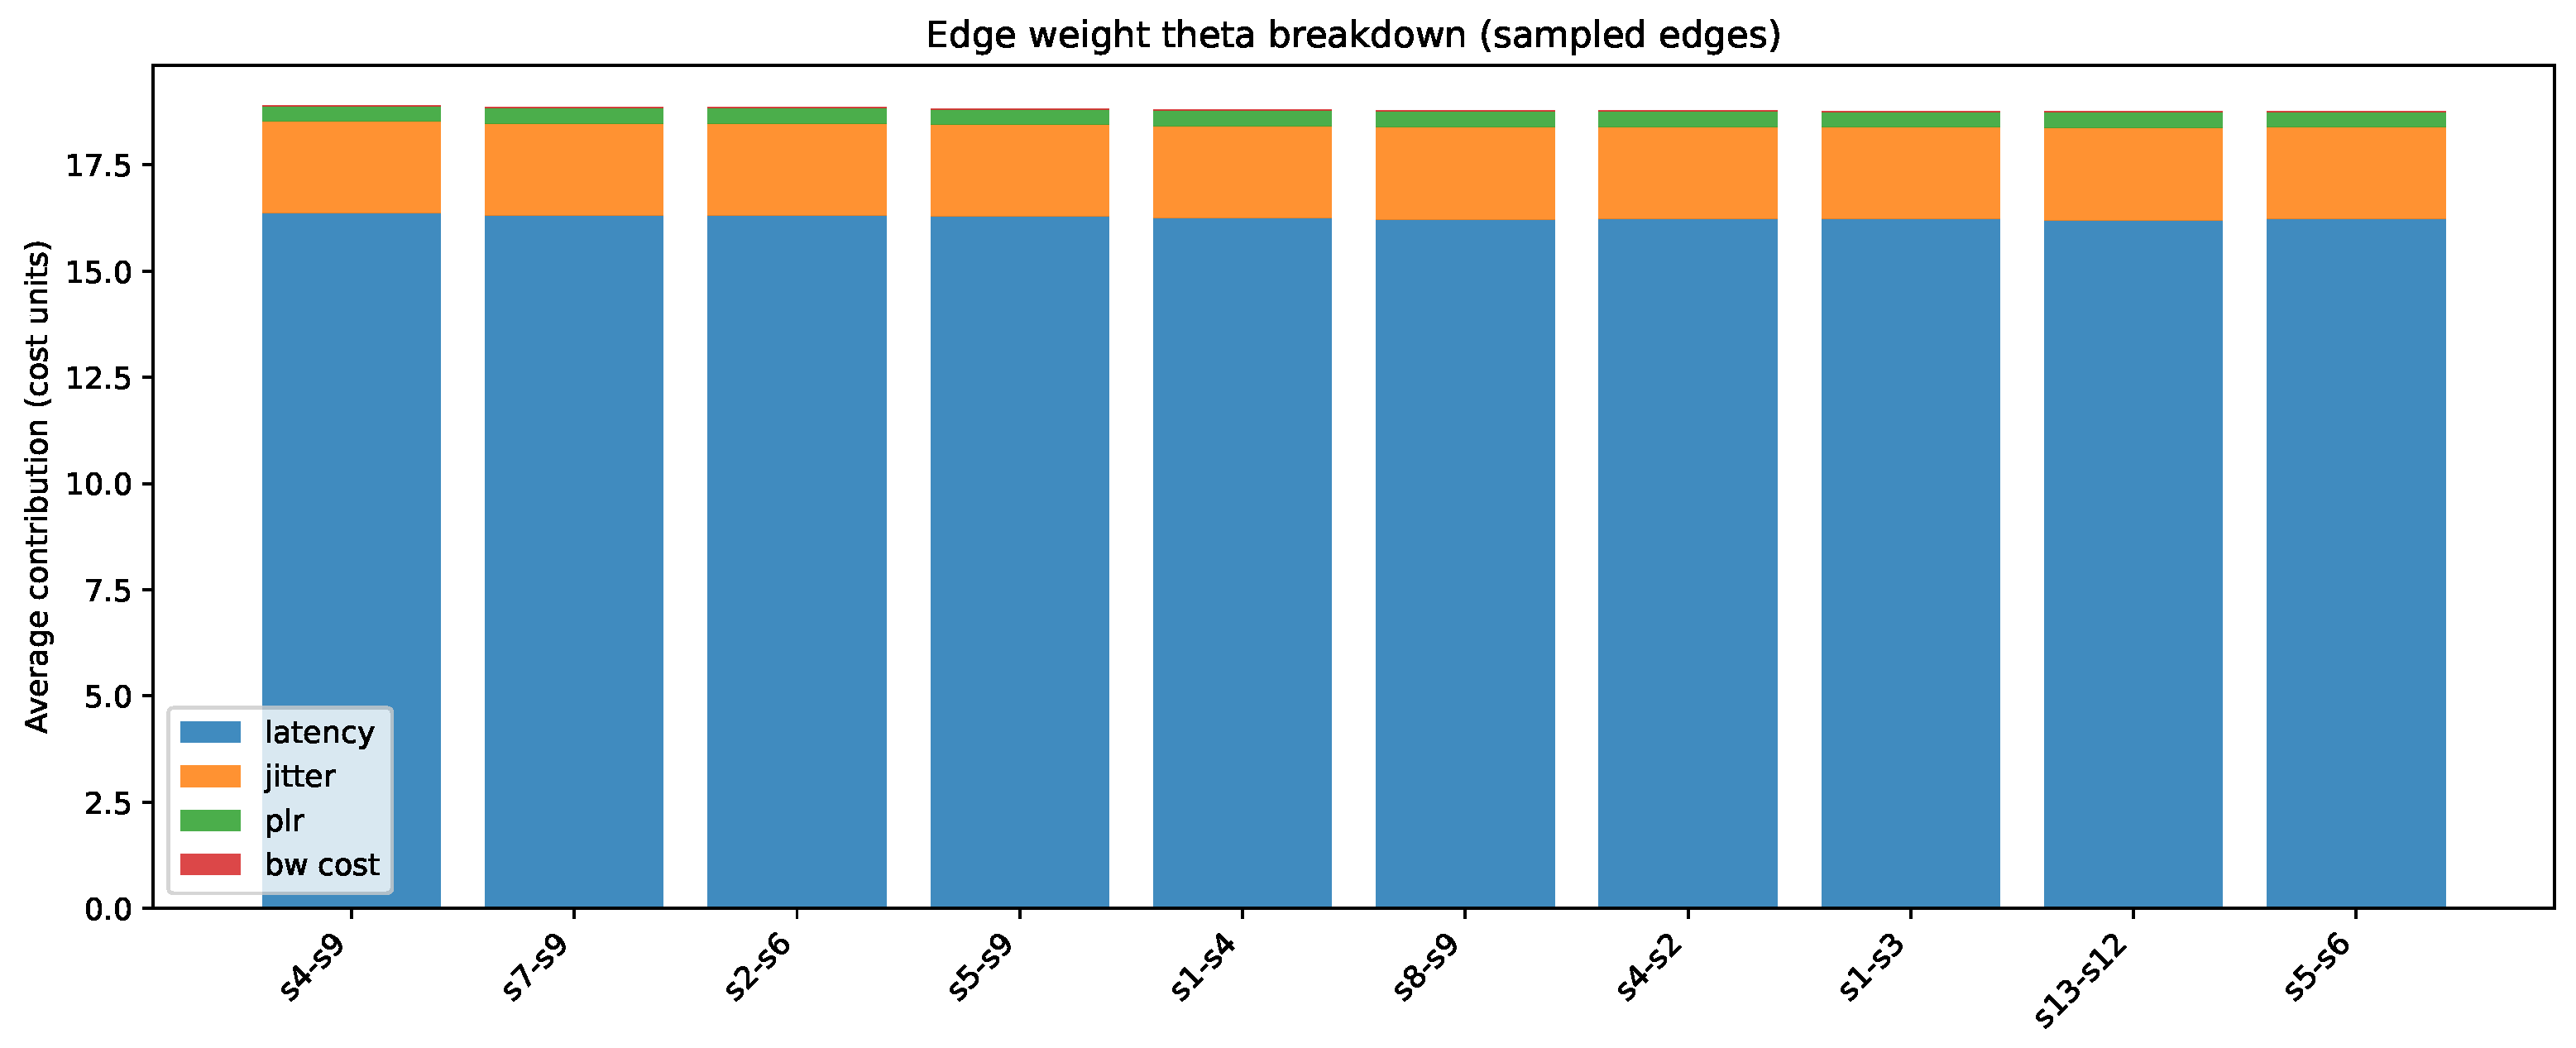

Disclaimer/Publisher’s Note: The statements, opinions and data contained in all publications are solely those of the individual author(s) and contributor(s) and not of MDPI and/or the editor(s). MDPI and/or the editor(s) disclaim responsibility for any injury to people or property resulting from any ideas, methods, instructions or products referred to in the content. |
© 2026 by the authors. Licensee MDPI, Basel, Switzerland. This article is an open access article distributed under the terms and conditions of the Creative Commons Attribution (CC BY) license.