


Abstract
In the future market operation of new power systems, establishing a fair and reasonable cost allocation mechanism for ramping ancillary services is crucial. Such a mechanism would incentivize both the generation and load sides to reduce ramping demands. It will also promote the active participation of flexible resources across ramping services. However, the ramping ancillary service market currently piloted in Shandong, China, exhibits significant shortcomings. Net load volatility and uncertainty have increased the ramping service demand. Yet load-side Users, as beneficiaries, do not share the costs. Meanwhile, flexible units that wish to provide service still bear costs even if they fail to win bids. This violates the “who triggers, who pays” principle. To address this, this paper proposes a fair cost allocation mechanism based on ramping responsibility coefficients of market entities. First, a source-load ramping demand assessment model is developed. It quantifies both deterministic demand from net load variations and uncertain demand from net load forecast errors. Second, a two-layer cost allocation model is constructed using source-load ramping responsibility coefficients. In the first layer, system attribution is performed: initial allocation of ramping service costs is based on the responsibility share of each component—net load variations, load forecast deviations, and renewable energy forecast deviations—in total ramping demand. The second layer—responsibility-retrospective allocation—further assigns these costs by source: costs from net load change are allocated to power Users and renewable energy units; costs from load forecast errors and renewable forecast errors are assigned to the power Users and renewable energy units, respectively. For costs from renewable forecast errors, a differentiated allocation method is designed based on the deviation between declared and actual forecast errors. Case study results show that the proposed mechanism improves fairness and traceability in ramping cost allocation. It offers a market-based reference and supports the development of ramping ancillary service markets.
1. Introduction
To meet carbon emission targets and the growing demand for electricity, power systems around the world are undergoing an energy transition to promote the development of renewable energy generation [1,2,3]. However, the integration of a high proportion of renewable energy sources with high uncertainty and volatility, such as wind and photovoltaic power, into power systems imposes higher requirements on grid flexibility and the economic and secure operation of the system [4,5,6]. Currently, some countries and regions are exploring and developing market mechanisms to procure flexible ramping capability from the grid. The California Independent System Operator (CAISO) in the United States [7] and the Midcontinent Independent System Operator (MISO) [8] have introduced Flexible Ramping Products (FRPs) and Ramp Capability Products (RCPs) into their electricity markets, respectively. Germany conducts auctions for flexible ramping products through 15-minute contracts [9]. The UK National Grid has introduced the Demand Turn Up (DTU) service to address the high penetration of renewable energy [10]. Correspondingly, China has incorporated ramping ancillary services into its market system in the newly issued “Administrative Measures for Electric Power Ancillary Services” [11]. As the first pilot ramping ancillary service market in China, the Shandong ramping ancillary service market was officially implemented on 1 March 2024 [12].
Currently, research on ramping ancillary service markets primarily focuses on the feasibility analysis of providing flexible ramping capability and the joint clearing of energy and ramping ancillary service markets. Reference [13] develops an uncertain flexible ramping product to address the stochastic variations in net load, but it does not consider the cost allocation among diverse market participants. Reference [14] proposes an enhanced flexible ramping product along with a corresponding payment strategy; however, the study focuses on product design and lacks a systematic discussion of cost recovery mechanisms. Reference [15] examines the bidding strategies of energy storage in the flexible ramping product under imperfect competition, establishing bidding models for different suppliers and a two-stage market-clearing model for the Independent System Operator (ISO), but its focus remains on market-clearing efficiency rather than fair cost allocation. Reference [16] discusses the feasibility of electric vehicle charging station operators serving as flexibility service providers to address congestion issues in distribution networks, yet it does not address the traceability and allocation of ramping costs. In summary, existing studies on ramping ancillary service market mechanisms predominantly focus on clearing and dispatch aspects, leaving systematic research on cost allocation—a critical link—still insufficient.
Among the limited practices in cost allocation, the Midcontinent Independent System Operator (MISO) in the United States considers load and exports as the primary beneficiaries of ramping services and allocates costs accordingly. However, MISO does not distinguish between different sources of responsibility for deterministic and uncertain ramping, making accurate attribution difficult [17]. CAISO, on the other hand, allocates costs to load, exports, and generators based on the sources of ramping requirements, but requires a month-end re-settlement based on actual error distributions [18]. Although this month-end re-settlement mechanism theoretically enables cost traceability, it significantly increases system settlement complexity and operational costs. Moreover, since ramping costs are triggered by market participants in the real-time market, month-end delayed settlement weakens the timeliness of economic incentives. Due to the relatively late start of China’s ramping ancillary service market, although the “Basic Rules for Electric Power Ancillary Services” clearly state that in provinces where the electricity market operates continuously, ancillary service costs may be shared between Users and entities not participating in the energy market, during the transitional phase where continuous spot market operation has not been fully realized, the Shandong pilot ramping ancillary service market still adopts a traditional cost-based compensation mechanism. Under this mechanism, compensation costs are allocated to the generation side, distributed among units that do not provide ramping services in proportion to their daily grid-connected energy quantities [12]. This mechanism leads to two prominent issues. First, flexible generators that are willing to provide ramping services but fail to secure bids in the market are still required to bear ramping costs—a “pay-without-service” paradox. Second, with the large-scale integration of new types of loads such as electric vehicles and distributed photovoltaics on the demand side, loads exhibit a significant “source-load duality,” with increased volatility and uncertainty, imposing higher demands on the response speed and capacity of ramping services. However, load-side electricity Users bear no ramping costs while enjoying ramping services provided by the generation side. This clearly violates the principle of fair allocation, may lead to a zero-sum situation for generators, and discourages investment in flexible resources [19]. These deficiencies make it difficult for the market to form effective price guidance signals, constraining the long-term efficiency and sustainability of the ramping ancillary service market. Therefore, it is imperative to construct a fair, efficient, and traceable ramping ancillary service cost allocation mechanism that clarifies the responsibility coefficients of market participants for ramping requirements, enhances market fairness, and restores the electricity commodity attribute of ramping services [20]. This will help refine the Shandong ramping ancillary service market system and provide theoretical support and methodological reference for establishing a market-oriented fair cost allocation mechanism.
Therefore, to address the fairness issue in cost allocation within the Shandong ramping ancillary service market—exacerbated by increased volatility and uncertainty on both the supply and load sides—this paper proposes a fair ramping cost allocation mechanism based on the ramping responsibility coefficients of market participants. This mechanism aims to achieve accurate tracing of ramping responsibilities and fair cost allocation, and its effectiveness is validated through case study analysis. The main contributions are as follows:
(1) A fair, traceable, and efficient ramping cost allocation mechanism is designed. The proposed mechanism establishes a bilevel responsibility quantification model. At the first level, system attribution—based on the analysis of ramping requirement sources and according to the responsibility proportions of net load variation, load forecast deviation, and renewable energy forecast deviation for ramping requirements—and the total ramping ancillary service costs triggered by the overall ramping requirements are initially allocated proportionally. At the second level, responsibility tracing and the costs caused by net load variation are allocated to the load side and the renewable energy side, while the costs caused by load forecast deviation and renewable energy forecast deviation are allocated to the load side and the renewable energy side, respectively.
(2) For cost allocation arising from renewable energy forecast deviation, a differentiated cost allocation mechanism based on the declared forecast error interval and actual error of renewable units is proposed. Through economic means, the risks to the power system caused by renewable energy uncertainty are channeled to the renewable energy side. This incentivizes renewable power plants to proactively improve power forecast accuracy or engage in power mutual support cooperation with flexible resources, systematically reducing the uncertainty of renewable energy output.
The remainder of this paper is structured as follows. Section 2 provides a brief introduction to the Shandong ramping cost allocation approach and analyzes its deficiencies. Section 3 presents the cost allocation mechanism based on the responsibilities of market participants for deterministic and uncertain ramping requirements. Section 4 validates the effectiveness of the proposed method through numerical simulation example analysis. Finally, Section 5 concludes the paper.
2. Analysis of the Shandong Ramping Ancillary Service Mechanism and Its Shortcomings
In the California electricity market, market participants eligible to provide FRP submit bids in the energy and ancillary service markets. CAISO constructs a market model that includes energy, ancillary services, and FRP, and performs market clearing with the objective of maximizing social welfare/minimizing operational costs, obtaining the corresponding prices and cleared quantities for energy, ancillary services, and FRP. The FRP market mechanisms of CAISO and MISO are very similar. The Shandong ramping ancillary service market is jointly cleared with the energy market, but differs in aspects such as market participants, market clearing, and cost allocation. Table 1 summarizes the main differences in the operational mechanisms of flexibility markets among CAISO, MISO, Shandong, and Guizhou.
Table 1.
Differences in flexibility market operation mechanisms across different regions.
2.1. Shandong Ramping Ancillary Service Market Cost Allocation Mechanism
At the current stage, the pilot ramping ancillary services in Shandong includes upward and downward ramping services. The compensation costs for ramping ancillary services are calculated on a daily basis and settled monthly. Suppliers that provide ramping services on a given day do not participate in the cost allocation of ramping ancillary services for that day. The costs are allocated among generating units that do not provide ramping services (including utility-scale public generating units, grid-connected wind farms, grid-connected photovoltaic power stations, and independent new energy storage power stations) in proportion to their grid-connected energy quantities on that day, as shown in Equation (1), with daily calculation and monthly settlement [12].
where is the allocated cost for generating unit j that does not provide ramping services; is the ramping ancillary service compensation cost received by supplier i during time interval t; and is the actual electricity generation of unit j during time interval t.
As shown in Equation (2), the compensation revenue of a ramping ancillary service supplier consists of the compensation costs for upward and downward ramping services [12].
where and are the actual upward and downward ramping capacity provided by supplier i during time interval t, respectively; and are the clearing prices for upward and downward ramping services during time interval t, respectively.
2.2. Shandong Ramping Cost Allocation Mechanism Deficiencies
(1) Under the current Shandong ramping cost allocation mechanism, Users benefit from ramping services without bearing the costs, resulting in a lack of fairness.
When flexible units participate in the Shandong ramping ancillary service market, they are cleared based on opportunity costs without submitting price bids. Consequently, units such as hydropower or gas turbines, despite having fast ramping rates, may fail to win bids due to relatively high opportunity costs. Moreover, system ramping requirements are limited in each time interval. When a large number of flexible units compete, some units inevitably fail to secure bids. As a result, even flexible units willing to provide ramping services may still be required to bear ramping ancillary service costs due to their inability to win bids. However, according to the “who causes, who bears” principle, the costs for ramping ancillary services should be borne by the market participants that create the ramping requirements.
In the context of the new power system, the diverse resources connected to the load side—such as stochastic loads from electric vehicles and intermittent distributed photovoltaic generation—are driving a structural transformation of load characteristics, exhibiting a distinct “dual supply-demand characteristic.” On one hand, electric vehicles, as a new type of load, demonstrate significant spatiotemporal randomness in their charging behavior. On the other hand, the integration of distributed photovoltaics on the load side transforms Users from pure Users into prosumers. The output of distributed PV is directly affected by meteorological conditions, and Users’ self-consumption behavior further increases the unpredictability of system net load. This evolution in load characteristics imposes higher demands on the response speed and regulation capacity of ramping services. Nevertheless, under the current market mechanism, load-side Users, as direct beneficiaries of ramping services, are exempt from bearing the corresponding ancillary service costs, which clearly violates the principle of fair cost allocation.
Furthermore, if flexible units seek to avoid unfairly allocated costs, they may adopt distorted strategies when participating in the energy market. For instance, a highly efficient gas turbine might deliberately reduce its generation output in the energy market or increase its bid price to lower its opportunity cost, thereby reducing its allocation coefficient. However, such behavior could lead to higher clearing prices in the energy market, undermining overall market economic efficiency.
(2) The current Shandong ramping cost allocation mechanism fails to reflect the sources of costs, thereby weakening market guidance and subsequently constraining the development of renewable energy.
Units that do not provide ramping ancillary services are typically uncontrollable renewable units such as wind farms and photovoltaic power stations. The current Shandong mechanism, which allocates costs in proportion to grid-connected energy quantities, cannot clearly reflect the actual sources of ramping service costs. This diminishes the guiding role of the market mechanism and hinders the development of renewable energy. For instance, compared to wind power, photovoltaic power generally exhibits lower forecast errors. Given the same generation output, the ramping requirements triggered by forecast errors from PV are usually lower than those from wind power. However, under the current mechanism, PV operators still bear the same cost allocation proportion as wind power, imposing excessively high costs on PV and lacking fairness, which is detrimental to its development. Therefore, following the “who causes, who bears” principle, costs should be allocated based on the extent to which each market participant’s uncertainty contributes to ramping requirements. Costs should also be passed through to Users to enhance fairness and restore the electricity commodity attribute of ramping ancillary services.
3. Design of a Ramping Ancillary Service Cost Allocation Mechanism Based on the Ramping Responsibility Coefficient
3.1. Source Analysis of Ramping Requirements
The current Shandong ramping ancillary service market mechanism is implemented through day-ahead declaration and joint clearing with the intraday and real-time spot markets. The power dispatch center determines the upward and downward ramping requirements for each time interval (every 15 min) on the operating day D based on actual system operating conditions. As shown in Figure 1, the upward/downward ramping requirement of the system during time interval t is determined by the change in system demand 15 min later. It consists of two components: first, the predicted net load (load minus renewable generation) variation for the next time interval, which represents a deterministic requirement; second, the forecast deviation of system net load within a certain confidence interval, including load and renewable forecast deviations, which represents an uncertainty requirement. Therefore, the upward/downward ramping requirement of the system during time interval t is expressed as shown in Equation (3).
where and are the upward and downward ramping requirements of the system during time interval t, respectively (both positive values, excluding direction); and are the forecasted net load of the system for time intervals t and t + 1, respectively; and are the upward and downward forecast deviations of load at a certain confidence level for time interval t + 1, respectively; and and are the upward and downward forecast deviations of renewable energy output at a certain confidence level for time interval t + 1, respectively.
Figure 1.
Ramping demand source composition.
3.2. Cost Allocation Mechanism Considering the Ramping Responsibility Coefficient
The fair cost allocation mechanism is an institutional arrangement that follows the “who causes, who pays” principle. It can accurately identify the responsibility contribution of each market entity to the system ramping demand, reasonably allocate the ramping ancillary service costs to the responsible parties, and ensure the allocation results with effective economic incentives, traceable responsibilities, and engineering operability. To make the mechanism more standardized and complete, this paper further defines its institutional criteria, introduction conditions, and application framework:
- (1)
- Institutional Criteria: The fair ramping cost allocation mechanism proposed in this paper is constrained by four core criteria as theoretical foundations: responsibility matching, traceability, incentive compatibility, and engineering implementability. Their formal definitions are as follows:
- (a)
- Responsibility Matching Criterion (Axiom 1): The allocated cost must be strictly positively correlated with the market participant’s contribution to ramping responsibility. That is, for any two market participants I and j, if their ramping responsibility coefficients satisfy ri ≥ rj, then their corresponding allocated costs must satisfy ci ≥ cj, eliminating mismatches between responsibility and cost.
- (b)
- Traceability Criterion (Axiom 2): Every allocated cost must be uniquely traceable to its physical cause and responsible entity. That is, there exists a surjective mapping ϕ that maps each allocated cost uniquely to its corresponding ramping driver (net load variation, load forecast deviation, renewable energy forecast deviation) and responsible participant, enabling transparent cost tracing and clear responsibility boundaries.
- (c)
- Incentive Compatibility Criterion (Axiom 3): The cost allocation mechanism must provide positive incentives for participants to improve their behavior. That is, if a market participant reduces its responsibility coefficient from ri to r′i< ri through its own efforts, its allocated cost must satisfy c′i ≤ ci, thereby guiding participants to actively improve forecast accuracy and regulation capabilities.
- (d)
- Engineering Implementability Criterion: The mechanism design must balance theoretical rigor with practical applicability. While satisfying the above three axioms, it must maintain clear logic and manageable computational complexity; adapt to existing power market trading, metering, and settlement processes; and possess practical conditions for promotion and deployment.
- (2)
- Introduction conditions: Requiring the foundation of the intraday/real-time spot market, the capability of renewable energy probabilistic forecasting and declaration, load metering conditions, and a supporting supervision system.
- (3)
- Application mechanism: Adopting the two-layer implementation framework of “system attribution + responsibility tracing”. From the perspective of physical causality, the upward/downward ramping demand of the system mainly comes from the net load change and the net load forecast deviation, which can be further decomposed into load forecast deviation and renewable energy forecast deviation. Based on this causal chain, this paper constructs a two-layer analysis framework of “system attribution + responsibility tracing”. At the system attribution layer, the total ramping cost is first objectively attributed based on physical driving factors. According to the contribution proportion of net load change, load forecast deviation and renewable energy forecast deviation to the total ramping responsibility, the total ramping ancillary service cost is initially allocated, and three independent “cost pools” are established to lay the foundation for the subsequent transmission of economic responsibilities to relevant market entities. At the responsibility tracing layer, refined and traceable cost allocation is carried out for the responsible entities corresponding to each cost pool.
Compared with conventional single-layer cost allocation methods (e.g., proportional allocation based on energy output or fixed coefficients), the proposed bilevel structure has the following three significant advantages: (1) Causal discrimination capability: Single-layer methods typically allocate costs based on a single dimension (e.g., generation or load volume) and cannot distinguish the differentiated contributions of different causes (net load variation, and forecast deviations) to ramping requirements. In contrast, the bilevel structure achieves more refined and traceable cost allocation through the two layers of “system attribution” and “responsibility tracing.” (2) Mismatch correction: Single-layer methods find it difficult to differentiate the volatility responsibilities of the load side and the renewable side, often leading to a mismatch where “small responsibility bears large cost, large responsibility bears small cost.” By establishing independent cost pools in the first layer and accurately tracing responsibilities according to responsibility coefficients in the second layer, the bilevel structure effectively solves the problem of responsibility-cost mismatches. (3) Behavioral incentive guidance: Single-layer methods often lack incentives to guide market participant behavior. Through mechanisms such as differentiated error allocation, the bilevel structure incentivizes renewable enterprises to proactively improve power forecast accuracy while guiding load-side Users to optimize their electricity consumption behavior, thereby achieving a virtuous cycle from passive cost bearing to active cost reduction.
3.2.1. First-Layer Cost Allocation Based on the Causes of Ramping Requirements
According to Section 3.1, the upward and downward ramping requirements of the system arise from net load variation and net load forecast deviation. Among these, the net load forecast deviation can be decomposed into load forecast deviation and renewable energy forecast deviation. To establish a fair and traceable ramping cost allocation mechanism, a framework of “system attribution and responsibility tracing” needs to be constructed. First, the total ramping cost is objectively attributed at the system level based on the physical causes. Subsequently, the attributed costs are transmitted as economic responsibilities to the relevant market participants. Accordingly, the total ramping ancillary service costs are initially allocated in proportion to the ramping requirements generated by each type of cause. Specifically, based on the proportions of net load variation, load forecast deviation, and renewable energy forecast deviation in the total ramping responsibility, the ramping ancillary service costs triggered by the total ramping requirements are allocated accordingly, as shown in Equations (4)–(7). This allocation process constitutes an objective attribution based on physical driving factors, aiming to establish three independent “cost pools” that provide a foundation for subsequent economic responsibility tracing to the relevant market participants. It is particularly important to note that the fundamental sources of the load forecast deviation and renewable energy forecast deviation cost pools are the uncertainty in load-side electricity consumption behavior and the uncertainty in renewable energy output, respectively. Their economic responsibilities should ultimately be transmitted to the load side and renewable energy power stations, respectively. As for the dispatch center, in its role as the system operator, its responsibility lies in minimizing such deviations through improving forecast accuracy. This part of the responsibility should be separately assessed through a performance evaluation system at the regulatory level.
where and are the upward and downward ramping cost allocations for time interval t caused by net load variation, respectively; and are the total upward and downward ramping ancillary service compensation costs received by all ramping ancillary service suppliers during time interval t, respectively, as shown in Equation (7); and are the upward and downward ramping cost allocations for time interval t caused by load forecast deviation, respectively; and are the upward and downward ramping cost allocations for time interval t caused by renewable energy forecast deviation, respectively.
3.2.2. Second-Layer Responsibility Tracing for Cost Allocation
- 1.
- Cost Allocation for Net Load Variation
As shown in Equation (8), the net load variation is driven by both the load side and the renewable energy side. In the new power system, the volatility on both the supply and load sides has significantly increased. On the supply side, the integration of a high proportion of renewable energy makes its output strongly dependent on meteorological conditions, exhibiting significant intermittency and randomness. On the load side, the acceleration of electrification in energy consumption, coupled with the transformation of electricity Users from traditional “Users” into “prosumers,” has fundamentally altered the characteristics of system net load. Specifically, large-scale electric vehicles, as a new type of load, exhibit significant spatiotemporal randomness in their charging behavior due to User habits. The widespread deployment of massive distributed photovoltaic systems as generation units on the load side has profoundly changed the typical shape of the net load curve, leading to an “inverse load” phenomenon—during the day, abundant sunlight causes high PV output, leading to a sharp decline in net load and forming a low-demand period; after sunset, PV output plummets while electricity demand rises, causing a rapid increase in net load. This superimposed effect of volatility on both the supply and load sides presents the system with more complex ramping scenarios.
Therefore, appropriately allocating the ramping ancillary service costs caused by net load variations to the load side and the renewable energy side not only adheres to the “who causes, who bears” cost allocation principle but also establishes an effective price signal. On one hand, it encourages load-side Users to adjust their electricity consumption behavior and actively participate in demand response. On the other hand, it provides a strong economic incentive for the renewable energy side to enhance output controllability by optimizing generation profiles and configuring energy storage facilities. This helps to alleviate system ramping pressure at the source and promote coordinated optimization between supply and demand.
where and are the load demands of User k during time intervals t and t + 1, respectively; and are the outputs of renewable unit l during time intervals t and t + 1, respectively.
As indicated in Equation (8), when the load demand variation in User k during time interval t is positive, it only triggers upward ramping requirements. In this case, User k only bears the upward ramping cost allocation for that interval. Conversely, when the output variation in renewable unit l during time interval t is negative, it exacerbates upward ramping requirements and should likewise bear the upward ramping cost. Similarly, when the load demand variation in User k during time interval t is negative, it only triggers downward ramping requirements. In this case, User k only bears the downward ramping cost allocation for that interval. When the output variation in renewable unit l during time interval t is positive, it exacerbates downward ramping requirements and should bear the downward ramping cost. Therefore, for ramping ancillary service costs caused by net load variation, the allocation is performed proportionally based on the variation in load demand of Users and the variation in output of renewable units during the current time interval, as detailed in Equations (9) and (10).
where and represent the positive and negative load demand variations in User k during time interval t, respectively, with ; and represent the positive and negative forecast output variations in renewable unit l during time interval t, respectively, with ; and are the upward and downward ramping cost allocations borne by User k during time interval t due to net load variation; and are the upward and downward ramping cost allocations borne by renewable unit l during time interval t due to net load variation.
- 2.
- Cost Allocation for Load Forecast Deviation
Load forecast deviation is caused by the uncertainty in User electricity consumption behavior. Therefore, the ramping ancillary service costs arising from load forecast deviation are allocated to the load side. At present, since load-side Users in the Shandong real-time market cannot participate through quantity and price bids, it is difficult to obtain individual User consumption deviations through market data. Load forecast deviation reflects the aggregated result of the entire network, making it challenging to precisely quantify the deviation attributable to individual Users. Consequently, the ramping ancillary service costs caused by load forecast deviation are allocated to the load side in proportion to electricity consumption, as shown in Equation (11). This approach approximately reflects each User’s responsibility coefficient for system ramping requirements.
where and are the upward and downward ramping cost allocations borne by User k during time interval t due to load forecast deviation, respectively; is the dispatch time interval.
- 3.
- Cost Allocation for Renewable Energy Forecast Deviation
Renewable energy forecast deviation should be reasonably borne by the renewable power plants responsible for the deviation. Based on the current assessment requirements imposed by grid companies on renewable plants [21], and considering that although research on probabilistic forecasting has advanced significantly [22,23], it has not yet been fully applied in grid dispatch and evaluation systems, and given that ramping requirements caused by renewable forecast deviations arise from the volatility and uncertainty of forecasts, renewable plants are required to submit both their power forecasts and the corresponding forecast error bounds at a specified confidence level. The ramping ancillary service costs caused by renewable energy forecast deviation are then allocated in two parts based on the submitted error bounds and the actual forecast errors, as shown in Equation (12). By comparing the declared forecast error bounds with the actual operational errors, this approach enables a more accurate quantification of the ramping ancillary service costs attributable to each renewable unit’s forecast deviation.
where is the ramping cost allocation borne by renewable unit l during time interval t due to renewable energy forecast deviation; and are the ramping cost allocations borne by renewable unit l during time interval t due to its declared forecast error interval and actual forecast error, respectively; and are the upper and lower forecast error bounds reported by renewable unit l for time interval t, respectively; is the allocation coefficient for renewable unit l during time interval t based on its actual forecast error; and is the proportion of ramping cost allocated for the declared forecast error interval to the total ramping cost borne by renewable units, with a value between 0 and 1.
The practice of renewable energy units reporting the upper and lower bounds of their forecast errors represents a commitment to forecast accuracy. To prevent some plants from intentionally underestimating their error ranges in order to reduce their cost allocation shares, a higher cost allocation proportion should be applied to units whose actual forecast errors exceed the declared ranges. This mechanism design effectively encourages renewable plant operators to continuously improve forecast accuracy while ensuring they bear corresponding responsibility for their declared forecast deviations. Therefore, the allocation coefficient for renewable unit l based on its actual forecast error can be expressed as shown in Equation (13):
where is the actual error of renewable unit l during time interval t; and is the penalty coefficient for forecast errors exceeding the declared bounds.
3.3. The Joint Transaction Organization Process and Data Requirements of the Shandong Spot and Ramping Ancillary Service Markets
In light of the proposed two-layer ramping cost allocation method and the joint transaction organization process of the spot market and the ramping ancillary service market, the overall process is shown in Figure 2. The specific steps are described as follows:
Figure 2.
Joint transaction organization process of the Shandong spot and ramping ancillary service markets.
Step 1: By 10:00 on the bidding day (Day D − 1), the dispatch center publishes pre-market information for the day-ahead spot market, including the system load forecast curve, critical grid section constraints, market competition space, etc.
Step 2: By 12:00 on Day D − 1, generators participating in the spot market submit their bid quantities and prices for the operating day. Generators (thermal units) participating in the ramping ancillary service market declare their ramping rates (without price bids).
Step 3: During 12:00–18:30 on Day D − 1, the dispatch center clears the day-ahead spot market (energy market only), determining the cleared energy quantities and locational marginal prices for each interval of the operating day.
Step 4: Before real-time operation on the operating day (Day D), the dispatch center determines the upward/downward ramping requirements for each time interval (every 15 min) based on actual system operating conditions. Ramping requirements are determined by net load variation and load/renewable forecast deviations.
Step 5: At t − 30 min on Day D (30 minutes before real-time operation), renewable units declare the upper and lower bounds of their forecast errors.
Step 6: At t − 15 min on Day D, based on the latest grid operating status and ultra-short-term load and renewable output forecasts, the dispatch center performs joint clearing of the real-time spot market and the ramping ancillary service market, obtaining real-time clearing prices, cleared energy quantities, ramping cleared capacities, and compensation costs.
Step 7: At time t on Day D, the generation schedules are executed. The actual output of each unit, the actual ramping capacity provided by ramping service suppliers, the actual electricity consumption of Users, the actual output of renewable units, and the actual forecast errors are recorded.
Step 8: On Day D + 1 and thereafter, based on the actual execution results of Day D and the forecast error bound data declared by renewable stations, ramping costs are allocated to the corresponding market participants. The costs are aggregated and settled on a monthly basis.
4. Case Study
4.1. Simulation Parameter Settings
Based on the modified IEEE 39-bus system, the rationality and advantages of the proposed ramping ancillary service cost allocation mechanism are verified and analyzed. The market participants include 10 thermal power plants (TP), 6 wind farms (WP), 3 photovoltaic power stations (PV), and 9 Users. The operating parameters of the units are provided in Table A1 of Appendix A, and the output of all renewable energy stations is shown in Figure A1 of Appendix A. Thermal power units submit five-step block bids based on their marginal generation costs [24], with generation costs expressed in quadratic function form. The load demand curves of all power Users are shown in Figure A2 of Appendix A. In the Shandong ramping ancillary service market, the upper and lower bounds of load forecast and renewable energy forecast errors are determined based on the same month of the previous year and the load forecast and renewable forecast error datasets for the same time intervals within the 15 days prior to the operating day. A normal distribution is fitted to the error probability distribution, and the confidence level between 2.5% and 97.5% is adopted to determine the upper and lower bounds of load forecast and renewable energy forecast errors. This paper employs a joint clearing model to perform coordinated optimization of the real-time spot market and the ramping ancillary service market. The detailed model is presented in Equations (A1)–(A4) in Appendix A. The model is formulated as a mixed-integer linear programming (MILP) problem, which is solved using MATLAB 2021b with the Gurobi 12.0.2 solver. The simulation computations were carried out under the following hardware environment: a 12th Gen Intel(R) Core(TM) i5-12450H @ 2.00 GHz processor, 16 GB of RAM, and a 64-bit Windows 11 operating system. The solver parameters were set as follows: the MIP relative optimality gap was 0.01%, and the time limit was 3600 s. The clearing results for the real-time spot market and the ramping ancillary service market are shown in Figure A3 and Figure A4 of Appendix A, respectively.
The simulation example in this paper is designed based on the operational characteristics of a power system with a high proportion of renewable energy. On the selected typical day, the proportion of renewable energy generation in the total system output reaches 41.06%. The net load variation per 15 min interval ranges from −470.96 MW to 406.15 MW, while the sum of load forecast deviation and renewable energy forecast deviation ranges from −1766.67 MW to 1472.01 MW. Ramping requirements primarily originate from forecast deviations of load and renewable energy. The constructed upward and downward ramping requirement curves, along with a comparative chart of net load and total renewable output forecast curves, are shown in Figure 3.
Figure 3.
Comparative diagram of upward/downward ramp demand curves with net load and total renewable energy forecasted output curves.
The overall trend of the upward and downward ramping requirement curves is generally consistent. This is because ramping requirements mainly stem from load and renewable energy forecast deviations. When load and renewable energy forecast errors are high, the upward and downward ramping requirements exhibit high levels; correspondingly, when forecast errors are low, the ramping requirements show low levels. The curves in the figure display multiple rapid fluctuations and asymmetric patterns, which are precisely the combined result of the intermittent and volatile output of high-proportion renewable energy interacting with the uncertainty in load forecasting.
4.2. Analysis of Simulation Results
4.2.1. Cost Allocation Analysis of the Current Shandong Mechanism
To verify the deficiencies of the current Shandong ramping ancillary service market allocation mechanism, the allocated costs of each market participant are calculated according to the existing rules—namely, ramping compensation costs are allocated to generation-side units that do not provide ramping services in proportion to their daily grid-connected energy, while the load side does not participate. The resulting allocated costs are presented in Table 2. WP denotes wind farms, PV denotes photovoltaic power stations, and TP denotes thermal power plants.
Table 2.
Cost allocation among entities under the Shandong ramping auxiliary allocation method.
From the data in Table 2, the following quantitative conclusions can be drawn:
(1) Severe mismatch between responsibility and cost. The non-winning thermal units (TP6 and TP9) together bear $1.4753 million, while the photovoltaic stations (PV1–PV3), which are the main triggers of ramping demand, together bear only $0.4345 million—the former is 3.4 times the latter. This creates a reverse allocation of “low responsibility with high cost, high responsibility with low cost”, seriously violating the “who causes, who pays” fairness principle.
(2) Complete absence of load-side participation. Load-side Users actually contribute more than 30% of the ramping demand through net load variation and load forecast deviation, yet bear zero cost under the current mechanism. This causes the generation side to unreasonably bear additional costs that should have been paid by the load side (over $3 million under the proposed mechanism).
The above quantitative diagnosis reveals the core deficiencies of the current ramping ancillary service allocation mechanism from the perspectives of fairness and economic efficiency. When further examined from the dimensions of technical rationality, operational feasibility, and system security, the mechanism still exhibits significant shortcomings: (1) Technical perspective: The current allocation mechanism is completely disconnected from the physical causes of ramping demand (net load variation, load forecast deviation, and renewable energy forecast deviation), making it difficult to establish an effective technical incentive. Renewable energy stations lack the intrinsic motivation to improve power forecast accuracy, resulting in persistently high system ramping reserve requirements and hindering improvements in grid flexibility regulation efficiency. (2) Operational perspective: The existing allocation rule is simple in form but lacks responsibility traceability and cost transmission logic, resulting in weak interpretability. Market operators find it difficult to clearly explain the cost allocation basis to market participants, which may lead to market disputes and loss of trust, significantly increasing the difficulty of market regulation and operation. (3) Safety perspective: The unreasonable cost allocation mechanism forces flexible units with regulation capability to exit the market or adopt distorted bidding strategies, leading to insufficient system ramping reserve capacity. Under scenarios of severe net load fluctuations, the grid is prone to frequency violations and other issues, directly threatening the safe and stable operation of the power system.
4.2.2. Comparative Analysis of Ramping Ancillary Service Cost Allocation Methods
Considering that the cost allocation for renewable energy forecast deviation requires renewable power plants to report their forecast error bounds, the wind farms and photovoltaic power stations declare upper and lower bounds of ±5% and ±3% of their forecast power, respectively, based on their forecast errors. The coefficient β for the proportion of ramping costs allocated based on the declared forecast error interval in the total renewable forecast deviation ramping costs is set to 0.4, and the penalty coefficient γ for forecast errors exceeding the declared bounds is set to 2. A comparison of the allocated costs under different allocation methods is shown in Figure 4. Among these, Allocation Method 1 represents the current Shandong ramping ancillary service market allocation method based on the proportion of grid-connected energy, while Allocation Method 2 is the method proposed in this paper. To verify the fairness of the proposed method in this paper, two economic indicators—Gini coefficient [25] and Spearman’s rank correlation coefficient [26]—are introduced for quantitative analysis of different allocation methods. The specific calculation formulas are shown in Equations (14) and (15), and the allocation indicator results of different methods are presented in Table 3.
Figure 4.
Comparison of allocation costs under different allocation methods.
Table 3.
Comparison of indicators for different methods.
The Gini coefficient quantifies the fairness of ramp cost allocation by measuring the equilibrium of the allocated cost distribution, as shown in Equation (14). The value of G ranges from [0, 1], and a smaller G indicates a fairer allocation.
where n denotes the total number of market participants involved in the cost allocation; xi represents the allocated cost of participant i; is the average value of the allocated costs of all participants; and denotes the absolute difference between the allocated costs of any two participants.
Spearman’s rank correlation coefficient ρ quantifies the fairness of ramp cost allocation by measuring the consistency between the allocated costs and the responsibility ranking, as shown in Equation (15). The closer the indicator is to 1, the more the cost allocation aligns with the principle of “who causes, who bears”.
where di is the difference between the responsibility rank and the cost rank of the i-th participant.
The analysis leads to the following conclusions:
As shown in Table 3, the Gini coefficient of Allocation Method 1 (the current Shandong mechanism) is 0.6254, which indicates a highly unbalanced level, while that of Allocation Method 2 (the proposed two-layer allocation mechanism) is 0.4045, which lies in a relatively balanced range. Compared with Method 1, the Gini coefficient of Method 2 is reduced by approximately 35.3%, demonstrating that the proposed mechanism has a significant advantage in the fairness of cost allocation. The allocation results shown in Figure 4 further explain this difference. Under Method 1, ramping costs are allocated among units that do not provide ramping services in proportion to their daily grid-connected energy, and the load side does not participate. Although Thermal Power Plant 6 and Thermal Power Plant 9 do not trigger ramping requirements and fail to secure bids in the ramping market due to their high opportunity costs, they still bear high allocated costs in proportion to their grid-connected energy. In contrast, the three photovoltaic power stations, as the triggers of ramping requirements, bear much lower costs because of their low grid-connected energy, with the costs borne by PV stations accounting for only 29.46% of those borne by thermal power plants. This phenomenon of “small responsibility bearing large cost, large responsibility bearing small cost” directly leads to a high Gini coefficient and seriously violates the “who causes, who pays” market principle. Under Method 2, thermal power plants, as providers of ramping ancillary services, do not bear ramping costs; the costs are allocated to renewable energy power stations and the load side based on the sources of ramping requirements (net load variation, load forecast deviation, and renewable energy forecast deviation). This adjustment makes the allocation results more balanced and significantly reduces the Gini coefficient.
Meanwhile, the Spearman correlation coefficient of Method 1 is −0.5820, indicating a moderately negative correlation, while that of Method 2 is 1, indicating a perfect positive correlation. The negative correlation of Method 1 further confirms the above analysis: under the current Shandong mechanism, the allocated costs are inversely related to the actual ramping responsibilities of market participants—the more a participant triggers ramping requirements (such as renewable energy stations and highly volatile loads), the less cost it bears, whereas thermal power plants with little or no responsibility bear a larger share of the costs. The Spearman correlation coefficient of Method 2 being 1 indicates that under the proposed mechanism, the ranking of ramping responsibilities of market participants is perfectly consistent with the ranking of allocated costs, achieving an exact match between responsibility and cost. This result fully verifies the effectiveness and accuracy of the proposed mechanism in responsibility traceability.
Under Allocation Method 2, the average ramping cost allocated to renewable energy units decreases by 26.51%. On the one hand, this result directly alleviates the unreasonable burden on renewable energy power stations. On the other hand, and more importantly, the proposed mechanism establishes a positive “behavior–responsibility–cost” incentive chain through its differentiated error allocation method (based on declared error intervals versus actual errors). Specifically, renewable energy enterprises can actively reduce their allocated costs through two pathways: (1) improving power forecast accuracy—by adopting better forecasting models and higher-resolution meteorological data to reduce forecast errors, thereby directly obtaining cost reductions; and (2) power-sharing cooperation with flexible resources—by coordinating with energy storage, thermal units, or neighboring renewable stations to smooth output fluctuations, thereby reducing the demand for system ramping services and indirectly lowering allocated costs. In contrast, the current Shandong mechanism is linked only to energy output, providing no means for enterprises to improve their allocation outcomes through their own actions, regardless of forecast accuracy or output volatility, and thus lacks any incentive for improvement. Therefore, Allocation Method 2 not only makes ramping cost allocation clearer and fairer, but more importantly, offers renewable enterprises a feasible pathway to “reduce costs through their own efforts.” This effectively incentivizes enterprises to proactively enhance output controllability, promotes coordination between renewable generation and the power system, and supports the low-carbon transition.
4.2.3. Analysis of the Proposed Method
To analyze the fairness and traceability of the ramping ancillary service cost allocation method proposed in this paper, Table 4 and Table 5 present the specific sources of ramping cost allocations for Users and renewable energy power stations under Allocation Method 2, respectively. Taking User 2 and User 9 as representative examples, a comparative graph of their load demand curves is plotted, as shown in Figure 5. Similarly, taking Wind Farm 5 and Wind Farm 6 as representative examples, their output curves and declared power intervals are shown in Figure 6. To clearly illustrate the implementation of the proposed two-layer ramping cost allocation mechanism, Appendix B provides a step-by-step calculation from raw data to final allocated costs for a typical time interval (00:45–01:00 of the operating day), followed by analysis and discussion.
Table 4.
Sources of ramping allocation costs for power Users.
Table 5.
Sources of ramping allocation costs for new energy power stations.
Figure 5.
Load demand curves of typical power Users.
Figure 6.
Power output curves and declared power intervals of typical wind power plants.
Based on Table 4 and Table 5, it can be observed that the ramping ancillary service cost allocation method proposed in this paper enables traceability of the cost allocation mechanism for both Users and renewable energy power stations. From the perspective of allocation results, the proportion of ramping costs caused by net load variation borne by renewable energy stations is lower than that borne by the load side. This is mainly because the magnitude of renewable energy output fluctuations is significantly smaller than that of load-side fluctuations. For Users, ramping cost allocations primarily originate from ramping requirements triggered by load uncertainty. As illustrated in Figure 5, although the total electricity consumption of User 2 and User 9 is similar, the load demand curve of User 9 exhibits greater volatility (with a standard deviation 49.34% higher than that of User 2), leading to significantly increased upward and downward ramping requirements. Consequently, the net load ramping cost allocation for User 9 is $13,600 higher than that for User 2. This difference fully reflects the fairness principle of “User pays.”
Similar to the load side, ramping cost allocations for renewable energy power stations mainly arise from ramping requirements triggered by renewable energy output uncertainty. Notably, the ramping costs incurred by the photovoltaic power station due to downward net load variation are zero. This is because its output characteristics are highly aligned with the load trend: when the system experiences downward ramping requirements, the PV station’s output simultaneously decreases. This characteristic means it does not create additional regulation requirements in scenarios where downward ramping is triggered by net load variation. Furthermore, as illustrated in Figure 6, the forecast output of Wind Farm 6 exhibits greater volatility compared to Wind Farm 5, resulting in an increase of $37,900 in its ramping costs attributable to net load variation. Additionally, due to the high probability that the actual output errors of Wind Farm 6 exceed its declared power interval, it further bears ramping costs arising from errors exceeding the declared range, amounting to $115,900 more than those of Wind Farm 5. These results validate that the allocation mechanism proposed in this paper effectively identifies the distinct fluctuation characteristics of different renewable energy stations and, through economic signals, incentivizes them to improve output forecast accuracy and exercise prudence in declaring power output intervals. The analysis demonstrates that the ramping ancillary service cost allocation method proposed in this paper can scientifically quantify the responsibility coefficients of market participants for system ramping requirements, thereby achieving fairness in cost allocation and accuracy in responsibility traceability.
4.2.4. Sensitivity Analysis on Declared Error Intervals of Renewable Units
To further investigate the influence mechanism of the declared forecast error bounds of renewable power plants on their ramping ancillary service cost allocation, this study selects Wind Farm 5 and Photovoltaic Power Station 3 as research subjects. Comparative analyses are conducted by setting declared forecast error bounds ranging from ±5.5% to ±9.5% for the wind farm and from ±3% to ±7% for the photovoltaic station, respectively. The actual forecast errors of Wind Farm 5 and Photovoltaic Power Station 3 fluctuate within the ranges of ±7.5% and ±5% of their forecast power, respectively. The specific ramping cost allocation results under different declared forecast error bounds are shown in Figure 7.
Figure 7.
Comparison of ramping allocation cost impacts under different declared error limits for new energy power stations. (a) Ramping cost allocation for Wind Farm 5 under different declared forecast error bounds; (b) ramping cost allocation for Photovoltaic Power Station 3 under different declared forecast error bounds.
As shown in Figure 7, the declared ramping costs of Wind Farm 5 and Photovoltaic Power Station 3 exhibit a significant positive correlation with their declared forecast error bounds. As the declared forecast error interval expands, the ramping costs allocated for the declared error interval for both stations show a monotonically increasing trend. Conversely, the ramping costs arising from actual forecast errors demonstrate a decreasing characteristic as the declared forecast error bounds increase. This phenomenon occurs because a wider declared error range can cover a larger proportion of the actual error fluctuations. Once the declared forecast error bounds fully cover the range of actual error fluctuations (±7.5% for wind power, ±5% for photovoltaic power), further increasing the declared bounds no longer affects the ramping costs arising from actual errors. It is worth noting that, since the actual errors of Photovoltaic Power Station 3 are mainly concentrated in the ±4% to ±4.5% range, Figure 7b shows a significant decrease in the ramping costs arising from actual errors when the declared forecast error bounds are adjusted from ±4% to ±4.5%. This results in the total ramping cost allocation for this station being minimized when the declared forecast error bounds are ±4.5%. In contrast, the error distribution of Wind Farm 5 is relatively uniform, and its ramping costs arising from actual errors exhibit a linearly decreasing trend as the declared forecast error bounds increase. The total ramping cost allocation for this wind farm is minimized when the declared forecast error bounds are ±7.5%.
In summary, the optimal declaration strategy for renewable power plants should ensure that their declared forecast error bounds fully cover the range of actual error fluctuations, thereby minimizing the total ramping cost allocation. This indicates that the differentiated allocation mechanism based on the declared forecast error interval and actual error, as designed in this paper, effectively prevents renewable power plants from evading economic responsibility by underestimating their declared forecast error intervals, ensuring the fairness and rationality of cost allocation. Through economic means, this mechanism channels the risks to the power system arising from renewable energy uncertainty to the renewable side. It not only incentivizes renewable power plants to proactively improve their power forecast accuracy but also promotes their engagement in power mutual support cooperation with flexible resources, thereby systematically reducing the uncertainty of renewable energy output. This provides an effective market-based solution for the optimal allocation of ramping resources in the power system.
4.2.5. Sensitivity Analysis Under Extreme Scenarios
To comprehensively validate the robustness of the proposed mechanism under extreme operating conditions, two typical extreme scenarios are designed for sensitivity analysis:
Scenario 1: Significant increase in renewable penetration: The renewable energy output in the system is increased to 1.8 times that of the typical day, raising the proportion of renewable energy generation from 41.06% to over 65%. This scenario simulates the extreme case of a future power system with very high renewable penetration and tests the adaptability of the mechanism under such conditions.
Scenario 2: Extremely large renewable forecast errors: WP5 and PV3 are selected as typical cases. Their actual forecast errors are set to five times the mean error of the typical day, and their declared forecast error intervals are set to only 20% of their actual errors, while other renewable stations remain unchanged. This simulates the combination of extreme uncertainty and strategic under-reporting.
Table 6 and Table 7 present the detailed ramping cost allocation for Users and renewable stations under Scenario 1 using Allocation Method 2. Since Scenario 2 does not affect User-side cost allocation, the analysis focuses on the cost allocation for renewable stations under Scenario 2, with Table 8 presenting the specific sources of ramping cost allocation for renewable stations under Allocation Method 2 in Scenario 2.
Table 6.
Sources of ramping allocation costs for power Users in Scenario 1.
Table 7.
Sources of ramping allocation costs for new energy power stations in Scenario 1.
Table 8.
Sources of ramping allocation costs for new energy power stations in Scenario 2.
When renewable penetration is significantly increased in Scenario 1, compared with the baseline scenario in Section 4.2.2, the total User-side cost decreases slightly from 3,184,900 $ to 3,176,000 $, a reduction of approximately 0.28%. Among these, the upward net load allocation cost decreases from 128,700 $ to 123,400 $, and the downward net load allocation cost decreases from 161,200 $ to 153,900 $. The main reason for this change is that the substantial increase in renewable output (by a factor of 1.8) alters the shape of the system net load curve. As renewable output increases, the system’s reliance on traditional thermal power decreases during certain periods, and the absolute value of net load variation diminishes, leading to a corresponding reduction in the costs borne by the User side due to net load variation. On the other hand, load forecast deviation costs remain unchanged because this part of the cost is only related to load-side uncertainty and is not affected by changes in renewable output.
The total renewable-side cost increases from 5,328,900 $ to 8,241,200 $, an increase of 54.7%, which is lower than the output increase, indicating that the responsibility coefficient does not increase linearly with generation. The upward net load allocation cost increases from 49,700 $ to 61,300 $ (+23.3%), and the downward net load allocation cost increases from 83,500 $ to 103,900 $ (+24.4%). These relatively small increases reflect that the net load variation does not scale proportionally with renewable output. Meanwhile, the declared error interval cost increases from 2,078,600 $ to 3,220,900 $, and the actual error cost increases from 3,117,100 $ to 4,855,100 $ (+55.8%). The increases in both are broadly consistent with the total cost increase, indicating that forecast deviation is the main driver of the increase in ramping costs after the increase in renewable penetration. This is because the integration of a high proportion of renewable energy exacerbates the uncertainty in output forecasting, thereby expanding the responsibility for forecast deviations.
In Scenario 2, WP5 and PV3 reduce their declared forecast error intervals to 20% of their actual errors (i.e., significant under-reporting), causing their declared costs to drop from the baseline values of 305,200 $ and 44,600 $ to 91,600 $ and 8900 $, respectively—reductions of 70.0% and 80.0%. The cost shares of other stations increase accordingly, with their declared costs rising, resulting in a transfer of costs from under-reporters to honest declarers. The change in actual error costs reflects the effect of the penalty mechanism. The actual forecast errors of WP5 and PV3 are magnified by a factor of five and exceed their declared intervals, causing their actual error costs to surge from the baseline values of 519,700 $ and 111,900 $ to 1,559,100 $ and 447,600 $, respectively. At the same time, the cost shares of other stations decrease, with their actual error costs dropping proportionally by approximately 55.3%. This reallocation benefits honest declarers, who bear lower actual error costs. Combining both declared and actual error parts, the total cost of WP5 increases by 98.15%, and that of PV3 increases by 190.84%; the total costs of other stations decrease by 24% to 31%, validating the effectiveness of the mechanism in punishing under-reporting and its incentive compatibility.
In summary, under both extreme high-penetration and extreme forecast deviation scenarios, the proposed mechanism can accurately trace ramping responsibilities, achieve fair allocation, and generate effective economic incentive signals. It exhibits good robustness and scalability, providing a feasible solution for cost allocation in the ramping ancillary service market of power systems with a high proportion of renewable energy.
4.3. Discussion
4.3.1. Potential Impact of the Proposed Mechanism on the Bidding Behavior of Market Participants
The proposed two-layer ramping cost allocation mechanism establishes a “behavior–responsibility–cost” linkage, which positively incentivizes the bidding behavior of various market participants.
(1) Impact on the bidding behavior of renewable energy stations: The proposed mechanism requires renewable stations to declare their forecast error intervals and imposes penalties for actual errors exceeding the declared intervals. This incentivizes renewable stations to declare forecast error intervals more prudently, avoiding deliberate under-reporting for short-term declared cost reductions. At the same time, stations are motivated to proactively improve forecast accuracy by adopting advanced weather forecasting models, high-resolution data, or deploying energy storage facilities, thereby reducing actual errors and lowering actual error costs. In the long run, improved forecast accuracy enables renewable stations to provide more reliable output profiles, making their bids more competitive and stable.
(2) Impact on the bidding behavior of load-side Users: The proposed mechanism allocates ramping costs caused by load forecast deviations to the load side in proportion to electricity consumption, making Users bear costs commensurate with their load volatility. This incentivizes large Users to optimize their electricity consumption behavior, such as participating in demand response, avoiding high-volatility periods, and smoothing load curves, thereby reducing their allocated costs from net load variation and load forecast deviation. In a future mature market where load-side Users are allowed to submit quantity and price bids, Users will tend to declare their load forecast deviations truthfully to avoid unreasonable costs from inaccurate forecasts, which helps dispatch centers obtain more accurate load forecast information.
(3) Impact on the bidding behavior of thermal power units: Under the current Shandong mechanism, flexible units that fail to secure bids still bear ramping costs, which may lead them to adopt distorted bidding strategies (e.g., raising bid prices) in the energy market to avoid allocation. The proposed mechanism exempts thermal power units, as ramping service providers, from unreasonable cost allocation, allowing them to bid based on their true marginal costs and avoiding market distortions.
4.3.2. Transferability of the Proposed Mechanism to Different Regulatory Frameworks and Market Designs
Although the proposed two-layer ramping cost allocation mechanism is developed based on the Shandong ramping ancillary service market, its core design principles—physical-cause-based system attribution and responsibility-coefficient-based responsibility tracing—are highly generalizable and transferable. The transferability is discussed below for different market types.
(1) Transferability to regions with similar market structures (spot market + ramping products): Mature flexible ramping product markets have already been established in CAISO and MISO in the United States. These markets face similar fairness issues in ramping cost allocation under high renewable penetration. The core framework of the proposed mechanism (first layer: establishing cost pools for net load variation, load forecast deviation, and renewable forecast deviation; second layer: tracing costs to the load side and the renewable side) can be directly transplanted to these markets, requiring only parameter adjustments according to local market rules (e.g., confidence levels for forecast deviations, penalty coefficients, etc.).
(2) Transferability to regions that have not yet established ramping products but face similar challenges: For emerging electricity markets that have not yet established independent ramping products (e.g., other Chinese provinces or developing countries), the proposed mechanism can serve as a reference template for ramping ancillary service market design. These markets typically already have a basic spot market framework and renewable energy forecasting systems. The additional data required (e.g., renewable forecast error intervals) can be obtained by modifying existing declaration systems with low implementation cost. The differentiated error allocation method in the mechanism can operate independently of specific market rules, showing strong adaptability.
(3) Adaptability to different regulatory frameworks and cost allocation principles: The proposed mechanism follows the universal “who causes, who pays” fairness principle, which applies to most electricity market regulatory frameworks. Different markets may have different preferences regarding allocation granularity and responsibility boundaries, but the two-layer structure allows flexible adjustments. For example, if a market wishes load forecast deviations to be borne entirely by Users, the second-layer proportional allocation according to electricity consumption can be directly applied. If a market wishes renewables to bear all forecast deviation responsibility, the allocation ratios in the first layer can be adjusted. Therefore, the mechanism exhibits good modular tunability.
In summary, while keeping the core logic unchanged, the proposed mechanism can adapt to different regulatory frameworks and market design characteristics through parameter adjustments and local rule modifications, demonstrating good transferability. This paper currently focuses on centralized renewable energy stations and traditional power Users, and does not yet address prosumers. For prosumers equipped with distributed PV, energy storage, and electric vehicles, their net load curve exhibits bidirectional fluctuation characteristics, making them both beneficiaries of ramping services and potential triggers of ramping requirements. The proposed two-layer allocation framework can be extended through the net load method: the prosumer’s real-time net load (electricity consumption minus distributed generation) is taken as its equivalent load, and its ramping responsibility is determined by the variation and forecast deviation of the net load, thereby being incorporated into the first-layer system attribution and second-layer responsibility tracing. This extension is an important part of our subsequent research.
5. Conclusions
Based on the current pilot operational mechanism of the Shandong ramping ancillary service market in China, this paper proposes a cost allocation mechanism based on the deterministic and uncertain ramping responsibility coefficients of market participants. This mechanism aims to address the deficiencies in the Shandong ramping ancillary service market and provides theoretical support and methodological reference for establishing a market-oriented fair cost allocation mechanism. The effectiveness of the proposed method is validated through case studies, and the research results indicate that:
(1) Compared to directly allocating ramping costs to the generation side in proportion to grid-connected energy quantities, under the proposed ramping cost allocation mechanism, the costs allocated to renewable units decrease by an average of 26.51%. This is more conducive to the development of renewable energy under the dual carbon goals. Furthermore, thermal power plants that do not provide ramping services are exempt from bearing ramping costs, resulting in a clearer and more reasonable cost allocation.
(2) The proposed bilevel ramping ancillary service cost allocation model effectively quantifies the responsibility coefficients of market participants for ramping requirements, achieving a fair and traceable allocation of ramping ancillary service costs.
(3) The optimal declaration strategy for renewable power plants should ensure that their declared forecast error bounds fully cover the range of actual error fluctuations. This indicates that the proposed mechanism effectively prevents renewable plants from evading economic responsibility by underestimating their declared forecast error intervals, effectively incentivizing them to proactively improve power forecast accuracy and mitigate forecast errors.
The proposed method is designed in the context of China’s electricity market gradually moving toward a mature stage (expected during the 15th Five-Year Plan period, 2026–2030, characterized by fully continuous spot market operation, full participation of the load side and renewable energy in the market with corresponding responsibilities), and fully considers the evolutionary direction of market rules from generation-side-only allocation to source-load joint allocation, and from a cost-based compensation mechanism to a responsibility-based fair allocation mechanism. The case study has thoroughly validated the effectiveness and robustness of the proposed mechanism through comparative validation, sensitivity analyses under extreme scenarios, and incentive compatibility analysis. In subsequent research, based on the calculation results of this paper under scenarios such as different renewable penetration levels and extreme forecast errors, as well as quantitative conclusions including the Gini coefficient and Spearman correlation coefficient, we will focus on exploring the scenario-based application and gradual implementation pathway of the proposed method:
- (1)
- Short-term research directions (1–2 years): For the transition period of China’s electricity market, simplify the two-layer allocation model by consolidating certain allocation items and setting thresholds for ramping requirements, thereby reducing engineering computational complexity while maintaining fairness; further optimize key parameters such as the penalty coefficient for renewable forecast errors and the weight of declared error intervals based on measured data, to improve the model’s adaptability in actual power grids; conduct validation using measured data from provincial grids (e.g., Shandong), align the proposed mechanism with current ramping market rules, and form a pilot transitional scheme.
- (2)
- Long-term research directions (3–5 years): Extend the mechanism to scenarios with different renewable penetration levels (30%, 50%, 65% and above), further verifying its fairness scalability under high penetration; study the ramping responsibility quantification method for prosumers, incorporating distributed PV, energy storage, and electric vehicles into the responsibility tracing framework using the net load method; promote the improvement of market rules to gradually transition load-side load forecast deviation allocation from “system-wide uniform proportion” to “individual declaration deviation”, and design a corresponding credit evaluation and assessment system.
Author Contributions
Conceptualization, Y.Z. and X.L.; methodology, Y.Z. and X.L.; software, Y.Z.; validation, Y.Z.; formal analysis, Y.Z.; investigation, X.L.; resources, Y.Z.; data curation, Y.Z.; writing—original draft preparation, Y.Z.; writing—review and editing, Y.Z. and X.L.; visualization, Y.Z.; supervision, X.L.; project administration, X.L.; funding acquisition, X.L. All authors have read and agreed to the published version of the manuscript.
Funding
This research received no external funding.
Data Availability Statement
The original contributions presented in this study are included in the article. Further inquiries can be directed to the corresponding author.
Conflicts of Interest
The authors declare no conflicts of interest.
Appendix A
In the real-time market, based on the latest system operating status and ultra-short-term load forecast information, the dispatch center conducts a joint clearing of the real-time spot and ramping ancillary service markets at time t—15 min. It adopts real-time market Security Constrained Economic Dispatch (SCED) to perform rolling optimization for unit output in the next two hours. The clearing yields the actual generation schedule to be executed by each unit during time interval t, node prices, cleared ramping ancillary service capacity, and upward/downward ramping service prices. Among these, ramping ancillary service suppliers only provide ramping rates without submitting price bids. The upward/downward ramping service prices are the shadow prices corresponding to the power balance constraint equations related to upward/downward ramping requirements in the optimization model, essentially representing the opportunity cost incurred by units for providing ramping services. To achieve the accommodation of a high proportion of wind and solar renewable energy, the clearing is performed with the optimization objective of minimizing the sum of electricity consumption costs, ramping ancillary service costs, and penalty costs for wind and solar curtailment:
where Nf is the total number of generators participating in the real-time market; and are the bid price and cleared energy quantity of generator f during time interval t, respectively; is the unit penalty cost coefficient for wind and solar curtailment; is the curtailment energy of renewable unit r during time interval t; and Nnew is the total number of renewable units participating in the real-time market.
- (1)
- Supply–demand balance constraint:
- (2)
- Ramping supply–demand balance constraint:
- (3)
- Cleared quantity constraint for generators:
The cleared energy quantity of a unit during time interval t, as well as its cleared upward and downward ramping ancillary service capacity, must be less than its declared quantity. In addition, the sum of a unit’s output during time interval t and its upward ramping capacity should be less than the unit’s upper output limit during time interval t + 1. Similarly, the difference between a unit’s output during time interval t and its downward ramping capacity should be greater than the unit’s lower output limit during time interval t + 1.
where is the declared energy quantity of unit f during time interval t; and are the declared upward and downward ramping capacity of ramping ancillary service supplier i during time interval t, respectively; and and are the upper and lower output limits of supplier i during time interval t + 1, respectively.
Figure A1.
Output of renewable energy units.
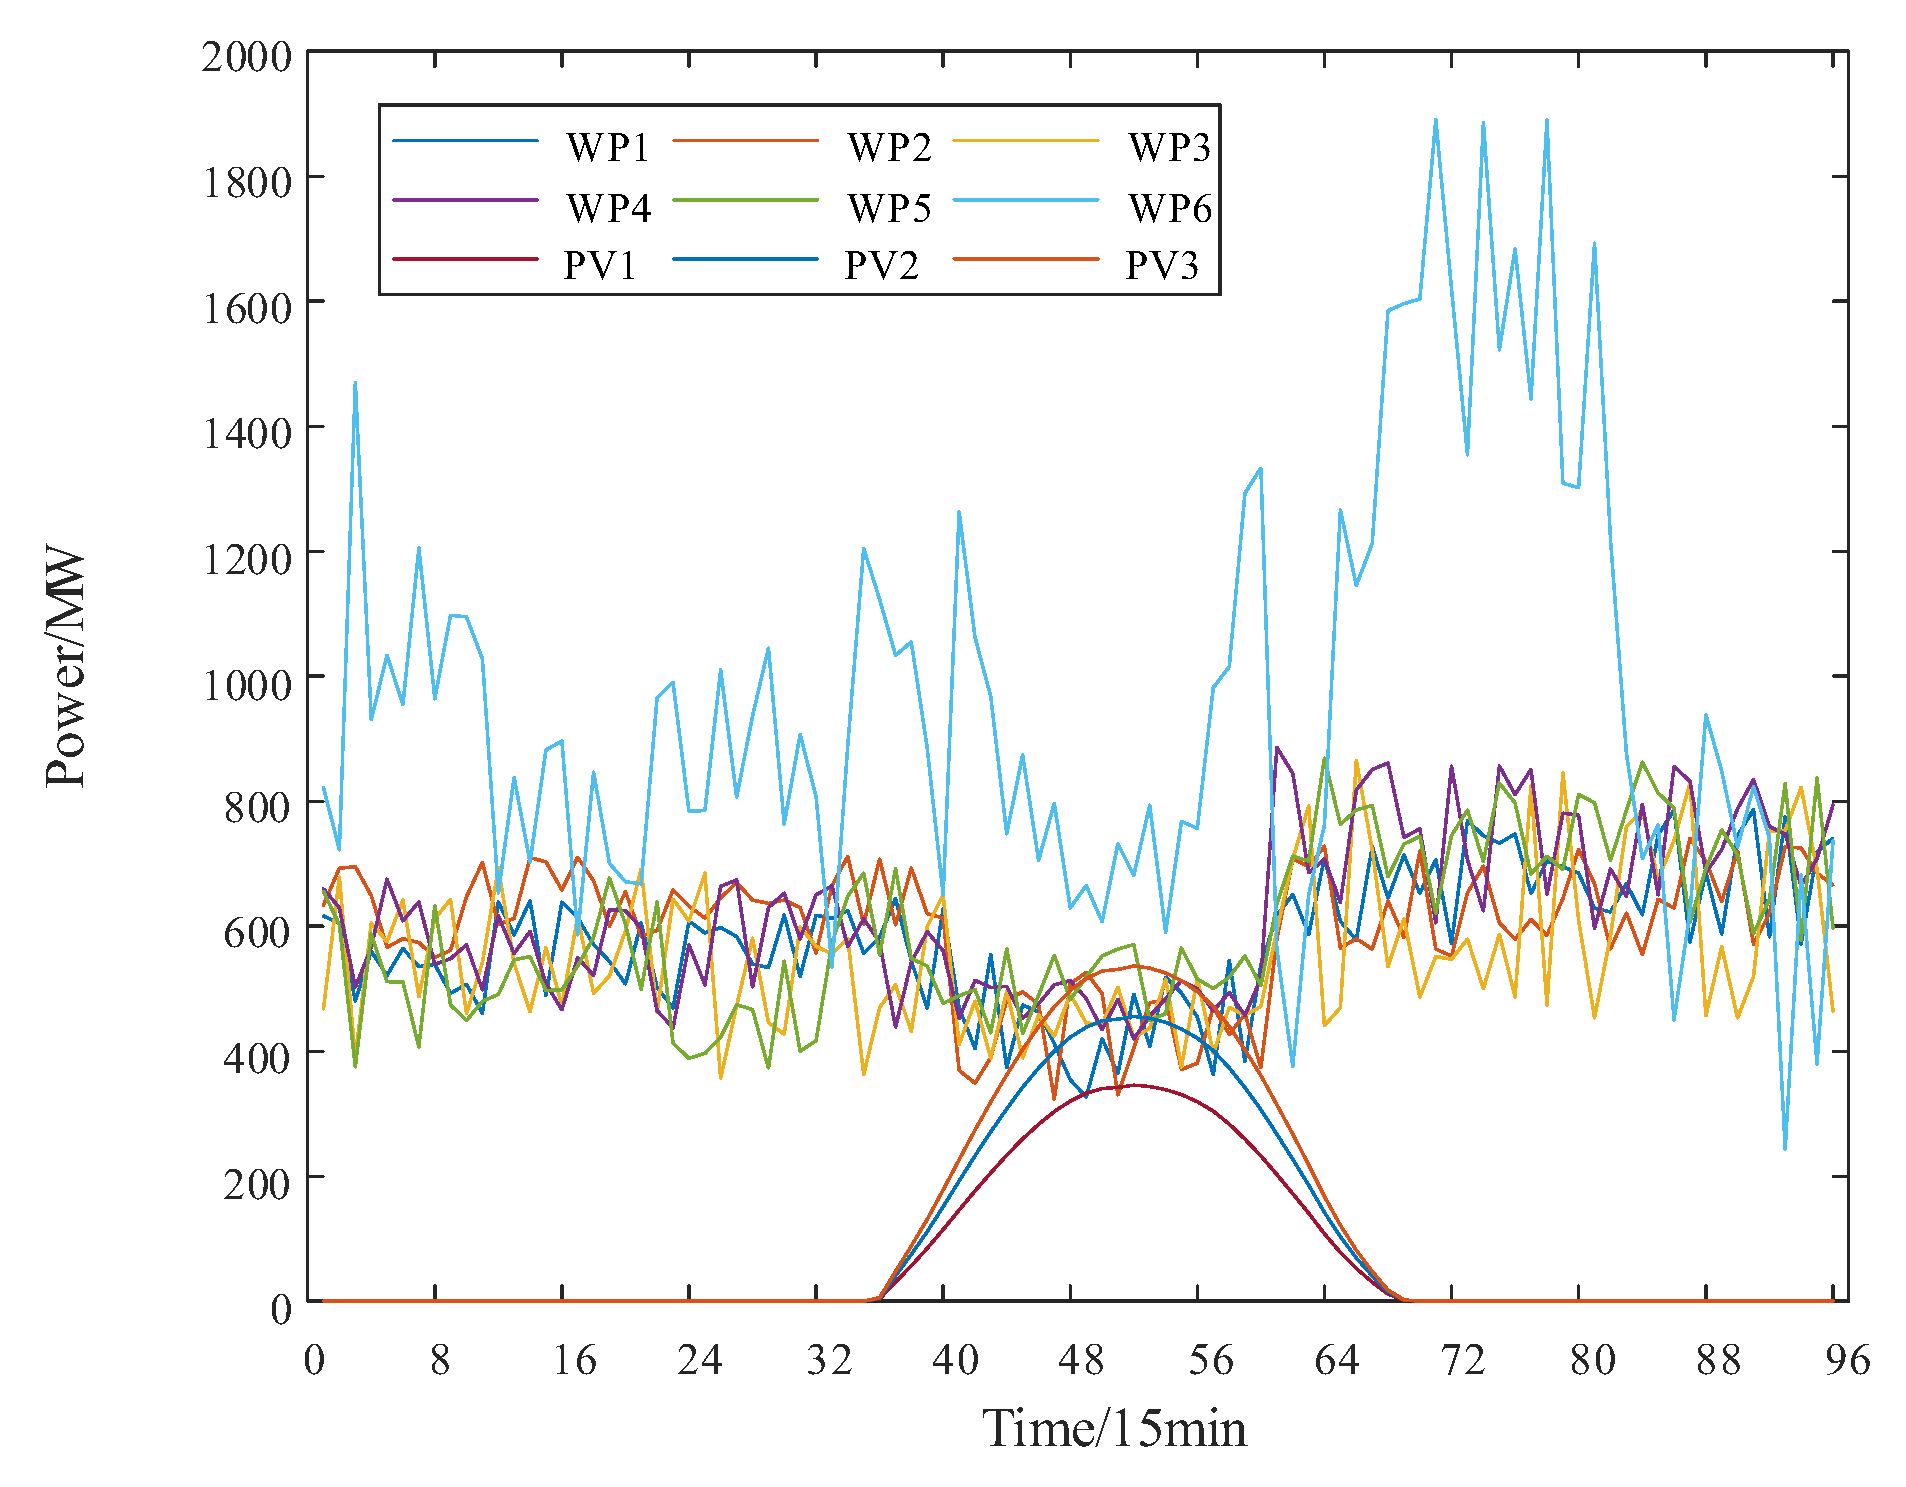
Figure A2.
Power load demand curves for all power Users.
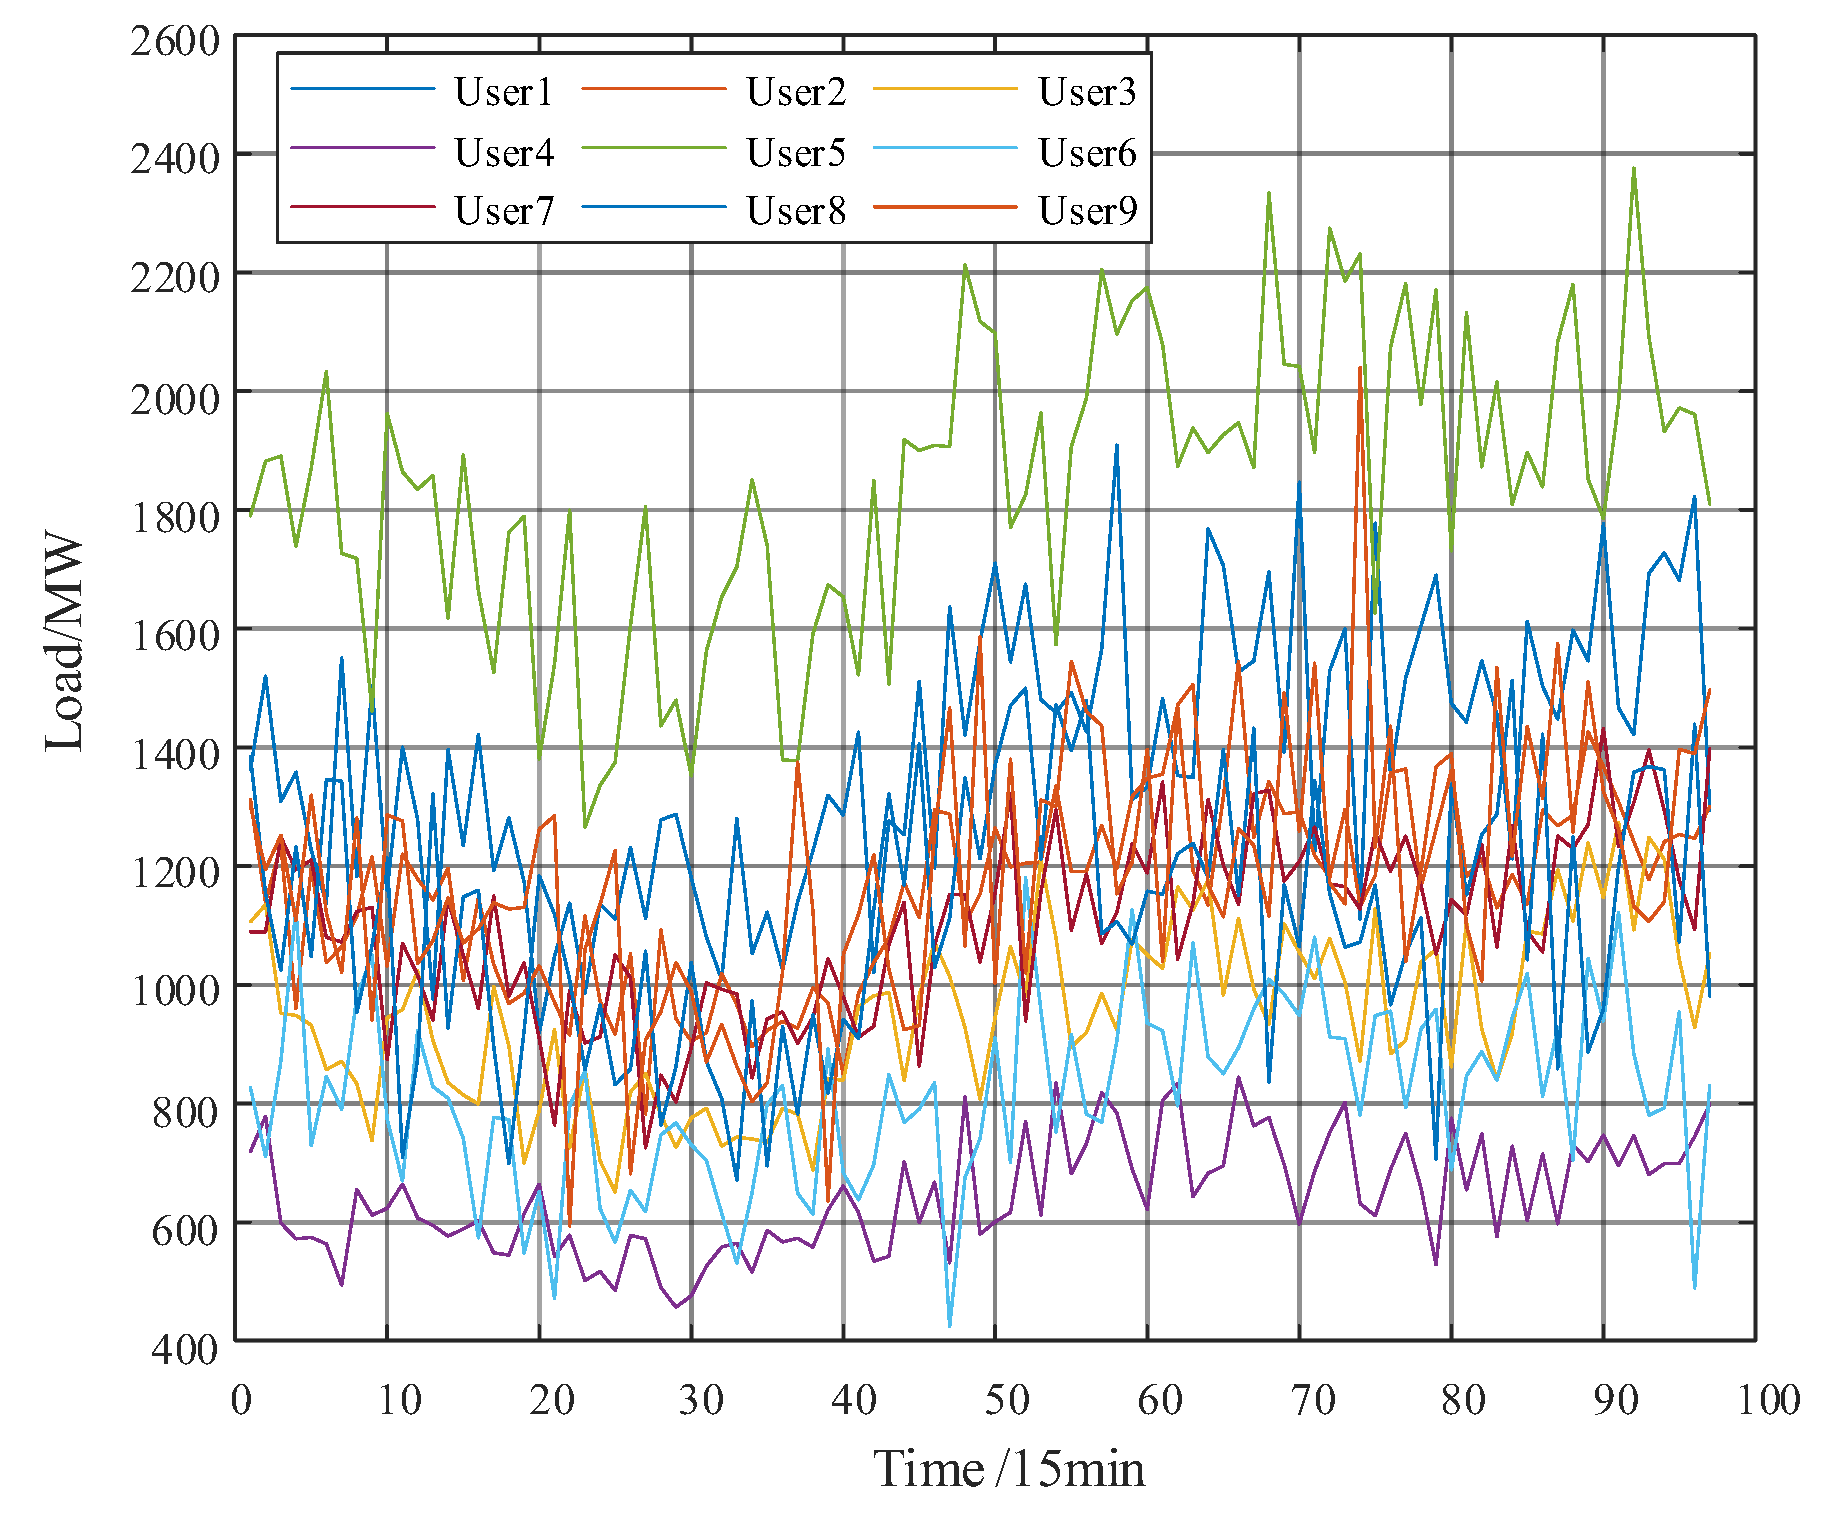
Table A1.
Operation parameters of units.
Figure A3.
Real-time spot market clearing results.
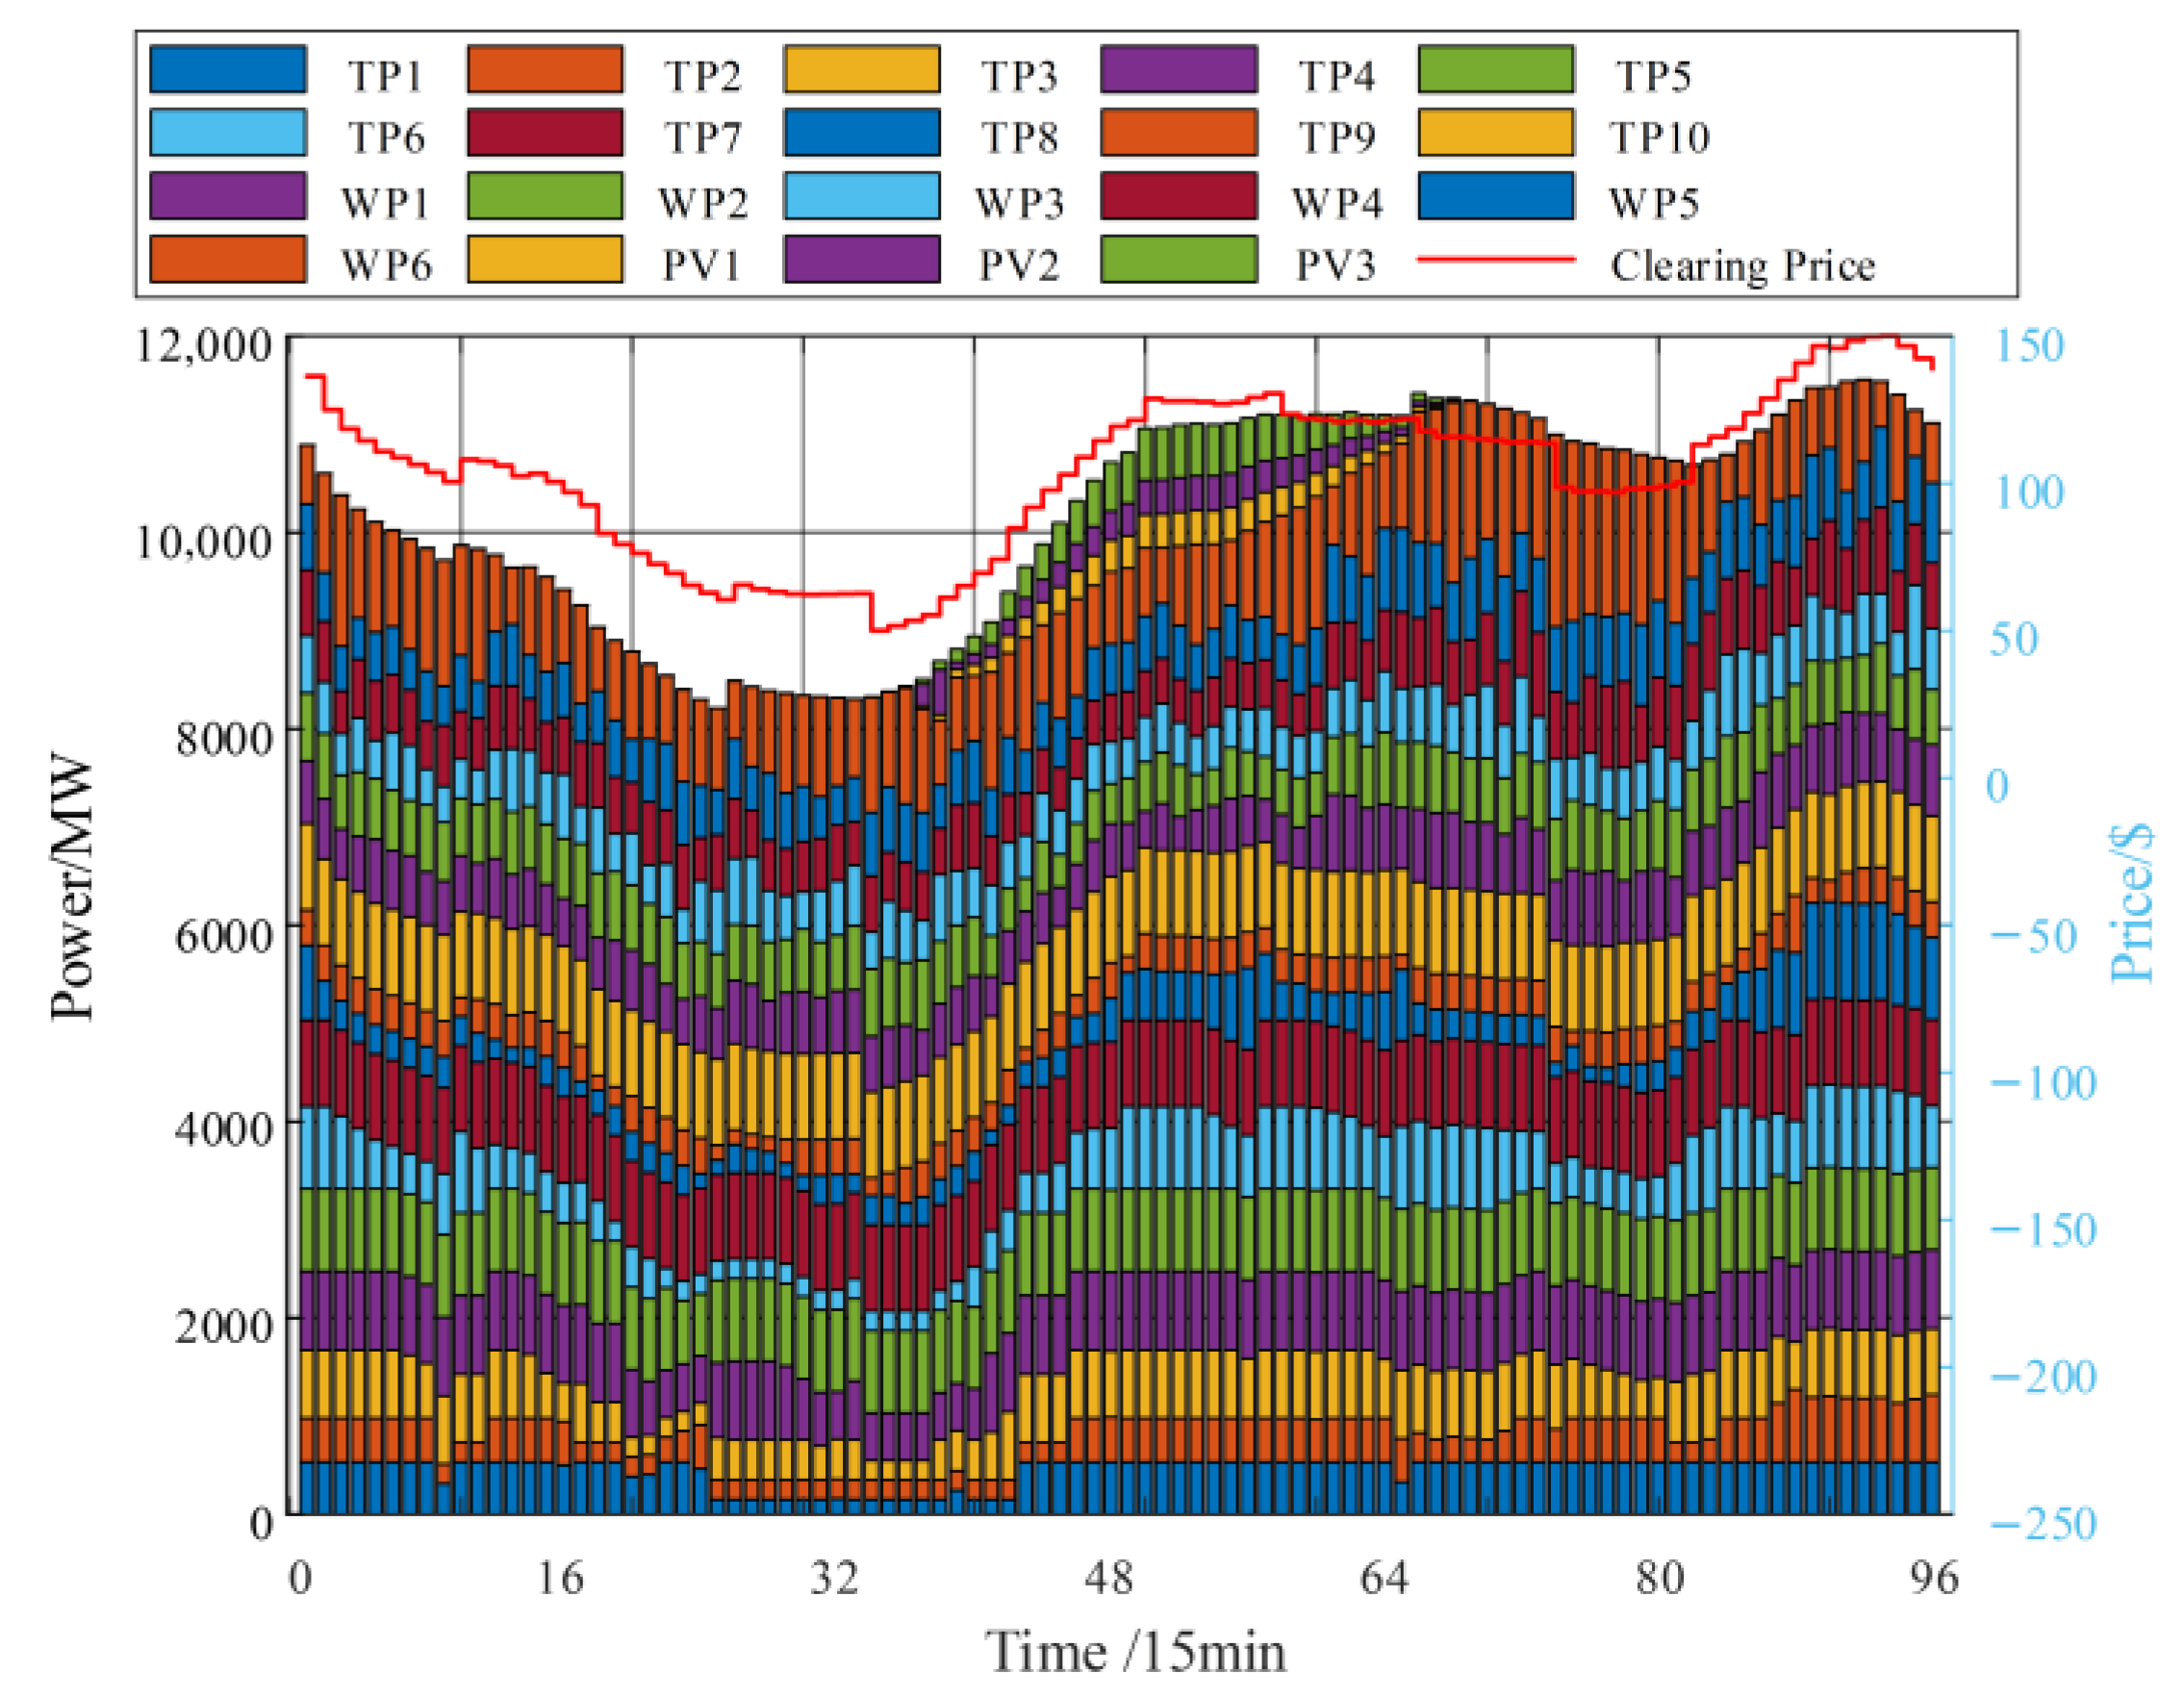
Table A2.
List of abbreviations.
Figure A4.
Ramping ancillary service market-clearing results. (a) Upward ramping clearing results; (b) downward ramping clearing results.
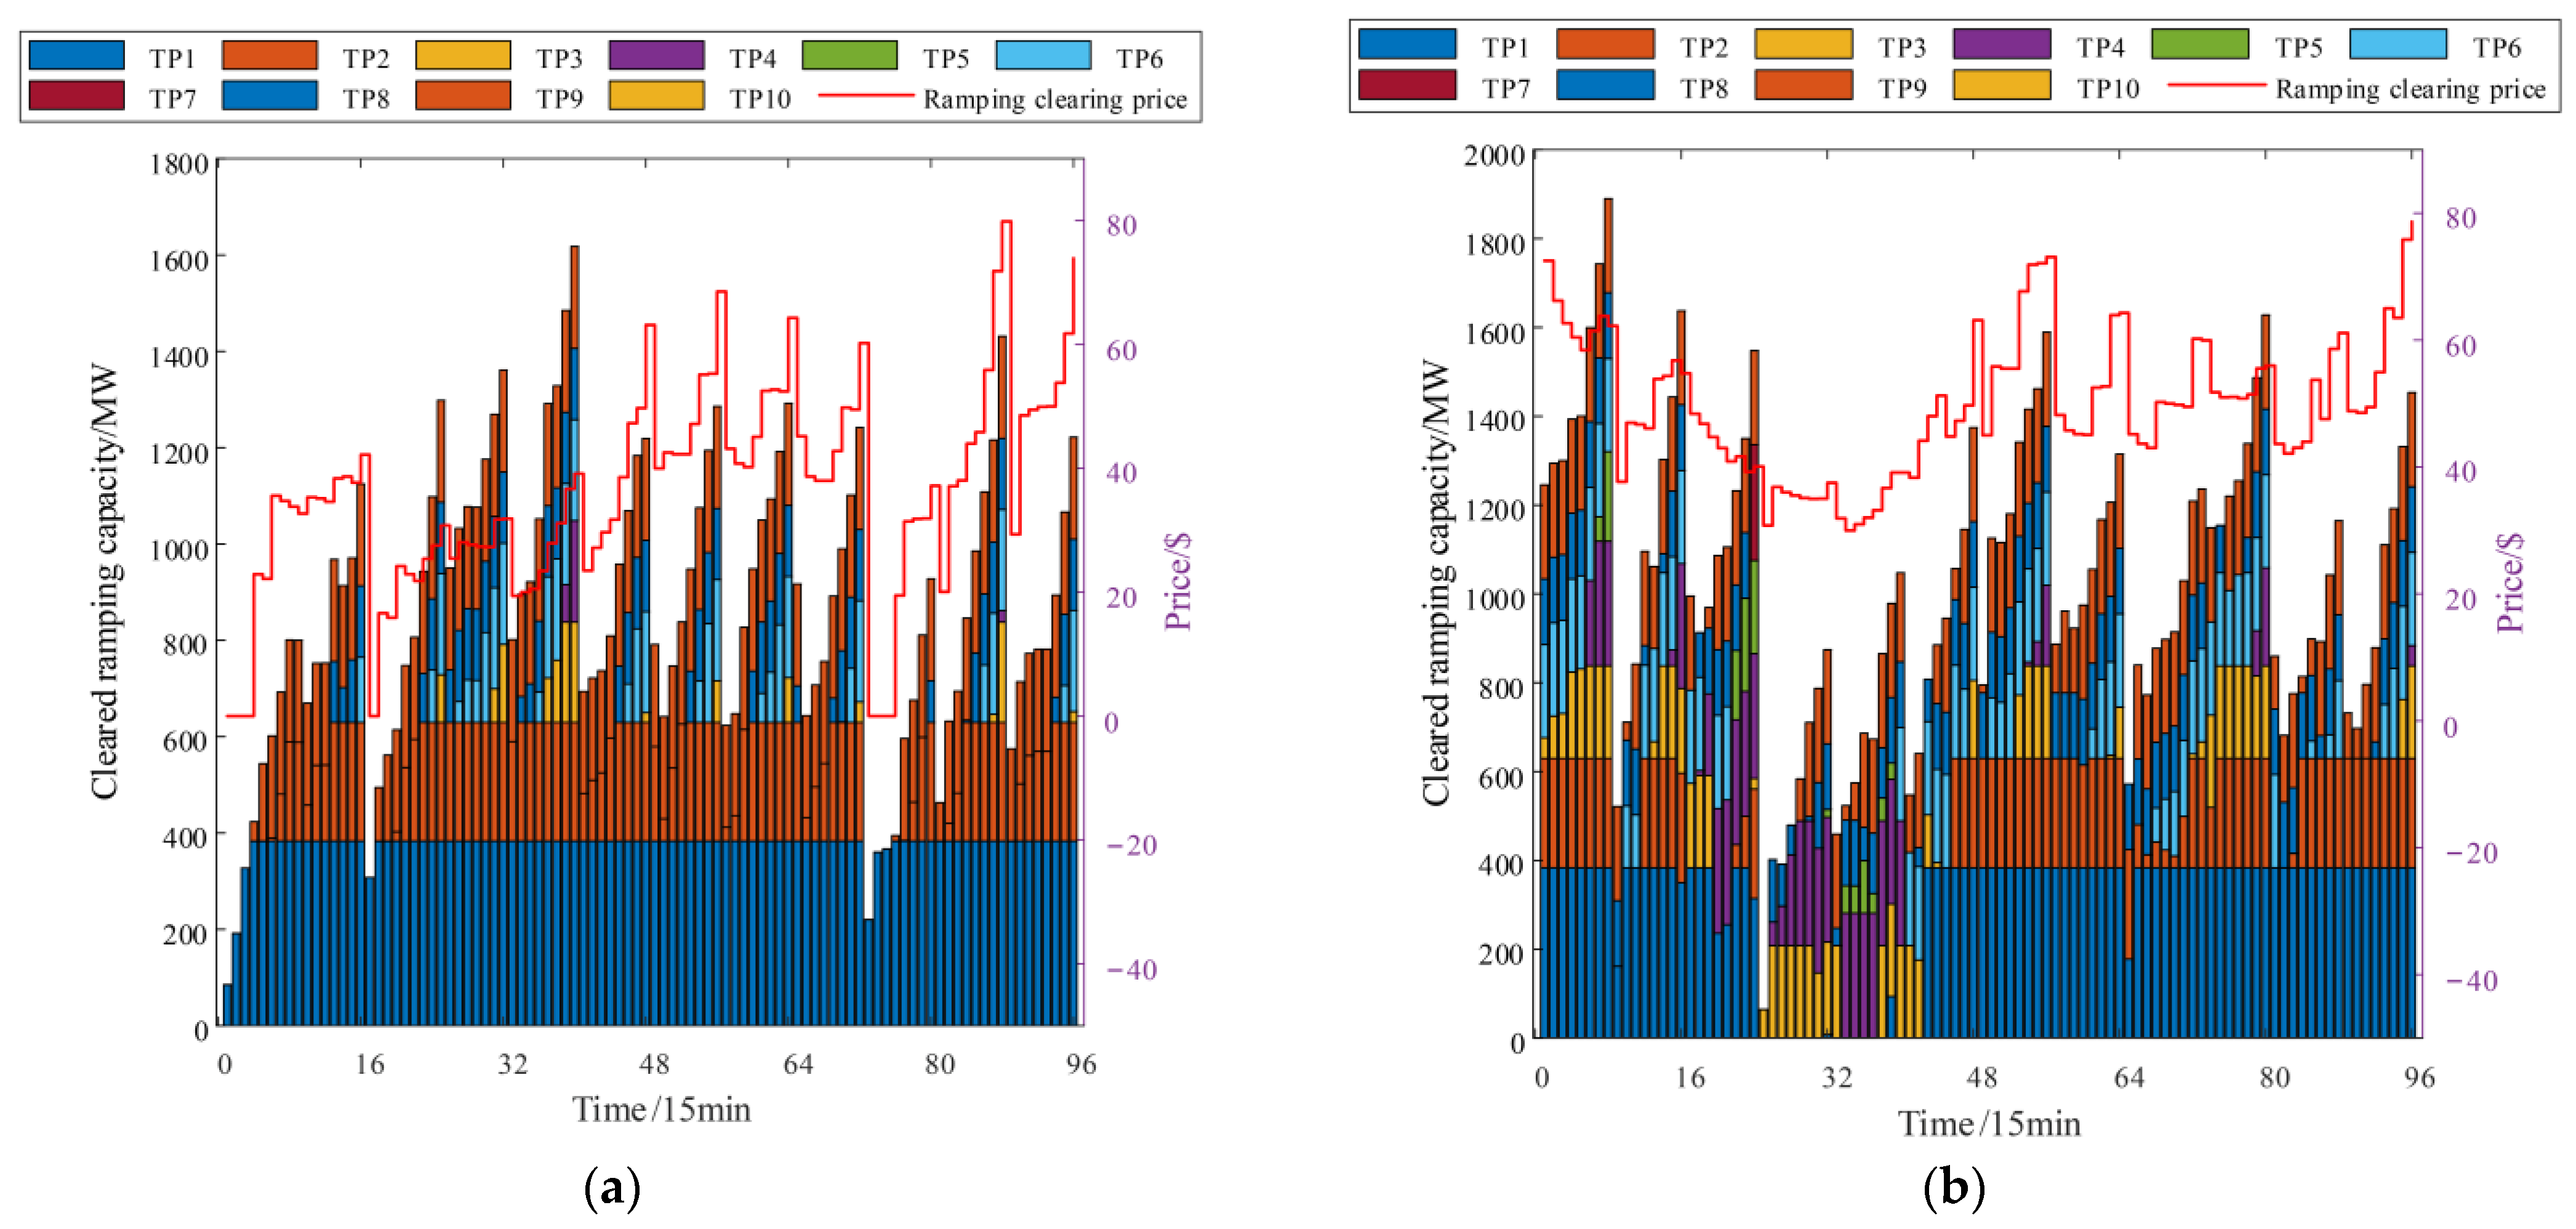
Appendix B
Taking a typical time interval (00:45–01:00 of the operating day) as an example, the system operation data and the data required by the proposed ramping cost allocation mechanism are presented in Table A3, Table A4 and Table A5. Among them, Table A3 shows the system operation data for this interval, which is used to perform the first-layer “system attribution” and obtain the total costs of the three cost pools. Table A4 and Table A5 present the relevant data for Users and renewable energy stations, respectively.
Table A3.
System operation data for a typical time interval.
Table A4.
Typical interval User load data.
Table A5.
Typical interval renewable energy station data.
(1) First-layer system attribution: Establishing cost pools. According to Equations (4)–(7), the allocated costs for each cost pool are calculated based on the proportion of each causal type to the total ramping responsibility:
(2) Second-layer responsibility tracing.
(a) Cost allocation for net load variation: Allocation is performed based on the responsibility proportion of each User and the renewable energy station’s net load variation. The total upward cost caused by net load variation is 0 $ (because the net load variation is negative and does not contribute to upward ramping), and the total downward cost is 8034.32 $. Therefore, all upward net load allocation costs are zero. The downward cost needs to be allocated according to each entity’s contribution to the downward net load. Downward net load consists of two parts: negative values of User load change (i.e., load decrease) and positive values of renewable output change (i.e., output increase). Taking User 1 as an example for downward net load change cost allocation, the allocated cost for User 1 in this interval is:
Similarly, the allocated costs of net load variation for each User and renewable energy station during this interval are shown in Table A6.
Table A6.
Allocated costs of net load variation for each market participant during a typical time interval.
(b) Cost allocation for load forecast deviation: Allocated in proportion to each User’s electricity consumption share (Table A4). Taking User 1 as an example, the allocated costs of upward and downward load forecast deviation for User 1 during this interval are:
Similarly, the allocated costs of load forecast deviation for each User during this interval are shown in Table A7.
Table A7.
Allocated costs of load forecast deviation for each User during a typical time interval.
(c) Cost allocation for renewable energy forecast deviation: Taking WP1 as an example, the declared error interval cost is allocated in proportion to the declared interval width of each station:
The actual error cost is allocated in proportion to the actual error allocation coefficients.
Similarly, the allocated costs of renewable energy forecast deviation for each renewable energy station during this interval are shown in Table A8.
Table A8.
Allocated costs of forecast deviation for each renewable energy station during a typical time interval.
From the above single-period example, it can be clearly seen that:
- (1)
- Responsibility matching: Users with large load fluctuations (e.g., User5 and User9) bear higher costs in the net load variation cost pool; renewable energy stations with large forecast errors (e.g., WP6) bear significantly higher costs in the actual error cost pool.
- (2)
- Traceability: Each cost can be traced back to specific physical causes (net load variation, load forecast deviation, and renewable energy forecast deviation) and responsible entities.
- (3)
- Incentive compatibility: If a renewable station’s actual error exceeds its declared error interval (e.g., WP6), its actual error cost increases substantially, forming an economic penalty that incentivizes truthful declaration and improved forecast accuracy.
This example is fully consistent with the overall results in the main text, verifying the effectiveness and reproducibility of the proposed two-layer allocation mechanism.
Based on the optimizable directions revealed by this case study, subsequent research will focus on the following aspects: expanding the quantification of prosumer responsibilities by incorporating prosumers such as distributed PV, energy storage, and electric vehicles into a unified net-load framework to accurately assess their ramping responsibilities; improving the integration with market rules by designing a phased transition scheme from “system-wide uniform proportional allocation” to “individual declaration-based deviation allocation”, along with a supporting credit evaluation and assessment mechanism; and promoting engineering simplification by consolidating allocation items and setting thresholds for ramping requirements to reduce computational complexity while ensuring core fairness, thereby enhancing the practical implementability of the mechanism. These research directions have been systematically elaborated as short-term and long-term research plans in the conclusions of the main text.
References
- Adams, S.; Klobodu, E.K.M.; Apio, A. Renewable and non-renewable energy, regime type and economic growth. Renew. Energy 2018, 125, 755–767. [Google Scholar] [CrossRef] [Scilit]
- Sreekumar, S.; Yamujala, S.; Sharma, K.C.; Bhakar, R.; Simon, S.P.; Rana, A.S. Flexible Ramp Products: A solution to enhance power system flexibility. Renew. Sustain. Energy Rev. 2022, 162, 112429. [Google Scholar] [CrossRef] [Scilit]
- Gong, X.; Li, X.; Zhong, Z. Strategic bidding of hydrogen-wind-photovoltaic energy system in integrated energy and flexible ramping markets with renewable energy uncertainty. Int. J. Hydrogen Energy 2024, 80, 1406–1423. [Google Scholar] [CrossRef] [Scilit]
- Wang, P.; Zhang, Y.; Ding, Y.; Wang, W.; Cui, Z.; Liu, X. Collaborative bidding optimization model for pumped storage plants participating in the electricity and flexible ramping markets considering multi-player game relationships: Case study of China. Energy 2025, 326, 136307. [Google Scholar] [CrossRef] [Scilit]
- Deng, J.; Li, X.; Liu, J. A joint optimal clearing model for energy, inertia and ramping in power systems considering multiple time scales. Appl. Energy 2025, 390, 125892. [Google Scholar] [CrossRef] [Scilit]
- Yuanyuan, Z.; Huiru, Z.; Bingkang, L. Distributionally robust comprehensive declaration strategy of virtual power plant participating in the power market considering flexible ramping product and uncertainties. Appl. Energy 2023, 343, 121133. [Google Scholar] [CrossRef] [Scilit]
- CAISO. Flexible Ramping Product: Revised Draft Final Proposal; CAISO: Folsom, CA, USA, 2015. [Google Scholar]
- MISO. Ramp Capability for Load Following in MISO Markets White Paper; MISO: Carmel, IN, USA, 2016. [Google Scholar]
- EPEX Spot. Flexibility is the Answer: European Power Exchange as a Component of Security of Supply During the Solar Eclipse; EPEX: Paris, France, 2015. [Google Scholar]
- British National Grid. Demand Turn up 2018 Interactive Guidance Document; National Grid ESO: London, UK, 2018. [Google Scholar]
- National Energy Administration. Circular of the National Energy Administration on Issuing the “Basic Rules for the Electric Power Ancillary Service Market”. Available online: https://www.ndrc.gov.cn/xxgk/zcfb/ghxwj/202504/t20250429_1397483.html (accessed on 3 April 2025).
- Shandong Energy Regulatory Office of the National Energy Administration. Circular on Issuing the “Shandong Electric Power Ramping Ancillary Service Market Trading Rules (Trial)”. Available online: https://sdb.nea.gov.cn/dtyw/tzgg/202402/t20240208_245961.html (accessed on 8 February 2024).
- Saberi, L.; Alizadeh, M.-I.; Moghaddam, M.P. Optimal scheduling of flexible ramp product and emerging flexible resources considering short-term variability impacts in power system with high RESs penetration: A novel robust UC approach. Int. J. Electr. Power Energy Syst. 2022, 142, 108279. [Google Scholar] [CrossRef] [Scilit]
- Ghaljehei, M.; Khorsand, M. Day-Ahead Operational Scheduling With Enhanced Flexible Ramping Product: Design and Analysis. IEEE Trans. Power Syst. 2021, 37, 1842–1856. [Google Scholar] [CrossRef] [Scilit]
- Huang, C.; Han, D.; Yan, Z.; Li, Y.; Sun, C.; Jia, Q. Bidding strategy of energy storage in imperfectly competitive flexible ramping market via system dynamics method. Int. J. Electr. Power Energy Syst. 2022, 136, 107722. [Google Scholar] [CrossRef] [Scilit]
- Massana, J.; Burgas, L.; Cañigueral, M.; Sumper, A.; Melendez, J.; Colomer, J. Enabling charging point operators for participation in congestion markets. Int. J. Electr. Power Energy Syst. 2025, 167, 110604. [Google Scholar] [CrossRef] [Scilit]
- Zhao, Y.; Wu, G.B.; Cai, Q.N.; Wang, L.; Song, H.; Yu, J.; Yu, P.; Wang, Z.L.; Dai, X.J.; Chen, Y.G. The Research on Settlement and Cost Allocation Mechanisms of Ramping Ancillary Service. Price Theory Pract. 2024, 10, 131–137. [Google Scholar] [CrossRef]
- Yu, Z. Research on the Clearing and Cost Sharing Mechanism of Flexible Ramping Products in the Electricity Market. Master’s Thesis, South China University of Technology, Guangzhou, China, 2023. [Google Scholar] [CrossRef]
- Wang, B.B.; Cong, X.H.; Gao, Z.P.; Tan, J.; Wu, C.; Gu, W.Y.; Xie, M.C. Status Analysis and Thoughts of Market-oriented Acquisition Mechanism on Flexible Ramp Capability for Power Grid With High Proportion of Renewable Energy. Power Syst. Technol. 2019, 43, 2691–2701. [Google Scholar] [CrossRef]
- Wu, S.; Bian, X.Y.; Zhang, J.X.; Lin, Y.; Lin, W.W. A Review of Domestic and Foreign Ancillary Services Market for Improving Flexibility of New Power System. Trans. China Electrotech. Soc. 2023, 38, 1662–1677. [Google Scholar] [CrossRef]
- Shandong Energy Regulatory Office of the National Energy Administration. Circular on Issuing the “Shandong Electricity Maket Rules (Trial)”. Available online: https://sdb.nea.gov.cn/dtyw/tzgg/202404/t20240419_261034.html (accessed on 19 April 2024).
- Dong, R.; Wang, Y.; Huang, Y.; Zou, R. Feature-driven dynamic non-crossing quantile ensemble learning for reliable probabilistic wind power forecasting. Energy 2025, 335, 137884. [Google Scholar] [CrossRef] [Scilit]
- Guan, S.; Xu, C.; Guan, T. Multistep interval prediction model with adjustable horizon for uncertain power load forecasting. Energy 2025, 335, 137768. [Google Scholar] [CrossRef] [Scilit]
- Chen, H.; Huang, J.; Lin, Z.; Huang, F.; Li, M. Stochastic Economic Dispatch Based Optimal Market Clearing Strategy Considering Flexible Ramping Products Under Wind Power Uncertainties. CSEE J. Power Energy Syst. 2024, 10, 1525–1535. [Google Scholar] [CrossRef] [Scilit]
- Gini, C. Measurement of Inequality of Incomes. Econ. J. 1921, 31, 124–126. [Google Scholar] [CrossRef] [Scilit]
- Legrand, M.; Berardinis, B.D.; Gaggin, H.K.; Magrini, L.; Belcher, A.; Zancla, B.; Femia, A.; Simon, M.; Motiwala, S.; Sambhare, R.; et al. Spearman Correlation Coefficients Between Biomarkers; John Wiley & Sons, Inc.: Hoboken, NJ, USA, 2014. [Google Scholar]
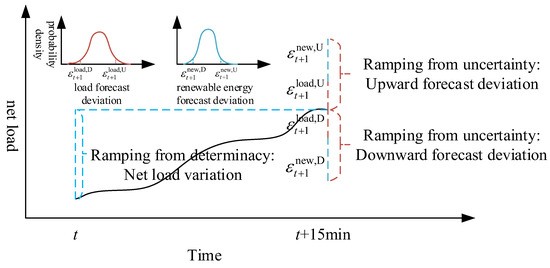
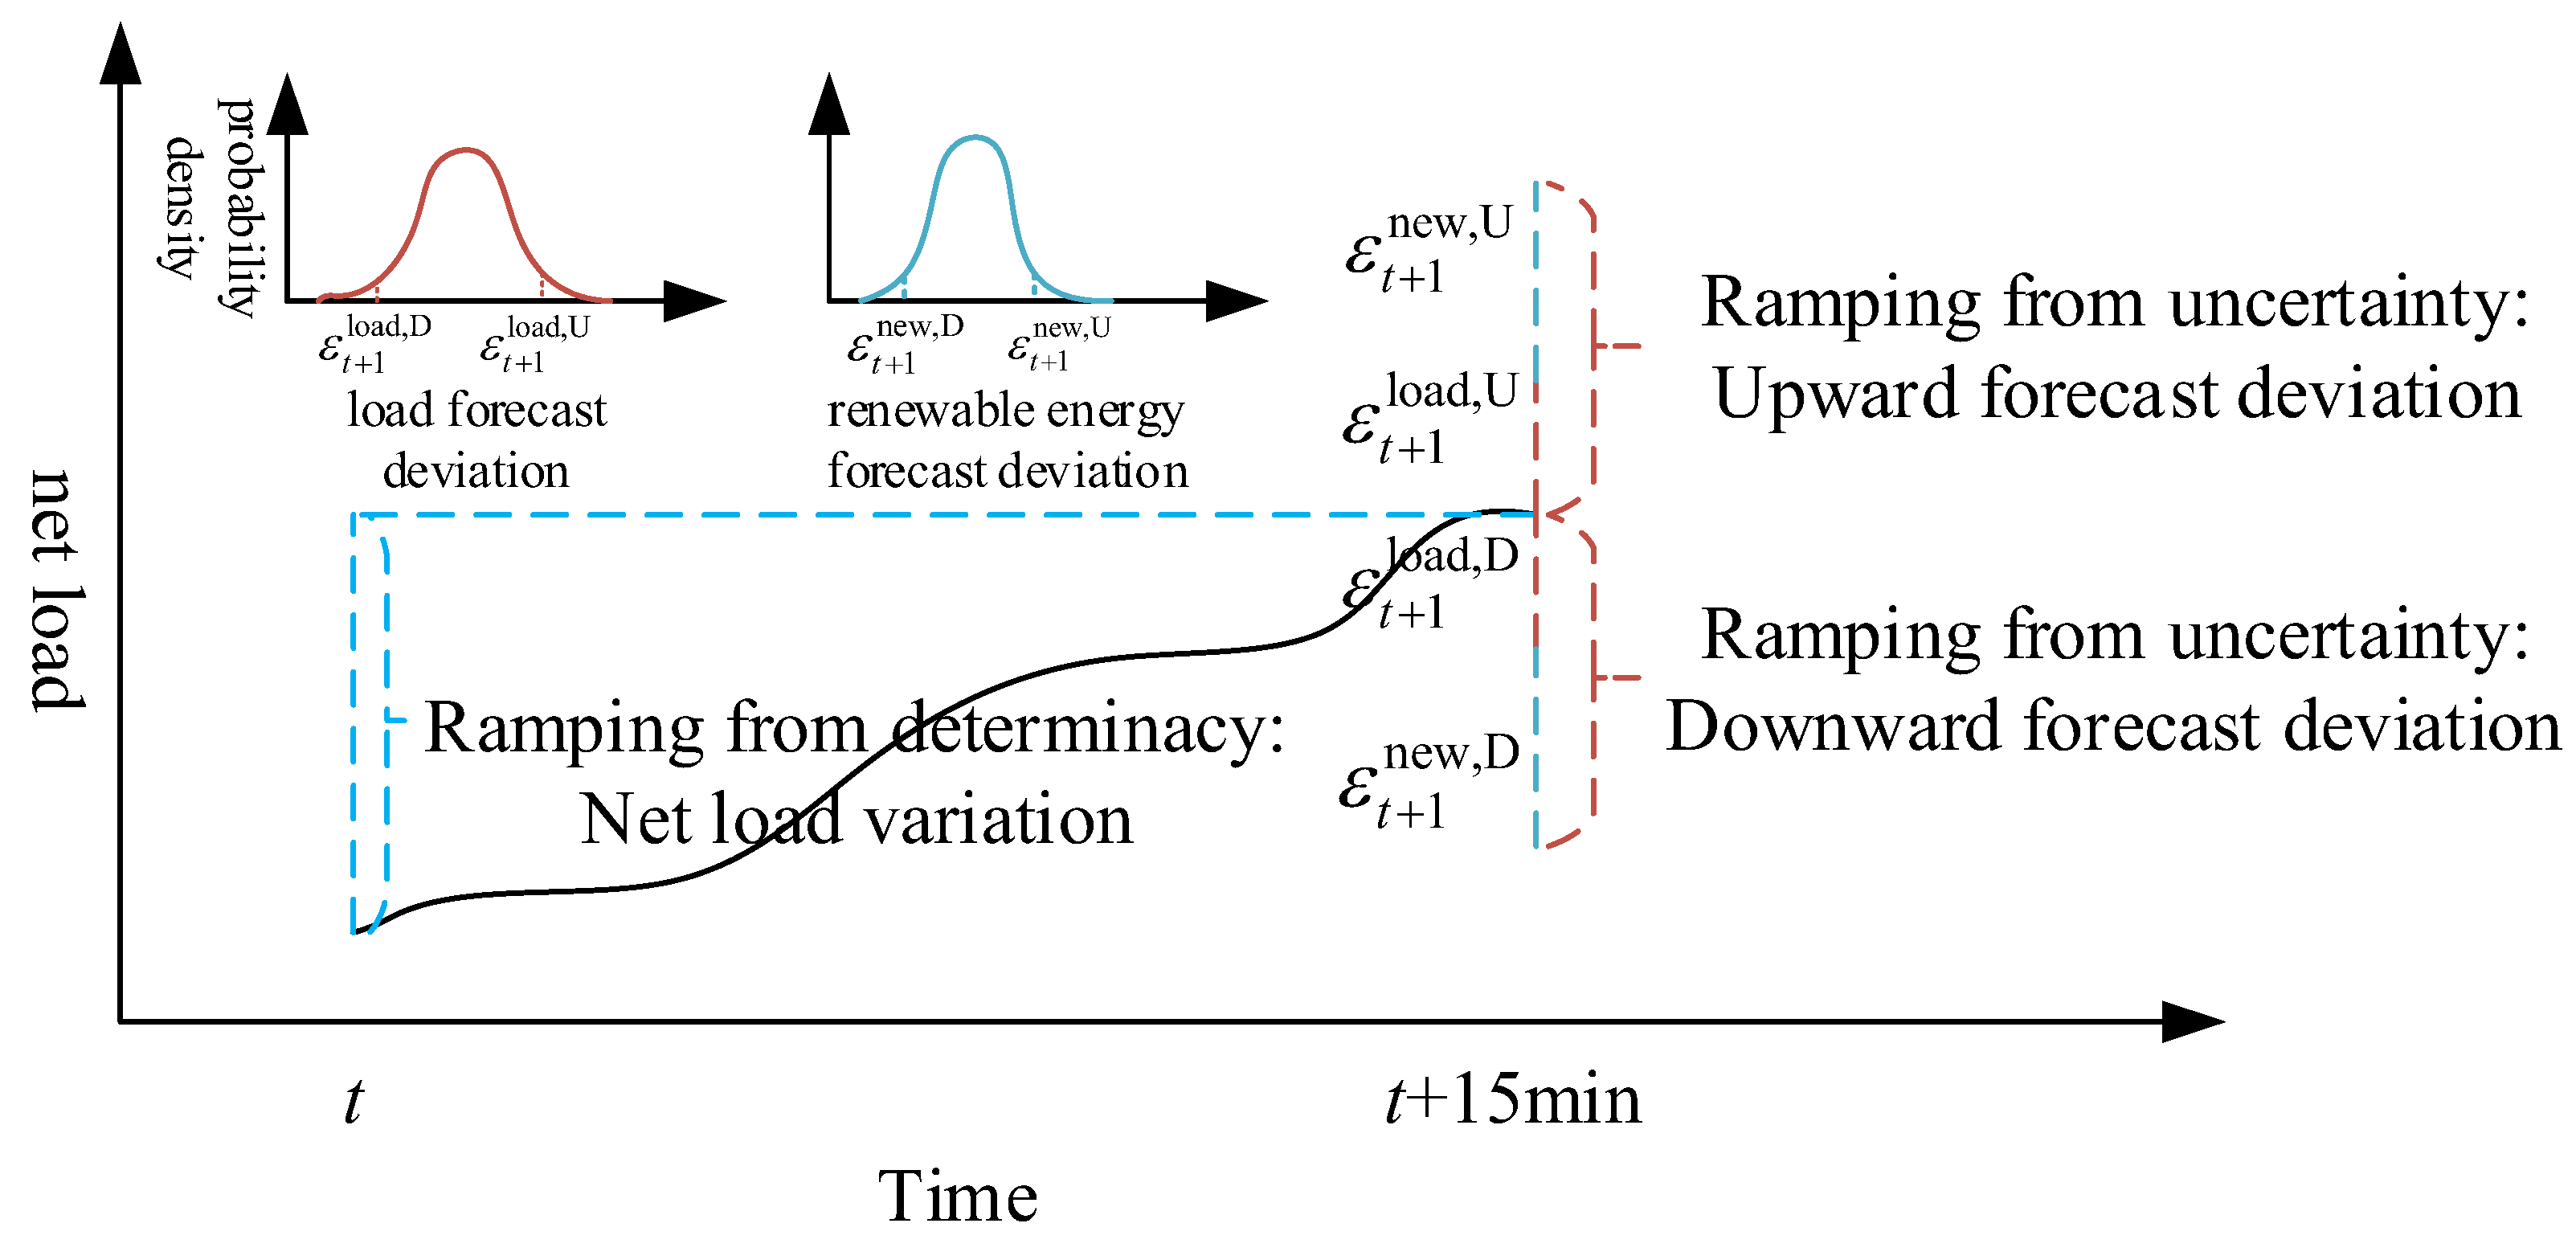
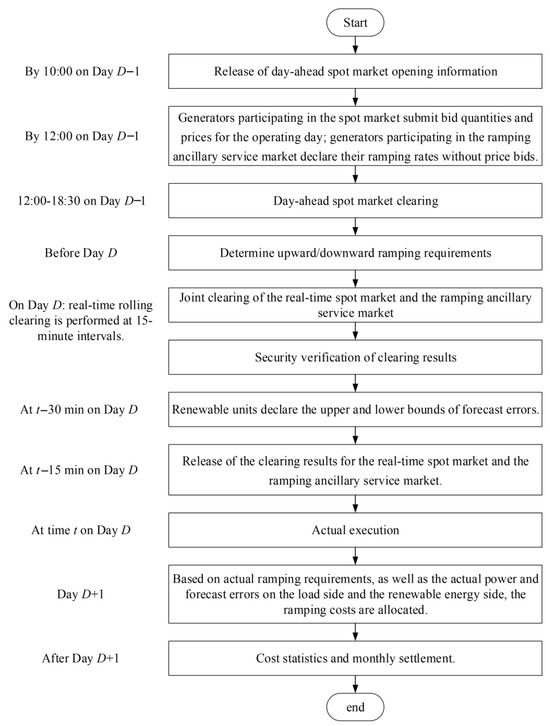
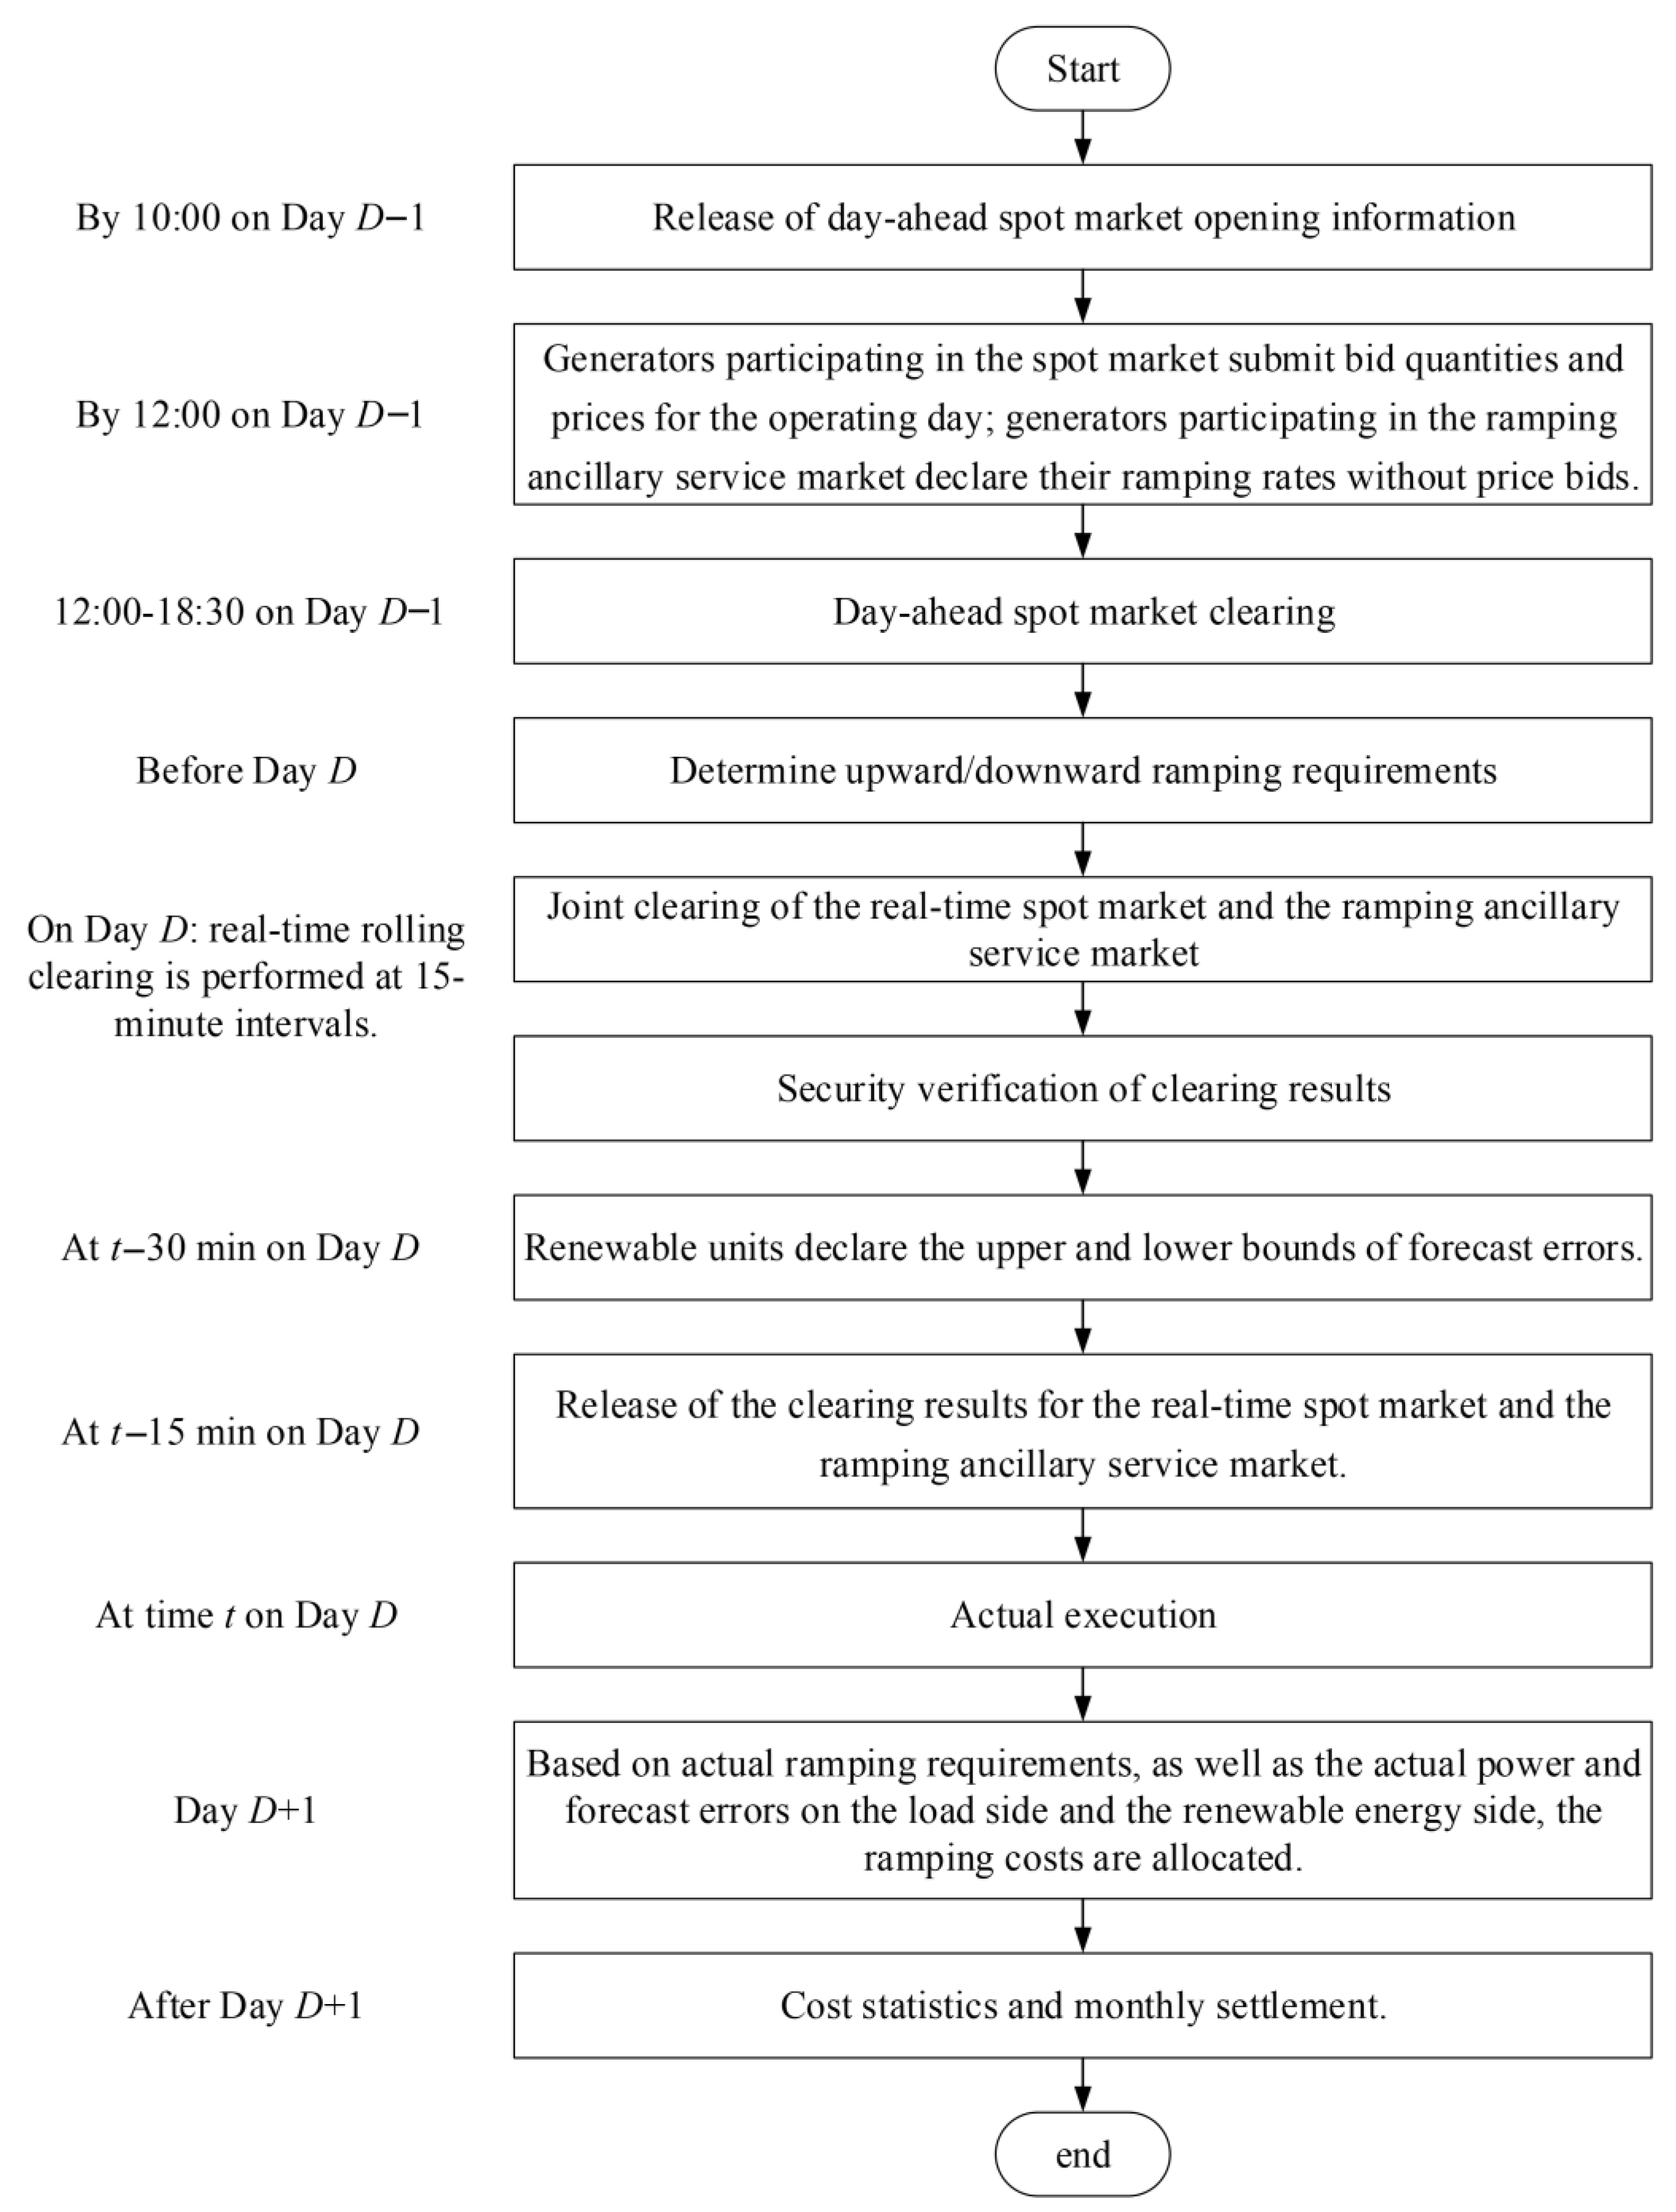
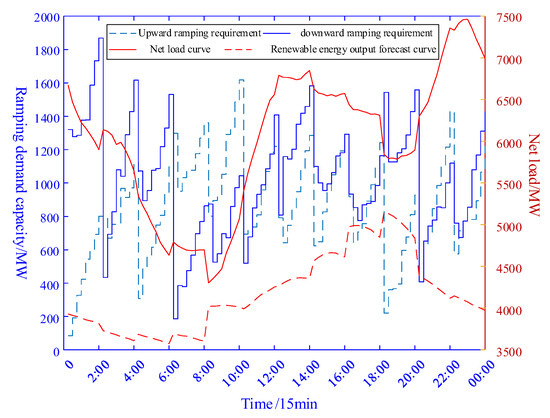
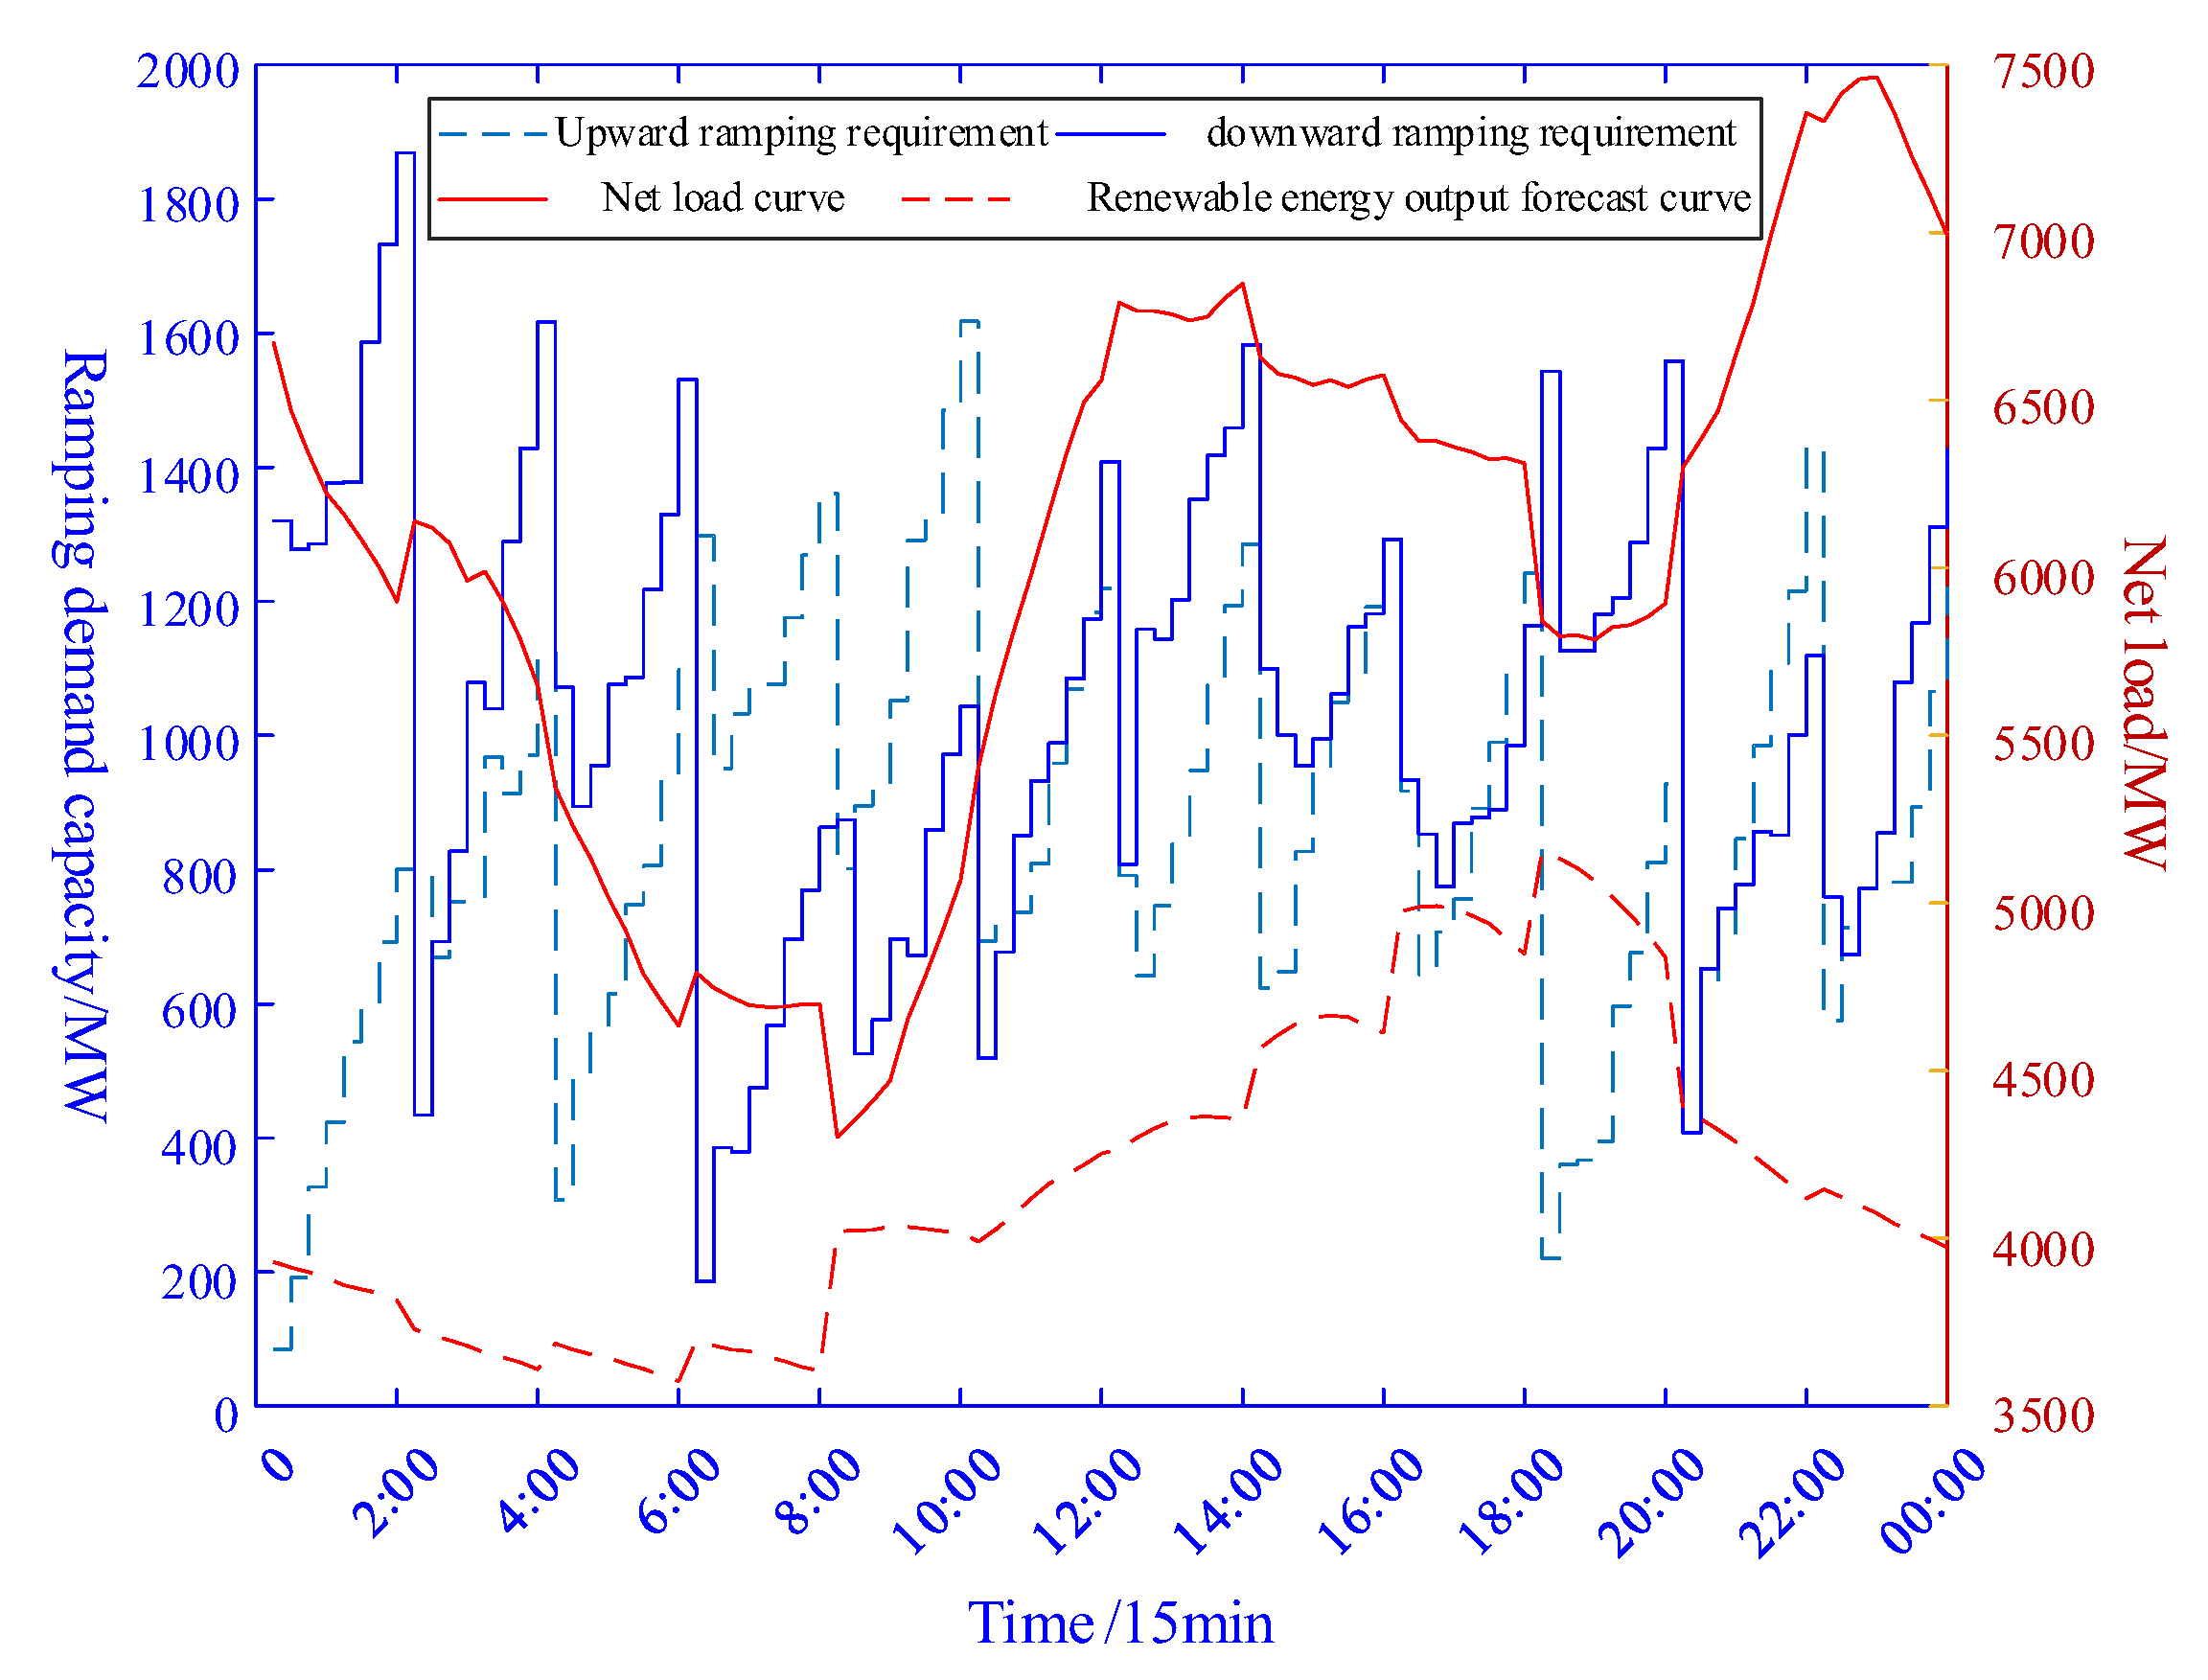
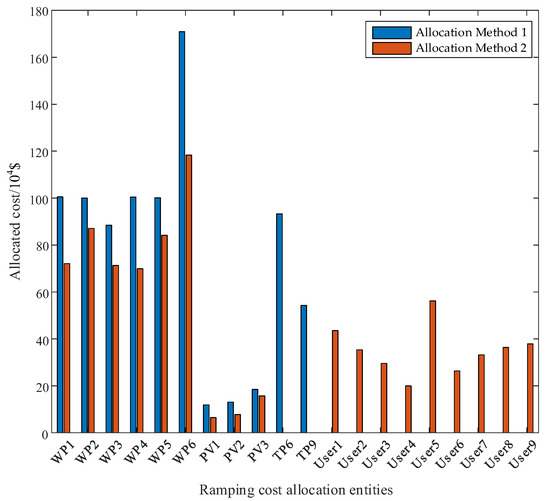
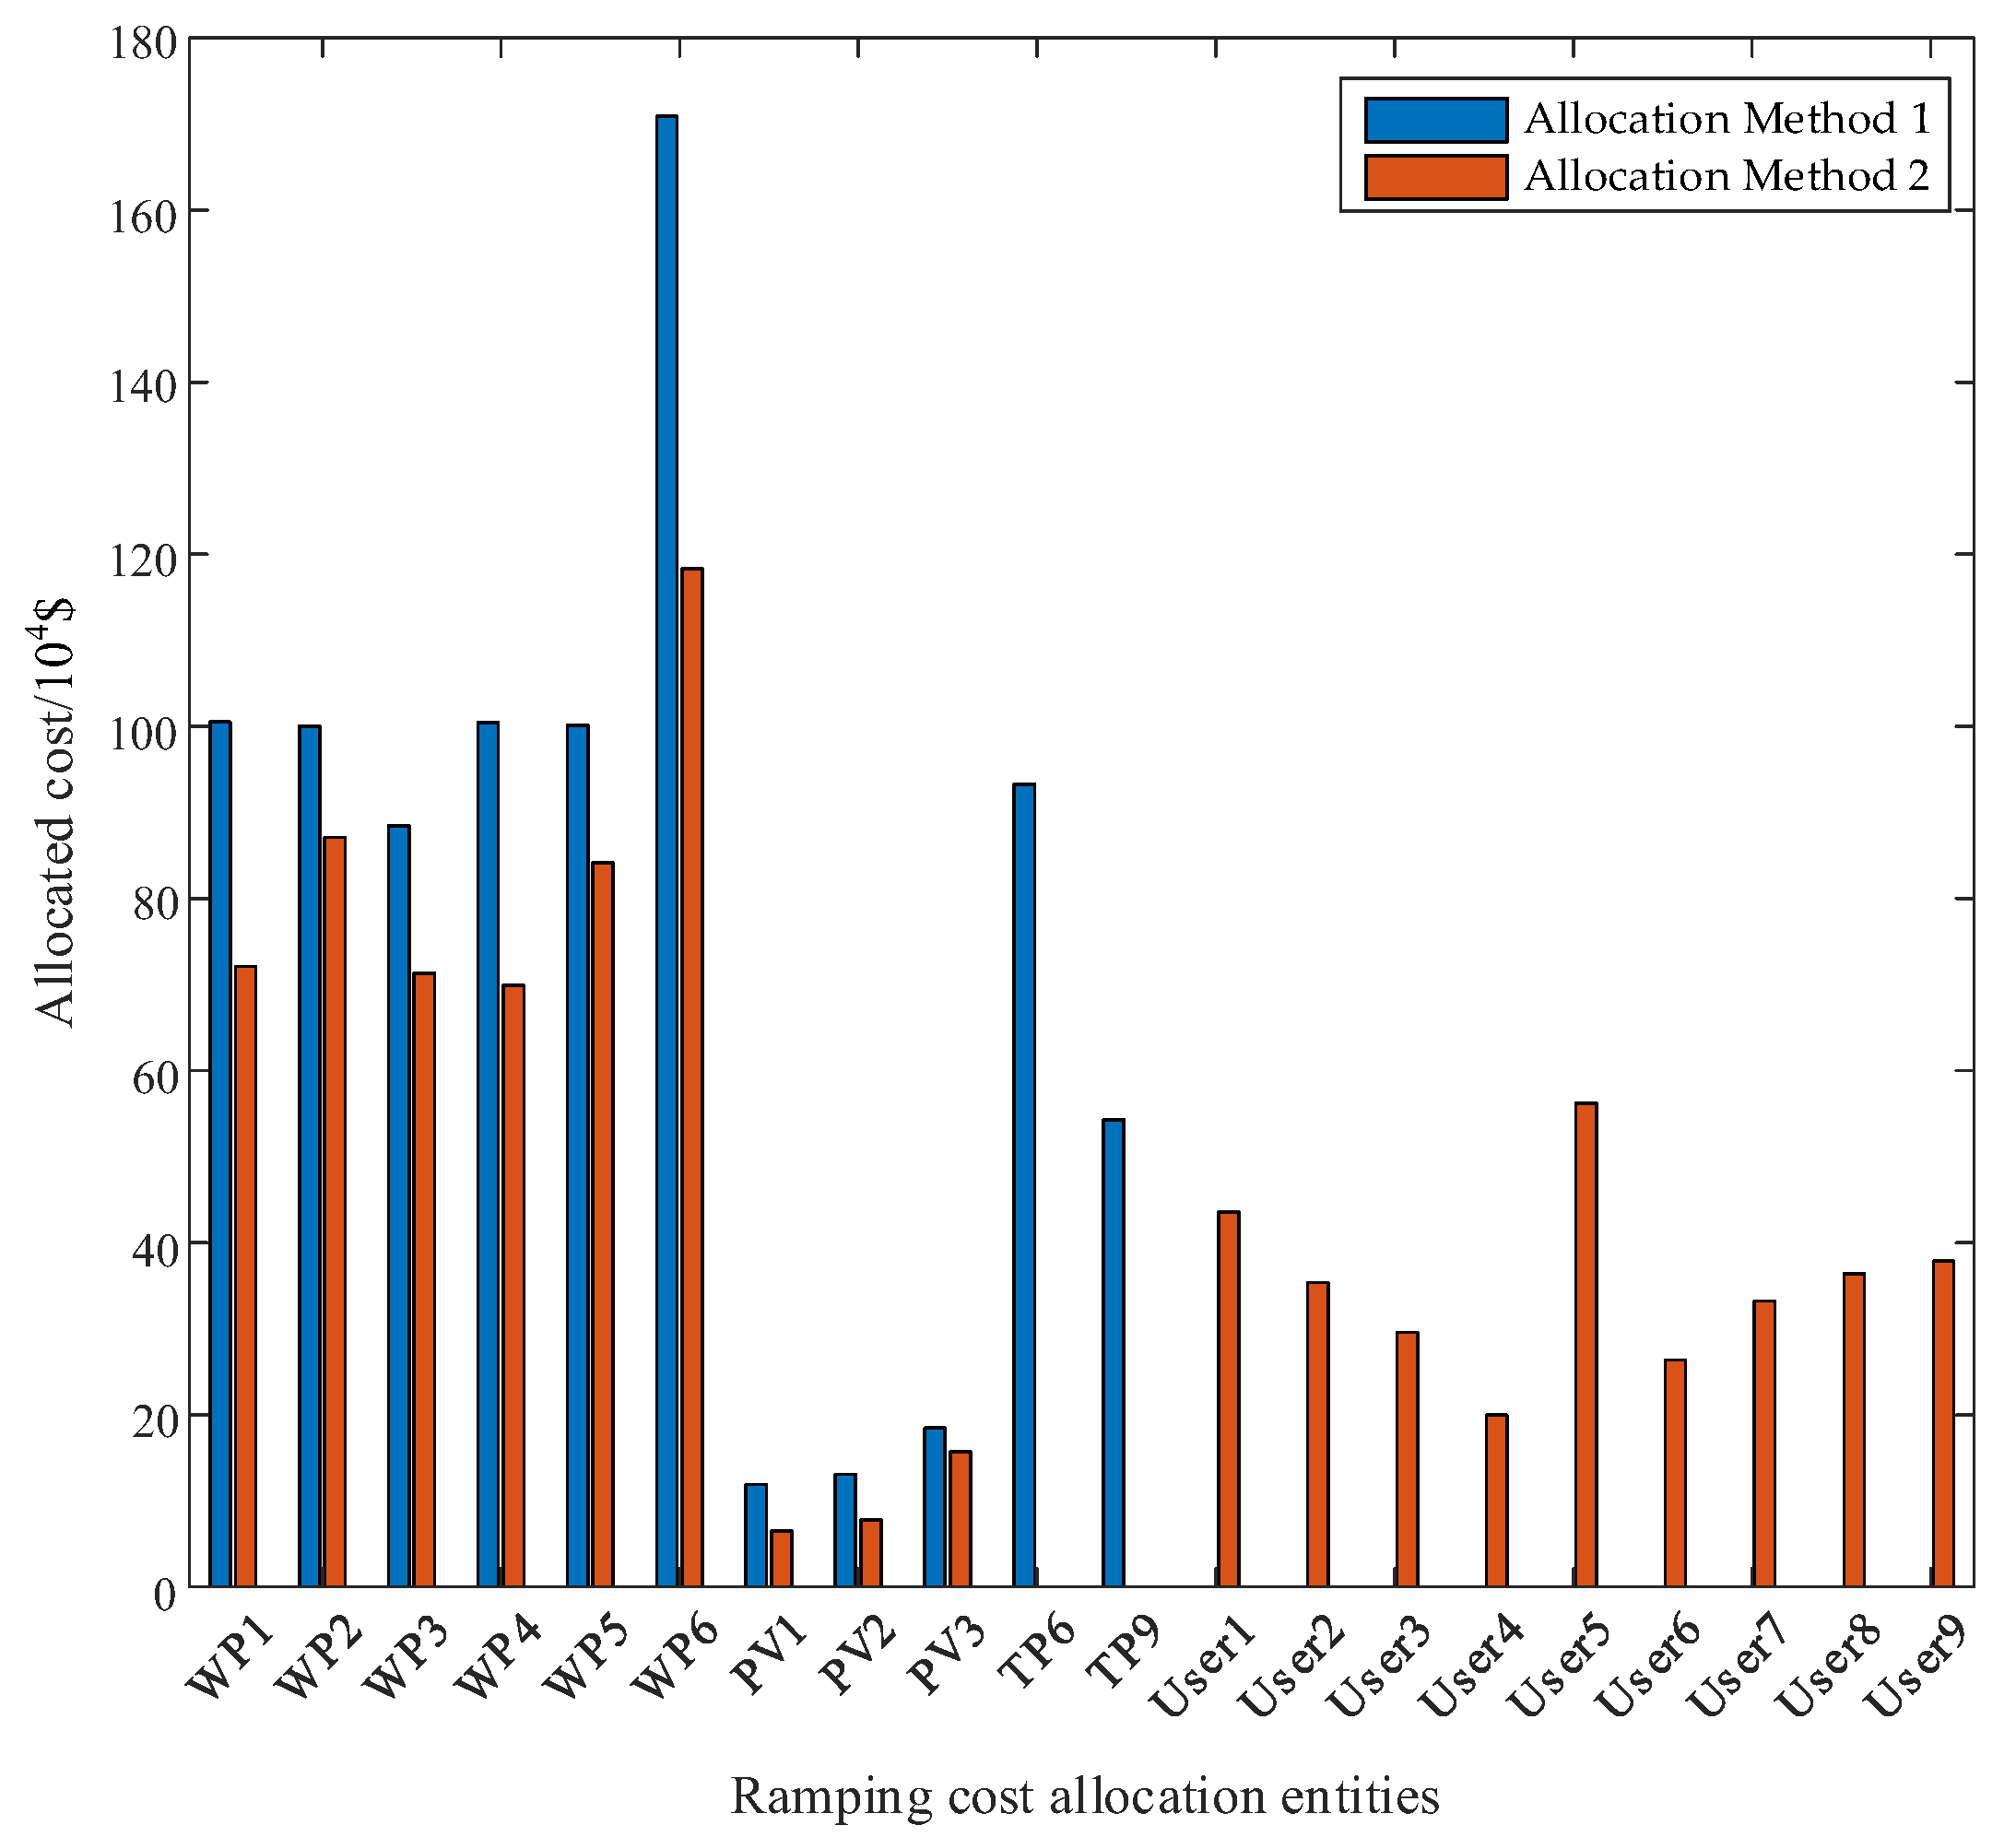
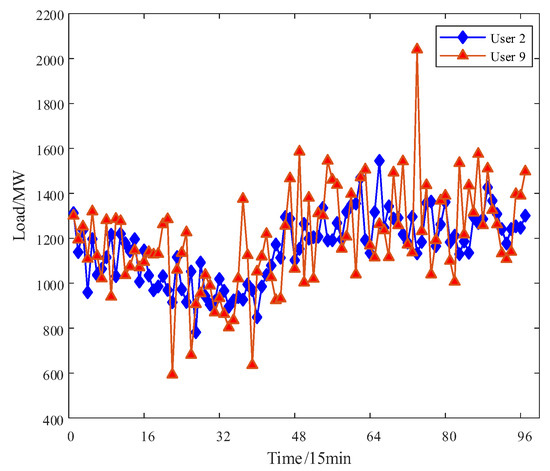
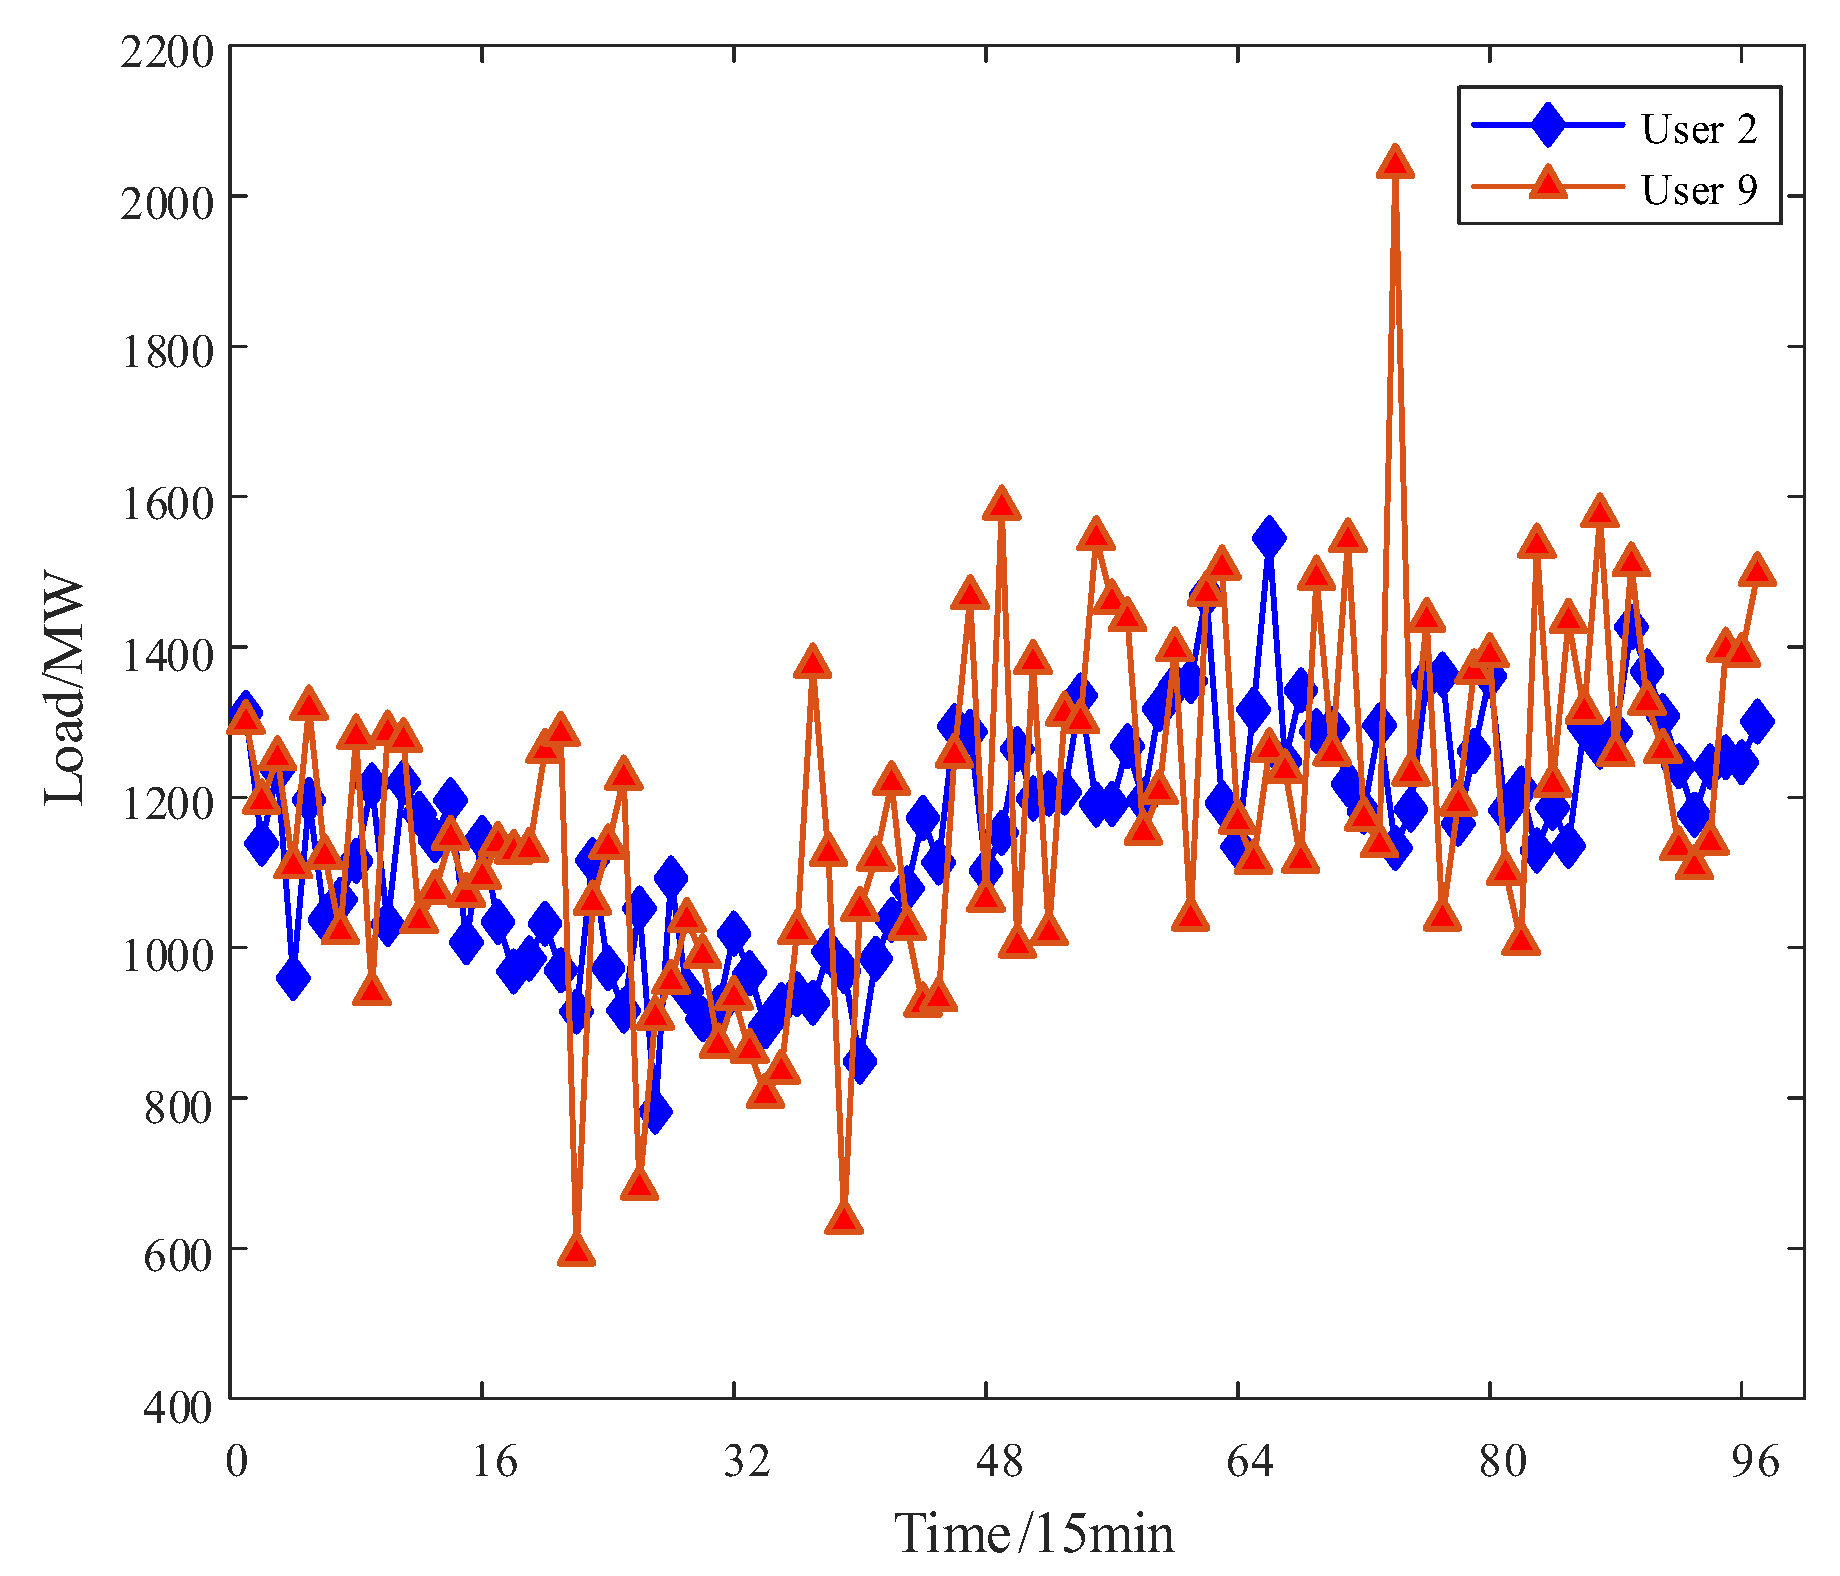
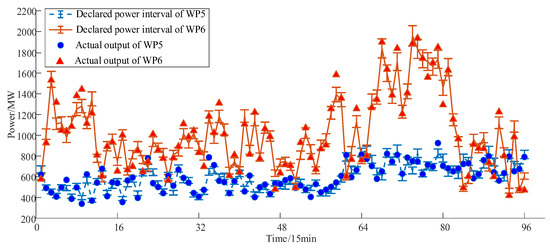
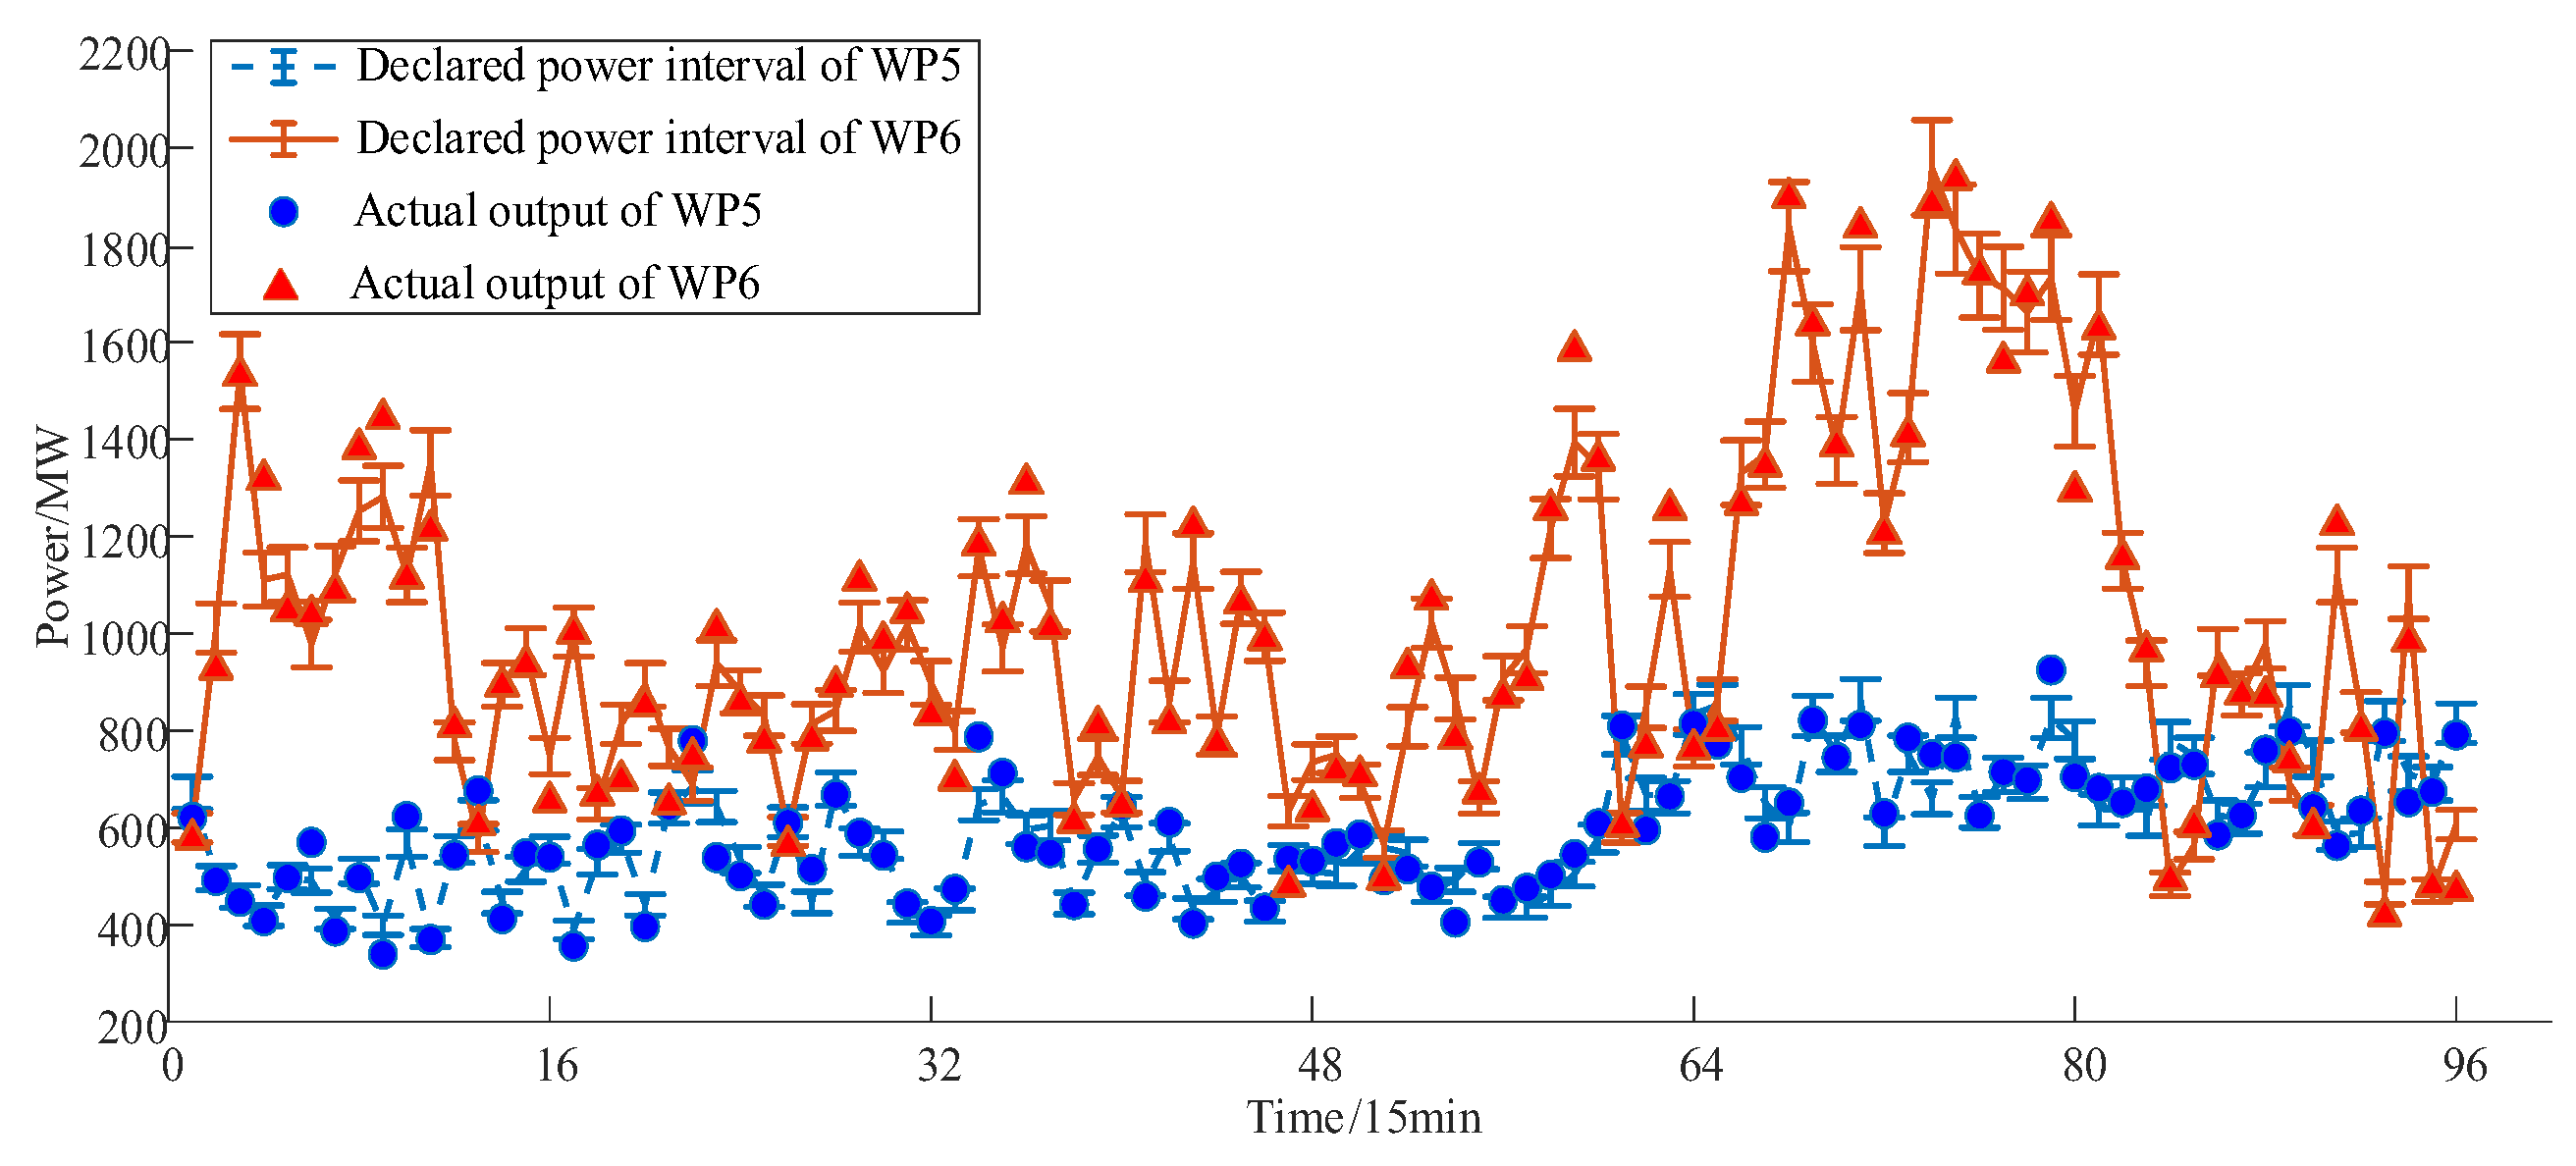
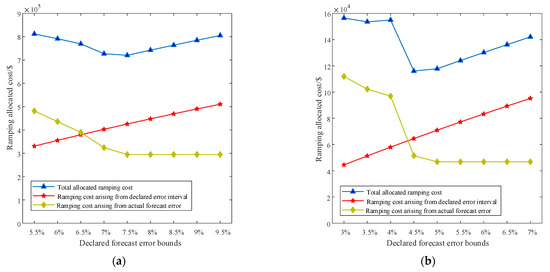

Disclaimer/Publisher’s Note: The statements, opinions and data contained in all publications are solely those of the individual author(s) and contributor(s) and not of MDPI and/or the editor(s). MDPI and/or the editor(s) disclaim responsibility for any injury to people or property resulting from any ideas, methods, instructions or products referred to in the content. |
© 2026 by the authors. Licensee MDPI, Basel, Switzerland. This article is an open access article distributed under the terms and conditions of the Creative Commons Attribution (CC BY) license.