


Abstract
Research on methods for detecting microwave-based noncontact vibration has garnered significant attention in recent years. To simplify system complexity and reduce costs, which would enable broader application of radar technology in daily life, we propose a low-complexity, high-precision continuous-wave (CW) radar system for noncontact vibration detection. This system employs a hardware-based approach for phase comparison to extract vibration information, enabling simultaneous detection of both vibration amplitude and frequency under a CW radar architecture. In this study, we establish a phase discrimination error model to characterize the inconsistent detection sensitivity of the hardware phase comparator in different phase intervals, and we further propose a phase compensation scheme to mitigate the nonlinearity of phase discrimination and the “null-point” problem in continuous phase comparison, consequently improving the sensitivity and precision of the proposed radar system. Through loudspeaker vibration and experiments on human vital signs, the system maintains a vibration amplitude detection accuracy above 90.3% within 1.8 m while achieving respiratory rate and heartbeat rate detection accuracies of 96.34% and 98.02%, respectively.
1. Introduction
Noncontact vibration detection has the advantages of long detection distances, convenient wearing, and easy maintenance. Therefore, it has broad application prospects, with optical detection [1,2,3,4,5] and radar detection [6,7,8] being prominent examples that have attracted tremendous attention. Optical detection mainly uses a laser vibrometer to detect tiny vibrations of the target, which has the advantage of high accuracy [9], but it is relatively easily affected by the external environment such as smoke, dust, and ambient light, and only works if the target can be directly “seen” [10,11]. Thus, optical detection is only suitable for specific applications. By comparison, radar detection has the following advantages in tiny vibration detection: first, the electromagnetic waves generated by the radar can easily penetrate non-metallic obstructions to detect vibrations of the target surface; second, these waves are less affected by ambient temperature and light. The spread of the electromagnetic wave in space is relatively stable, which is more conducive to detecting various complex conditions. Thus, the noncontact detection capability of radar for small vibrations has a wide range of applications in daily life. In structural monitoring applications, conventional contact displacement sensors need to be fixed at a reference point, which limits their suitability for most scenarios. Consequently, noncontact detection using radar technology offers continuous and accurate vibration monitoring for large structures such as skyscrapers, bridges, and dams, effectively preventing collapses [12,13,14,15,16]. In healthcare applications, non-invasive and noncontact monitoring techniques for vital signals have garnered significant attention.
Radar systems applied to detect tiny vibrations are usually classified into three categories: continuous-wave (CW) radar [17,18,19,20], frequency-modulated continuous-wave (FMCW) radar [21,22,23,24,25,26], and ultrawide-band (UWB) radar [27,28,29,30,31]. The latter offers a high range of resolutions due to its large bandwidth [30,31]. However, in scenarios requiring only relative displacement measurements such as target micro-movements, its high operating bandwidth results in a lower signal-to-noise ratio (SNR). FMCW radar can measure both absolute distance and relative displacement, but its measurement performance depends on the generated frequency ramps. In order to acquire higher measurement accuracy, an extremely wide operating frequency band along with a small sweep time needs to be set in FMCW radar [21]. By comparison, CW radar offers a simpler radar structure and exhibits high resistance to interference owing to its narrower signal bandwidth. It does not require complex waveform modulation and operates by transmitting signals at a single frequency, making it a cost-effective solution [32] and a suitable choice for applications that only require relative displacement. Tiny vibrations are detected by the CW radar system usually through analyzing the phase difference between the transmitted and reflected signals. Traditionally, the main demodulation methods for CW radar are small-angle approximation [33] and arctangent demodulation [34]. The performance of the former depends on the distance between the target and radar, and when this distance changes, “optimum” and “null” points will alternately appear [35]. To solve this problem, arctangent demodulation is introduced, but this method leads to a complex system architecture and its accuracy is affected by the DC offset. In the field of using CW radar to measure tiny vibrations caused by conditions such as chest movements and bridge vibrations, there are various hardware architectures (e.g., Doppler radar [18], self-rejection-locked radar [36]) and baseband signal processing methods (e.g., extended DACM algorithm [6], multi-signal classification-based algorithms and heterodyne digital quadrature demodulation [34]). A classical signal processing method, utilizing a series of processes including DC removal, filtering, and Hilbert vibrational decomposition (HVD) to obtain human respiration and heartbeat signals, is introduced in [18,19,20]. These methods typically require post-processing of the echo signal to extract target micro-motion information, resulting in poor real-time performance. Algorithms with higher accuracy for estimating human respiration and heartbeats were also proposed in [21,22], such as singular spectrum analysis and particle swarm optimization (PSO). However, the substantial computational demands limit their real-time performance and hardware deployment. Therefore, the relatively complex signal processing methods of these studies result in either complex system architectures or poor real-time performance in vibration detection applications.
Unlike conventional CW radar methods that mainly rely on small-angle approximation, arctangent demodulation, or post-processing-based vibration extraction, the proposed radar system in this paper adopts a hardware-based phase comparison method to obtain target vibration information from the phase difference between the transmitted and reflected signals. This study first proposes a phase discrimination error model to simulate the nonlinear input–output characteristics of the hardware phase comparator. On this basis, a phase compensation scheme is proposed to address the issue of inconsistent phase discrimination sensitivity across different phase ranges, as well as the “null-point” problem in continuous phase comparison methods. By performing a phase scan and applying phase compensation to the reflected signals before each vibration measurement, the sensitivity and reliability of radar vibration detection are enhanced. The effectiveness and stability of the radar proposed in this paper have been validated in vibration detection involving short distances and small displacements. The main contributions of this article are as follows:
- We establish a phase discrimination error model to simulate the characteristic of inconsistent sensitivity in the hardware phase comparator across different phase ranges, thereby providing a theoretical basis for selecting the optimal phase discrimination range for vibration detection.
- We propose a hardware-based phase comparison method for extracting target vibration information and a phase compensation scheme to enhance the sensitivity of vibration detection. The proposed method extracts the vibration amplitude and frequency information of the target from the phase discrimination output of a hardware phase comparator. The phase compensation scheme applies phase compensation to the reflected signals by adjusting the phase shifter before vibration detection, thereby mitigating the “null-point” problem and enhancing the sensitivity and reliability of the radar’s vibration detection results.
- We propose a low-complexity CW radar system for measuring vibration amplitude and frequency without relying on complex post-processing, and validate its effectiveness through loudspeaker vibration and experiments on human vital signs.
The rest of this paper is organized as follows. In Section 2, the principle of the hardware phase comparator is described, the non-strict consistency of the phase discrimination sensitivity in different intervals is explained by the developed phase discrimination error model, and a phase compensation scheme is proposed to optimize the linearity of the transfer function of the phase comparator. Section 3 presents the theory and basic structure of the proposed radar system. Three experiments are designed to verify the accuracy and stability of the proposed system for detecting tiny vibrations in Section 4. The conclusion is presented in Section 5.
2. Principle of Phase Detection
In this section, we introduce the proposed measurement method for vibration amplitude and frequency based on a hardware phase comparator. We derive the mathematical model used by this system for measuring vibration amplitude and frequency, establish a phase discrimination error model to simulate the inconsistent phase detection sensitivity of AD8302 across different operating ranges, and propose a hardware–software co-optimization scheme for phase detection sensitivity based on phase compensation.
2.1. The Features of the Hardware Phase Comparator AD8302
The hardware phase comparator (AD8302) is a broadband chip for measuring phase difference, including two precise matched broadband logarithmic amplifiers and a broadband phase detector [37]. The main parameters of the chip are illustrated in Table 1.
Table 1.
The parameters of phase comparator AD8302.
The phase measurement scaling factor R means that, when the phase difference between the two input signals of AD8302 changes by 1°, the output voltage changes by 10 mV in proportion. This is an important parameter which enables the proposed radar system to detect the vibration amplitude. In the proposed system, the phase differences between the transmitted and reflected signals can be converted into a voltage value by AD8302. The phase discrimination output of AD8302 is expressed in [37]:
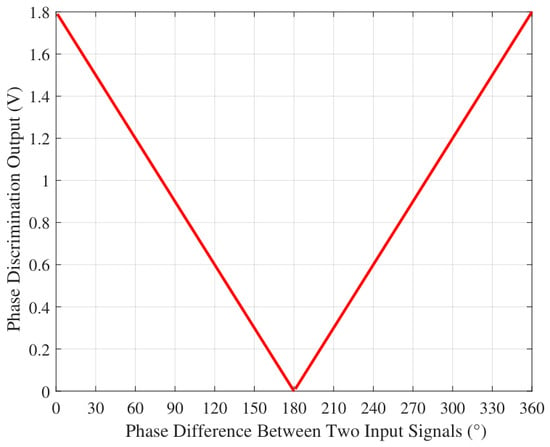
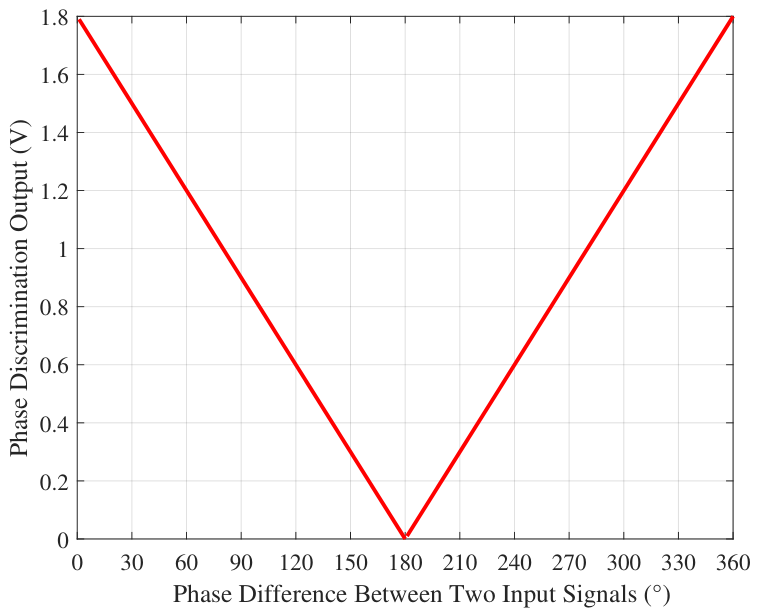
where and are the phase values of the two input signals, respectively. The ideal phase discrimination curve of AD8302 is shown in Figure 1, which shows that the phase difference between the two input signals is linearly related to the output voltage, and the phase scaling factor of AD8302 has a fixed absolute value of 10 mV/°.
Figure 1.
The ideal phase characteristic curve of AD8302.
2.2. The Phase Discrimination Error Model
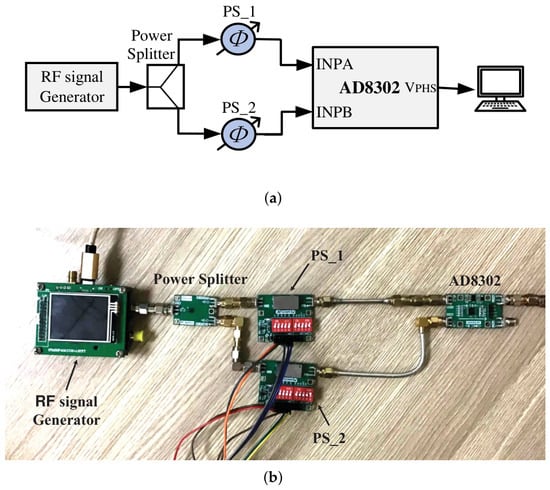
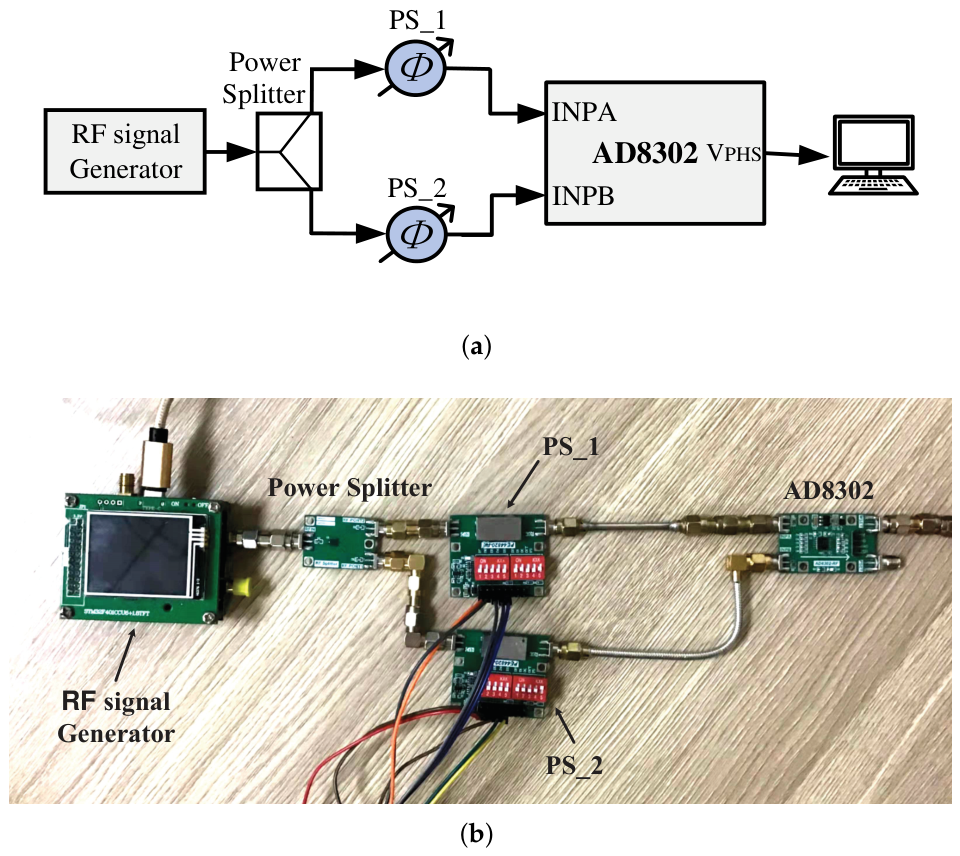
To verify whether the relationship is as linear in practice as it appears in Figure 1, a test system shown in Figure 2 is developed. In this system, a 2.4 GHz CW signal is generated and passes through phase shifters 1 (PS_1) and 2 (PS_2), respectively, and is then fed into AD8302 from ports INPA and INPB.
Figure 2.
Test setup for phase discrimination sensitivity of AD8302. (a) Block diagram. (b) Photograph of the test setup.
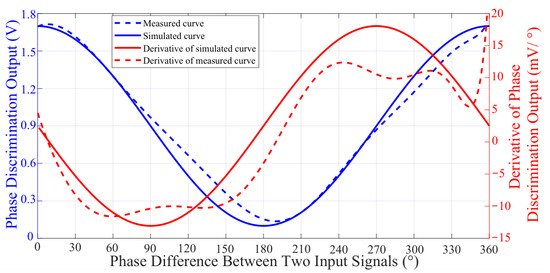
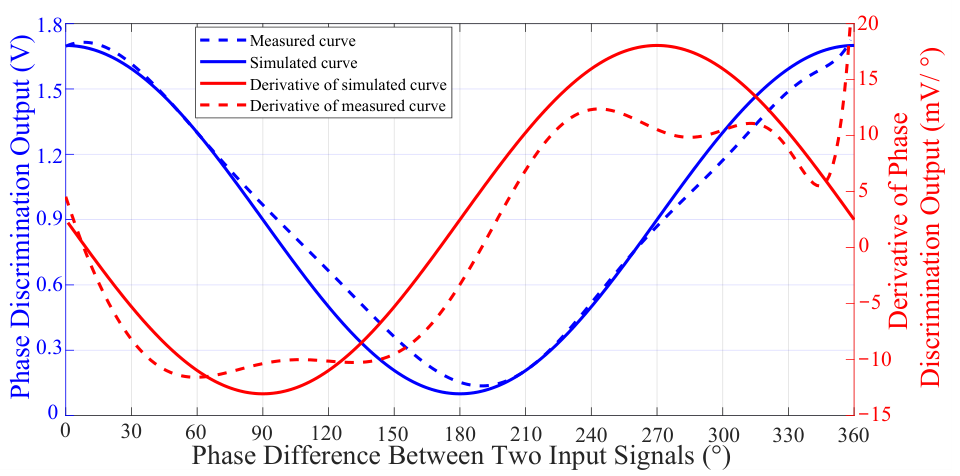
In order to obtain the actual phase discrimination curve of AD8302, PS_1 is adjusted to sweep from to while the value of PS_2 is fixed; meanwhile, the output voltage of AD8302 is recorded. The blue dashed line in Figure 3 shows the measured phase characteristic curve, where the actual characteristic curve is seen to be nonlinear. In order to study the trend of the output voltage with phase difference, the derivative of the measured phase characteristic curve is drawn and represented by a red dashed line. The phase measurement scaling factor R in Equation (1) can be represented by the derivative curve.
Figure 3.
The phase characteristic curve of AD8302 at the frequency of 2.4 GHz. Measured and simulated phase discrimination output curves and their derivative curves.
Additionally, the measured curve reveals that at phase differences close to and , the derivative value tends towards zero, which indicates that AD8302 exhibits a low sensitivity in phase difference around these values. Conversely, the scaling factor reaches a maximum at around . The actual phase characteristic curve obtained from the measurement deviates from the ideal linear relationship, as shown in Figure 1. Instead, it exhibits characteristics similar to a cosine function. Therefore, in order to approximately describe the input–output characteristics of the phase comparator, a behavioral-level model based on a first-order cosine function is proposed in this section and can be expressed as:
where is the frequency response characteristics of AD8302, is a phase reference, and is the DC offset. Equation (2) indicates the phase-dependent characteristics of the phase comparator in different phase intervals. Based on the measured phase-voltage values of the phase comparator shown in Figure 3, the nonlinear least squares fitting shown in Equation (3) was performed on Equation (2), yielding the following estimated parameter values at 2.4 GHz: V, °, and V.
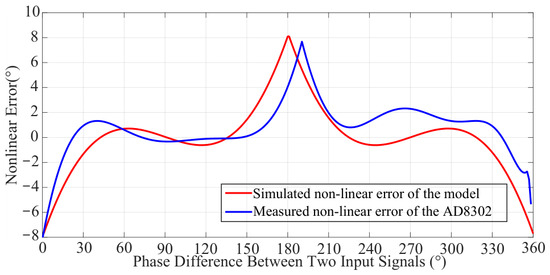
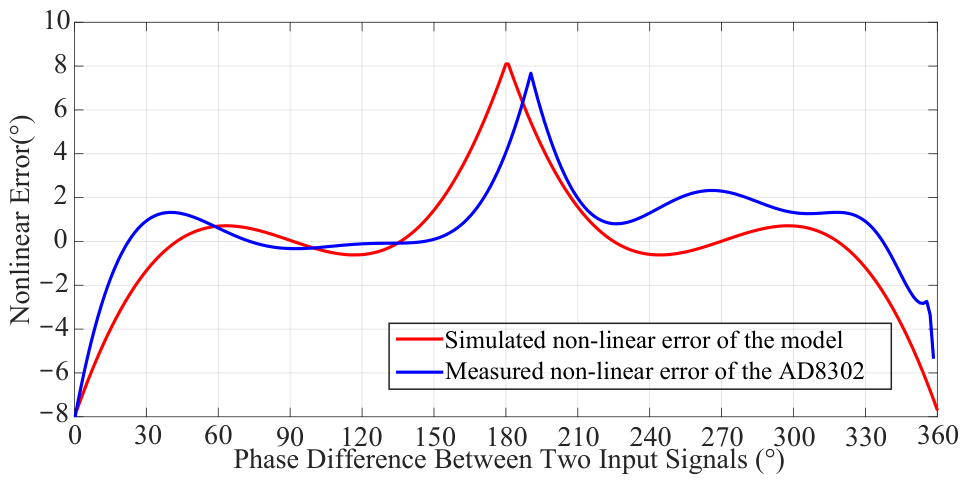
Figure 3 depicts the simulated curve of Equation (2) under the above parameters with a blue solid line and its derivative curve with a red solid line. It can be observed that the simulated curve exhibits similar characteristics to the measured curve. Within an acceptable margin of error, this simulated curve can be used as an approximation of the measured curve to characterize the input–output characteristics of the phase comparator. Based on these curves, the nonlinear error between the measured and simulated phase discrimination curves and the ideal phase discrimination curve can be extracted and plotted in Figure 4.
Figure 4.
Nonlinear error between the measured, simulated, and ideal curves at 2.4 GHz.
According to Figure 4, the nonlinear error of the simulated and measured curves is close to 0 within the range of 100∼. The same conclusion can be drawn from the derivative curve in Figure 3, where the phase difference is detected with the best sensitivity and linearity within the range of 100∼. This provides a theoretical basis for selecting 100∼ as the optimal phase detection range for subsequent phase compensation algorithms.
2.3. Principle of Vibration Amplitude Measurement Based on the Hardware Phase Comparator
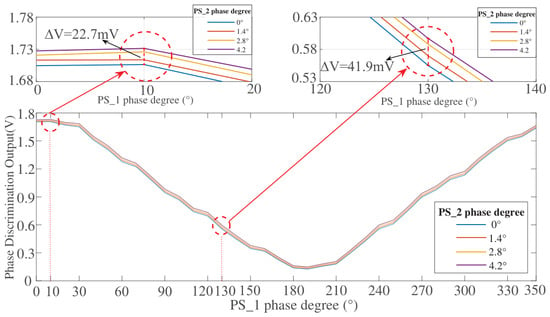
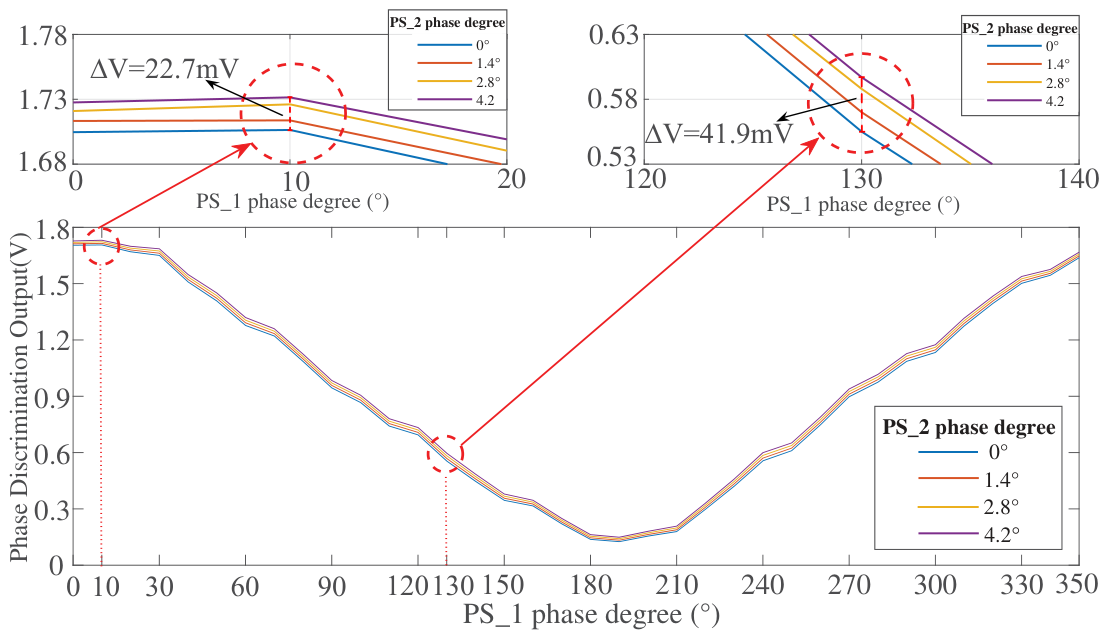
For vibration amplitude detection, another test is implemented to investigate the linear relationship between the phase change caused by the target vibration and the variation in the AD8302 output voltage. When detecting target vibrations, the tiny vibration will cause a small change in phase difference between the transmitted and reflected signals. To simulate this phase change, PS_2 (in Figure 2) is scanned from 0° to 4.2° in steps of 1.4° and is then reduced to 0° in the same step, while PS_1 is scanned from 0° to 360° in steps of 10°. When the phase value of PS_1 is at different degrees, the output voltages of AD8302 at 0°, 1.4°, 2.8°, and 4.2° for PS_2 are shown in Figure 5.
Figure 5.
AD8302 output voltage curve when PS_2 is at 0°, 1.4°, 2.8°, and 4.2° and PS_1 sweeps from 0° to 360°. The minimum voltage variation is 22.7 mV when the PS_1 degree is at 10° and the maximum voltage variation is 41.9 mV when the PS_1 degree is at 130°.
The phase change caused by vibrations is simulated using PS_2, and the corresponding maximum phase fluctuation is 4.2°. When the phase measurement scale factor R is 10 mV/° (as described in Section 2.1), the theoretical output voltage variation of AD8302 is expected to be 42 mV. It can be seen from Figure 5 that the minimum peak-to-peak value of phase discrimination output voltage is only 22.7 mV when the phase value of PS_1 is 10° and PS_2 is scanned from 0° to 4.2°. Meanwhile, when the phase value of PS_1 is 130°, the peak-to-peak value of the phase discrimination output reaches 41.9 mV, which approximately satisfies the theoretical voltage change of 42 mV. Measurement results indicate that when the phase difference between the transmitted and reflected signals is around 130° (falling within the optimal phase detection range of 100∼), the phase scanning factor reaches its maximum and nearly approaches the ideal value. This demonstrates that the phase comparator operating within this phase range exhibits the most accurate capability for measuring target vibrations.
Measuring the vibration amplitude based on AD8302 aims to establish a definite functional relationship between the phase discrimination output voltage and the vibration amplitude. When the transmitted signal from the radar is reflected by a vibrating target, the phase change of the reflected signal depends on the vibration amplitude of the target. The phase change caused by the vibration of the target can be expressed as:
where represents the vibration amplitude. Assuming the frequency of the CW signal is 2.4 GHz, the corresponding wavelength is 125 mm. According to Equation (4), if the detected target moves by 1 mm, the change in phase difference between the transmitted and reflected signals is . The relationship between the phase discrimination output voltage and the vibration amplitude can be expressed as:
changes with the phase difference, which exhibits the phase-dependent characteristics. Assuming the phase measurement scaling factor R is 10 mV/°, the variation in the output voltage should be 5.76° × 10 mV/° = 57.6 mV. With the above analysis, the vibration amplitude of the target can be obtained by inferring from the output of AD8302. The proposed radar system in Section 3 uses this relationship to detect with high accuracy the vibration amplitude.
2.4. The Phase Compensation Scheme
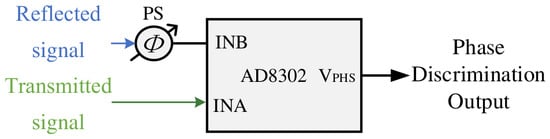
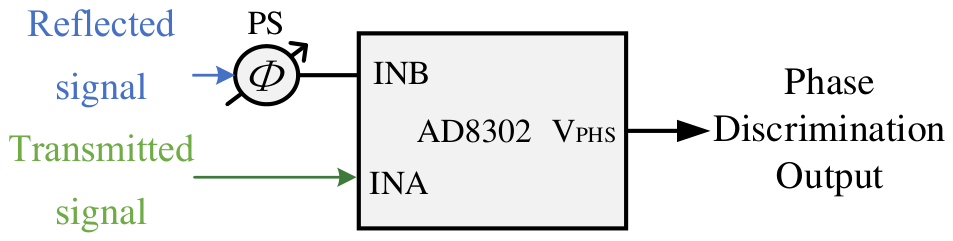
Since the operating frequency of the proposed CW radar system is 2.4 GHz, corresponding to a wavelength of approximately 125 mm, the small displacement of static targets (e.g., chest wall motion caused by respiration and heartbeats) is significantly smaller than the wavelength. As a result, under the small-displacement conditions considered in this work, the induced phase change generally remains within one cycle and phase wrapping does not normally occur. In this case, the intra-cycle phase change between the transmitted and received signals can accurately represent the target micro-movement. Therefore, to further enhance the precision of vibration measurement, based on the derived phase discrimination error model, this section proposes a phase compensation scheme to optimize the sensitivity and accuracy of the AD8302 phase detection. The objective of this scheme is to shift the initial phase difference between the reference and reflected signals into the interval where the phase discrimination sensitivity is high and locally stable, so that the scaling factor in Equation (5) can be approximated by a relatively stable value. To achieve this goal the reflected signal passes through a phase shifter before entering the AD8302 as shown in Figure 6.
Figure 6.
Hardware structure diagram of phase compensation scheme.
The after phase compensation can be expressed as Equation (6):
is the phase shift introduced by the phase shifter. In this work, a phase scan procedure is performed before each vibration measurement process to estimate the initial phase difference between the two inputs of AD8302. A compensation angle is then applied so that the operating point is moved to the selected optimal phase discrimination interval. During the subsequent vibration measurement, the phase shifter setting remains fixed.
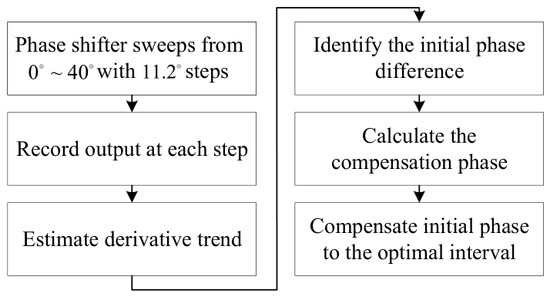
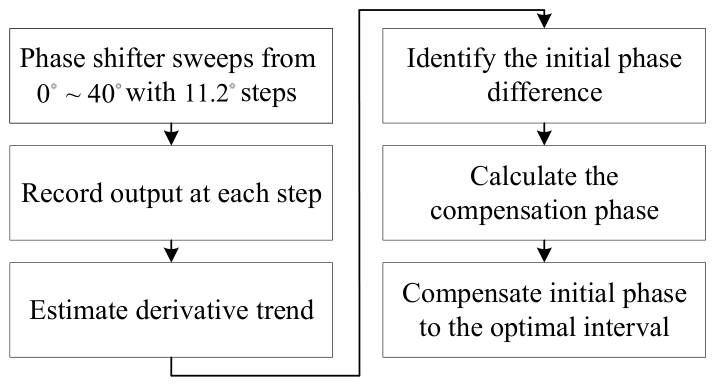
The proposed scheme mainly aims to solve two problems: to determine the initial phase difference between the two input signals caused by the fixed distance between the target and radar, and to shift this initial phase difference to the optimal phase discrimination interval for subsequent measurement of the target vibration amplitude and frequency. To solve both, the phase shifter is controlled by the MCU to perform a phase scan, during which the output of AD8302 is recorded. The initial phase difference is then identified from the output trend and its derivative, after which the compensation angle is calculated and applied through the phase shifter. The specific process of the phase compensation scheme described above is shown in Figure 7.
Figure 7.
Flowchart of the phase compensation scheme.
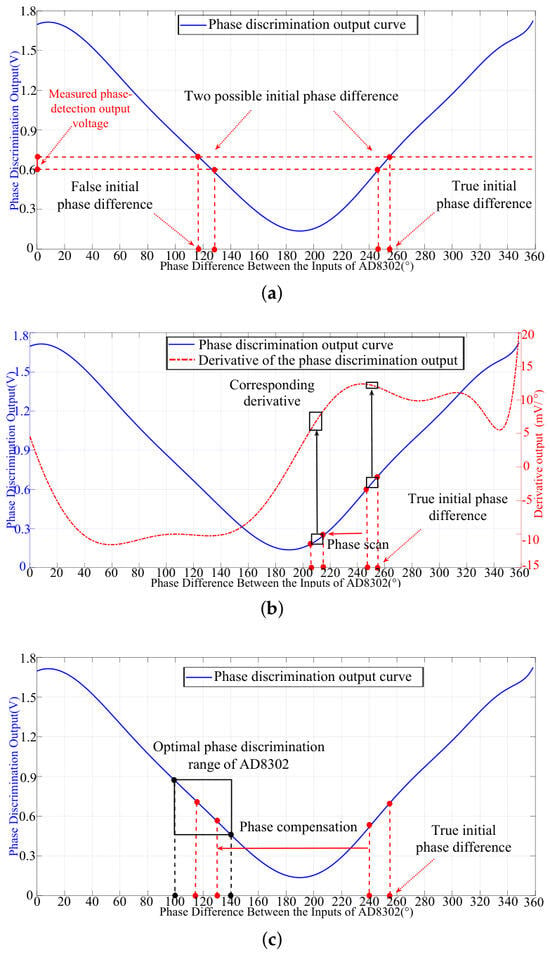
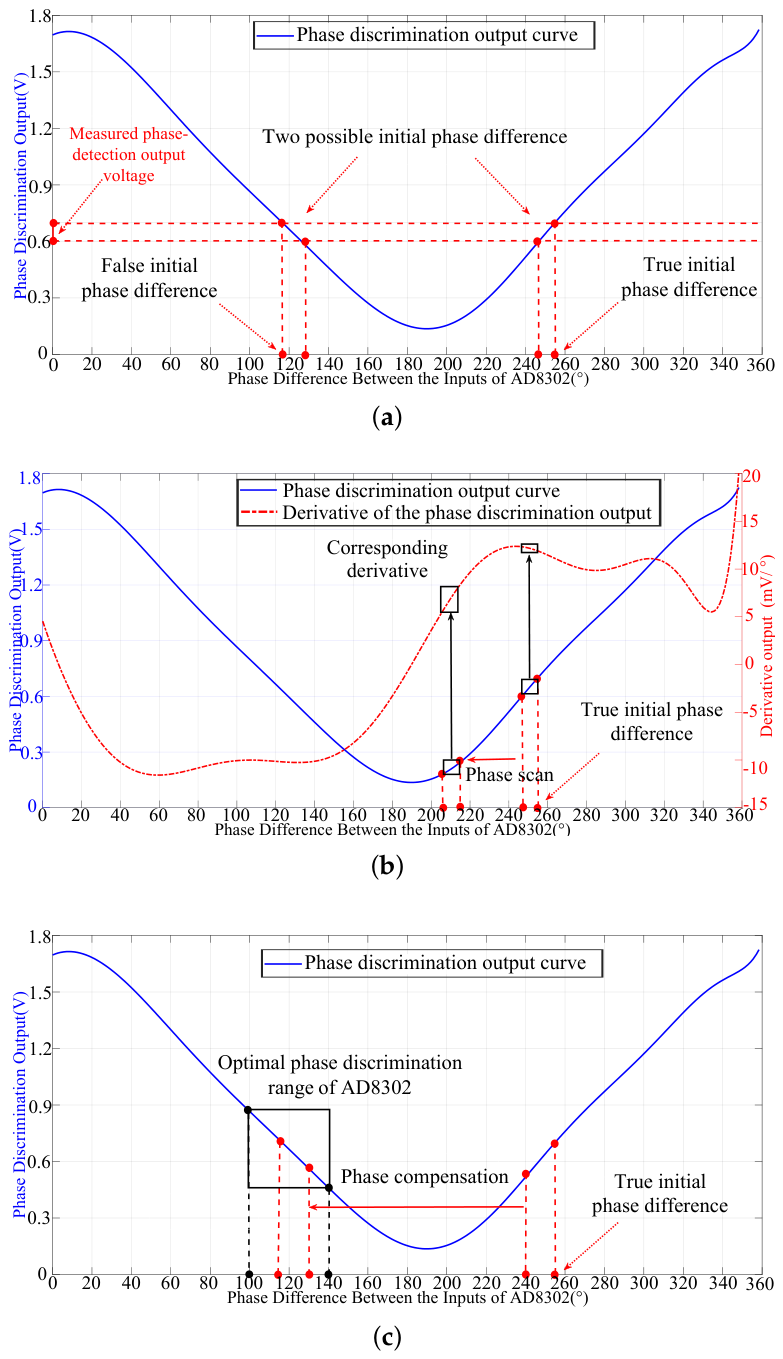
The diagram of the phase compensation scheme is shown in Figure 8.
Figure 8.
Diagram of the phase compensation scheme. (a) A single phase discrimination output corresponds to two possible initial phase differences. (b) The true initial phase difference is determined from the derivative of the phase discrimination output. (c) The initial phase difference is compensated for by the optimal phase discrimination interval.
As shown in Figure 8a, AD8302 maps the phase differences of 0∼ and 180∼ to a voltage range of 0∼1.8 V, where each voltage output corresponds to two possible phase differences between the two inputs. In order to determine the initial phase difference, as in Figure 8b, a phase scan from to ∼ with steps is performed by the phase shifter, during which the phase discrimination output is recorded. The derivative is then computed based on the output. To reduce the influence of noise, the derivative is determined from multiple sampled outputs. The initial phase difference is identified from the output and its derivative, after which the compensation angle is calculated and applied through the phase shifter. Finally, the initial phase difference is shifted by the phase shifter to the optimal operating interval of AD8302, as in Figure 8c. As concluded before, the optimal phase discrimination output can be obtained within this optimal operating interval. In this interval, the scale factor can be approximated by a locally stable constant as , and the relationship between the phase discrimination output and the vibration amplitude can be expressed as
3. Principle and Implementation of the Proposed Radar System
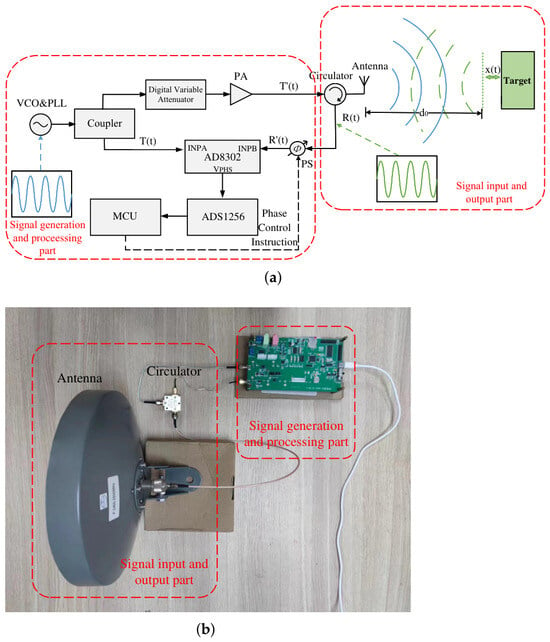
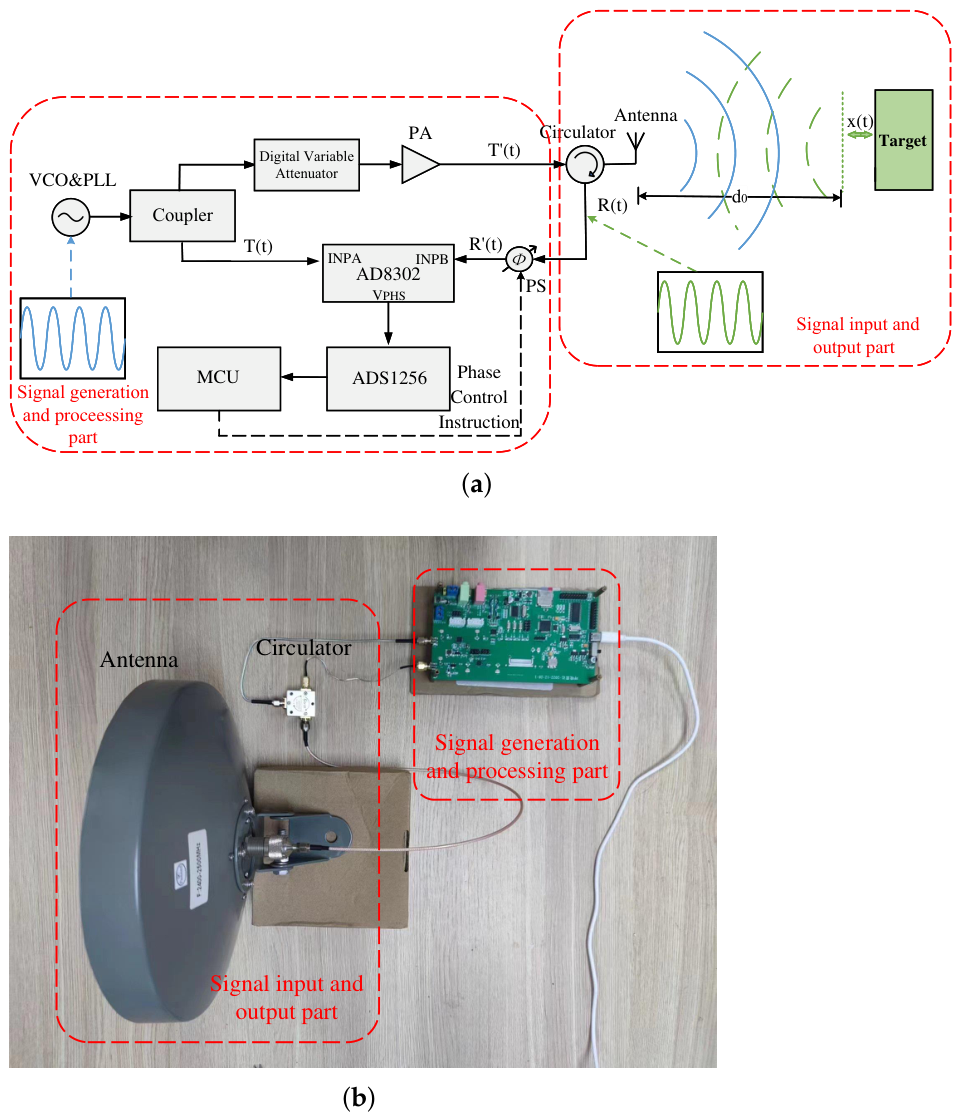
In order to detect small vibrations in a cost-effective and low-complexity manner, a CW system is proposed and illustrated in Figure 9.
Figure 9.
Setup for the proposed CW radar vibration detection system. (a) Block diagram. (b) Photograph of the radar system.
Figure 9a shows the setup of the proposed radar system, which mainly consists of an RF front-end and a signal generation and processing part. The RF front-end employs a horn antenna with high gain and directivity, with an operating frequency range of 2.4–2.5 GHz, which meets the corresponding range of the proposed radar system. The signal generation and processing parts are integrated on a self-developed signal processing board. Figure 9b shows the photograph of the radar system, and the sizes of the core modules are annotated. Under the practical operating scenario in this work, the average power consumption of the signal processing board was measured to be 0.715 W (5 V @ 0.143 A). A signal of 2.4 GHz is generated in the proposed CW radar system. The CW signal generated by the frequency source is divided into two paths through a power splitter: one path is amplified and transmitted through the antenna, while the other serves as the reference signal and is fed into the INPA port of the phase detector AD8302. The reflected signal induced by the vibrations of the target surface is received by the same antenna and subsequently subjected to phase compensation using a phase shifter before being applied to the INPB port of AD8302. Under the control of the MCU, the phase compensation performed by the phase shifter ensures that AD8302 operates within its optimal phase discrimination range, enabling accurate phase comparison. The phase discrimination output voltage from AD8302 is collected by the analog-to-digital converter ADS1256 and processed by the MCU to extract the target’s micro-vibration characteristics, including vibration frequency and amplitude. The INPA input reference signal and the transmitted signal are represented as
where is the phase delay caused by the transmission of the signal through the circuit. The transmitted signal from the antenna propagates towards and is subsequently reflected by the target, whereas the received signal and the signal after phase compensation are represented as
where represents the amplitude of the received signal, indicates the initial distance between the antenna and target, and denotes the vibration of the target over time. is the phase compensation produced by the phase shifter. Once the received signal is obtained, the phase compensation scheme implemented within the MCU adjusts the phase shifter to compensate for the original received signal .
4. Experimental Results
In this section, the proposed CW radar system is evaluated in terms of both detection accuracy and practical stability. Experiment in Section 4.1 validates the vibration amplitude detection capability of the system through measuring loudspeaker vibration, and Experiment in Section 4.2 verifies its frequency detection accuracy through human respiratory and heartbeat experiments. In addition, Experiment in Section 4.3 is conducted to evaluate the performance of the proposed radar under practical scenarios. Finally, the experimental results are analyzed and compared with related studies to further demonstrate the advantages of the proposed system.
4.1. Loudspeaker Vibration Experiment
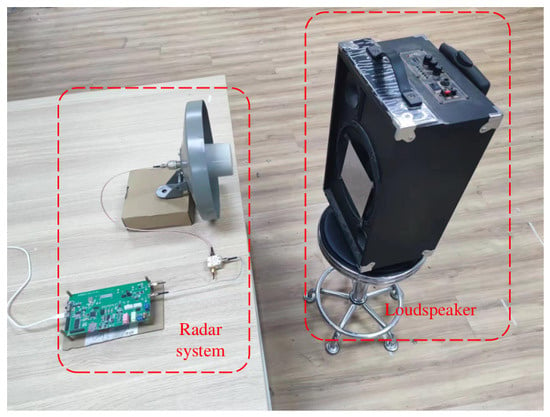
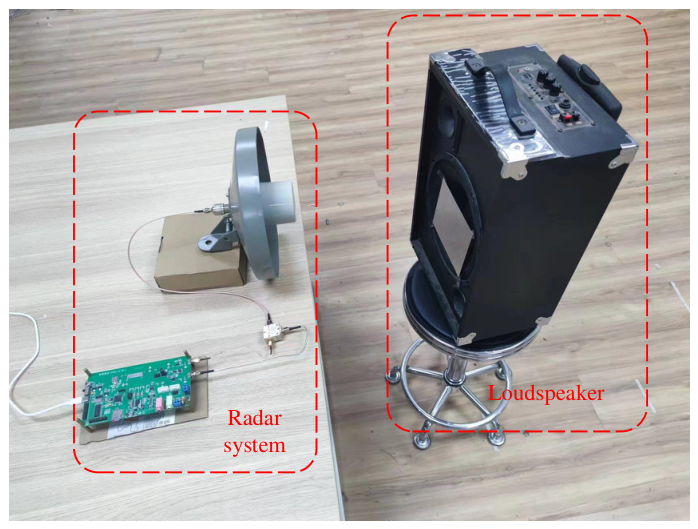
In this experiment, a loudspeaker is used as a target whose vibration is controlled by an audio signal source at a predetermined frequency and amplitude. The target, consisting of a modified loudspeaker and a flat tin foil plate, is referenced from [6]. By adjusting the audio signal source, the vibration frequency and amplitude of the loudspeaker can be controlled, thereby influencing the vibration characteristics of the tin foil surface. Figure 10 shows the experimental setup.
Figure 10.
Setup of the loudspeaker vibration experiment.
The proposed radar system is employed to measure the vibration amplitude and compare with reference values, and the system operates by transmitting a 2.4 GHz CW signal. To evaluate the accuracy of the proposed system in measuring vibration amplitude, professional laser vibration detection equipment (BL30NML from BOJKE Technology, Dongguan City, China) is also utilized to measure the vibration amplitude of the loudspeaker. The measurement results of the vibration amplitude are shown in Table 2.
Table 2.
Vibration amplitude measurement results of the loudspeaker at different target distances using the proposed radar system.
The reference value measured by the laser displacement sensor was 1.160 mm. To improve the reliability of the vibration amplitude measurements obtained by the proposed radar system, 10 repeated measurements were performed at each target distance, and the corresponding results are presented in Table 2. With the gradual increase in distance between the target and radar, the decrease in effective radar cross-section (RCS) contribution of the target, and the increase in free-space propagation loss, the detection accuracy of the target’s vibration amplitude gradually decreases. When the distance is less than 1 m, the vibration amplitude measurement accuracy remains above 95.1%. For distances less than 1.8 m, the accuracy is above 90.3%. The results demonstrate that the proposed CW radar system is capable of measuring vibration amplitude, particularly in short-distance scenarios or applications where extremely high-amplitude measurement precision is not required.
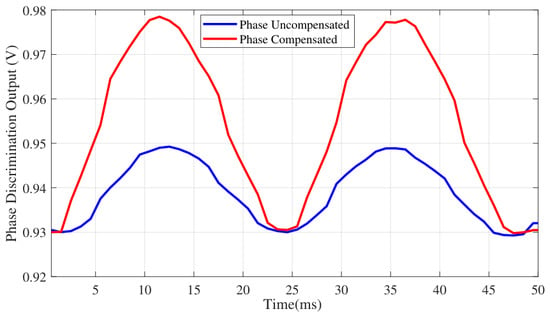
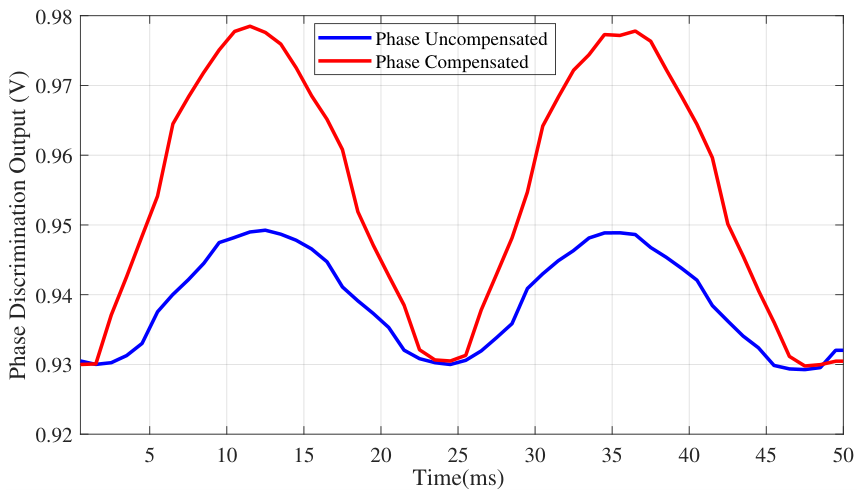
To evaluate the performance of the proposed phase compensation scheme in Section 2.4 in enhancing the phase detection sensitivity of AD8302, a sine wave signal with a frequency of 40 Hz is generated from the audio source, causing the tin foil surface to vibrate at the same frequency. Measurement results of the phase comparator output voltage with and without phase compensation are shown in Figure 11.
Figure 11.
Phase discrimination output voltage of AD8302 with and without phase compensation.
It is evident from the results that compensating the phase difference between the two input signals leads to a higher peak-to-peak value for the phase discrimination output under the same vibration conditions. Compared with the uncompensated phase discrimination output voltage, which exhibits a peak-to-peak value of approximately 20 mV, the phase-compensated output increases to around 50 mV, significantly enhancing the capability of the proposed CW radar system to detect small vibrations.
4.2. Experiment on Human Vital Signs
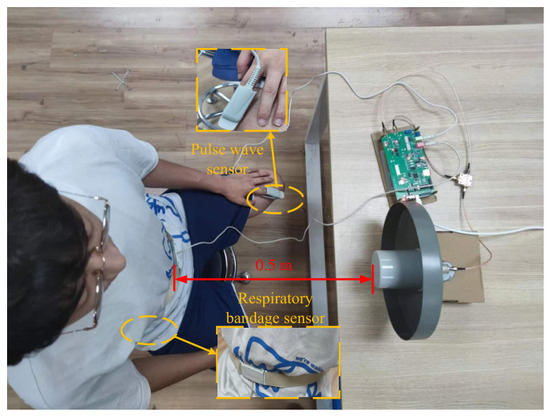
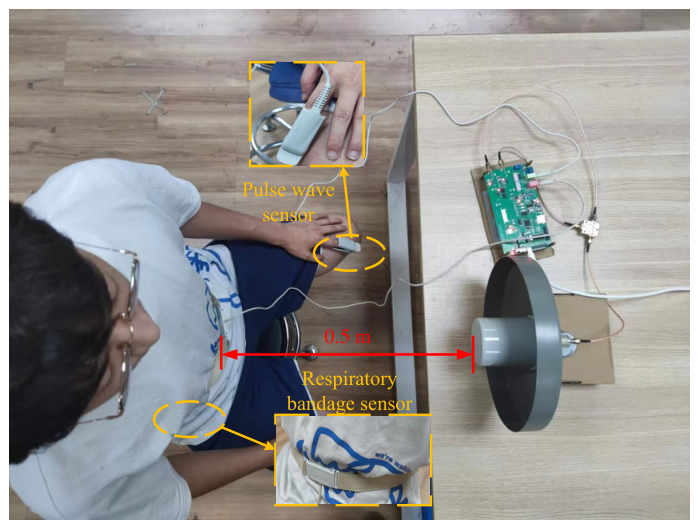
To evaluate the accuracy of the proposed radar system in measuring vibration frequency, Experiment in Section 4.2 was conducted, which involved detecting human respiration and heartbeats using the radar system and comparing with wearable sensors. The respiratory bandage sensor and pulse wave sensor were used as standard values. The experimental setup is depicted in Figure 12.
Figure 12.
Setup of experiment on human vital signs.
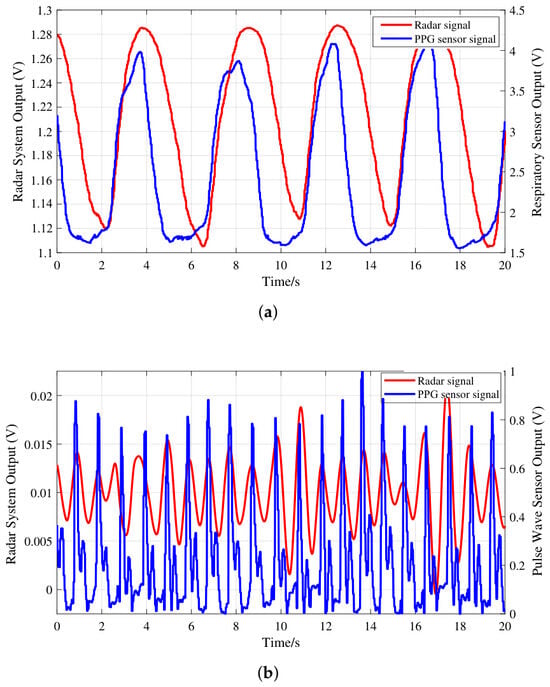
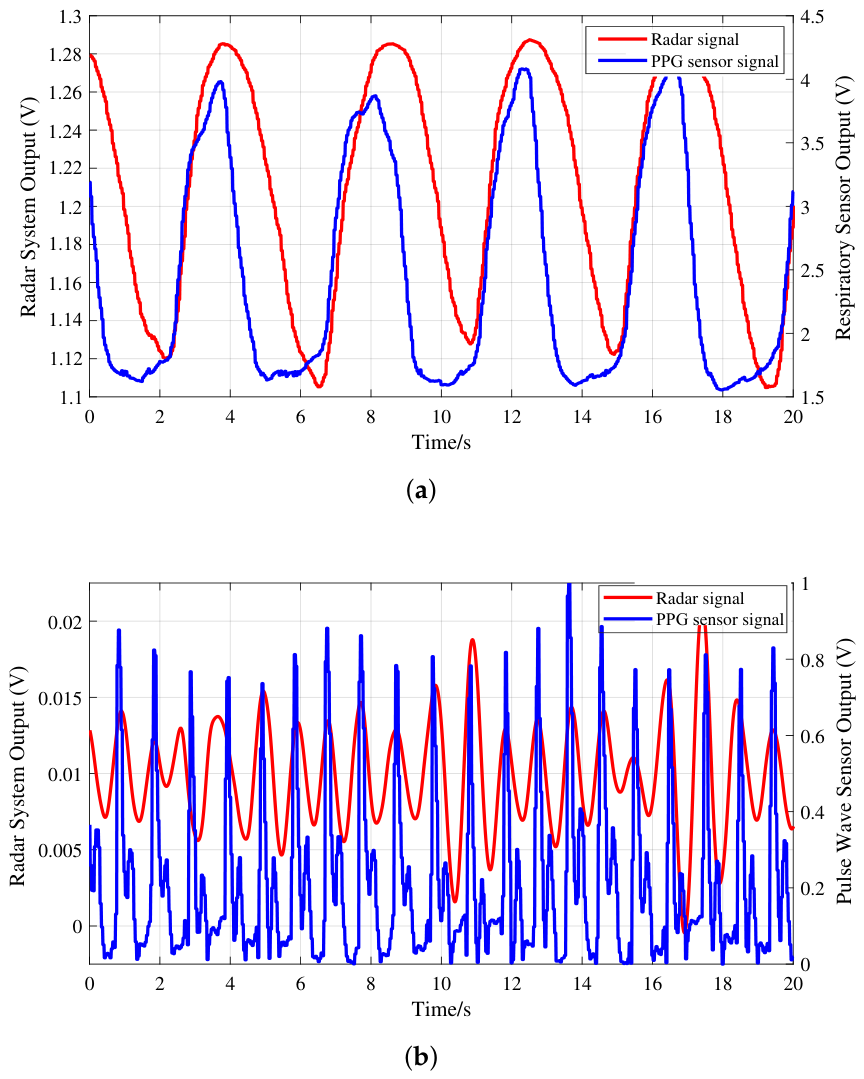
In this experiment, the target’s body remained stationary, and the target maintained natural breathing throughout. The distance between the target and antenna was 0.5 m. The proposed radar system monitored the chest movements of the targets, including their respiratory and heartbeat rates, and the measurement process for each target lasted for 20 s. Additionally, as shown in Figure 12, the target wore a respiratory bandage sensor on the abdomen and a pulse wave sensor on the left hand. The proposed radar system was employed to conduct a series of experiments on monitoring vital signs. The red line in Figure 13a illustrates the raw radar signal collected over a duration of 20 s, including the respiratory signal and heartbeat signal, with the latter being weaker than the former. For comparison, the blue line in Figure 13a represents the data obtained using the respiratory bandage sensor as the standard reference value. Since the respiratory signal detected by the radar system is much stronger than the heartbeat signal and noise, the fluctuation in the measured raw signal can directly represent the respiratory activity. However, the heartbeat signal is relatively weak and easily influenced by respiratory harmonics during detection, so bandpass filtering is performed to obtain the heartbeat signal from the raw signals. The passband is set according to the normal person’s heartbeat rate, which is usually 60∼100 bpm. The red line in Figure 13b represents the extracted heartbeat signal, while the blue line represents the signal obtained from the pulse wave sensor, providing a reference value of the heartbeat signal for comparison. According to the comparison results, the heart rate extracted by the radar and that obtained by the sensor are basically the same.
Figure 13.
Results of measuring vital signs of volunteer A. Comparison of (a) respiratory signals obtained with radar and sensor, and (b) heartbeat signal obtained with radar and sensor.
Experiments were carried out on four volunteers to further evaluate the performance of the radar system in vibration frequency detection. Each volunteer completed three independent trials under the same experimental setup as shown in Figure 12, and the corresponding results are summarized in Table 3.
Table 3.
Results of detecting vital signs for different volunteers using the proposed CW system.
It can be concluded that the CW radar system achieved a respiratory detection accuracy of 96.34% and a heartbeat detection accuracy of 98.02%. These results indicate that the proposed CW radar system can accurately detect both respiratory and heartbeat frequencies under the tested conditions.
4.3. System Stability Experiment
To evaluate the stability of the radar system proposed in this paper in practical scenarios, two supplementary experiments were designed and are illustrated in this section.
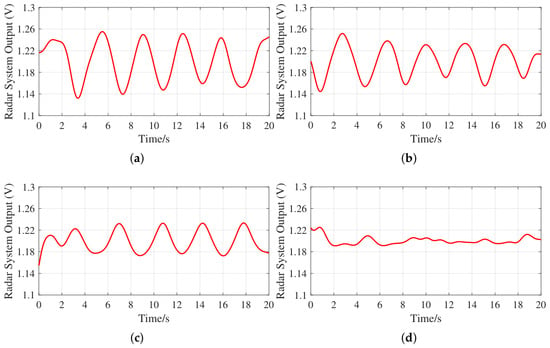
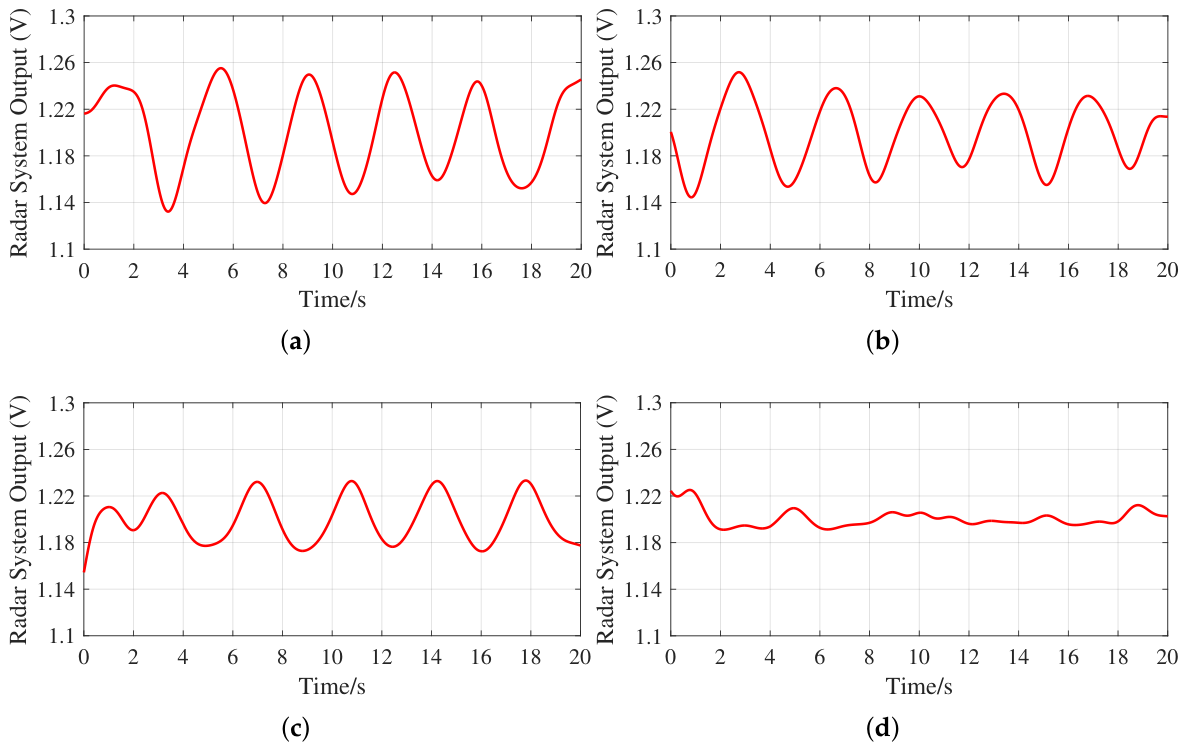
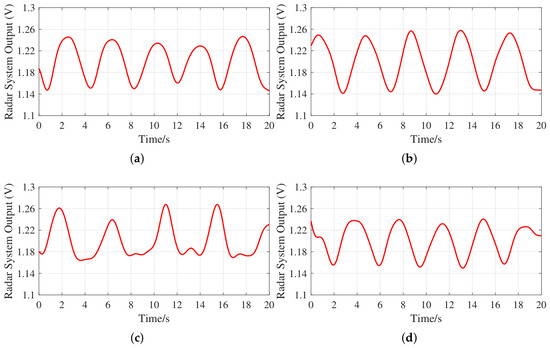
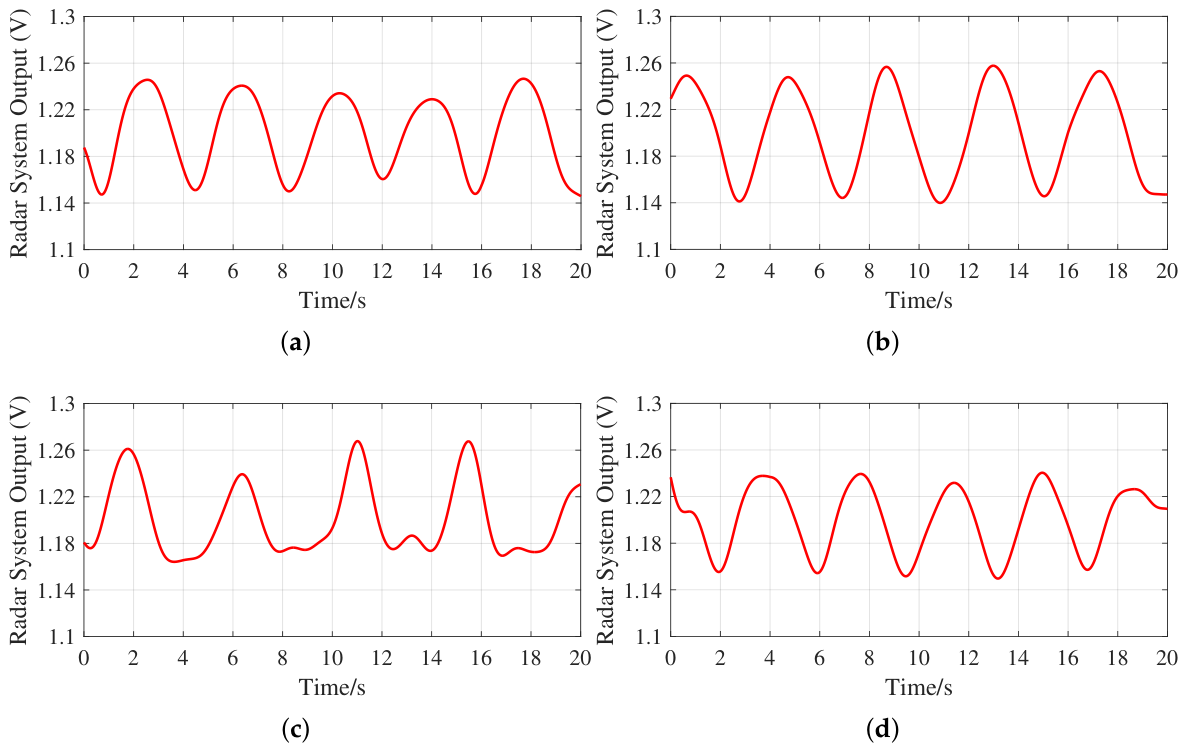
In practical applications, the reflected signal received by the radar is typically weak, resulting in an amplitude imbalance between the reference and reflected signals at the input of the phase comparator. The aim is to evaluate the impact of this phenomenon on the measurement performance of the radar system proposed in this paper. In the first experiment, human respiration measurements were conducted under varying amplitude differences between the transmitted and received signals. The experimental setup is illustrated in Figure 12. During the experiment, the distance between the subject and the radar, as well as the radar transmission power, was kept constant. The measured power of the reference signal at the INPA port of the phase comparator was −18.96 dBm. Due to link loss and free-space propagation loss, the initial received signal power at the INPB port was measured at −28.18 dBm. By introducing an adjustable attenuator into the receive path to attenuate the received signal by 0, 4, 10, and 15 dB in turn, the respiratory measurement curves under different transmit–receive signal amplitude differences were obtained, as shown in Figure 14.
Figure 14.
Respiratory measurement results under conditions of transmit–receive signal amplitude imbalance. The power of the reference signal remains constant at −18.96 dBm. Received signal power of (a) −28.18 dBm, (b) −32.18 dBm, (c) −38.18 dBm, and (d) −43.18 dBm.
The experimental result shows that when the reference signal power is fixed at −18.96 dBm, as the received signal power gradually reduces from −28.18 to −43.18 dBm, the amplitude of the system’s output respiratory waveform gradually decreases and its periodicity gradually weakens. When the received signal power is −28.18 and −32.18 dBm, the respiratory waveform still exhibits a relatively clear periodic structure; when the received signal power drops to −38.18 dBm, the amplitude of the waveform decreases significantly, but the respiratory rhythm still remains discernible; and when the received signal power is further reduced to −43.18 dBm, the output curve becomes nearly flat, and it becomes difficult to extract the respiratory periodicity. These results demonstrate that the system proposed in this paper retains a certain degree of robustness under conditions of weak echoes and moderate amplitude imbalance between transmitted and received signals. However, as the target reflected signal power decreases further, its detection performance may be affected.
A further anti-interference experiment was conducted to evaluate the anti-interference performance of the proposed radar system in real environments. Four representative scenarios were set up for this experiment: Figure 15a: a static scenario, used as a reference baseline; Figure 15b: a scenario involving people moving in the vicinity, to simulate dynamic noise interference introduced by external human movement; Figure 15c: a scenario involving the subject’s own limb movements, to simulate the impact of the subject’s own additional movements on respiration measurement; and Figure 15d: a scenario where the subject wears Bluetooth headphones. As both Bluetooth devices and the radar in this study operate in the 2.4 GHz band, the last scenario is used to investigate the impact of co-channel wireless devices on the system’s detection performance. In this experiment, the radar transmission and reception conditions, as well as the distance between the subject and radar, were kept constant. The system’s respiratory measurement results under different scenarios are shown in Figure 15.
Figure 15.
Respiration measurement results under different interference scenarios. (a) Static scenario. (b) Scenario involving people moving in the vicinity. (c) Scenario involving the subject’s own limb movements. (d) Scenario where the subject wears Bluetooth headphones (operating frequency band of 2.4 GHz).
As shown in Figure 15, the system was able to produce respiratory measurement curves with a certain degree of periodicity under all four interference scenarios. In both static scenarios and when people were moving around in the vicinity, the output waveforms maintained good periodicity, indicating that the system is not sensitive to dynamic interference caused by the movements of people around the subject. When the subject moved their limbs, the waveform exhibited noticeable disturbances and local distortions, indicating that the subject’s own movements will affect the system’s respiratory measurements. When the subject wore Bluetooth headphones, the output waveform showed little distortion. This indicates that, under the experimental conditions, the radiation signals from Bluetooth devices operating at the same frequency do not interfere with the reference signal, and therefore do not affect the respiration measurement results of the radar system. Overall, the system in this study maintains a stable level of vibration detection capability in typical indoor interference scenarios, demonstrating good environmental adaptability.
4.4. Analysis of Results
We also compared the system proposed in this paper with some other FMCW and CW systems used for vibration detection and vital-sign monitoring, and the results are shown in Table 4.
Table 4.
Table of comparison with other works.
First, unlike some software-based demodulation methods such as FFT with peak search [20], empirical mode decomposition [19], Hilbert vibrational decomposition [18], or other advanced optimization frameworks including SSA-CEEMDAN [21] and the two-wave model [22], the proposed radar relies on a hardware-based phase comparison method. This avoids complex post-processing after signal acquisition, thereby reducing the complexity of system implementation. Second, the integration of a tunable phase shifter and the proposed phase compensation scheme effectively mitigates the “null-point” problem and avoids phase wrapping under the short-range and small-displacement conditions investigated in this work. Third, while maintaining a computational complexity lower than those of other methods, the system maintains a vibration amplitude detection accuracy above 90.3% in short-range scenarios (within 1.8 m), with a respiratory accuracy of 96.34% and heart rate accuracy of 98.02%. Overall, the results confirm that the proposed CW radar system provides a favorable balance between accuracy, sensitivity, and hardware complexity, indicating its potential for vibration detection applications such as short-range physiological monitoring and small-scale structural vibration measurement.
5. Conclusions
In this paper, a low-complexity CW radar system for detecting short-range, small-displacement, and single-target noncontact vibration is proposed. Unlike many existing methods for detecting CW radar vibration, which mainly extract vibration information through software-side phase demodulation and subsequent processing after signal acquisition, the proposed system adopts a hardware-based phase comparison method. Conventional methods often rely on arctangent demodulation, phase unwrapping, and related post-processing, which may increase processing complexity and make the measurement more sensitive to channel mismatch, DC offsets, and phase-null regions. By comparison, the proposed radar in this study directly extracts vibration information from the output of a hardware phase comparator, thereby simplifying the demodulation process. Furthermore, by modeling the input–output characteristic of the phase comparator, a phase discrimination error model is established, and a phase compensation scheme is proposed accordingly to keep the comparator operating in the optimal phase discrimination interval. As a result, the sensitivity and accuracy of the radar vibration detection under short-range, small-displacement conditions are improved. Experimental results show that the system can effectively detect the target’s vibration amplitude within a range of 2 m, with an absolute vibration amplitude error of less than 0.057 mm within 1 m and less than 0.135 mm within 2 m. In detecting vital signs at a distance of 50 cm, the system achieves 96.34% and 98.02% accuracies in respiration rate and heart rate, respectively.
Author Contributions
Conceptualization, C.W. and Y.W.; methodology, C.W. and Y.W.; validation, C.W., Y.W., X.W., J.S. and Z.J.; formal analysis, C.W., Y.W., P.D. and Y.C.; investigation, Y.W.; resources, C.W. and Y.W.; data curation, Y.W., X.W., J.S. and Z.J.; writing—original draft preparation, Y.W.; writing—review and editing, C.W. and Y.W.; visualization, Y.W. All authors have read and agreed to the published version of the manuscript.
Funding
This research received no external funding.
Institutional Review Board Statement
The study was conducted in accordance with the Declaration of Helsinki, and approved by the Zhengzhou University Institutional Review Board.
Informed Consent Statement
Informed consent was obtained from all subjects involved in the study.
Data Availability Statement
Data are contained within the article.
Conflicts of Interest
The authors declare no conflicts of interest.
References
- Giri, P.; Kharkovsky, S. Detection of surface crack in concrete using measurement technique with laser displacement sensor. IEEE Trans. Instrum. Meas. 2016, 65, 1951–1953. [Google Scholar] [CrossRef] [Scilit]
- Cao, S.; Kajiwara, I.; Li, X.; Hosoya, N. Structural health monitoring based on laser excitation vibration test and wavelet transform. In Proceedings of the 2017 Eleventh International Conference on Sensing Technology (ICST), Sydney, NSW, Australia, 4–6 December 2017; IEEE: Piscataway, NJ, USA, 2017; pp. 1–6. [Google Scholar]
- Perrone, G.; Vallan, A. A low-cost optical sensor for noncontact vibration measurements. IEEE Trans. Instrum. Meas. 2008, 58, 1650–1656. [Google Scholar] [CrossRef] [Scilit]
- Villarroel, M.; Guazzi, A.; Jorge, J.; Davis, S.; Watkinson, P.; Green, G.; Simpson, P.J.C.; Tarassenko, L. Continuous non-contact vital sign monitoring in neonatal intensive care unit. Healthc. Technol. Lett. 2014, 1, 87–91. [Google Scholar] [CrossRef] [Scilit] [PubMed]
- Alkali, A.H.; Saatchi, R.; Elphick, H.; Burke, D. Thermal image processing for real-time non-contact respiration rate monitoring. IET Circuits Devices Syst. 2017, 11, 142–148. [Google Scholar] [CrossRef] [Scilit]
- Wang, J.; Wang, X.; Chen, L.; Huangfu, J.; Li, C.; Ran, L. Noncontact distance and amplitude-independent vibration measurement based on an extended DACM algorithm. IEEE Trans. Instrum. Meas. 2014, 63, 145–153. [Google Scholar] [CrossRef] [Scilit]
- Kim, S.; Nguyen, C. On the development of a multifunction millimeter-wave sensor for displacement sensing and low-velocity measurement. IEEE Trans. Microw. Theory Tech. 2004, 52, 2503–2512. [Google Scholar] [CrossRef]
- Li, C.; Peng, Z.; Huang, T.-Y.; Fan, T.; Wang, F.-K.; Horng, T.-S.; Muñoz-Ferreras, J.-M.; Gómez-García, R.; Ran, L.; Lin, J. A review on recent progress of portable short-range noncontact microwave radar systems. IEEE Trans. Microw. Theory Tech. 2017, 65, 1692–1706. [Google Scholar] [CrossRef] [Scilit]
- Castellini, P.; Revel, G.M.; Tomasini, E.P. Laser doppler vibrometry. In An Introduction to Optoelectronic Sensors; World Scientific: Singapore, 2009; pp. 216–229. [Google Scholar]
- Feng, D.; Feng, M.Q.; Ozer, E.; Fukuda, Y. A vision-based sensor for noncontact structural displacement measurement. Sensors 2015, 15, 16557–16575. [Google Scholar] [CrossRef] [Scilit]
- Fukuda, Y.; Feng, M.Q.; Narita, Y.; Kaneko, S.I.; Tanaka, T. Vision-based displacement sensor for monitoring dynamic response using robust object search algorithm. IEEE Sens. J. 2013, 13, 4725–4732. [Google Scholar] [CrossRef] [Scilit]
- Rice, J.A.; Li, C.; Gu, C.; Hernandez, J.C. A wireless multifunctional radar-based displacement sensor for structural health monitoring. In Proceedings of the Sensors and Smart Structures Technologies for Civil, Mechanical, and Aerospace Systems 2011, San Diego, CA, USA, 7–10 March 2011; SPIE: Bellingham, WA, USA, 2011; Volume 7981, pp. 185–195. [Google Scholar]
- Guan, S.; Rice, J.A.; Li, C.; Li, Y.; Wang, G. Structural displacement measurements using DC coupled radar with active transponder. Struct. Control Health Monit. 2017, 24, e1909. [Google Scholar] [CrossRef] [Scilit]
- Rodrigues, D.V.; Zuo, D.; Tang, Z.; Wang, J.; Gu, C.; Li, C. Adaptive displacement calibration strategies for field structural health monitoring based on Doppler radars. IEEE Trans. Instrum. Meas. 2020, 69, 7813–7824. [Google Scholar] [CrossRef] [Scilit]
- Rice, J.A.; Gu, C.; Li, C.; Guan, S. A radar-based sensor network for bridge displacement measurements. In Proceedings of the Sensors and Smart Structures Technologies for Civil, Mechanical, and Aerospace Systems 2012, San Diego, CA, USA, 11–15 March 2012; SPIE: Bellingham, WA, USA, 2012; Volume 8345, pp. 157–166. [Google Scholar]
- Castellano, A.; Fraddosio, A.; Martorano, F.; Mininno, G.; Paparella, F.; Piccioni, M.D. Structural health monitoring of a historic masonry bell tower by radar interferometric measurements. In Proceedings of the 2018 IEEE Workshop on Environmental, Energy, and Structural Monitoring Systems (EESMS), Salerno, Italy, 21–22 June 2018; IEEE: Piscataway, NJ, USA, 2018; pp. 1–6. [Google Scholar]
- Gu, C.; Peng, Z.; Li, C. High-precision motion detection using low-complexity Doppler radar with digital post-distortion technique. IEEE Trans. Microw. Theory Tech. 2016, 64, 961–971. [Google Scholar] [CrossRef] [Scilit]
- Chauhan, S.S.; Basu, A.; Abegaonkar, M.P.; Koul, S.K. Through the wall human subject localization and respiration rate detection using multichannel Doppler radar. IEEE Sens. J. 2021, 21, 1510–1518. [Google Scholar]
- Park, J.-E.; Lee, G.-H.; Lee, I.-S.; Yang, J.-R. Heart rate extraction technique with mitigation of respiration harmonic for bio-radar sensors. IEEE Sens. J. 2024, 24, 7149–7159. [Google Scholar] [CrossRef] [Scilit]
- Huan, C.; Kontou, P.; Smida, S.B.; Anagnostou, D.E. Dual-band CW radar system for vital signs detection with interference cancellation method. IEEE Trans. Microw. Theory Tech. 2024, 72, 4966–4979. [Google Scholar] [CrossRef] [Scilit]
- Wang, Y.; Liu, H.; Xiang, W.; Shui, Y.; Guo, L.; Zhou, M.; Pang, Y. A novel non-contact respiration and heartbeat detection method using frequency-modulated continuous wave radar. IEEE Sens. J. 2024, 24, 10434–10446. [Google Scholar] [CrossRef] [Scilit]
- Ko, M.M.; Moriyama, T. Noncontact monitoring of respiration and heartbeat based on two-wave model using a millimeter-wave MIMO FM-CW radar. Electronics 2024, 13, 4308. [Google Scholar] [CrossRef] [Scilit]
- Jeong, J.M.; Bae, H.S.; Lee, H.J.; Lee, J.G. Range enhancement of a 60 GHz FMCW heart rate radar using Fabry–Perot cavity antenna. Electronics 2025, 14, 4014. [Google Scholar] [CrossRef] [Scilit]
- Alizadeh, M.; Shaker, G.; De Almeida, J.C.M.; Morita, P.P.; Safavi-Naeini, S. Remote monitoring of human vital signs using mm-wave FMCW radar. IEEE Access 2019, 7, 54958–54968. [Google Scholar] [CrossRef] [Scilit]
- Yang, S.; Liang, X.; Dang, X.; Jiang, N.; Cao, J.; Zeng, Z.; Li, Y. Random body movement removal using adaptive motion artifact filtering in mmWave radar-based neonatal heartbeat sensing. Electronics 2024, 13, 1471. [Google Scholar] [CrossRef] [Scilit]
- Li, W.; Jiang, J.; Yao, Y.; Liu, D.; Gao, Y.; Li, Q. Hand character gesture recognition based on a single millimetre-wave radar chip. IET Radar Sonar Navig. 2022, 16, 208–223. [Google Scholar] [CrossRef] [Scilit]
- Mimouna, A.; Khalifa, A.B.; Alouani, I.; Amara, N.E.B.; Rivenq, A.; Taleb-Ahmed, A. Entropy-based ultra-wide band radar signals segmentation for multi obstacle detection. IEEE Sens. J. 2021, 21, 8142–8149. [Google Scholar] [CrossRef] [Scilit]
- Duan, Z.; Liang, J. Non-contact detection of vital signs using a UWB radar sensor. IEEE Access 2019, 7, 36888–36895. [Google Scholar] [CrossRef] [Scilit]
- Kumar, A.; Liang, Q.; Li, Z.; Zhang, B.; Wu, X. Experimental study of through-wall human being detection using ultra-wideband (UWB) radar. In 2012 IEEE Globecom Workshops; IEEE: Piscataway, NJ, USA, 2012; pp. 1455–1459. [Google Scholar]
- Liu, L.; Xie, H.; Liu, Z.; Bagtzoglou, A.; Barrowes, B.; Vincitore, A.M. Numerical simulation of UWB impulse radar vital signal detection at an earthquake disaster site. In Proceedings of the 1st International Conference on Wireless Technologies for Humanitarian Relief, Amritapuri, India, 18–21 December 2011; Association for Computing Machinery: New York, NY, USA, 2011; pp. 278–281. [Google Scholar]
- Yin, Y.; Yu, X.; Lv, H.; Liu, M.; Qi, F.; Wang, J. Micro-vibration distinguishment between humans and animals based on ensemble empirical mode decomposition using ultra-wide band radar. J. Eng. 2019, 2019, 7469–7472. [Google Scholar] [CrossRef] [Scilit]
- Li, C.; Lubecke, V.M.; Boric-Lubecke, O.; Lin, J. A review on recent advances in Doppler radar sensors for noncontact healthcare monitoring. IEEE Trans. Microw. Theory Tech. 2013, 61, 2046–2060. [Google Scholar] [CrossRef] [Scilit]
- Li, C.; Xiao, Y.; Lin, J. Experiment and spectral analysis of a low-power Ka-band heartbeat detector measuring from four sides of a human body. IEEE Trans. Microw. Theory Tech. 2006, 54, 4464–4471. [Google Scholar] [CrossRef] [Scilit]
- Gu, C.; Li, C.; Lin, J.; Long, J.; Huangfu, J.; Ran, L. Instrument-based noncontact Doppler radar vital sign detection system using heterodyne digital quadrature demodulation architecture. IEEE Trans. Instrum. Meas. 2010, 59, 1580–1588. [Google Scholar]
- Pan, W.; Wang, J.; Huangfu, J.; Li, C.; Ran, L. Null point elimination using RF phase shifter in continuous-wave Doppler radar system. Electron. Lett. 2011, 47, 1196–1198. [Google Scholar] [CrossRef] [Scilit]
- Wang, F.-K.; Wu, C.-T.M.; Horng, T.-S.; Tseng, C.-H.; Yu, S.-H.; Chang, C.-C.; Ma, J.-G.; Yuan, Y. Review of self-injection-locked radar systems for noncontact detection of vital signs. IEEE J. Electromagn. RF Microw. Med. Biol. 2020, 4, 294–307. [Google Scholar] [CrossRef] [Scilit]
- Analog Devices, Inc. AD8302 Datasheet; rev. A; Analog Devices, Inc.: Norwood, MA, USA, 2002. [Google Scholar]

Disclaimer/Publisher’s Note: The statements, opinions and data contained in all publications are solely those of the individual author(s) and contributor(s) and not of MDPI and/or the editor(s). MDPI and/or the editor(s) disclaim responsibility for any injury to people or property resulting from any ideas, methods, instructions or products referred to in the content. |
© 2026 by the authors. Licensee MDPI, Basel, Switzerland. This article is an open access article distributed under the terms and conditions of the Creative Commons Attribution (CC BY) license.