


Abstract
To address the challenges posed by the strong uncertainty of high-proportion renewable energy sources (RES) to the secure and stable operation of distributed real-time power dispatch (D-RTPD) in new-type power systems, this paper proposes an integrated solution combining a neighborhood feature aggregation-based graph attention network (NFA-GAT) and multi-agent deep deterministic policy gradient (MADDPG). First, the D-RTPD problem is modeled as a decentralized partially observable Markov decision process (Dec-POMDP), which effectively captures the stochastic game characteristics of multi-regional agents and the partial observability of grid states. Second, the NFA-GAT is designed to enhance agents’ perception of grid operating states: by introducing a spatial discount factor, it realizes rational aggregation of multi-order neighborhood information while modeling the attenuation of electrical quantity influence with topological distance. Third, a prior-guided mechanism is integrated into the MADDPG framework to eliminate constraint-violating actions by setting their actor logits to negative infinity, improving training efficiency and strategy reliability. Simulation validations on the IEEE 118-bus test system (75.2% RES installed capacity ratio) show that the proposed method achieves efficient training convergence. Compared with the multi-layer perceptron (MLP) structure, it attains higher cumulative reward values and scenario win rates. When compared with traditional model-driven (ADMM) and data-driven (Q-MIX) methods, the proposed method balances solution efficiency, operational safety (98.7% maximum line load rate, zero power flow violation rate), and economic performance ($12,845 daily dispatch cost), providing a reliable technical support for D-RTPD under high-proportion RES integration.
1. Introduction
1.1. Background and Motivation
At this stage, China’s power grid primarily adopts a “hierarchical and zonal” dispatching system for management. Generally, provincial-level power grids serve as independent dispatching units, with cross-provincial power transmission corridors and direct current (DC) transmission projects acting as coordination means between provincial-level power grids. However, issues such as tight power flow coupling and weak communication connections exist between provincial-level power grids, failing to fully realize resource complementarity and regional mutual support among multiple provincial-level power grids [1,2,3]. Nevertheless, against the backdrop of “carbon neutrality and carbon peaking”, relying solely on long-distance DC external power transmission projects is insufficient to cope with the integration of a high proportion of RES sources. It is therefore necessary to deeply tap into the absorption capacity of provincial/regional power grids and explore a multi-regional power grid collaborative dispatching mode [4,5,6]. Consequently, solving the problem of distributed real-time power dispatch (D-RTPD) holds significant practical importance.
In response to this, this paper models the D-RTPD problem as a decentralized partially observable Markov decision process and proposes a neighborhood feature aggregation-based D-RTPD solution method, which balances solution efficiency and solution quality under limited information exchange.
1.2. Literature Review
Existing research on D-RTPD can be roughly categorized into two types: mathematical optimization-based methods and multi-agent reinforcement learning (MARL)-based methods. For mathematical optimization methods, researchers have proposed various distributed algorithms to address the global optimization problem under limited information interaction. Reference [7] develops a regional decomposition optimal power flow algorithm based on augmented Lagrangian relaxation, which decomposes large-scale problems into regional subproblems but remains a centralized solution in essence, making it inapplicable to scenarios where only neighborhood information is available. Reference [8] proposes a consensus-based distributed control algorithm for economic dispatch (ED), which achieves optimal solutions through iterative updates of power imbalance estimation among agents, but requires massive iterative calculations that limit real-time performance. Reference [9] further combines consensus mechanisms with graph theory to solve dynamic economic dispatch (DED) problems, yet still faces challenges in balancing computational efficiency and solution accuracy under high-proportion RES penetration. Reference [10] design a new group decision-making method that applies two new consensus methods based on sentiment analysis for application in the analysis of texts on social media. The application to a real case of public investment demonstrates the effectiveness of the approach in collaborative contexts that used natural language.
With the development of artificial intelligence, MARL has emerged as a promising approach for collaborative decision-making in multi-agent systems, and has been widely applied in power system dispatching [11,12,13,14,15,16,17,18]. Reference [19] adopts the MADDPG algorithm to train dispatching agents for active-reactive power coordination, realizing efficient regulation of multiple resources but ignoring the objective inconsistency among agents in collaborative tasks. References [20,21,22] applies stochastic consensus maximum entropy reinforcement learning to voltage and reactive power control (VVC), improving communication efficiency but failing to address the insufficient perception of grid global states by individual agents. Reference [23] converts the dispatching problem into a partially observable Markov decision process (POMDP) and uses MADDPG for centralized training and decentralized execution, yet the lack of effective coordination mechanisms still leads to suboptimal collaborative performance. Reference [24] proposes a pricing economic dispatch method based on local multipliers and conic relaxation, which achieves efficient solution under AC power flow constraints but relies on accurate mathematical modeling and lacks adaptability to high-proportion renewable energy uncertainty. Reference [25] combines model-free prediction and fixed-time control for islanded AC microgrids, focusing on robustness but failing to address distributed collaborative dispatch in large-scale multi-regional power grids. Reference [26] proposes a consensus method for group decision-making that, through sentiment analysis, assesses aggressiveness in comments using generative artificial intelligence, specifically the large language models provided by Google. In summary, mathematical optimization methods suffer from low real-time performance due to excessive iterations, while existing MARL-based methods struggle with inadequate neighborhood information utilization, making them difficult to meet the requirements of solution accuracy and algorithm scalability for D-RTPD under high-proportion RESs integration.
High-proportion renewable energy integration poses two core challenges to distributed real-time power dispatch (D-RTPD): partial observability of grid states due to limited local/neighboring information access and RES/load randomness, and communication constraints from inter-regional latency and bandwidth limits that restrict large-scale information interaction. Conventional model-driven methods (e.g., ADMM) assume global information sharing, ignore partial observability, and suffer from low real-time performance due to massive iterations, while existing MARL methods adopt single-agent POMDP modeling, neglect multi-agent stochastic game characteristics and underutilize constrained neighborhood information, leading to inadequate grid state perception. Moreover, neither approach adapts to the core characteristics of power grids with a high proportion of renewable energy, including partial observability and limited information interaction. To address these issues, this paper models D-RTPD as a decentralized partially observable Markov decision process (Dec-POMDP), which captures the above distributed features and converts the complex source–storage coordinated dispatch problem into a MARL-adaptive sequential decision-making problem, laying a rigorous theoretical foundation for the proposed NFA-GAT-MADDPG method.
1.3. Contribution and Summary
The main contributions of this paper are as follows:
- (1)
- A decentralized partially observable Markov decision process (Dec-POMDP) model tailored for distributed real-time power dispatch is established. By integrating the stochastic game characteristics of multi-regional agents and the partial observability of grid states, the model effectively converts the complex mathematical optimization problem of source–storage coordinated dispatch into a sequential decision-making problem suitable for reinforcement learning. This provides a rigorous theoretical framework for handling the strong uncertainty of high-proportion RES and limited information interaction among regions.
- (2)
- A neighborhood feature aggregation-based graph attention network (NFA-GAT) is proposed to enhance the agents’ perception of grid operating states. By introducing a spatial discount factor to model the attenuation of electrical quantity influence with topological distance, the network realizes effective aggregation of multi-order neighborhood information. This enables agents to fully capture the spatial correlation of power grid features under limited information interaction, improving the accuracy of policy decisions.
- (3)
- A multi-agent reinforcement learning framework integrating MADDPG and a prior-guided mechanism is proposed. The MADDPG algorithm ensures stable training of agents under environmental non-stationarity through centralized criticism and decentralized execution, while the prior-guided mechanism eliminates invalid actions violating constraints by setting their actor logits to negative infinity. This synergy enhances the efficiency and reliability of policy learning, enabling agents to generate feasible and optimal dispatching strategies in complex real-time power grid environments.
- (4)
- Comprehensive case studies are conducted on the IEEE 118-bus test system with the 75.2% installed capacity ratio of RESs. The proposed method is compared with traditional mathematical optimization methods and MARL methods with different network structures. Additionally, the impact of agent quantity on algorithm convergence is analyzed. Numerical results verify its superior performance in solution efficiency and algorithm scalability, which provide practical guidance for the deployment of multi-agent systems in real-world D-RTPD scenarios.
2. Basic Models and Theoretical Methods
2.1. Mathematic Model of D-RTPD
To suppress the strong uncertainty of RES during the D-RTPD phase [27], the power system needs to dispatch flexible resources with fast regulation speeds, and maintain power balance as well as safe and stable operation through the complementary operation mode of renewable energy sources (RESs) and energy storages (ESs). This section mainly uses “source–storage” coordination to address the D-RTPD challenges of power grids with high-proportion RES integration. Therefore, the objective functions of this section include generator output and rescheduling costs, ES operation costs, and line overload penalties, and the D-RTPD model is as follows:
where and are respectively system operation cost and redispatch operation cost. and are respectively day-ahead schedule and real-time adjustment of i-th generator. The operation cost of ES is incorporated into the objective function. Specifically, and denote the charging/discharging power of ES unit j at time t (the power is positive during discharging and negative during charging), and represents the charging/discharging cost coefficient of ES unit j. refers to the output of the balancing unit, and only the upper and lower limits of the output are considered as constraints for the balancing unit. Constraint (1a) is the power balance constraint. Constraint (1b) is the ES charging/discharging power conversion equation, where represents the rated capacity of ES unit j, and denote the charging and discharging states of ES unit j at time t respectively (0–1 variables), is the energy conversion efficiency coefficient of ES unit j, and refers to the state of charge (SoC) of ES unit j at time t. Constraint (1c) is the ES charging/discharging state constraint. Constraint (1d) is the SoC constraint for ES unit j, which is used to avoid overly discharge or charge, and and represent the minimum and maximum SoC values of ES unit j respectively. Constraint (1e) is the charging/discharging ramping constraint for ES unit j, and denotes the charging/discharging ramping coefficient of the ES. Constraint (1f) is the generator output constraint, with and being the maximum and minimum output of generator i respectively. Constraint (1g) is the balancing unit output constraint. Constraint (1h) is the generator ramping limit, where refers to the ramping limit of generator i within a single time period. Constraint (1i) is the line transmission capacity constraint, with representing the line transmission power at time t and being the maximum line transmission capacity. and denote the sets of generators and ES units respectively.
2.2. MADDPG Algorithm
MADDPG is a deterministic gradient descent algorithm, where each agent requires a critic that acquires global information and an actor that observes local information. Without loss of generality, is used to represent the parameters of the strategies for n agents. For the i-th agent, its cumulative expected reward is:
where s and ai denote the state observation and action value of the i-th agent, respectively. and represent the state transition probability and policy function, respectively. Therefore, the gradient formula of its deterministic policy is:
where denotes the deterministic policy of the i-th agent. and represent the observation and action value of the i-th agent, respectively. and denote the observation vector and action vector of the multi-agent system, respectively. D is the replay buffer that stores the trajectories of the multi-agent system. represents the centralized state-action value of the i-th agent under the deterministic policy. This gradient formula enables iterative optimization of agent policies, driving policy updates toward maximizing the cumulative reward.
For the update method of the critic in centralized training, Temporal Difference (TD) and Double Q-Network approaches are adopted, which can be expressed as:
where denotes the centralized state-action value under the policy output by the target network. represents the true state value. stands for the target policy with parameters . and denote the observation vector of the multi-agent system at the next time step and the action vector of the target policy at the next time step, respectively.
2.3. Graph Attention Network
RL algorithms rely on neural networks to process large volumes of input information. The attention mechanism can help neural networks quickly screen key features and improve the training efficiency of neural networks. Assume that there exist N electrical quantities as the input vector , for any input vector and the corresponding query vector . An information selection mechanism can be adopted to aggregate the input information, which is:
where is referred to as the attention distribution, that is .
The graph attention layer applies the attention mechanism to graph neural networks. It updates node features through the information of first-order neighborhood nodes, and learns different attention weight coefficients for different neighborhood variables. A shared weight matrix is trained for all nodes, which represents the relationship between the F input features and the F′ output features, and can be used to derive the neighborhood weight coefficient of each node. The calculation formulas of the attention value and the attention coefficient are as follows:
After the attention coefficients are calculated, for any node i, the model can adopt a multi-head attention mechanism to enhance its representation capability. For the output features of the intermediate layers of the GAT, a K weight matrix is used to calculate the self-attention, concatenate the K output results for output, and finally adopt a strategy of averaging the output vectors of the attention heads in the output layer. This process can be expressed as follows:
where denotes the attention coefficient of the k-th attention head, and is the weight parameter matrix of the k-th attention head. It is worth noting that the activation function of the output layer usually takes the form of softmax or logistic sigmoid.
3. Proposed Method
3.1. Decision Process Modeling for D-RTPD
D-RTPD of multi-area power grids is a fully cooperative stochastic game process based on multi-agent systems. It composes the Nash strategies of multiple agents in each state into a joint strategy in a dynamic environment, and updates the reward value of each agent in the game process through continuous interaction with the environment. Considering the mechanism of partitioned power grid scheduling, each scheduling area cannot obtain global information of other areas, so its dispatching problem is actually a decentralized partially observable Markov decision process (Dec-POMDP). Following the stochastic game paradigm, a Dec-POMDP is established for the D-RTPD of multi-area power grids with source–storage coordination, which mainly consists of the following elements:
- (1)
- Agent: The dispatching agent i in each area. This section mainly considers the generator rescheduling actions and ES regulation actions, and all multi-agents adopt decision-making in a continuous action space. denotes the set of multi-agents;
- (2)
- State: The system state at time t is , which includes the day-ahead predicted active power output and real-time predicted active power output of wind power at time t, the day-ahead predicted active power output and real-time predicted active power output of solar units at time t, the day-ahead scheduled active power output of uncontrolled generators, the SoC of all ESs, the day-ahead predicted active load and real-time predicted active load of load nodes, the load rate of each branch in the system, and the output value of controlled generators at the previous time step. It is worth noting that the action of generators at time 0 is the value specified in the day-ahead scheduling plan.
- (3)
- Local Observation Information: The observation quantity of an agent is . The observation quantity of each agent is divided into two parts: one is the general observation quantity, i.e., the electrical quantities of the node where the agent is located and its k-th order neighborhood; the other is the special observation quantity. Specifically, the agent responsible for controlling generator rescheduling actions focuses on the generator output value of the managed area at the previous time step, while the agent responsible for controlling ES responses focuses on the SoC state at the previous time step, the day-ahead and real-time predicted values of RES, and the dispatching time step t. Without loss of generality, the observation quantities of the two types of agents can be expressed as follows:
It is worth noting that the k-th order neighborhood observation quantity of an agent does not include the part beyond its regulation area.
- (4)
- Action: The actions of the two types of agents are generator rescheduling actions and ES charging/discharging actions respectively. All actions considered in this section are continuous regulation actions; therefore, both the generator rescheduling and ES charging/discharging strategies take values in the continuous action space. The upper and lower limits of the generator’s action space are its maximum and minimum active power output. In addition to satisfying the upper and lower limit constraints of SoC, the ES also needs to meet the requirement that the difference between the initial SoC and the final SoC within each dispatching day is within a certain range, which can be expressed as follows:
- (5)
- Reward Function: This section employs generator rescheduling and ES actions to address the strong uncertainty of high-proportion RES, and the economic costs of generator dispatching also need to be taken into account. Therefore, the design of the reward function in this section should revolve around three aspects: the system line load rate, the generator unit rescheduling cost, and the ES action cost, which can be expressed as follows:
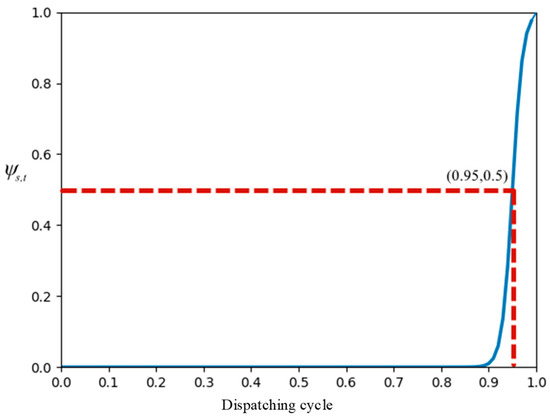
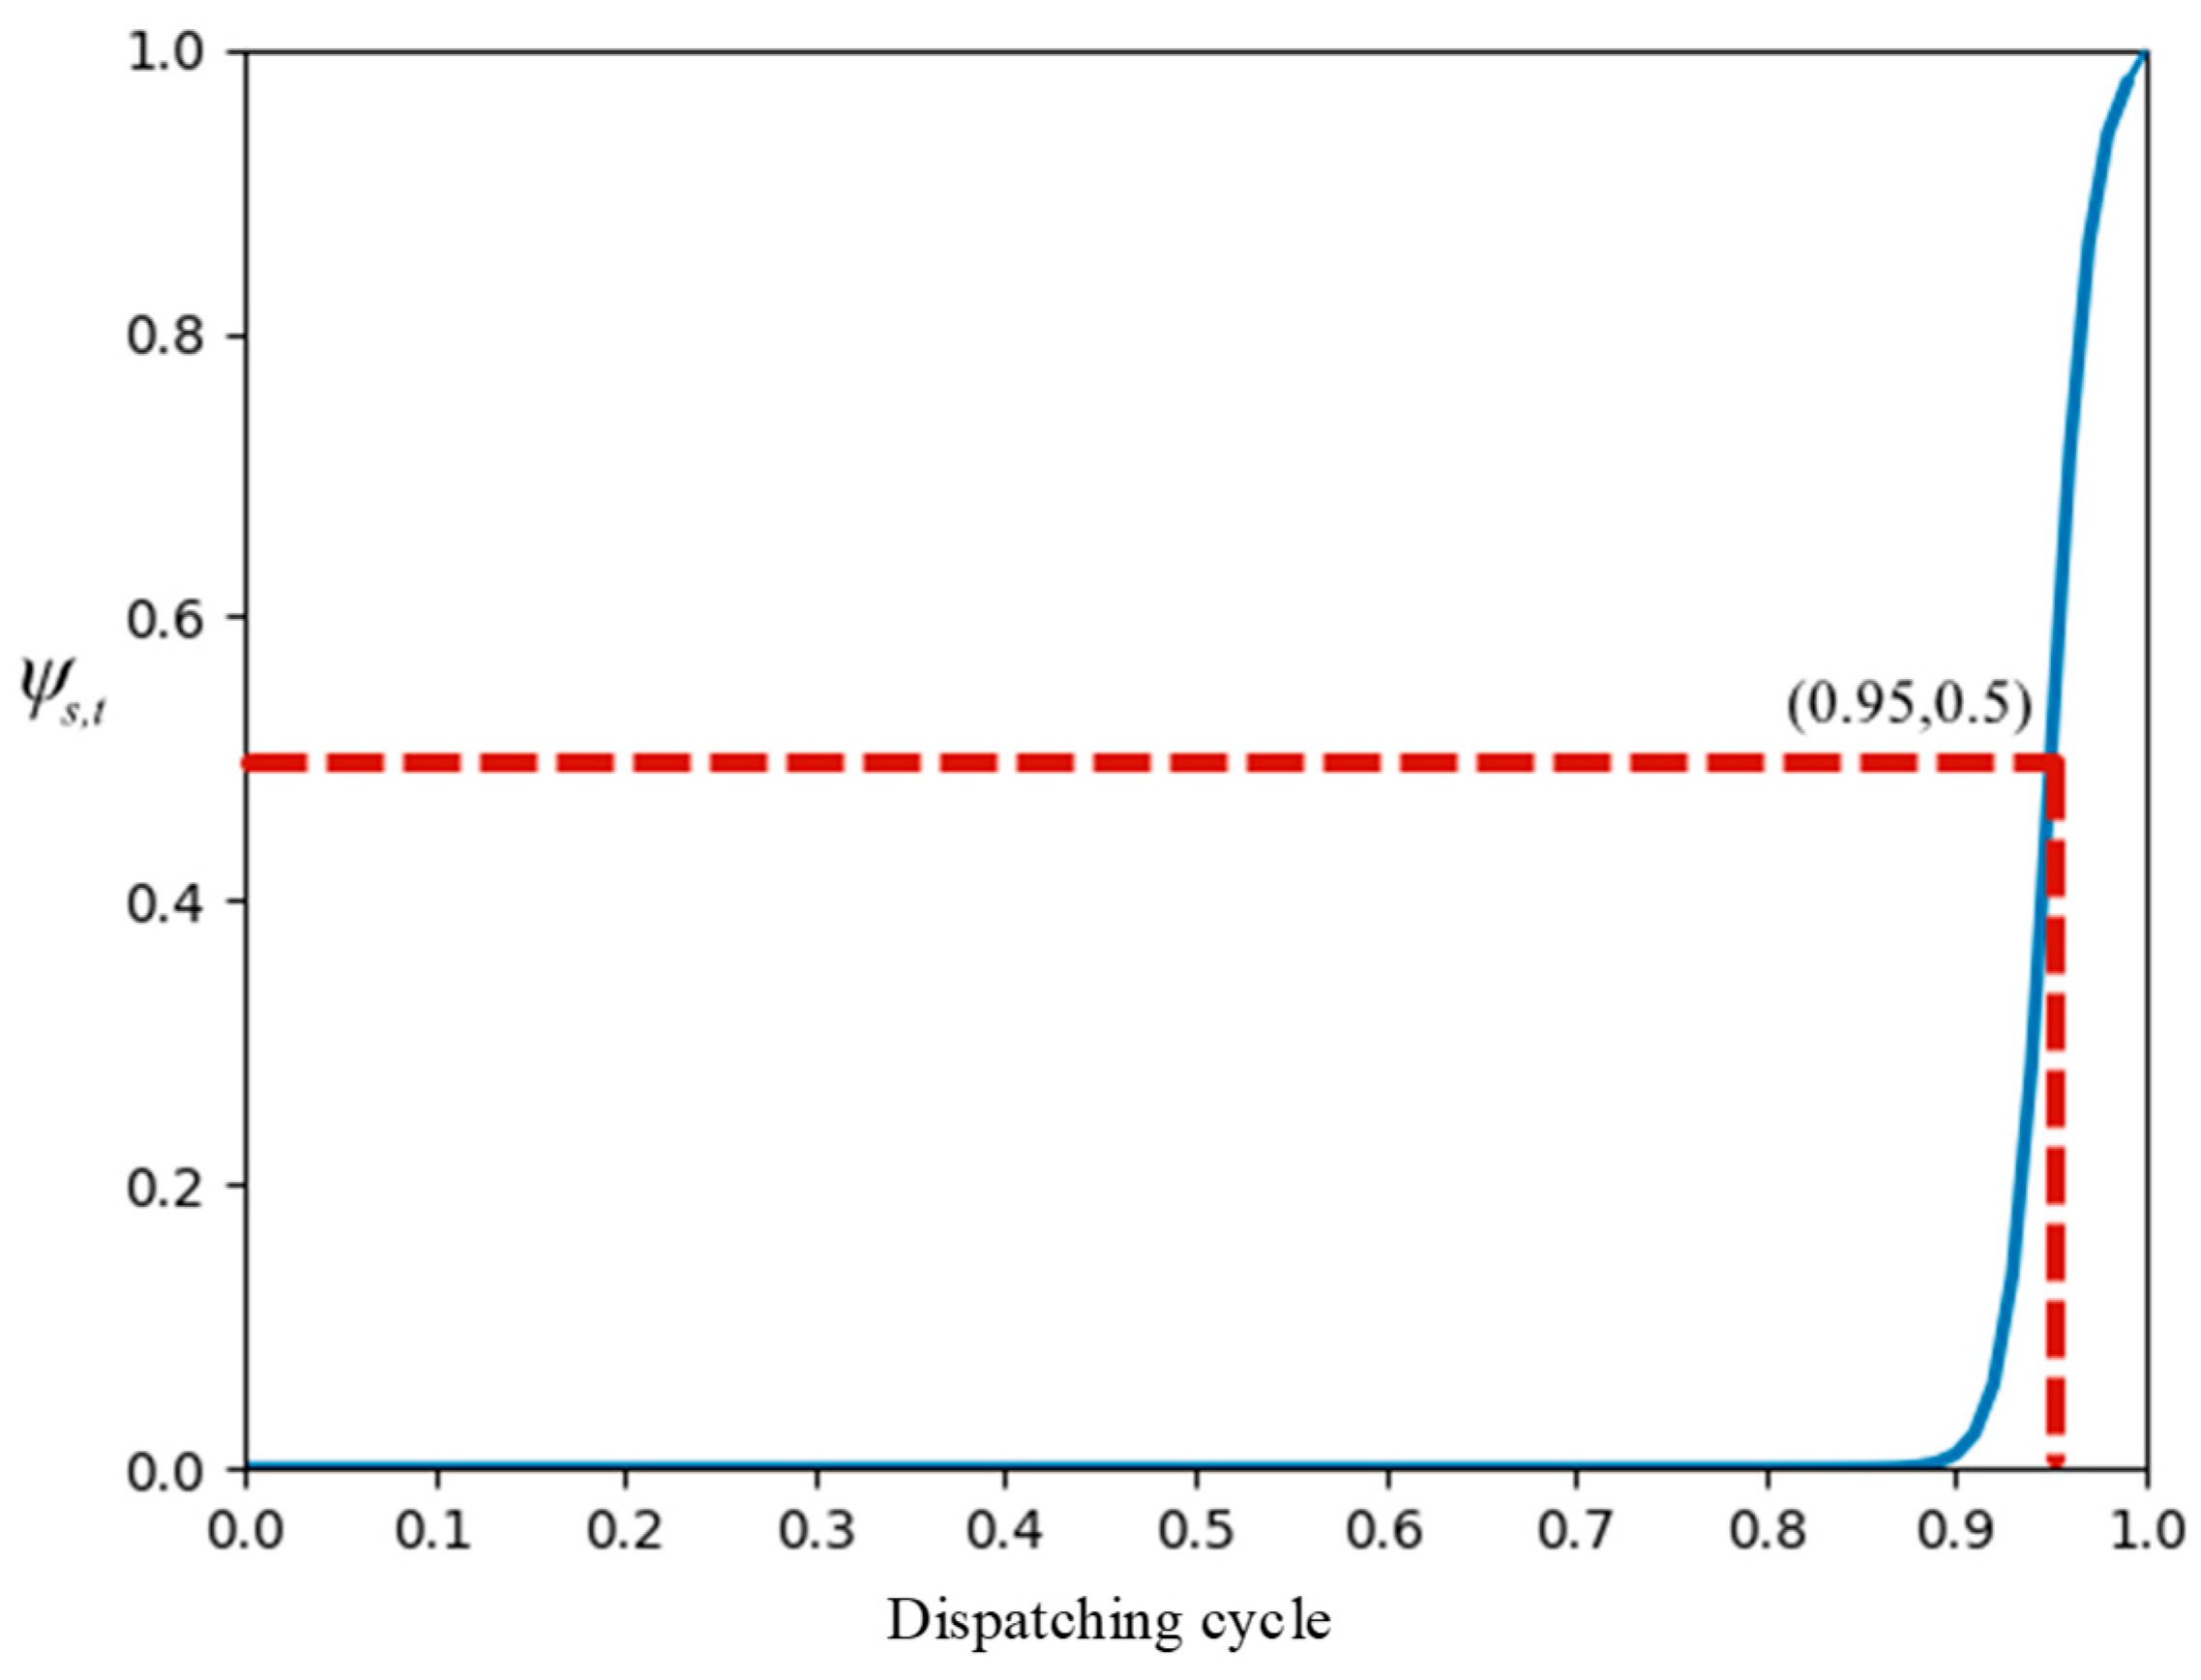
Considering that the SoC deviation of ES should satisfy Formula (5), the value of shall follow the principle that it increases as the value approaches the maximum dispatching duration. Therefore, this section adopts a sigmoid function to determine the value of , which can be expressed as follows:
where t and T represent the current dispatching time step and the maximum dispatching duration respectively, and the curve of the function is shown in Figure 1.
Figure 1.
Value curve of SoC deviation assessment coefficient based on sigmoid function.
When formulating strategies, the agents need to take both the current power grid state and the long-term power grid situation into account, and their immediate reward and cumulative reward functions are shown in Formulas (8) and (9), respectively.
where , , and denote the line load rate reward coefficient, generator rescheduling cost reward coefficient, and ES action cost reward coefficient respectively. represents the constant reward term for normal system power flow. denotes the initial time of cumulative reward. and represents the attenuation factor of cumulative reward.
3.2. Solution Method Based on MADDPG
3.2.1. Policy Optimization
In Equation (4), the training of the critic for each agent requires the policies of other agents. In the MADDPG algorithm, the policy of other agents for each agent can be obtained by means of fitting approximation, without the need for communication and interaction with them. Therefore, each agent can maintain n − 1 policy approximation functions, and the logarithm of the approximated policy can be used as the loss function, which can be expressed as:
where denotes the policy approximation parameter of the j-th agent for the i-th agent, and is its policy approximation function. By minimizing this loss function, the approximation of the policies of other agents can be obtained. Thus, can be expressed in Equation (4) as follows:
Since the policy of each agent is constantly updated and iterated, the environment faced by a single reinforcement learning agent is dynamically unstable. To address this problem, MADDPG adopts a policy set technique, which assumes that the policy of each agent consists of a set containing multiple sub-policies. For the i-th agent, its policy is composed of k sub-policies, and only one sub-policy is used in each training episode. The overall reward of its policy set is expressed as follows:
Therefore, the update gradient for each sub-policy of the i-th agent is expressed as follows:
3.2.2. Neighborhood Feature Aggregation Based on Graph Attention Network
GAT leverages the multi-head attention mechanism to perform feature aggregation on first-order neighborhood information, while neglecting the impact of high-order neighborhood information on agents. In power grids, line power flow is often strongly correlated with the power injection and outflow of multiple nodes in the network. It is difficult for scheduling agents to accurately and effectively perceive the power flow operation state of the power grid relying solely on first-order neighborhood information [28,29,30,31]. Therefore, this section proposes a graph attention network based on neighborhood feature aggregation (NFA-GAT) through the feature aggregation and superposition of multi-order neighborhood information, so as to expand the perception range of the agent’s GAT layer.
For any power grid node, the influence of the electrical quantities of its neighboring nodes on the power flow of the connected lines will weaken as the distance increases. Therefore, when aggregating the neighborhood features of agents, we should assign different contribution degrees to the nodes in neighborhoods of different orders.
By introducing a spatial discount factor to weight multi-order neighborhood information, Equations (6) and (7) (base GAT attention coefficient calculation) are combined and rewritten as follows:
where denotes the k-th order neighborhood of the node where agent i is located; represents the distance-dependent SPF; denotes the neighborhood order between node i and node j (i.e., the shortest hop count between node i and node j). Starting from the physical characteristics of power systems, this section illustrates the exponential attenuation law of electrical quantities (power/voltage) with topological distance (hop count), which originates from the voltage and power division effects of line impedances. Therefore, the adoption of an exponential function conforms to objective physical laws. The optimality of the spatial discount factor will be investigated in the Section 4.6. By comparing the capabilities of balancing neighborhood information aggregation and invalid information filtering, the performance differences among different parameter settings are verified, and the rationality of the exponential function form is validated.
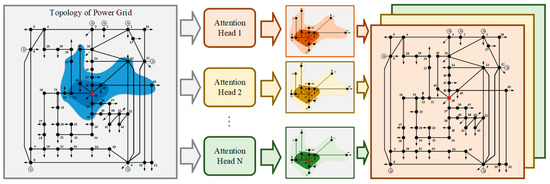
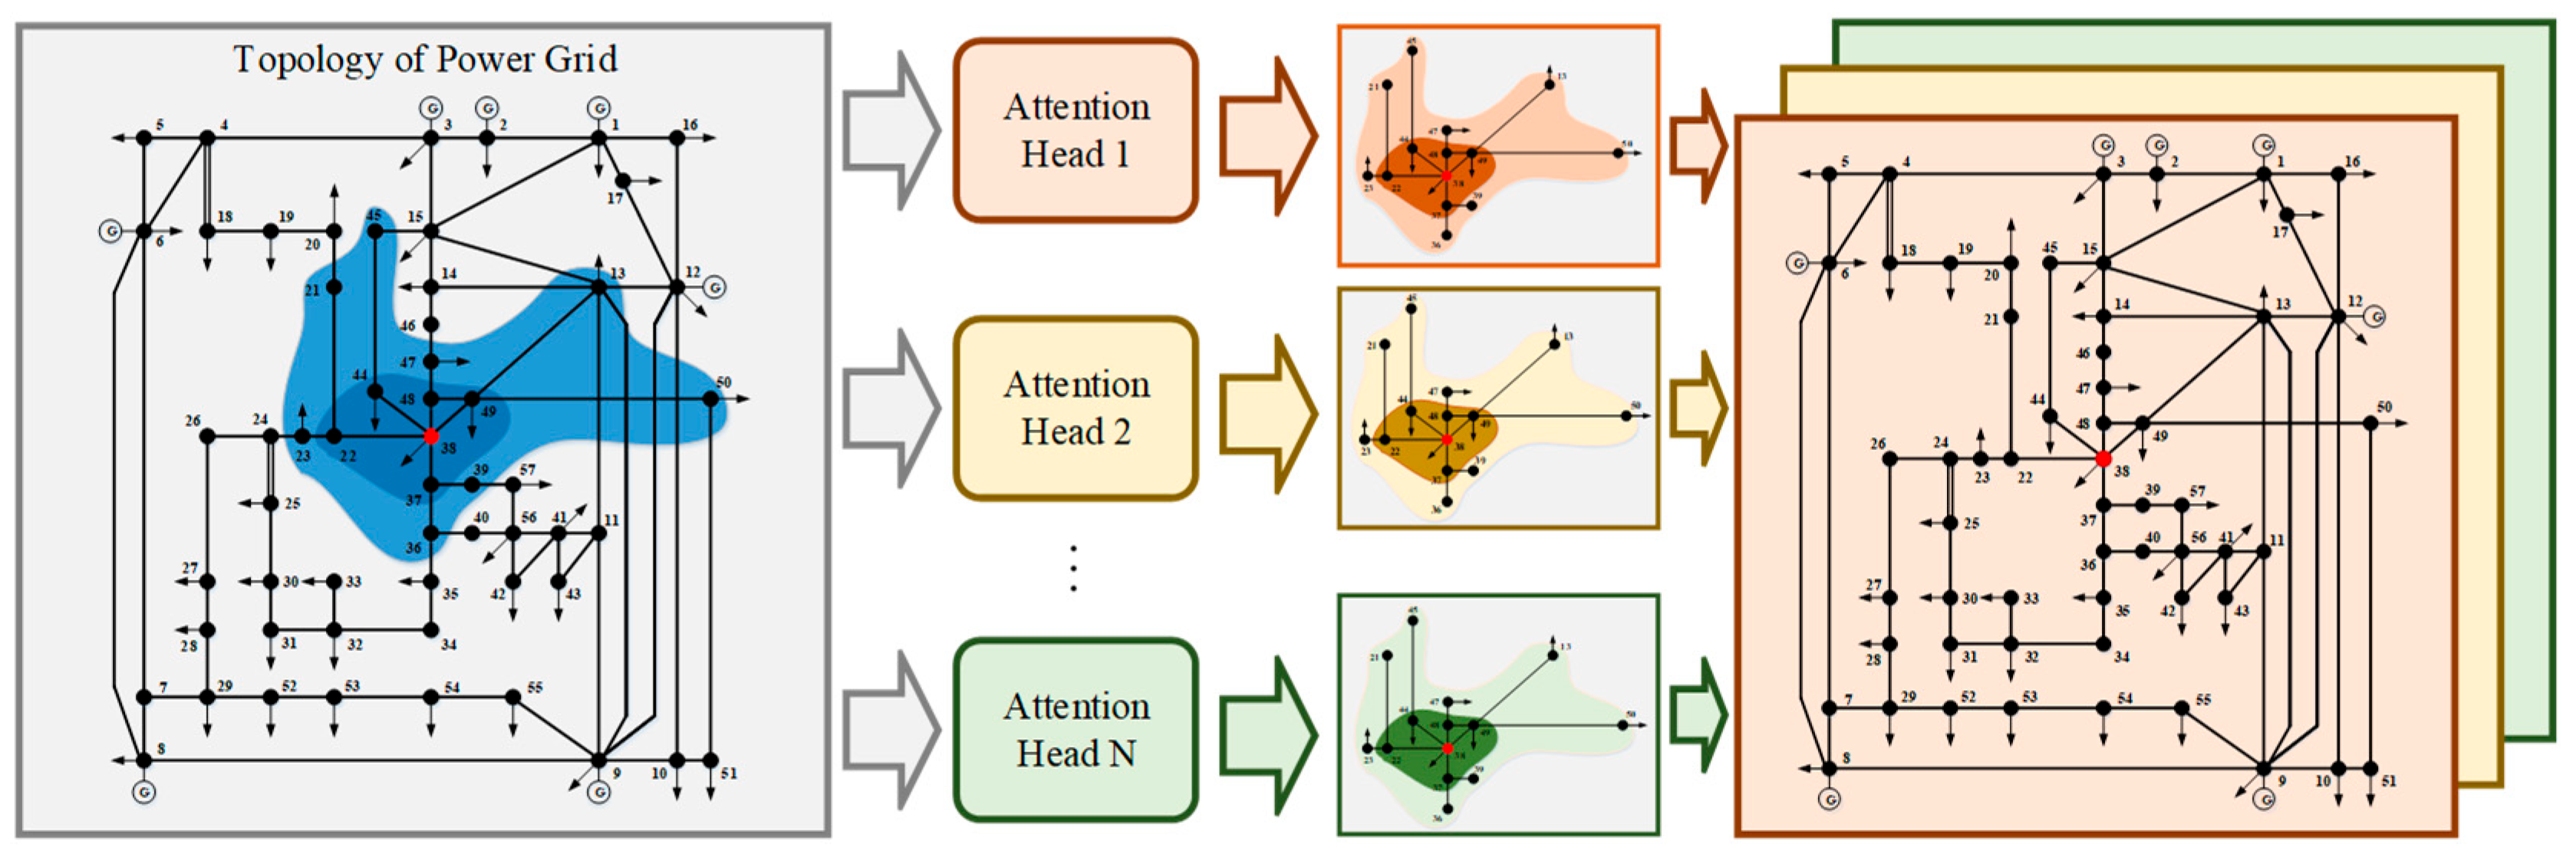
Similarly, to prevent overfitting, NFA-GAT also adopts the multi-head attention mechanism presented in Equation (8). Taking a power grid as an example, the schematic diagram of its principle for feature aggregation of the second-order neighborhood of a certain node in the graph is shown in Figure 2, which intuitively presents the process of NFA-GAT assigning exponentially attenuated weights to first-order and second-order neighborhood nodes based on the spatial discount factor, then fusing multi-order neighborhood feature information with the local node feature to form the final high-dimensional feature representation of the node.
Figure 2.
Schematic diagram of second-order neighborhood feature aggregation for nodes based on NFA-GAT.
3.2.3. Prior-Guided Mechanism
To enhance the effectiveness of the agents’ output strategies, we have incorporated a prior knowledge-guided action validity check into each agent’s policy network. By setting the actor logits corresponding to invalid actions that violate constraints to negative infinity, invalid actions can be eliminated during the agents’ training process, thereby improving the training efficiency of multi-agent systems. The details of action validity check mechanism are: (1) The masking operation acts directly on the actor logits output by the Actor network after feature extraction via NFA-GAT. Specifically, the logits corresponding to invalid actions that violate power grid constraints (e.g., unit output limits, energy storage charging/discharging constraints, line power flow constraints) are set to negative infinity; (2) The masking operation only modifies the logits corresponding to invalid actions without changing the gradient propagation path of the Actor network. After the revised logits are converted into an action probability distribution via softmax, they can still normally participate in the computation and update of the policy gradient, ensuring differentiability throughout the training process.
Additionaly, a discretization sampling is performed on the continuous policies output by the agents deployed with the MADDPG algorithm, which thus requires the use of the Gumbel-max trick. For any n-dimensional probability vector , Gumbel noise is added to its corresponding discrete random variable before sampling is conducted, which can be expressed as follows:
where denotes an independent and identically distributed (i.i.d.) random variable following the standard Gumbel distribution, and its cumulative distribution function is expressed as follows:
Considering that the argmax operation in Equation (23) renders it non-differentiable, we replace the argmax with the softmax function to enable gradient derivation and update of the algorithm. Therefore, Gumbel–softmax approximates the original continuous action probability distribution with the output of the neural network while sampling the maximum probability using argmax. Essentially, it leverages the reparameterization trick to address the non-differentiability issue caused by argmax.
3.3. Training Framework
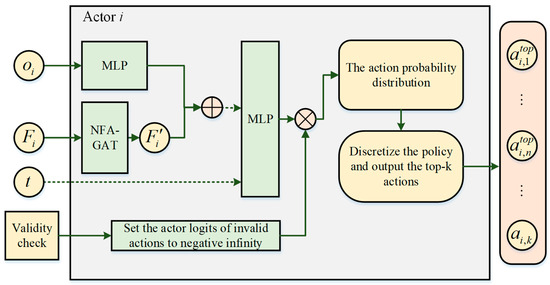
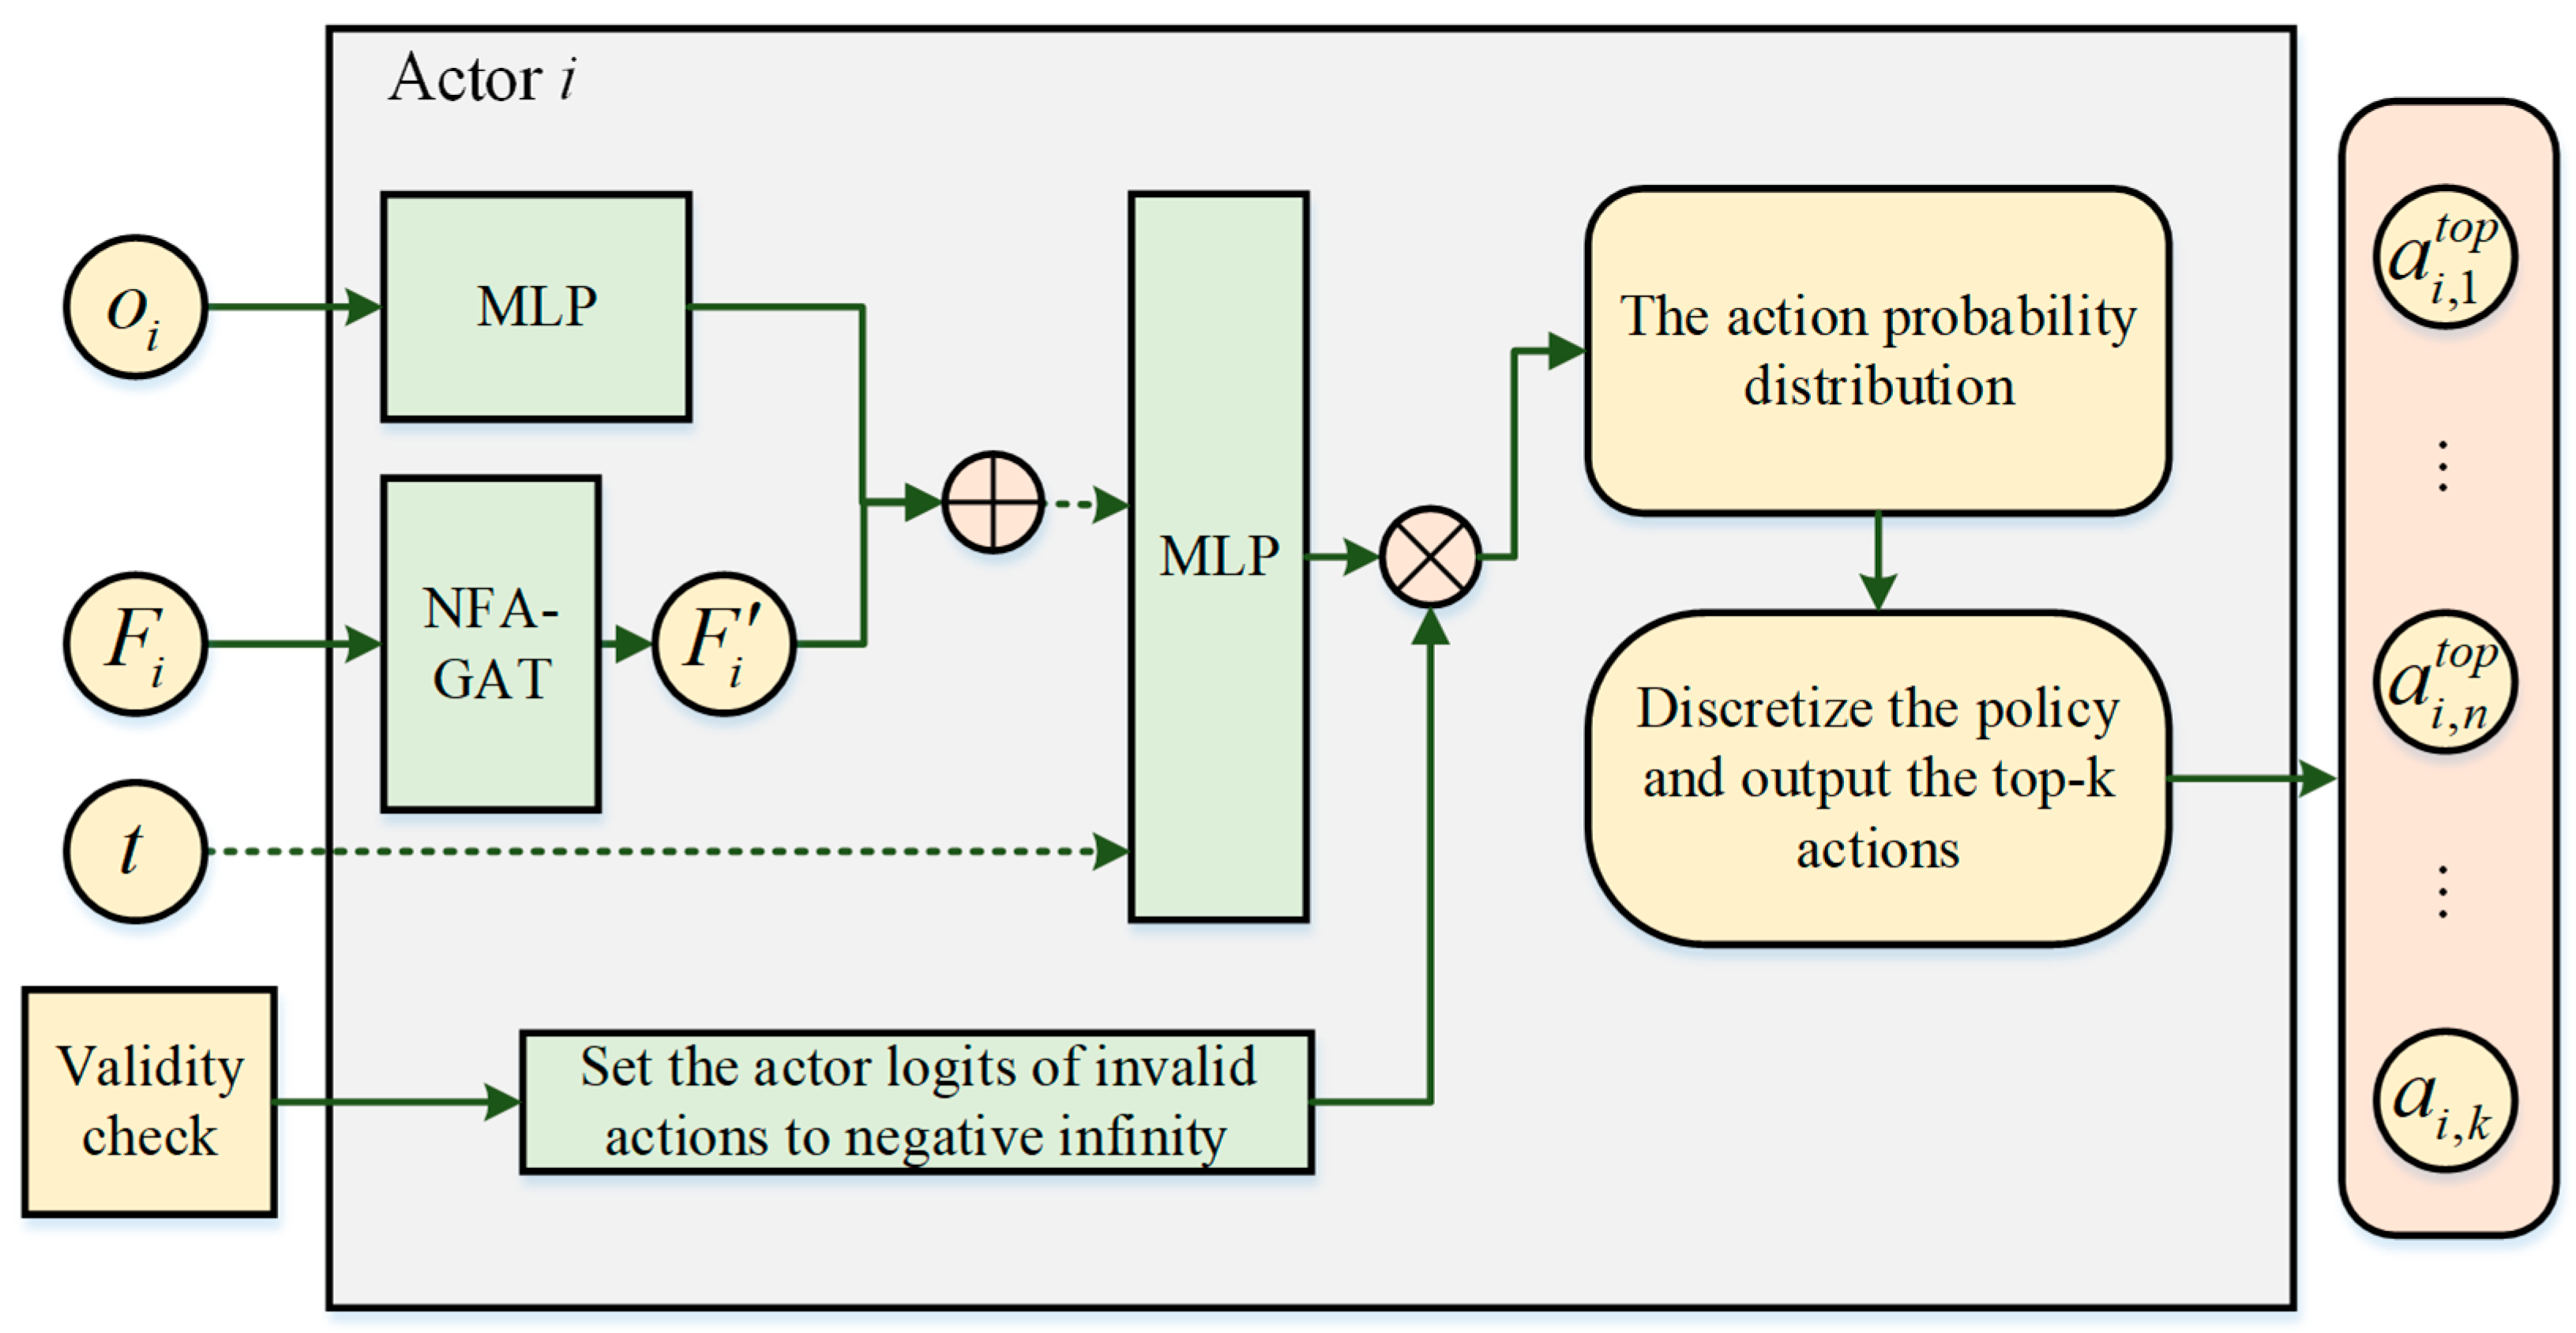
As a tool to enhance the neighborhood feature extraction capability of agents, NFA-GAT needs to be deployed in the Actor network of agents. Therefore, the structure of the agent Actor network integrated with the NFA-GAT and MADDPG algorithms is illustrated in Figure 3. For the input variable t, it only needs to be fed into the ES agents rather than the generator agents. In this section, ES is dispatched at the grid side. The “centralized training, distributed execution” framework of the multi-agent system does not rely on a communication network, where the neighborhood of each agent refers to the adjacent bus nodes in its physical network. During the centralized training phase of the multi-agent model, the Critic network evaluates the action of each agent based on the information from all agents, thereby ensuring the stability of the environment throughout the training process. After the multi-agent model is trained to convergence, each agent can formulate effective strategies solely based on its local observations during deployment. Ultimately, the real-time scheduling of the power grid is achieved through the coordinated strategies of multiple agents.
Figure 3.
Actor network structure of the agent.
Since multi-agents need to utilize the attention mechanism to process neighborhood features, this section selects the electrical characteristic quantities of the power grid to avoid extracting those irrelevant to real-time scheduling. Thus, the environment returns an updated feature matrix before each interaction with the agents. After the environment returns the system state and feature matrix, multiple agents obtain their respective local observations, extract the neighborhood features from the feature matrix using the NFA-GAT layer, and finally output policy actions. To satisfy the inequality constraints of the real-time scheduling model, an action validity verification mechanism that satisfies model constraints is established for each agent. When certain actions in the discrete action space of any agent would cause the generator or ES to exceed limits, this mechanism sets the actor logits of these actions to negative infinity. As a result, the probability density of these actions in the constructed categorical distribution becomes zero, ensuring that all actions output by each agent are valid and executable in the environment.
To implement the prior-guided mechanism, after the policy network outputs the action probability distribution, this distribution is converted into a discrete Gumbel distribution for discrete policy output. The core purposes of adopting the Gumbel-max trick and discretized sampling are to achieve efficient optimization of continuous policies. After the Actor network outputs a continuous policy distribution, Gumbel noise injection is applied to perform discretized sampling of the continuous policy, followed by top-k optimization to extract the top-k optimal continuous action values. This approach does not design the action space as discrete; instead, it discretizes and filters the output results of the continuous policy to improve the decision-making efficiency of real-time scheduling.
At each decision step, the decision trajectories of the multi-agents are combined into a piece of experience and stored in the experience replay buffer. When an episode ends (either the maximum number of steps is reached or the scenario power flow exceeds limits), the environment is reset again and a new scenario is randomly generated. After a certain number of interaction episodes, we randomly sample a batch of samples from the experience replay buffer and use these samples to train the neural networks of the multi-agents. During the network update process, we first input the local observations, action values, reward values and Done flags of all agents. The centralized Critic evaluates and feeds back the Q-value of each agent based on global information. The Actor training of each agent relies on the local observations, actions of the agent itself and the Q-value returned by the centralized Critic. After training for a certain number of steps, when the loss functions of the multi-agents are observed to converge, we terminate the training process and export the trained model. The pseudocode for training the multi-agent system for real-time scheduling in this section is shown in Algorithm 1.
| Algorithm 1: Multi-agent training algorithm for real-time scheduling based on NFA-GAT and MADDPG |
|
4. Case Simulation
4.1. Case Description
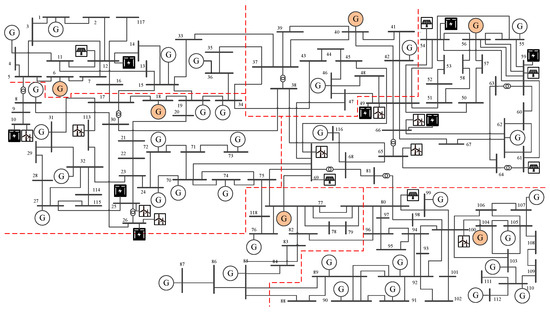
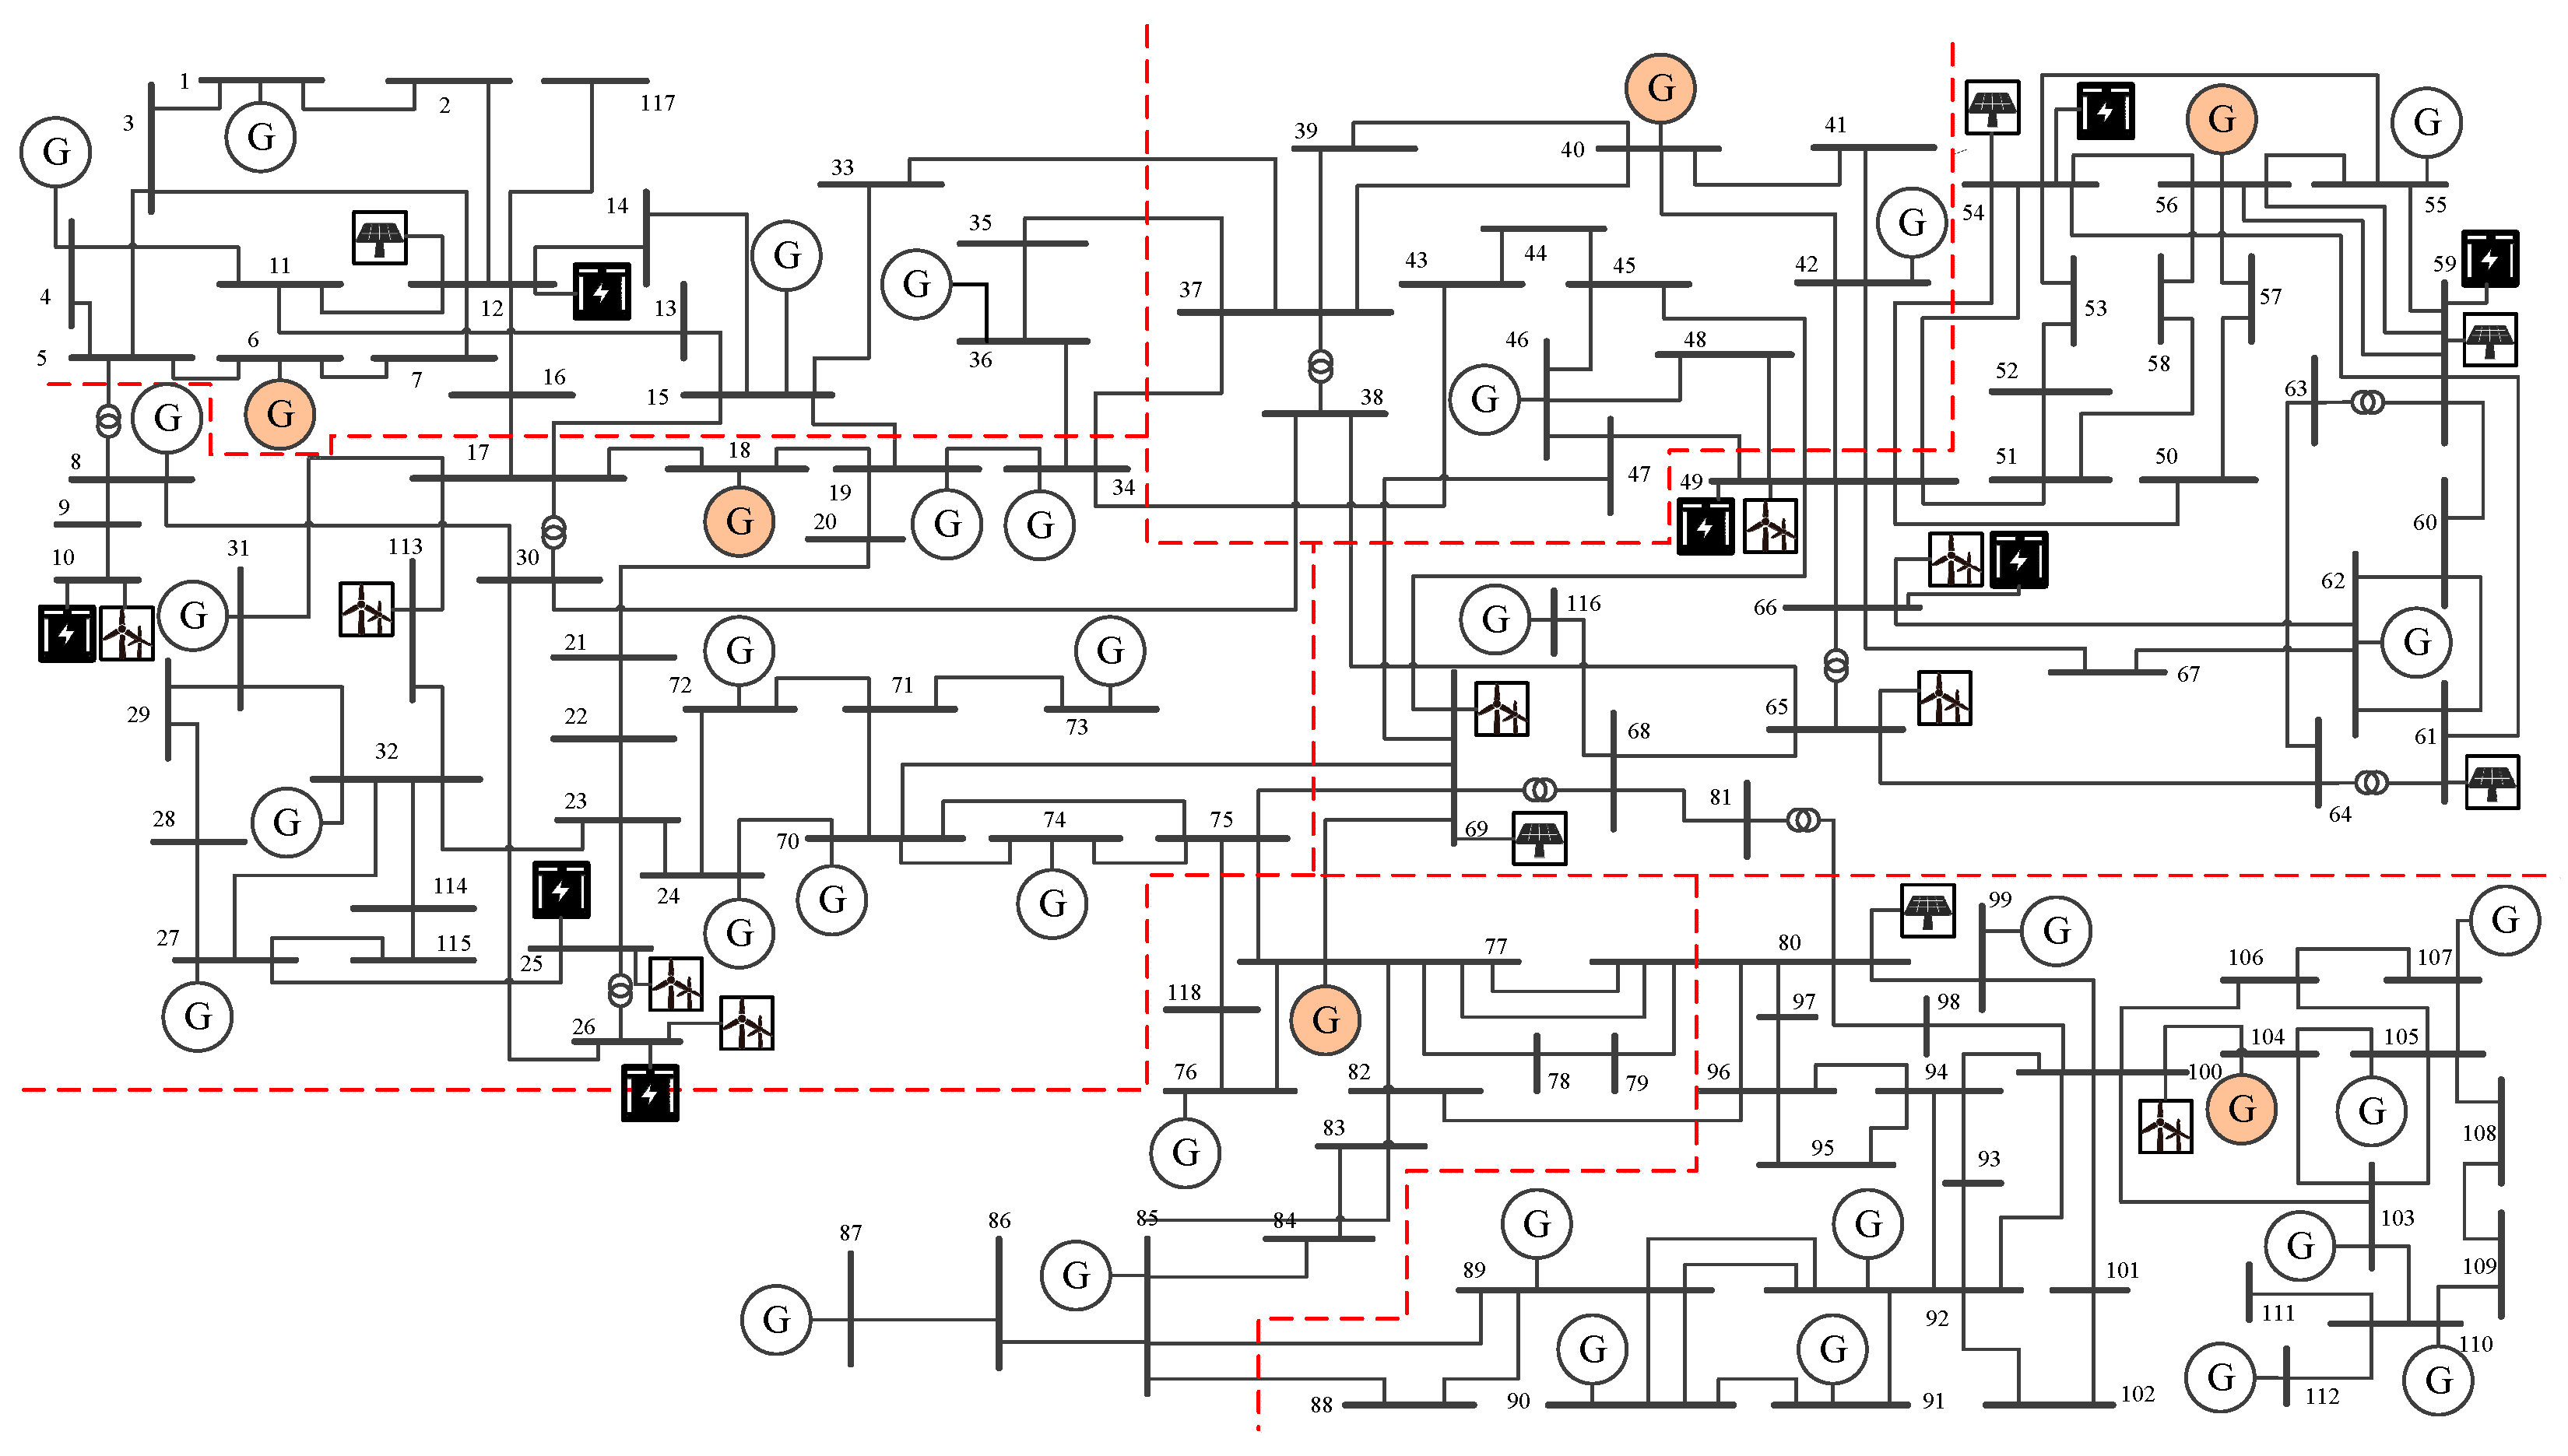
In this section, an offline power grid simulation environment for interaction with agents based on the power flow calculation engine PyPower 5.1.4 is built, and the IEEE 118-bus power grid is selected as the object of D-RTPD. Considering that the generator dispatching agents and ES dispatching agents have a large adjustable range, this section divides the target power grid into six regions, and sets six generator agents (orange generators in the figure) in each dispatching region. Meanwhile, to cope with the integration of high-proportion RES, we configured seven distributed ES agents in the power grid to dispatch ES resources, and its topology is shown in Figure 4.
Figure 4.
Topology diagram of the IEEE 118-bus system.
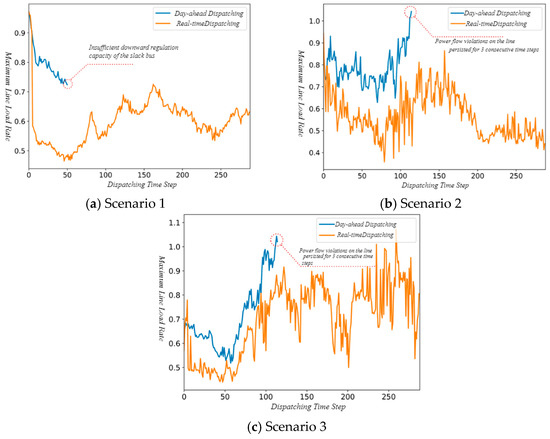
The primary task of D-RTPD is to ensure the safe and stable operation of the power grid. Therefore, we track the maximum line load rate of the power grid. Given that D-RTPD requires a response time for generator redispatch, the power grid will experience power flow violations if the line load rate reaches 100% for two consecutive time steps.
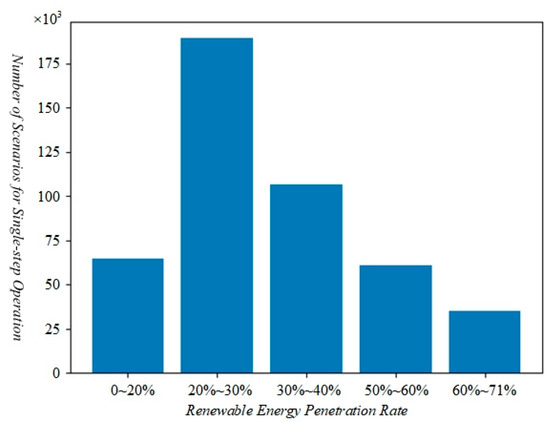
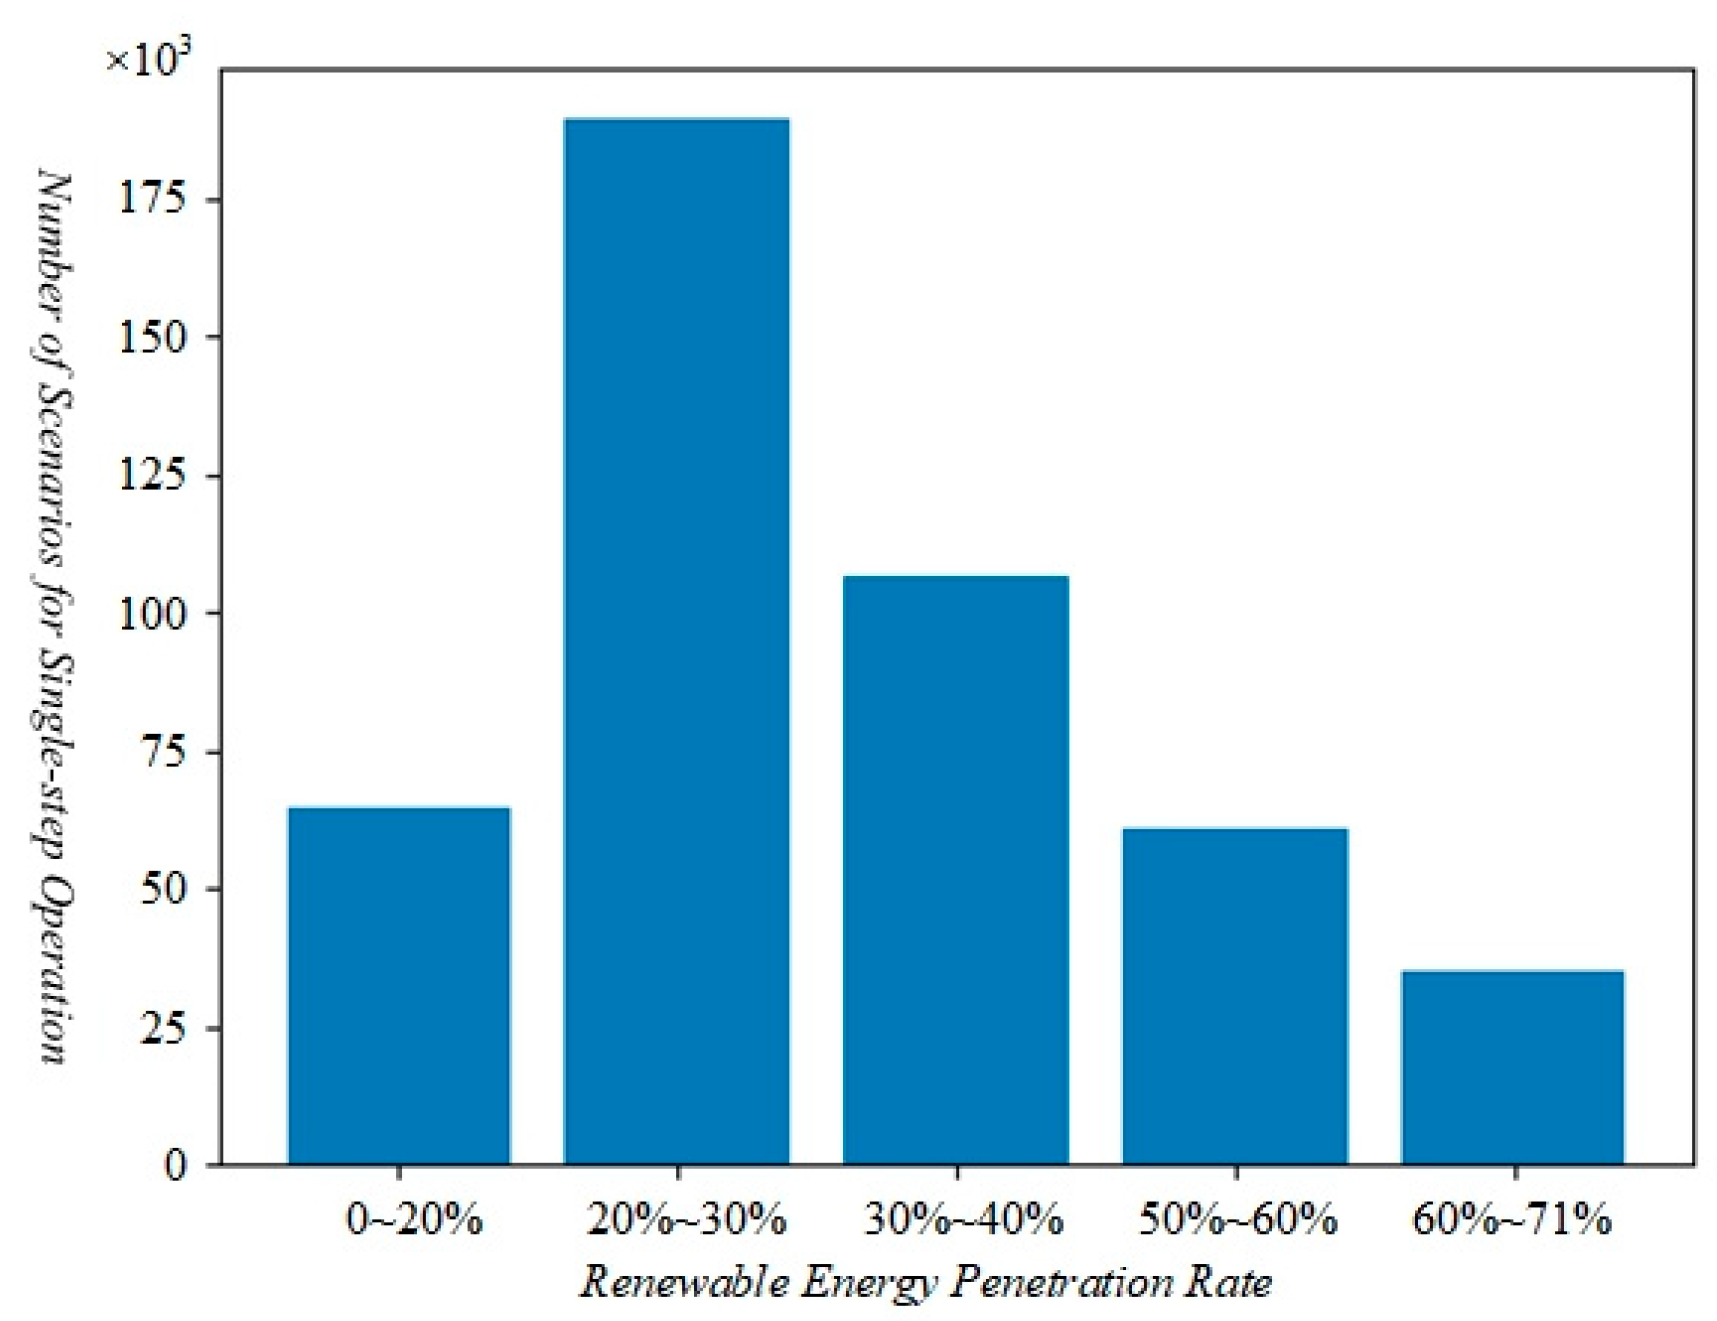
The scenarios with differentiated RES penetration rates of the system are established, which integrate a large number of wind and solar units into various regions of the power grid. The output curves of both wind turbines and solar systems are derived from historical measured data. In the case study of this section, the installed capacity proportion of RES reaches 75.2%. However, considering the output characteristics of wind and solar power as well as ultra-short-term forecasting errors, the actual penetration rate fluctuates within the range of 0% to 71% during the D-RTPD period. Based on the day-ahead dispatching plan, the interval distribution of RES penetration rates under single-step operation scenarios of the power grid is shown in Figure 5.
Figure 5.
Distribution of RES penetration rate in single-step operation scenarios within the training scenario set.
We collected 1000 daily dispatching scenarios covering different seasons and RESs penetration rates. These scenarios are derived from simulation data of the IEEE 118-bus system, with random fluctuations superimposed to simulate ultra-short-term forecasting errors. Furthermore, 200 scenarios were randomly selected from the same data source as the training set, ensuring consistent distribution characteristics but not overlapping with the training set. The training scenarios in this section are organized on a daily basis. The optimization solver Gurobi 13.0.1 was adopted to generate the day-ahead dispatching plan for each training scenario. Multiple agents are required to formulate 288 D-RTPD plans at 5-min intervals based on the day-ahead dispatching plan; therefore, the maximum time step of each scenario is set to 288 steps. All weight coefficients in this paper have been verified through multiple rounds of simulation. Under a new energy penetration rate of 75.2%, the model ensures compliance with power grid safety constraints while achieving optimal dispatching economy.
Both the policy networks of the generator dispatching agents and ES dispatching agents adopt the discretized DDPG algorithm. In the NFA-GAT layer shown in Figure 3, a hidden layer with 64 neurons and two attention heads are employed, and the aggregated features are 10-dimensional feature vectors within the three-hop neighborhood. The spatial discount factor is fixed at 0.8. For the Actor and Critic networks of each agent, the hidden layers are configured with 128 neurons, and the Leaky ReLU activation function is selected for both networks.
In addition, the batch size sampled from the experience replay buffer is set to 128, and the Adam optimizer is adopted with a learning rate of 0.001 for both the Actor and Critic networks. The correlation coefficients of the reward function are presented in Table 1. To accelerate the training speed, the neural network parameters were shared among all ES agents. The case studies were implemented based on PyPower 5.1.4 and Pytorch-GPU CUDA 11.0, and the training was conducted on a Linux server equipped with 4 NVIDIA RTX 2080Ti graphics cards.
Table 1.
Correlation coefficients of the reward function.
4.2. Validation of Algorithm Learning Capability
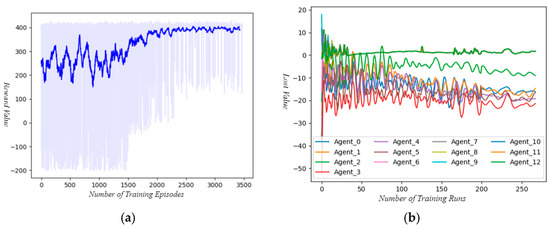
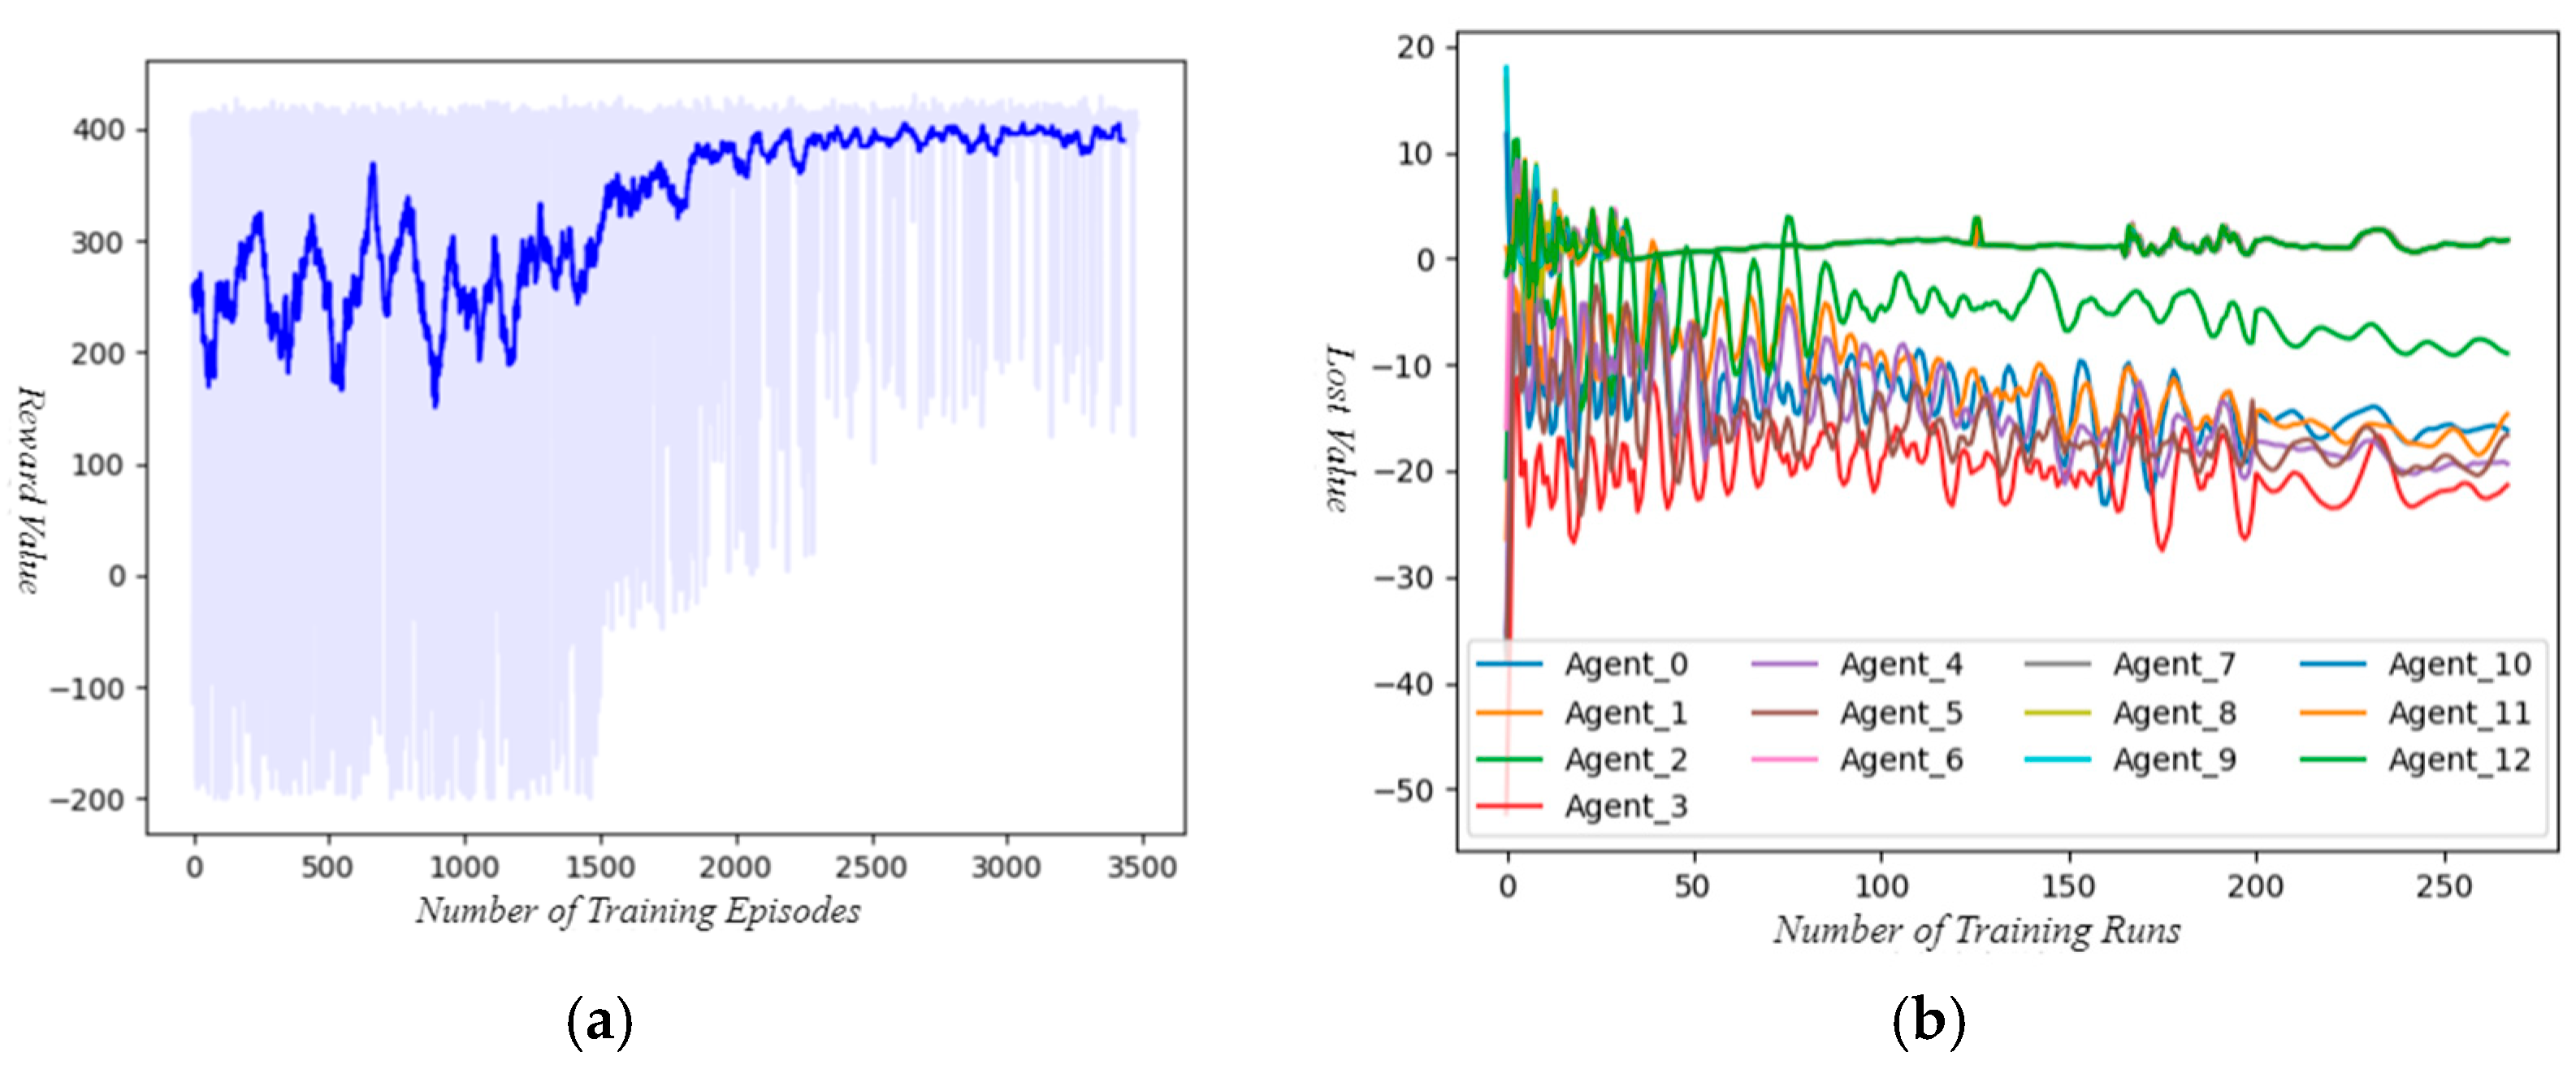
During the training process, samples in the training set were randomly selected as D-RTPD scenarios, and the total number of training episodes for the multi-agent system was set to 3500. The first 1000 episodes served as the random exploration phase, after which the neural network parameters of the multi-agents were learned and updated every 100 episodes. After more than 40 h of training, the training curves shown in Figure 6 were obtained. Figure 6a depicts the cumulative reward curve per episode of the multi-agent system deployed with the MADDPG algorithm, where the dark blue curve represents the moving curve and the light blue background corresponds to the original curve. In addition, considering that ES dispatching agents mainly perform coordinated adjustments according to the RES output in the neighboring areas for D-RTPD tasks, all ES agents share the same policy network in the case study of this section.
Figure 6.
Curve diagram of multi-agent training process under the algorithm proposed in this section. (a) Moving average cumulative reward curve. (b) Loss value curve of the multi-agent policy network.
Considering the randomness of the alternating occurrence of scenarios with different penetration rates in the training set, the reward curve of the multi-agent system during the random exploration phase is highly unstable, and power flow divergence frequently occurs (with the cumulative reward value hovering around −200). This indicates that the day-ahead dispatching plan based on day-ahead forecasting information struggles to cope with the impact of strong uncertainties. The power grid is prone to power flow violations caused by either transmission line overload or insufficient regulation capacity of the slack bus.
After 2500 training episodes, the cumulative reward curve of the multi-agent system stabilizes at around 400, and its loss curve also converges within a certain range. This indicates that the training algorithm proposed in this section, which is based on NFA-GAT and MADDPG, exhibits favorable convergence performance. It enables the policy networks of the multi-agent system to output a deterministic action distribution, and to formulate effective real-time control strategies under the uncertainty impact of high-proportion RES.
As can be seen from the loss function curves in Figure 6b, the multi-agent training loss curve fluctuates sharply at the beginning of this phase. After a period of network parameter updates, it has started to show a convergence trend. Considering that the deterministic gradient descent algorithm is essentially a conservative search strategy, it can be observed that the loss value of the agents keeps fluctuating within a relatively small range. The loss values of the policy networks of multiple agents converge within a specific threshold range after 200 training iterations (corresponding to 3000 episodes of interaction between the agents and the environment). However, considering the dynamic nature of the multi-agent game process, the loss curves of the policy functions still show slight fluctuations.
In addition, given that the seven ES agents share neural network parameters, it can be observed from the figure that the loss function curves of these seven agents all converge to the same level. Combined with the cumulative reward curves, this demonstrates that the method of sharing neural network parameters does not affect the effectiveness of the D-RTPD strategies.
4.3. Validation of Algorithm Deployment Performance
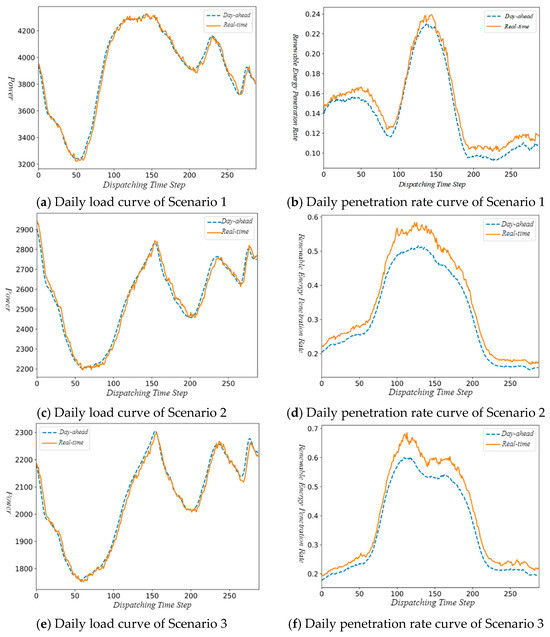
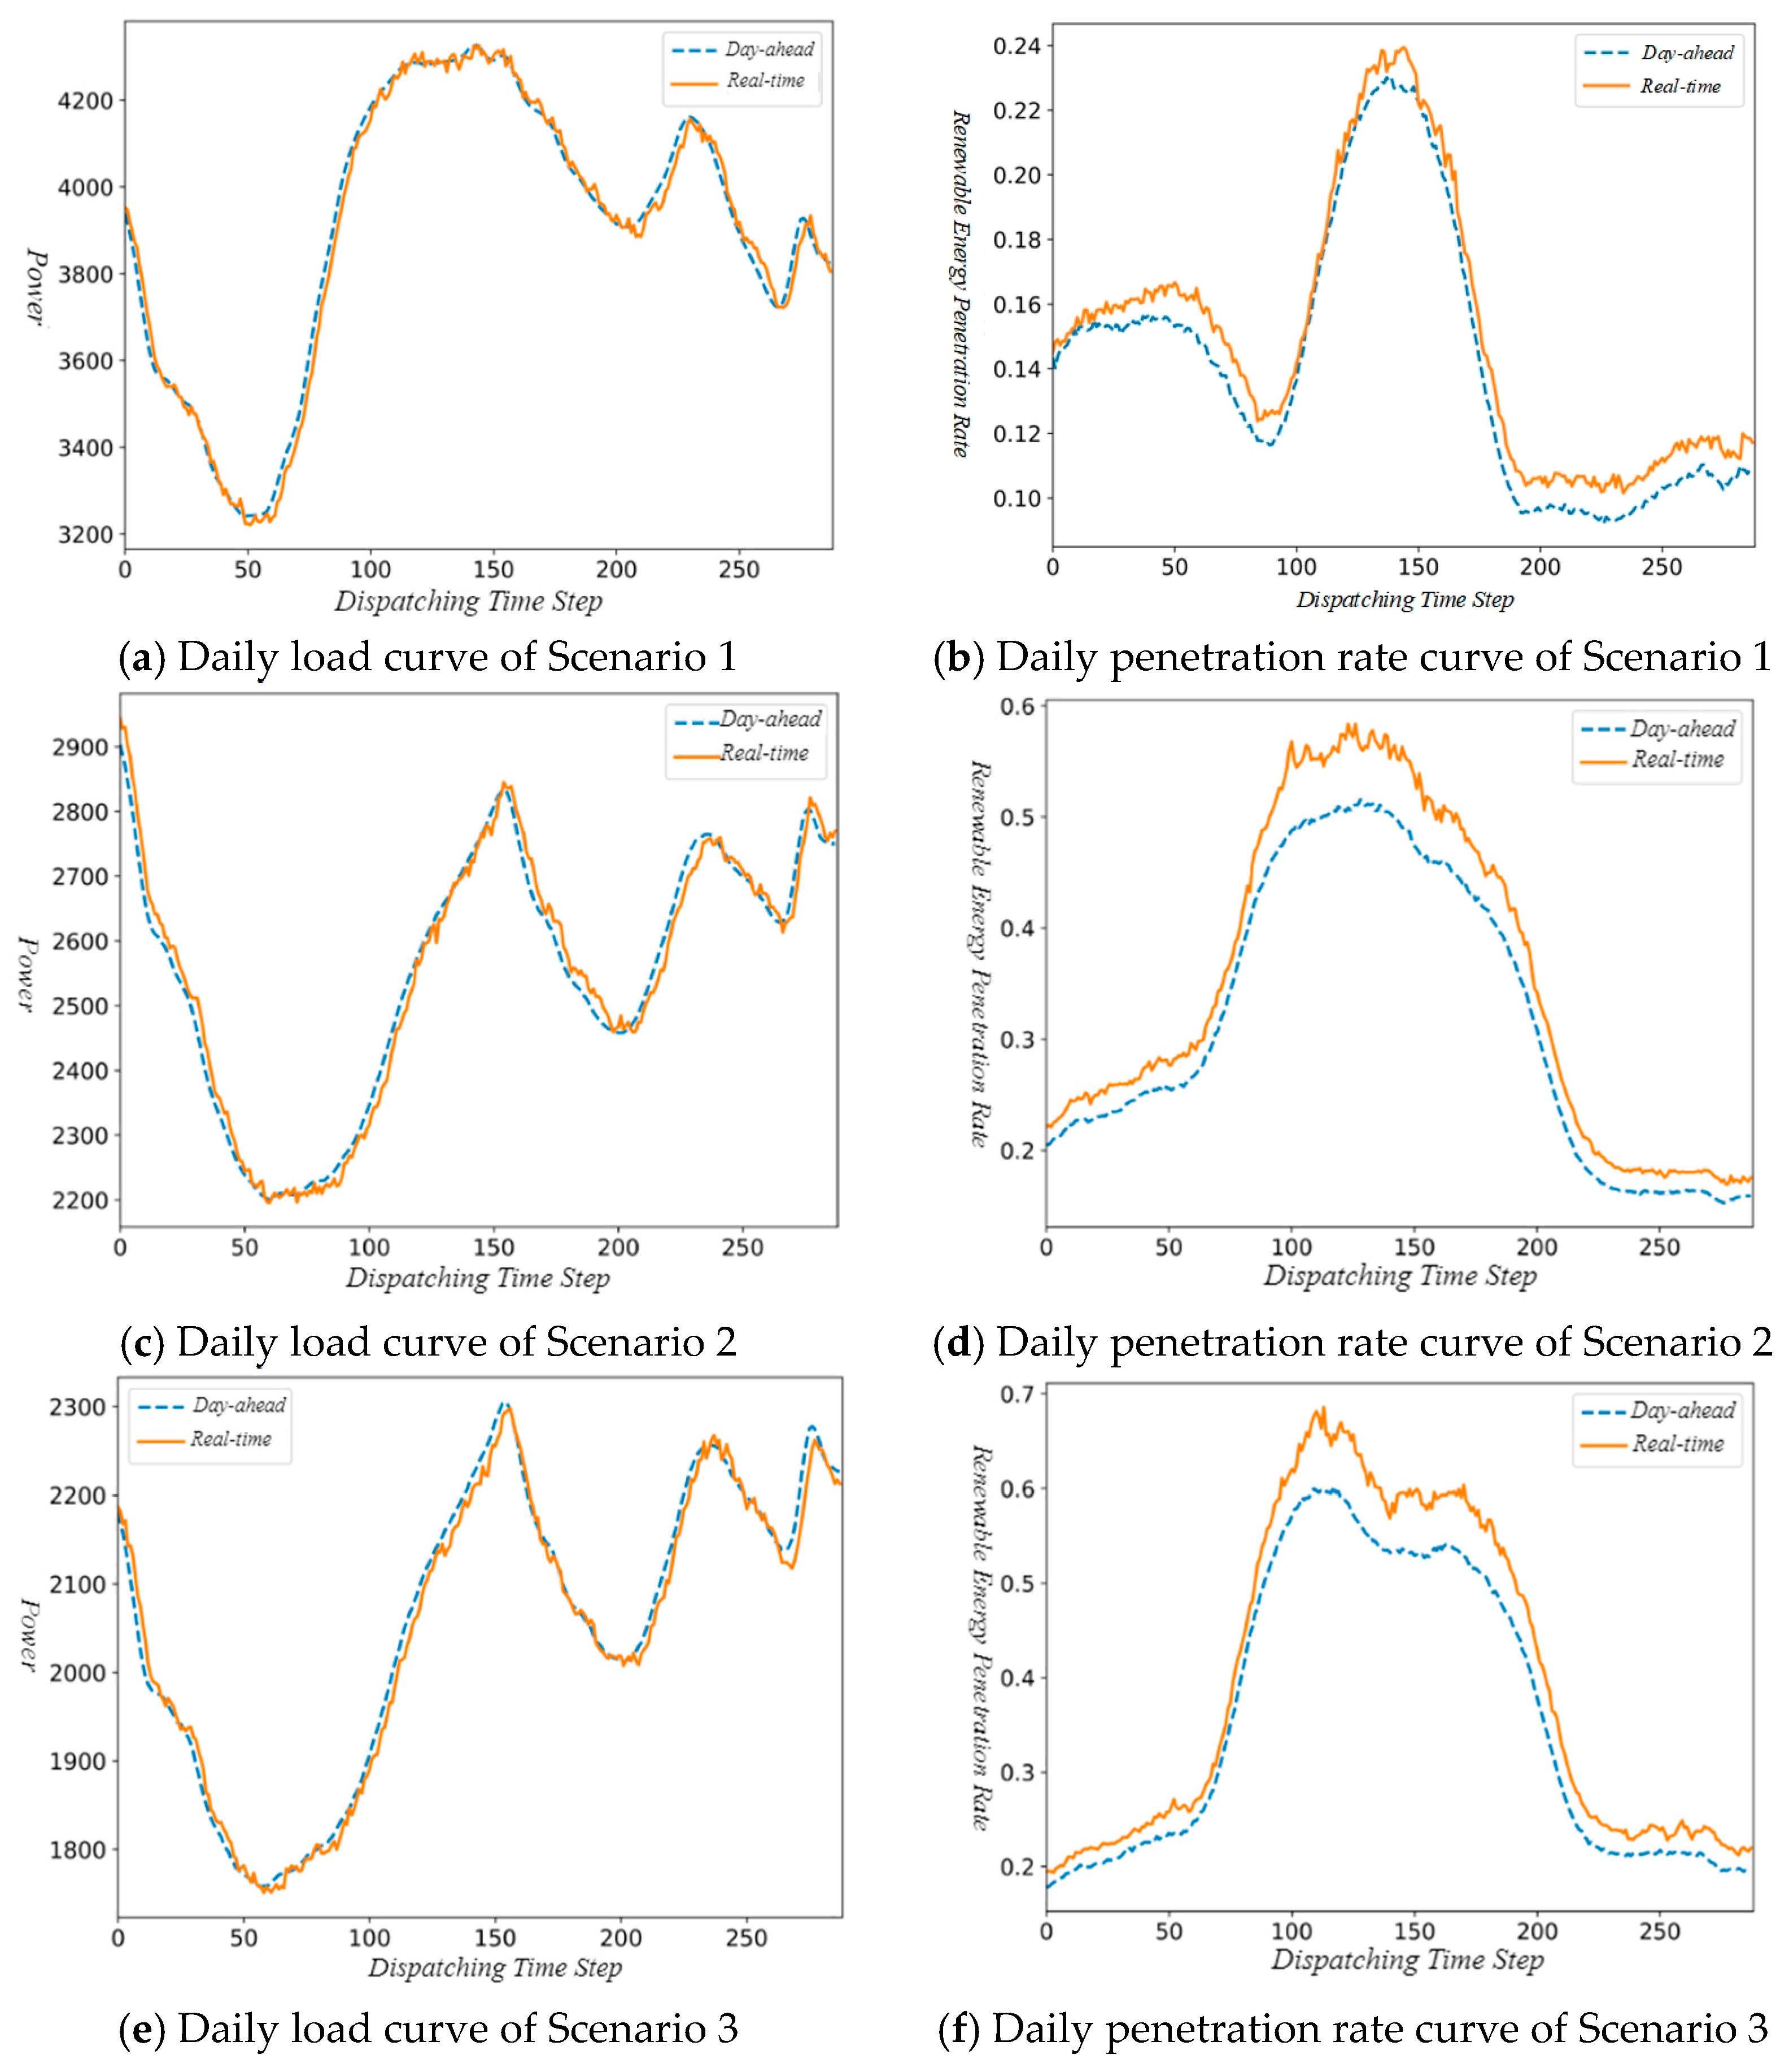
To verify the deployment performance of the multiple agents trained by the algorithm proposed in this section, we deployed the 13 well-trained agents (six generator agents and seven ES agents) in the offline power grid simulation environment. A total of 100 independent scenarios that never appeared in the training and validation sets were established. These scenarios correspond to actual dispatching days, with distinct load and renewable energy source output characteristics to fully verify the generalization ability of the proposed method. Among them, three test scenarios with different penetration rates were randomly selected. These three scenarios were derived from different dispatching days in December, April, and August, respectively, and their load and penetration rate curves are shown in Figure 7.
Figure 7.
Curves of load and RES penetration rate under different test scenarios.
In the scenarios of the training set, we fully considered the fluctuations of sources and loads as well as the uncertainty of RES. The blue curve and the orange curve represent the day-ahead short-term predicted values and real-time short-term predicted values respectively. It can be seen that the magnitude of load fluctuations remains at a relatively low level, while the predicted values of the total RES penetration rate of the system have large deviations, leading to power fluctuations ranging from 100 MW to 500 MW.
As can be seen from Figure 7, due to the characteristic of solar (PV) systems that their output reaches the maximum at noon, RES tends to generate excessive power during the noon period. Day-ahead short-term forecasts may have large deviations during this time window, which makes it easy to encounter challenges such as power balance and power flow regulation when implementing the day-ahead dispatching plan in the noon period.
Although wind and PV generation have a certain degree of complementarity, during the two periods of noon and afternoon when PV output surges sharply and drops drastically, the power grid will face power flow violations and insufficient regulation capacity of the slack bus caused by problems such as inadequate upward and downward ramping capabilities of generators and limited transmission capacity of lines. In such cases, the coordinated dispatching of generators and ESs is required to ensure the safe and reliable operation of the power system.
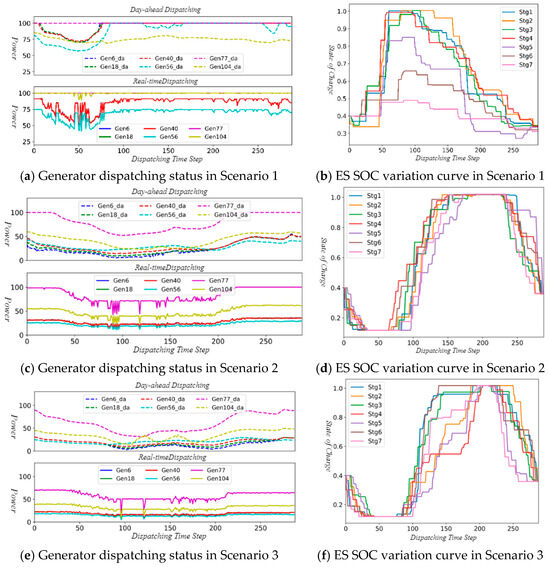
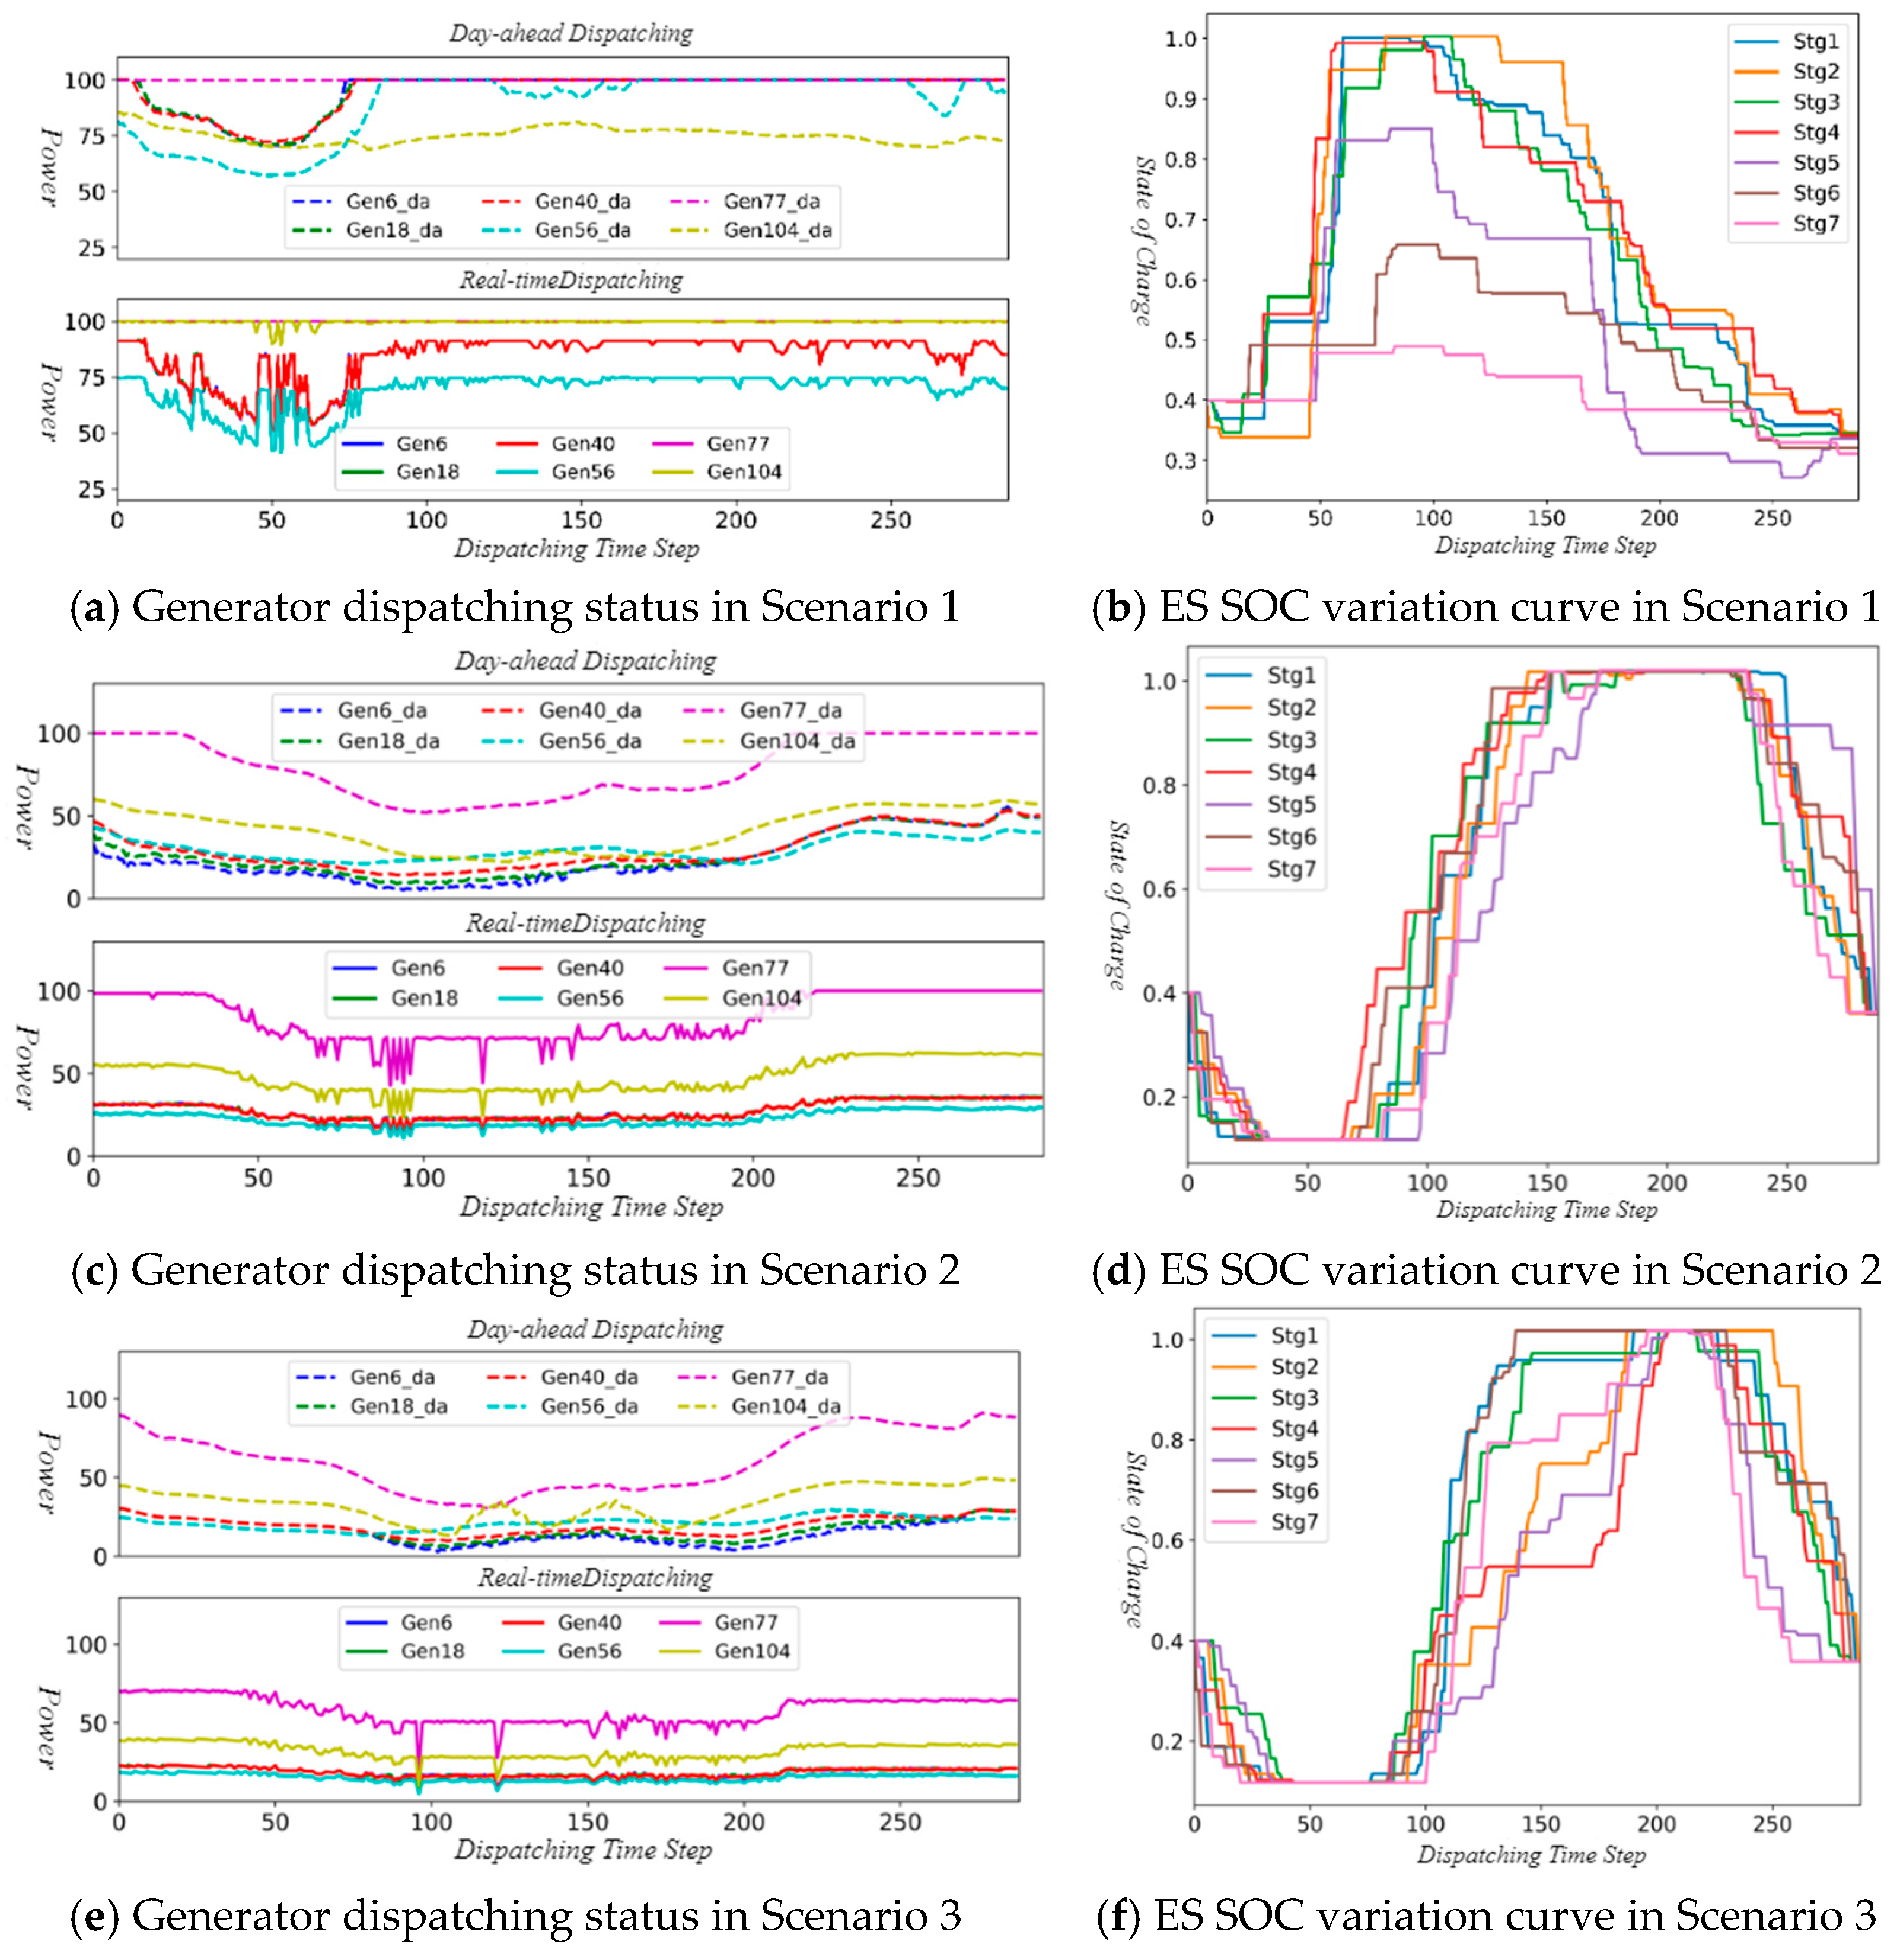
As can be seen from Figure 8, in all three scenarios, the generators in subfigures (a,c,e) reduced their output during the peak solar (PV) generation period. However, taking into account the constraints on generator ramping capabilities and high redispatch costs, the ES agents implemented corresponding coordinated scheduling. By comparing the operational actions of generators and ESs across the three scenarios, it can be concluded that ES regulation serves as the primary means to cope with RES output fluctuations in this case study, with the following details.
Figure 8.
D-RTPD strategies of multi-agents under different scenarios.
In Scenario 1, the RES output exhibited a trend of first rising, then falling, and subsequently surging sharply. The generators made adjustments during the morning hours based on the day-ahead dispatching plan, while no significant redispatch actions were carried out during the noon period of peak PV generation. During noon, the power grid mainly relied on ES actions to absorb the RES output. In the evening, since the ESs needed to discharge to keep the difference in the initial and final SoC within a specific threshold range, their discharge power just offset the decline in RES output.
Scenario 2 and Scenario 3 are roughly similar in terms of scenario characteristics, but Scenario 2 has a higher load level. Therefore, both the generator output level and the depth of ES charging/discharging in Scenario 2 are higher than those in Scenario 3. Considering that the RES output fluctuations in both scenarios show a single-peak characteristic, the dispatching strategies adopted by the ES agents in the two scenarios are generally similar.
Combined with the D-RTPD strategies of multi-agents under different scenarios in Figure 8, an analysis of the maximum line load rate of the system in Figure 9 reveals the following. In December (Scenario 1), when the RES penetration rate is relatively low, the total power fluctuation caused by RES uncertainty remains at a low level, and the maximum line load rate of the power grid is also low. However, due to the sharp drop followed by a sudden surge of RES output in the morning, the day-ahead dispatching plan suffers from insufficient downward regulation capacity of the slack bus. The D-RTPD strategy leverages the charging capability of ESs to absorb the surplus RES output, thus resolving the issue of insufficient downward regulation capacity of the system.
Figure 9.
Maximum line load rate of the system after implementing the D-RTPD plan under different scenarios.
In April and August, when the RES penetration rate is relatively high, although the total load during the dispatching period is not large, the system mainly relies on the output of RES with high penetration rate to supply the load. As can be seen from the figure, during the noon period of peak RES generation, the limitations of generators’ downward ramping capability lead to severe line congestion, resulting in power flow violations in the system lines under the day-ahead dispatching plan. In contrast, the D-RTPD strategy utilizes the characteristics of ESs: it charges the ES when RES output surges to avoid power flow violations, and discharges when RES output drops sharply, thereby reducing the redispatch costs of generators.
By observing the line load rate during the evening period across the three scenarios, it can be found that considering the constraint on the initial and final SOC values of ESs in this section, ES stores a large amount of electricity during the noon period of peak RES generation and thus has to discharge in the evening. This complements the output characteristics of RES. Therefore, during the evening dispatching period when the load level is still relatively high, the maximum line load rate of the power grid remains at a high level. Meanwhile, generators reduce their output during the noon period of surging RES output, and only perform minor redispatch operations in the evening when ES takes on the main power supply task.
Finally, combining the agent modeling characteristics, scenario characteristics and D-RTPD strategies, we conduct a macro-analysis of the three scenarios. By comparing the load characteristics, RES characteristics and agent action strategies across the three different scenarios, it can be found that the action strategies of ES agents are mainly focused on source-load balance regulation, whereas the generator agents act primarily based on the SoC of ESs. The specific manifestations are as follows:
In Scenario 1, the RES output experiences a trend of first increasing and then decreasing during the morning dispatching period. During this period, generator agents are mainly responsible for downward and upward output adjustments. However, due to the relatively low level of RES penetration, some ESs remain in a low SOC state. During the noon period with high load levels, the RES output and ES discharge can match the load changes, so the generator agents do not perform any redispatch actions. Finally, when both the load level and RES output decrease simultaneously, the ESs continue discharging to maintain the source-load balance of the system.
By comparing Scenarios 2 and 3 with Scenario 1, it can be observed that since the load peaks in Scenarios 2 and 3 occur earlier and the RES output presents a single-peak characteristic, the ES agents in Scenarios 2 and 3 implement the discharge strategy at the initial stage. Then, during the noon period when RES output surges sharply, the downward adjustment of generators and charging of ESs are utilized to absorb the excess output. In the evening when RES output drops drastically, the ES agents discharge to maintain source-load balance, and the generator agents refrain from redispatch operations after observing the state of ESs. As the time points of RES output decline in Scenarios 2 and 3 are later than that in Scenario 1, the second discharge time of the ES agents in Scenarios 2 and 3 is also significantly later than that in Scenario 1.
4.4. Comparison of Different Networks
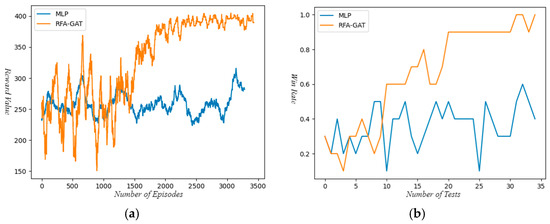
To verify the role of the NFA-GAT network layer proposed in this section in improving algorithm effectiveness, we adopted two structures—the fully connected layer (MLP) and NFA-GAT—respectively in the agent policy network of the proposed algorithm. Under the same algorithm framework, hyperparameters, random scenario seeds, and training duration, the two neural network structures were used to test the multi-agent system across 10 random scenarios every 100 training episodes. A “win” was defined as the power grid maintaining safe and reliable operation throughout 288 D-RTPD periods. The curve comparison diagram is shown in Figure 10.
Figure 10.
Comparison of moving average reward curves and win rate curves under different neural networks. (a) Comparison of moving average cumulative reward curves. (b) Comparison of win rate curves in the testing process.
As can be seen from Figure 10a, the multi-agent system with the NFA-GAT layer can achieve high reward values and win rates after training. This indicates that NFA-GAT can help multi-agents efficiently capture neighborhood information, which equips them with the ability to effectively perceive power grid states and enables them to reach the Nash equilibrium state. In contrast, the multi-agent system with MLP fails to capture power grid characteristics effectively, resulting in non-convergence even after more than 3000 training episodes, with both its moving average reward values and win rates lower than those of the system with NFA-GAT.
In addition, by comparing Figure 10a,b, it can be observed that the neural network with NFA-GAT suffers from significant instability in the early training stage, where its moving average reward curve fluctuates sharply and the multi-agents fail to achieve satisfactory win rates. This may be attributed to the fact that the learning of attention coefficients increases the training burden of the neural network. After the neural network learns stable attention coefficients, the performance of the multi-agents is significantly improved, which further demonstrates the effectiveness of the NFA-GAT layer in multi-agent D-RTPD tasks.
4.5. Comparison of Different Algorithms
To better highlight the advantages of the proposed algorithm, a comparison of the solution effects among various algorithms is conducted, with specific details as follows: (1) Model-driven method: the Alternating Direction Method of Multipliers (ADMM); (2) Data-driven method: Q-MIX algorithm. All experiments with “10 independent random seeds” are reported as the “mean ± standard deviation” of all metrics. The comparative results are summarized in Table 2.
Table 2.
Performance comparison among different algorithms.
In terms of solution efficiency, the proposed method achieves an average solution time of 23.5 ms per step, which is approximately 8.1 times faster than ADMM. While Q-MIX exhibits a slightly shorter solution time (21.5 ms), its performance in operational safety and economy is significantly inferior. Regarding grid operational safety, the proposed method limits the maximum line load rate to 98.7% (well below the 100% violation threshold) and achieves a zero power flow violation rate. Although the model-driven ADMM achieves 0% power flow violation rate, its solution efficiency is low. In contrast, the purely data-driven Q-MIX exhibits high solution efficiency, but the power flow violation rate reaches 14.3%. Our proposed “data-driven + NFA-GAT” method has better performance on power flow constraints satisfaction and solution efficiency than a single data-driven or model-driven method. Q-MIX suffers from severe line overload (130.5%) and a 14.3% violation rate. This gap stems from the proposed method’s coordinated decision-making framework: NFA-GAT enables accurate perception of grid states, while the prior-guided mechanism eliminates constraint-violating actions, ensuring stable power flow constraints satisfaction. Economically, the proposed method reduces the total daily dispatching cost to $12,845 ± 126, representing a nearly 13.0% reduction compared to Q-MIX. This cost advantage is attributed to the optimal coordination between generator rescheduling and energy storage regulation, which minimizes unnecessary redispatch costs and energy storage operation losses. Overall, the proposed method balances solution efficiency, operational safety, and economic performance, outperforming traditional model-driven and data-driven methods in handling the strong uncertainty of high-proportion renewable energy integration.
4.6. Results of Sensitivity Analysis on the Spatial Discount Factor
Table 3 presents the sensitivity analysis results of the spatial discount factor (with values of 0.6, 0.7, 0.8, and 0.9). As observed, the performance of the proposed NFA-GAT model exhibits a significant dependence on , with achieving the optimal comprehensive performance. Specifically, when , the model attains the highest average cumulative reward 405.6 and scenario win rate 92.3%, accompanied by a zero power flow violation rate and a low maximum line load rate 98.7%, which is well below the 100% violation threshold.
Table 3.
Performance comparison among different spatial discount factors.
For and , the lower discount factors lead to insufficient attenuation of high-order neighborhood information, resulting in redundant feature aggregation. This not only reduces the model’s ability to capture critical spatial correlations (reflected by lower cumulative rewards and win rates) but also introduces minor power flow violations (1.8% and 0.9% respectively). In contrast, overemphasizes the contribution of distant neighborhood nodes due to the weak discount effect, which distorts the spatial priority of grid features. Consequently, the cumulative reward 381.2 and win rate 87.5% decline compared to .
These results validate that strikes an optimal balance between effective multi-order neighborhood feature aggregation and rational spatial weight allocation. It enables the NFA-GAT network to accurately perceive the attenuation of electrical quantity influence with topological distance, thereby enhancing the agents’ understanding of grid operating states and improving the reliability and efficiency of distributed real-time power dispatch.
4.7. Scalability and Engineering Practical Application of the Proposed Method
To verify the deployment value of the proposed NFA-GAT-MADDPG method in actual power systems, this section systematically demonstrates the practical application potential of the method from three dimensions: grid scale scalability, agent quantity scalability and engineering scenario adaptability, combined with quantitative data and comparative analysis, providing theoretical and practical references for subsequent engineering implementation.
4.7.1. Grid Scale Scalability
The NFA-GAT in the proposed method adopts a sparse neighborhood feature aggregation mechanism, which only performs feature extraction and information fusion on the agent’s local and K-order neighborhood nodes without feature calculation for all grid nodes. This makes the computational complexity grow linearly with the number of grid nodes, breaking the bottleneck of the exponential growth of computational complexity of traditional graph neural networks in large-scale power grids. To quantitatively verify the performance of the method under grid scale expansion, three test systems of different scales (IEEE 30-bus, IEEE 118-bus, and IEEE 300-bus) are selected with a consistent renewable energy penetration rate of about 75%. The core performance indicators of the method under different grid scales are tested, and the results are shown in Table 4.
Table 4.
Comparison of method performance indicators under different grid scales.
It can be seen from Table 4 that as the number of grid nodes increases from 39 to 300 (10 times expansion), the average solution time per step of the method increases from 8.2 ms to 56.7 ms (only 6.9 times expansion), and the 0% power flow violation rate is always maintained. The maximum line load rate is controlled within the safety threshold of 99.2%.
4.7.2. Agent Quantity Scalability
In multi-agent coordinated D-RTPD, the number of agents critically affects scheduling performance and algorithm convergence. Aiming at the influence of agent quantity on algorithm convergence and dispatch effect in multi-agent cooperative dispatch, the proposed method designs a parameter sharing + hierarchical coordination agent configuration mechanism to realize the flexible expansion of agent quantity. Taking the benchmark IEEE 118-bus system with configurations of six generator dispatch agents and seven energy storage (ES) agents, two comparative cases are investigated: Case 1 with three generator dispatch agents and seven ES agents, and Case 2 with 12 generator dispatch agents and seven ES agents.
The influence of the change of agent quantity on the convergence and dispatch performance of the method is quantitatively analyzed, and the results are shown in Table 5, with the convergence trend corresponding to Figure 11.
Table 5.
Comparison of method performance under different agent quantities.
Figure 11.
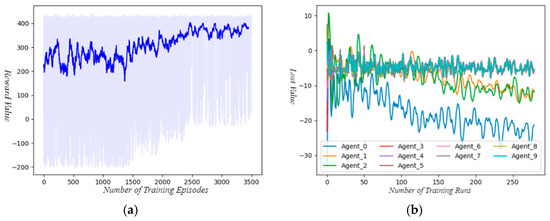
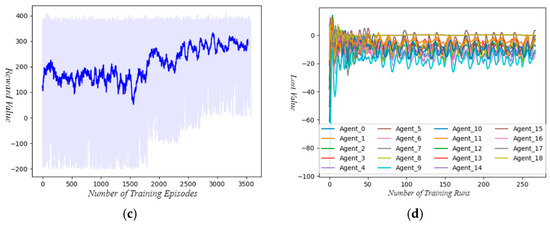
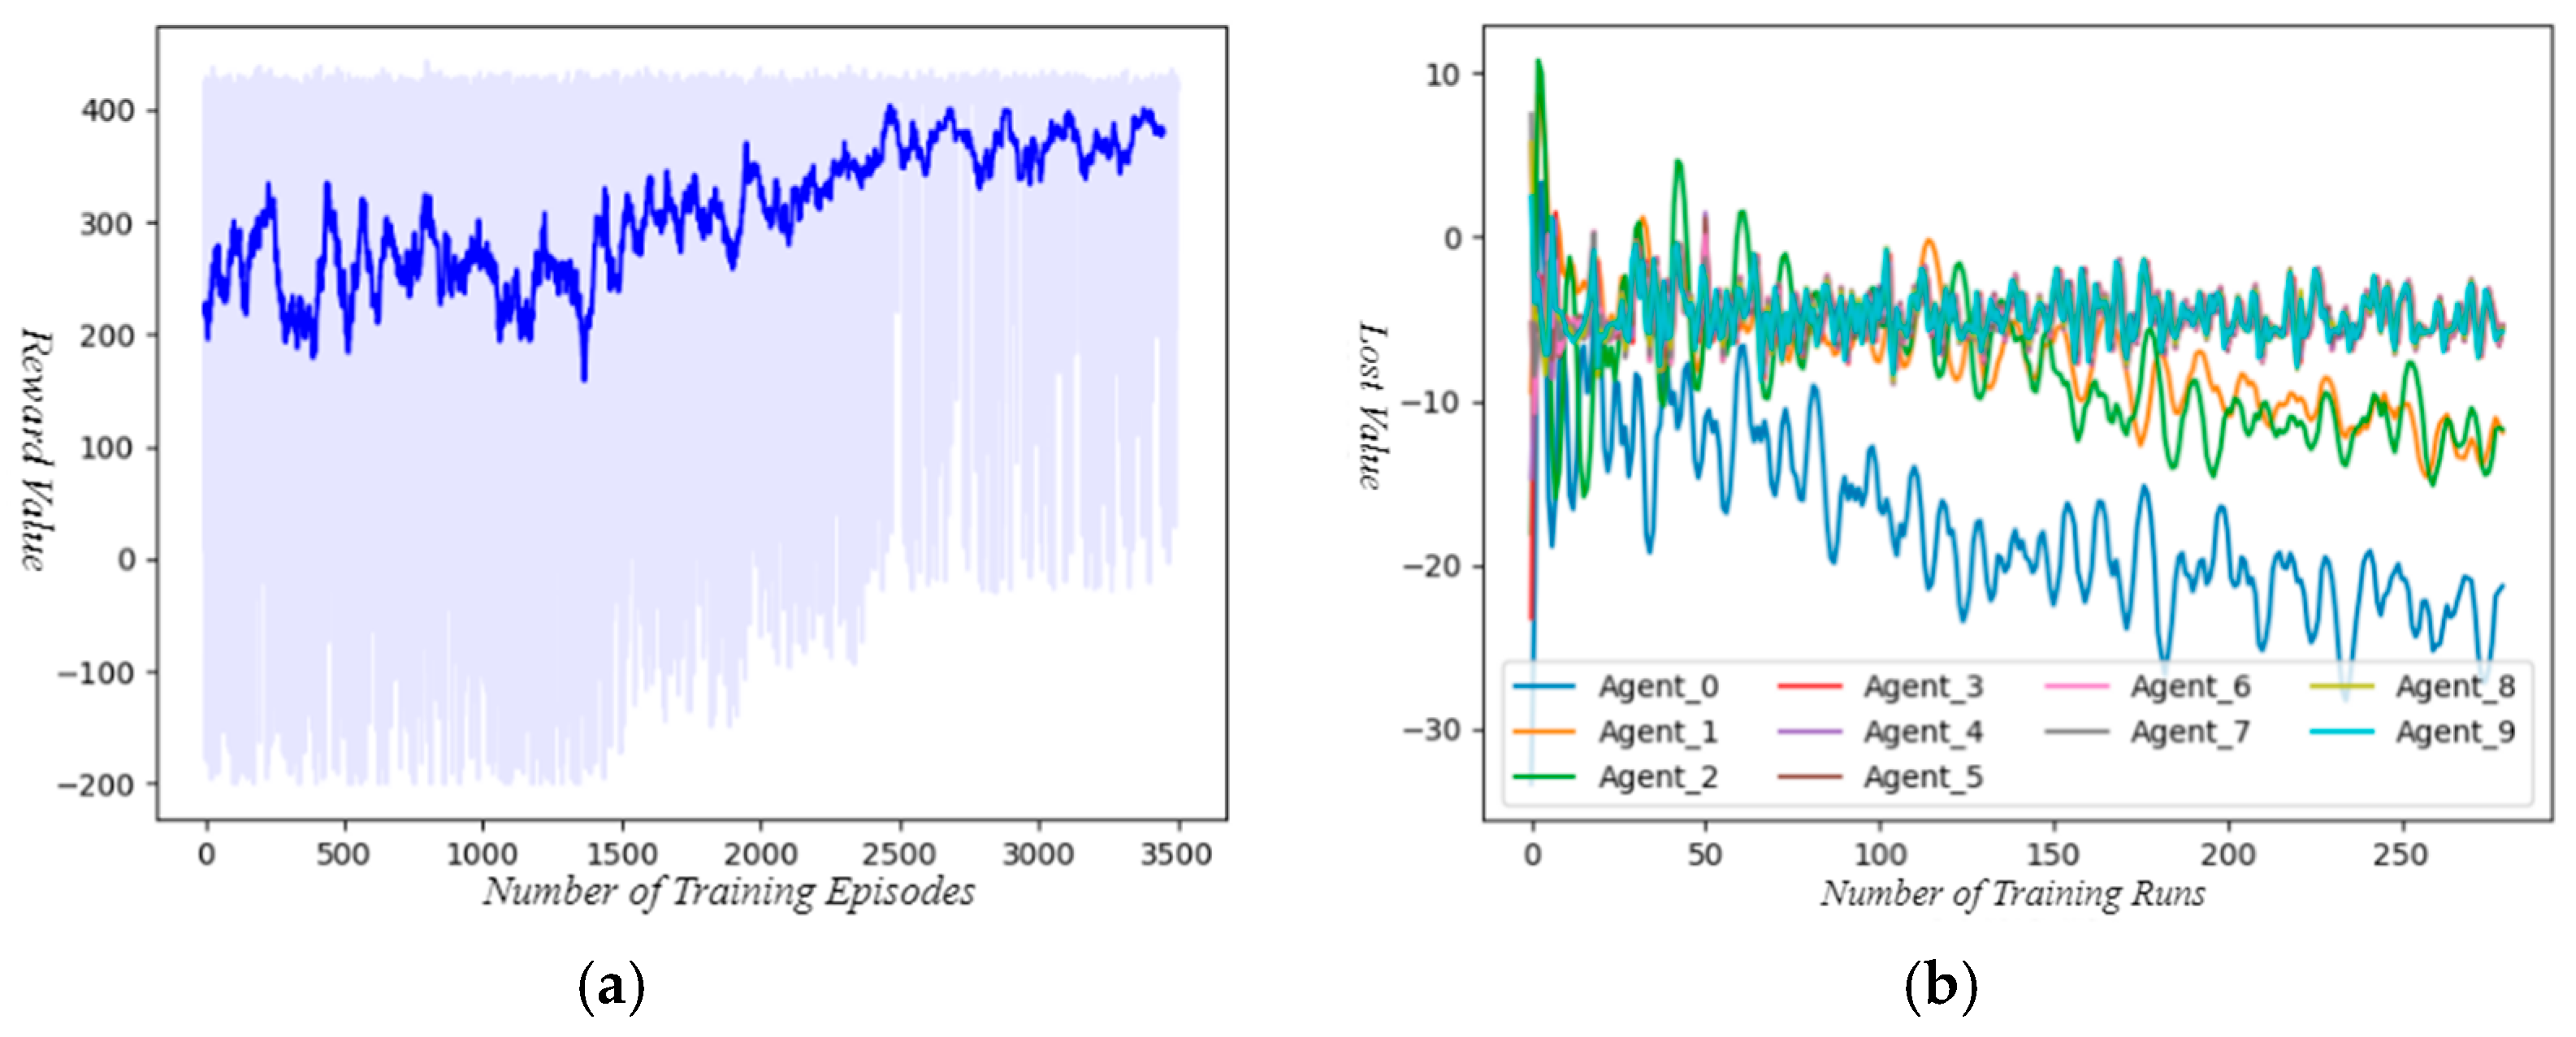
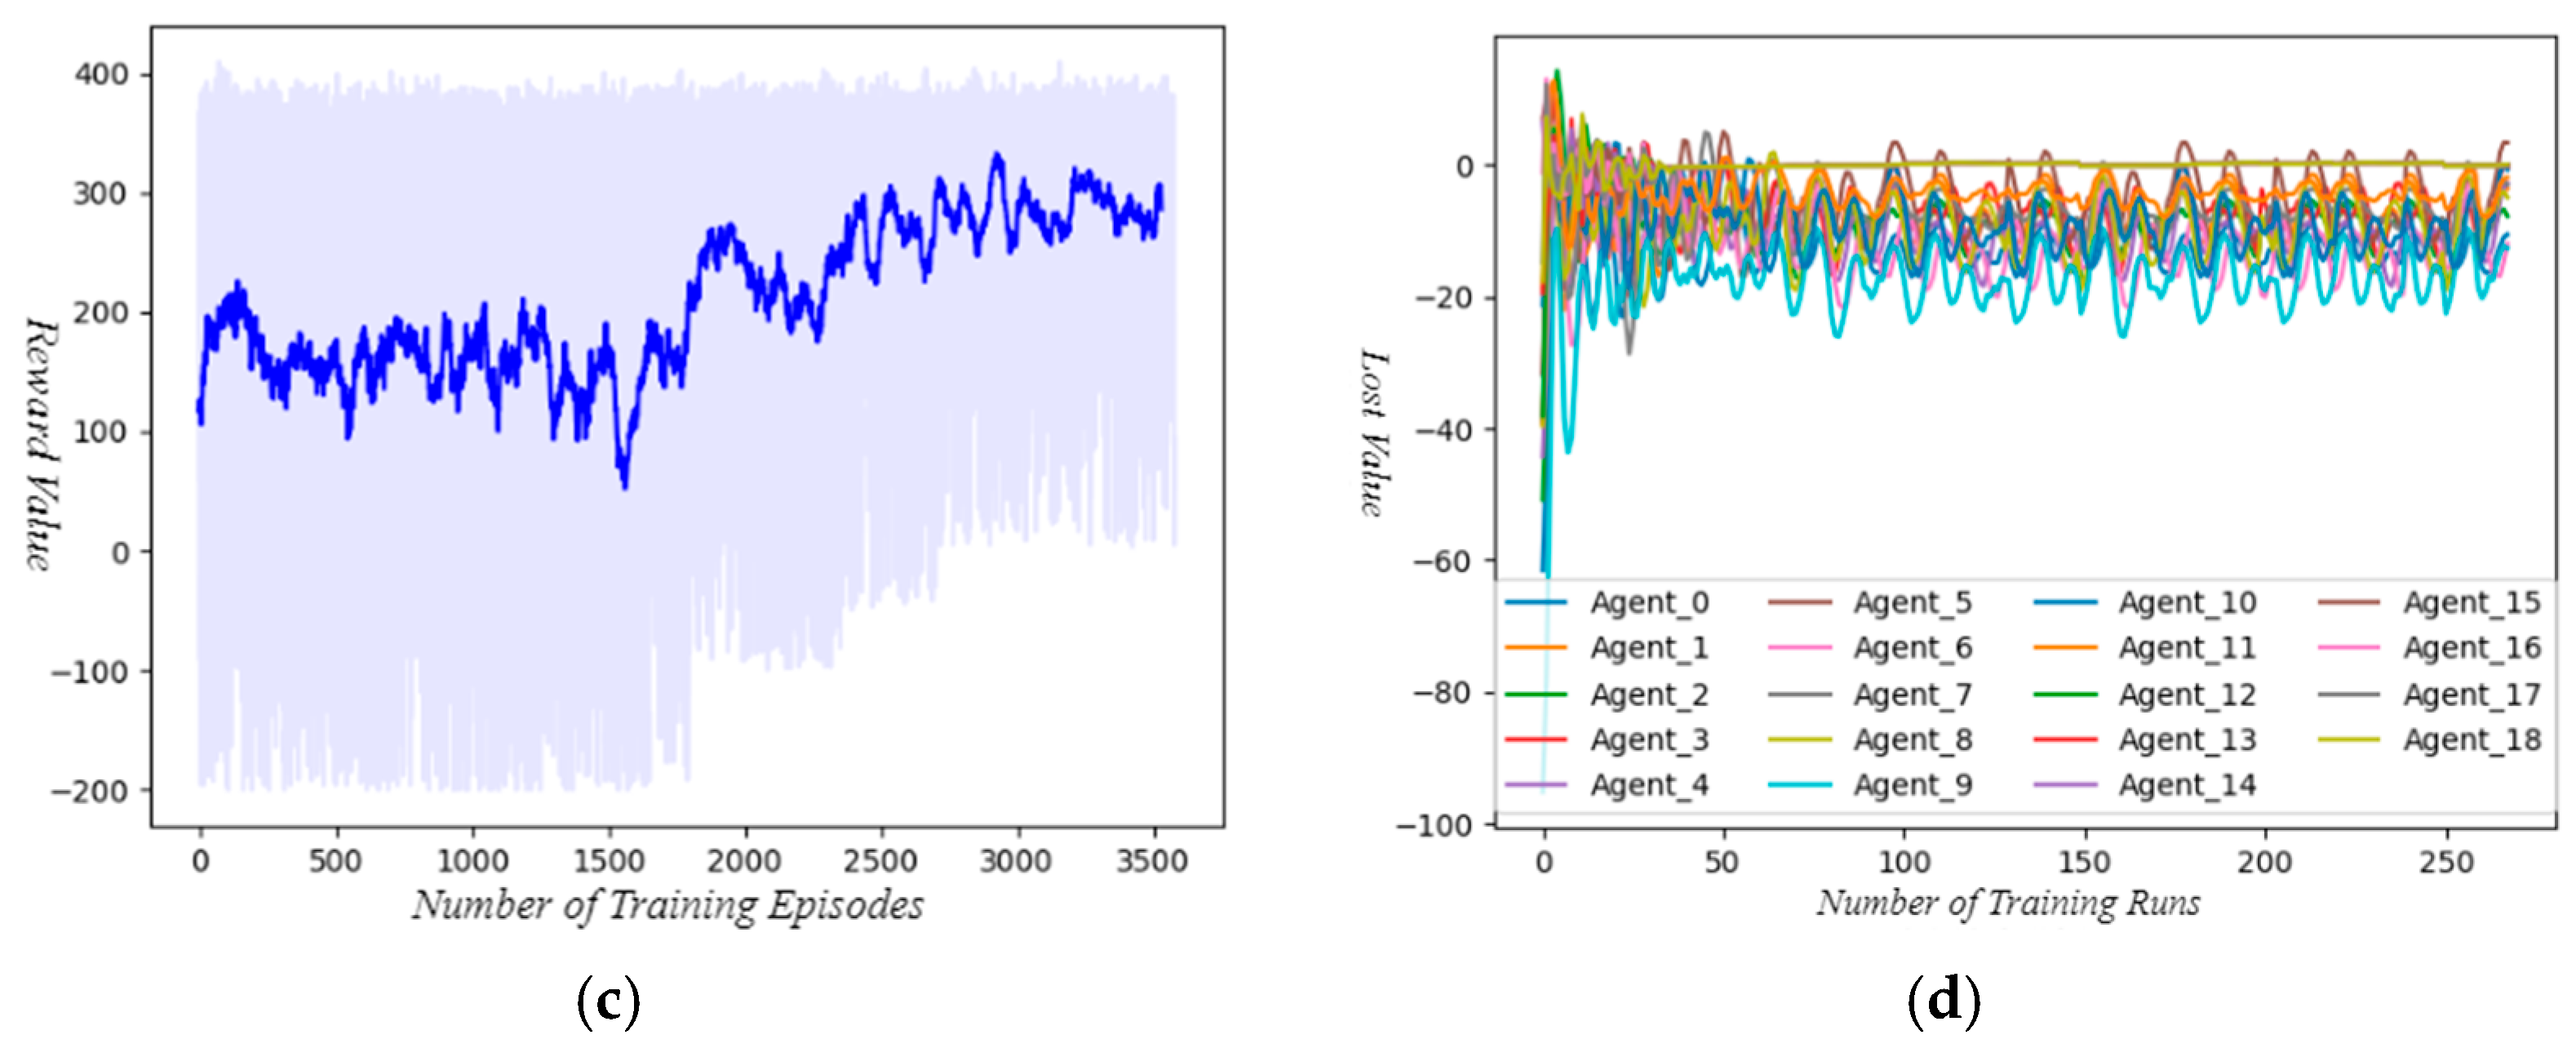
Curves of multi-agent training process under different agent quantities. (a) Moving average cumulative reward curve of Case 1. (b) Loss value curve of the multi-agent policy network for Case 1. (c) Moving average cumulative reward curve of Case 2. (d) Loss value curve of the multi-agent policy network for Case 2.
It can be concluded from Table 5 that due to insufficient dispatchable resources, a power flow violation rate of 1.2% occurs, and the maximum line load rate is close to the safety critical value of 99.5%. Although the daily dispatch cost is low, the operational safety of the power grid is sacrificed. The number of agents matches the demand of grid partition dispatch, with the least training convergence iterations (3200 times) and the highest average cumulative reward (405.6), achieving the optimal balance between safety and economy. Although the 0% violation rate is maintained, the game complexity among agents increases, the training convergence iterations increase by 41.2%, the daily dispatch cost rises by 6.3%, and the cumulative reward decreases slightly.
Results in Figure 11 show that both cases exhibit more fluctuating moving average cumulative reward curves and poorer convergence compared with the benchmark. In Case 1, insufficient dispatchable generators cause inadequate scheduling resources under high renewable penetration, leading to power flow violations and insufficient slack bus regulation capacity; nevertheless, its lower redispatch cost in certain scenarios enables its maximum cumulative reward to approach or exceed the benchmark. In Case 2, more generator agents aggravate game instability and reward volatility, with higher redispatch costs, yet its maximum cumulative reward remains close to the benchmark.
Moreover, the policy networks in both cases tend to converge during training, while their policy loss functions oscillate due to scenario-induced reward fluctuations. Compared with Case 1, Case 2 has higher policy network loss values as agent numbers increase. This indicates that more complex coordination strengthens mutual policy interference among agents, forming a bottleneck for applying large-scale multi-agent systems to real-time power grid dispatch.
4.7.3. Engineering Scenario Adaptability
Based on the design idea of distributed decision-making and local neighborhood information interaction, the proposed method is highly adaptable to the operational characteristics and constraint conditions of actual power systems. Combined with the comparison with traditional methods and the requirements of engineering standards, the engineering adaptability is verified from four dimensions: communication constraints, safety standards, modeling requirements, and economic real-time performance. The quantitative comparison results are shown in Table 6 and the core performance indicators all meet the relevant engineering requirements of the Guidelines for Security and Stable Operation of Power Systems.
Table 6.
Comparison of method performance under different algorithm.
Combined with Table 6 and actual engineering requirements, the 0% power flow violation rate and 98.7% maximum line load rate fully meet the safety operation requirements of power systems for “no overload and no violation”, avoiding safety accidents such as line overload tripping. As a data-driven method, it does not need to establish a complex mathematical model of the power grid, and realizes policy learning only through interaction with the grid simulation environment. It effectively avoids the problems of parameter perturbation and model mismatch in actual power grids and has strong adaptability to changes in grid operating states. Balancing economy and real-time performance: The average solution time per step is 23.5 ms, which meets the time requirement of 5-min scale distributed real-time power dispatch; the daily dispatch cost is reduced by 13.0% compared with Q-MIX. Although it is slightly higher than ADMM, the solution efficiency is improved by 8.1 times, achieving a three-dimensional balance of real-time performance, economy and safety, which is in line with the core demand of actual power system dispatch.
5. Conclusions
This study addresses the intense uncertainty brought by high-proportion renewable energy sources (RES) to distributed real-time power dispatch (D-RTPD) in power systems, and proposes an integrated solution that combines the NFA-GAT with MADDPG based on a source–storage coordination paradigm. Validated on the IEEE 118-bus test system with a 75.2% RES installed capacity ratio, the proposed method demonstrates prominent performance in D-RTPD optimization: MADDPG guarantees stable collaborative dispatch across multi-regional power grids through its centralized criticism and decentralized execution mechanism, where ES agents can autonomously learn adaptive control strategies, charging during RES output surges and discharging during output dips, to mitigate RES fluctuations and cut down dispatch costs effectively. The NFA-GAT, augmented with a distance-dependent spatial discount factor, enables efficient aggregation of multi-order neighborhood information, which enhances agents’ perception of grid operating states and outperforms the MLP structure in terms of cumulative reward and scenario win rate. Additionally, the number of dispatch agents is found to exert a significant impact on the algorithm’s performance: an insufficient number of generator agents leads to a shortage of dispatchable resources and subsequent power flow violations, while an excessive number exacerbates the complexity of inter-agent game, causes multiplicative growth of model parameters, and impairs the convergence stability of the algorithm.
Future research will focus on the following issues:
- (1)
- Online Update of Graph Attention Weights Under Dynamic Topology Changes: Study the online learning mechanism of NFA-GAT weights during line switching/distributed power access without retraining the model;
- (2)
- Hierarchical Collaborative Scheduling Strategy for Large-Scale Multi-Agents: Design a “Bi-level” hierarchical architecture, where the upper-level agent is responsible for inter-regional coordination and lower=level agents for local scheduling, addressing convergence and computational complexity issues;
- (3)
- Robust Scheduling Optimization Under Extreme New Energy Fluctuation Scenarios: Adopt GAN to generate extreme scenarios of sudden rise/drop in new energy output, and optimize the constraint processing capability of NFA-GAT in feature extraction and prior guidance mechanisms;
- (4)
- Adaptive Sparsification Improvement and Computational Efficiency Enhancement of NFA-GAT [32]: Integrate the sparse graph attention mechanism to reduce the computational load of non-critical nodes and improve the real-time performance of ultra-large-scale power grids.
Author Contributions
Conceptualization, B.C. and C.L.; methodology, B.C.; software, W.W.; validation, B.C. and Q.L.; formal analysis, L.M.; resources, W.W.; data curation, W.W.; writing—original draft preparation, B.C.; writing—review and editing, Q.L.; supervision, X.W. All authors have read and agreed to the published version of the manuscript.
Funding
This research received no external funding.
Data Availability Statement
The original contributions presented in this study are included in this article. Further inquiries can be directed to the corresponding author.
Conflicts of Interest
Authors Baisen Chen, Chenghuang Li, Lingteng Ma, and Xiaowei Wang were employed by the company Yangtze Survey, Planning, Design and Research Co., Ltd.; Author professor Qingfen Liao was employed by School of Electrical Engineering and Automation, Wuhan University; Author Wenyi Wang was employed by the company Central Southern China Electric Power Design Institute. The remaining authors declare that this research was conducted in the absence of any commercial or financial relationships that could be construed as a potential conflict of interest.
References
- Han, X.Q.; Li, T.J.; Zhang, D.X.; Zhou, X. New Problems and Key Technologies of New Power System Planning Under the “Dual Carbon” Goals. High Volt. Eng. 2021, 47, 3036–3046. [Google Scholar] [CrossRef]
- Maulik, A.; Das, D. Optimal Power Dispatch Considering Load and Renewable Generation Uncertainties in an AC–DC Hybrid Microgrid. IET Gener. Transm. Distrib. 2019, 13, 1164–1176. [Google Scholar] [CrossRef] [Scilit]
- Wang, B.; Xu, J.; Sun, Y.Z.; Xu, Q. Stochastic Dynamic Economic Dispatch of Power Systems with Wind Power Based on General Distribution. Autom. Electr. Power Syst. 2016, 40, 17–24. [Google Scholar]
- Zhang, Y.; Ai, X.; Wen, J.; Fang, J.; He, H. Data-Adaptive Robust Optimization Method for the Economic Dispatch of Active Distribution Networks. IEEE Trans. Smart Grid 2018, 10, 3791–3800. [Google Scholar] [CrossRef] [Scilit]
- Ye, Q.Q.; Wu, M.Q.; Wu, X.G.; Chen, W.; Gao, T. Fully Distributed Optimal Power Flow Algorithm for Multi-Area DC Systems Based on ADMM. Zhejiang Electr. Power 2024, 43, 13–24. [Google Scholar]
- Wen, G.H.; Yu, X.H.; Liu, Z.W. Research Progress on Distributed Economic Dispatch in Smart Grids: A Review. Front. Inf. Technol. Electron. Eng. 2021, 22, 25–39. [Google Scholar] [CrossRef] [Scilit]
- Le, J.; Zhou, Q.; Zhao, L.G.; Wang, Y. Review on Distributed Economic Dispatch Methods of Power Systems Based on Consensus Algorithms. Electr. Power Autom. Equip. 2020, 40, 44–54. [Google Scholar]
- Pourbabak, H.; Luo, J.; Chen, T.; Su, W. A Novel Consensus-Based Distributed Algorithm for Economic Dispatch Based on Local Estimation of Power Mismatch. IEEE Trans. Smart Grid 2017, 9, 5930–5942. [Google Scholar] [CrossRef] [Scilit]
- Li, Q.; Gao, D.W.; Zhang, H.; Wu, Z.; Wang, F.-Y. Consensus-Based Distributed Economic Dispatch Control Method in Power Systems. IEEE Trans. Smart Grid 2017, 10, 941–954. [Google Scholar] [CrossRef] [Scilit]
- Bajaña-Zajía, J.; Trillo, J.R.; Cabrerizo, F.J.; Morente-Molinera, J.A. Consensus-Based Automatic Group Decision-Making Method with Reliability and Subjectivity Measures Based on Sentiment Analysis. Algorithms 2025, 18, 477. [Google Scholar] [CrossRef] [Scilit]
- Yao, R.; Xie, H.; Wang, C.; Xu, X.; Du, D.; Varga, L.; Hu, Y. A Multi-Agent-Based Microgrid Day-Ahead Optimal Operation Framework with Liquid Air Energy Storage by Hybrid IGDT-STA. J. Energy Storage 2024, 86, 111318. [Google Scholar] [CrossRef] [Scilit]
- Qiu, D.; Wang, Y.; Zhang, T.; Sun, M.; Strbac, G. Hierarchical Multi-Agent Reinforcement Learning for Repair Crews Dispatch Control Towards Multi-Energy Microgrid Resilience. Appl. Energy 2023, 336, 120826. [Google Scholar] [CrossRef] [Scilit]
- Wang, J.; Xu, W.; Gu, Y.; Song, W.; Green, T.C. Multi-Agent Reinforcement Learning for Active Voltage Control on Power Distribution Networks. In Proceedings of the 35th Conference on Neural Information Processing Systems (NeurIPS 2021), Virtual, 6–14 December 2021. [Google Scholar]
- Liu, J.; Ma, Y.; Chen, Y.; Zhao, C.; Meng, X.; Wu, J. Multi-Agent Deep Reinforcement Learning-Based Cooperative Energy Management for Regional Integrated Energy System Incorporating Active Demand-Side Management. Energy 2025, 319, 135056. [Google Scholar] [CrossRef] [Scilit]
- Hu, D.; Ye, Z.; Gao, Y.; Ye, Z.; Peng, Y.; Yu, N. Multi-Agent Deep Reinforcement Learning for Voltage Control with Coordinated Active and Reactive Power Optimization. IEEE Trans. Smart Grid 2022, 13, 4873–4886. [Google Scholar] [CrossRef] [Scilit]
- Zhao, Y.; Liu, T.; Hill, D.J. Distributed Attention-Enabled Multi-Agent Reinforcement Learning Based Frequency Regulation of Power Systems. IEEE Trans. Power Syst. 2025, 40, 2427–2437. [Google Scholar] [CrossRef] [Scilit]
- Cao, D.; Hu, W.; Zhao, J.; Zhang, G.; Zhang, B.; Liu, Z.; Chen, Z.; Blaabjerg, F. Reinforcement Learning and Its Applications in Modern Power And Energy Systems: A Review. J. Mod. Power Syst. Clean Energy 2020, 8, 1029–1042. [Google Scholar] [CrossRef] [Scilit]
- Liu, J.; Duan, L.; Chen, J.; Shang, J.; Wang, B. Application of Artificial Intelligence Technology in The Power Dispatch Metaverse. In Proceedings of the 2024 4th International Conference on New Energy and Power Engineering (ICNEPE), Guangzhou, China, 8–10 November 2024; IEEE: New York, NY, USA, 2024; pp. 1256–1267. [Google Scholar]
- Ren, K.; Zeng, Y.; Zhong, Y.; Sheng, B.; Zhang, Y. MAFSIDS: A reinforcement learning-based intrusion detection model for multi-agent feature selection networks. J. Big Data 2023, 10, 137. [Google Scholar] [CrossRef] [Scilit]
- Gao, Y.; Wang, W.; Yu, N. Consensus Multi-Agent Reinforcement Learning for Volt-Var Control in Power Distribution Networks. IEEE Trans. Smart Grid 2021, 12, 3594–3604. [Google Scholar] [CrossRef] [Scilit]
- Wang, S.; Duan, J.; Shi, D.; Xu, C.; Li, H.; Diao, R.; Wang, Z. A Data-Driven Multi-Agent Autonomous Voltage Control Framework Using Deep Reinforcement Learning. IEEE Trans. Power Syst. 2020, 35, 4644–4654. [Google Scholar] [CrossRef] [Scilit]
- Cao, D.; Hu, W.; Zhao, J.; Huang, Q.; Chen, Z.; Blaabjerg, F. A Multi-Agent Deep Reinforcement Learning Based Voltage Regulation Using Coordinated PV Inverters. IEEE Trans. Power Syst. 2020, 35, 4120–4123. [Google Scholar] [CrossRef] [Scilit]
- Cao, D.; Zhao, J.; Hu, W.; Ding, F.; Huang, Q.; Chen, Z.; Blaabjerg, F. Data-Driven Multi-Agent Deep Reinforcement Learning for Distribution System Decentralized Voltage Control with High Penetration of PVs. IEEE Trans. Smart Grid 2021, 12, 4137–4150. [Google Scholar] [CrossRef] [Scilit]
- Liu, H.; Zhang, C.; Chai, Q.; Meng, K.; Guo, Q.; Dong, Z.Y. Robust Regional Coordination of Inverter-Based Volt/Var Control via Multi-Agent Deep Reinforcement Learning. IEEE Trans. Smart Grid 2021, 12, 5420–5433. [Google Scholar] [CrossRef] [Scilit]
- Huang, S.; Wang, L.; Xiong, L.; Zhou, Y.; Gao, F.; Huang, W.; Li, Y.; Guo, H.; Wang, F. Hierarchical Robustness Strategy Combining Model-Free Prediction and Fixed-Time Control for Islanded AC Microgrids. IEEE Trans. Smart Grid 2025, 16, 4380–4394. [Google Scholar] [CrossRef] [Scilit]
- Trillo, J.R.; Cabrerizo, F.J.; Pérez, I.J.; Morente-Molinera, J.A.; Herrera-Viedma, E. A new consensus reaching method for group decision-making based on the large language model Gemini for detecting hostility during the discussion process. In Proceedings of the 2024 IEEE International Conference on Evolving and Adaptive Intelligent Systems (EAIS), Madrid, Spain, 23–24 May 2024; IEEE: New York, NY, USA, 2024; pp. 1–8. [Google Scholar]
- Li, Y.; Morente-Molinera, J.A.; Trillo, J.R.; Herrera-Viedma, E. Z-number generation model and its application in a rule-based classification system. IEEE Trans. Cybern. 2025, 55, 2010–2023. [Google Scholar] [CrossRef] [Scilit] [PubMed]
- Bai, Y.; Chen, S.; Zhang, J.; Xu, J.; Gao, T.; Wang, X.; Gao, D.W. An adaptive active power rolling dispatch strategy for high proportion of renewable energy based on distributed deep reinforcement learning. Appl. Energy 2022, 330, 120294. [Google Scholar] [CrossRef] [Scilit]
- Si, R.; Chen, S.; Zhang, J.; Xu, J.; Zhang, L. A multi-agent reinforcement learning method for distribution system restoration considering dynamic network reconfiguration. Appl. Energy 2024, 372, 123625. [Google Scholar] [CrossRef] [Scilit]
- Hu, K.; Xu, K.; Xia, Q.; Li, M.; Song, Z.; Song, L.; Sun, N. An overview: Attention mechanisms in multi-agent reinforcement learning. Neurocomputing 2024, 598, 128015. [Google Scholar] [CrossRef] [Scilit]
- Zhao, B.; Huo, M.; Li, Z.; Feng, W.; Yu, Z.; Qi, N.; Wang, S. Graph-based multi-agent reinforcement learning for collaborative search and tracking of multiple UAVs. Chin. J. Aeronaut. 2025, 38, 103214. [Google Scholar] [CrossRef] [Scilit]
- Qu, K.; Xue, S.; Zheng, X.; Yan, D.; Cao, H. Learning dynamic inter-farm dependencies for wind power forecasting via adaptive sparse graph attention network. Renew. Energy 2025, 258, 124969. [Google Scholar] [CrossRef] [Scilit]

Disclaimer/Publisher’s Note: The statements, opinions and data contained in all publications are solely those of the individual author(s) and contributor(s) and not of MDPI and/or the editor(s). MDPI and/or the editor(s) disclaim responsibility for any injury to people or property resulting from any ideas, methods, instructions or products referred to in the content. |
© 2026 by the authors. Licensee MDPI, Basel, Switzerland. This article is an open access article distributed under the terms and conditions of the Creative Commons Attribution (CC BY) license.