


Abstract
Benggang (Benggang), a typical landform characterized by severe erosion and a geohazard in the red-soil hilly regions of southern China, is characterized by a fragmented texture, irregular boundaries, and high similarity to background objects such as bare soil and roads, which poses a dual challenge of “multiscale variability + strong noise” for automated identification at regional scales. To address insufficient information from a single modality and the limited representation of cross-scale features, this study proposes a dual-stream feature-fusion network (DF-Net) for multisource data consisting of a digital orthophoto map (DOM) and a digital elevation model (DEM). The method adopts ResNeSt50d as the backbone of the two branches: on the DOM side, a Canny-edge channel is stacked to enhance high-frequency boundary information; on the DEM side, derived terrain factors, including slope, aspect, curvature, and hillshade, are introduced to provide morphological constraints. In the cross-modal fusion stage, a multiscale sparse attention fusion module is designed, which acquires contextual information via multiwindow average pooling and suppresses noise interference through top-K sparsification. In the decision stage, a multibranch ensemble is employed to improve classification stability. Taking Anxi County, Fujian Province, as the study area, a coregistered dataset of GF-2 (1 m) DOM and ALOS (12.5 m) DEMs is constructed, and a zonal partitioning strategy is adopted to evaluate the model’s generalization ability. The experimental results show that DF-Net achieves 97.44% accuracy, 85.71% recall, and an 82.98% F1 score in the independent test zone, outperforming multiple mainstream CNN/transformer classification models. This study indicates that the strategy of “multimodal feature enhancement + sparse attention fusion” tailored to Benggang erosional landforms can significantly improve recognition performance under complex backgrounds, providing technical support for rapid Benggang surveys and governance-effectiveness assessments.
1. Introduction
Benggang is a severe gully erosion landform formed by the collapse, transport, and deposition of granite weathering crust under the coupled effects of gravity and runoff erosion. It is widely distributed in the red-soil hilly regions of southern China, mainly in Guangdong, Jiangxi, Guangxi, Fujian, Hunan, Hubei, Anhui, and other provinces [1]. Its development is often accompanied by intensive soil erosion and vegetation degradation, thereby affecting watershed sediment yield, land-use security, and ecosystem stability. Therefore, rapid, objective, and repeatable identification and dynamic monitoring of Benggang areas are highly important prior to governance decision-making, engineering design, and effectiveness evaluation [2,3].
Traditional Benggang identification relies mainly on field surveys and hydrological-station observations [4,5], which can provide highly reliable point locations and process information but suffer from limited spatial coverage, high costs, heavy labor demands, high risks in complex terrains, and strong dependence on subjective experience. In recent years, UAV photogrammetry and terrestrial laser scanning have been used to obtain high-resolution imagery and 3D models at small scales, but they are still constrained in regional inventory scenarios by flight planning, meteorological conditions, and data production costs. In contrast, satellite remote sensing offers convenient acquisition, broad coverage, and availability of long-term time series, making it an important data source for rapid large-scale Benggang screening.
Early studies on Benggang extraction from satellite imagery mostly adopted traditional image-processing methods such as thresholding, edge detection, and spectral indices [6,7,8,9]. These methods are sensitive to illumination, vegetation cover, and soil-background variations and are difficult to adapt to complex situations with diverse Benggang morphologies, large scale ranges, and blurred boundaries. With the development of deep learning, researchers have introduced methods such as U-Net, DeepLab, and foundation models to improve semantic segmentation and target-extraction accuracy [10,11,12,13,14]. Despite notable progress, existing methods generally face two limitations: (i) reliance on a single modality (multispectral imagery or DEM) leads to insufficient utilization of information; and (ii) the Benggang identification field lacks dedicated research on cross-modal fusion mechanisms and cross-scale recognition, leaving room to improve model generalizability under complex backgrounds and across different data scales.
In the task of identifying Benggang, existing deep learning-based multimodal fusion methods still face significant challenges. Traditional convolutional neural networks and hybrid methods combining transformers [15] are limited by fixed convolution kernel sizes, often focusing only on local features and struggling to effectively capture the global characteristics of Benggang. Although MATNet [16] enhances feature information by utilizing spatial and channel attention, this method remains susceptible to being misled by redundant surrounding information in boundary regions with sparse backgrounds and strong interference, leading to biased feature extraction.
Secondly, RMSIN [17] proposed a Rotational Multi-scale Interaction Network; however, it often generates a large amount of redundant multi-scale features when dealing with Benggang that have irregular shapes and a fragmented distribution. Although EMTCAL [18] utilizes a multi-scale Transformer to capture contextual information, its patch-based attention mechanism is constrained by small receptive fields when processing large Benggang areas, making it difficult to capture the fine edges of small gullies.
Meanwhile, MSCN [19] and the KSA [20] architecture introduce the concept of sparsity through a Top-k mechanism. However, its fixed screening strategy struggles to distinguish areas with spectral signatures similar to Benggang in remote sensing regions with extremely low signal-to-noise ratios. Therefore, to capture Benggang erosion features at different scales while reducing environmental noise, it is particularly necessary to design a sparse attention mechanism capable of automatically filtering key information, suppressing background interference, and reducing computational redundancy.
In our paper [21], we proposed a dual-stream fusion model to study Benggang data captured by UAVs. We fused the extracted Benggang features from UAVs using spatial attention and channel attention mechanisms to make decisions. However, due to the differences between UAV data and remote sensing data, this feature fusion method is not well-suited for Benggang DEM and DOM features in remote sensing images.
Therefore, for multisource remote-sensing data from Benggang areas, an identification model that integrates multiscale feature extraction and cross-modal complementary fusion mechanisms is urgently needed to improve discriminative accuracy and robustness under complex backgrounds.
Accordingly, this study proposes a two-stream feature-fusion network, DF-Net. The model takes the DOM and DEM as dual inputs, employs ResNeSt50d to construct a two-branch multiscale encoder, and designs a multiscale sparse cross-attention fusion module to realize cross-modal information complementarity; during the decision-making phase, multi-branch prediction and ensemble methods are employed to enhance classification stability, and image-level classification is performed for Benggang-prone areas. Moreover, UAV pretrained weights and a progressive freezing fine-tuning strategy are adopted to alleviate training difficulties caused by limited labeled samples and domain discrepancies. The main contributions are summarized as follows:
- A feature-enhanced multimodal learning framework is constructed using co-registered DOM and DEM data. Erosion-related geomorphological factors with strong correlations with Benggang evolution are introduced to strengthen the joint representation of terrain–texture. A dual-stream encoding architecture based on ResNeSt50d is designed to extract multiscale spatial features from optical and elevation modalities in parallel.
- A lightweight multiscale sparse cross-attention fusion module is proposed to improve feature interaction efficiency. The module captures contextual information using multi-window average pooling and suppresses background interference via Top-k sparsification. In addition, a decision-level fusion module is constructed to integrate prediction results from the single-modality branches and the feature-fusion branch, improving model robustness in complex terrain environments.
- Comparative and ablation experiments are conducted to verify the effectiveness of the proposed method. Furthermore, its transferability across UAV and satellite remote sensing data is systematically evaluated, demonstrating its potential as a reusable algorithmic framework for rapid regional-scale Benggang screening.
2. Materials and Methods
2.1. Study Area
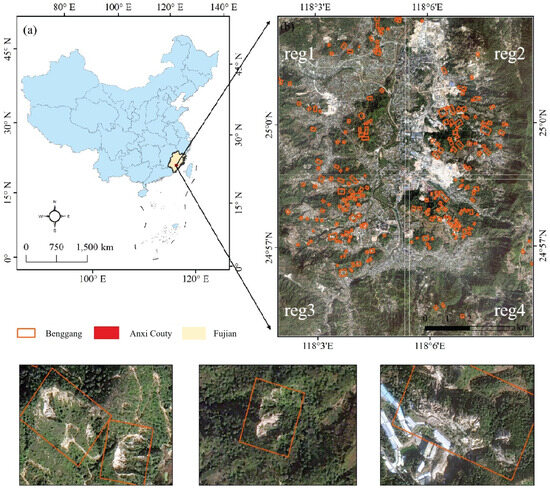
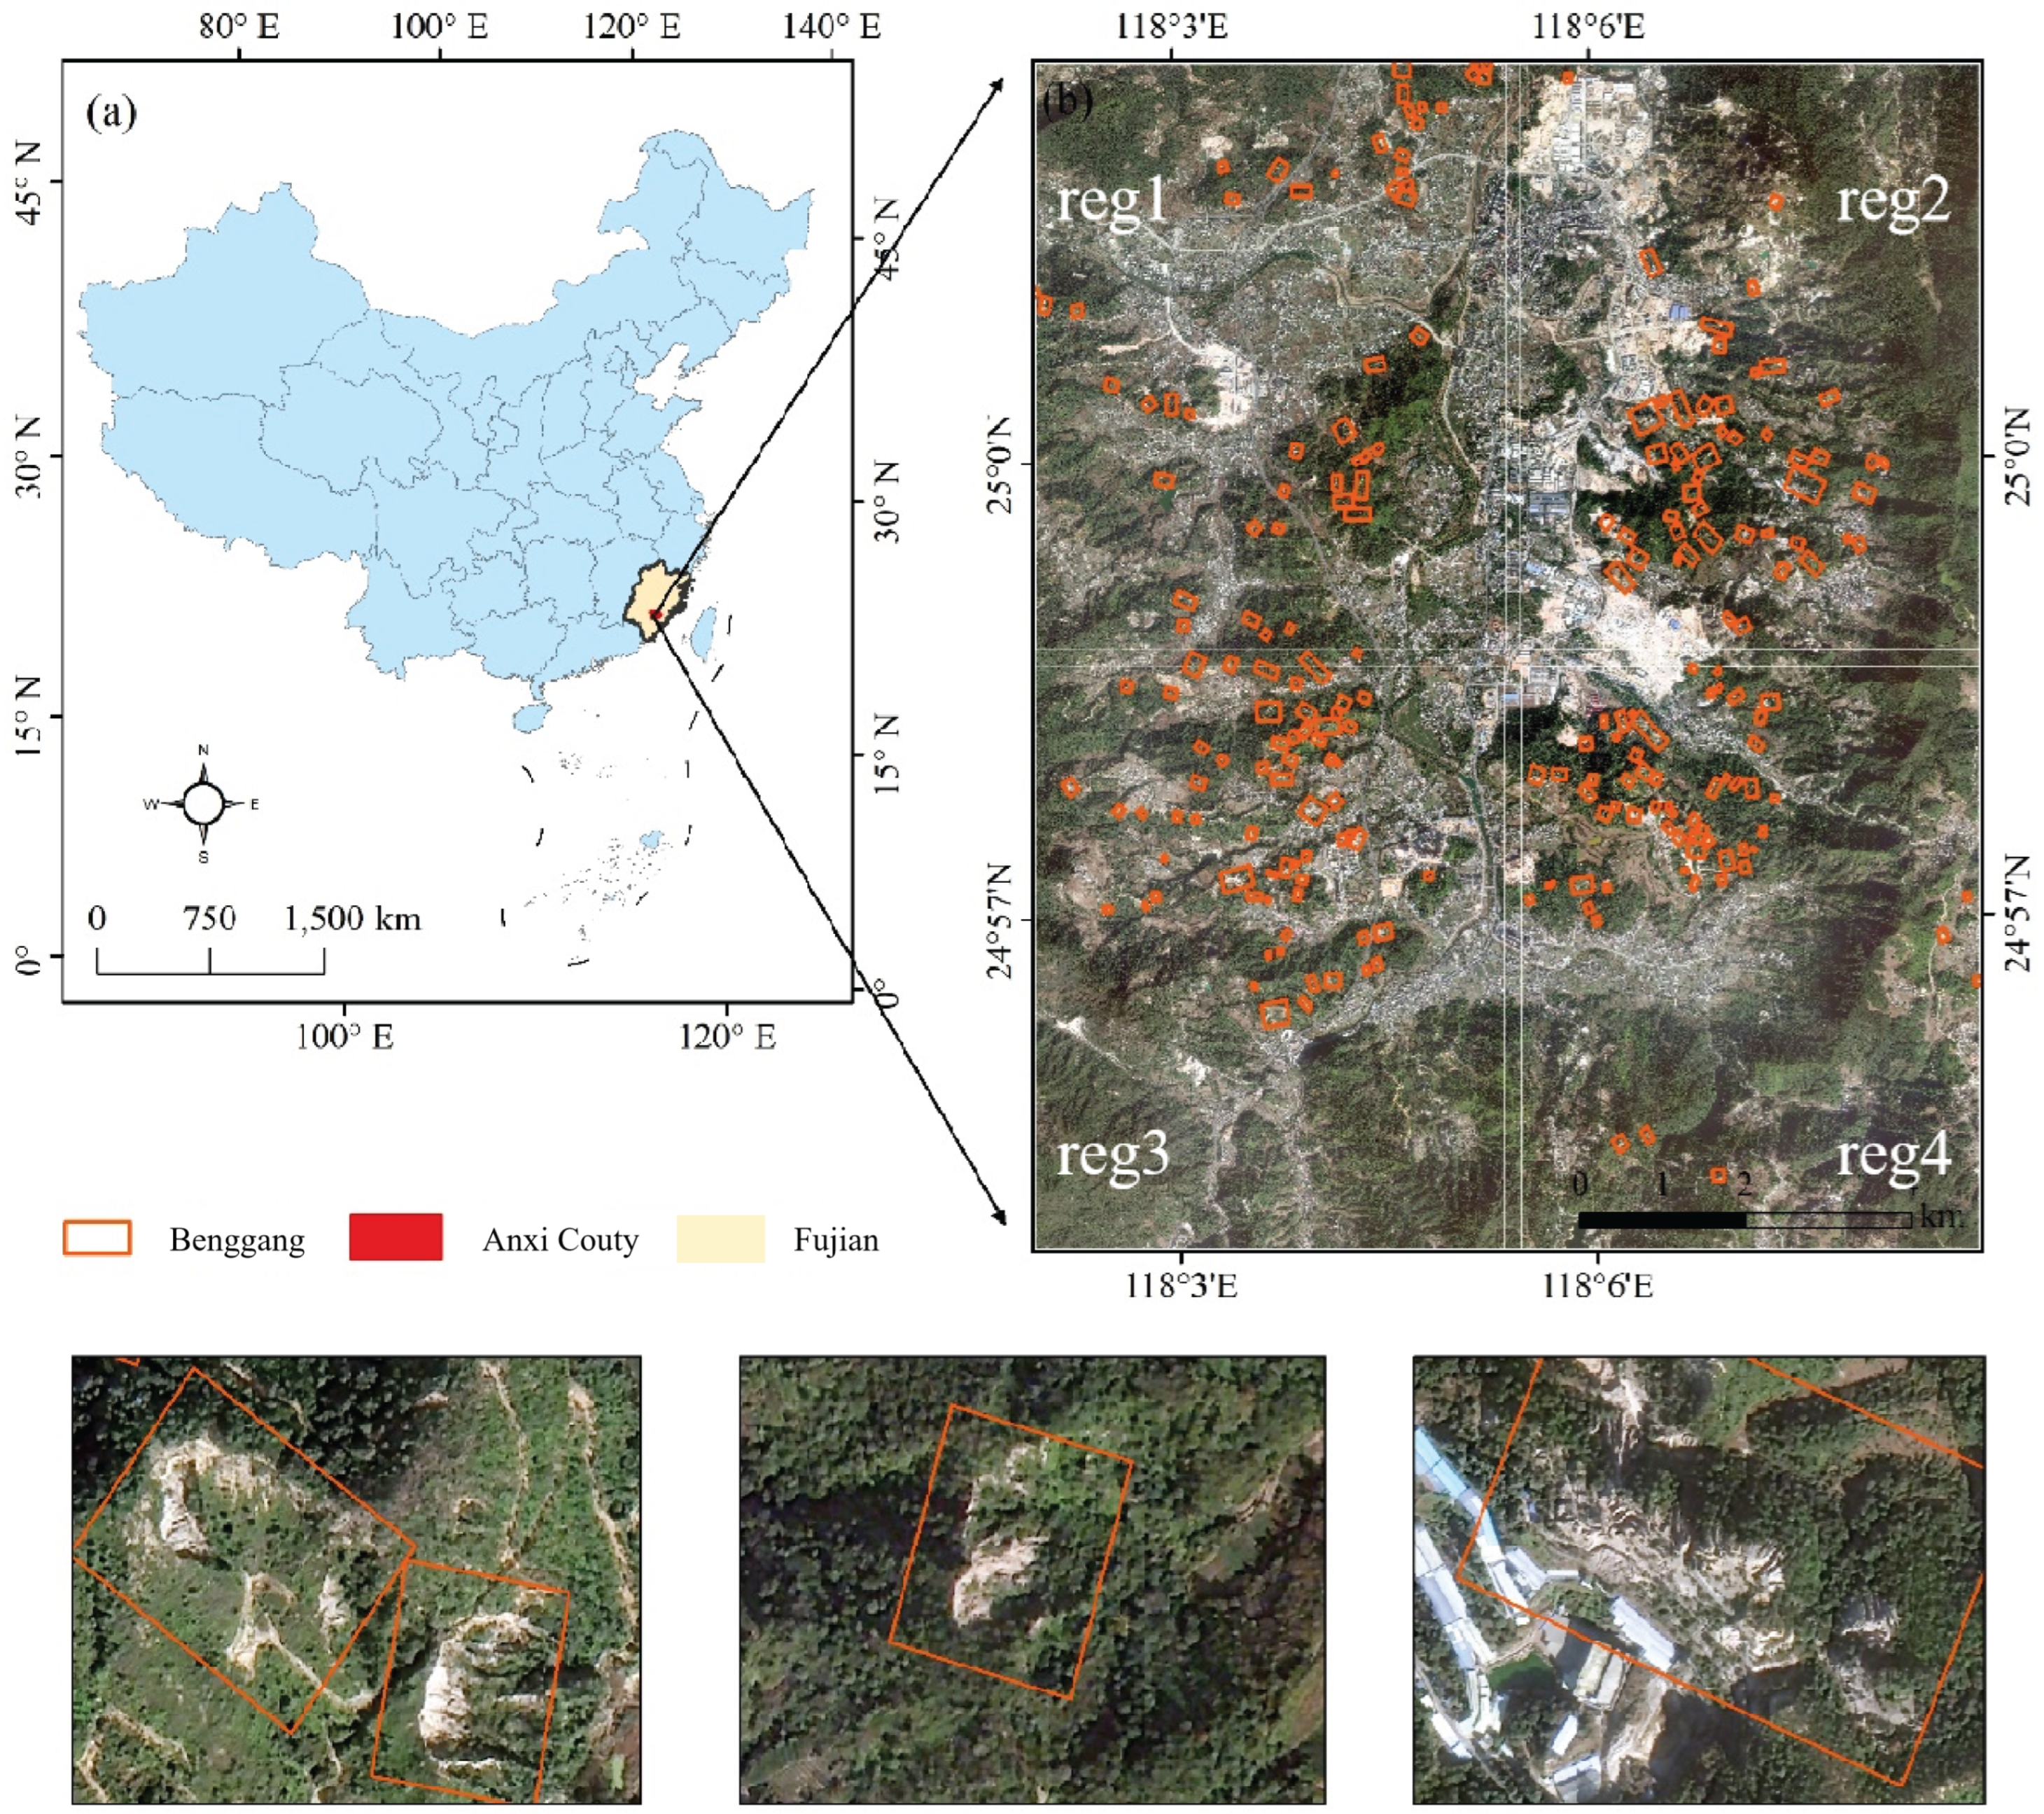
Anxi County is located in southeastern Fujian Province and belongs to the mid–south subtropical climate zone, with an annual mean temperature of 16–22 °C and an annual mean precipitation of 1300–2000 mm. The dominant soil types are latosolic red soil, red soil, and yellow soil. Affected by heavy rainfall and rugged topography, soil erosion is pronounced in the region, making it one of the key soil and water loss control counties in Fujian Province. This study selects representative Benggang governance areas in Guanqiao town and Longmen town in Anxi County as the research objects (Figure 1).
Figure 1.
Location and zonal partitioning of the study area (regs. 1–4). The red boxes indicate Benggang locations and sample distributions. subigure (a) shows the location of Fujian Province, while subigure (b) shows the location of the study area.
The remote-sensing imagery used in this study consists of GF-2 data acquired in April 2025, including a 0.8 m panchromatic band and 3.2 m multispectral bands. GF-2 images are preprocessed via radiometric calibration, atmospheric correction, orthorectification, and geometric refinement, followed by pansharpening and resampling to generate a 1 m digital orthophoto map (DOM). The terrain data are derived from the ALOS PALSAR 12.5 m DEM (Advanced Land Observing Satellite), which is clipped, coregistered, and resampled to a 1 m resolution using the nearest neighbor interpolation method to ensure spatial consistency and grid alignment with the DOM, thereby preserving the original elevation values of the DEM while enabling cross-modal feature fusion under consistent spatial resolution.
2.2. Data Processing
On the basis of field verification and visual interpretation, Benggang boundaries are delineated on the DOM to generate sample annotations. To evaluate cross-regional generalization, the study area is partitioned into four subregions (reg1–reg4) according to spatial location, where reg1–reg3 are used for training and reg4 serves as an independent test region (see Figure 1). A sliding-window cropping strategy is then applied to divide the DOM and the corresponding DEM into patches, with a window overlap rate of 0.5. To reduce label noise, samples are screened according to the overlap ratio between each image patch and the manually annotated Benggang polygon: patches with an overlap are labeled as positive Benggang samples; patches with are discarded; and patches with an overlap are labeled as negative non-Benggang samples. The sample statistics are shown in Table 1.
Table 1.
Sample statistics under the overlap rate threshold of 70%.
2.3. Benggang Identification via Deep Learning
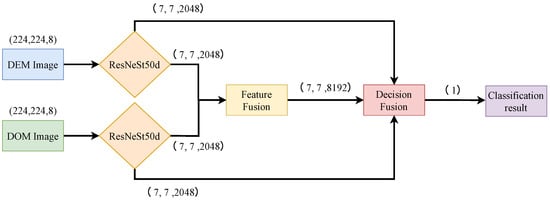
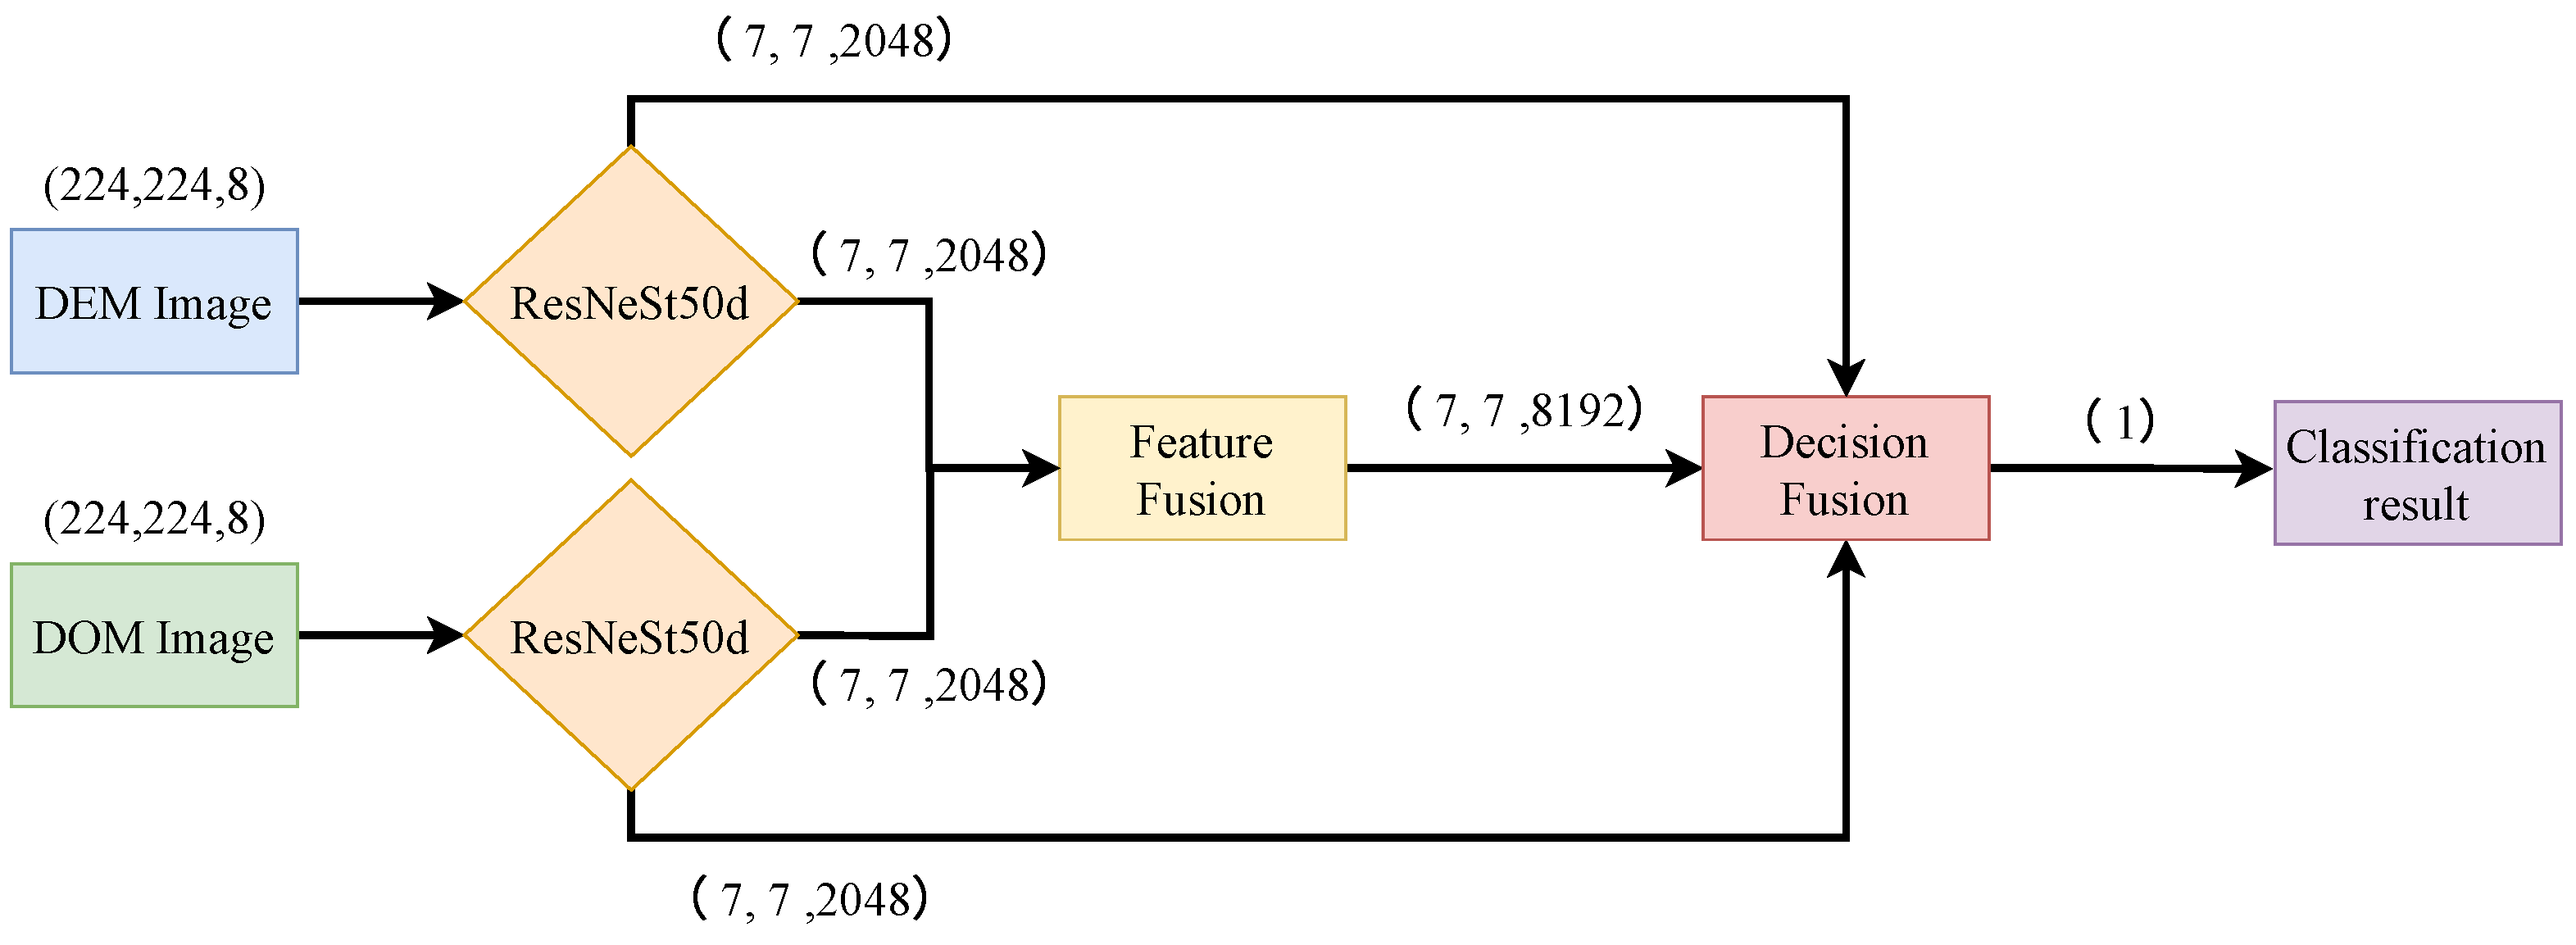
This study proposes a two-stream Benggang classification network, DF-Net, whose overall architecture is shown in Figure 2. The model takes the DOM and DEM (with enhanced features) as dual inputs and extracts multilevel features through multiscale encoders based on ResNeSt50d. Multimodal feature fusion is then performed at four scales to form a fused-feature branch. Finally, classification is conducted for the DOM branch, DEM branch, and fusion branch, and their predictions are ensembled at the decision level to obtain the final binary classification result. This framework jointly leverages the texture/boundary information of the DOM and the terrain constraints of the DEM, thereby improving the robustness of Benggang identification under complex backgrounds.
Figure 2.
Overall architecture of DF-Net (two-stream encoding–multiscale fusion–decision ensembling).
2.3.1. Feature Construction
To enhance the ability of the DEM to represent Benggang morphology, four types of derived terrain factors are extracted from the original elevation raster: slope, aspect, curvature, and hillshade. Slope reflects the steepness of the surface, aspect is related to solar incidence, curvature characterizes terrain concavity/convexity, and hillshades can enhance subtle topographic undulations. These factors are all computed from the DEM and concatenated along the channel dimension to form the enhanced DEM feature.
where and denote the first-order elevation gradients in the X and Y directions, respectively, and Z is the pixelwise elevation value. represents the second-order variation obtained by applying the Laplacian operator to the elevation raster. denotes the solar elevation angle, is the solar azimuth angle, and S and A correspond to the slope and aspect, respectively. Finally, the slope, aspect, curvature, and hillshade are concatenated along the channel dimension to form the enhanced DEM feature .
For DOM data, considering that Benggang development is often accompanied by surface disturbance and boundary differentiation, the Canny operator is employed to extract salient edge information for each DOM patch. The extracted edge map is concatenated with the original RGB channels along the channel dimension to construct an edge-enhanced DOM feature . Without changing spatial resolution, this processing introduces high-frequency information that is more sensitive to boundaries and textures, helping to distinguish Benggang areas from similar backgrounds, such as bare soil and roads.
2.3.2. Encoder Feature Extraction
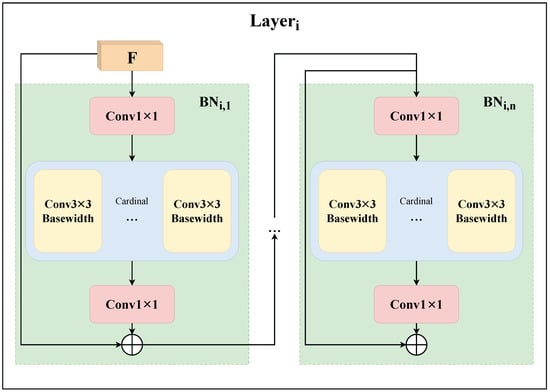
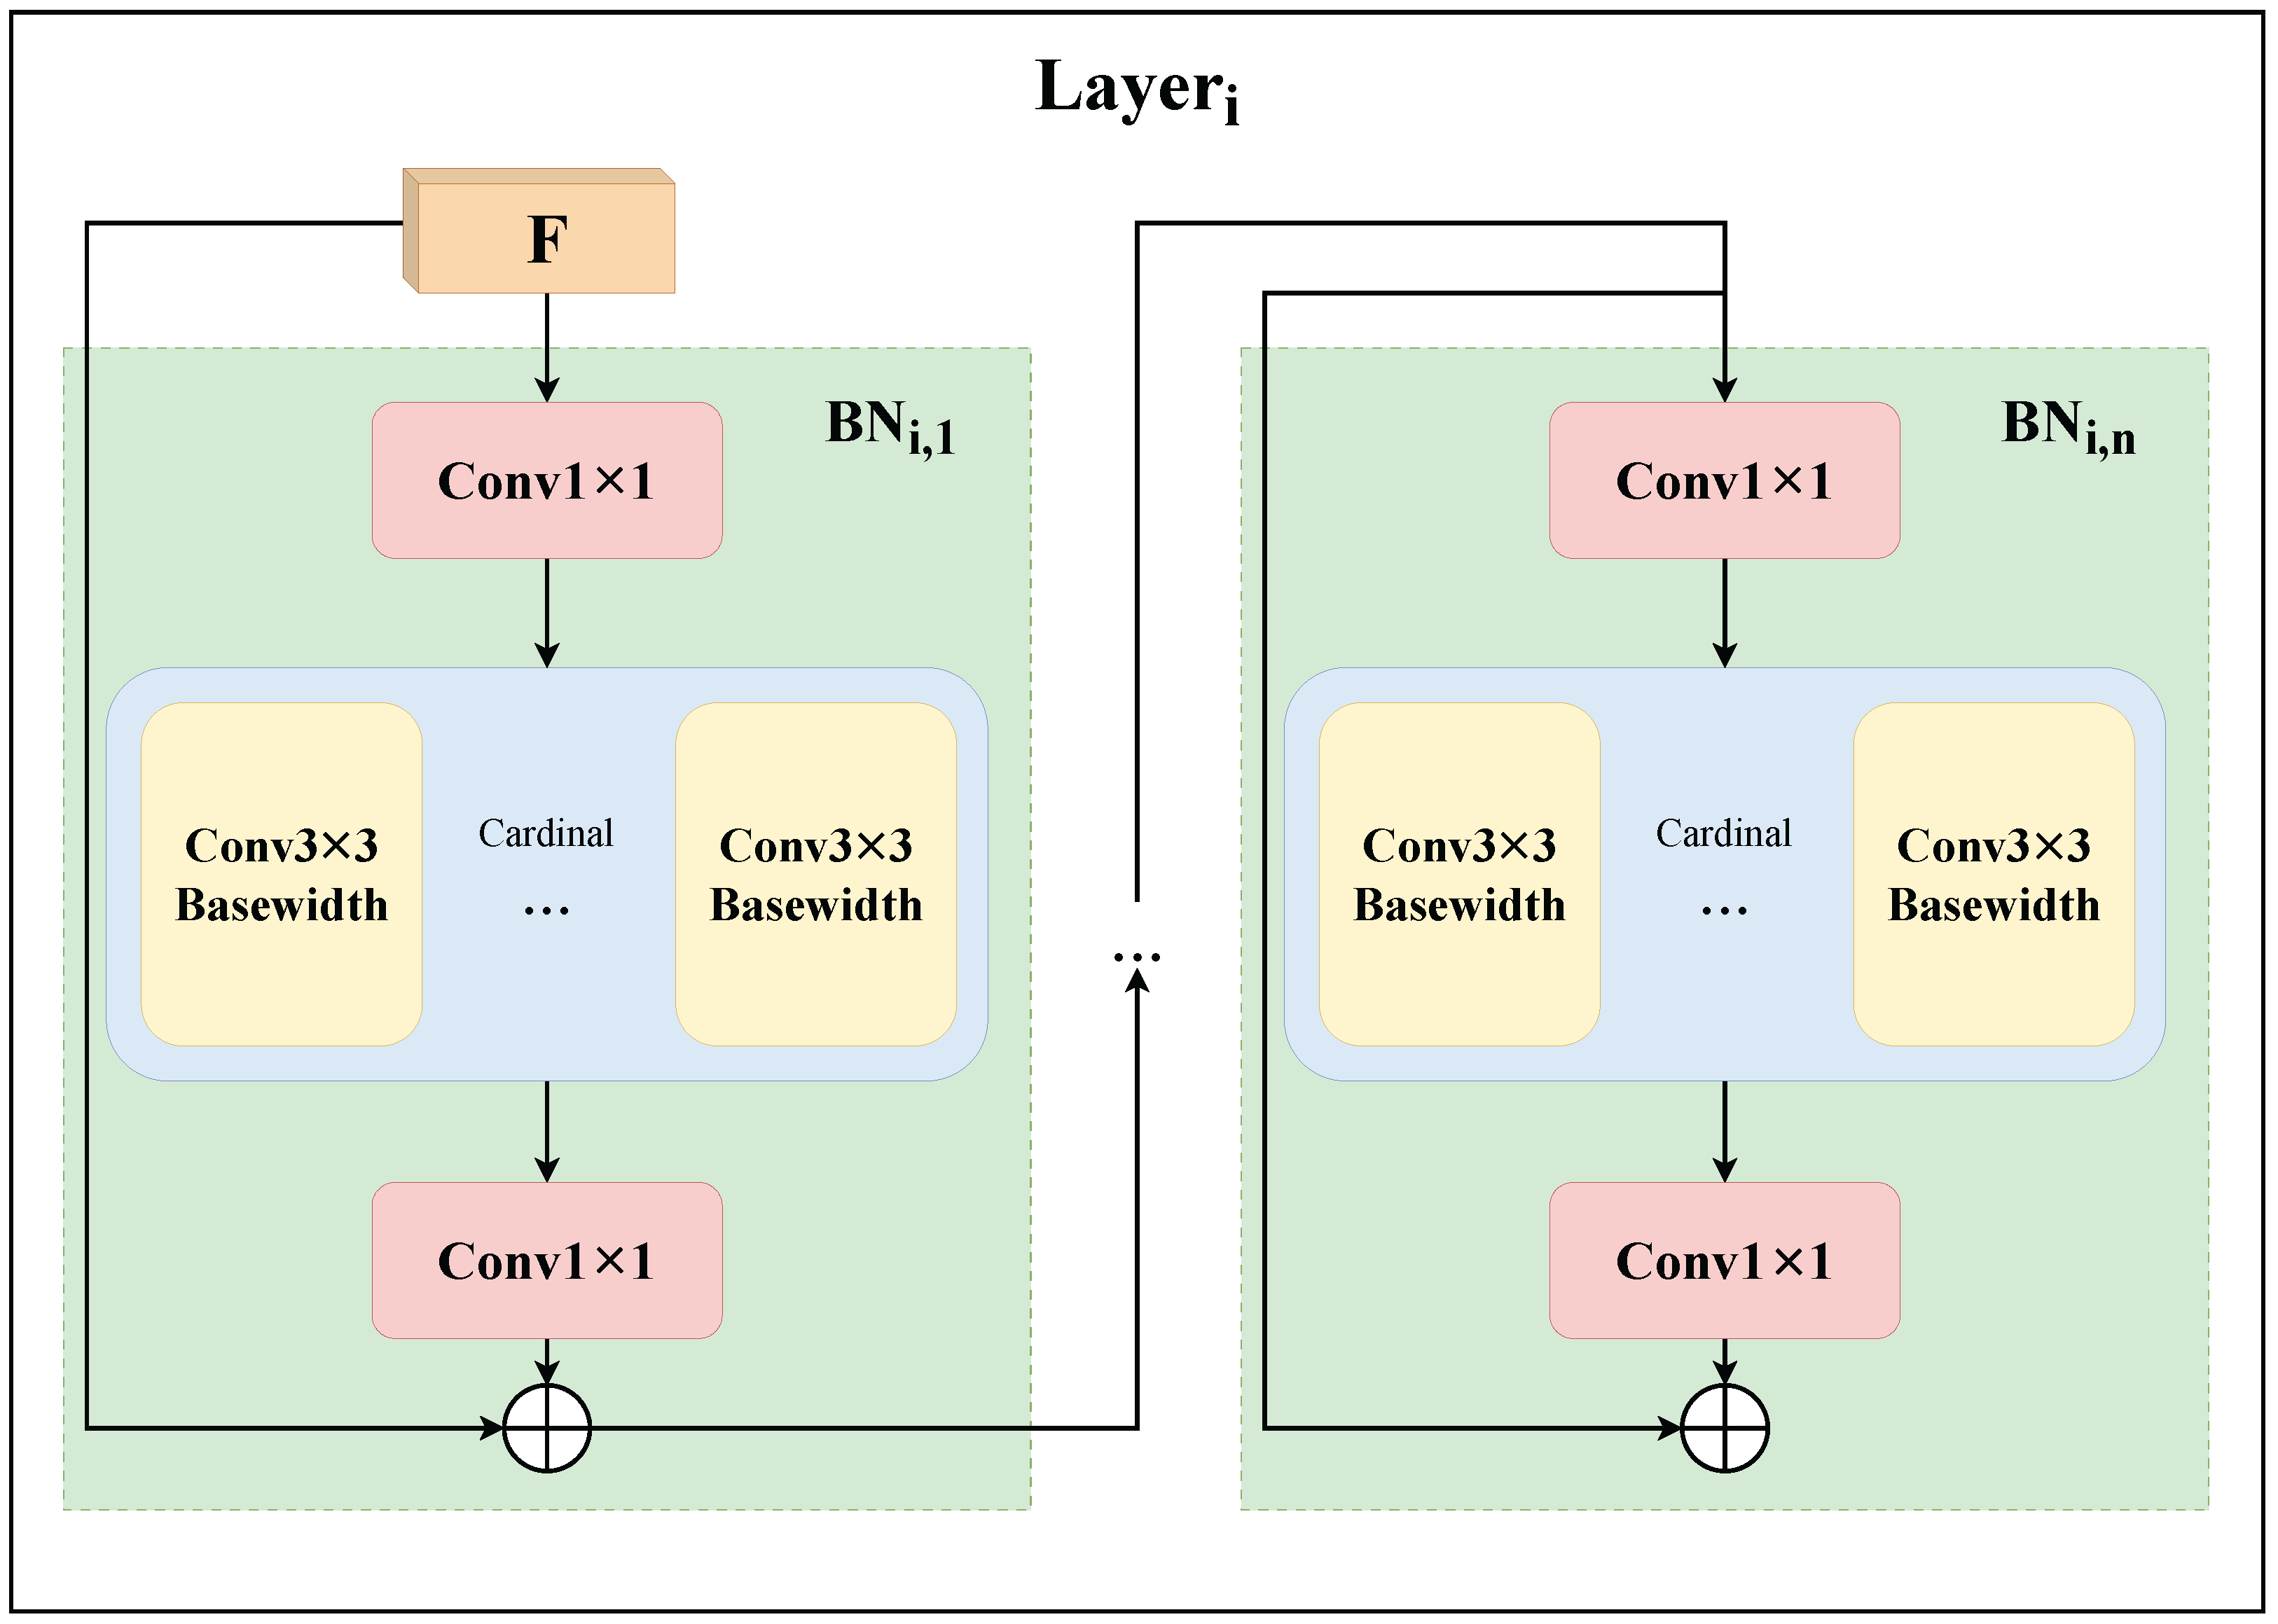
In the encoder, ResNeSt50d is selected as the backbone to encode the edge-enhanced DOM features and the terrain-enhanced DEM features , thereby efficiently capturing and integrating multiscale spatial information from different modalities. ResNeSt introduces a split-attention mechanism within the residual framework, enhancing multibranch representation through grouped feature aggregation. Specifically, both the DOM and DEM branches consist of four residual stages (Stages 1–4), and each stage stacks multiple bottleneck (BN) blocks, as illustrated in Figure 3.
Figure 3.
Structure of the ResNet bottleneck (BN) block.
Let the input of the i-th stage be ; then, the outputs at different scales can be expressed as:
The BN computation is given in the following equations:
Here, BN denotes the nonlinear mapping of a bottleneck block, while and denote convolution operators for channel compression/expansion and spatial feature extraction, respectively. The cardinality and base width control the number of groups in the group convolution and the channel width per group. Stage i is composed of bottleneck blocks connected in series.
2.3.3. Fusion Module
To fully exploit the spectral/texture information of the DOM and the terrain constraints provided by the DEM, this study constructs a multimodal feature fusion module (feature fusion) at four scales to enable interaction and complementarity between the DOM feature and the DEM feature . The resulting fused features are further fed into the fusion branch for subsequent classification.
To analyze the effectiveness of different fusion mechanisms, two fusion architectures are implemented: Module 1 (dual-attention weighted fusion) and Module 2 (multiwow context + sparse cross-attention fusion). Quantitative comparisons are reported in the experimental section.
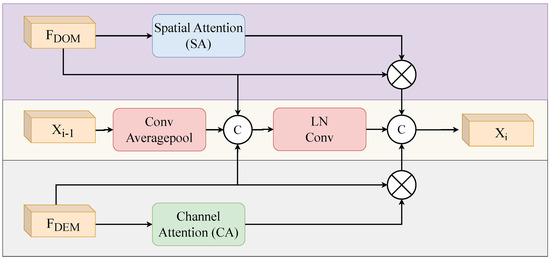
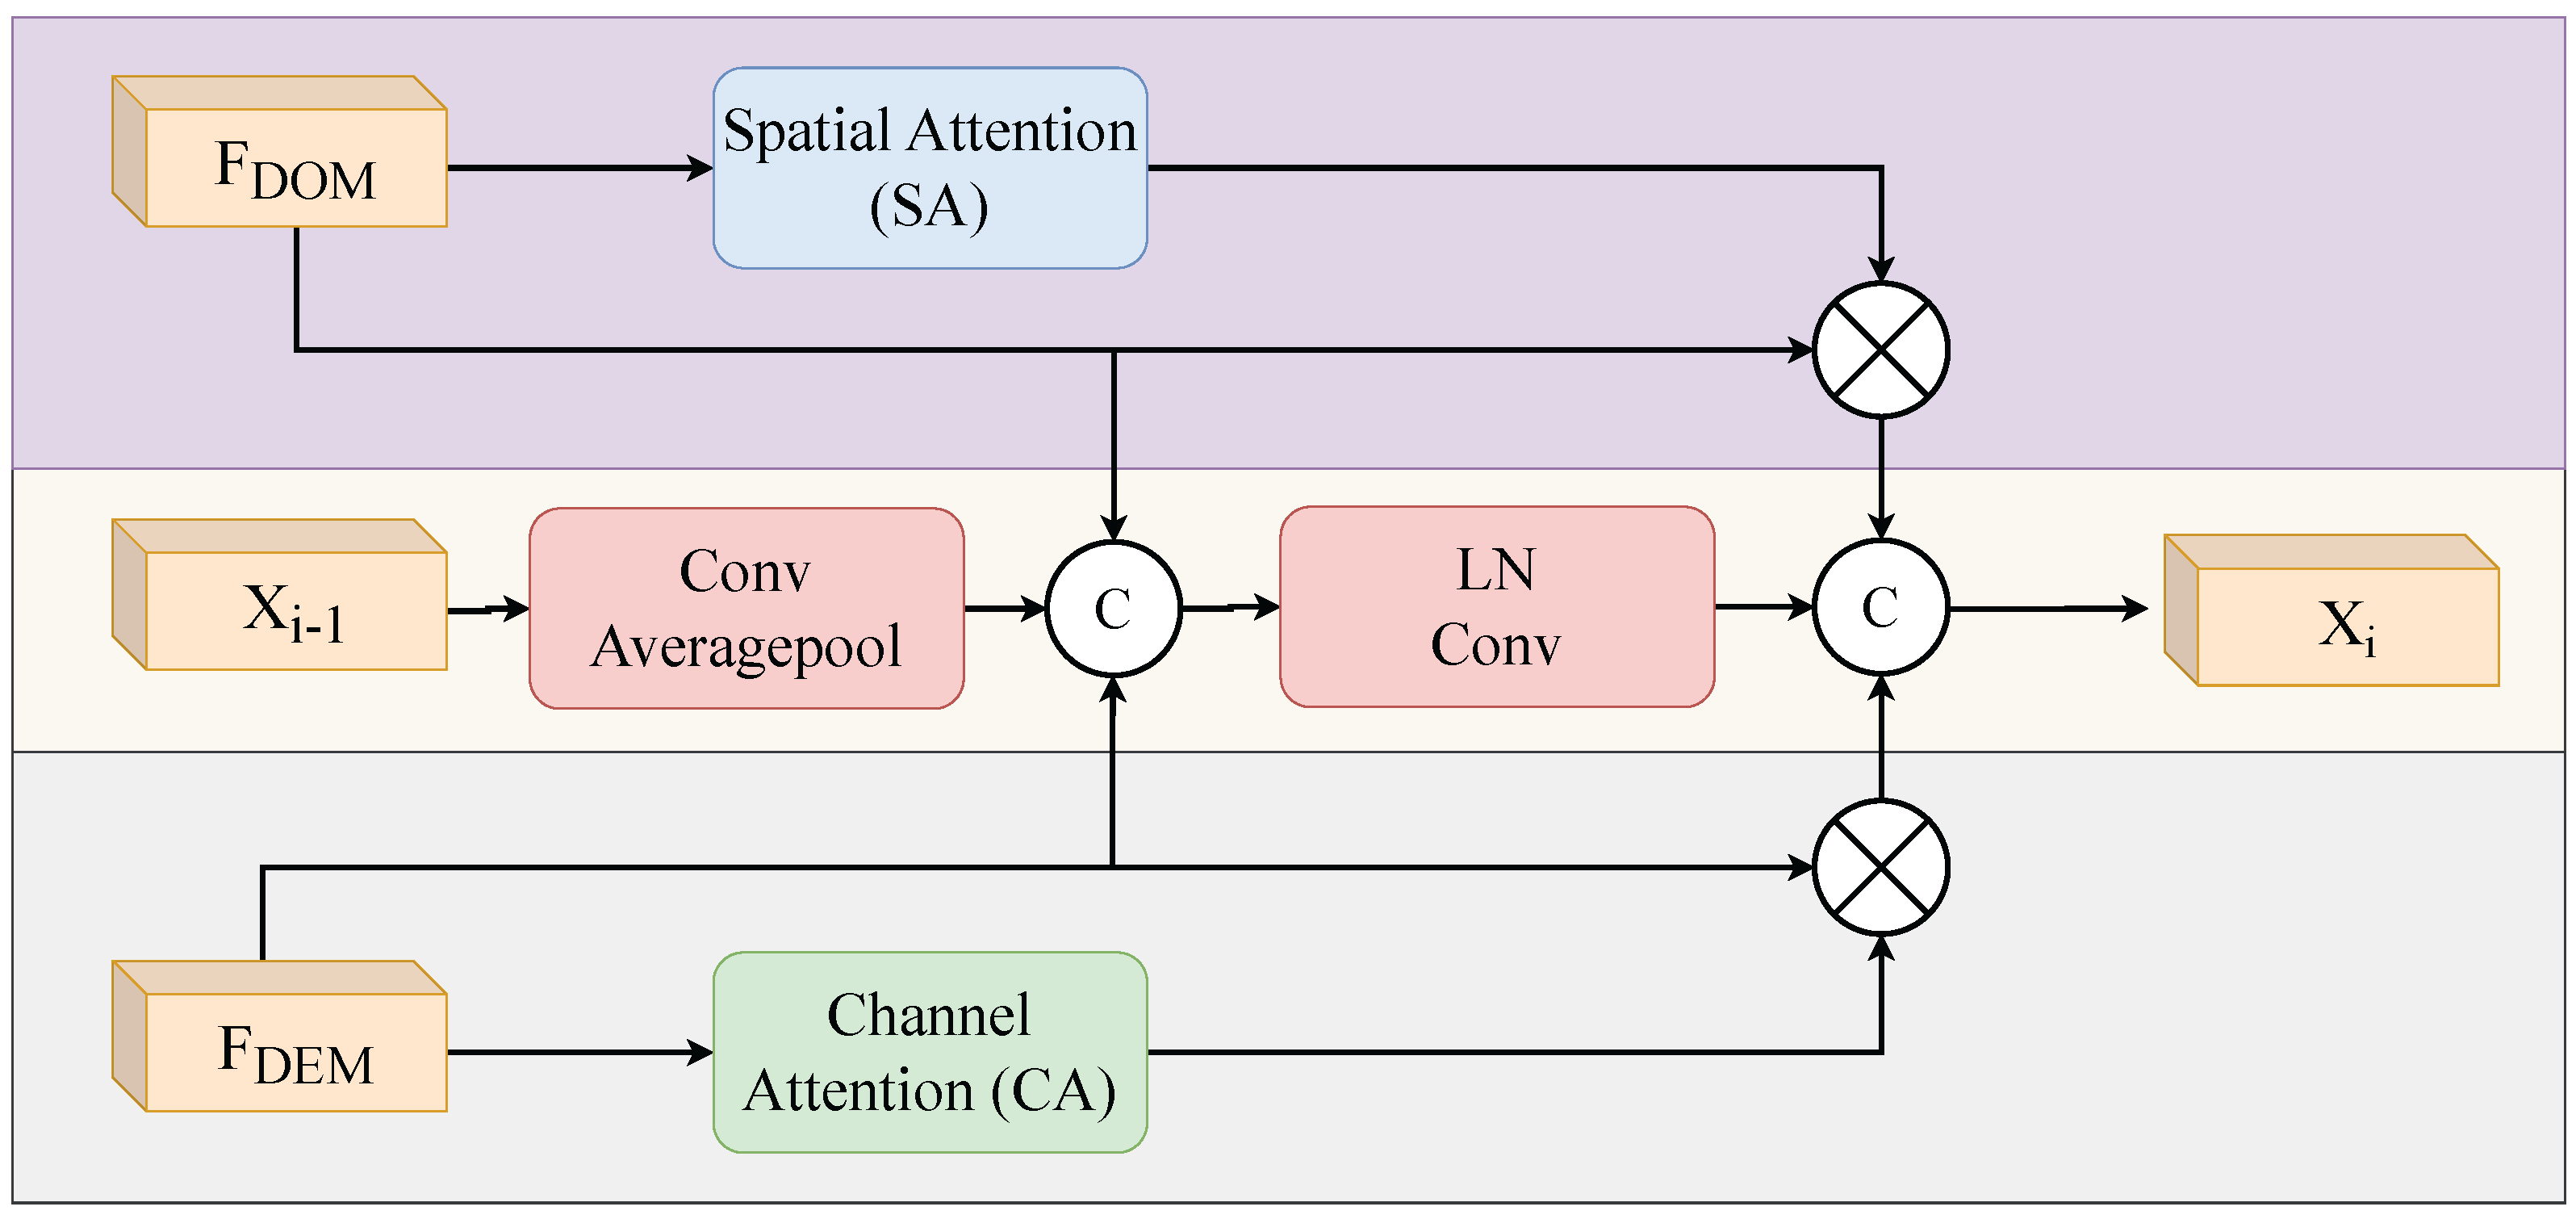
Module 1: This structure simultaneously receives the DOM feature and DEM feature at the current scale, as well as the fused feature from the previous scale. First, channel attention and spatial attention are applied to the DOM and DEM features, respectively, to achieve adaptive recalibration. Then, the previous-scale fused feature is aligned to the current scale via convolution and average pooling and concatenated with the DOM and DEM features. Finally, normalization and convolution are employed to obtain the fused output at the current scale.
This design employs different attention mechanisms to extract features from multimodal data and adopts a multilevel weighted fusion strategy to increase the effectiveness of feature integration. The overall network architecture is illustrated in Figure 4.
Figure 4.
Schematic of the module 1 fusion structure.
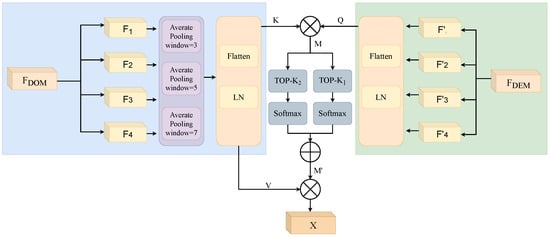
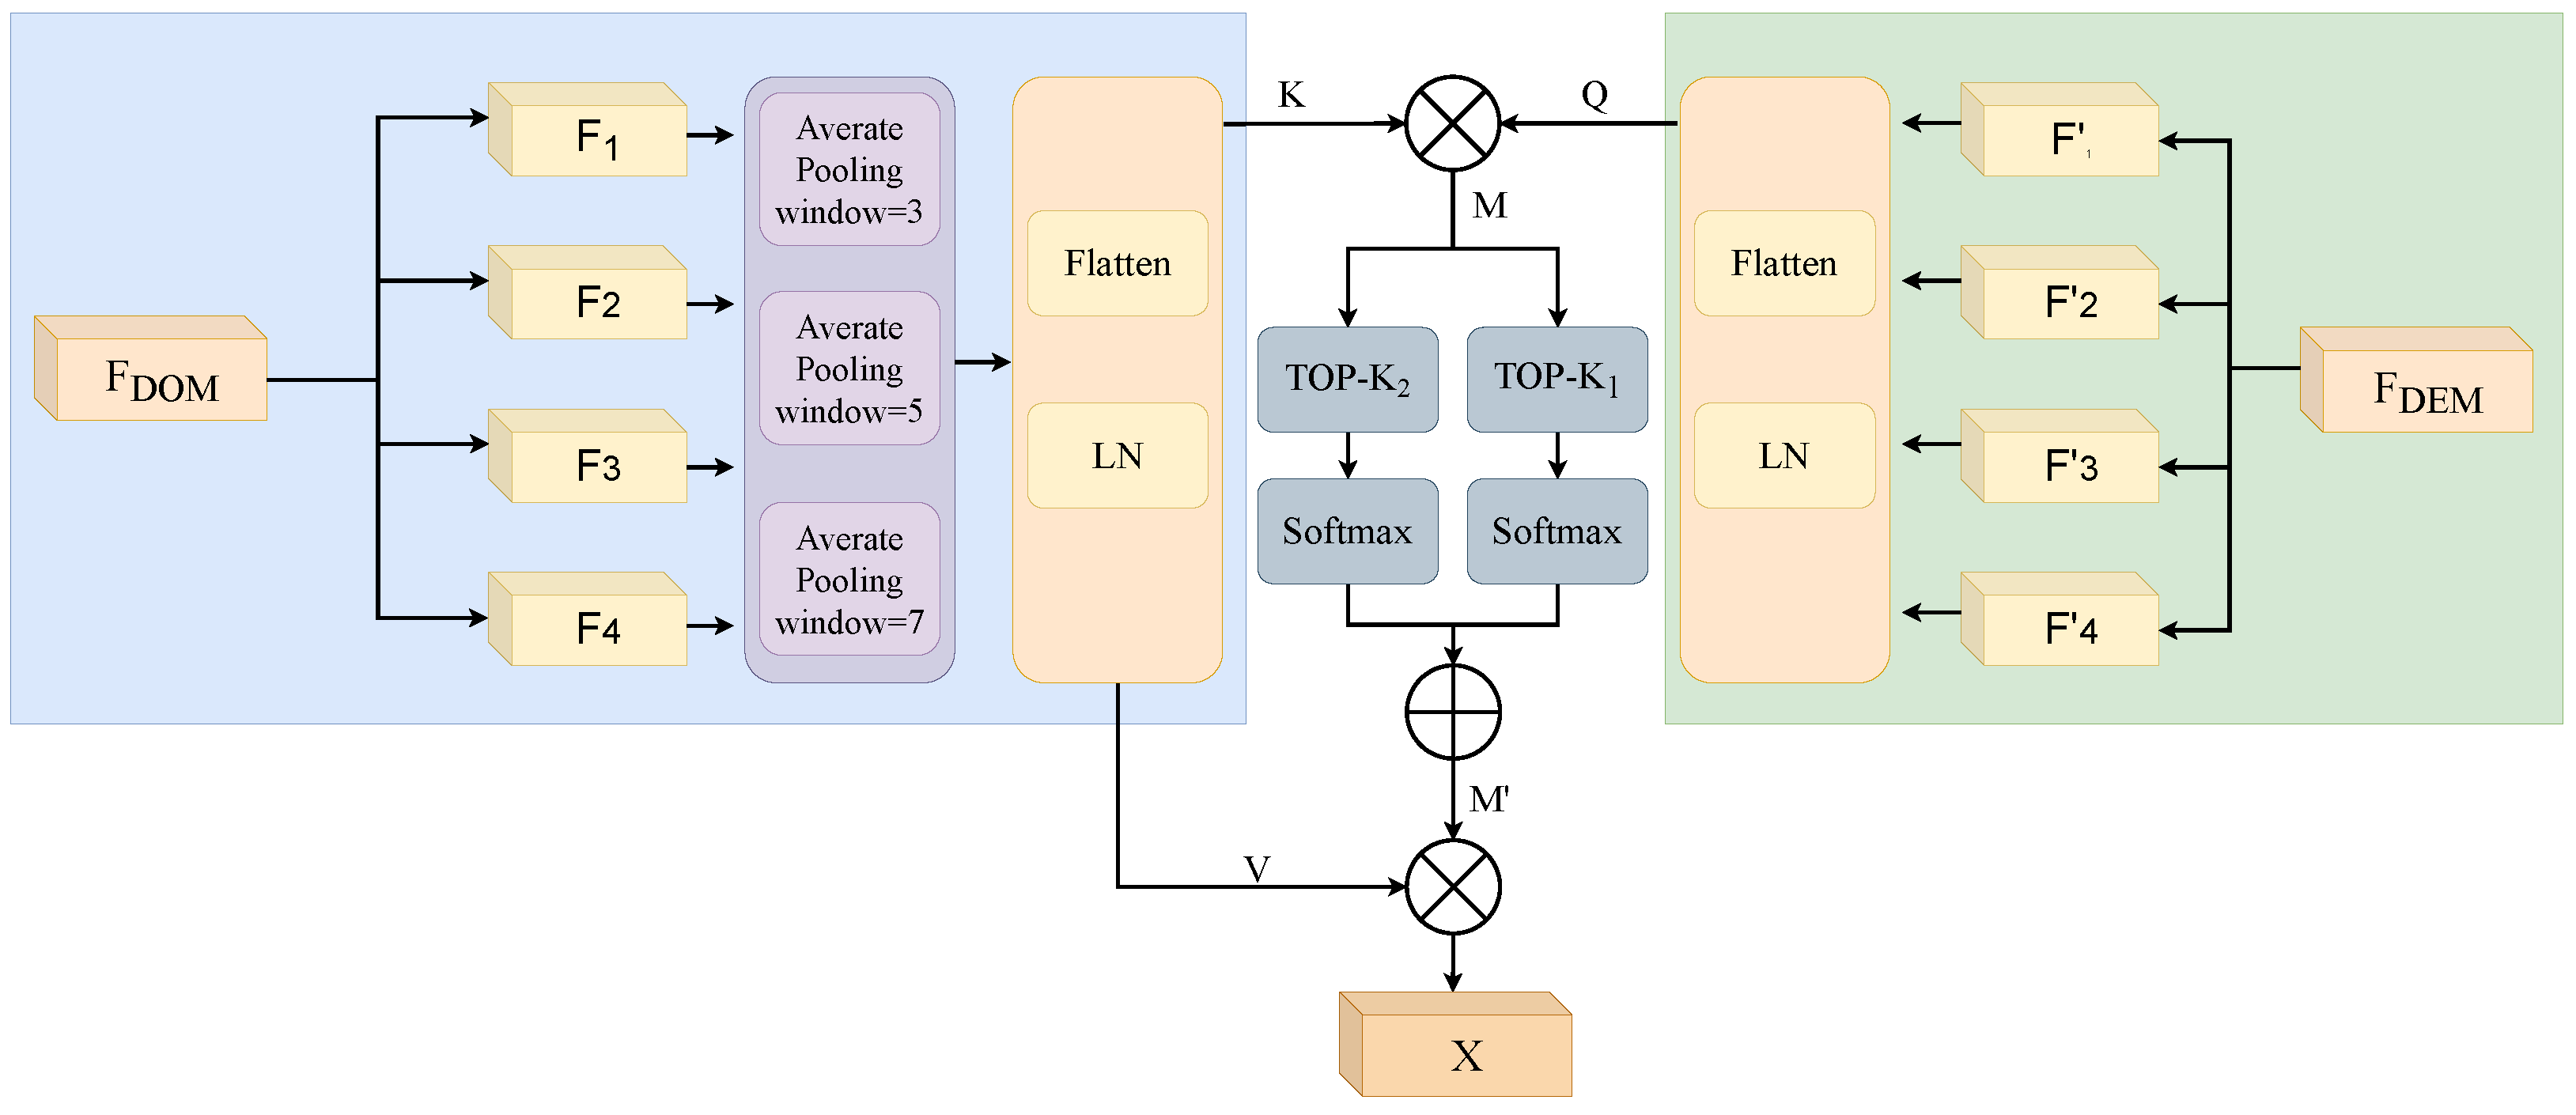
Module 2: Considering that Benggang identification is susceptible to interference from background noise, this study proposes a lightweight sparse cross-attention fusion structure. The network structure is illustrated in Figure 5.
Figure 5.
Schematic of the Module 2 fusion structure.
For the DOM-branch feature , three average pooling operations with different window sizes (3, 5, and 7) are first applied to generate new features , , and . These three features are then summed to obtain Y. Subsequently, and Y are flattened and mapped to , , and in the cross-attention mechanism, where , , , and , denote the image height and width, respectively. The mapping function is given as follows:
Here, and are the parameters of linear projection; flattens and into two-dimensional feature matrices; denotes the operation of uniformly splitting along the channel dimension; and is the normalization layer. On the basis of Q and K, the attention map M can be further computed as follows:
The elements in M represent the similarity between the corresponding elements and in Q and K; a smaller value indicates lower relevance. Here, c denotes the dimensionality of Q, thereby determining how the weighted attention is allocated to V.
After obtaining the quantified relevance information, a sparsification operation is introduced to retain only the top proportion of values in each row of M while setting the remaining entries to . In this study, two sparsification operators, and , are employed, where is set to 2 in and is set to 3 in . A Softmax operation is subsequently applied to convert to 0, yielding the adjusted attention map M. Moreover, two learnable parameters, and , both initially set to 0.5, are introduced to automatically adjust the ratios of these two TopK operations, as formulated in the following equation.
These parameters in the formula are jointly optimized end-to-end with other model parameters throughout the training process using the Adam optimizer (learning rate ) and a binary cross-entropy loss function; the weight ratio between the two is automatically adjusted via backpropagation between two Top-K sparse operations.
Finally, we multiply the adjusted attention maps and V to obtain the fused features X, as shown in the following formula.
By calculating the DOM feature and DEM feature at four distinct scales, we obtain the fused feature across different scales. Finally, we employ Concat to concatenate these features, yielding the fused feature .
However, using DOM and DEM feature vectors as semantic inputs at different levels in the fusion module will yield different results. Therefore, to demonstrate the rationale behind feeding DOM as a low-level feature into the module from the left and DEM as a high-level feature from the right, we conduct cross-validation experiments in Section 3.5 below. In the experiments, the fusion module, module 2, is abbreviated as FF; FF (DOM) + FF (DEM) denotes that, in this experiment, DOM is used as the low-level feature input and DEM features as the high-level feature input, with other models following the same convention.
2.3.4. Decision Module
The decision module receives the output features of the last BN layer from the DOM branch, the output features of the last BN layer from the DEM branch, and the fused features produced by the fusion module. To integrate the predictions from these branches and perform the final binary classification, we need to reduce the dimensionality of the received DOM features, DEM features, and fused features using a linear layer, and finally concatenate them into a one-dimensional vector. Specifically, global average pooling (GAP) is applied to downsample these features, yielding three 2048-dimensional feature vectors , , and , which are then concatenated into a 12,288-dimensional vector .
To further enhance the features, the and vectors are subsequently reduced from 2048 to 512 dimensions and then to 1 dimension, yielding two outputs, and . The 8192-dimensional vector is reduced to 512 dimensions and then to 1 dimension, yielding an output . The 12,288-dimensional vector is first reduced to 512 dimensions and then to 1 dimension, yielding an output .
Here, denotes a fully connected layer that reduces the feature dimension from ; denotes a fully connected layer that reduces the feature dimension from ; denotes a fully connected layer that reduces the feature dimension from ; and denotes a fully connected layer that reduces the feature dimension from . Finally, these 1-dimensional features are concatenated and then fed into another fully connected layer, , to produce the final classification prediction.
2.4. Model Training
Transfer learning can significantly improve the convergence speed and generalization performance under limited labeled samples by reusing representations learned in the source domain. In Benggang identification, UAV imagery can describe the local textures and microtopography of Benggang areas more finely, but such high-quality labeled data are scarce. In contrast, large-scale remote-sensing data are easier to acquire but contain fewer Benggang details. Accordingly, this study first trains a UAV dataset to obtain pretrained weights and then transfers them to GF-2/DEM remote-sensing data. A progressive freezing–unfreezing strategy is adopted for fine-tuning; frozen layers are not updated during training, which helps reduce overfitting risk and improve training stability.
- Full freezing, i.e., freezing layers 1–4 and training only the decision-fusion module and the classification head;
- Freezing layers 1–3 and unfreezing layer 4 to adapt high-level features;
- Freezing layers 1–2 and unfreezing layers 3–4 to optimize mid- to high-level features;
- Freezing only layer 1.
Strategies 2–4 freeze shallow convolutional layers and retrain the remaining learnable layers, enabling the network to adapt to distribution differences in remote-sensing data while preserving general low-level representations. Strategy 1 replaces and trains only the classification layer, which is equivalent to linear-mapping fine-tuning on pretrained features. After the pretrained weights are obtained, dataset annotation and sample construction are performed with a 70% overlap threshold, as described in Section 2.2, and the input feature dimensions for the DOM and DEM are constructed accordingly. The model is then fine-tuned via the progressive freezing strategy, and the fusion module is replaced with the proposed feature fusion module to retrain on remote-sensing samples. Finally, prediction and evaluation are conducted in the independent test zone. The transfer-learning workflow is shown in Algorithm 1.
| Algorithm 1 Transfer Learning for Benggang Detection |
| Require: DOM and DEM datasets (Anxi County); Pretrained DF-Net model Ensure: Benggang detection and classification results // Phase 1: Data Preprocessing
|
2.5. Baseline Models
For comparison, this study evaluates multiple classification models, including pure CNN and hybrid transformer-based models, namely EVA02 [22], LeViT [23], MobileNet-V4 [24], Next-ViT [25], and NaFlexViT [26,27].
In our experiments, we will train these baseline models using the same category weighting method on Benggang data with 70% overlap threshold pruning. We will use identical input data, the same training/testing split settings, and consistent experimental hyperparameters (batch size, optimizer, number of training iterations, etc.) to ensure a fair comparison of model performance.
- EVA02. EVA02 is a transformer-based self-supervised model for large-scale visual representation learning. Its core principle lies in the masked image modeling (MIM) strategy, which performs self-supervised training by reconstructing masked image–text aligned features and enhances multimodal adaptability by incorporating a CLIP visual encoder;
- LeViT. LeViT is a hybrid architecture for efficient inference. Its core idea is to combine transformer blocks with convolutional network principles to optimize the accuracy–efficiency trade-off in high-speed inference scenarios. It integrates positional information via attention bias, uses activation maps with reduced resolution, and captures global dependencies through transformer self-attention;
- MobileNet-V4. MobileNet-V4 targets the mobile ecosystem with a general-purpose efficient model. Its core idea is to fuse inverted bottlenecks, ConvNeXt modules, and feedforward networks into a scalable universal building block;
- Next-ViT. Next-ViT is an efficient Vision transformer that captures local and global information via next-convolution blocks (NCBs) and next-transformer blocks (NTBs). It stacks NCBs and NTBs in a hybrid manner to reduce the quadratic complexity of multihead self-attention (MHSA);
- NaFlexViT. NaFlexViT is a flexible vision transformer model that integrates the core ideas of FlexiViT and NaViT, supporting arbitrary patch sizes, resolutions, and aspect ratios without a fixed input configuration.
2.6. Accuracy Evaluation
To evaluate the accuracy of the Benggang classification models, this study uses the accuracy, recall, and F1 score to validate the prediction performance by assessing the discrepancy between the predicted classes and the ground truth. The metric formulations are as follows:
Here, TP denotes the number of samples predicted as positive and correctly classified; TN denotes the number of samples predicted as negative and correctly classified; FP denotes the number of samples predicted as positive but misclassified; and FN denotes the number of samples predicted as negative but misclassified.
3. Results and Analysis
3.1. Comparative Analysis
Table 2 presents a performance comparison between DF-Net and multiple baseline models in the independent test zone (reg4). DF-Net achieves the best results in terms of accuracy, recall, and F1 score (97.44%, 85.71%, and 82.98%, respectively), indicating that the proposed multiscale two-stream feature extraction and fusion mechanism can better exploit the complementary information of the DOM and DEM and enhance detection of the Benggang positive class. In contrast, EVA02 relies on large-scale self-supervised pretraining, and its advantage is limited under small Benggang sample sizes. LeViT and Next-ViT achieve high accuracy owing to the strong feature extraction of CNN–Transformer hybrids; however, their recall is relatively low, suggesting missed detections for small-area Benggang regions in large-scale remote-sensing imagery. NaFlexViT achieves a relatively balanced trade-off between accuracy and recall, yet its F1 score is lower than that of DF-Net. Overall, DF-Net improves overall accuracy and stability while maintaining high recall, demonstrating better generalizability.
Table 2.
Performance comparison of different models.
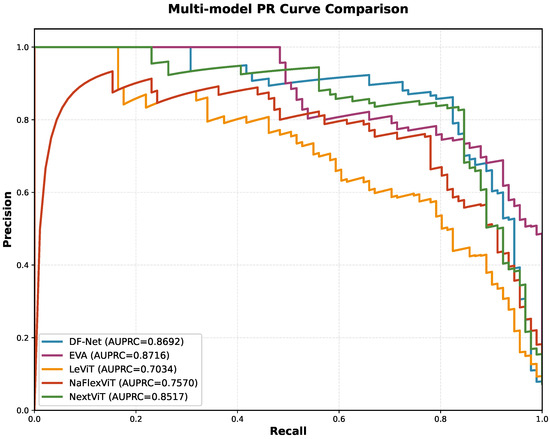
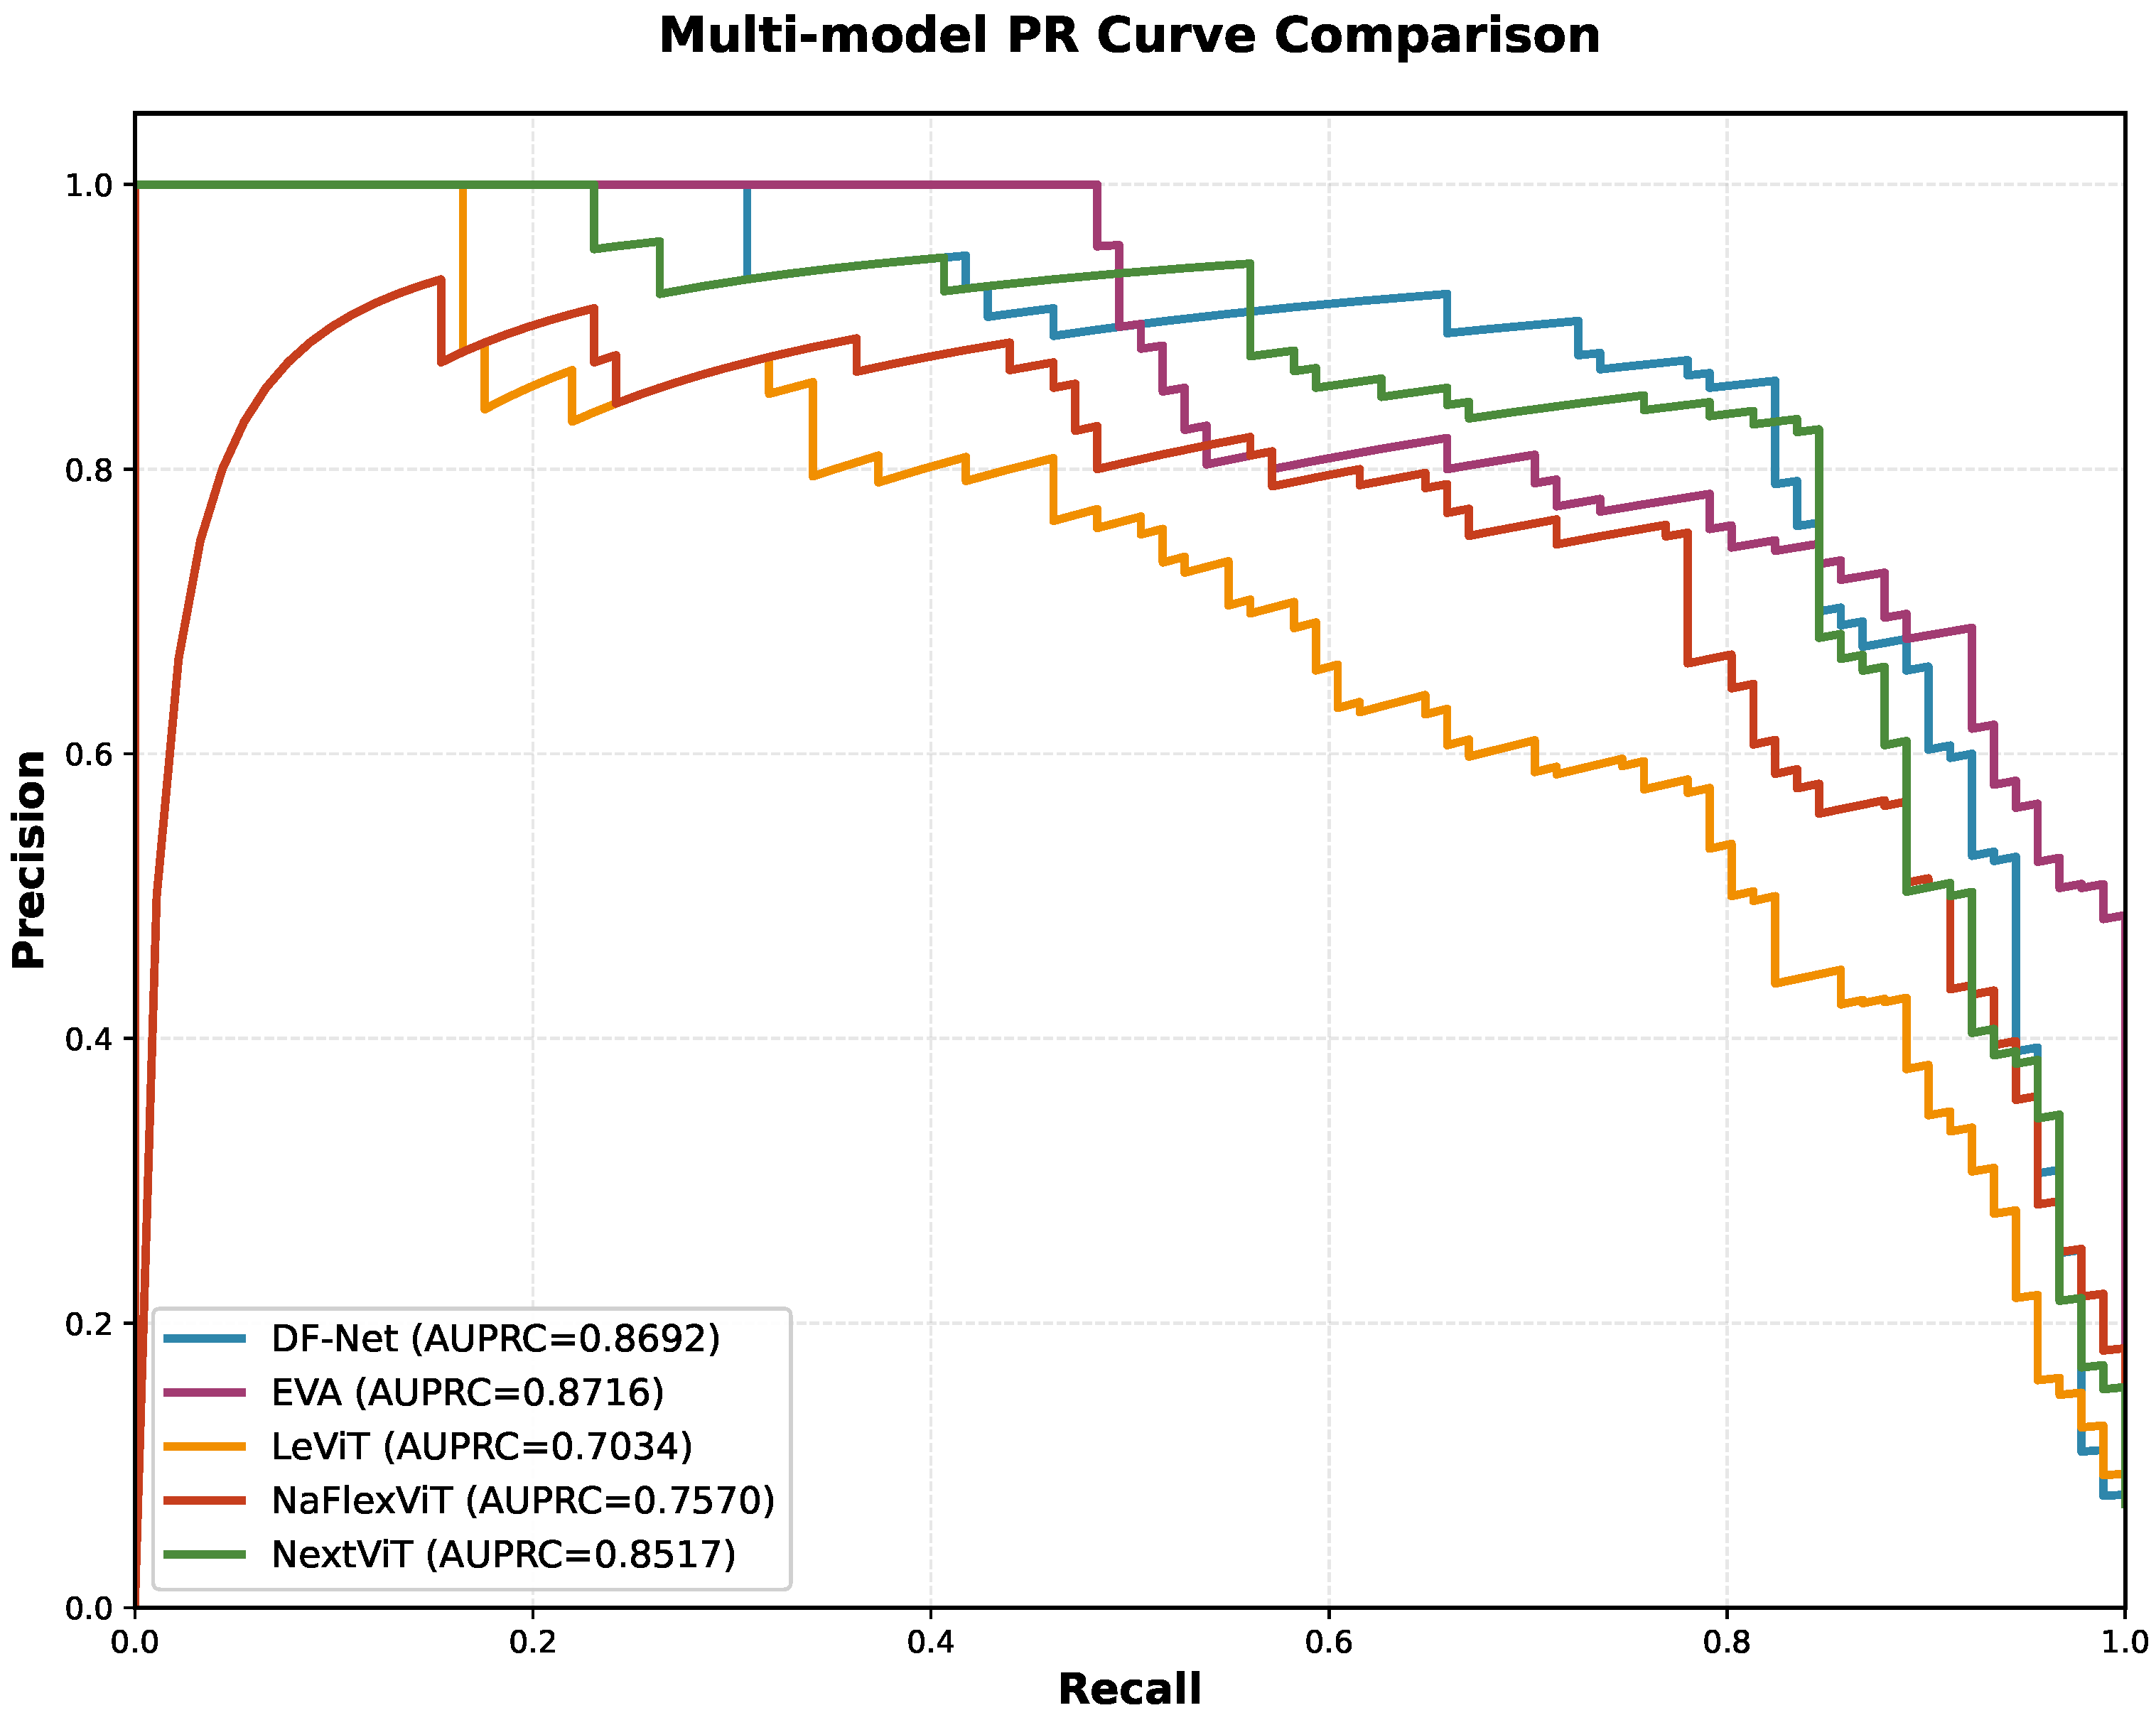
Figure 6 presents the precision–recall (PR) curves in the independent test zone (reg4). Compared with those of LeViT, Next-ViT, and NaFlexViT, the PR curves of DF-Net overall envelop those of the compared models, indicating a superior ability to balance precision and recall. In addition, DF-Net achieves an AUPRC of 0.8692, which is close to that of EVA (0.8716). However, within the moderate-to-high recall interval of 0.5–0.8, EVA results in a pronounced decrease in precision. In contrast, the DF-Net curve shows a smoother and more continuous decreasing trend, suggesting lower sensitivity to variations in the classification threshold and thus stronger overall discriminative performance and threshold robustness for Benggang identification.
Figure 6.
PR curves of the compared models.
3.2. Transfer Learning Analysis
Table 3 compares different freezing strategies when transferring UAV pretrained weights to remote-sensing data. Overall, as the number of frozen layers decreases (i.e., more trainable parameters), the metrics on the test set improve: when Stages 1–4 are frozen, the accuracy is 90.95%, and the F1 score is 56.70%; when only Stage 1 is frozen, the accuracy increases to 95.51%, and the F1 score increases to 73.08%. This indicates a significant domain gap between UAV and satellite remote sensing in terms of resolution and texture representation, and appropriately unfreezing high-level and even mid-level parameters helps the model learn discriminative representations suited to satellite data. Moreover, compared with training from scratch, transfer learning yields a more stable convergence process with fewer epochs, thereby improving training efficiency. In addition, as fewer layers are frozen, the overall performance increases markedly, suggesting that allowing more layers to participate in training enables better adaptation to distribution differences between remote-sensing data and high-precision UAV data.
Table 3.
Ablation study on the number of frozen layers. The best results are highlighted in bold.
3.3. Data Processing Analysis
Table 4 shows the impact of sample labeling strategies under different overlap thresholds on model performance. With 0.70 as the positive sample threshold, the model achieves 97.44% accuracy, 85.71% recall, and an 82.98% F1 score.
Table 4.
Ablation study on cropping overlap threshold. The best results are highlighted in bold.
When the threshold is set to 90%, most Benggang samples correspond to their central regions, causing the training process to focus solely on features in the central areas. As a result, the model ignores information about the boundaries of the Benggangs, leading to misclassifications when identifying images that contain Benggang boundaries. When the threshold is lowered to 0.50 or 0.30, the recall rate changes only slightly, while the precision rate drops significantly. This indicates that a lower threshold introduces more borderline samples and mixed samples; the increase in borderline samples reduces the expression of the Benggang feature, thereby introducing more environmental noise, causing the model to learn irrelevant feature information and generate more false positives.
Considering the trade-off between accuracy and recall, the 0.70 threshold reduces noise while retaining more representative Benggang samples, which is beneficial for improving model robustness.
3.4. Feature Extraction Analysis
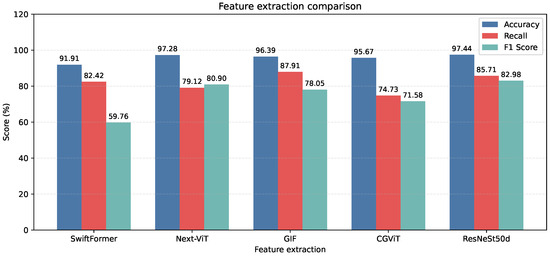
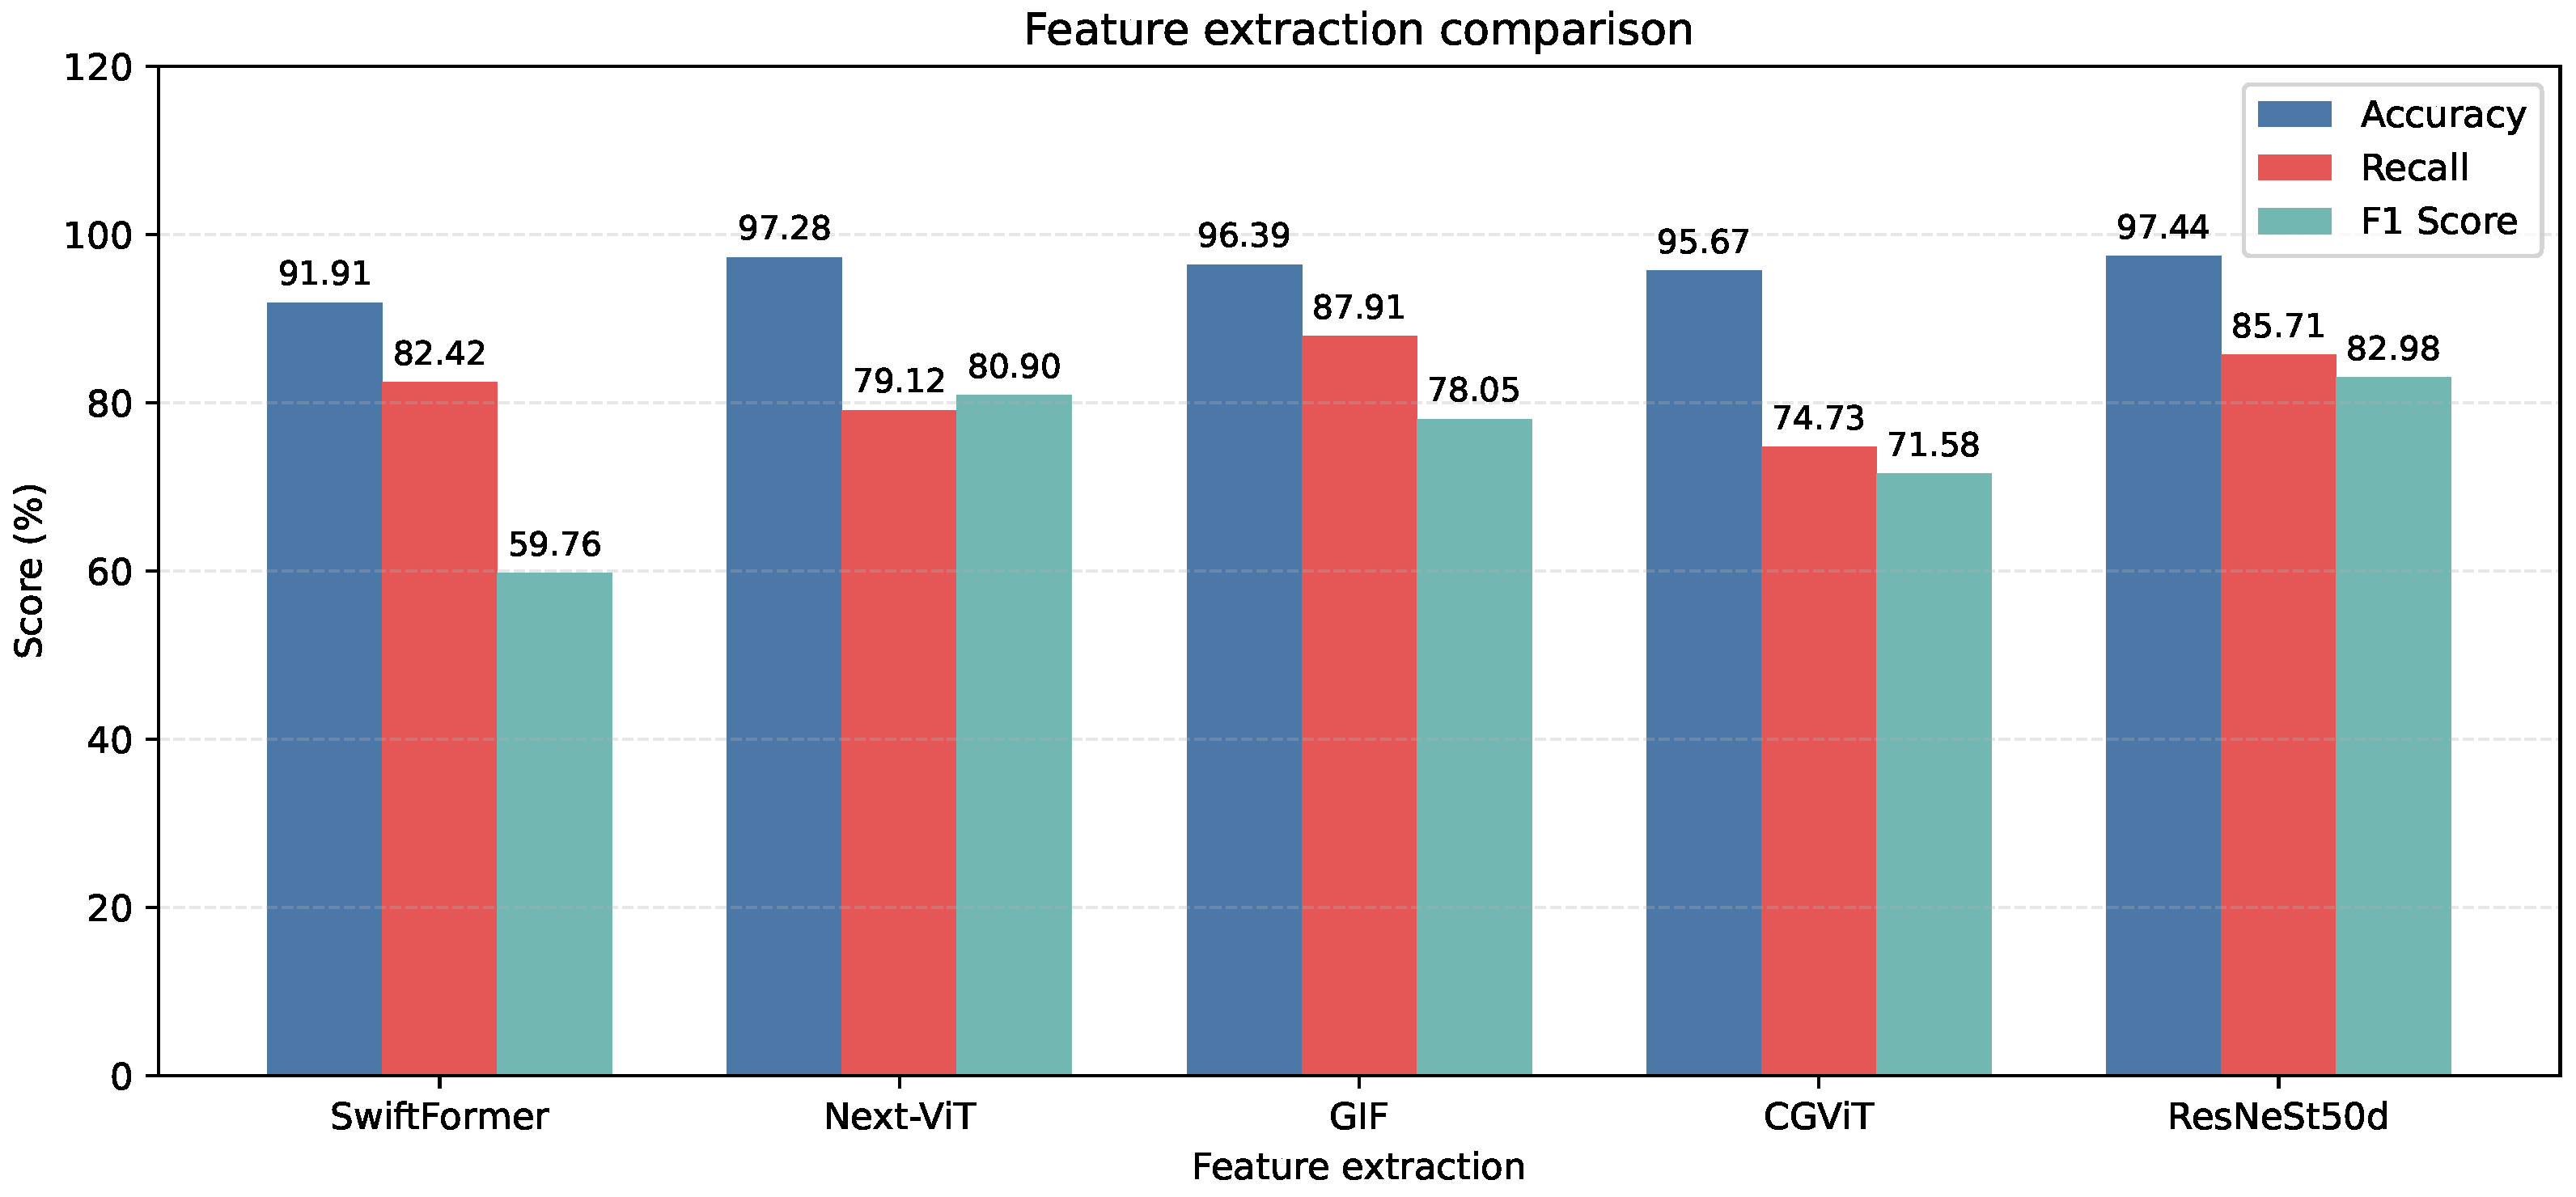
To analyze the ability of different backbone networks to represent Benggang remote-sensing features, several classic and recent models, including ResNeSt50d [28], SwiftFormer [29], Next-ViT [25], GIF [30], and CGViT [31], are selected as encoder alternatives. As shown in Figure 7, ResNeSt50d yields the best combination, with 97.44% accuracy, 85.71% recall, and an 82.98% F1 score. Next-ViT attains accuracy close to that of ResNeSt50d but with lower recall, indicating higher sensitivity to class imbalance. GIF and SwiftFormer yield relatively high recall but lower accuracy and F1-scores, suggesting that some non-Benggang backgrounds are misclassified as Benggang; CGViT also performs worse than ResNeSt50d. Overall, ResNeSt50d is more suitable for robust multiscale feature extraction in this task.
Figure 7.
Performance comparison of the feature extraction module.
3.5. Feature Fusion Analysis
To verify the effectiveness of the fusion strategies, multiple feature fusion schemes are compared (Table 5). The best performance (accuracy 97.44%, recall 85.71%, and F1 score 82.98%) is achieved when the proposed feature fusion method is used, and the fusion order in which the DEM provides high-level semantic constraints and the DOM supplements low-level textures is adopted, further improving the recall and F1 score relative to the original fusion order. In contrast, some Top-K attention combinations improve the recall but introduce more false positives, resulting in lower F1 scores. These results indicate that sparse cross-attention fusion integrating a multiscale context can more effectively suppress background interference and fully leverage the complementary information of the DOM and DEM.
Table 5.
Performance comparison of feature fusion modules.
Furthermore, Table 6 compares the performance and parameter scale of the two fusion structures. Module 2 achieves 97.44% accuracy, 85.71% recall, and an 82.98% F1 score, outperforming Module 1 (95.51%, 83.52%, and 73.08%, respectively). Moreover, Module 2 has 143.6 M parameters, which is substantially lower than Module 1’s 843.2 M. These results suggest that Module 1 is more susceptible to complex background noise, whereas Module 2, with multiwindow context and sparse cross-attention, is more conducive to robust fusion in large-area scenes while remaining lightweight.
Table 6.
Performance comparison of feature fusion structures.
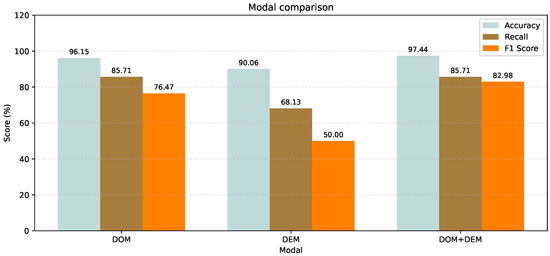
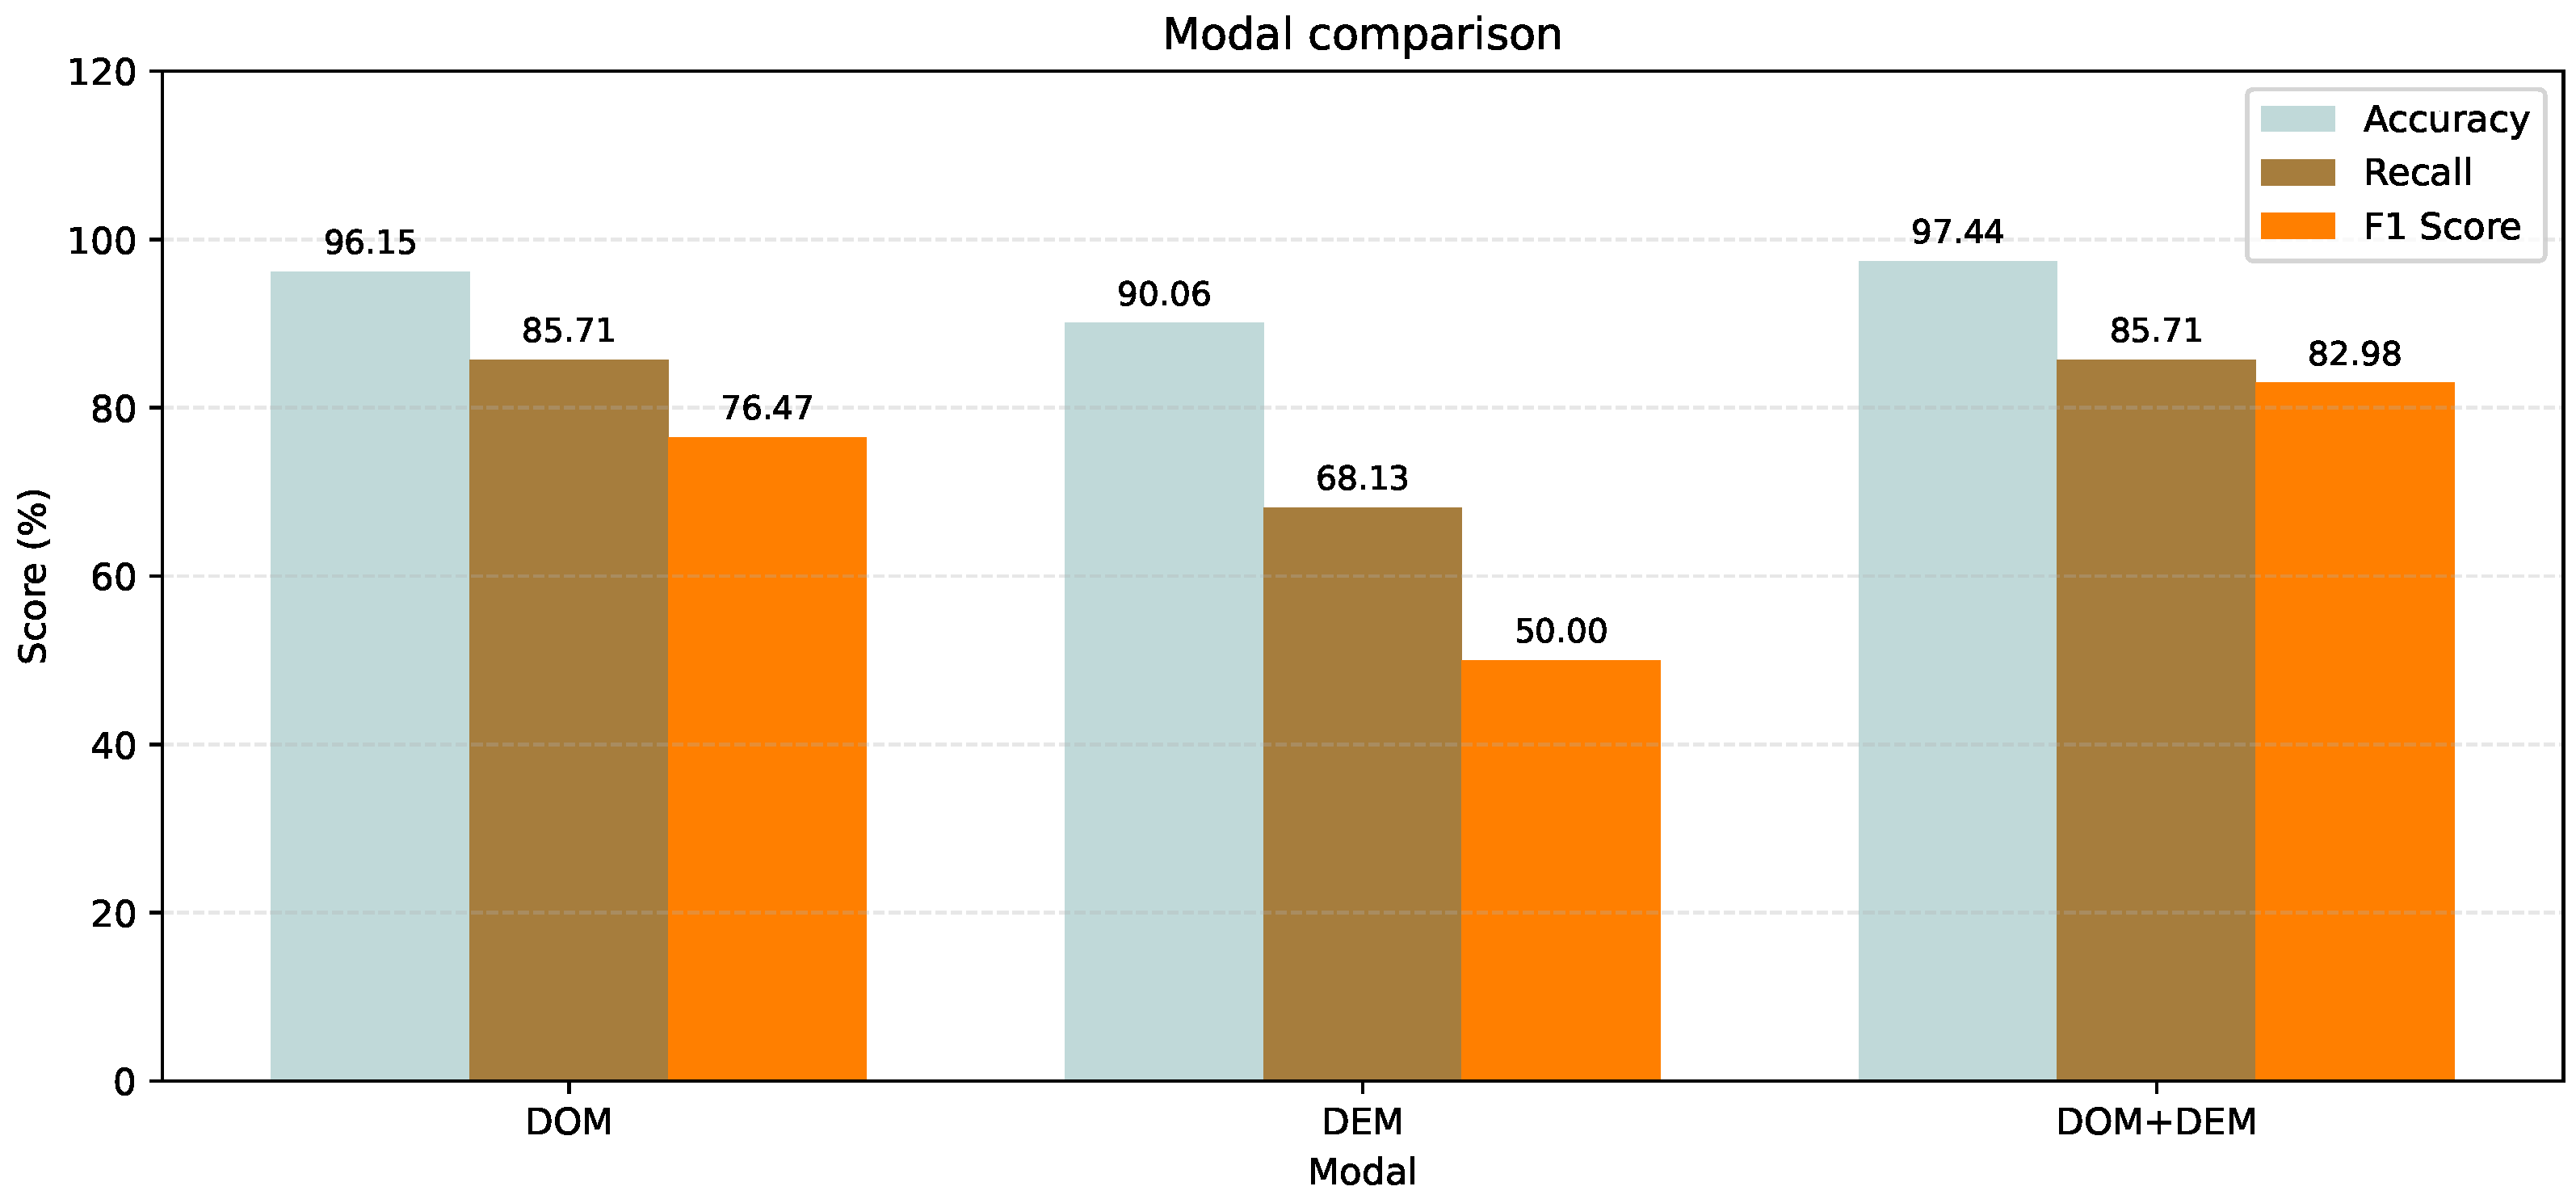
To verify the effectiveness of the proposed fusion module in integrating DEM and DOM information, ablation experiments were conducted using a DOM-only modality, a DEM-only modality, and a dual-modality configuration combining the DOM and DEM. The results in Figure 8 show that the DOM-only model achieves 96.15% accuracy and 85.71% recall, indicating that the DOM data already provide strong recognition performance. In contrast, the DEM-only model attains an accuracy of 90.06% and a recall of 68.13%, suggesting that the DEM and derived terrain factors are also informative and can provide certain morphological cues of Benggang. Notably, the dual-modality model performs significantly better than either single-modality model in Benggang remote-sensing recognition, reaching 97.44% accuracy and 85.71% recall. Compared with the DOM-only setting, the F1 score results in a more pronounced improvement, demonstrating that incorporating the DEM can suppress interference from complex environments and enhance the precision of recognition, thereby improving the overall accuracy and F1 score.
Figure 8.
Comparison of modal fusion performance.
3.6. Imbalanced Sample Analysis
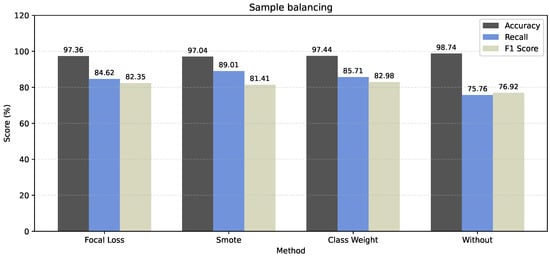
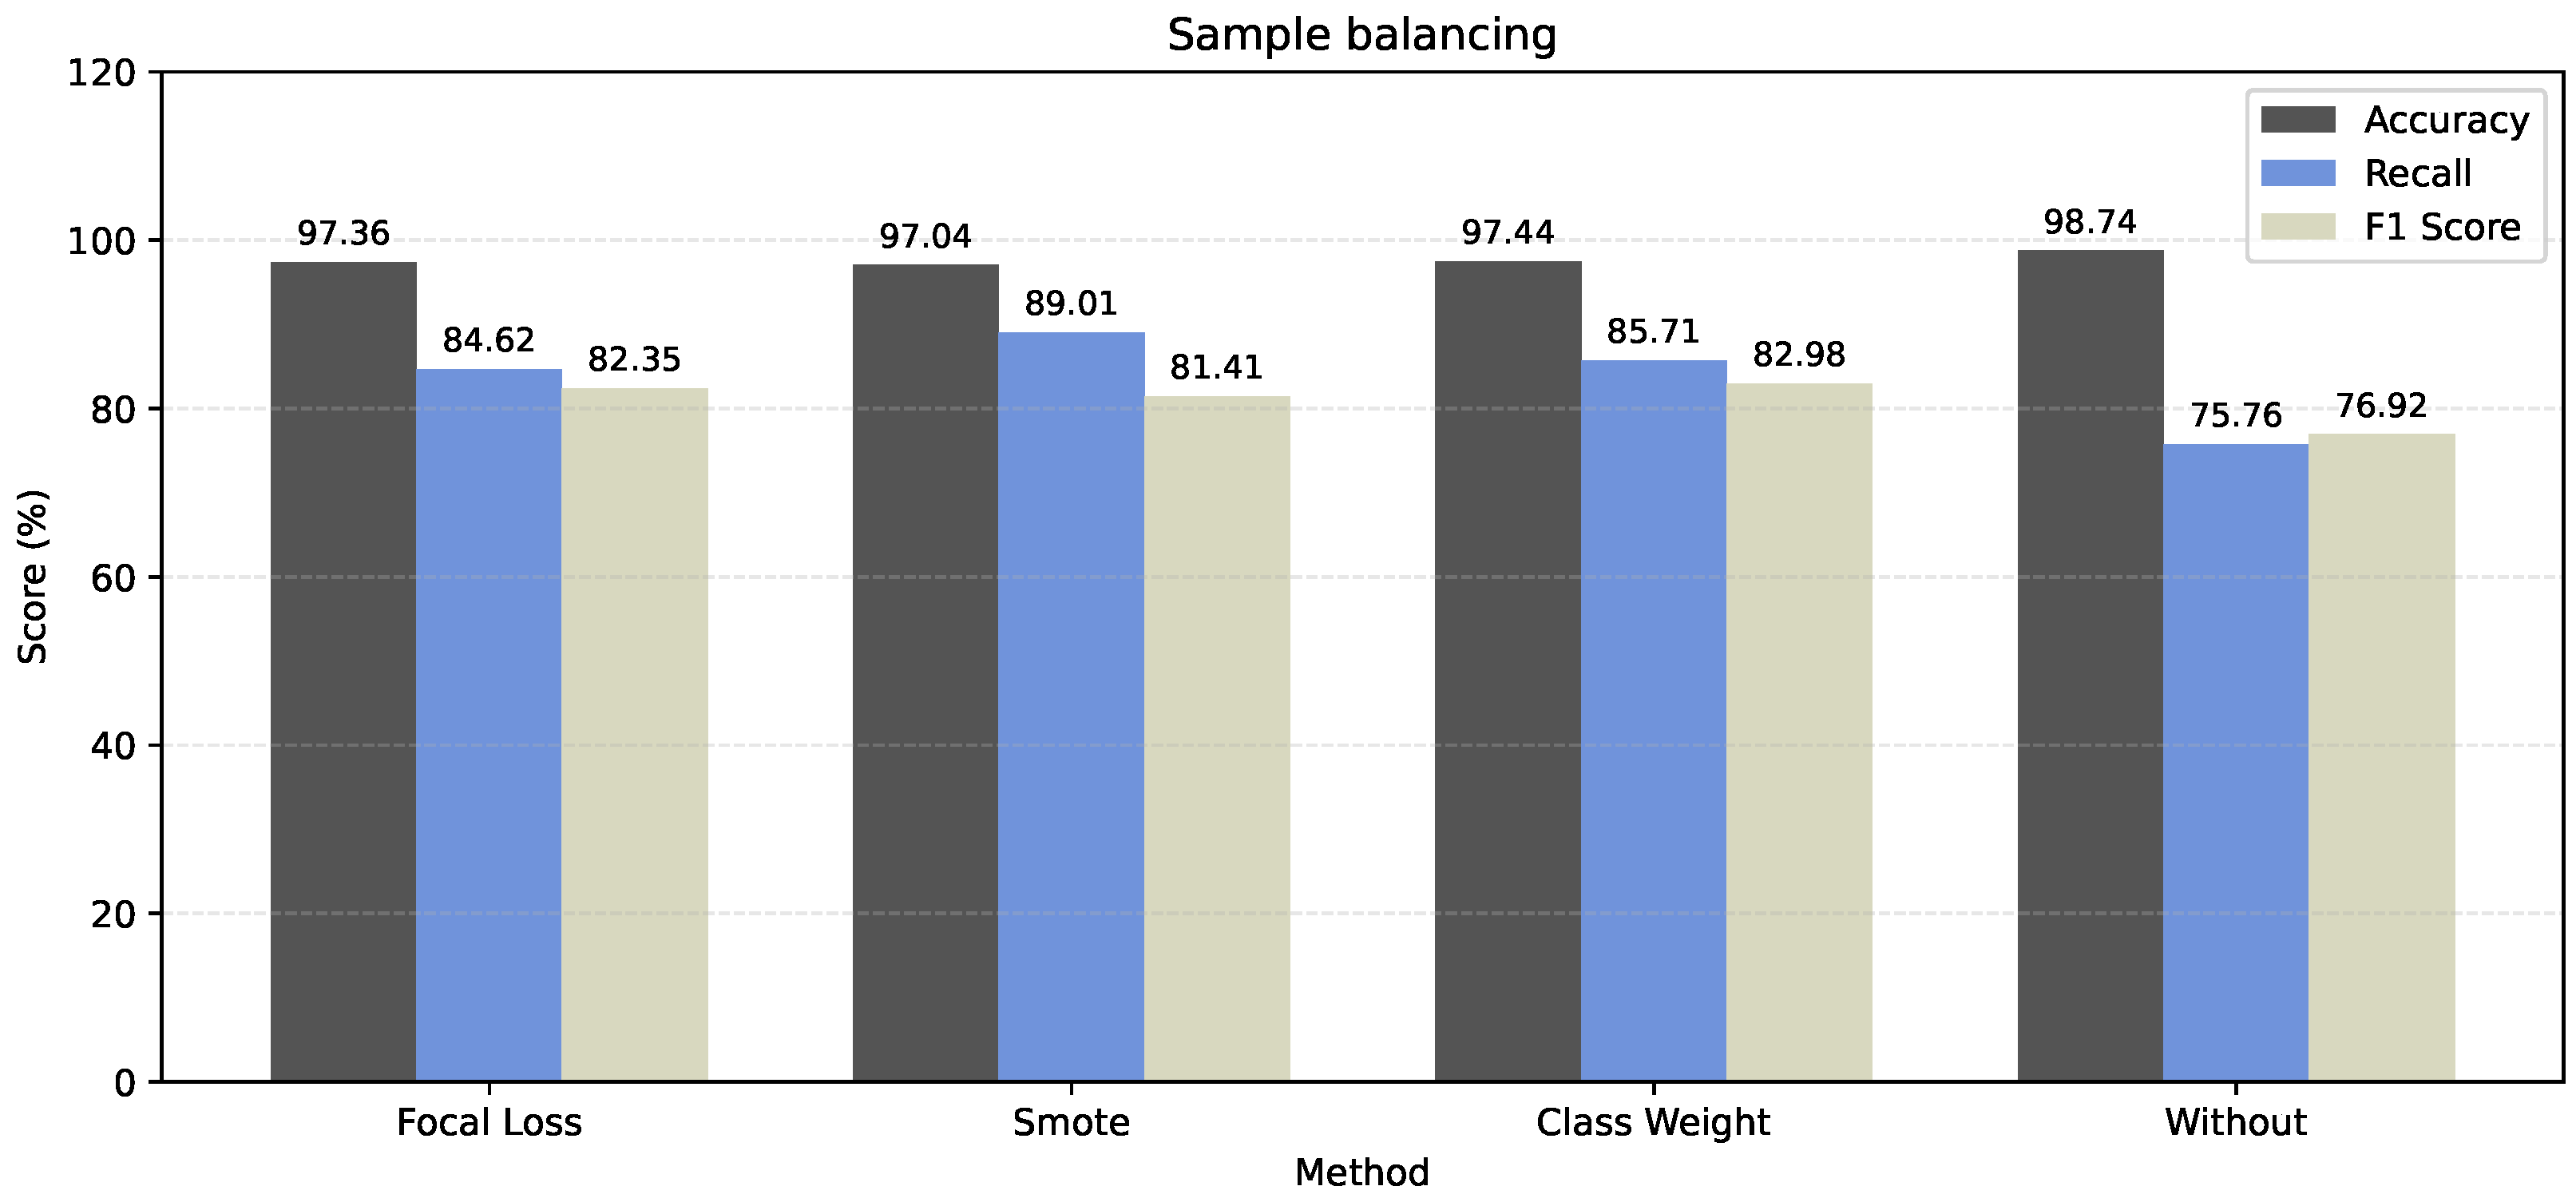
Given the imbalance between positive and negative samples in this study, focal loss, SMOTE, and class weighting were introduced and evaluated via ablation experiments to address the class imbalance issue. As shown by the results in Figure 9, the class-weighting strategy achieved the best overall performance, yielding an accuracy of 97.44% and a recall of 85.71%. Although SMOTE led to a notable improvement in the recall, both the accuracy and F1 score decreased. This indicates that SMOTE, as an oversampling approach, synthesizes new instances among minority class samples to balance the distribution; however, for Benggang remote-sensing data with complex textures, the generated synthetic samples may amplify noise, thereby adversely affecting precision.
Figure 9.
Ablation experiment on sample balancing.
In summary, the classweight approach enhances the penalization of minority classes at the loss function level, improving recall while effectively controlling false positives, thereby enabling the model to achieve a better balance between precision and recall.
To further illustrate the model’s classification decision-making mechanism in scenarios with imbalanced data, we present the confusion matrix for the test set in Table 7. The table shows that the total number of tests (TN) is 11,355 and the total number of positive tests (TP) is 210, with 16 false positives (FP) and 75 false negatives (FN). This indicates that the model achieves a high accuracy in correctly identifying non-Benggang samples, with only 210 samples misclassified as Benggangs, and only 16 false negatives for Benggang samples. This is because our multi-scale coefficient attention fusion mechanism enhances the boundary features of Benggangs and suppresses related spectral noise interference through Top-K sparsification, further demonstrating the robustness of our model.
Table 7.
Confusion matrix statistics table.
Therefore, although the number of positive samples is small, this accurately reflects the discrete distribution of Benggangs—a specific type of geological hazard—in the natural environment. The model maintains a low misclassification rate even in complex, unseen geographical environments, indicating that it captures the intrinsic topographic features of Benggangs. Combined with the analysis of the AUPRC = 86.92% result in the PR curve shown in Figure 6, we can further demonstrate that this performance is not coincidental. Therefore, our sample size of Benggangs is sufficient to support a reliable model evaluation.
4. Discussion
4.1. Novelty and Robustness Analysis
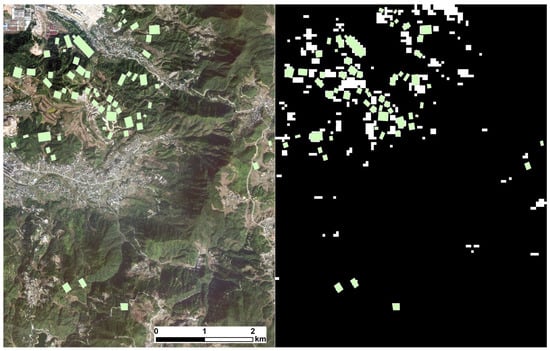
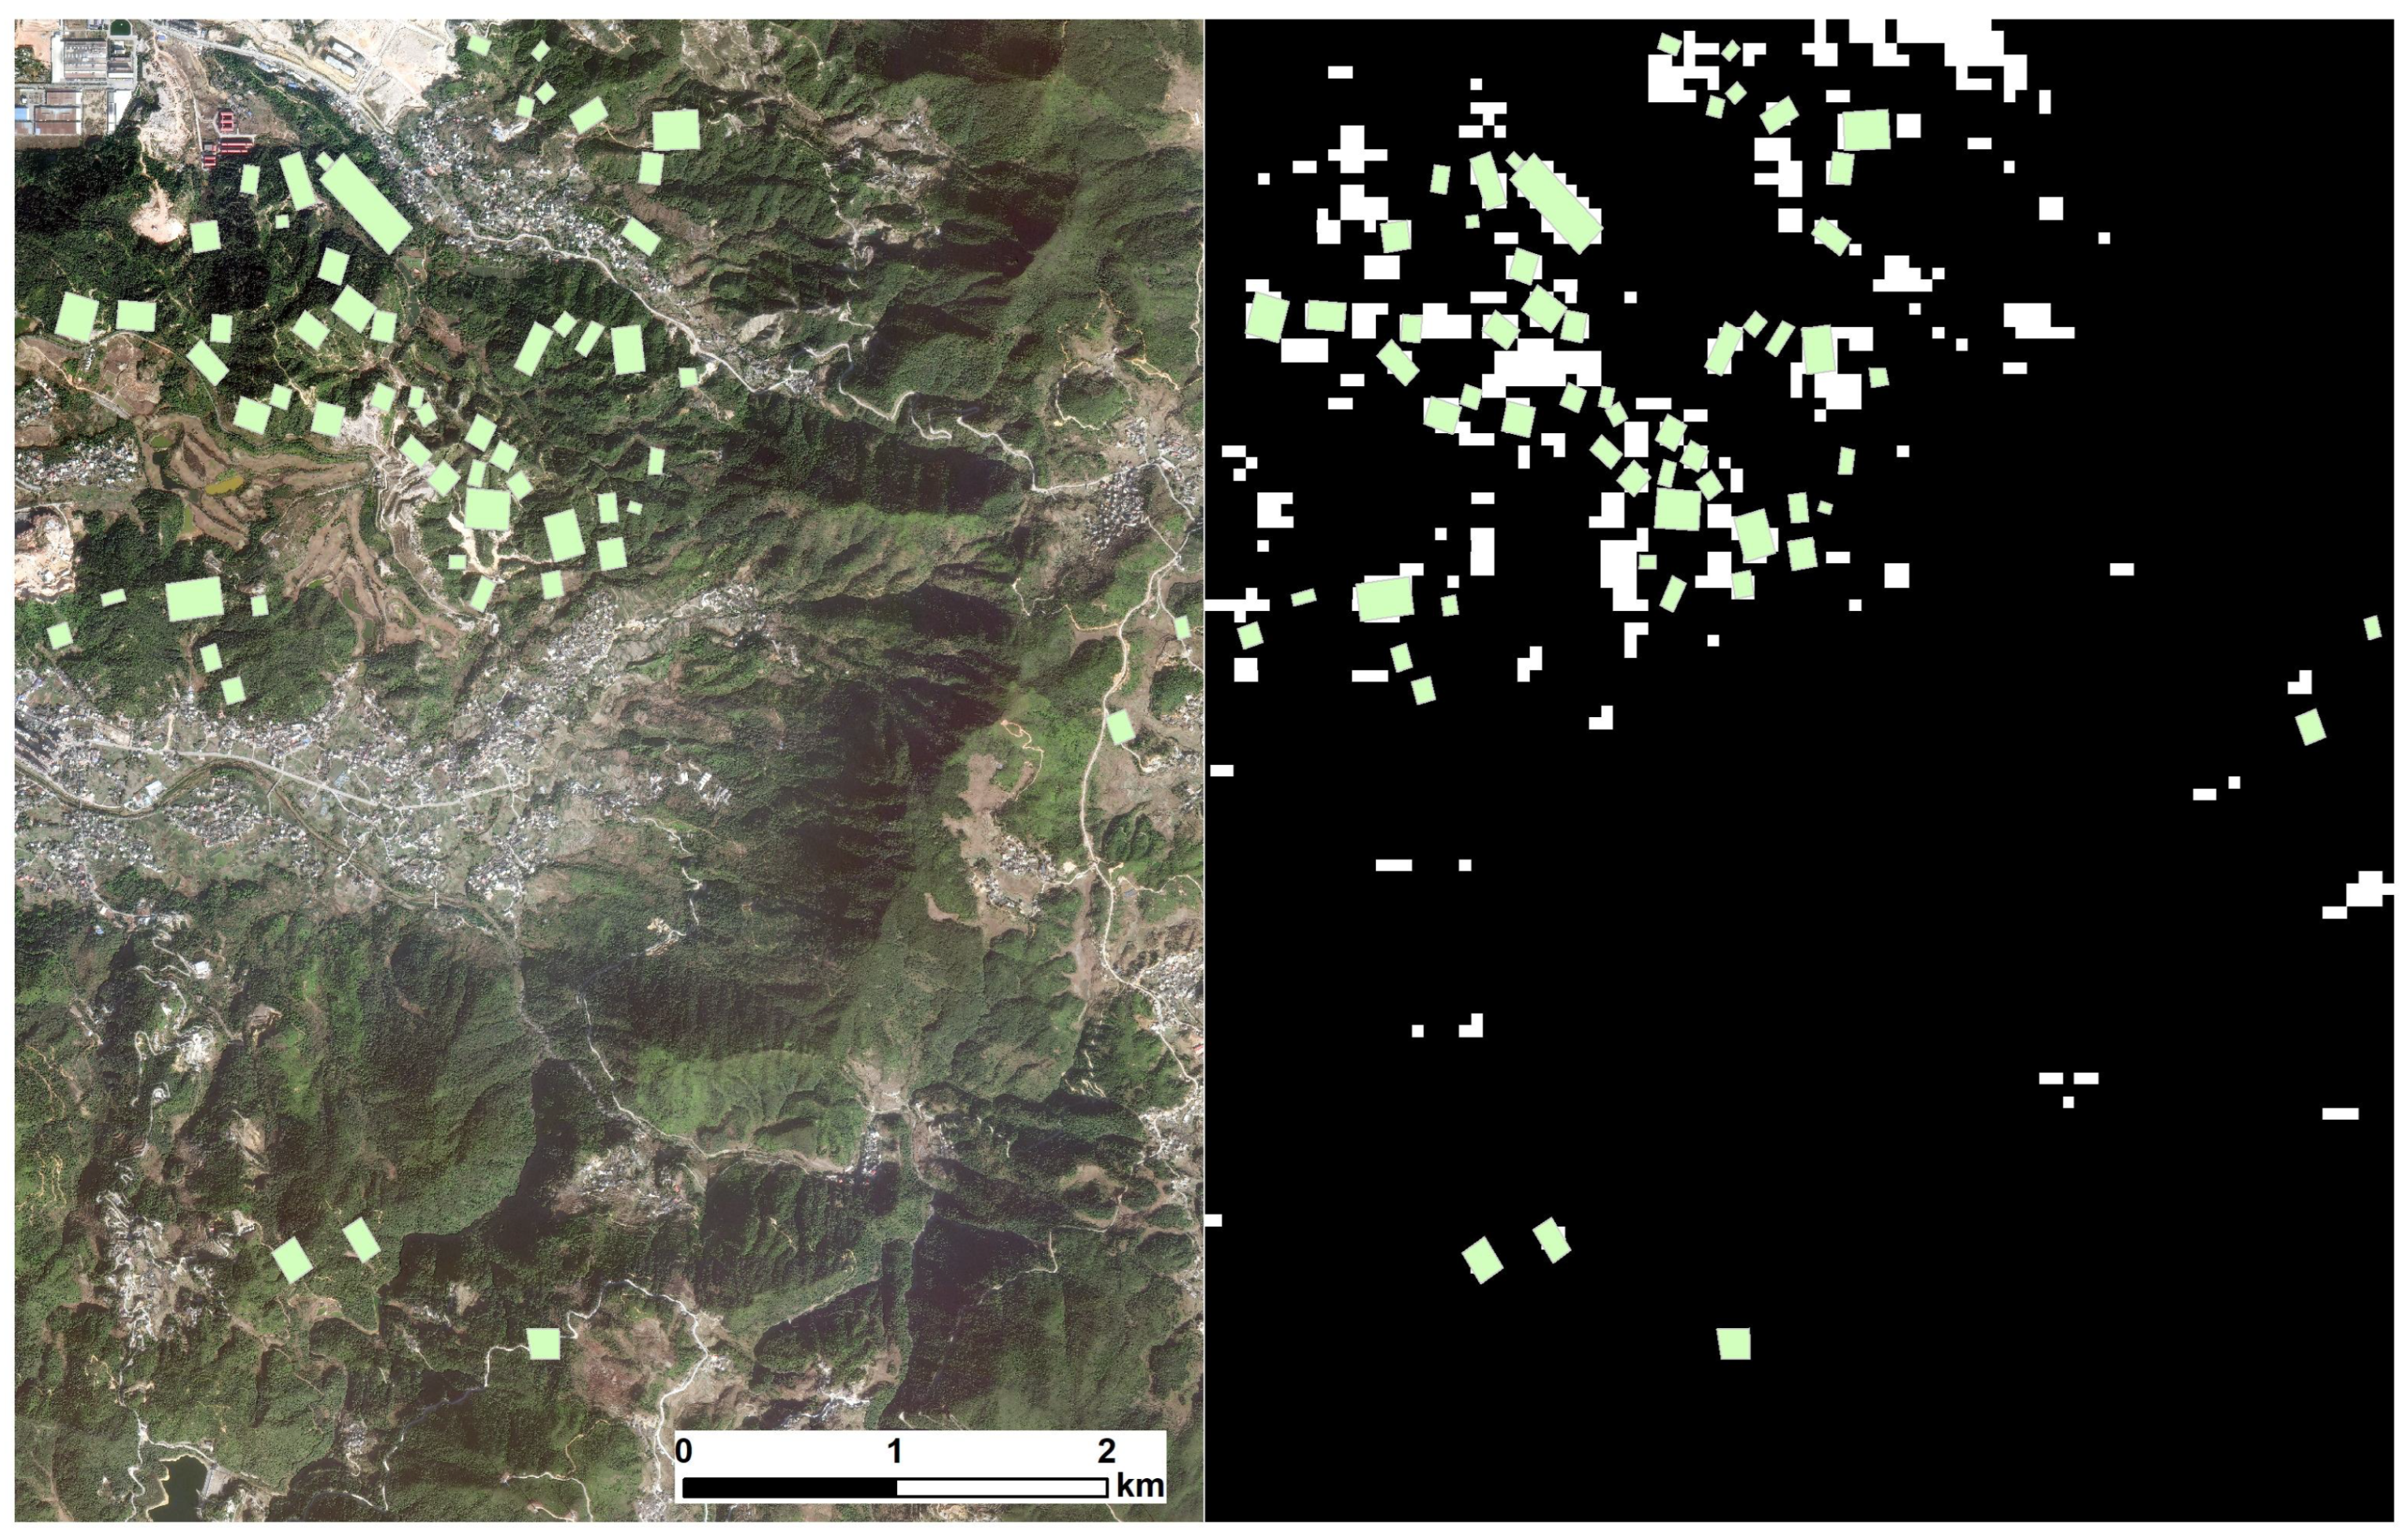
According to the comparison results in the independent test zone, DF-Net achieves markedly better performance than other mainstream classification methods in terms of accuracy, recall, and F1 score, reaching 97.44% accuracy, 85.71% recall, and an 82.98% F1 score. To further verify robustness, predictions on the independent test zone (reg4) are visualized. In Figure 10, the white areas indicate the predicted Benggang regions, and the green areas denote manual annotations. The predicted Benggang locations are highly consistent with the manual labels. In particular, in the lower half of the image with dense vegetation, the false-alarm rate is low, indicating good robustness in detecting positive samples. These results demonstrate that the optimization strategy of “feature-level enhancement—cross-modal sparse fusion—decision ensembling” effectively improves the effectiveness of rapid Benggang identification. Specifically,
Figure 10.
Test area and prediction results.The white areas represent the model’s predicted Benggang zones, the black areas represent the model’s predicted non-Benggang zones, and the green areas indicate the actual Benggang zone labels.The scale of this map is 1:42,980.
- Feature-level enhancement. Benggang landforms often exhibit distinctive morphological characteristics, such as steep gully walls, clear erosion-pit walls, and exposed parent material. The multimodal feature enhancement and fusion strategy effectively reduces confusion between Benggang regions and homogeneous bare land. Specifically, by incorporating DEM-derived factors such as slope, aspect, curvature, and hillshade, the model is provided with effective information compensation when the DOM quality decreases due to illumination changes or vegetation occlusion;
- Cross-modal sparse fusion. During Benggang identification, a top-K sparsification mechanism is introduced in the multiscale feature fusion module, making attention allocation more focused on task-relevant regions. This not only reduces sensitivity to noise but also offers significant advantages at the parameter scale, clearly outperforming the traditional dual-attention weighted fusion method;
- Multibranch decision ensembling. The DOM branch, DEM branch, and fusion branch provide complementary evidence, and decision-level ensembling effectively mitigates the potential biases of a single-branch model in specific scenarios. Moreover, the progressive freeze–unfreeze fine-tuning strategy improves training efficiency while preserving source-domain general representations. As more layers are unfrozen, the overall model performance improves significantly, reflecting a pronounced domain gap between UAV and satellite data in terms of resolution, texture details, and imaging noise, which requires updating mid-to-high-level features to accomplish “domain alignment”.
4.2. Limitations and Complexity
Although the proposed method achieves relatively high completeness and correctness in Benggang identification, a small number of misclassifications remain. In Figure 10, noticeable false positives occur in areas with more exposed vegetation or less distinct boundary information, mainly because land-cover types such as bare soil, roads, and quarries are similar to Benggang in DOM color and texture, and the limited DEM resolution makes them difficult to distinguish, leading to misidentification. In addition, while the sliding-window cropping and overlap threshold strategies can reduce label noise, they may still introduce mixed edge samples, causing uncertain predictions in “transition regions”. Table 4 shows that lowering the threshold substantially increases the proportion of noisy samples and reduces accuracy, indicating that the sample construction strategy directly affects model robustness.
Therefore, since the current model is trained and tested solely on a specific dataset, its generalization ability may be significantly reduced under different soil types, in areas with denser vegetation cover, or under complex terrain conditions. In particular, recognition stability faces challenges during the early stages of Benggang, where the background areas—such as roads and bare soil—are highly similar, or where vegetation cover is sparse and terrain changes are minimal.
In terms of computational complexity, although multi-scale sparse attention fusion effectively reduces the computational overhead of traditional cross-attention through a Top-K mechanism, the dual-stream ResNeSt backbone combined with multi-branch decision-level ensemble remains more complex than single-modal CNN models. It places high demands on hardware resources (GPU memory and computation time), which imposes certain limitations when conducting real-time screening of vast areas or deploying the system on devices with limited computational power.
From an application perspective, DF-Net is more suitable for regional-scale “rapid screening/key-area delineation” tasks, improving recall while maintaining high accuracy and thus reducing the number of governance blind spots caused by missed detections. For governance planning and effectiveness assessment, model outputs can be further integrated with slope classification, land-use types, or watershed-unit statistics to form a decision-oriented indicator system. Future work can improve practicality in the following three ways:
- Introducing higher-resolution or multitemporal terrain data, such as high-precision digital elevation model (DEM) or InSAR products, to strengthen constraints on microtopographic differences and improve the identification of small-scale Benggang areas;
- Semisupervised/self-supervised learning and uncertainty estimation are explored to reduce labeling costs and improve generalizability, maintaining good performance under data scarcity or low-quality labels;
- A lightweight network design is combined with model compression techniques to improve inference efficiency, meet the requirements of regional surveys and operational deployment, and perform corresponding validations.
5. Conclusions
To meet the needs of rapid regional-scale Benggang identification, this study proposes DF-Net, a two-stream deep learning model based on multimodal feature enhancement and sparse cross-attention fusion, and validates it on coregistered GF-2 DOM and ALOS DEM data in Anxi County, Fujian Province. The main conclusions are as follows:
- To enhance Benggang feature representation, Canny edge features are introduced in the DOM branch, and terrain factors such as slope/aspect/curvature/hillshade are stacked in the DEM branch, strengthening representations of Benggang boundaries and morphological characteristics;
- A multiwindow context-driven sparse cross-attention fusion module is designed for feature fusion. By using Top-K sparsification to suppress complex background noise, it enables efficient aggregation of complementary cross-modal information. Compared with the dual-attention weighted fusion scheme, it improves accuracy by 1.93% while substantially reducing the parameter scale;
- In the zonal independent test zone, DF-Net achieves 97.44% accuracy, 85.71% recall, and an 82.98% F1 score, outperforming multiple mainstream CNNs and transformer baselines and verifying the effectiveness and robustness of the proposed method for complex erosional landform recognition.
In the future, we will further expand on multiregional multitemporal samples, develop segmentation-level fine extraction and uncertainty estimation techniques, and combine model compression and edge-inference optimization strategies to promote DF-Net applications in regional surveys and governance evaluation. Moreover, we explore the integration of model outputs with management-oriented indicators such as slope grading, land-use types, or watershed-unit statistics, providing more scientific and comprehensive support for the prevention and management of Benggang hazards.
Author Contributions
Conceptualization, X.R. and Y.H.; data curation, Q.C. and J.L.; methodology, X.R. and Q.C.; supervision, X.R., Q.C., Y.H. and K.Z.; writing—original draft, X.R. and Q.C.; writing—review and editing, X.R., Z.C. and K.Z. All authors have read and agreed to the published version of the manuscript.
Funding
This research was funded by the Science and Technology Program Fund of the Fujian Provincial Department of Finance (LX-2024-HX-011) and the National Natural Science Foundation of China (41601557).
Data Availability Statement
The data presented in this study are available on request from the corresponding author due to privacy concerns and legal restrictions associated with geographic data.
Conflicts of Interest
The authors declare no conflicts of interest.
References
- Zhu, X.C.; Gao, L.; Wei, X.R.; Li, T.C.; Shao, M.A. Progress and prospect of studies of Benggang erosion in southern China. Geoderma 2023, 438, 116656. [Google Scholar] [CrossRef] [Scilit]
- Liao, Y.S.; Yuan, Z.J.; Zheng, M.G.; Li, D.G.; Nie, X.D.; Wu, X.L.; Huang, B.; Xie, Z.Y.; Tang, C.Y. The spatial distribution of Benggang and the factors that influence it. Land Degrad. Dev. 2019, 30, 2323–2335. [Google Scholar] [CrossRef] [Scilit]
- Lin, Z.; Liao, D.L.; Huang, W.X.; Cai, C.F.; Deng, Y.S.; Duan, X.Q. Estimation of the soil hydraulic properties and parameter characteristics of Benggang erosion in granite in southern China. Hydrol. Process. 2023, 37, e14952. [Google Scholar] [CrossRef] [Scilit]
- Santangelo, M.; Cardinali, M.; Rossi, M.; Mondini, A.C.; Guzzetti, F. Remote landslide mapping using a laser rangefinder binocular and GPS. Nat. Hazards Earth Syst. Sci. 2010, 10, 2539–2546. [Google Scholar] [CrossRef] [Scilit]
- Alexander, D.E. A brief survey of GIS in mass-movement studies, with reflections on theory and methods. Geomorphology 2008, 94, 261–267. [Google Scholar] [CrossRef] [Scilit]
- Wang, H.H.; Nie, D.L.; Tuo, X.G.; Zhong, Y.S. Research on crack monitoring at the trailing edge of landslides based on image processing. Landslides 2020, 17, 985–1007. [Google Scholar] [CrossRef] [Scilit]
- Lissak, C.; Bartsch, A.; De Michele, M.; Gomez, C.; Maquaire, O.; Raucoules, D.; Roulland, T. Remote sensing for assessing landslides and associated hazards. Surv. Geophys. 2020, 41, 1391–1435. [Google Scholar] [CrossRef] [Scilit]
- Mulabbi, A.; Danoedoro, P.; Samodra, G. Automatic Landslide Mapping with Interpretable Attention-based Convolutional Neural Networks Using Remote Sensing Data. Int. J. Geoinformatics 2025, 21, 81–99. [Google Scholar] [CrossRef] [Scilit]
- Zhao, Y.; Yang, H.; Yan, H.; Shen, S.; Cai, D.; Lyu, X. Benggang Extraction Based on Improved U-Net Model from Satellite Remote Sensing Images. In Proceedings of the 2023 4th International Conference on Computer Vision, Image and Deep Learning (CVIDL); IEEE: Zhuhai, China, 2023; pp. 170–174. [Google Scholar]
- Hu, Y.X.; Qi, Z.X.; Zhou, Z.X.; Qin, Y. Detection of Benggang in Remote Sensing Imagery through Integration of Segmentation Anything Model with Object-Based Classification. Remote Sens. 2024, 16, 428. [Google Scholar] [CrossRef] [Scilit]
- Zhu, S.P.; Zhang, Q.R.; Belloulata, K. An Image Segmentation Algorithm in Image Processing Based on Threshold Segmentation. In Proccedings of the 2007 Third International IEEE Conference on Signal-Image Technologies and Internet-Based System; IEEE: Los Alamitos, CA, USA, 2007; pp. 673–678. [Google Scholar]
- Xu, Y.L.; Bi, H.B.; Yu, H.F.; Lu, W.X.; Li, P.F.; Li, X.M.; Sun, X. Attention-based contrastive learning for few-shot remote sensing image classification. IEEE Trans. Geosci. Remote Sens. 2024, 62, 5620317. [Google Scholar] [CrossRef] [Scilit]
- Shen, S.Y.; Chen, J.S.; Cheng, D.B.; Liu, H.H.; Zhang, T. Benggang segmentation via deep exchanging of digital orthophoto map and digital surface model features. Int. Soil Water Conserv. Res. 2024, 12, 589–599. [Google Scholar] [CrossRef] [Scilit]
- Li, B.Y.; Guo, Y.L.; Yang, J.G.; Wang, L.G.; Wang, Y.Q.; An, W. Gated recurrent multiattention network for VHR remote sensing image classification. IEEE Trans. Geosci. Remote Sens. 2021, 60, 5606113. [Google Scholar] [CrossRef] [Scilit]
- Xu, F.L.; Mei, S.H.; Zhang, G.; Wang, N.; Du, Q. Bridging CNN and transformer with cross-attention fusion network for hyperspectral image classification. IEEE Trans. Geosci. Remote Sens. 2024, 62, 5522214. [Google Scholar] [CrossRef] [Scilit]
- Zhang, B.; Chen, Y.X.; Rong, Y.; Xiong, S.W.; Lu, X.Q. MATNet: A combining multiattention and transformer network for hyperspectral image classification. IEEE Trans. Geosci. Remote Sens. 2023, 61, 5506015. [Google Scholar] [CrossRef] [Scilit]
- Liu, S.H.; Ma, Y.W.; Zhang, X.Q.; Wang, H.W.; Ji, J.Y.; Sun, X.S.; Ji, R.R. Rotated multiscale interaction network for referring remote sensing image segmentation. In Proceedings of the 2024 IEEE/CVF Conference on Computer Vision and Pattern Recognition (CVPR); IEEE: Seattle, WA, USA, 2024; pp. 26658–26668. [Google Scholar]
- Tang, X.; Li, M.T.; Ma, J.J.; Zhang, X.R.; Liu, F.; Jiao, L.C. EMTCAL: Efficient multiscale transformer and cross-level attention learning for remote sensing scene classification. IEEE Trans. Geosci. Remote Sens. 2022, 60, 5626915. [Google Scholar] [CrossRef] [Scilit]
- Ma, J.J.; Jiang, W.; Tang, X.; Zhang, X.R.; Liu, F.; Jiao, L.C. Multiscale sparse cross-attention network for remote sensing scene classification. IEEE Trans. Geosci. Remote Sens. 2025, 63, 5605416. [Google Scholar] [CrossRef] [Scilit]
- Ji, R.; Tekalp, A.M. A new multipicture architecture for learned video deinterlacing and demosaicing with parallel deformable convolution and self-attention blocks. Image Vis. Comput. 2024, 146, 105023. [Google Scholar] [CrossRef] [Scilit]
- Rao, X.L.; Feng, C.; Lin, J.S.; Chen, Z.D.; Ji, X.; Huang, Y.H.; Chen, R.G. Multiscale Two-Stream Fusion Network for Benggang Classification in Multi-Source Images. Sensors 2025, 25, 2924. [Google Scholar] [CrossRef] [Scilit] [PubMed]
- Fang, Y.X.; Wang, W.; Xie, B.H.; Sun, Q.; Wu, L.; Wang, X.G.; Huang, T.J.; Wang, X.L.; Cao, Y. Eva: Exploring the limits of masked visual representation learning at scale. In Proceedings of the 2023 IEEE/CVF Conference on Computer Vision and Pattern Recognition (CVPR); IEEE: Vancouver, BC, Canada, 2023; pp. 19358–19369. [Google Scholar]
- Graham, B.; El-Nouby, A.; Touvron, H.; Stock, P.; Joulin, A.; Jégou, H.; Douze, M. Levit: A vision transformer in convnet’s clothing for faster inference. In Proceedings of the 2021 IEEE/CVF International Conference on Computer Vision (ICCV); IEEE: Montreal, QC, Canada, 2021; pp. 12259–12269. [Google Scholar]
- Qin, D.F.; Leichner, C.; Delakis, M.; Fornoni, M.; Luo, S.X.; Yang, F.; Wang, W.J.; Banbury, C.; Ye, C.X.; Akin, B.; et al. MobileNetV4: Universal models for the mobile ecosystem. In Proceedings of the European Conference on Computer Vision (ECCV); Springer: Cham, Switzerland, 2024; pp. 78–96. [Google Scholar]
- Li, J.S.; Xia, X.; Li, W.; Li, H.X.; Wang, X.; Xiao, X.F.; Wang, R.; Zheng, M.; Pan, X. Next-vit: Next generation vision transformer for efficient deployment in realistic industrial scenarios. arXiv 2024, arXiv:2207.05501. [Google Scholar]
- Beyer, L.; Izmailov, P.; Kolesnikov, A.; Caron, M.; Kornblith, S.; Zhai, X.; Minderer, M.; Tschannen, M.; Alabdulmohsin, I.; Pavetic, F. Flexivit: One model for all patch sizes. In Proceedings of the 2023 IEEE/CVF Conference on Computer Vision and Pattern Recognition (CVPR); IEEE: Vancouver, BC, Canada, 2023; pp. 14496–14506. [Google Scholar]
- Dehghani, M.; Mustafa, B.; Djolonga, J.; Heek, J.; Minderer, M.; Caron, M.; Steiner, A.; Steiner, A.; Puigcerver, J.; Geirhos, R.; et al. Patch n’pack: Navit, a vision transformer for any aspect ratio and resolution. In Proceedings of the Advances in Neural Information Processing Systems 36 (NeurIPS 2023), New Orleans, LA, USA, 10–16 December 2023. [Google Scholar]
- Zhang, H.; Wu, C.; Zhang, Z.; Zhu, Y.; Lin, H.; Zhang, Z.; Sun, Y.; He, T.; Mueller, J.; Manmatha, R.; et al. Resnest: Split-attention networks. In Proceedings of the 2022 IEEE/CVF Conference on Computer Vision and Pattern Recognition Workshops (CVPRW); IEEE: New Orleans, LA, USA, 2022; pp. 2735–2745. [Google Scholar]
- Shaker, A.; Maaz, M.; Rasheed, H.; Khan, S.; Yang, M.-H.; Khan, F.S. Swiftformer: Efficient additive attention for transformer-based real-time mobile vision applications. In Proceedings of the 2023 IEEE/CVF International Conference on Computer Vision (ICCV); IEEE: Paris, France, 2023; pp. 17379–17390. [Google Scholar]
- Cheng, C.; Xu, T.; Feng, Z.; Wu, X.; Tang, Z.; Li, H.; Zhang, Z.; Atito, S.; Awais, M.; Kittler, J. One Model for ALL: Low-Level Task Interaction Is a Key to Task-Agnostic Image Fusion. In Proceedings of the 2025 IEEE/CVF Conference on Computer Vision and Pattern Recognition (CVPR); IEEE: Nashville, TN, USA, 2025; pp. 28102–28112. [Google Scholar]
- Liu, C.; Min, W.; Song, J.; Yang, Y.; Sheng, G.; Yao, T.; Wang, L.; Jiang, S. Channel grouping vision transformer for lightweight fruit and vegetable recognition. Expert Syst. Appl. 2025, 292, 128636. [Google Scholar] [CrossRef] [Scilit]

Disclaimer/Publisher’s Note: The statements, opinions and data contained in all publications are solely those of the individual author(s) and contributor(s) and not of MDPI and/or the editor(s). MDPI and/or the editor(s) disclaim responsibility for any injury to people or property resulting from any ideas, methods, instructions or products referred to in the content. |
© 2026 by the authors. Licensee MDPI, Basel, Switzerland. This article is an open access article distributed under the terms and conditions of the Creative Commons Attribution (CC BY) license.