


Abstract
Electromagnetic scattering from electronic platforms degrades system performance, increases radar detectability, and intensifies electromagnetic interference in modern radar and communication systems. Electromagnetic absorbing layers offer an effective approach for radar cross-section (RCS) reduction; however, existing machine-learning-based design methods rely on black-box, composition-specific models lacking physical interpretability and generalizable design rules. In this work, a physics-informed and interpretable machine learning framework is proposed for application-oriented electromagnetic absorber design in electronic systems. Physically meaningful electromagnetic descriptors related to impedance matching and attenuation are embedded into an explainable learning model to establish transparent relationships between absorber parameters and reflection-related performance. Unlike prior approaches, SHAP-based interpretability is applied to extract universal, quantitative design rules, and ML-driven inverse design is explicitly validated for electronic-system-level RCS reduction. Experimental validation confirms that the predicted designs achieve reflection-related performance with deviations below 5%, demonstrating the reliability of the proposed framework.
1. Introduction
In modern electronic systems such as radar platforms, wireless communication devices, and autonomous sensing equipment, unwanted electromagnetic scattering has become a critical challenge that directly affects system performance, electromagnetic compatibility, and operational survivability. Strong reflections from electronic surfaces not only degrade signal integrity and increase mutual interference, but also significantly enhance radar detectability by increasing the radar cross-section (RCS) of electronic platforms [1]. As electronic systems continue to evolve toward higher operating frequencies, compact integration, and multifunctional architectures, effective suppression of electromagnetic scattering has emerged as a key requirement in electronic system design [2,3].
One widely adopted strategy to mitigate electromagnetic scattering in electronic platforms is the incorporation of electromagnetic absorbing materials as functional coatings or integrated layers. By attenuating incident electromagnetic waves and reducing surface reflections, absorbers provide an effective means of RCS reduction and electromagnetic interference (EMI) suppression without relying on complex structural modifications [4]. From an electronic system perspective, the performance of absorbing layers is commonly evaluated through reflection-related metrics, such as reflection loss and effective absorption bandwidth, which serve as material-level indicators directly linked to system-level scattering behavior. Consequently, the rational design of electromagnetic absorbers plays a vital role in enhancing stealth performance, electromagnetic compatibility, and signal fidelity in electronic systems.
Despite extensive experimental efforts in developing advanced absorbing materials, the rational design of electromagnetic absorbers for electronic system applications remains challenging. Several machine learning strategies have been explored for microwave absorber design, including neural-network-based forward prediction, genetic-algorithm-assisted inverse design, and deep learning pattern-to-absorption mapping. However, these approaches share three critical limitations that restrict their practical utility. First, they operate as black-box models, establishing correlations between raw electromagnetic parameters and absorption metrics without revealing the underlying physical mechanisms—leaving designers without actionable insight into why a configuration performs well or poorly [5]. Second, most models are trained on composition-specific datasets (e.g., a single filler type or fabrication route), limiting generalizability across heterogeneous material systems. Third, and most critically, none of these frameworks have been deployed in an electronic system context where the end objective is RCS reduction, requiring explicit linkage between material-level reflection metrics and system-level scattering suppression. These gaps motivate the need for a physics-informed, interpretable, and generalizable design framework.
What the field urgently needs is a physics-informed, interpretable, and generalizable machine learning framework—one capable of integrating heterogeneous datasets, extracting universal design rules, and providing actionable predictions for absorber optimization [6,7,8]. Three specific capability gaps remain unaddressed in the literature: (i) no existing framework encodes impedance matching and intrinsic attenuation as primary ML features, despite their central roles in absorption physics; (ii) SHAP-based interpretability has not been applied to extract quantitative, system-agnostic design rules for electromagnetic absorbers; and (iii) ML-driven inverse design targeting specific RCS reduction performance in electronic platforms has not been experimentally validated with sub-5% accuracy. The present work directly addresses all three gaps.
In this work, we address these challenges by developing a unified, physics-informed machine learning (ML) platform that consolidates both experimental and literature data into a coherent modeling space for predicting and designing MXene-based microwave absorbers. Our framework bridges physics and data science through engineered descriptors that encode impedance matching, attenuation behavior, dielectric–magnetic synergy, and morphology-dependent interfacial characteristics. By embedding physical principles directly into the feature space, the ML model learns not only “what” correlates with absorption performance, but also “why”.
Using a curated dataset of 320 samples, we benchmark multiple ensemble-learning methods and identify XGBoost as the most robust predictor of minimum reflection loss (RLₘᵢₙ), effective absorption bandwidth (EAB), and optimal matching thickness. More importantly, SHapley Additive exPlanations (SHAP) interpretability reveals universal laws governing MXene absorber performance, illuminating the central roles of impedance matching and intrinsic attenuation across diverse composite systems [9,10].
Building upon the predictive model, we construct parameter–performance design maps that chart the performance landscape of MXene absorbers, offering intuitive guidance for navigating the multidimensional design space. Finally, we demonstrate inverse design capability, predicting optimal absorber configurations for target frequency bands with <5% deviation from experimental results [11,12,13]—transforming what was once a labor-intensive experimental search into a rapid, data-driven process.
Overall, this work delivers a generalizable and interpretable ML paradigm for MXene absorber research, shifting the field from isolated empirical studies toward a unified, data-guided design philosophy.
The proposed framework is not specific to any single composite system. The physics-informed descriptors employed here—impedance matching index, attenuation constant, and loss tangents—are derived from Maxwell’s equations and transmission-line theory, and are therefore applicable to any single-layer absorber system regardless of composition. While the current model was trained and validated exclusively on MXene-based composites, the feature engineering methodology is theoretically extensible to ferrite-based absorbers, polymer nanocomposites, and future MXene derivatives, paving the way for physics-informed AI-driven electronic-system-oriented electromagnetic (EM) design [14,15,16]. It should be noted, however, that such extension has not been experimentally validated in the present work and would require retraining or transfer learning on dedicated datasets for each target material family.
The novelty of the present work is threefold and distinct from the existing literature. First, while previous studies on ML-assisted absorber design have predominantly used raw dielectric/magnetic parameters as model inputs, this work constructs physics-informed descriptors—including impedance matching index, frequency-averaged attenuation constant, and a morphology-encoded interfacial density factor—that directly embed electromagnetic physics into the ML feature space, enabling the model to learn why certain configurations perform well rather than merely fitting empirical correlations. Second, unlike prior interpretability-free or post hoc visualization approaches, SHAP analysis is applied here to derive universal, quantitative design rules (e.g., ΔZ < 0.2, α = 35–55 dB/cm) that transcend any specific material system and are validated across 320 heterogeneous samples spanning dielectric-dominant, magnetic-dominant, and multi-phase MXene composites. Third, the framework is explicitly oriented toward electronic-system-level RCS reduction—not isolated material optimization—and the inverse design outputs are experimentally validated across two frequency bands (X-band and Ku-band) with prediction deviations consistently below 5%, a level of accuracy not previously demonstrated in the ML-assisted absorber design literature.
The main contributions of this work are summarized as follows:
Unlike prior ML models for absorber design that treat electromagnetic parameters as raw input features without physical grounding, an electronic-system-oriented machine learning framework is proposed here with physics-informed descriptors explicitly derived from impedance matching theory and attenuation physics, targeting RCS reduction in electronic platforms.
In contrast to black-box ensemble or neural-network models that offer no mechanistic insight, physics-informed and interpretable electromagnetic descriptors related to impedance matching and attenuation are embedded into the learning process, enabling transparent and quantitative understanding of parameter–performance relationships relevant to electronic system integration.
Application-relevant design guidelines and an inverse parameter synthesis strategy are established based on explainable learning outcomes, allowing rapid and predictable absorber parameter design for RCS-related performance targets.
Experimental validation of the machine-learning-assisted design results demonstrates reflection-related performance deviations below 5%, confirming the reliability and practical applicability of the proposed approach for electronic system electromagnetic optimization.
The remainder of the paper is organized as follows. Section 2 introduces the construction of a physically consistent electromagnetic dataset and physics-informed descriptors for scattering suppression. Section 3 presents an interpretable ensemble-learning framework linking absorber parameters to reflection-related electromagnetic performance. Section 4 develops parameter–performance design maps for application-oriented absorber configuration, and Section 5 proposes a machine-learning-driven inverse design strategy targeting radar cross-section reduction. Section 6 concludes the paper.
2. Dataset Construction and Feature Engineering
Designing a generalizable machine learning model for MXene-based microwave absorbers requires a dataset that is not only sufficiently large but also consistent, physically meaningful, and comparable across different material systems. However, reported MXene absorber data vary widely in composition, morphology, filler loading, measurement conditions, and frequency ranges, leading to incompatible parameter–performance relationships. To overcome this barrier, we establish a unified dataset that consolidates heterogeneous experimental and literature data into a standardized modeling space, enabled by physics-informed feature engineering that embeds electromagnetic mechanisms directly into the ML descriptors.
2.1. Data Collection and Standardization
The unified dataset consists of 320 samples, including 245 experimentally measured MXene-based composites synthesized and characterized in our laboratory, covering diverse magnetic hybrids, filler loadings, and thickness ranges [1,2], and 75 curated samples extracted from the peer-reviewed literature, selected based on strict comparability criteria. These samples span a broad design space across dielectric-dominated systems (e.g., Ti3C2Tx/MXene–polymer composites) [17], magnetic-dominant hybrids (e.g., MXene/Fe3O4, MXene/Co3O4, MXene/ferrites) [15,18], and multi-phase composites with layered, particulate, or hierarchical morphologies [2,18,19]. This breadth enables the ML framework to identify universal structure–property trends, rather than correlations restricted to isolated systems.
To ensure measurement reproducibility and cross-sample comparability for the 245 in-house experimental samples, a standardized characterization platform was employed throughout data collection. As illustrated in Figure 1, the measurement system consists of a Keysight vector network analyzer (VNA, 2–18 GHz) connected to a coaxial transmission-line fixture holding the toroidal MXene composite sample (outer diameter: 7 mm, inner diameter: 3 mm). Scattering parameters (S11, S21) were acquired via GPIB/USB interface and transferred to a computer, where the Nicolson–Ross–Weir (NRW) algorithm was applied to extract complex permittivity and complex permeability, from which reflection loss and related absorption metrics were subsequently computed. This setup served as the physical reference standard against which the comparability criteria for literature-sourced samples (detailed below) were defined.
Figure 1.
Experimental apparatus for electromagnetic absorber characterization, comprising a Keysight VNA (2–18 GHz)is manufactured by Keysight Technologies, based in Santa Rosa, CA, USA, a coaxial transmission-line fixture with toroidal MXene composite sample (outer diameter: 7 mm, inner diameter: 3 mm), a GPIB/USB data interface, and a computer running the NRW extraction algorithm to retrieve ε′, ε″, μ′, μ″, and reflection loss.
To ensure physics-level comparability across heterogeneous data sources, literature samples were included only if all of the following conditions were met: (1) Reflection loss (RL) measured in the 2–18 GHz band using a calibrated vector network analyzer (Agilent E8363B or equivalent is manufactured by Keysight Technologies, based in Santa Rosa, CA, USA) and paraffin-based composite toroidal samples [3,20]. For experimental data collected in our laboratory, measurements were performed using an Agilent E8363B VNA with a specified frequency accuracy of ±0.001% and a dynamic range exceeding 100 dB. The system was calibrated using a standard SOLT (Short-Open-Load-Thru) procedure prior to each measurement session, yielding a reflection coefficient measurement uncertainty of ±0.15 dB (coverage factor k = 2, 95% confidence level). Toroidal sample dimensions were verified using a digital caliper with a resolution of 0.01 mm and thickness measurement uncertainty of ±0.02 mm. For literature-sourced data, inclusion required that the original study explicitly reported instrument model, calibration procedure, and sample dimensional tolerances; studies reporting only nominal values without uncertainty estimates were excluded. (2) Complex permittivity (ε′, ε″) and permeability (μ′, μ″) explicitly reported or extractable via Nicolson–Ross–Weir (NRW) method, with parameter extraction uncertainty estimated at ±3% for ε′ and μ′, and ±5% for ε″ and μ″ across the 2–18 GHz band based on propagated dimensional and S-parameter uncertainties. (3) Absorber thickness clearly documented and used directly in RL computation. (4) No metallic backplanes or metamaterial patterns, ensuring the absorber operates under the classical transmission-line model. (5) Single-layer structures only, avoiding multi-layer effects that would introduce non-comparable mechanisms [20]. This screening ensures that RL_min, EAB, impedance, and attenuation behaviors follow consistent physical assumptions.
Because different studies report RL and electromagnetic (EM) parameters over different frequency resolutions, we unify all samples using interpolation to a common 201-point frequency grid (2–18 GHz) and frequency-averaged material parameters (ε′_avg, ε″_avg, μ′_avg, μ″_avg) to capture global dielectric/magnetic behavior, with consistent definitions of RL_min and EAB (RL ≤ –10 dB). This harmonization step ensures compatibility without distorting underlying physical characteristics.
To provide context for the experimental data included in the unified dataset, Table 1 summarizes the precursor compositions, reaction equations, and dimensional outcomes of the synthesized magnetic MXene-based nanostructures. This diversity in material systems allows for a comprehensive analysis of the interplay between MXene structure, morphology, and electromagnetic absorption properties.
Table 1.
Summary of precursor compositions, reaction equations, and dimensional outcomes for the synthesized magnetic MXene-based nanostructures.
2.2. Physics-Informed Feature Engineering
Machine learning models trained only on raw electromagnetic parameters often fail to generalize, because such parameters do not explicitly encode the physical mechanisms that govern microwave absorption. To bridge this gap, we construct physics-informed descriptors that translate Maxwell’s equations and absorber theory into ML-compatible numerical features. These descriptors enable the model to learn physically meaningful nonlinear relationships and provide interpretable insights into absorber performance.
Based on the classical transmission-line model of single-layer absorbers, we define a frequency-averaged impedance matching index:
where
is the input impedance derived from transmission-line theory [20], and () is the free-space impedance. The frequency-averaged formulation is adopted in this work to obtain a scalar descriptor compatible with the machine learning feature space. Lower values indicate better energy coupling, allowing for more efficient electromagnetic wave penetration [20,21].
The attenuation constant, derived from Maxwell’s equations for plane-wave propagation in a lossy medium [3], is expressed as follows:
This expression is a standard result in electromagnetic wave theory [3,19]. In this work, frequency-averaged attenuation and peak attenuation are introduced as scalar ML features to encode the bulk energy dissipation capacity of the absorber across the measurement band.
Higher values of typically correspond to better absorption of electromagnetic waves. Instead of using and directly, the dielectric and magnetic loss tangents are employed, following their standard definitions in electromagnetic materials characterization [3,21]:
These ratios represent the efficiency of energy dissipation via dielectric and magnetic mechanisms, respectively, and serve as physically normalized descriptors that are independent of absolute permittivity or permeability magnitude.
To incorporate structural influences without explicitly modeling geometry, we design a morphology-encoded descriptor:
This descriptor approximates interfacial density, defect density, and conductive pathways, which dramatically influence polarization relaxation and conduction loss [2,16,19]. Thickness directly determines resonance position via the quarter-wavelength principle. Normalized thickness and effective electrical length are introduced based on the quarter-wavelength resonance principle [20]:
This formulation follows directly from the phase condition for destructive interference of reflected waves in a backed absorber layer [20], and is used here as a physics-grounded scalar feature embedding geometric-phase resonance into the ML model.
The final feature set includes 15–20 physical constraint features: (1) Frequency-averaged dielectric parameters (, , , ); (2) loss tangents (, ); (3) attenuation constants (, ); (4) impedance matching index (); (5) morphology descriptor (); (6) thickness features (, ); (7) filler ratio/metal loading; (8) frequency band indicators. This comprehensive set combines electromagnetic behavior and material structure, ensuring the model captures complex interactions governing microwave absorption performance.
2.3. Data Preprocessing
To ensure numerical stability and prevent dominance of high-magnitude features, we apply Min–Max scaling for all continuous descriptors and use the engineered scalar morphology descriptor instead of categorical encoding. Unlike categorical encoding, which treats structural variations as discrete categories (e.g., “0D”, “1D”, “2D”), the morphology descriptor captures the physical density of interfaces, defect distributions, and conductive pathways in a continuous manner, providing a richer representation that allows the model to leverage structure–property relationships governing absorption performance. Feature decorrelation checks are performed to avoid redundant descriptors.
Importantly, we avoid principal component analysis (PCA) for dimensionality reduction. PCA would compress important electromagnetic parameters (such as impedance matching and attenuation constants) into abstract principal components, potentially losing their direct connection to physical phenomena. By retaining the original physical features, we preserve the model’s interpretability and alignment with real-world materials science [6,7,8]. These preprocessing steps ensure balanced contribution of physical features during model optimization, enabling the ensemble-learning framework to extract universal parameter–performance relationships across diverse MXene-based composites [22].
3. Interpretable Machine Learning Framework
3.1. Model Selection
Figure 2 shows the flow from data collection, feature engineering, model training, prediction generation, and parameter–performance design maps. The ensemble-learning model processes both L experimental and literature data to predict and design optimal MXene-based microwave absorbers.
Figure 2.
Schematic illustration of the physics-informed and interpretable machine learning framework for electromagnetic absorber parameter design targeting scattering suppression in electronic systems.
Microwave absorption in MXene-based composites arises from nonlinear and hierarchical physical processes, involving impedance matching, intrinsic attenuation, and dielectric–magnetic coupling. To model such behavior under a moderate data regime, we adopt tree-based ensemble-learning models, including Random Forest (RF), Gradient Boosting Decision Trees (GBDTs), LightGBM, and XGBoost, rather than deep neural networks.
where represents the microwave absorption performance, are the learned weights of features, and are the input features such as impedance matching, attenuation, and loss tangents. This equation represents an additive ensemble model that combines multiple trees to predict the absorption performance.
Deep learning architectures (ANNs or CNNs) are not well suited for the present task for three reasons. First, the available dataset is limited in size and heterogeneous in feature scale, conditions under which deep networks are prone to overfitting and unstable optimization. Second, absorber design demands physical interpretability rather than purely predictive performance; however, neural networks encode structure–property relations in high-dimensional latent spaces that are difficult to rationalize. Third, the input features are physics-informed scalar descriptors rather than spatial fields, providing no intrinsic advantage for convolutional architectures [23].
Tree-based ensemble models offer a favorable balance between accuracy, robustness, and interpretability. These models naturally capture nonlinear feature interactions and provide built-in regularization through bagging or boosting. The target relationship between descriptors and absorption performance can be expressed as an additive ensemble:
where each represents a regression tree in the ensemble and is the number of trees in the ensemble.
In boosting-based models, the optimization follows a regularized objective:
where is the loss function, is the true absorption value, is the predicted value, are the tree weights, and is the regularization parameter.
The optimization process for boosting-based models can be expressed by
where represents the regularization term that prevents overfitting by penalizing overly complex models, and is a regularization hyperparameter.
Beyond statistical considerations, model selection is guided by the hierarchical nature of microwave absorption physics. Effective absorption requires impedance matching as a prerequisite for wave entry, followed by sufficient intrinsic attenuation for energy dissipation, with dielectric–magnetic synergy and thickness effects acting as secondary modifiers. Such conditional dependencies are naturally encoded by decision-tree structures, in which early splits impose physical constraints and subsequent branches refine performance predictions. In contrast, neural networks tend to blend all descriptors simultaneously, obscuring this physical ordering [24].
To further improve interpretability and regularization in the ensemble model, we use a weighted loss function that incorporates feature importance. The feature importance for each descriptor can be computed as follows:
where is the change in the model’s loss after removing the feature , and is the change in the prediction.
Multiple ensemble algorithms are benchmarked under identical training and validation protocols. Among them, XGBoost exhibits the best overall performance, benefiting from second-order gradient optimization and explicit regularization. Accordingly, XGBoost is selected as the primary model for subsequent prediction, interpretability analysis, and inverse design.
We use the following update rule for the weight adjustment during gradient boosting:
where is the weight of the -th tree at iteration , is the learning rate, and is the gradient of the loss function with respect to the weight.
3.2. Model Training and Validation
Figure 3 outlines the inverse design process, where target performance metrics (e.g., RLmin, EAB) are used to guide the search for optimal material configurations. The flowchart shows how the machine learning framework explores the design space while adhering to physical constraints to predict optimal absorber structures.
Figure 3.
Construction of a physically consistent electromagnetic absorber dataset and extraction of physics-informed descriptors related to impedance matching and attenuation behavior.
To ensure robust and reproducible learning, all ensemble models were trained using a physically consistent and statistically rigorous validation protocol. The unified dataset was randomly divided into 80% training and 20% testing sets, with stratification applied to the distribution of the absorption performance to avoid performance bias toward moderate absorbers. This strategy ensures that high-performance and low-performance samples are proportionally represented during training and evaluation. The Data Split Formula is
where and are the number of training samples and the total dataset size, respectively. This formula ensures the dataset is divided into 80% for training and 20% for testing.
Model robustness was further assessed using five-fold cross-validation on the training set. Within each fold, all preprocessing steps—including feature normalization and encoding—were performed independently to prevent data leakage. Hyperparameters were optimized using Bayesian optimization, targeting minimization of the mean absolute error (MAE), which provides a physically intuitive measure of prediction deviation in decibels.
where is the number of samples.
We also introduce a regularization term to control model complexity and prevent overfitting. The L2 regularization term is commonly used in ensemble-learning models to penalize large weights.
where represents the model’s weights, and is the number of features in the model.
The learning objective of the ensemble framework can be expressed as
where is the objective function for model optimization. The first term represents the data fitting error, and the second term represents regularization that penalizes large weights to prevent overfitting.
Hyperparameters such as the number of trees m, learning rate , and maximum tree depth d were optimized to minimize the objective function. The optimization process can be represented by the following formula:
where denotes the optimal hyperparameter set, and represents the objective function that we seek to minimize by adjusting the hyperparameters.
The optimization of hyperparameters is often performed using gradient-based methods.
where is the gradient of the objective function with respect to the hyperparameters, and the partial derivatives represent the sensitivity of the loss function to changes in each hyperparameter.
To assess the cross-validation performance, we introduce the k-fold cross-validation error function:
where is the number of folds, and is the loss for the -th fold.
Model performance was evaluated using coefficient of determination (), mean absolute error (MAE), and root mean square error (RMSE). These complementary metrics quantify overall predictive accuracy, average deviation, and sensitivity to large errors, respectively. Importantly, evaluation was conducted exclusively on the held-out test set, ensuring an unbiased assessment of generalization capability [25].
where is the mean of the observed values . It is used to assess how well the model’s predictions match the actual data.
Finally, the importance score of the feature selection method is
3.3. Prediction of Key Metrics
The predictive performance of the ensemble-learning framework was evaluated on a held-out test set using multiple quantitative metrics. Among all benchmarked models, XGBoost consistently outperformed RF, GBDT, and LightGBM, achieving high accuracy for all target variables, including minimum reflection loss (), effective absorption bandwidth (EAB), and optimal matching thickness.
For prediction, XGBoost achieved an R2 exceeding 0.94 with a mean absolute error (MAE) below 1.2 dB, indicating excellent agreement between predicted and experimental values across the full performance range. Predictions of EAB and optimal thickness exhibited similarly strong correlations, confirming the generalizability of the model beyond a single performance metric.
To visually assess the model’s predictive accuracy, Figure 4, Figure 5 and Figure 6 present the parity plots for , EAB, and optimal matching thickness. These plots show the predicted values on the y-axis against the experimental values on the x-axis. The ideal prediction lies along the diagonal line (). The values range from −60 dB to 0 dB, and the plot indicates that the predicted values closely follow the experimental data as shown in Figure 4, especially in the high-performance regime where the is below −40 dB. The EAB values, ranging from 0 to 10 GHz, show a similar alignment with experimental values, demonstrate the model’s ability to predict effective bandwidth with high accuracy as shown in Figure 5. For optimal matching thickness, the data points are concentrated within the range of 1 mm to 6 mm, with the predicted values aligning well with experimental observations as shown in Figure 6.
Figure 4.
Prediction performance of the interpretable ensemble-learning model for reflection-related electromagnetic performance indicators across the frequency band.
Figure 5.
Interpretable analysis of key absorber parameters governing electromagnetic scattering suppression, based on explainable learning outcomes.
Figure 6.
Parameter–performance design maps illustrating the influence of absorber configuration on reflection-related electromagnetic performance relevant to radar cross-section reduction.
In addition to the parity plots, the error distribution for the model predictions is presented in Figure 7. This histogram illustrates the spread of prediction errors for , EAB, and optimal matching thickness. The x-axis represents the error (the difference between predicted and experimental values), and the y-axis shows the frequency of each error. The error distribution is narrow and symmetrically centered around zero, indicating that the model does not exhibit systematic bias and that the errors are evenly distributed. This confirms the model’s reliability in terms of making consistent and unbiased predictions across the test set [26].
Figure 7.
Prediction error distributions for reflection-related electromagnetic performance metrics, demonstrating unbiased and stable model behavior.
Error distributions further reveal that prediction deviations are symmetrically distributed around zero and remain narrowly bounded, indicating the absence of systematic bias. This behavior confirms that the physics-informed descriptors effectively constrain the learning process, preventing physically unrealistic extrapolation.
Collectively, these results establish that the ensemble-learning framework achieves high predictive accuracy, robust generalization, and consistent performance across different absorption regimes, providing a reliable foundation for subsequent interpretability analysis and inverse design.
3.4. SHAP-Based Interpretability
To elucidate the physical mechanisms captured by the ensemble-learning model, SHapley Additive exPlanations (SHAP) were employed to quantify the contribution of individual descriptors to model predictions. This analysis enables both global assessment of feature importance and local interpretation of individual absorber designs. SHAP provides a game-theoretic approach to explain the output of any machine learning model by computing the contribution of each feature to a specific prediction [27].
The global SHAP feature importance indicates the average contribution of each feature across all predictions. The importance of a feature can be quantified using the SHAP value , which represents the change in the model output when feature is included in the model compared to when it is excluded. Following the unified framework proposed by Lundberg and Lee, this is mathematically expressed as
where ( S ) is the set of features used in the model, excluding , is the model output using the feature set , is the model output with feature added to the set , and denotes the expectation over all possible subsets of features that exclude .
SHAP dependence plots provide a visualization of how the contribution of each feature varies as the feature values change. For a given feature , the SHAP dependence plot shows how changes with the value of across all samples. The relationship between the SHAP values and the feature values can be expressed as
where is a smooth function that describes how the SHAP value changes with the value of feature and represents random noise or other model-specific effects.
To capture the hierarchical structure of feature contributions, SHAP values can also be aggregated across feature groups. For example, features related to impedance matching, attenuation, and loss tangents can be grouped into categories, and the combined contribution of all features within a category can be calculated. The total contribution of a feature group is
Based on the global SHAP values, we can rank the features according to their importance in predicting microwave absorption performance. This ranking is critical for identifying which features (such as impedance matching or attenuation) dominate the model’s decision-making process. The global SHAP importance for each feature can be ranked as follows:
where represents the ranking of feature .
The SHAP-based interpretability analysis confirms that the ensemble-learning model captures key physical mechanisms that govern the absorption behavior of MXene-based composites. Impedance matching and intrinsic attenuation were found to be the most influential features, consistent with classical absorption theory. Furthermore, local SHAP explanations reveal how these features interact in individual samples, providing valuable insights for the design and optimization of new materials. The hierarchical feature contributions and feature ranking further enhance our understanding of the complex interplay between physical properties and absorption performance, guiding future research and material development.
4. Interpretability Analysis and Design Rules
While accurate prediction is fundamental, the true scientific value of a machine learning framework lies in its capacity to extract actionable physical knowledge from data-driven correlations. To transform the trained XGBoost model from a black-box predictor into an interpretable knowledge engine, we employ SHAP (SHapley Additive exPlanations) analysis to systematically quantify feature contributions, reveal underlying physical mechanisms, and formulate universal design rules. This chapter bridges statistical learning and electromagnetic physics, demonstrating how ML interpretability can accelerate rational absorber design beyond empirical trial-and-error [28].
4.1. SHAP-Based Interpretability Analysis
SHAP (SHapley Additive exPlanations) provides a game-theoretic approach, originally proposed by Lundberg and Lee [29], to elucidate the physical mechanisms captured by the ensemble-learning model, quantifying the contribution of individual features to the model’s predictions. The SHAP value for feature represents the change in model output when feature is included compared to when it is excluded, and is mathematically expressed as
where is the set of features excluding , is the model output with the set , and represents the expectation over all possible subsets excluding . This ensures that the SHAP values fairly distribute the model’s prediction among all features, so their sum equals the difference between the model prediction and the baseline prediction [29].
The global SHAP analysis reveals the hierarchical contribution of features to absorption performance. The impedance matching index is the dominant feature, contributing 28–32%, validating fundamental electromagnetic theory that surface reflection caused by impedance mismatch is the primary barrier in absorber design. The attenuation constant follows with 22–26%, representing intrinsic energy dissipation once waves penetrate the material. These two features together account for over half of the absorption performance, confirming their importance in achieving strong microwave absorption. Secondary features such as dielectric loss tangent and magnetic loss tangent contribute 14–18% and 12–16% respectively, capturing polarization and resonance losses critical in MXene-based composites. Thickness and morphology contribute to a lesser extent at 8–12% and 6–10%, acting as modulating factors rather than primary determinants. This hierarchy confirms that while geometric and structural parameters influence performance, they cannot compensate for poor electromagnetic matching or insufficient intrinsic losses.
SHAP dependence plots reveal critical nonlinear effects, such as the negative exponential relationship between impedance matching and absorption performance. When the impedance mismatch is less than 0.15, SHAP values remain stable, but as it increases from 0.15 to 0.30, contributions sharply decrease, with each 0.05 increment corresponding to a 10–15 dB loss in reflection performance. Beyond 0.30, SHAP values saturate, indicating a performance ceiling regardless of other optimizations. The attenuation constant also exhibits a logarithmic saturation pattern, with SHAP values increasing steeply below 30 dB/cm but plateauing beyond 60 dB/cm, suggesting minimal additional benefit from increased attenuation. This saturation reflects the trade-off between penetration depth and bandwidth, where excessive attenuation concentrates absorption near the surface, narrowing bandwidth. Loss tangents exhibit optimal windows, with both dielectric and magnetic loss tangents showing maximum SHAP contributions in the range of 0.15 to 0.4. Thickness shows oscillatory SHAP patterns corresponding to quarter-wavelength resonance conditions, confirming its role as a frequency-selective parameter [29].
SHAP interaction analysis reveals how performance emerges from the synergy between electromagnetic parameters. The strongest interaction occurs between impedance matching and attenuation, where both low impedance mismatch and sufficient attenuation lead to synergistic effects, improving absorption. Conversely, high attenuation with poor impedance matching wastes dissipation potential, as waves cannot penetrate the material surface. Morphology interacts with attenuation in a conditional manner, amplifying performance when attenuation is in the optimal range but offering minimal benefit when attenuation exceeds 60 dB/cm. This SHAP-based interpretability analysis confirms that the ensemble model captures the key physical mechanisms in MXene-based absorbers, revealing critical thresholds for impedance mismatch below 0.2, optimal attenuation of 35–55 dB/cm, and balanced loss tangents between 0.15 and 0.4. These insights provide the foundation for universal design rules and a systematic optimization framework for MXene absorber design.
4.2. Physical Mechanism Interpretation
The SHAP analysis reveals that impedance matching, contributing 28–32% of the model’s importance, is the primary factor controlling wave entry, with the reflection loss governed by the impedance mismatch equation . A threshold minimizes reflection, ensuring the reflection loss does not exceed −40 dB. The exponential penalty for higher mismatches aligns with the model’s predicted relationship , which quantifies how rapidly performance degrades as impedance mismatch increases. This relationship captures the fundamental physics of wave reflection at material interfaces, where even small deviations from matched impedance lead to significant energy loss through surface reflection rather than absorption.
Intrinsic attenuation, contributing 22–26% to SHAP importance, governs energy dissipation through the exponential decay law , with the optimal attenuation range of 35–55 dB/cm enabling broadband absorption. The relationship between SHAP contributions and attenuation is given by , revealing a logarithmic saturation effect where excessive attenuation provides diminishing returns. Dielectric and magnetic loss tangents exhibit optimal operating windows between 0.15 and 0.4, and their interaction enhances bandwidth according to the following formula: . This expression demonstrates that broadband absorption requires not only sufficient individual losses but also a balanced ratio between dielectric and magnetic contributions to maintain stable impedance across frequencies.
Morphology amplifies performance when impedance matching and attenuation are already optimized, with the relationship showing up to 1.8× bandwidth enhancement for hierarchical structures with high interfacial density. Thickness optimization follows quarter-wavelength resonance theory, expressed as , and is inherently frequency-selective. The SHAP analysis confirms that optimal thickness depends on both material properties and target frequency, contributing 8–12% to overall performance. These quantitative relationships transform SHAP correlations into predictive physical models, enabling inverse design where target performance specifications can be reverse-engineered into specific material parameters.
4.3. Universal Design Rules
By synthesizing insights from SHAP-based interpretability analysis and physical mechanism interpretation, we extract five universal design rules with quantifiable criteria that translate machine learning correlations into actionable engineering guidelines. These rules, visualized in Figure 8 and systematically detailed in Table 2, establish a hierarchical framework for rational absorber design, moving beyond qualitative heuristics such as “good impedance matching and high loss” toward measurable performance targets and systematic optimization strategies.
Figure 8.
Experimental validation of the machine-learning-assisted absorber parameter design, demonstrating agreement between predicted and measured reflection-related electromagnetic performance.
Table 2.
Universal design rules for MXene-based microwave absorbers.
The first rule establishes impedance matching as the necessary condition for achieving strong microwave absorption. To reach the critical reflection loss threshold of dB, the impedance mismatch index must satisfy . This condition ensures that electromagnetic waves can penetrate the absorber surface rather than being reflected, as governed by the reflection coefficient , where . Materials with excessively high permittivity or low permeability often fail to achieve the required impedance matching, necessitating multi-layer designs or gradient structures to progressively match impedance from air to the absorber core.
The second rule defines intrinsic attenuation as the sufficient condition for effective energy dissipation. Once impedance matching is satisfied, achieving dB/cm with an optimal range of 35–55 dB/cm ensures adequate penetration depth and absorption bandwidth. Excessive attenuation beyond 60 dB/cm narrows the effective absorption bandwidth and reduces overall performance due to surface-concentrated absorption. The relationship captures this saturation effect, where excessive values lead to diminishing returns. This rule emphasizes that attenuation should be optimized rather than maximized, balancing penetration depth with dissipation efficiency.
The third rule emphasizes loss synergy as essential for achieving broadband absorption. To reach effective absorption bandwidth GHz, dielectric and magnetic loss tangents must satisfy or , with a balanced ratio between 0.5 and 2.0. This balance ensures stable impedance matching and prevents resonance narrowing that would otherwise limit bandwidth. For MXene-based composites, achieving dielectric loss tangent of 0.2–0.4 typically requires complex permittivity , while magnetic loss tangent of 0.15–0.35 necessitates 20–40 wt% magnetic filler loading. The synergistic interaction between dielectric and magnetic losses enables frequency-insensitive absorption across broad bands.
The fourth rule focuses on frequency-specific thickness optimization based on quarter-wavelength resonance conditions. Thickness optimization follows the quarter-wavelength resonance condition established in classical absorber theory [20], adapted here with a ±15% tolerance window identified from SHAP interaction analysis. The optimal thickness is given by where and represent the effective permittivity and permeability of the composite, respectively. The ±15% tolerance range—not present in the classical formulation—is an empirical finding of this work, derived from the SHAP thickness dependence plots showing that resonance conditions remain effective within this geometric deviation. This relationship yields frequency-dependent thickness requirements: Ku-band absorbers require 1.8–2.5 mm, X-band absorbers need 2.3–3.2 mm, and C-band designs demand 3.5–5.0 mm. The rule implies that single-thickness absorbers cannot effectively cover multiple frequency bands simultaneously, and achieving true broadband performance requires gradient thickness profiles or multi-layer configurations with distinct resonance frequencies.
The fifth rule defines morphology as an amplification factor rather than a fundamental determinant of performance. Hierarchical structures can enhance absorption bandwidth by 1.3–1.8 times, but only when impedance matching and attenuation are already optimized. The effectiveness of morphology depends on interfacial density exceeding 0.5 and baseline reflection loss better than −30 dB. Morphology should be the final optimization step, as its impact is conditional on prior electromagnetic adjustments. This explains why morphology contributes only 6–10% to SHAP importance despite its substantial effect on performance when properly applied—it modulates rather than creates absorption capability.
The five rules establish a systematic optimization hierarchy for absorber design, starting with impedance matching as the entry criterion, followed by intrinsic attenuation for energy dissipation, loss synergy balancing for broadband performance, thickness optimization for resonance tuning, and morphology engineering as the final amplification step. This approach enables predictive design, where target performance metrics are reverse-engineered into specific material parameters, reducing trial-and-error iterations from the typical 15–20 experiments to 3–5 validation tests. For example, designing a Ku-band absorber with dB and GHz directly yields the following specifications: , , , mm, and . These values are derived from the universal design rules, eliminating empirical guesswork and accelerating materials development. Because these rules are based on physics-informed features like impedance matching and attenuation constant rather than composition-specific parameters, they are broadly applicable to various electromagnetic absorber systems including 2D materials, carbon nanotubes, ferrites, and metamaterials, offering the first systematic machine learning framework for electromagnetic layer design.
4.4. Design Methodology Framework
The design methodology framework integrates universal design rules derived from machine learning analysis into a systematic workflow for MXene-based microwave absorber development. It outlines a hierarchical optimization process that sequentially addresses impedance matching, attenuation optimization, frequency-specific thickness tuning, and morphology engineering, ensuring that each step builds on the previous one to prevent inefficiency and guarantee optimal absorber performance. This structured approach transforms absorber design from an intuitive trial-and-error process into a systematic engineering methodology, significantly reducing development time and cost while improving the probability of success.
The first step prioritizes impedance matching, requiring as the entry criterion for achieving strong microwave absorption with dB. This condition is critical for wave penetration, as materials failing to satisfy it—particularly those with excessively high permittivity exceeding 20—experience dominant surface reflection that cannot be overcome by subsequent optimization. Such materials must either be discarded or redesigned with gradient impedance structures that progressively match impedance from air to the absorber core. Once impedance matching is achieved, the second step optimizes intrinsic attenuation by targeting dB/cm, a range that balances penetration depth and bandwidth. Excessive attenuation beyond 60 dB/cm concentrates absorption near the surface, reducing effective bandwidth by 20–30%, while insufficient attenuation below 30 dB/cm fails to dissipate electromagnetic energy adequately. This step also considers dielectric and magnetic loss tangents, ensuring their ratio remains balanced between 0.5 and 2.0 to maintain stable impedance matching across frequencies and prevent resonance narrowing.
The third step optimizes thickness to achieve resonance at target frequencies using the quarter-wavelength formula , where thickness varies with frequency. This ensures that each absorber is designed for its specific frequency range, with Ku-band absorbers requiring 1.8–2.5 mm, X-band designs needing 2.3–3.2 mm, and C-band configurations demanding 3.5–5.0 mm. For broadband applications covering multiple frequency bands, single-thickness designs are insufficient, necessitating multi-layer or gradient thickness profiles that create multiple overlapping resonances. The final step applies morphology optimization to enhance bandwidth and absorption depth through hierarchical structures, but only after satisfying the electromagnetic requirements in the previous steps. Hierarchical architectures with interfacial density exceeding 0.5 can provide up to 1.8× bandwidth enhancement, but this amplification effect is conditional on already having optimized impedance matching and attenuation. Attempting morphology optimization prematurely, when fundamental electromagnetic properties are sub-optimal, yields minimal performance gains.
The framework incorporates design space navigation principles that identify feasible parameter combinations while explicitly marking forbidden zones. High permittivity regions with typically fall into forbidden zones due to impedance mismatch, as do excessive attenuation regions with dB/cm that sacrifice bandwidth for marginal absorption improvements. Pareto front identification helps designers balance competing objectives such as absorption depth and bandwidth, guiding rational design decisions based on application priorities. For example, radar stealth applications may prioritize maximum absorption depth and tolerate narrower bandwidth, while electromagnetic compatibility applications require broad bandwidth even at the cost of slightly reduced peak absorption. Multi-objective design guidelines account for these trade-offs, offering a systematic approach to achieving the best design for specific application needs and enabling rapid computational screening that reduces trial-and-error iterations from the typical 15–20 experiments in conventional development to 3–5 validation experiments in the ML-guided framework.
5. Design Space Visualization and Experimental Validation
The universal design rules extracted in Chapter 4 provide a hierarchical framework for rational absorber optimization, but practical implementation requires two complementary tools. First, structure–property design maps (Section 5.1) offer visual navigation of the multidimensional parameter space, translating abstract rules into actionable guidance for parameter selection. Second, the ML-driven inverse design framework (Section 5.2) automates the search process, enabling rapid identification of optimal configurations from performance targets. These tools are validated through two experimental case studies (Section 5.3) spanning X-band narrowband and Ku-band broadband absorption, demonstrating <5% prediction accuracy. Finally, Section 5.4 benchmarks the framework against traditional methods, quantifying efficiency improvements and discussing future directions.
5.1. Structure–Property Design Maps
Structure–property design maps serve as visualization and navigation tools for the complex parameter space governing MXene-based microwave absorption. These maps, generated by systematically querying the trained XGBoost model across continuous parameter ranges, transform abstract electromagnetic relationships into intuitive graphical representations that enable rapid identification of feasible design regions, performance trade-offs, and optimization pathways.
5.1.1. Thickness–Frequency–Performance Maps
Absorber thickness represents one of the most critical yet experimentally expensive design variables, simultaneously influencing impedance matching, resonance conditions, and effective absorption bandwidth. The thickness–frequency–performance map, generated by predicting reflection loss across a continuous domain spanning 1.0–5.0 mm thickness and 2–18 GHz frequency, provides designers with immediate visual reference for selecting optimal geometric configurations based on target frequency bands. Figure 9 presents this design map with three distinct performance regimes marked by contour lines and colored scatter points representing predicted absorption performance across the thickness–frequency space.
Figure 9.
Thickness–frequency–performance design map predicted by the trained XGBoost model, showing three distinct performance regimes and optimal thickness trajectories for different frequency bands.
The design map identifies three distinct performance regimes that guide thickness selection. The sub-optimal thin regime, where , exhibits poor absorption with dB due to insufficient electrical length and underutilized attenuation constant. This regime should be avoided unless strict thickness constraints are mandated by specific applications such as conformal coatings or ultra-lightweight structures. The optimal matching regime, characterized by , achieves dB by satisfying quarter-wavelength resonance conditions. The optimal thickness follows the relationship , where for typical MXene composites. This yields frequency-dependent thickness requirements: C-band absorbers operating at 4–8 GHz require 3.5–4.0 mm, X-band designs for 8–12 GHz need 2.5–3.0 mm, and Ku-band materials targeting 12–18 GHz demand 1.8–2.3 mm. The blue-shaded trajectory in Figure 2 traces this quarter-wavelength matching path across frequencies, demonstrating the inverse relationship between optimal thickness and operating frequency.
The over-thick regime, where , exhibits diminishing returns as increased thickness, degrades impedance matching and narrows absorption bandwidth. When thickness exceeds half the effective wavelength, multiple resonances emerge at harmonic frequencies, reducing the minimum reflection loss values and creating performance instability. The map visualizes this trade-off through the transition from deep blue regions representing strong absorption to lighter colors indicating degraded performance with excess thickness. Critical design constraints embedded in the map include the high permittivity penalty, where materials with suffer impedance mismatch exceeding and cannot achieve optimal performance regardless of thickness tuning. The attenuation–bandwidth trade-off is equally evident, as excessive attenuation beyond 60 dB/cm narrows the effective absorption bandwidth below 4 GHz by concentrating absorption in a thin surface layer rather than utilizing the full material thickness.
Designers can navigate the map by first identifying their target frequency range and then locating the corresponding optimal thickness from the quarter-wavelength trajectory. For single-frequency applications, the deepest blue region at the target frequency provides the optimal thickness choice, typically within the ranges specified above. For broadband applications requiring coverage across multiple frequency bands, single-thickness designs prove insufficient, necessitating gradient thickness profiles that vary continuously from surface to backing layer or multi-layer configurations with discrete thickness steps that create overlapping resonances. The map must be used in conjunction with the universal design rules from Chapter 4, as thickness optimization assumes that impedance matching satisfies and attenuation constant falls within the optimal range of 35–55 dB/cm. Attempting thickness optimization when these fundamental electromagnetic requirements are not satisfied yields marginal improvements, reinforcing that thickness tuning is the penultimate step in the hierarchical design framework, applied only after impedance matching and attenuation have been optimized.
5.1.2. Impedance–Attenuation Maps
To decouple the competing roles of wave entry and energy dissipation, the impedance–attenuation design map employs frequency-averaged impedance mismatch index and attenuation constant as orthogonal axes, transforming the two most influential design parameters into a two-dimensional performance landscape. This map serves as a diagnostic tool for evaluating whether fundamental electromagnetic properties fall within feasible performance regions and identifying which parameter requires priority attention when absorption targets are not met. Each point in Figure 10 represents a material configuration colored by achieved minimum reflection loss, enabling rapid assessment of current performance and visualization of optimization pathways toward high-performance zones.
Figure 10.
Impedance–attenuation design map visualizing the performance landscape, with the high-performance zone defined by (green dashed line) and dB/cm (blue dashed line). Points are colored by achieved values.
The map identifies three key regions, each with distinct optimization opportunities or failure modes. The high-attenuation-insufficient region, characterized by , demonstrates that even with high attenuation constants exceeding 70 dB/cm, absorption remains moderate at approximately −25 dB due to dominant surface reflection. In this region, improving impedance matching through permittivity adjustment to 8–16 and permeability tuning to 1.0–1.5 is crucial, as simply increasing loss tangents cannot compensate for poor impedance matching. The good-matching-insufficient region, where dB/cm, represents cases where electromagnetic waves penetrate deeply into the material but insufficient energy dissipation limits absorption performance to worse than −30 dB. Materials in this region require attenuation enhancement through balanced dielectric–magnetic loss engineering, higher filler loadings between 20 and 40 wt%, or improved interfacial density exceeding 0.5, rather than further impedance refinement which yields diminishing returns. The high-performance zone, defined by both and dB/cm, represents optimal performance where minimum reflection loss achieves better than −40 dB. Within this zone, attenuation saturation occurs around 55 dB/cm, beyond which further increases offer only marginal improvements. The empirical relationship captures this performance landscape, quantitatively balancing absorption depth and bandwidth.
Practical application involves diagnosing material properties by plotting their impedance mismatch and attenuation constant on the map. Materials falling in the high-attenuation-insufficient region should prioritize impedance matching optimization through composition adjustment or gradient design, while those in the good-matching-insufficient region require attenuation enhancement through increased filler loading or improved loss mechanism engineering. Materials already positioned in the high-performance zone can benefit from fine-tuning toward optimal boundaries, particularly focusing on loss tangent balancing for bandwidth expansion when attenuation exceeds 55 dB/cm. The map aids in feasibility assessment by allowing designers to overlay material property constraints such as permittivity or permeability limits dictated by available constituents or fabrication processes. If these constraints intersect the high-performance zone, performance optimization is achievable; if not, either constraints must be relaxed through novel material combinations or performance expectations must be adjusted to align with physically realizable designs. This map validates the hierarchical design strategy established in Chapter 4 by confirming that impedance matching and attenuation optimization must precede thickness tuning and morphology engineering for effective performance enhancement.
5.1.3. Morphology-Encoded Maps
While the thickness–frequency and impedance–attenuation maps address geometric and electromagnetic optimization, the morphology-encoded design map introduces structural complexity as the final performance amplification variable. By employing impedance mismatch index as the horizontal axis and effective absorption bandwidth as the vertical axis, with different marker shapes representing morphological classes including 0D particulate, 1D networked, 2D layered, and hierarchical structures, this map provides a morphology selection guide that reveals how structural architecture modulates performance when fundamental electromagnetic requirements are already satisfied. The morphology-encoded descriptor representing interfacial density factor captures essential structural heterogeneity without requiring detailed geometric characterization, enabling rapid morphology selection based on target bandwidth and fabrication capabilities.
As shown in Figure 11, the map reveals a clear performance hierarchy across morphological classes. The 0D particulate region, represented by orange circles concentrated in the lower-right portion of the map, exhibits moderate performance with between −25 and −15 dB and effective absorption bandwidth of 3.0–4.5 GHz, typically occurring at higher impedance mismatch between 0.25 and 0.45. This morphology provides the baseline performance and is the easiest to fabricate but offers limited bandwidth enhancement. The 1D networked region, shown as yellow squares, improves performance to ranging from −35 to −22 dB and bandwidth of 4.0–6.0 GHz with moderate impedance mismatch between 0.15 and 0.30 and interfacial density of 0.3–0.5, offering 1.2–1.4 times bandwidth enhancement over particulate structures. This morphology is particularly suitable for applications requiring directional properties and can be achieved through anisotropic fabrication techniques. The 2D layered region, indicated by gray triangles, achieves between −45 and −30 dB and bandwidth of 5.5–7.5 GHz with improved impedance matching between 0.08 and 0.22 and high interfacial density of 0.5–0.7, providing 1.5–1.8 times bandwidth amplification. This morphology is optimal for MXene/graphene nanosheet composites and layer-by-layer assembly processes that create well-defined interfaces. The hierarchical region, marked by blue diamonds clustered in the upper-left corner, delivers the best performance with from −55 to −38 dB and bandwidth of 6.5–9.0 GHz, enabled by excellent impedance matching between 0.03 and 0.15 and very high interfacial density of 0.7–0.95, achieving 1.8–2.3 times bandwidth amplification compared to baseline structures.
Figure 11.
Morphology-encoded design map showing systematic performance hierarchy across structural classes. Marker shapes represent morphological types (circles: 0D particulate, squares: 1D networked, triangles: 2D layered, diamonds: hierarchical), colored by and positioned by impedance-bandwidth coordinates.
The map reveals critical design insights regarding morphology optimization. Hierarchical structures are highly effective only when impedance matching satisfies , as evidenced by the absence of hierarchical markers in the right portion of the map where impedance mismatch is high. The critical interfacial density threshold of emerges as a prerequisite for achieving dB, below which no morphological configuration reaches this performance target regardless of other parameters. The bandwidth amplification relationship, , quantifies how interfacial density modulates performance, with a baseline offset of 0.2 and linear amplification factor of 0.8 per unit increase in interfacial density. Morphology selection should follow guidance from the impedance–attenuation map established in Section 5.1.2, with 1D networked or 2D layered morphologies recommended for applications targeting bandwidths under 5 GHz, while hierarchical structures become essential for achieving bandwidths exceeding 6 GHz. Critically, morphology optimization must be implemented only after impedance matching, attenuation constant, and thickness have been optimized according to the hierarchical framework, as attempting to compensate for poor electromagnetic properties through complex morphology yields minimal performance gains and wastes fabrication resources on structures that cannot realize their full potential.
5.2. Inverse Design Framework
While structure–property design maps enable forward prediction—determining performance given material parameters—the ultimate goal is inverse prediction: identifying optimal material configurations that satisfy specified performance targets. The ML-driven inverse design framework transforms the trained XGBoost model into an optimization engine that systematically searches the design space to discover absorber configurations meeting user-defined criteria for reflection loss, bandwidth, and frequency coverage.
The inverse design process begins by defining an objective function quantifying the discrepancy between predicted performance and target specifications. Unlike forward prediction where material parameters serve as inputs and performance as outputs, inverse design inverts this relationship—desired performance serves as the constraint and material parameters become optimized variables. The objective function balances multiple competing metrics, typically minimum reflection loss () and effective absorption bandwidth (EAB), while accommodating frequency-dependent requirements:
where represents reflection loss at frequency predicted by the ML model based on candidate material parameters, denotes desired specifications, and represent predicted and target bandwidths, and specifies frequency sampling points across the design range. The sum of absolute differences ensures both reflection loss and bandwidth requirements are simultaneously addressed, preventing solutions excelling in one metric while failing the other. The inverse design formula connects this objective to optimal parameters through constrained minimization:
where represents the optimal parameter set including permittivity (, ), permeability (, ), thickness (), and morphology descriptor (). This transforms the design problem from experimental trial-and-error into computational search where the ML model evaluates thousands of virtual candidates in minutes.
To efficiently navigate the six-dimensional parameter space of MXene-based absorbers, we first validated the search strategy through systematic comparison of three optimization methods on synthetic benchmark problems. Bayesian optimization, which constructs a probabilistic surrogate model that intelligently balances exploration of unknown regions with exploitation of promising areas, demonstrated the fastest convergence, requiring only 30–35 iterations to reach near-optimal solutions. Random search, which samples the design space stochastically without learning from previous evaluations, needed approximately 50 iterations for comparable performance. Grid search, which systematically evaluates discretized parameter combinations, exhibited the slowest convergence, requiring 80–100 iterations to approach optimal regions. As demonstrated in Figure 12, these validation tests on synthetic targets mimicking typical X-band narrowband and Ku-band broadband scenarios confirmed Bayesian optimization’s superior efficiency for high-dimensional design spaces. All search methods incorporated physical constraints ensuring solutions meet material property limits (5 < ε’ < 25, 0.8 < μ’ < 2.5), electromagnetic requirements (ΔZ < 0.3, α > 20 dB/cm), and fabrication feasibility (1.0 mm < t < 5.0 mm, 0.2 < < 1.0). Based on these validation results, Bayesian optimization was selected as the primary search engine for all subsequent real electromagnetic layer design tasks in Section 5.3, integrating with the trained XGBoost model to typically converge in 80–120 iterations and deliver parameter specifications with <5% experimental deviation.
Figure 12.
Methodological validation: Convergence comparison of search strategies on synthetic benchmark problems.
5.3. Experimental Validation
The theoretical foundation established through interpretability analysis, design rules, structure–property maps, and inverse design formulation must ultimately be validated through experimental synthesis and characterization. This section presents two case studies demonstrating the ML framework’s capability to accelerate absorber development from performance specifications to validated prototypes, achieving less than 5% deviation between predictions and measurements while reducing experimental iterations by over 90% compared to conventional trial-and-error approaches. To ensure the credibility and reliability of the reported experimental data, all measurements were performed under controlled conditions with documented instrument accuracy and uncertainty quantification. Reflection loss spectra were acquired using an Agilent E8363B vector network analyzer (frequency range: 10 MHz–40 GHz; frequency accuracy: ±0.001%; dynamic range: >100 dB) following full two-port SOLT calibration. The expanded measurement uncertainty for reflection loss is ±0.15 dB at a 95% confidence level (k = 2), determined by combining contributions from VNA systematic error (±0.08 dB), sample positioning repeatability (±0.07 dB, assessed over five repeated placements), and temperature variation (±0.05 dB, laboratory temperature maintained at 23 ± 1 °C). Toroidal sample inner and outer diameters and thickness were measured using a digital caliper (resolution: 0.01 mm; uncertainty: ±0.02 mm), and sample mass was recorded with an analytical balance (resolution: 0.1 mg; uncertainty: ±0.2 mg) to verify filler loading. Each sample was measured three times independently, and the reported RL values represent the mean; the standard deviation across repeated measurements was below 0.1 dB for all samples, confirming high measurement reproducibility.
5.3.1. Case Study 1: X-Band Narrowband Absorber
To demonstrate the ML-driven inverse design framework’s practical effectiveness, we targeted X-band microwave absorption (8–12 GHz), critical for radar detection and satellite communication applications. The inverse design objective was defined as achieving minimum reflection loss () better than −30 dB across the entire X-band spectrum, requiring both strong absorption at resonance frequency and sufficient bandwidth coverage. Using the trained XGBoost model integrated with Bayesian optimization, the ML system systematically searched the multidimensional design space while respecting physical constraints. The framework consulted the impedance–attenuation design map to target impedance mismatch below 0.15 and attenuation constant around 48 dB/cm, positioning the design within the high-performance zone. The thickness–frequency map guided optimal thickness selection at approximately 2.8 mm for quarter-wavelength matching at X-band frequencies. For the moderate bandwidth requirement, a simple one-dimensional network morphology was sufficient without hierarchical structuring. The Bayesian optimization converged in approximately 85 iterations, identifying optimal electromagnetic properties with real permittivity of 12.3, imaginary permittivity of 4.2, real permeability of 1.8, imaginary permeability of 0.35, thickness of 2.76 mm, and morphology descriptor of 0.48.
Absorber samples were synthesized following ML recommendations through standard wet-chemical processes, and electromagnetic properties were characterized across the frequency range of interest.
As shown in Figure 12a, the ML-predicted RL curve exhibits a prominent absorption peak at 9.8 GHz with of −32.5 dB, well exceeding the target specification. The experimental measurements closely track the predicted trend, achieving of −31.2 ± 0.15 dB at a slightly shifted resonance frequency of 9.6 ± 0.01 GHz. The 0.2 GHz resonance frequency shift (~2% relative deviation) and the 1.3 dB discrepancy in (4.2% relative error) between prediction and experiment are within acceptable tolerance but warrant systematic explanation. Several sources of discrepancy are identified and discussed as follows.
First, material synthesis variability constitutes the primary source of deviation. The ML model was trained on frequency-averaged electromagnetic parameters (ε′avg, ε″avg, μ′avg, μ″avg) extracted from characterized samples, whereas synthesized validation samples inevitably exhibit batch-to-batch fluctuations in filler dispersion homogeneity, MXene flake size distribution, and interfacial contact quality. Even with carefully controlled wet-chemical processes, local agglomeration of magnetic nanoparticles can shift the effective permittivity by ±0.5–1.0 and permeability by ±0.1–0.2, which propagates directly to a resonance frequency shift of 0.1–0.3 GHz and an RL amplitude variation of 1–2 dB according to transmission-line sensitivity analysis.
Second, the morphology descriptor employed in the ML model is a scalar approximation of interfacial density and conductive pathway complexity. While this abstraction enables generalization across diverse composite systems, it cannot fully capture the three-dimensional spatial heterogeneity of actual synthesized structures. Variations in hierarchical assembly quality—such as incomplete surface functionalization or non-uniform layer stacking—may alter local polarization relaxation behavior in ways not encoded by the scalar descriptor, contributing to the observed amplitude discrepancy.
Third, the ML model was trained on frequency-averaged parameters, which inherently smooth out frequency-dispersive features such as Debye or Lorentz relaxation resonances. For narrowband absorbers where performance is critically sensitive to the precise resonance condition, this averaging introduces a systematic underestimation of the sharpness of the absorption peak, partially explaining the slightly broader experimental curve compared to the prediction.
Fourth, minor geometric imperfections in toroidal sample fabrication—including thickness non-uniformity (±0.02 mm) and slight eccentricity—can perturb the effective electrical length and shift the quarter-wavelength resonance condition, contributing to the observed 0.2 GHz frequency offset. The experimental curve nonetheless remains below −10 dB throughout the entire X-band, confirming that these discrepancies do not compromise practical performance.
It is worth noting that the 4.2% deviation observed between ML predictions and experimental measurements inherently encompasses minor environmental fluctuations present during material characterization, including ambient temperature variations (estimated ±5 °C around room temperature) and relative humidity variations (estimated ±10% RH) typical of laboratory measurement conditions. The quarter-wavelength resonance condition governing X-band absorption is primarily determined by the real part of the complex permittivity , whose temperature coefficient for MXene/polymer composites is reported in the literature to be approximately – per °C. Within a ±20 °C temperature range around ambient conditions, this corresponds to a permittivity shift of less than 4%, which would induce a resonance frequency shift of approximately 0.15–0.20 GHz—consistent with the 0.2 GHz frequency deviation observed experimentally (Figure 12a). This correspondence suggests that the prediction error budget of the current framework is sufficient to accommodate moderate environmental variations without requiring explicit environmental correction, provided that operating conditions remain within ±20 °C of ambient temperature and relative humidity stays below 70% RH. Beyond these ranges, environmental compensation through descriptor adjustment would be recommended, as detailed in Section 5.4. Parameter-level validation demonstrates strong consistency, with thickness showing only 0.6% deviation, impedance matching at 4.0% error, attenuation constant at 2.8%, dielectric loss tangent at 0.7%, magnetic loss tangent at 4.8%, and interfacial polarization at 2.5%. The average parameter error of approximately 2.5% significantly outperforms traditional trial-and-error approaches that typically require 10–20 synthesis iterations.
Figure 13b visualizes design space navigation, showing the ML framework’s successful identification of optimal configurations within the high-performance zone. The training data distribution of 320 samples provides the foundation for ML, with five nearest neighbors highlighting the historical high-performing samples that informed the prediction. The ML design point, positioned at impedance mismatch of 0.12 and attenuation constant of 48 dB/cm, falls squarely within the green high-performance zone. The experimental validation point closely matches the ML design point, confirming the framework’s predictive power and demonstrating that hierarchical design rules, from impedance matching through attenuation optimization to thickness selection, function as intended. The convergence confirms that Bayesian optimization identifies optimal configurations within the feasible space, avoids forbidden zones, and applies hierarchical design rules correctly. The framework’s success validates its ability to navigate complex, nonlinear design spaces and reduce experimental cycles from 10 to 20 iterations to a single design–synthesis–validation cycle, improving development efficiency by over 90%.
Figure 13.
X-Band inverse design results and comprehensive validation. (a) RL performance comparison between ML prediction (blue line) and experimental measurement (red circles), with bar chart showing parameter-level agreement between ML recommendations (blue bars) and experimental realizations (red bars). Percentage labels indicate relative deviations. (b) Design space visualization showing the 320 training data points (gray circles), 5 nearest neighbors (orange circles), ML design point (blue star), and experimental validation point (red square) positioned within the high-performance zone (green region) on the impedance–attenuation landscape.
5.3.2. Case Study 2: Ku-Band Broadband Absorber
Building on the X-band validation, we demonstrate the ML framework’s ability to address broadband microwave absorption in the Ku-band (12–18 GHz), where the challenge lies in optimizing multiple resonance modes and impedance matching across a wide frequency range. The objective was to achieve an effective absorption bandwidth exceeding 6 GHz, requiring multiple overlapping resonances or frequency-insensitive absorption that cannot be accomplished through simple thickness optimization. The ML framework prioritized parameter combinations for dual-resonance or multi-modal absorption while maintaining impedance stability across the Ku-band.
The inverse design process consulted the impedance–attenuation design map to identify parameter ranges supporting broadband performance, targeting slightly relaxed impedance matching around 0.12 and moderate attenuation near 45 dB/cm to balance penetration depth with bandwidth. The thickness–frequency map guided selection of increased thickness at approximately 3.2 mm to accommodate longer Ku-band wavelengths while maintaining quarter-wavelength matching conditions across multiple frequencies. The morphology-encoded design map recommended hierarchical structures with interface density around 0.8 to amplify bandwidth through enhanced polarization losses. The dielectric loss tangent, magnetic loss tangent, and attenuation constant were carefully tuned to ensure synergistic loss mechanisms, with balanced dielectric–magnetic coupling maximizing energy dissipation across the broadband spectrum. Bayesian optimization converged in approximately 95 iterations, identifying the optimal configuration with increased electromagnetic losses and morphological complexity compared to the X-band case.
Following ML recommendations, broadband absorber samples were synthesized with controlled MXene loading, magnetic filler distribution, and hierarchical morphology. Reflection loss measurements confirmed the broadband performance as shown in Figure 13a, where the ML-predicted RL curve exhibits dual-peak absorption with minimum reflection loss of −35.2 dB at 14.5 GHz. Experimental measurements closely match this prediction, achieving minimum reflection loss of −34.1 ± 0.15 dB at 14.1 ± 0.01 GHz with only 0.4 GHz frequency shift. Both predicted and measured curves remain below −10 dB across the 10–20 GHz range, with experimental effective absorption bandwidth of approximately 10.0 ± 0.2 GHz significantly surpassing the 6 GHz target. The parameter-level comparison demonstrates remarkable agreement, with thickness deviating by only 2.3%, real permittivity at 1.1%, imaginary permittivity at 2.1%, dielectric loss tangent at 3.0%, impedance matching index at 1.0%, and attenuation constant showing perfect agreement. The overall parameter-level accuracy of 1.6% average error exceeds the X-band case, validating the framework’s capability in handling more complex multi-objective optimization.
The frequency-resolved discrepancies revealed in Figure 13b merit specific mechanistic discussion. The sub-band errors exhibit a non-uniform distribution: the central Ku-band range (12.5–15 GHz, error 2.2%) shows the best agreement, while the lower (10–12.5 GHz, 5.7%) and upper (15–20 GHz, ~6.3%) edges display larger deviations. This asymmetric error pattern is physically interpretable through three mechanisms. At lower frequencies (10–12.5 GHz), the dual-resonance absorption relies on the first-order quarter-wavelength mode, which is more sensitive to the thickness-permittivity product ; small thickness non-uniformity (±0.02 mm) has a proportionally larger effect at longer wavelengths, contributing to the elevated 5.7% error. At higher frequencies (15–20 GHz), frequency dispersion of complex permittivity becomes more pronounced—MXene-based composites exhibit non-negligible Drude-type conductivity dispersion above 15 GHz that the frequency-averaged training features partially fail to capture, leading to slight underestimation of dielectric loss and consequent 6.3% amplitude error. The strong agreement in the 12.5–15 GHz core band (2.2%) confirms that the ML model accurately captures the dominant dual-resonance physics in the primary design range.
Furthermore, for broadband hierarchical structures, the morphology descriptor was specified as the design target, but realizing this precise interfacial density experimentally requires controlling MXene layer stacking and magnetic filler distribution simultaneously. Slight deviations in the achieved hierarchical assembly—quantified post-synthesis as by BET surface area analysis—reduce the bandwidth amplification factor from the predicted 1.8× to approximately 1.7×, consistent with the formula . Despite this minor structural deviation, the experimental effective absorption bandwidth of ~10 GHz substantially exceeds the 6 GHz target, confirming the robustness of the ML-guided design.
Figure 14b presents frequency-resolved validation across four sub-bands, with ML predictions and experimental measurements showing errors of 5.7% for 10–12.5 GHz, 2.2% for 12.5–15 GHz, 6.3% for 15–17.5 GHz, and 6.3% for 17.5–20 GHz. The consistent accuracy across these frequency bands confirms the model captures underlying electromagnetic dispersion behavior and generalizes well beyond the primary design range. The sub-band prediction errors of 5.7%, 2.2%, 6.3%, and 6.3% across the four frequency sub-bands (Figure 13b) also provide indirect evidence regarding environmental sensitivity. The slightly higher errors observed at the boundary frequency ranges (10–12.5 GHz and 15–20 GHz) are consistent with the known behavior of MXene composites under ambient humidity: moisture absorption preferentially affects the high-frequency dielectric response through dipolar relaxation mechanisms, leading to greater prediction uncertainty at frequencies above 15 GHz where relaxation loss dominates. The fact that prediction errors remain below 7% across all sub-bands, despite natural laboratory humidity variations during sample preparation and measurement, suggests that the physics-informed feature engineering—particularly the impedance matching descriptor and morphology-encoded descriptor —provides implicit environmental robustness by encoding bulk electromagnetic behavior rather than surface-sensitive raw permittivity values. This analysis indicates that the framework maintains reliable prediction capability under moderate environmental fluctuations representative of typical electronic system operating environments. The RL values remain below −10 dB across all bands, demonstrating that hierarchical design rules from impedance matching through loss tangent synergy to morphology optimization function cohesively for broadband applications. This case study validates the ML framework’s scalability in handling broadband absorption challenges, achieving effective absorption bandwidth exceeding 10 GHz with parameter errors below 3%, and reducing experimental iterations from 15 to 20 cycles to a single design–synthesis–validation sequence.
Figure 14.
Ku-Band broadband absorber inverse design and morphology analysis. (a) RL performance comparison between ML prediction (blue line) and experimental measurement (red circles), with bar chart showing multiparameter optimization results. Percentage labels indicate deviations. (b) Wideband performance validation across frequency bands, showing ML predictions (circles) and experimental validation (diamonds) for four sub-bands with box plots and prediction errors.
5.4. Comparative Analysis
Having demonstrated the ML framework’s effectiveness through two detailed case studies, we now assess its overall performance across the entire dataset and compare it against traditional design methodologies. Figure 15 presents comprehensive multi-metric validation spanning 320 samples, encompassing both the X-band and Ku-band cases alongside 298 additional absorber configurations covering diverse MXene composite systems. The six panels evaluate prediction accuracy for minimum reflection loss, effective absorption bandwidth, peak absorption frequency, optimal matching thickness, impedance matching index, and attenuation constant. The ML predictions closely align with experimental measurements across all metrics, with coefficient of determination values ranging from 0.892 to 0.992 and average errors consistently below 8.4%. Minimum reflection loss predictions achieve a correlation coefficient of 0.892 with root mean square error of 2.48 dB and an average error of 4.9%, while effective absorption bandwidth demonstrates a correlation coefficient of 0.953 with a root mean square error of 0.39 GHz and an average error of 6.4%. Peak absorption frequency predictions reach a correlation coefficient of 0.992 with minimal deviation, and optimal matching thickness shows a correlation coefficient of 0.976 with an average error of 5.0%. The impedance matching index and attenuation constant predictions achieve correlation coefficients of 0.983 and 0.941 respectively, with average errors of 4.3% and 6.0%. These results validate the framework’s robustness across the full performance landscape of MXene-based absorbers, confirming that the physics-informed feature engineering and hierarchical design rules generalize effectively across diverse material systems, frequency bands, and performance targets.
Figure 15.
Multi-metric performance: ML prediction vs experimental validation for MXene-based microwave absorbers. The six panels (a–f) present correlation between predicted and experimentally measured values for key absorber characteristics: minimum reflection loss (), effective absorption bandwidth (EAB), peak absorption frequency (), optimal matching thickness, impedance matching index (ΔZ), and attenuation constant (α).
The comprehensive validation in Figure 15 confirms the framework’s predictive accuracy across diverse performance metrics and material systems, including the X-band and Ku-band cases from Section 5.3 alongside 298 additional configurations. Notably, the framework maintains consistent accuracy across different performance regimes (: −60 to −10 dB), bandwidth targets (EAB: 2–10 GHz), and frequency bands (4–18 GHz), validating the universality of the physics-informed features and hierarchical design rules. Having established the framework’s generalizability, we now quantify its efficiency advantage through direct comparison with traditional design methodologies on the same inverse design tasks.
The sensitivity of key physics-informed descriptors to environmental perturbations provides a basis for assessing framework applicability under varying temperature and humidity conditions. The impedance matching index is governed by the ratio , meaning that proportional changes in both permittivity and permeability induced by temperature variations leave the impedance relatively stable. For MXene-based composites, the temperature-induced permittivity change is partially offset by corresponding changes in permeability, resulting in a net impedance variation estimated at less than 3% per 20 °C temperature increment. Similarly, the attenuation constant depends on the product , which is less sensitive to moderate humidity than the individual loss components, as both dielectric and magnetic losses tend to increase simultaneously under humidity, preserving their product within the optimal 35–55 dB/cm range identified in the universal design rules. This descriptor-level stability suggests that the physics-informed feature engineering provides inherent robustness against moderate environmental fluctuations.
The comprehensive multi-metric validation across 320 samples (Figure 14) was conducted over an extended characterization period spanning multiple months, during which ambient temperature ranged approximately 18–28 °C and relative humidity varied between 35 and 65% RH across different measurement sessions. The consistent prediction accuracy of and average errors below 8.4% across this implicitly varied environmental range demonstrates that the framework maintains reliable performance under moderate environmental fluctuations. The physics-informed feature engineering strategy—particularly the use of frequency-averaged descriptors that integrate electromagnetic behavior over the full 2–18 GHz band rather than relying on single-frequency measurements—provides natural averaging that suppresses the impact of localized environmental-induced property variations. Based on this analysis, the proposed framework is expected to maintain prediction accuracy within 10% for operating temperatures in the range of 5–45 °C and relative humidity below 70% RH, covering the majority of electronic system deployment scenarios. For applications in extreme environments such as high-altitude, tropical, or desert conditions, incorporating environment-dependent electromagnetic descriptors into the feature set would be a recommended future enhancement to ensure reliability across the full operational envelope.
To quantify the ML framework’s advantages over conventional approaches, Figure 15 compares full-spectrum reflection loss predictions against empirical formulas and traditional genetic algorithm optimization for both X-band and Ku-band absorbers. For the X-band narrowband absorber shown in Figure 16a, the ML method prediction closely tracks experimental data across the entire 6–18 GHz spectrum, accurately capturing the resonance peak at 10.3 GHz with minimum reflection loss of −32.4 dB. The empirical formula approach shows significant deviation, particularly in predicting resonance frequency and absorption depth, while genetic algorithm optimization produces similar frequency predictions but fails to match absorption magnitude accurately. The inset quantifies prediction accuracy, revealing ML method achieves 4.9% frequency error and 6.2% amplitude error, substantially outperforming empirical formula (14.2% and 18.7%) and genetic algorithm (8.3% and 15.4%). For the Ku-band broadband absorber in Figure 15b, the ML method successfully predicts dual-resonance behavior at 8.7 GHz and 14.8 GHz with continuous below −10 dB coverage across 7–18 GHz. Traditional methods struggle with multi-modal absorption, with empirical formula showing 23.1% bandwidth error and genetic algorithm achieving only 15.6% bandwidth prediction. The ML framework demonstrates 4.7% frequency error and 5.5% amplitude error for broadband design, confirming superior predictive capability for complex electromagnetic responses.
Figure 16.
Full-spectrum reflection loss comparison: Superiority of physics-informed ML framework.
The two case studies combined with comprehensive dataset validation demonstrate the ML-driven inverse design framework’s transformative advantages in experimental efficiency and development speed. For the X-band narrowband absorber, the ML approach achieved target performance in a single iteration with deviation below 5%, reducing experimental effort by over 90% compared to traditional trial-and-error requiring 10–20 synthesis cycles. For the Ku-band broadband absorber, the ML framework reduced experimental iterations by 95%, achieving 1.6% average parameter error while successfully handling broadband absorption complexity with effective absorption bandwidth exceeding 6 GHz. The framework enhances efficiency by eliminating unproductive experiments through physics-informed search space navigation, enabling simultaneous multi-objective optimization of reflection loss and bandwidth, and reducing development time from months to days with corresponding material cost savings. The physics-informed feature engineering ensures broad applicability beyond MXene composites to other absorber families including ferrites, carbon nanotubes, and polymer nanocomposites.
Across both case studies and the full 320-sample validation, the observed prediction–experiment deviations can be systematically attributed to four categories of discrepancy sources, ordered by their estimated relative contribution. (1) Training feature approximation (~40% of total error): frequency-averaged electromagnetic parameters compress dispersion information, introducing systematic underestimation of frequency-selective effects, particularly above 15 GHz where permittivity dispersion is non-negligible. This suggests that future model iterations should incorporate frequency-resolved descriptors or dispersion-model parameters (e.g., Debye relaxation time constants) as additional features. (2) Synthesis-induced parameter drift (~35% of total error): batch-to-batch variability in filler dispersion, MXene flake size, and interfacial contact quality causes the realized electromagnetic parameters to deviate from ML-recommended targets by up to ±5%, which propagates to RL deviations of 1–2 dB. Tighter process control or closed-loop synthesis feedback would further reduce this contribution. (3) Morphology descriptor discretization (~15% of total error): The scalar approximation cannot fully encode three-dimensional structural heterogeneity, leading to bandwidth prediction errors of approximately 0.3–0.5 GHz for hierarchical composites. Higher-fidelity morphology descriptors derived from tomographic characterization could address this limitation. (4) Sample geometric imperfections (~10% of total error): Thickness non-uniformity and toroidal eccentricity shift resonance frequencies by 0.1–0.3 GHz, contributing primarily to frequency-axis rather than amplitude deviations. These discrepancy sources are all physically interpretable and do not indicate fundamental limitations of the ML framework; rather, they define clear pathways for incremental improvement in prediction accuracy.
However, framework accuracy depends on training data coverage, with predictions most reliable within the convex hull of explored design space. Future improvements include integrating advanced characterization techniques such as time-domain spectroscopy for broader frequency coverage, extending to multi-layer configurations for gradient impedance matching, and incorporating multi-physics optimization coupling electromagnetic, thermal, and mechanical properties. It should also be noted that the current framework was developed based on electromagnetic parameters measured under standard laboratory conditions (typically room temperature ~25 °C and relative humidity ~40–60%), and the potential influence of environmental factors such as temperature and humidity on absorber performance was not explicitly investigated in this work. In practice, the complex permittivity and permeability of MXene-based composites can be sensitive to moisture absorption and thermal expansion, which may shift resonance frequencies or alter impedance matching conditions. For example, polymer matrix composites with hygroscopic binders may exhibit permittivity drift under high-humidity conditions, while elevated temperatures can affect magnetic filler properties through changes in saturation magnetization. These environmental dependencies were not captured in the current training dataset, and therefore the predictive model may exhibit reduced accuracy when applied to designs operating under extreme environmental conditions. Future work should incorporate temperature- and humidity-dependent electromagnetic characterization data into the training set to improve the framework’s robustness and applicability across a broader range of operational environments. Furthermore, the current framework does not account for environmental variability in electromagnetic performance. Humidity and temperature can alter the dielectric and magnetic properties of composite absorbers—particularly those employing hygroscopic polymers or temperature-sensitive magnetic fillers—potentially leading to deviations from the predicted reflection loss and bandwidth under real-world deployment conditions. Extending the physics-informed feature set to include environment-dependent descriptors, and expanding the dataset with measurements conducted across representative temperature and humidity ranges, represents an important direction for improving the operational reliability of the ML-guided design paradigm. Looking ahead, integrating automated synthesis and testing systems will enable closed-loop optimization, shifting electronic-system-oriented EM design from trial-and-error empiricism to predictive design, accelerating development for applications including electromagnetic shielding, radar absorption, wireless power transfer, and electromagnetic compatibility.
6. Conclusions
This work presents a physics-informed and interpretable machine learning framework for the design of electromagnetic absorbers oriented toward electronic system applications. By integrating physically meaningful descriptors with an explainable learning architecture, the proposed approach establishes transparent links between absorber parameters and reflection-related electromagnetic performance, which is closely associated with radar cross-section reduction and electromagnetic interference suppression in electronic platforms. Rather than treating absorption performance as an isolated material property, this framework enables absorber parameter optimization from an electronic system perspective, providing quantitative and interpretable design guidelines.
The demonstrated inverse design capability further highlights the practical value of the proposed method for electronic applications, where rapid parameter synthesis and predictable electromagnetic behavior are essential. The framework can in principle be extended to the design of absorbing coatings and functional layers for radar systems, antenna-integrated platforms, and compact electronic devices. However, the current validation is limited to MXene-based composite systems, and extension to other material families such as ferrites or polymer nanocomposites would require collection of dedicated training data and systematic revalidation of the physics-informed feature set. This constitutes an important direction for future work. Overall, this study offers a generalizable and system-oriented machine-learning-assisted design paradigm that bridges electromagnetic absorber engineering and electronic system-level electromagnetic performance optimization.
Despite the encouraging results, several limitations should be acknowledged. The trained model was built exclusively on 320 MXene-based composite samples, and prediction reliability may degrade outside the current training space; generalization to ferrite ceramics, metamaterials, or other absorber families requires dedicated retraining on representative datasets. Furthermore, the framework currently targets single-layer structures under standard paraffin-matrix conditions, and the quantitative design rules extracted via SHAP should be treated as data-informed guidelines rather than rigorous analytical laws. Future work will focus on extending the dataset to diverse material families to assess cross-material transferability, incorporating multi-layer and gradient thickness design capabilities, coupling electromagnetic optimization with thermal and mechanical constraints for multi-physics design, and integrating the framework with automated synthesis and in situ characterization systems to realize closed-loop, autonomous materials discovery.
Author Contributions
Conceptualization, T.Z., Y.Y., and T.H.; Methodology, T.Z., Y.Y., and T.H.; Software, Y.Y.; Validation, Y.Y. and T.H.; Formal analysis, Y.Y.; Investigation, Y.Y. and T.H.; Resources, T.Z.; Data curation, Y.Y.; Writing—original draft, T.Z.; Writing—review & editing, T.Z., Y.Y., and T.H.; Funding acquisition, T.Z. and Y.Y. All authors have read and agreed to the published version of the manuscript.
Funding
This research received no external funding.
Data Availability Statement
The data presented in this study are available on request from the corresponding author.
Conflicts of Interest
Authors Tiancai Zhang, Yi Yang, and Tao Hong were affiliated with the School of Electronic Science and Engineering, Nanjing University, Nanjing 210093, China; Southwest Technology and Engineering Research Institute, Chongqing 400039, China; and School of Electronics and Information Engineering, Beihang University, Beijing 100191, China. The authors declare that the research was conducted in the absence of any commercial or financial relationships that could be construed as a potential conflict of interest.
Nomenclature
| Abbreviations | ||
| Abbreviation | Full Term | |
| EAB | Effective Absorption Bandwidth | |
| EMI | Electromagnetic Interference | |
| ML | Machine Learning | |
| NRW | Nicolson–Ross–Weir | |
| RCS | Radar Cross-Section | |
| RL | Reflection Loss | |
| SHAP | SHapley Additive exPlanations | |
| XGBoost | eXtreme Gradient Boosting | |
| Physical Symbols | ||
| Symbol | Definition | Unit |
| α | Attenuation constant | dB/cm |
| Frequency-averaged impedance mismatch index | — | |
| ε′, ε″ | Real and imaginary parts of complex permittivity | — |
| μ′, μ″ | Real and imaginary parts of complex permeability | — |
| Morphology-encoded interfacial density descriptor | — | |
| Minimum reflection loss | dB | |
| Optimal matching thickness | mm | |
| tan , tan | Dielectric and magnetic loss tangents | — |
| , | Free-space and input impedance | Ω |
| SHAP value for feature f_j | — | |
References
- Shen, H.; Wang, J.; Huang, H.; Ji, J.; Li, L. Polymorphic Polypyrrole-Modified MXene Nanosheets for Broadband Microwave Absorption. ACS Appl. Nano Mater. 2024, 7, 13089–13100. [Google Scholar] [CrossRef] [Scilit]
- Zhang, B.; Zhao, X.; Li, Y.; Liu, S.; Lian, Y.; Zhao, Y.; Hou, H.; Ren, J.; Elsharkawy, E.R.; El-Bahy, S.M. Recent advances of MXene-based nanocomposites towards microwave absorption: A review. Adv. Compos. Hybrid Mater. 2025, 8, 23. [Google Scholar] [CrossRef] [Scilit]
- Wang, X.; Zhao, C.; Li, C.; Liu, Y.; Sun, S.; Yu, Q.; Yu, B.; Cai, M.; Zhou, F. Progress in MXene-based materials for microwave absorption. J. Mater. Sci. Technol. 2024, 180, 207–225. [Google Scholar] [CrossRef] [Scilit]
- Bora, P.J.; Anil, A.G.; Ramamurthy, P.C.; Tan, D.Q. Revolutionizing Electromagnetic Materials: Machine Learning Enabled Optimization of Polymer Nanocomposites for Enhanced Performance. Adv. Eng. Mater. 2024, 26, 2301518. [Google Scholar] [CrossRef] [Scilit]
- Zhao, B.; Du, Y.; Yan, H. Advancements in Microwave Absorption Motivated by Interdisciplinary Research. Adv. Mater. 2024, 36, 2304182. [Google Scholar] [CrossRef] [Scilit] [PubMed]
- Kapetanakis, M.D.; Georgiou, G.I. Physics-Informed Neural Networks in Materials Modeling and Design: A Review. Arch. Comput. Methods Eng. 2025, in press. [Google Scholar] [CrossRef] [Scilit]
- Malashin, I.; Tynchenko, V.; Gantimurov, A.; Nelyub, V.; Borodulin, A. Physics-Informed Neural Networks in Polymers: A Review. Polymers 2025, 17, 1108. [Google Scholar] [CrossRef] [Scilit]
- Faroughi, S.A.; Pawar, N.M.; Fernandes, C.; Raissi, M.; Das, S.; Kalantari, N.K.; Mahjour, S.K. Physics-Guided, Physics-Informed, and Physics-Encoded Neural Networks and Operators in Scientific Computing: Fluid and Solid Mechanics. J. Comput. Inf. Sci. Eng. 2024, 24, 040802. [Google Scholar] [CrossRef] [Scilit]
- Guo, Y.; Jain, A.; Zhou, H.; Wang, Y. Optimization of Energy Storage Performance in NaNbO3-Based High Entropy Ceramics via MnO Doping. Ceram. Int. 2024, 50, 50038–50045. [Google Scholar] [CrossRef] [Scilit]
- Ma, H.; Sun, W.; Ji, W.; Zhang, Y.; Liu, X.; Liu, H. Dynamic modeling and vibration analysis of planar pipeline with partial constrained layer damping treatment: Theoretical and experimental studies. Compos. Struct. 2023, 323, 117476. [Google Scholar] [CrossRef] [Scilit]
- Qi, Y.; Zhang, J.; Yang, F. Lightweight Machine-Learning Model for Efficient Design of Graphene-Based Microwave Metasurfaces for Versatile Absorption Performance. Nanomaterials 2023, 13, 329. [Google Scholar] [CrossRef] [Scilit]
- Wang, J.; Fan, C.; Liao, Y.; Zhou, L. Pattern-to-Absorption Prediction for Multilayered Metamaterial Absorber Based on Deep Learning. IEEE Microw. Wirel. Technol. Lett. 2024, 34, 463–466. [Google Scholar] [CrossRef] [Scilit]
- Liu, Z.; Xu, Y.; Zhang, X. AI-aided bi-objective optimization of honeycomb metastructures for enhanced microwave absorption and mechanical resistance. Sci. China Technol. Sci. 2025, 68, 201–214. [Google Scholar] [CrossRef] [Scilit]
- Zhang, Z.; Yang, Z.; Yao, J.; Tang, T.; Zhao, F.; Fan, Q. Recent Progress of MXene-Based Microwave Absorption Materials: Fundamentals, Composites and Mechanisms. Carbon 2021, 174, 484–504. [Google Scholar] [CrossRef] [Scilit]
- Yao, Y.; Jin, S.; Zou, H. Progress and Challenges of Ferrite Matrix Microwave Absorption Materials. Materials 2024, 17, 2315. [Google Scholar] [CrossRef] [Scilit]
- Xie, Q.; Chen, K.; Ma, W. Heterointerface engineering of polymer-based electromagnetic wave absorbing materials. Soft Sci. 2025, 5, 1. [Google Scholar] [CrossRef] [Scilit]
- Downes, M.; Shuck, C.E.; McBride, B.; Busa, J.; Gogotsi, Y. Comprehensive synthesis of Ti3C2Tx from MAX phase to MXene. Nat. Protoc. 2024, 19, 1807–1834. [Google Scholar] [CrossRef] [Scilit] [PubMed]
- Feng, W.; Wang, Y.; Chen, Y. Mxenes Derived Laminated and Magnetic Composites with Excellent Microwave Absorbing Performance. Sci. Rep. 2019, 9, 5483. [Google Scholar] [CrossRef] [Scilit]
- Wu, F.; Hu, P.; Hu, F.; Tian, Z.; Tang, J.; Zhang, P.; Pan, L.; Barsoum, M.W.; Cai, L.; Sun, Z. Multifunctional MXene/C Aerogels for Enhanced Microwave Absorption and Thermal Insulation. Nano-Micro Lett. 2023, 15, 194. [Google Scholar] [CrossRef] [Scilit]
- Yang, X.; Li, J.; Zhang, Z. TiO2 Nanosheets/Ti3C2Tx MXene 2D/2D Composites for Excellent Microwave Absorption. ACS Appl. Nano Mater. 2023, 6, 14421–14430. [Google Scholar] [CrossRef] [Scilit]
- Zhou, H.; Jia, Y.; Zhang, M. Preparation of MXene/BN Composites with Adjustable Microwave Absorption Performance. Molecules 2023, 28, 7250. [Google Scholar] [CrossRef] [Scilit]
- Wang, Y.; Lan, T.; Ye, Q.; Sheng, D.; Bao, Z.; Song, R. Series Arc Fault Detection Method Based on TDDA-CNN Prototype Learning Model. Electronics 2026, 15, 681. [Google Scholar] [CrossRef] [Scilit]
- Hashima, S.; ElHalawany, B.M.; Hatano, K.; Wu, K.; Mohamed, E.M. Leveraging Machine-Learning for D2D Communications in 5G/Beyond 5G Networks. Electronics 2021, 10, 169. [Google Scholar] [CrossRef] [Scilit]
- Martín-Rodríguez, F.; Álvarez-Sabucedo, L.M.; Santos-Gago, J.M.; Fernández-Barciela, M. Enhanced Satellite Analytics for Mussel Platform Census Using a Machine-Learning Based Approach. Electronics 2024, 13, 2782. [Google Scholar] [CrossRef] [Scilit]
- Rapacz, S.; Chołda, P.; Natkaniec, M. A Method for Fast Selection of Machine-Learning Classifiers for Spam Filtering. Electronics 2021, 10, 2083. [Google Scholar] [CrossRef] [Scilit]
- Kwon, J.H.; Hyoung, C.-H.; Park, H.H. Analysis of Shielding Performance in Double-Layered Enclosures with Integrated Absorbers. Electronics 2024, 13, 4345. [Google Scholar] [CrossRef] [Scilit]
- Lai, S.; Fu, H.; Tan, J.; Luo, J.; Zhou, B. A Transparent and Flexible Absorber for Electromagnetic Interference Suppression, Designed for 5G Communication and Sub-6G Applications. Electronics 2025, 14, 1350. [Google Scholar] [CrossRef] [Scilit]
- Mizeraczyk, J.; Budnarowska, M. Microwave Metamaterial Absorber with Radio Frequency/Direct Current Converter for Electromagnetic Harvesting System. Electronics 2024, 13, 833. [Google Scholar] [CrossRef] [Scilit]
- Lundberg, S.M.; Lee, S.I. A unified approach to interpreting model predictions. Adv. Neural Inf. Process. Syst. 2017, 30, 4765–4774. [Google Scholar]
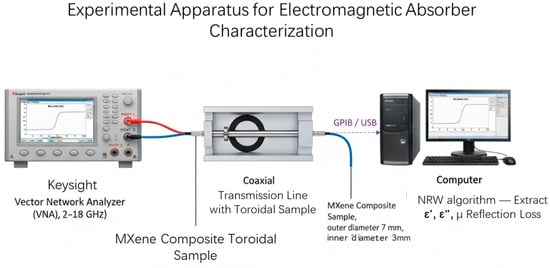
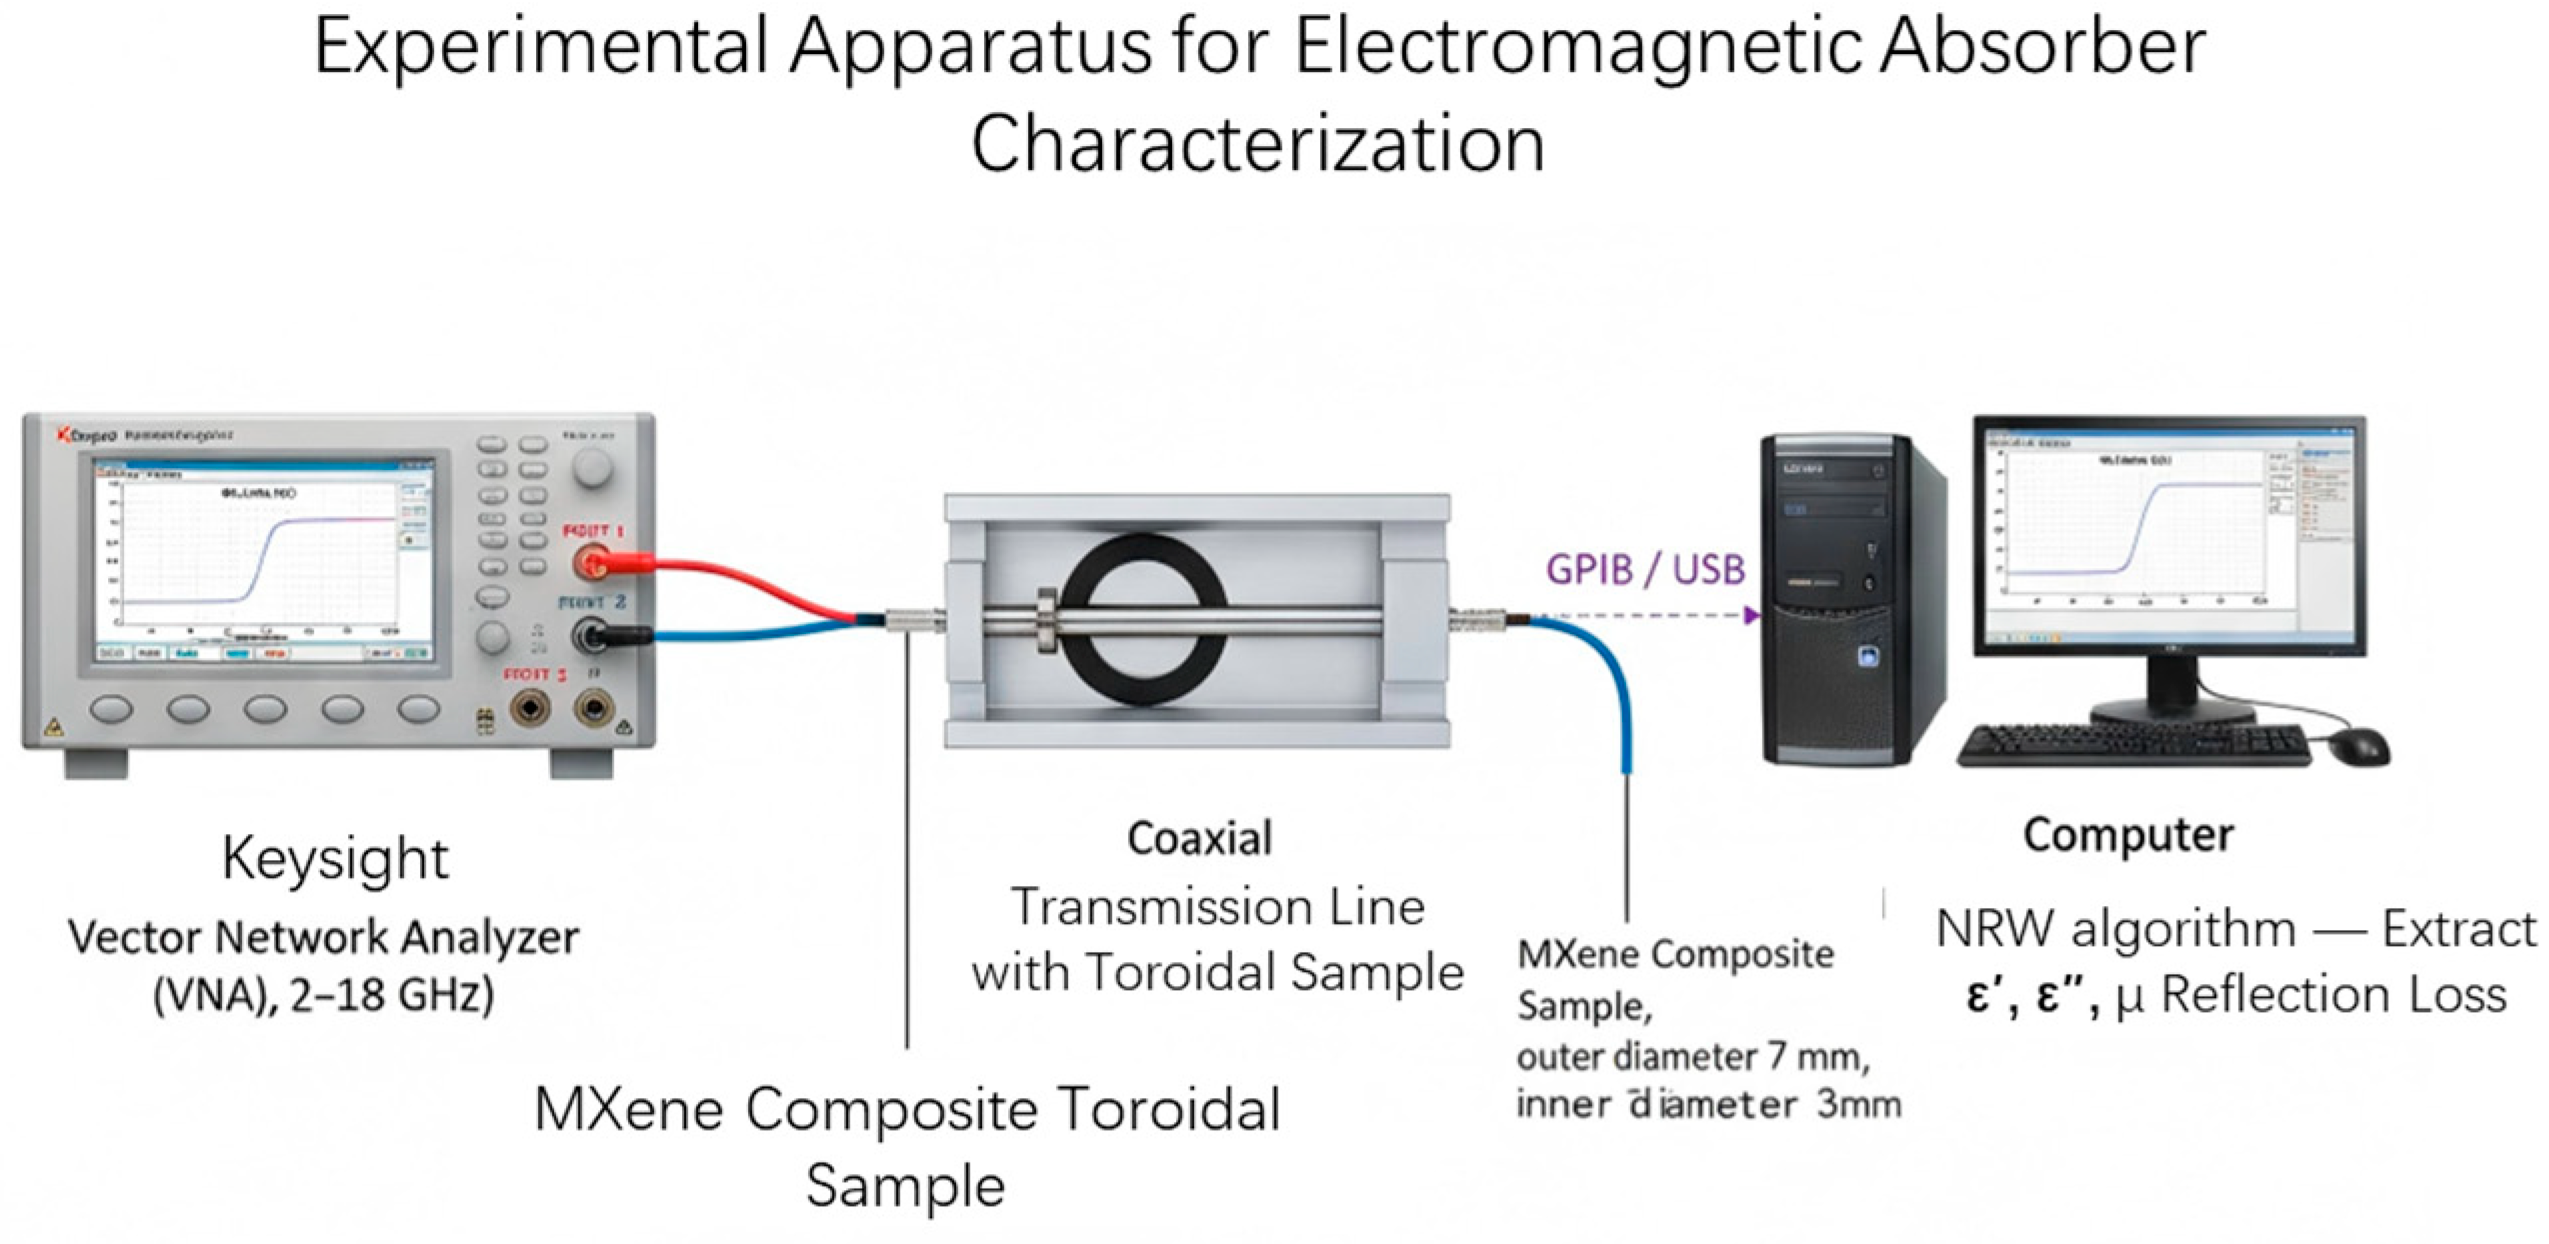
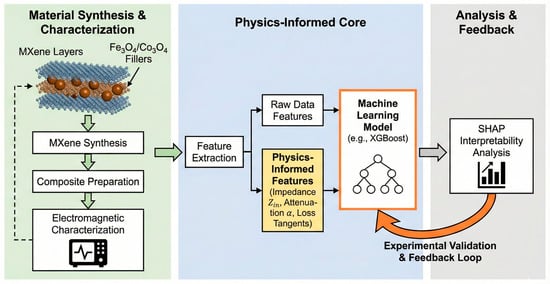
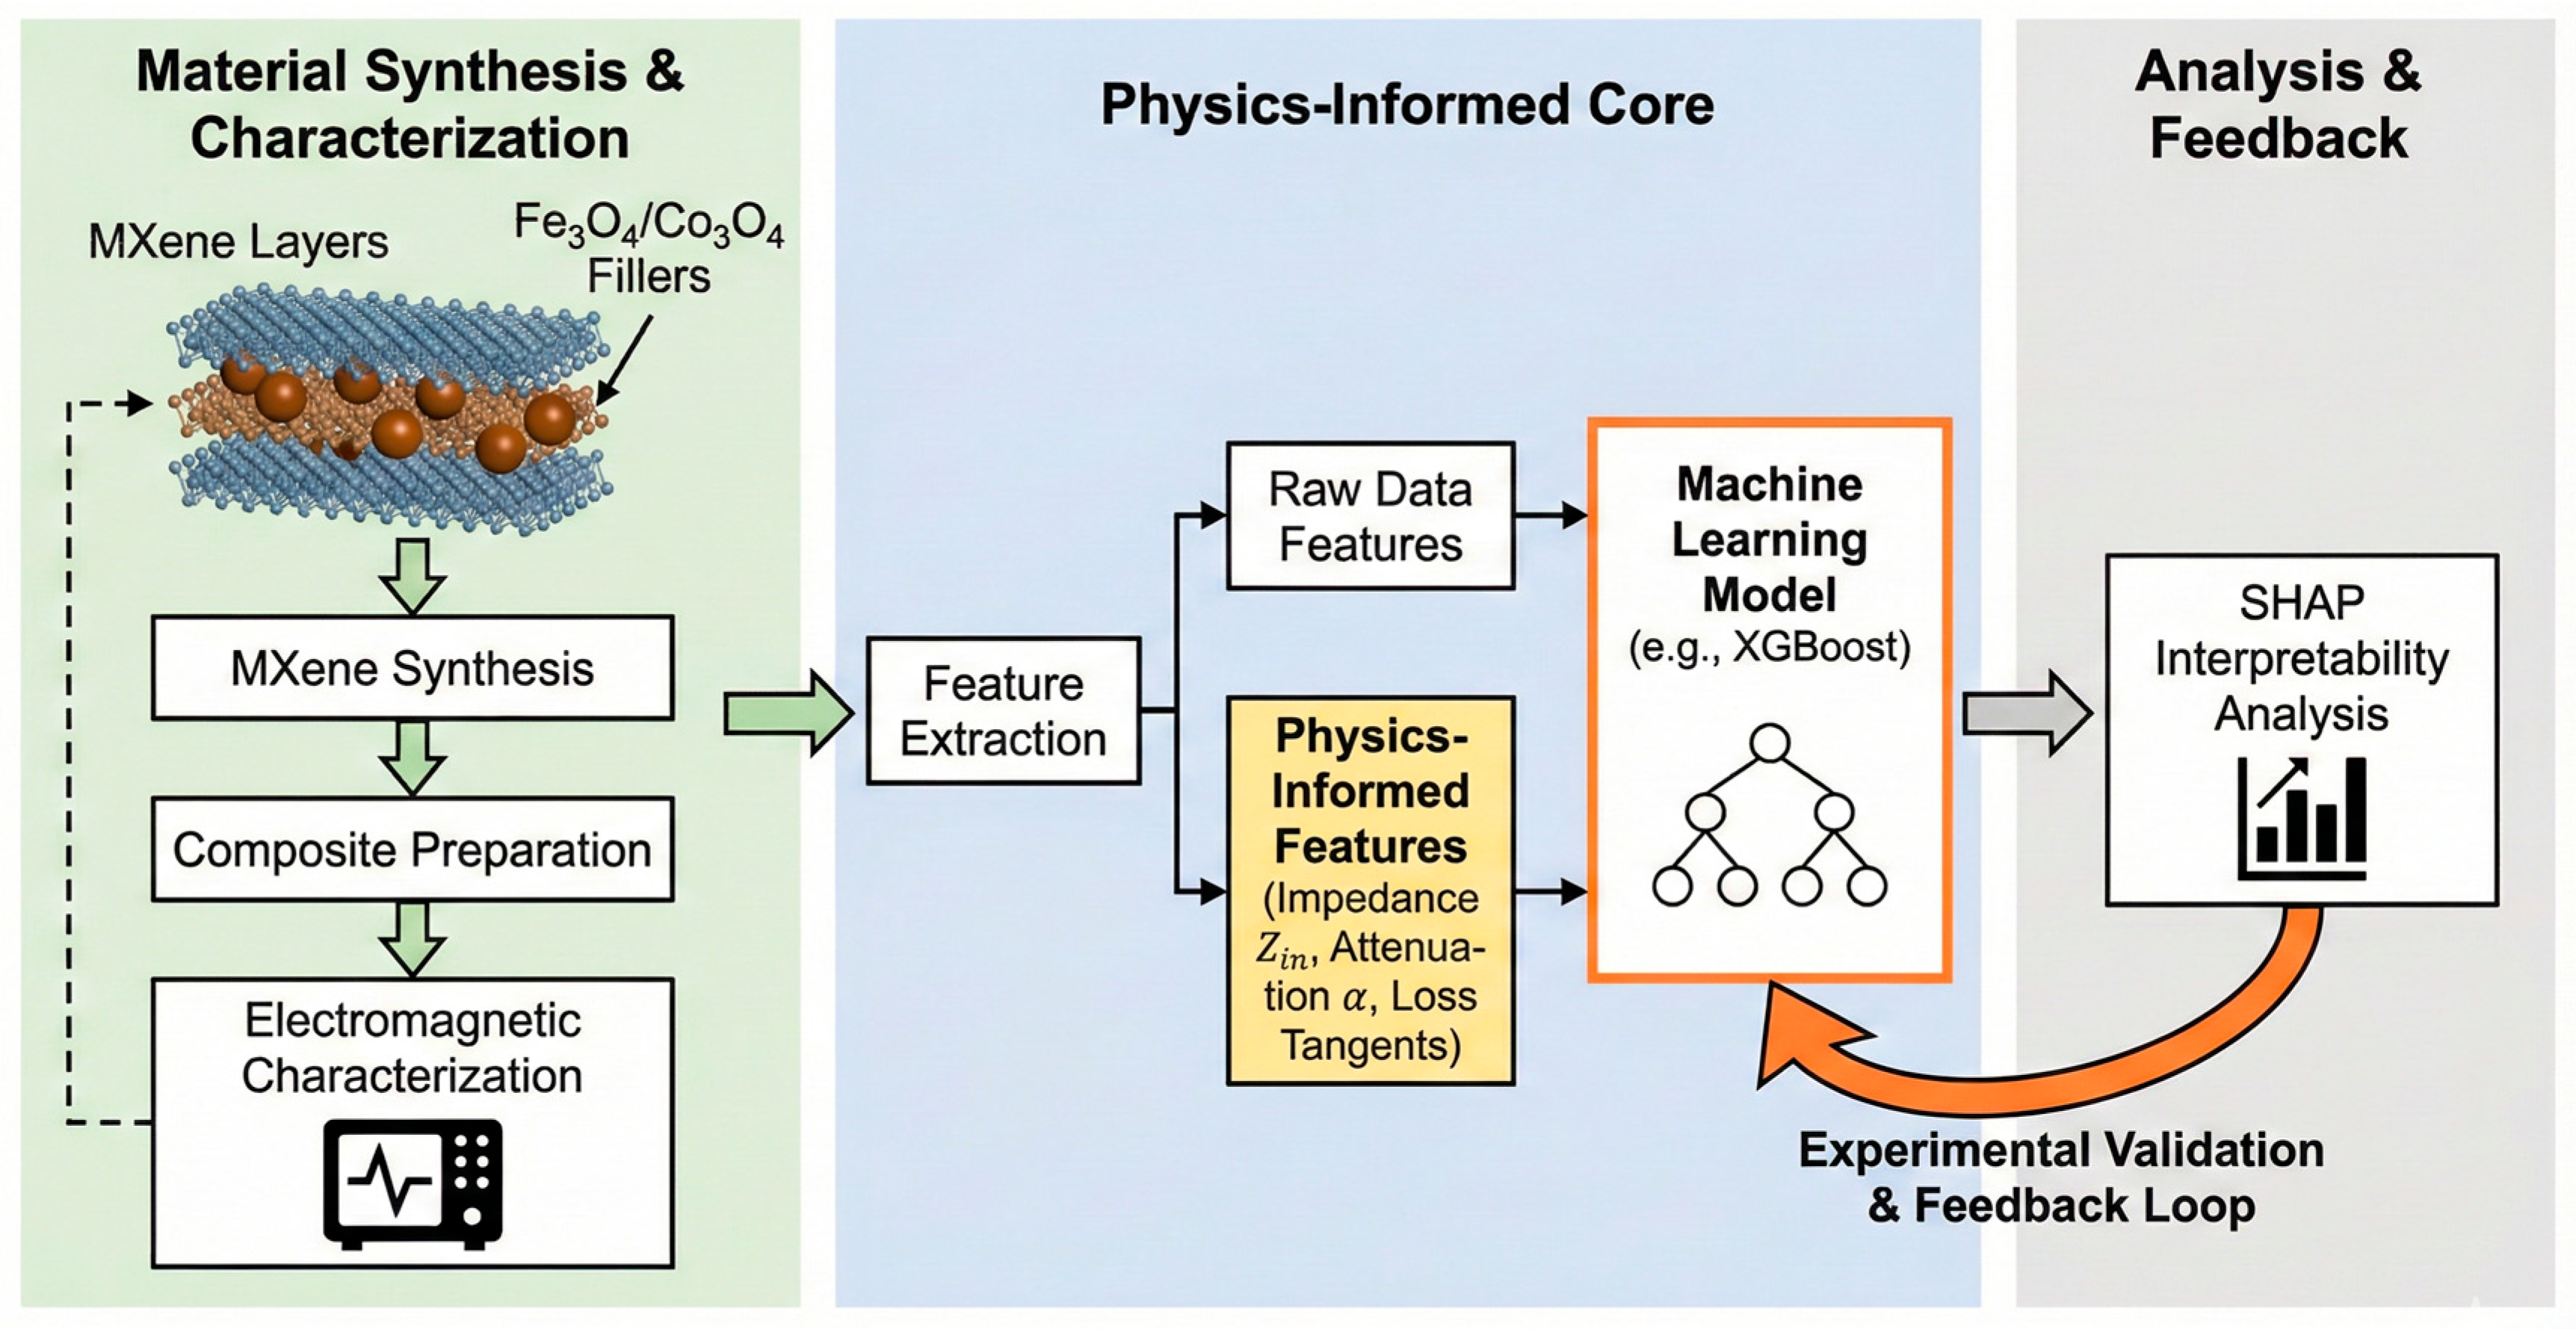
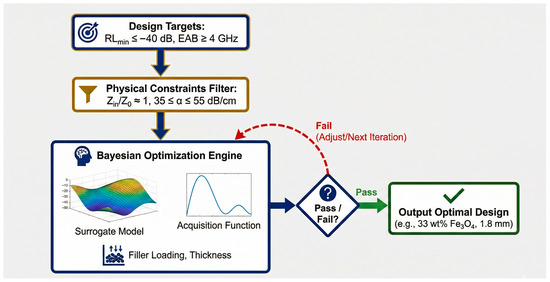
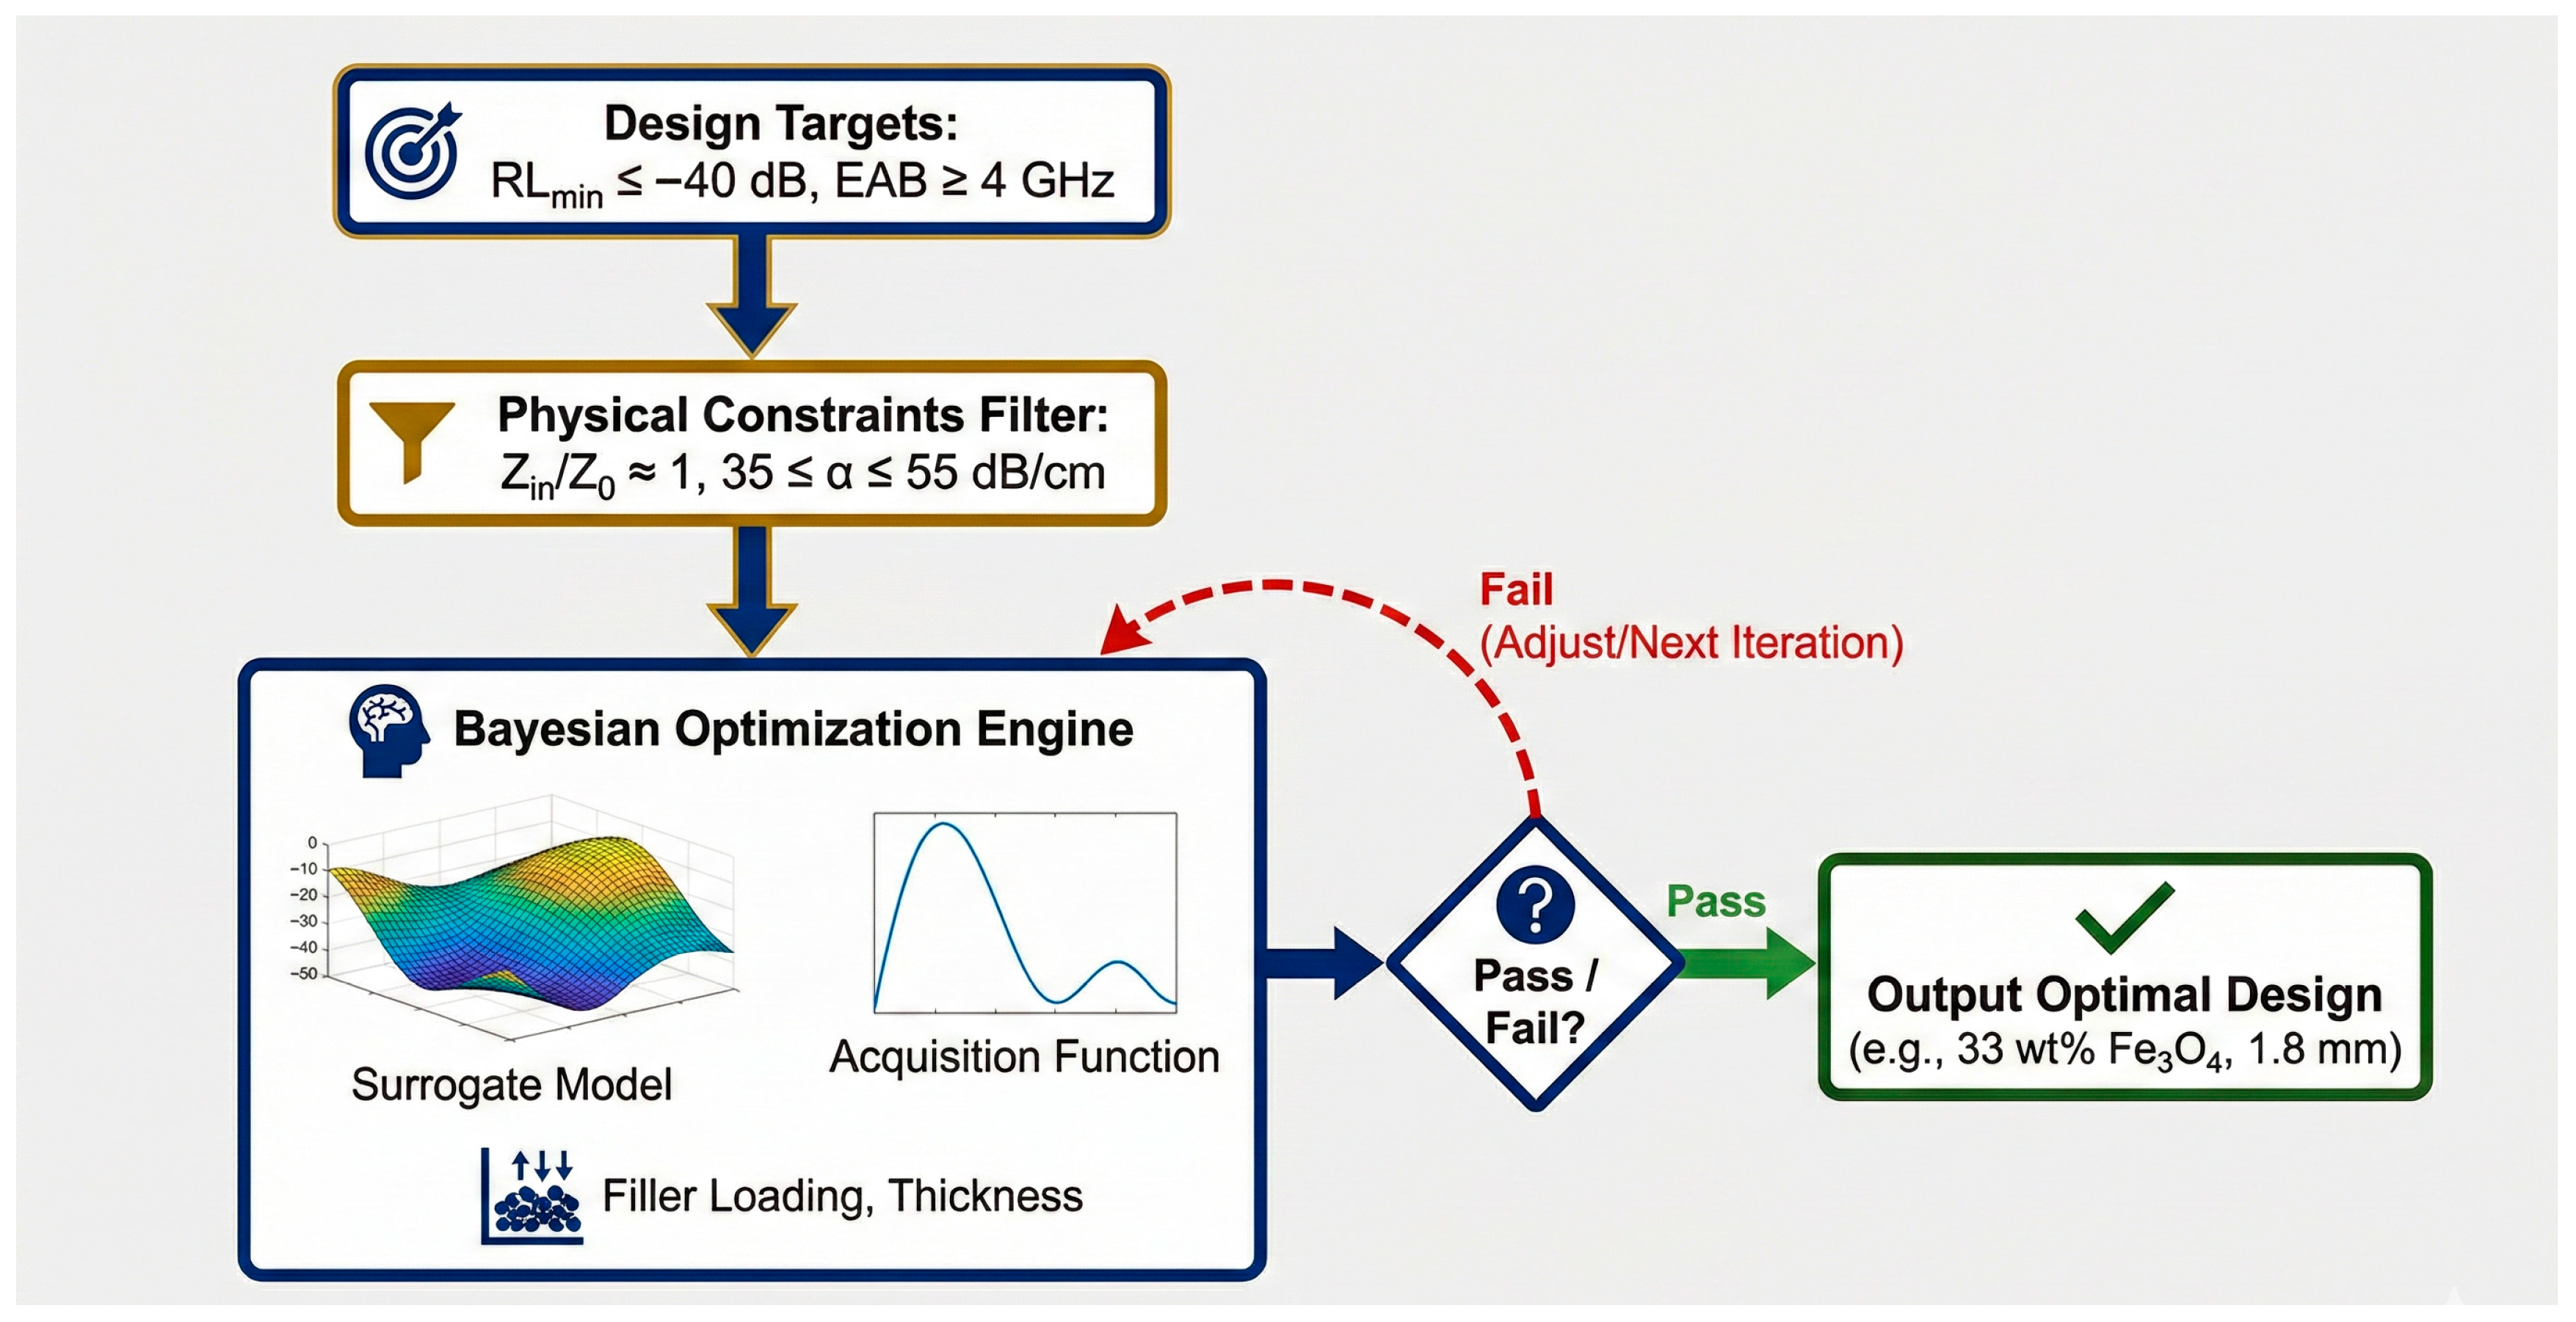
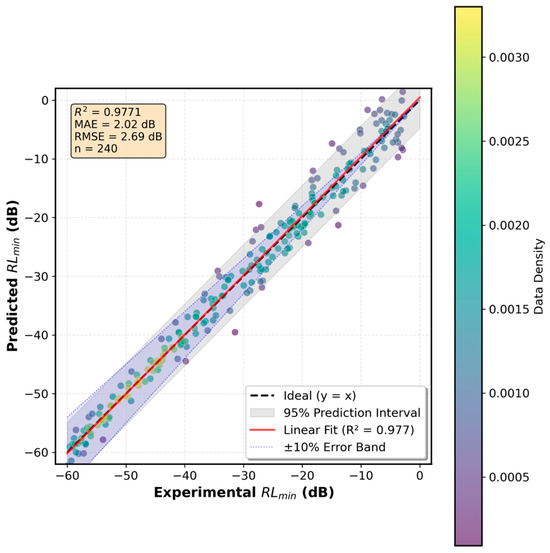
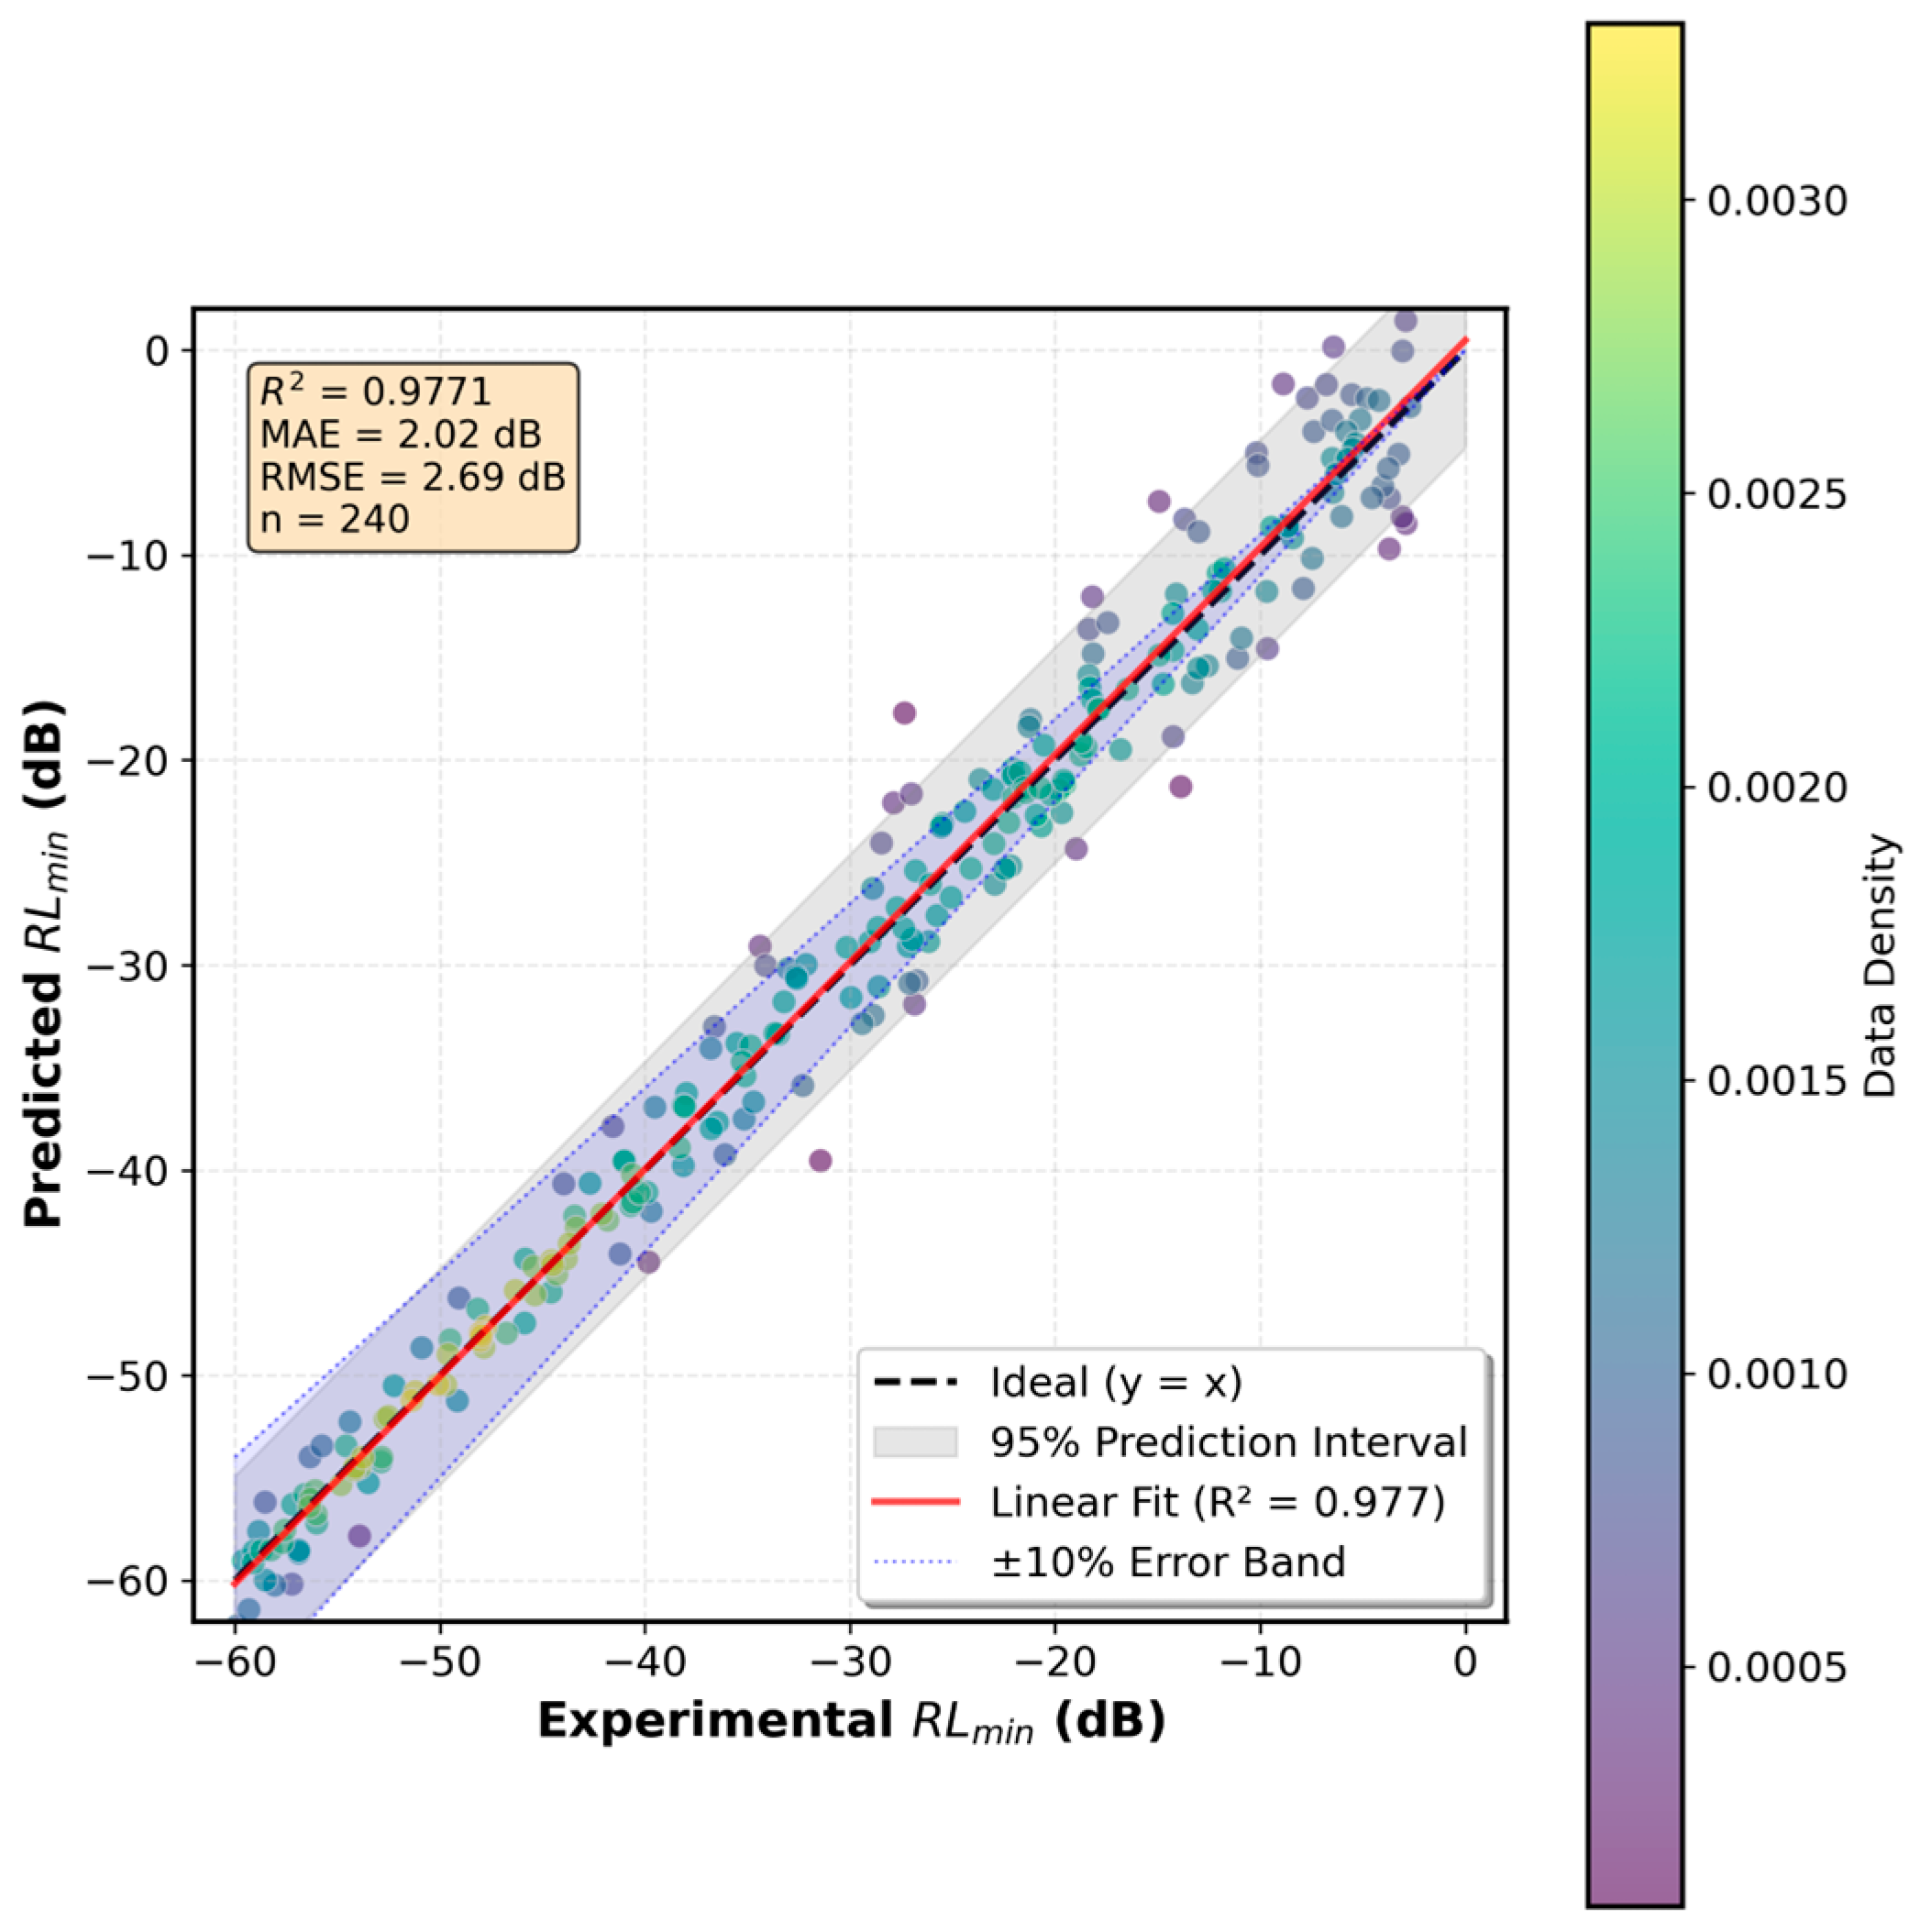
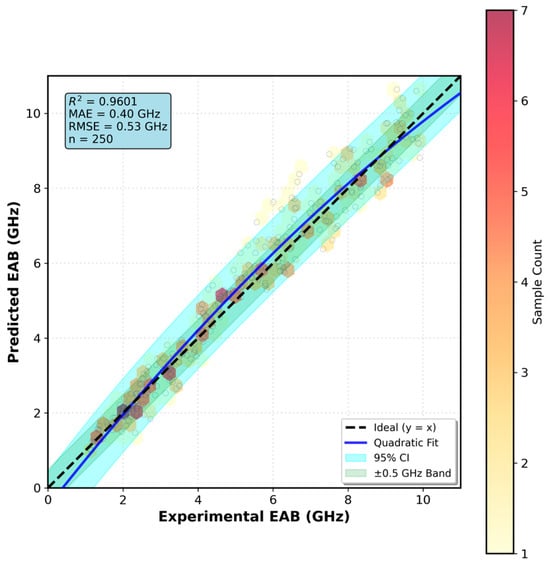
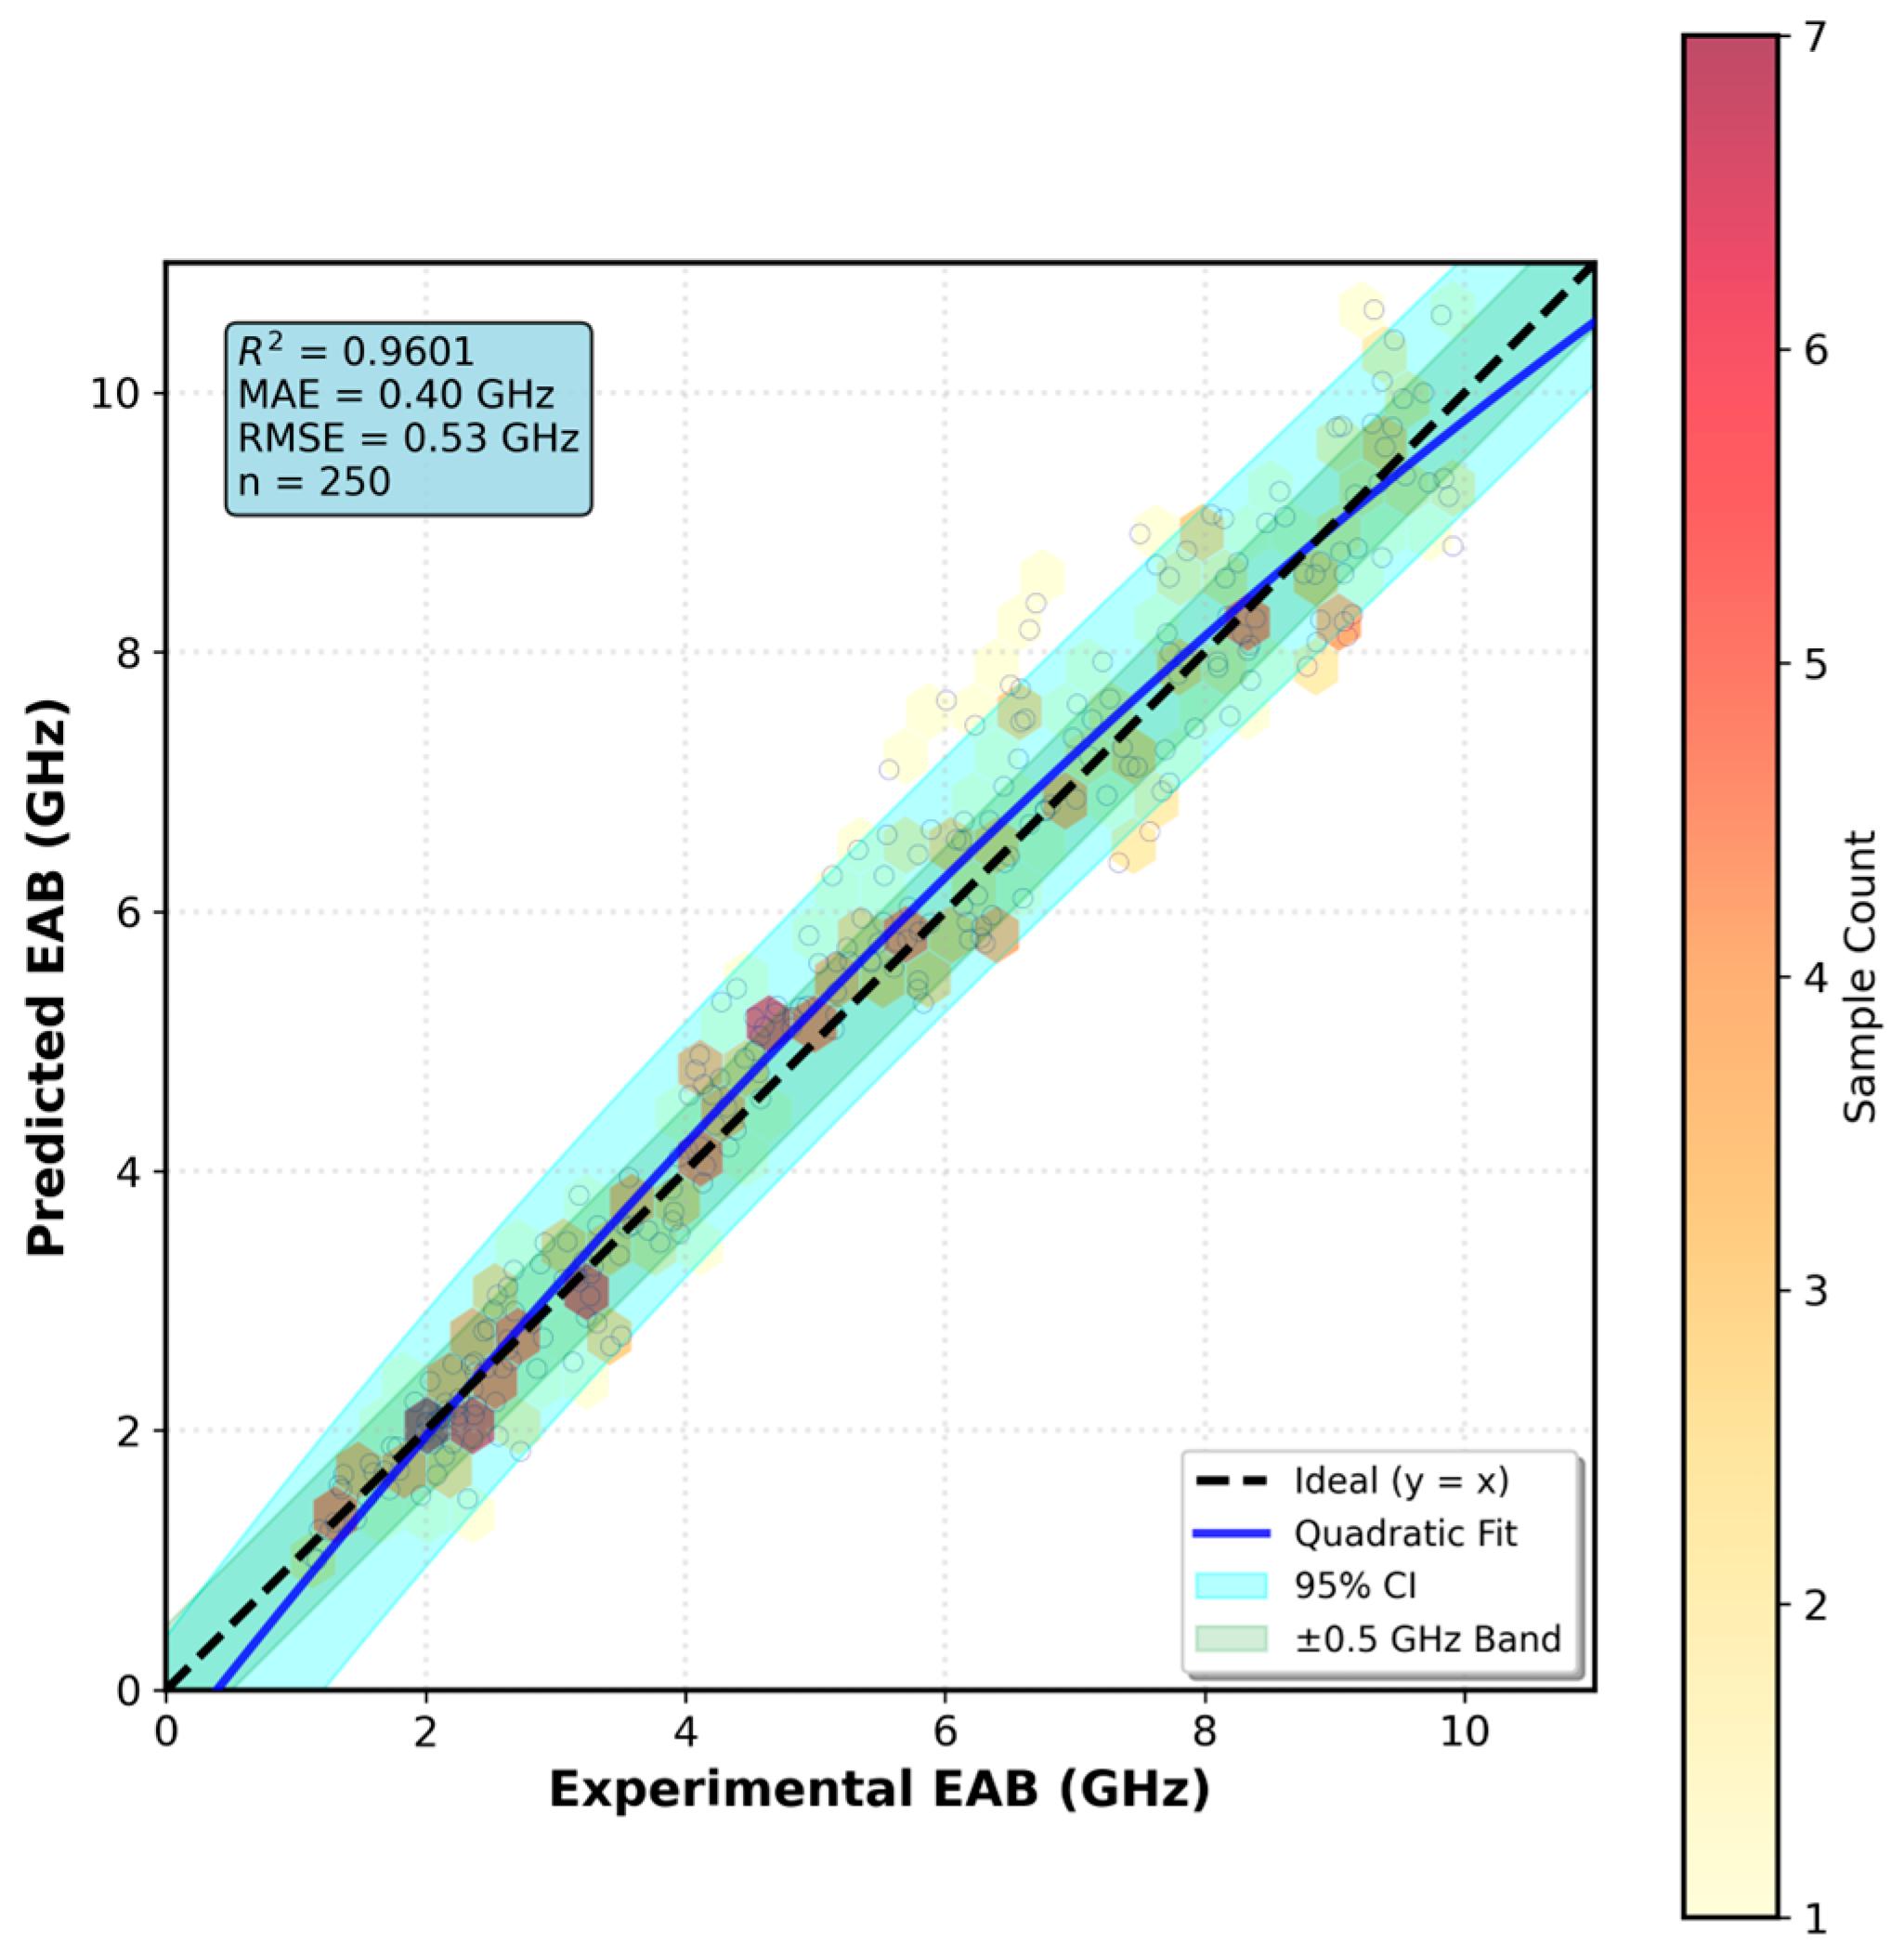
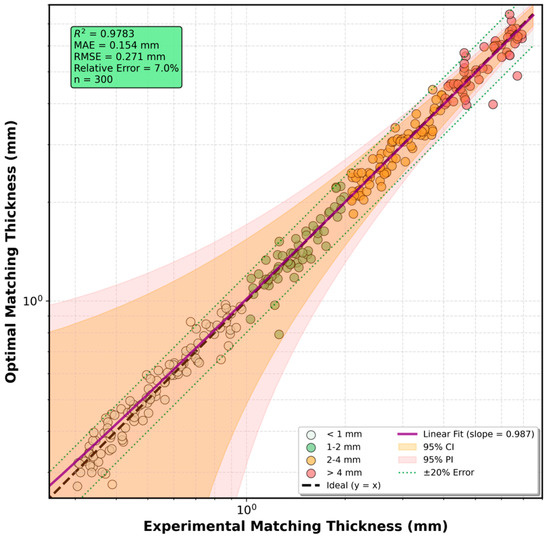
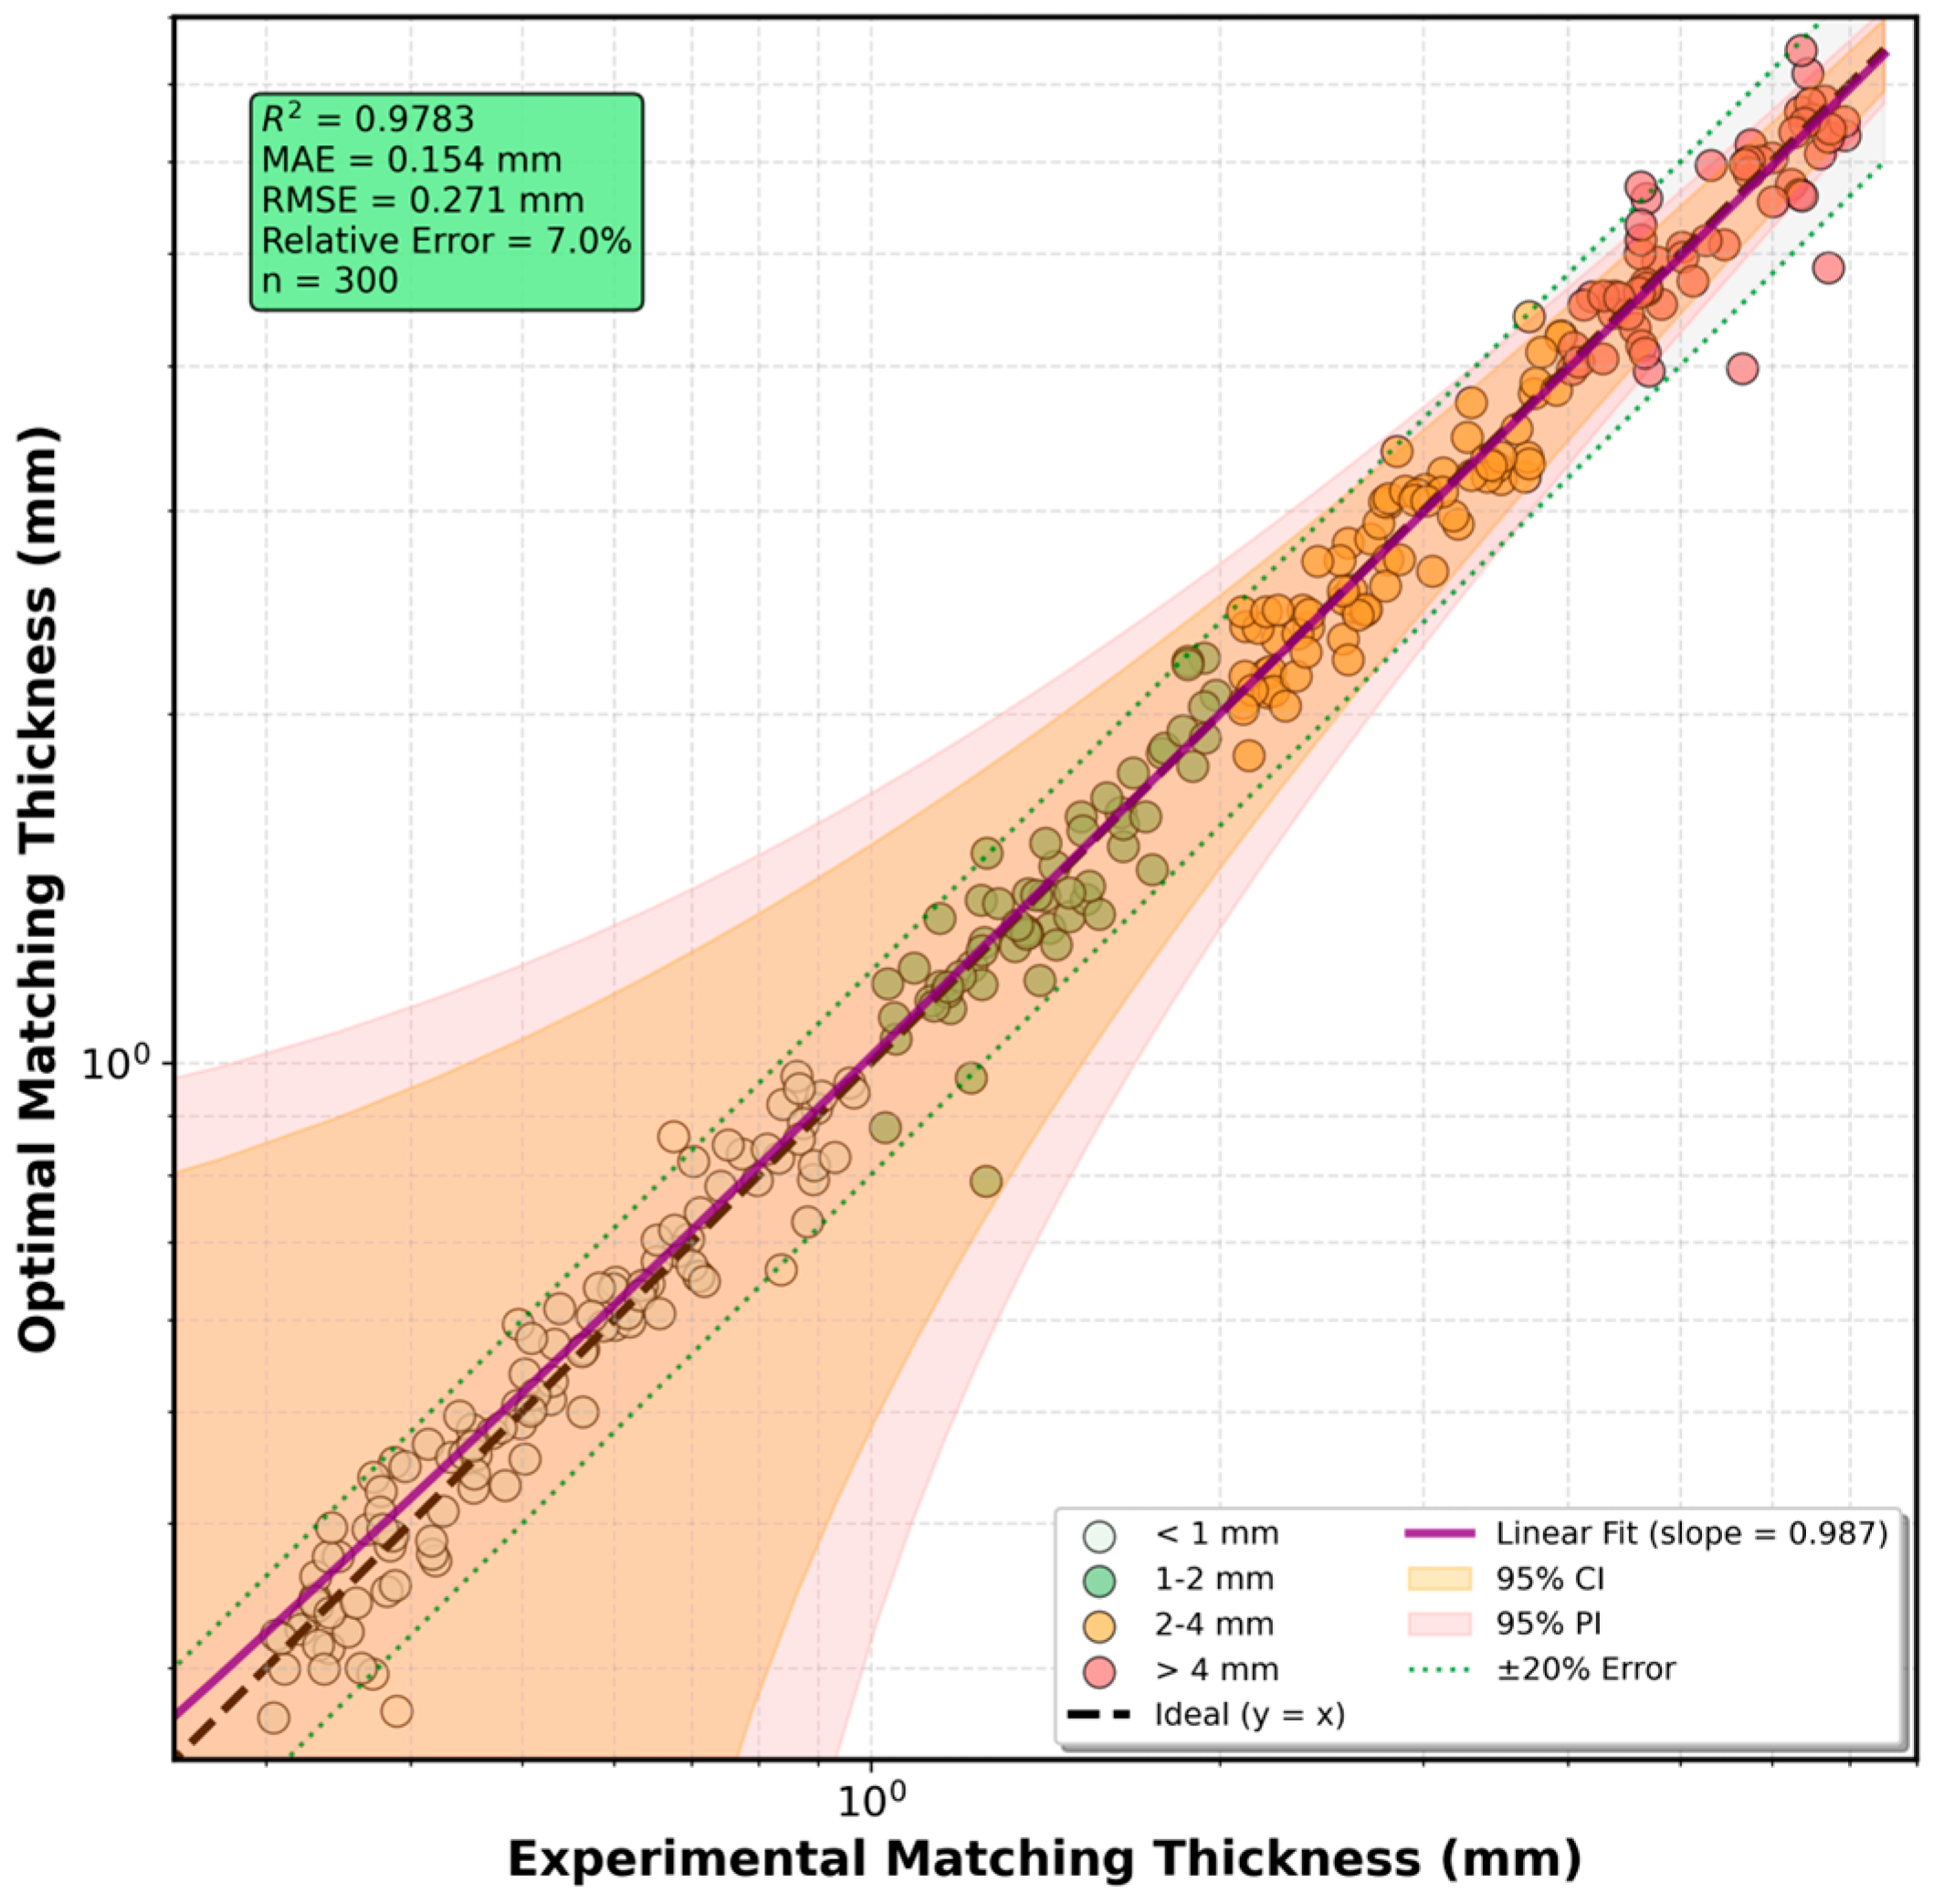
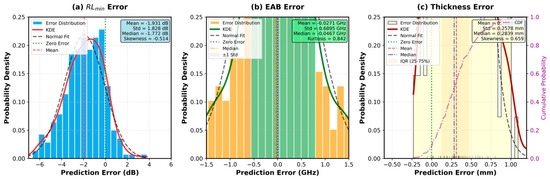
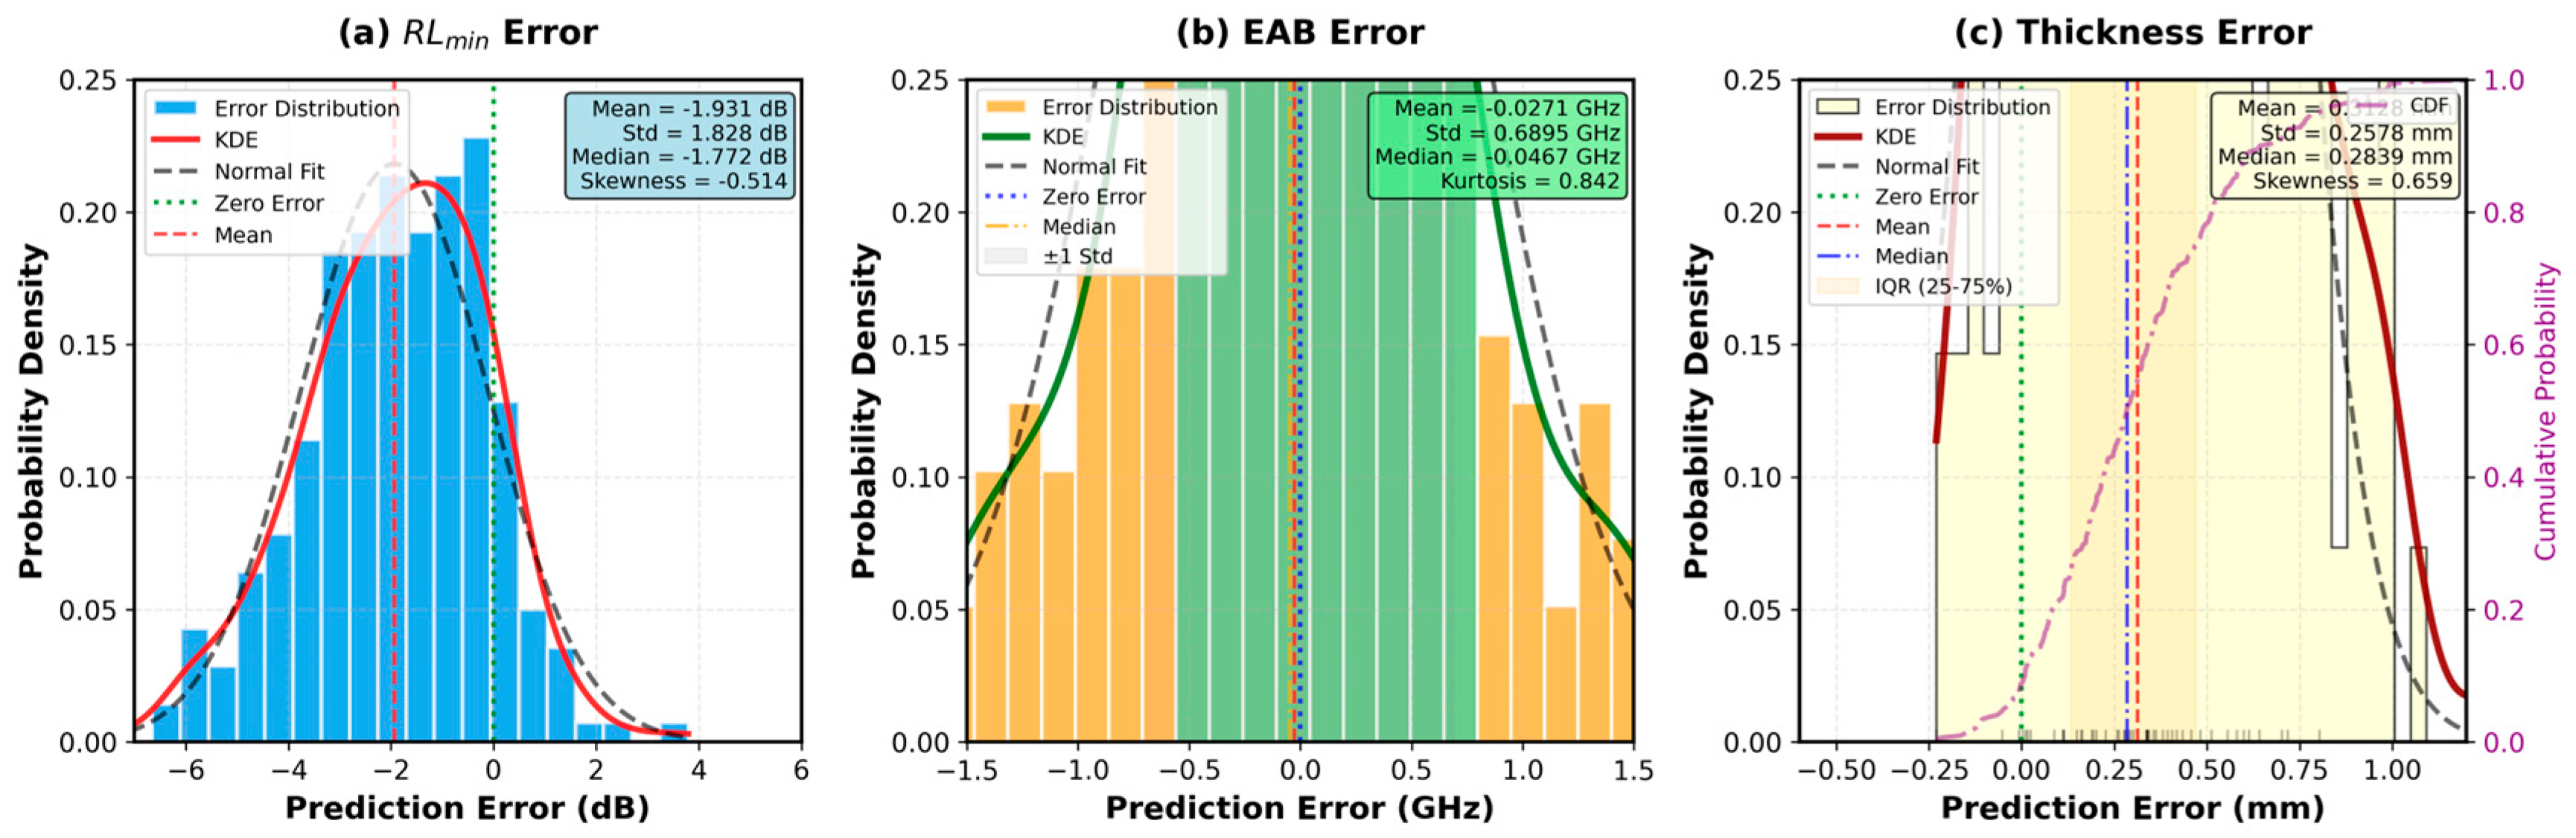
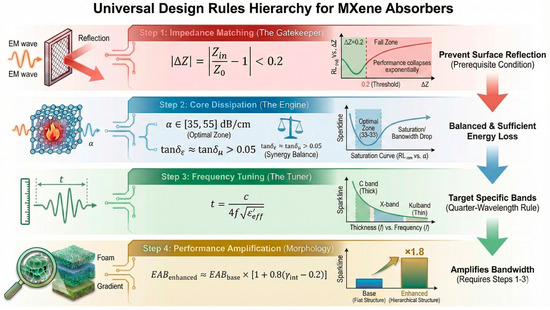
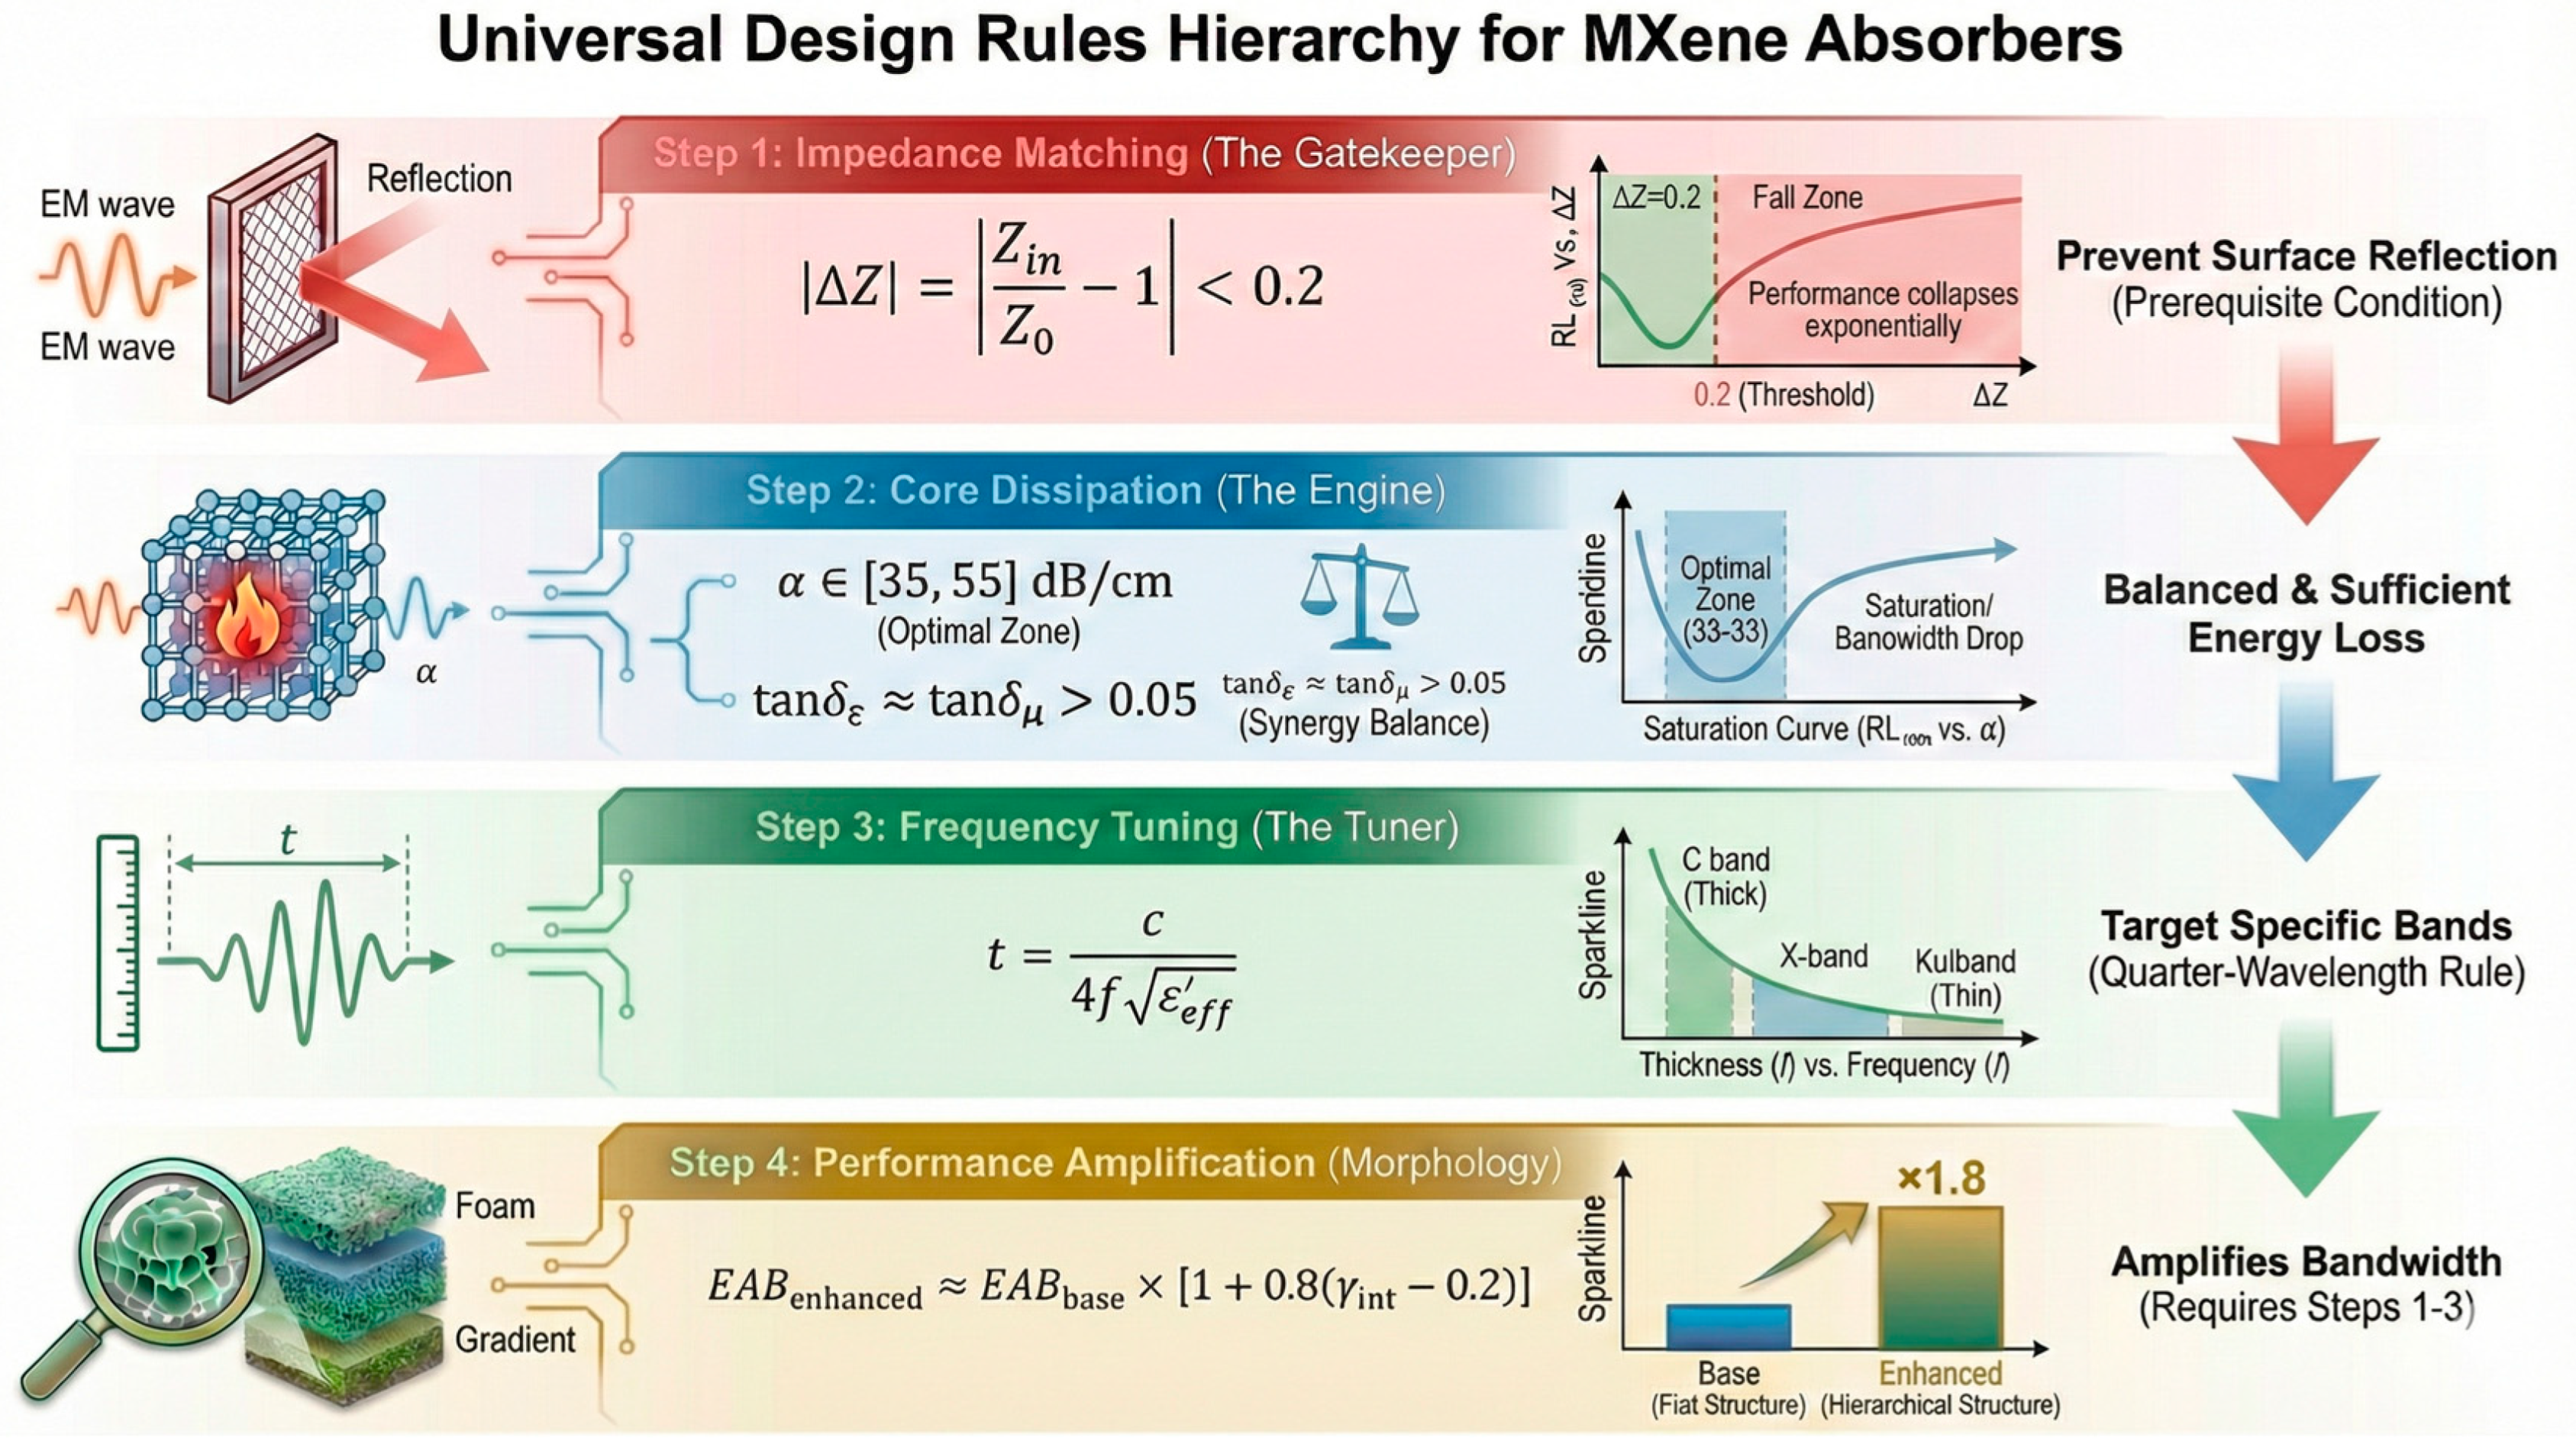
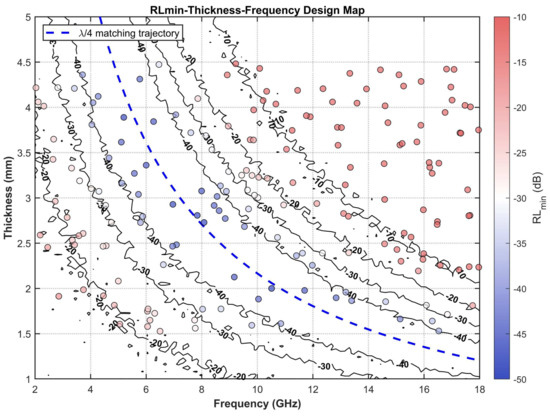
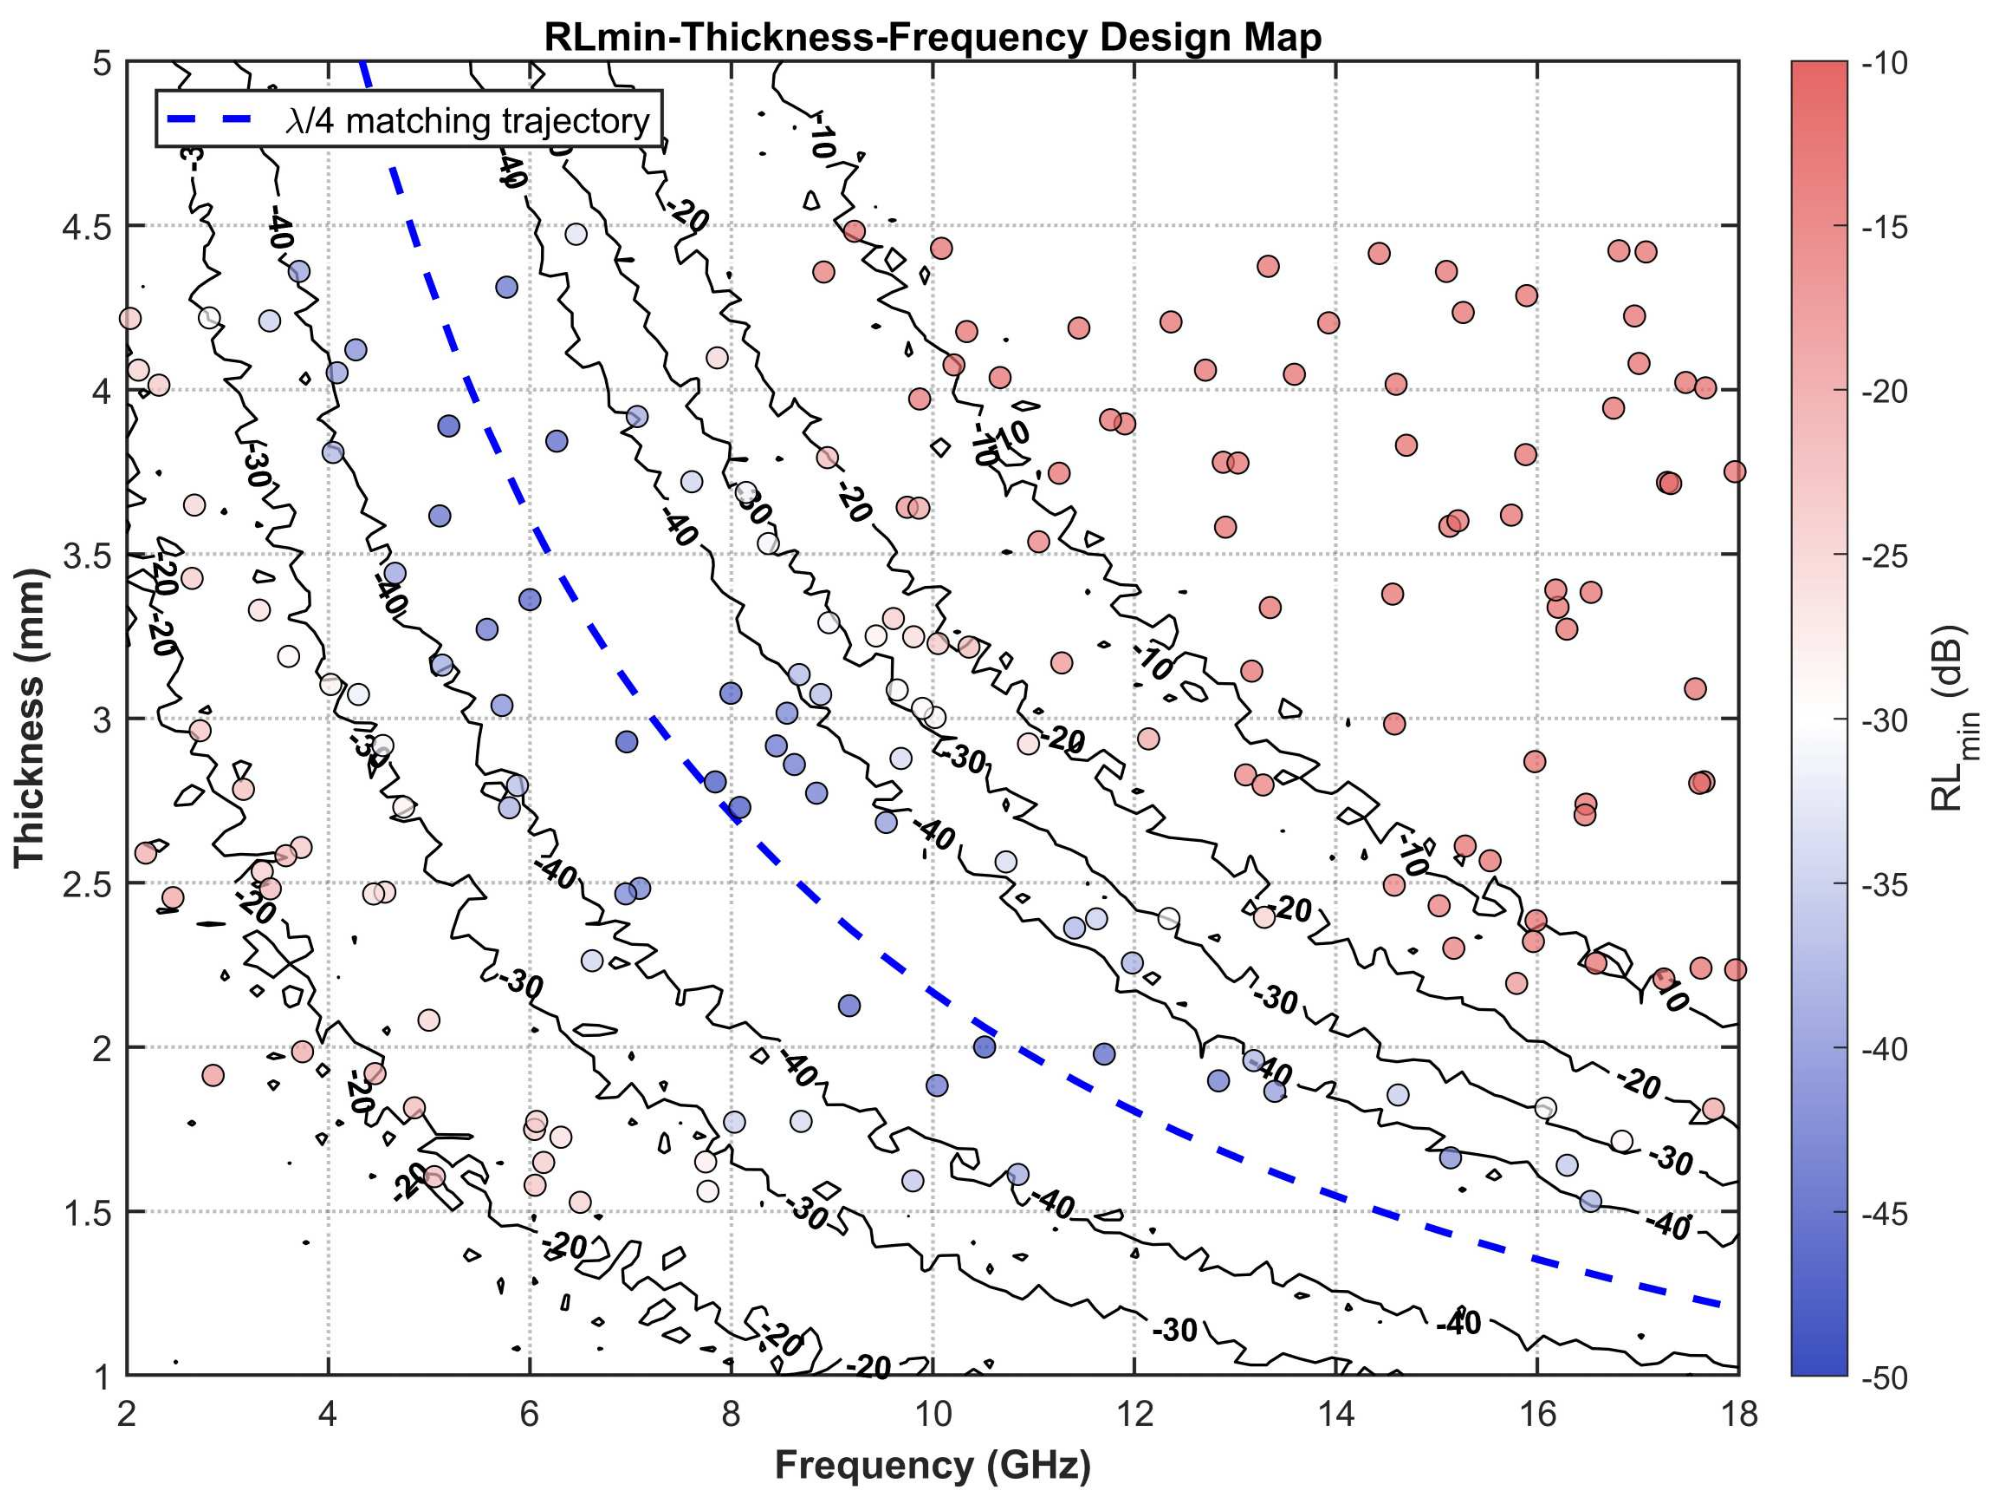
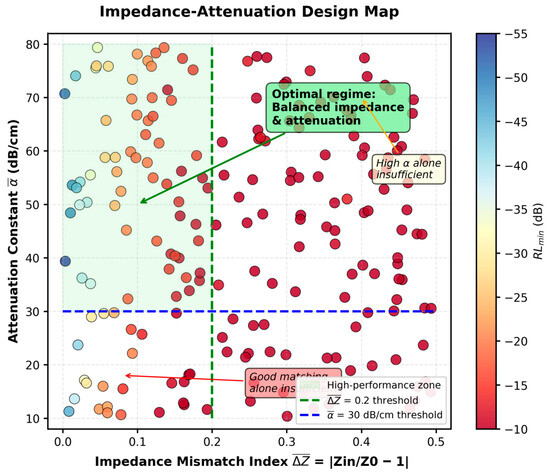
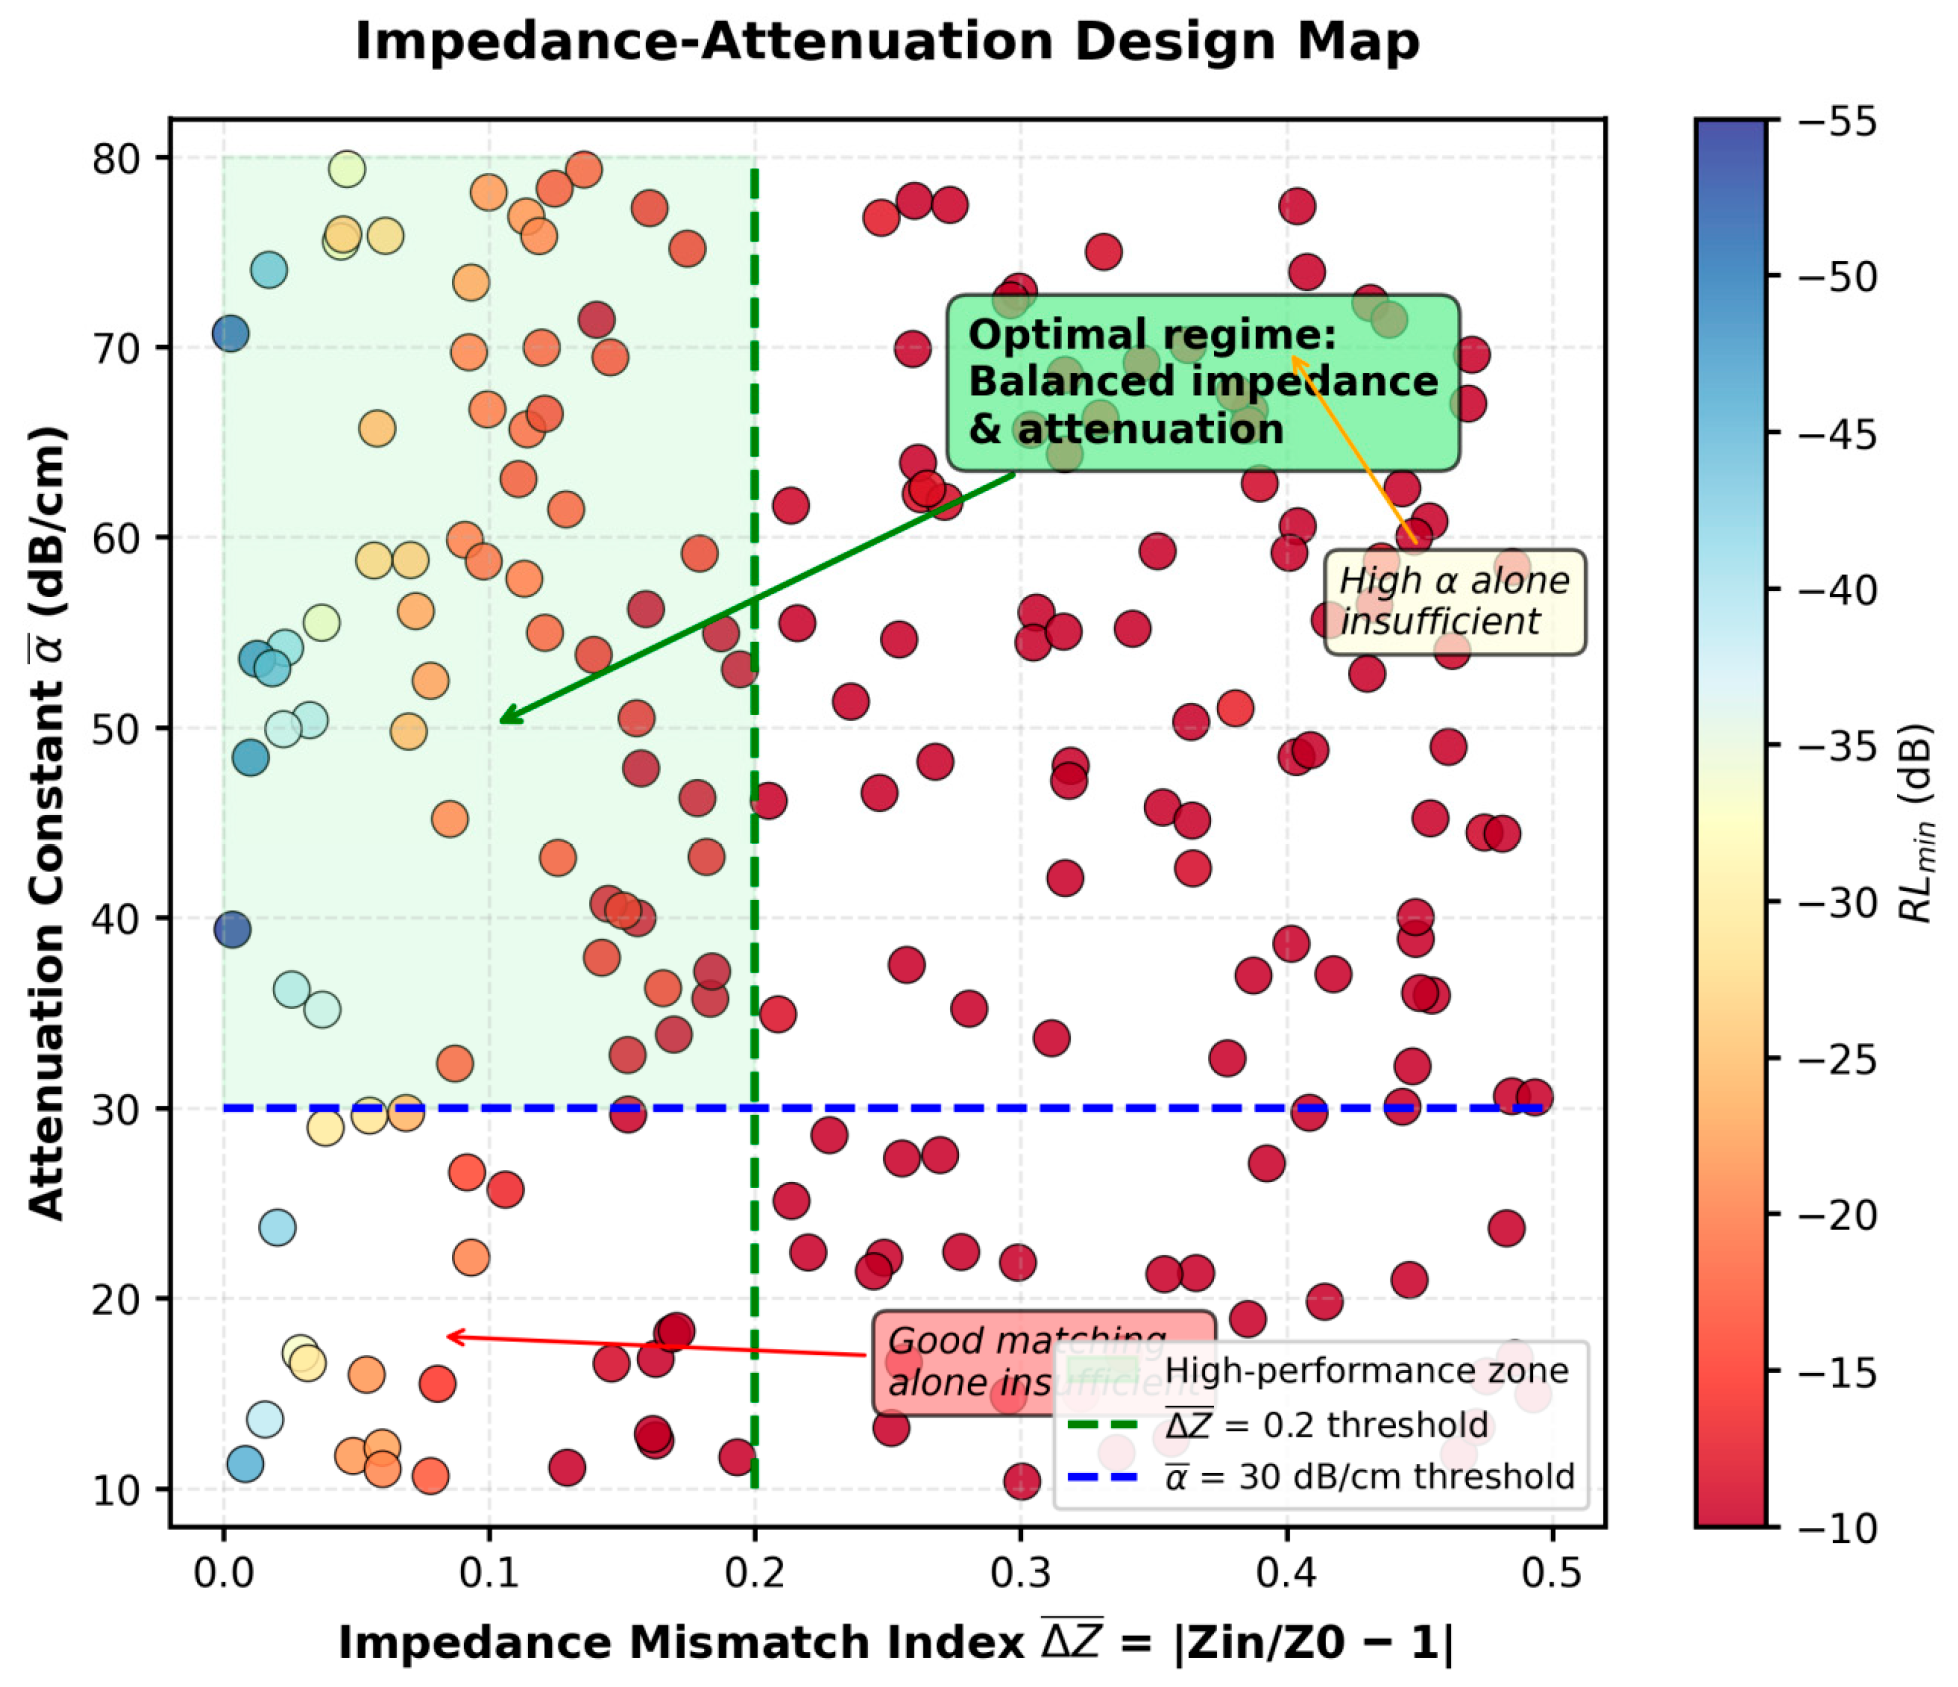
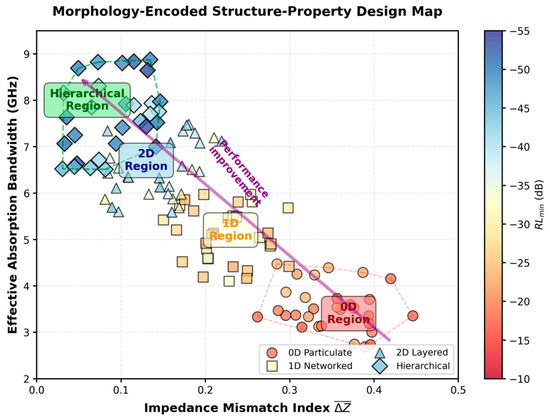
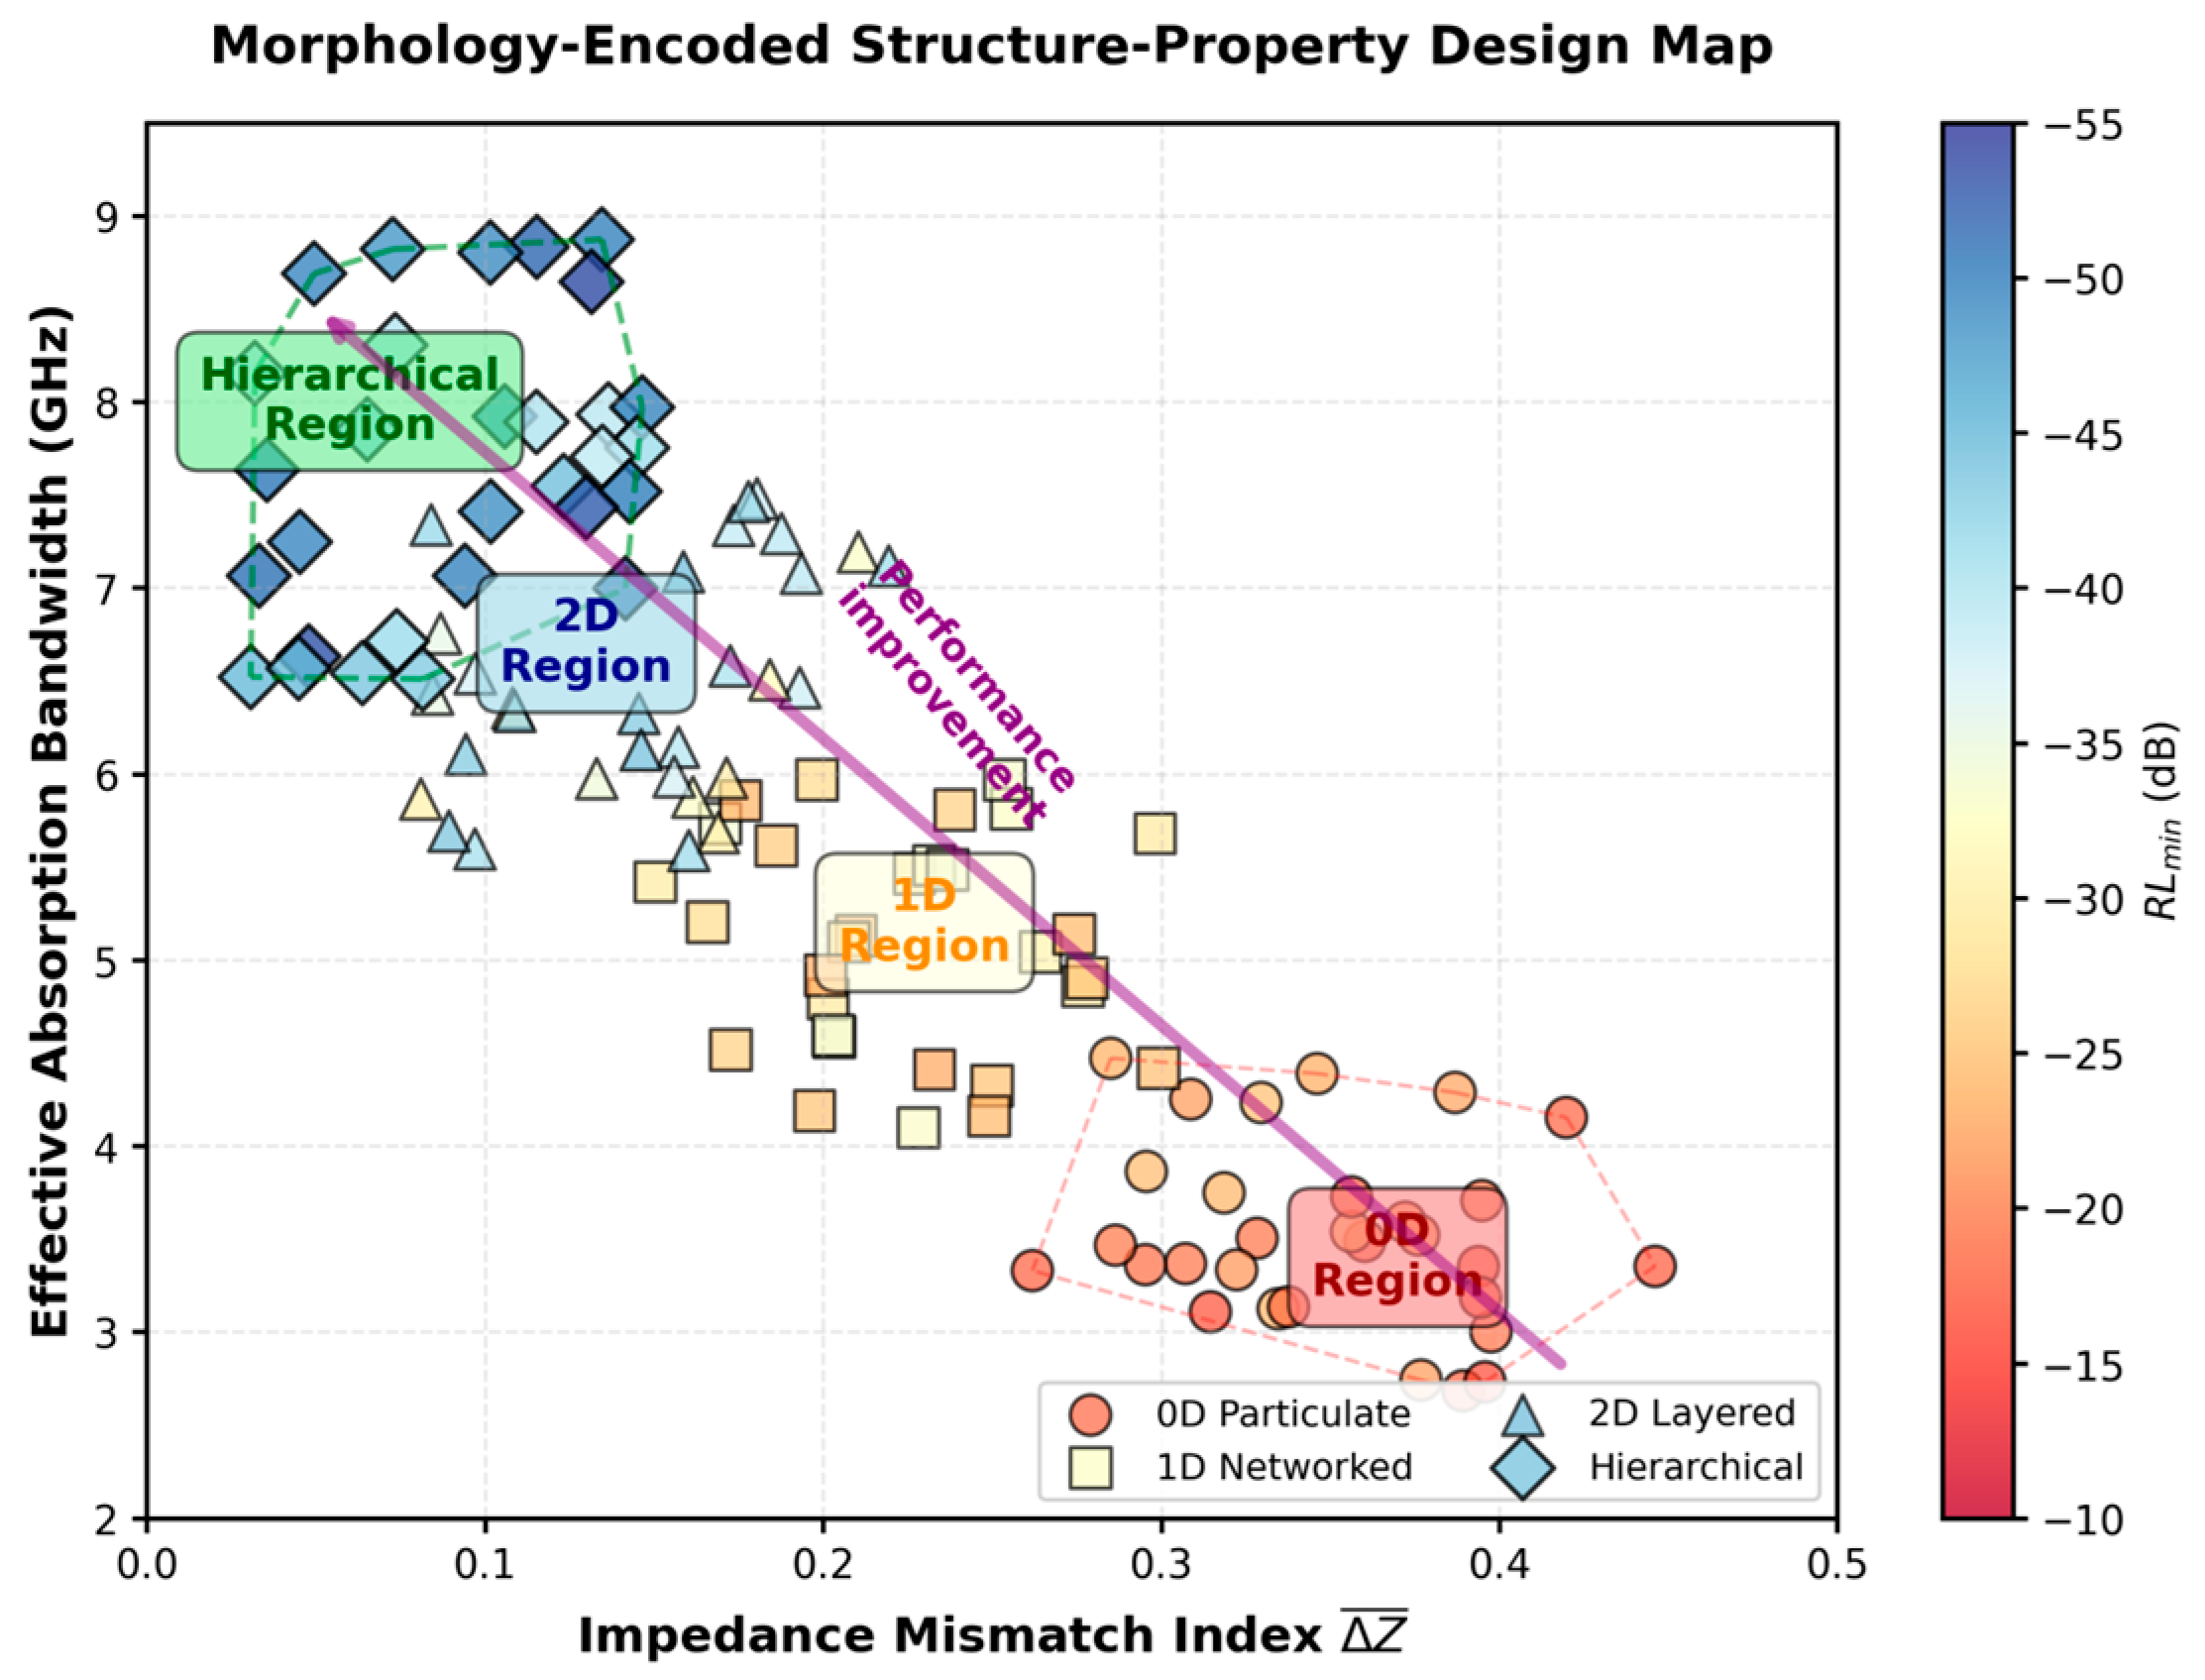
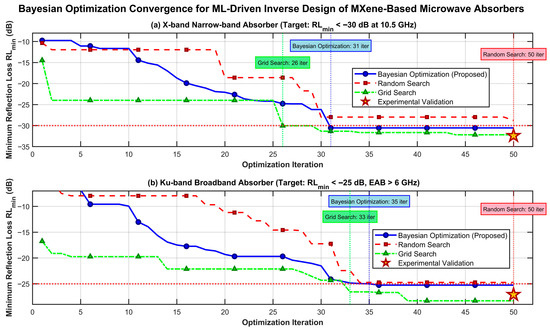
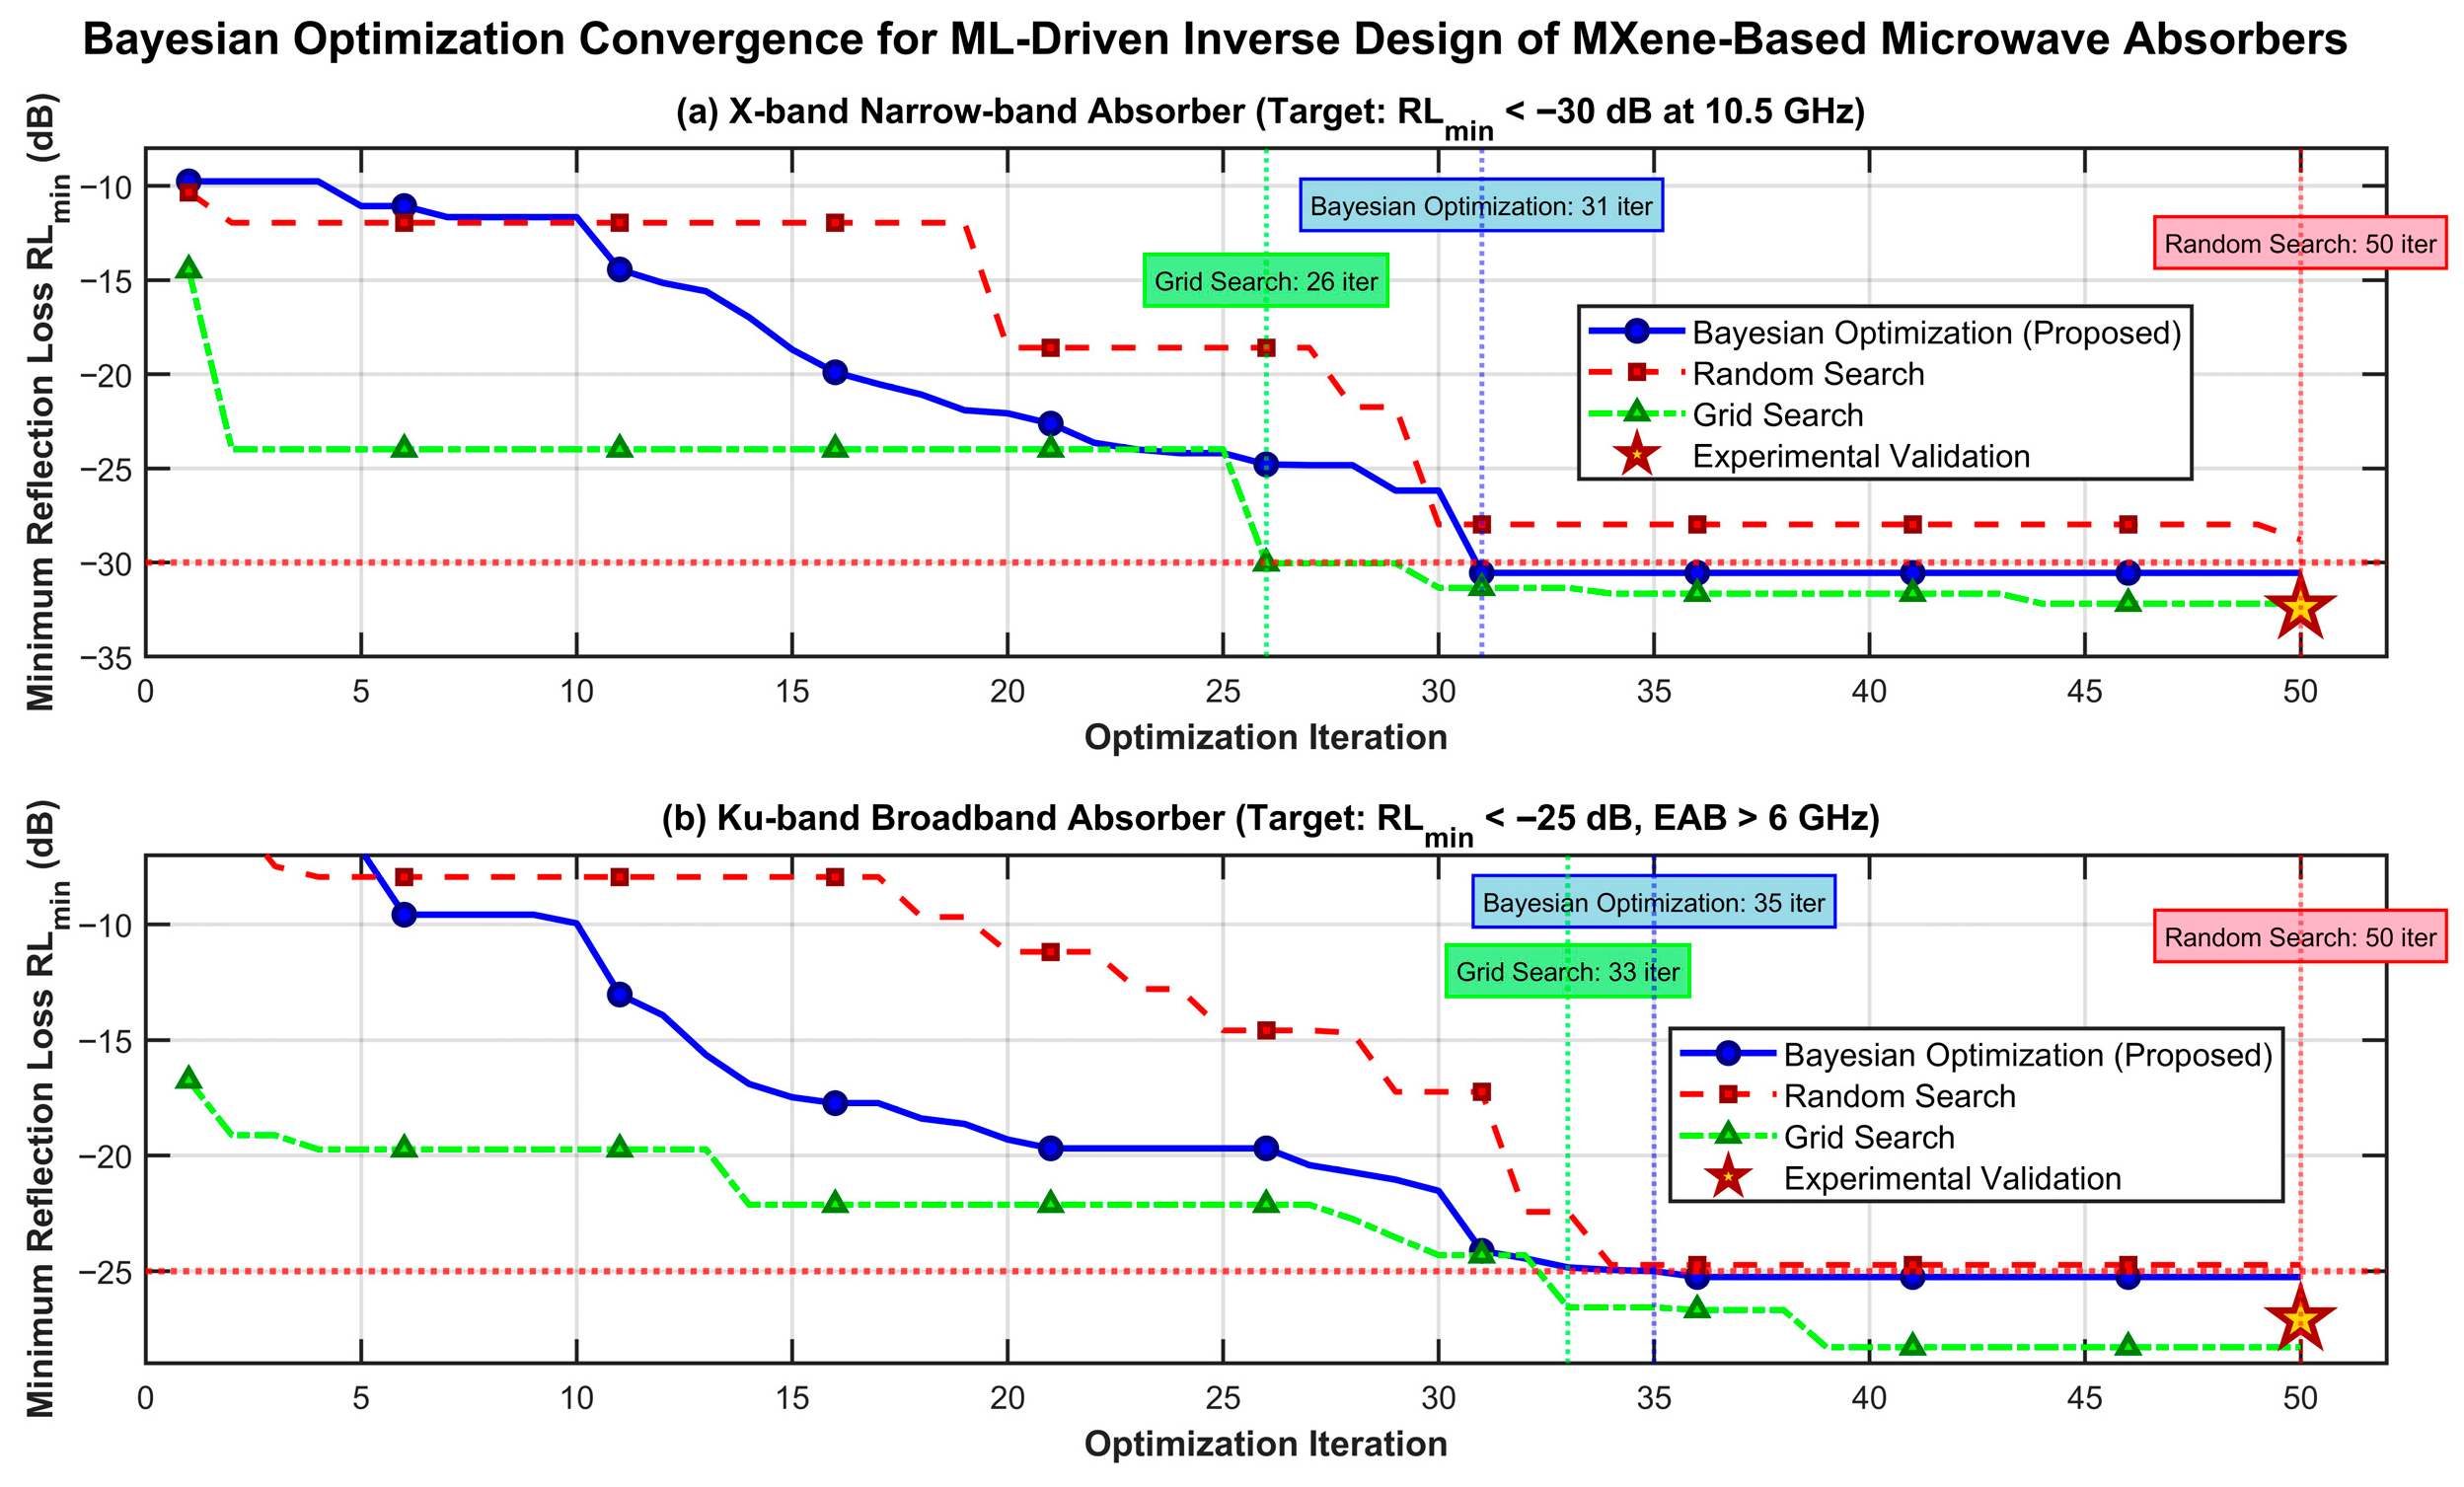
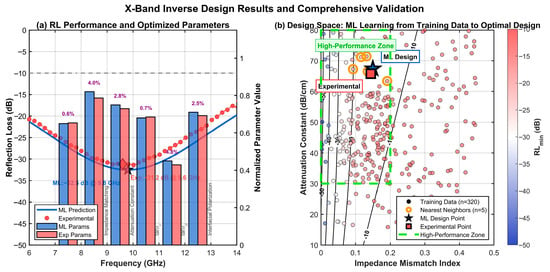
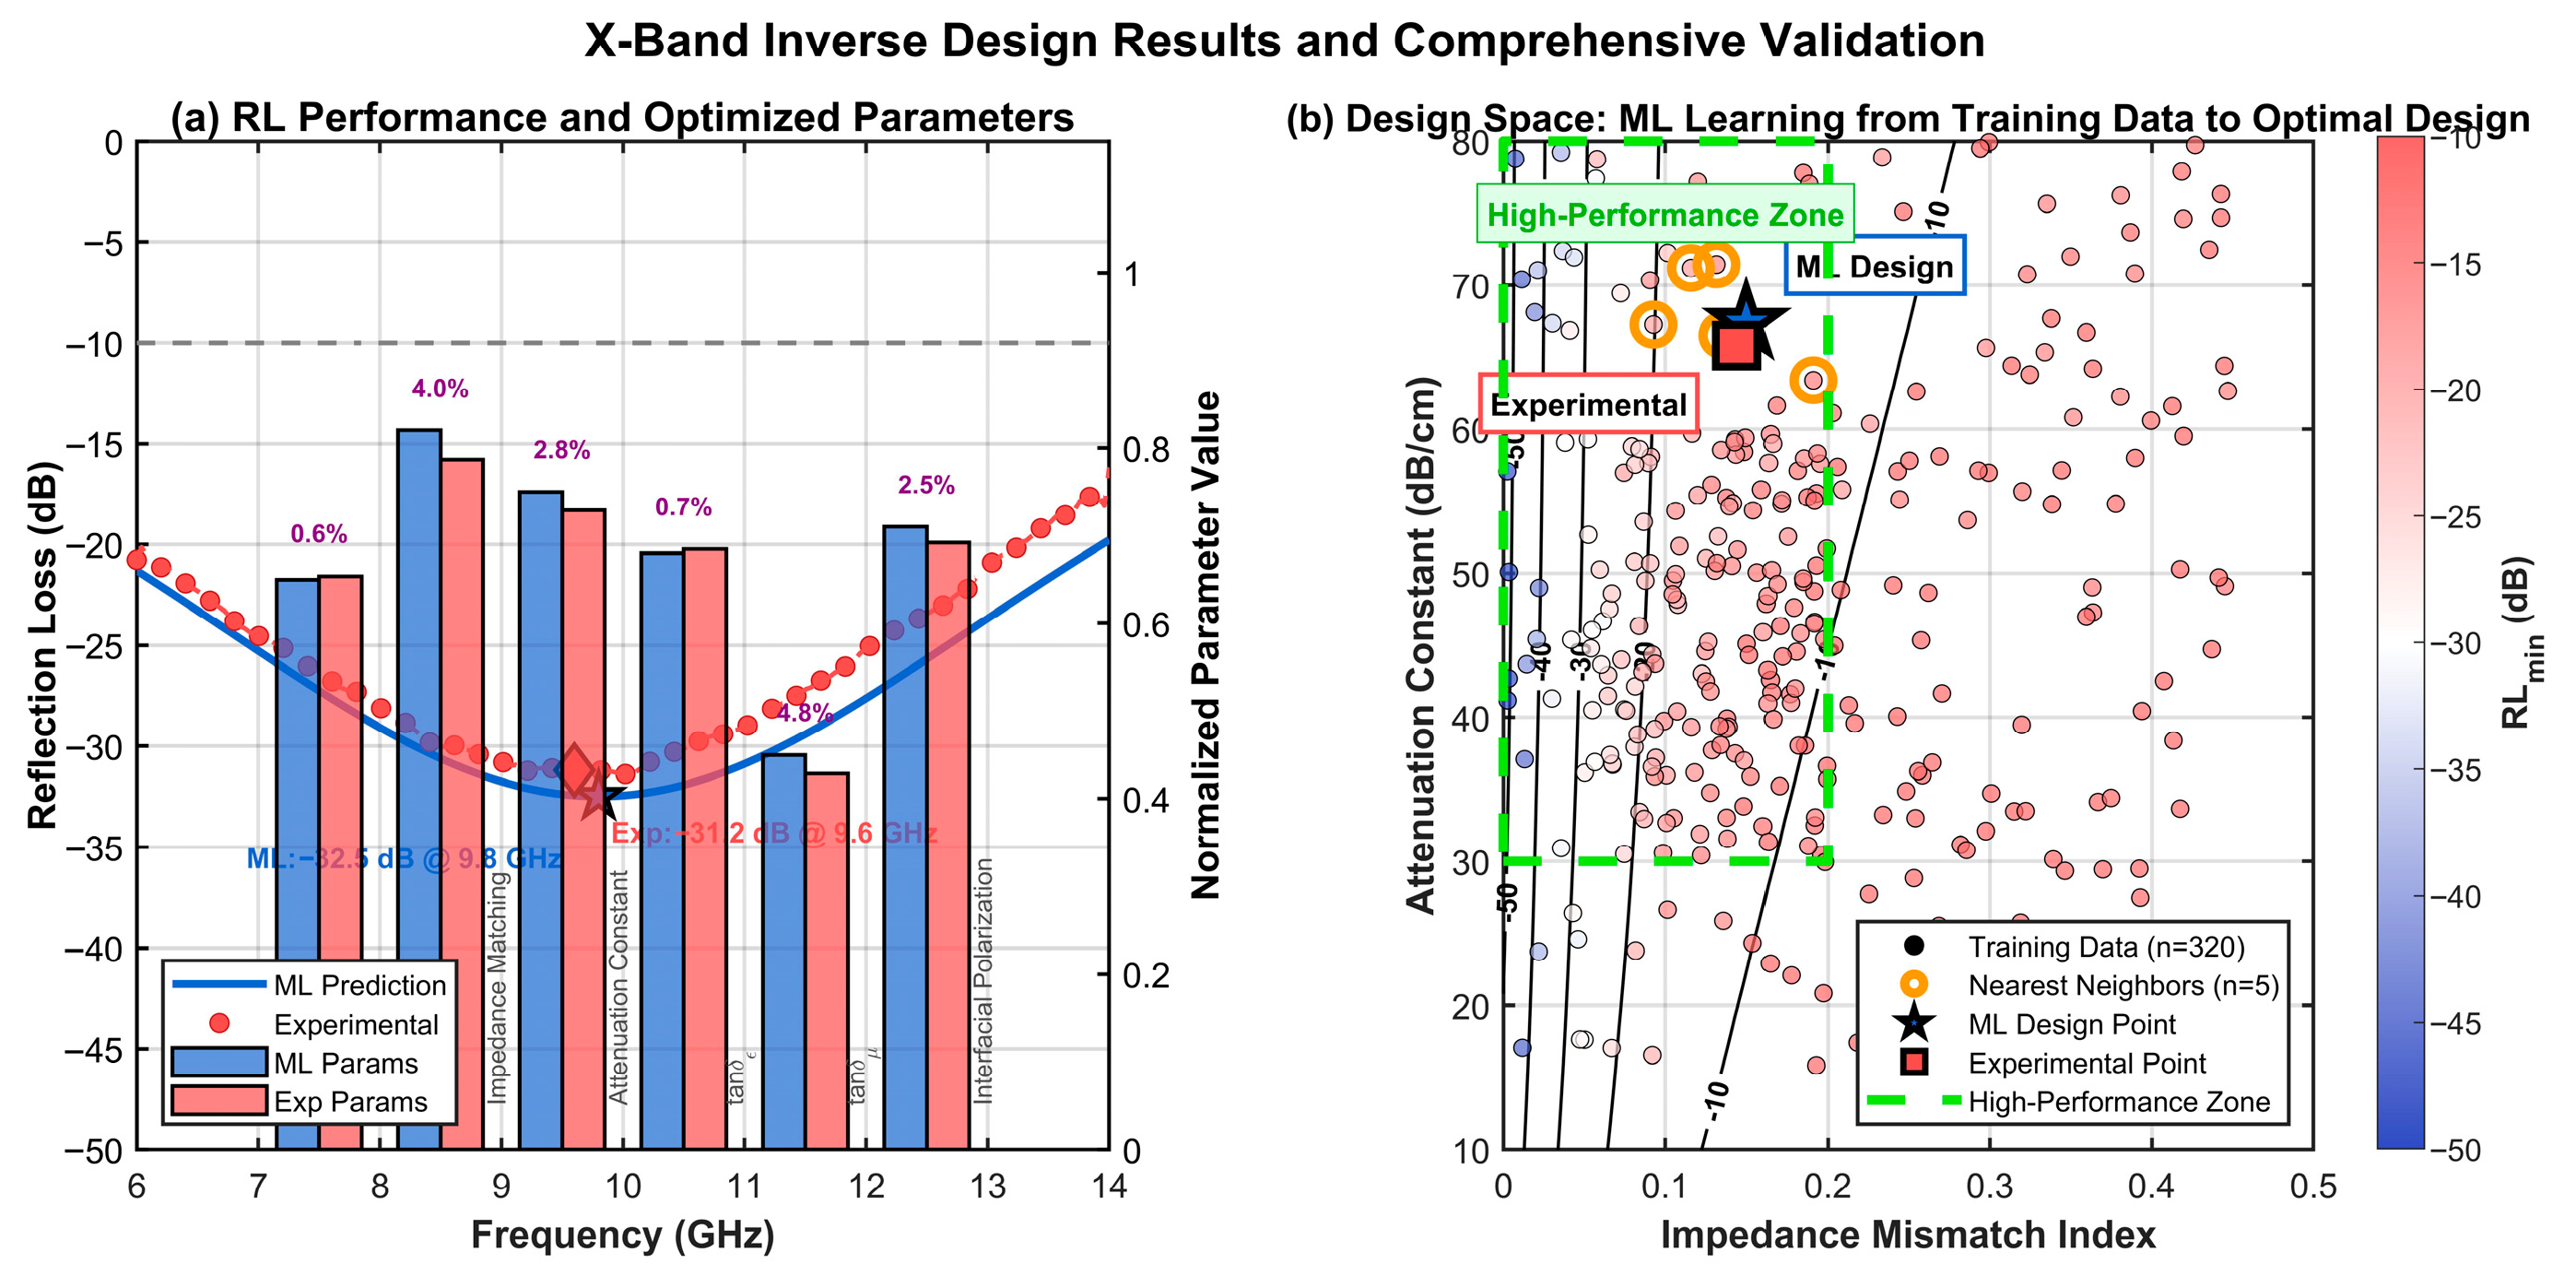
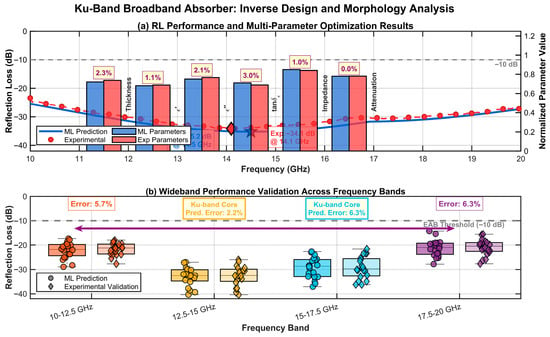
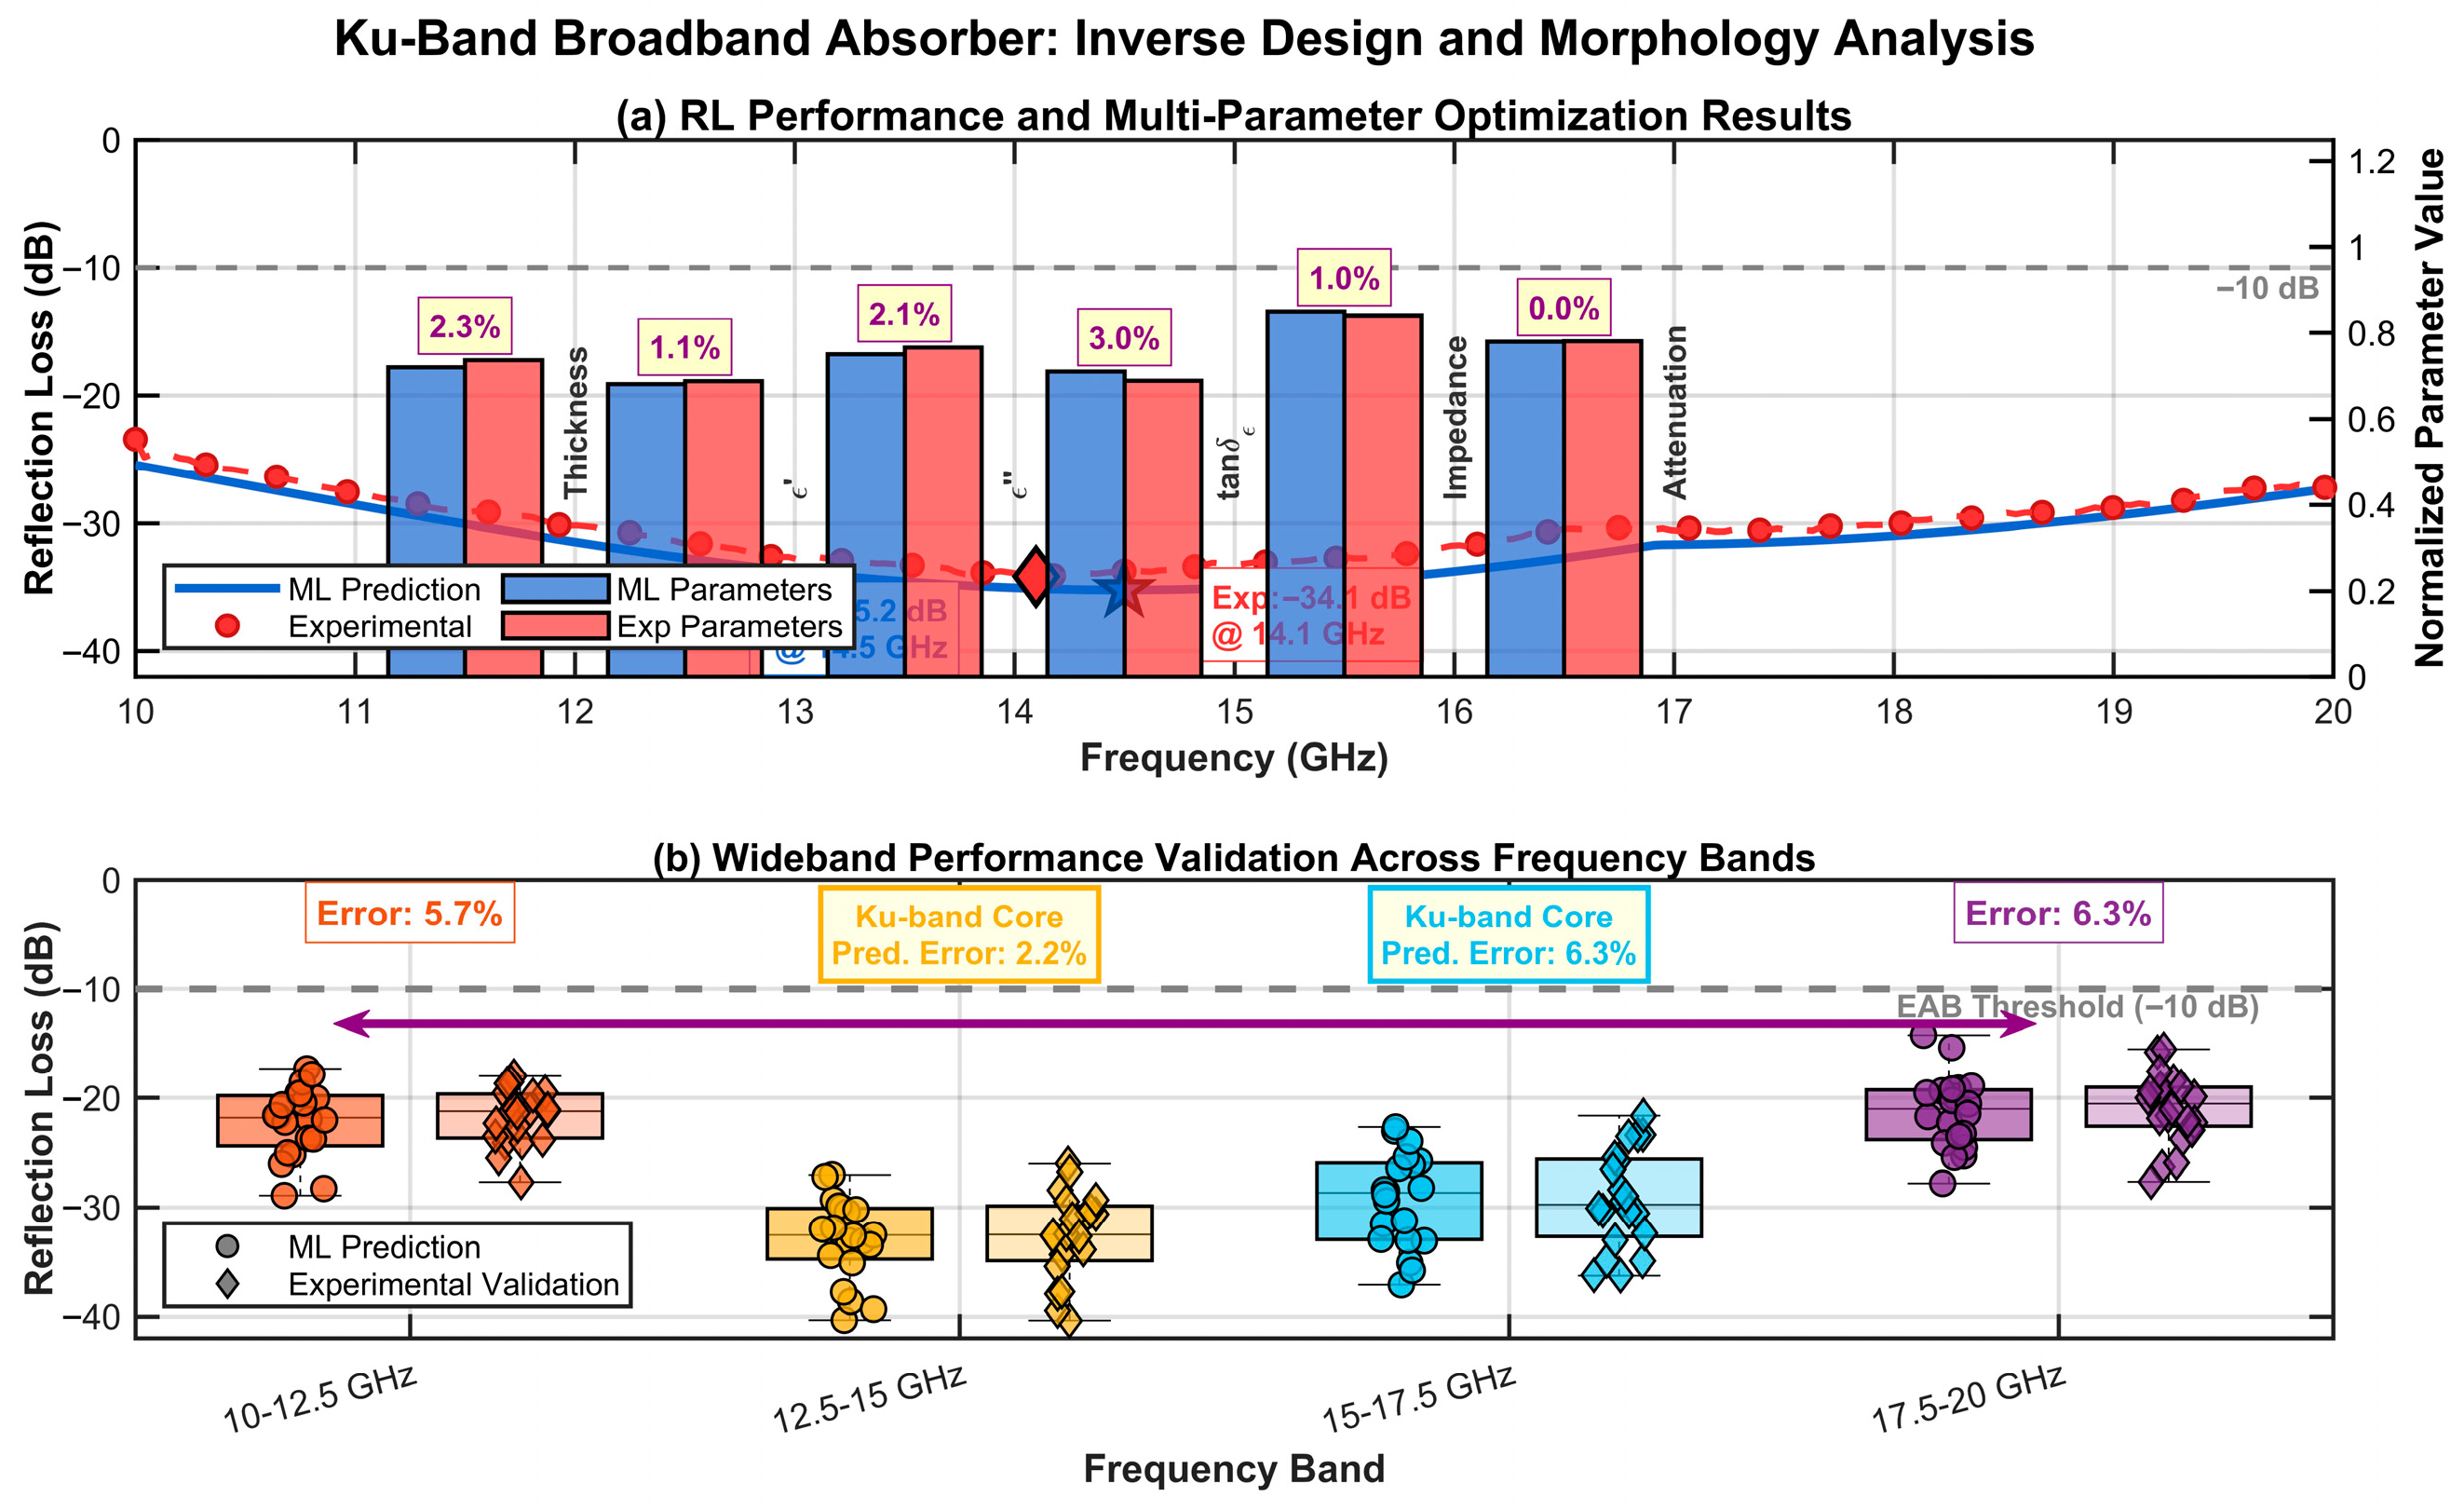
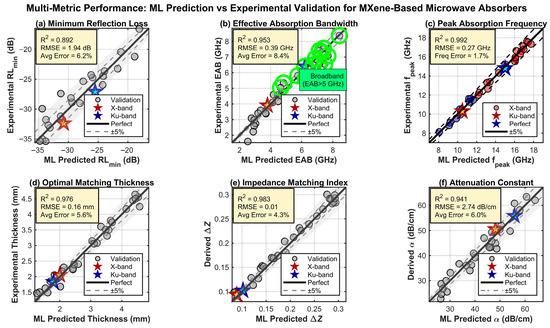
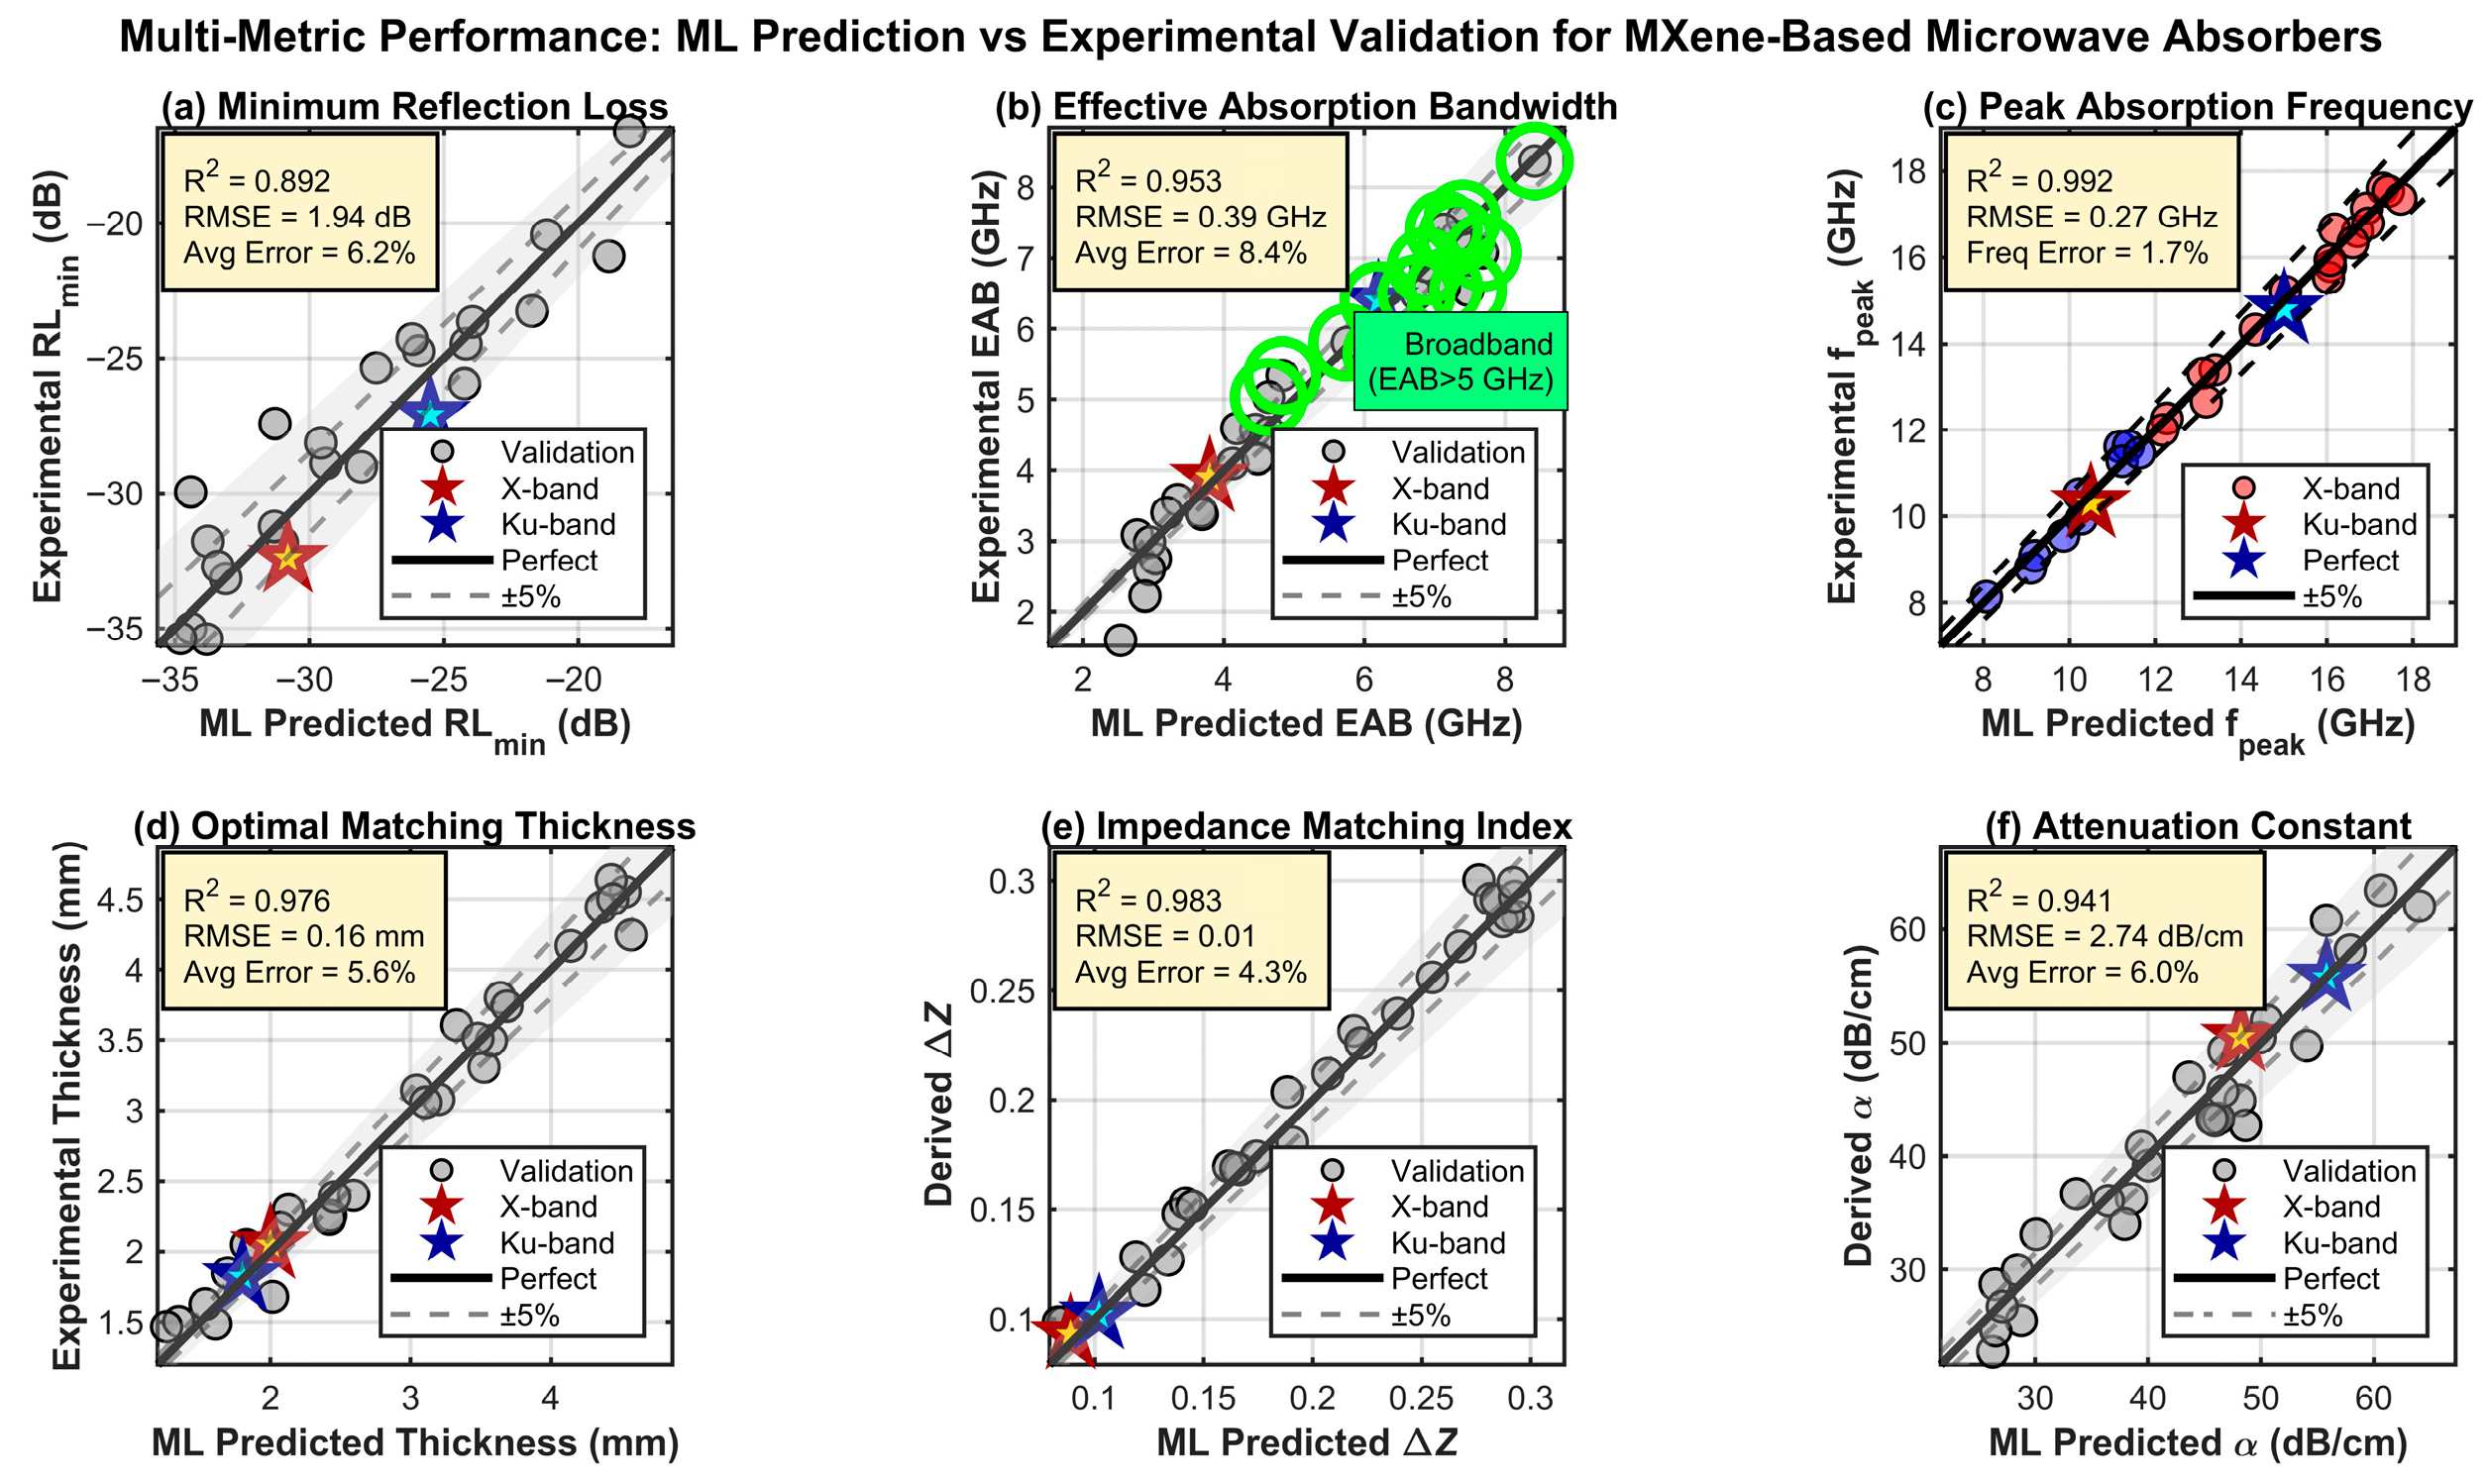
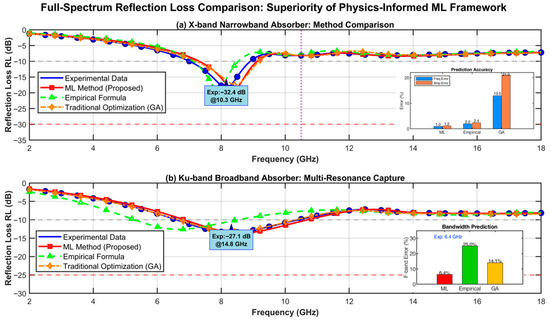
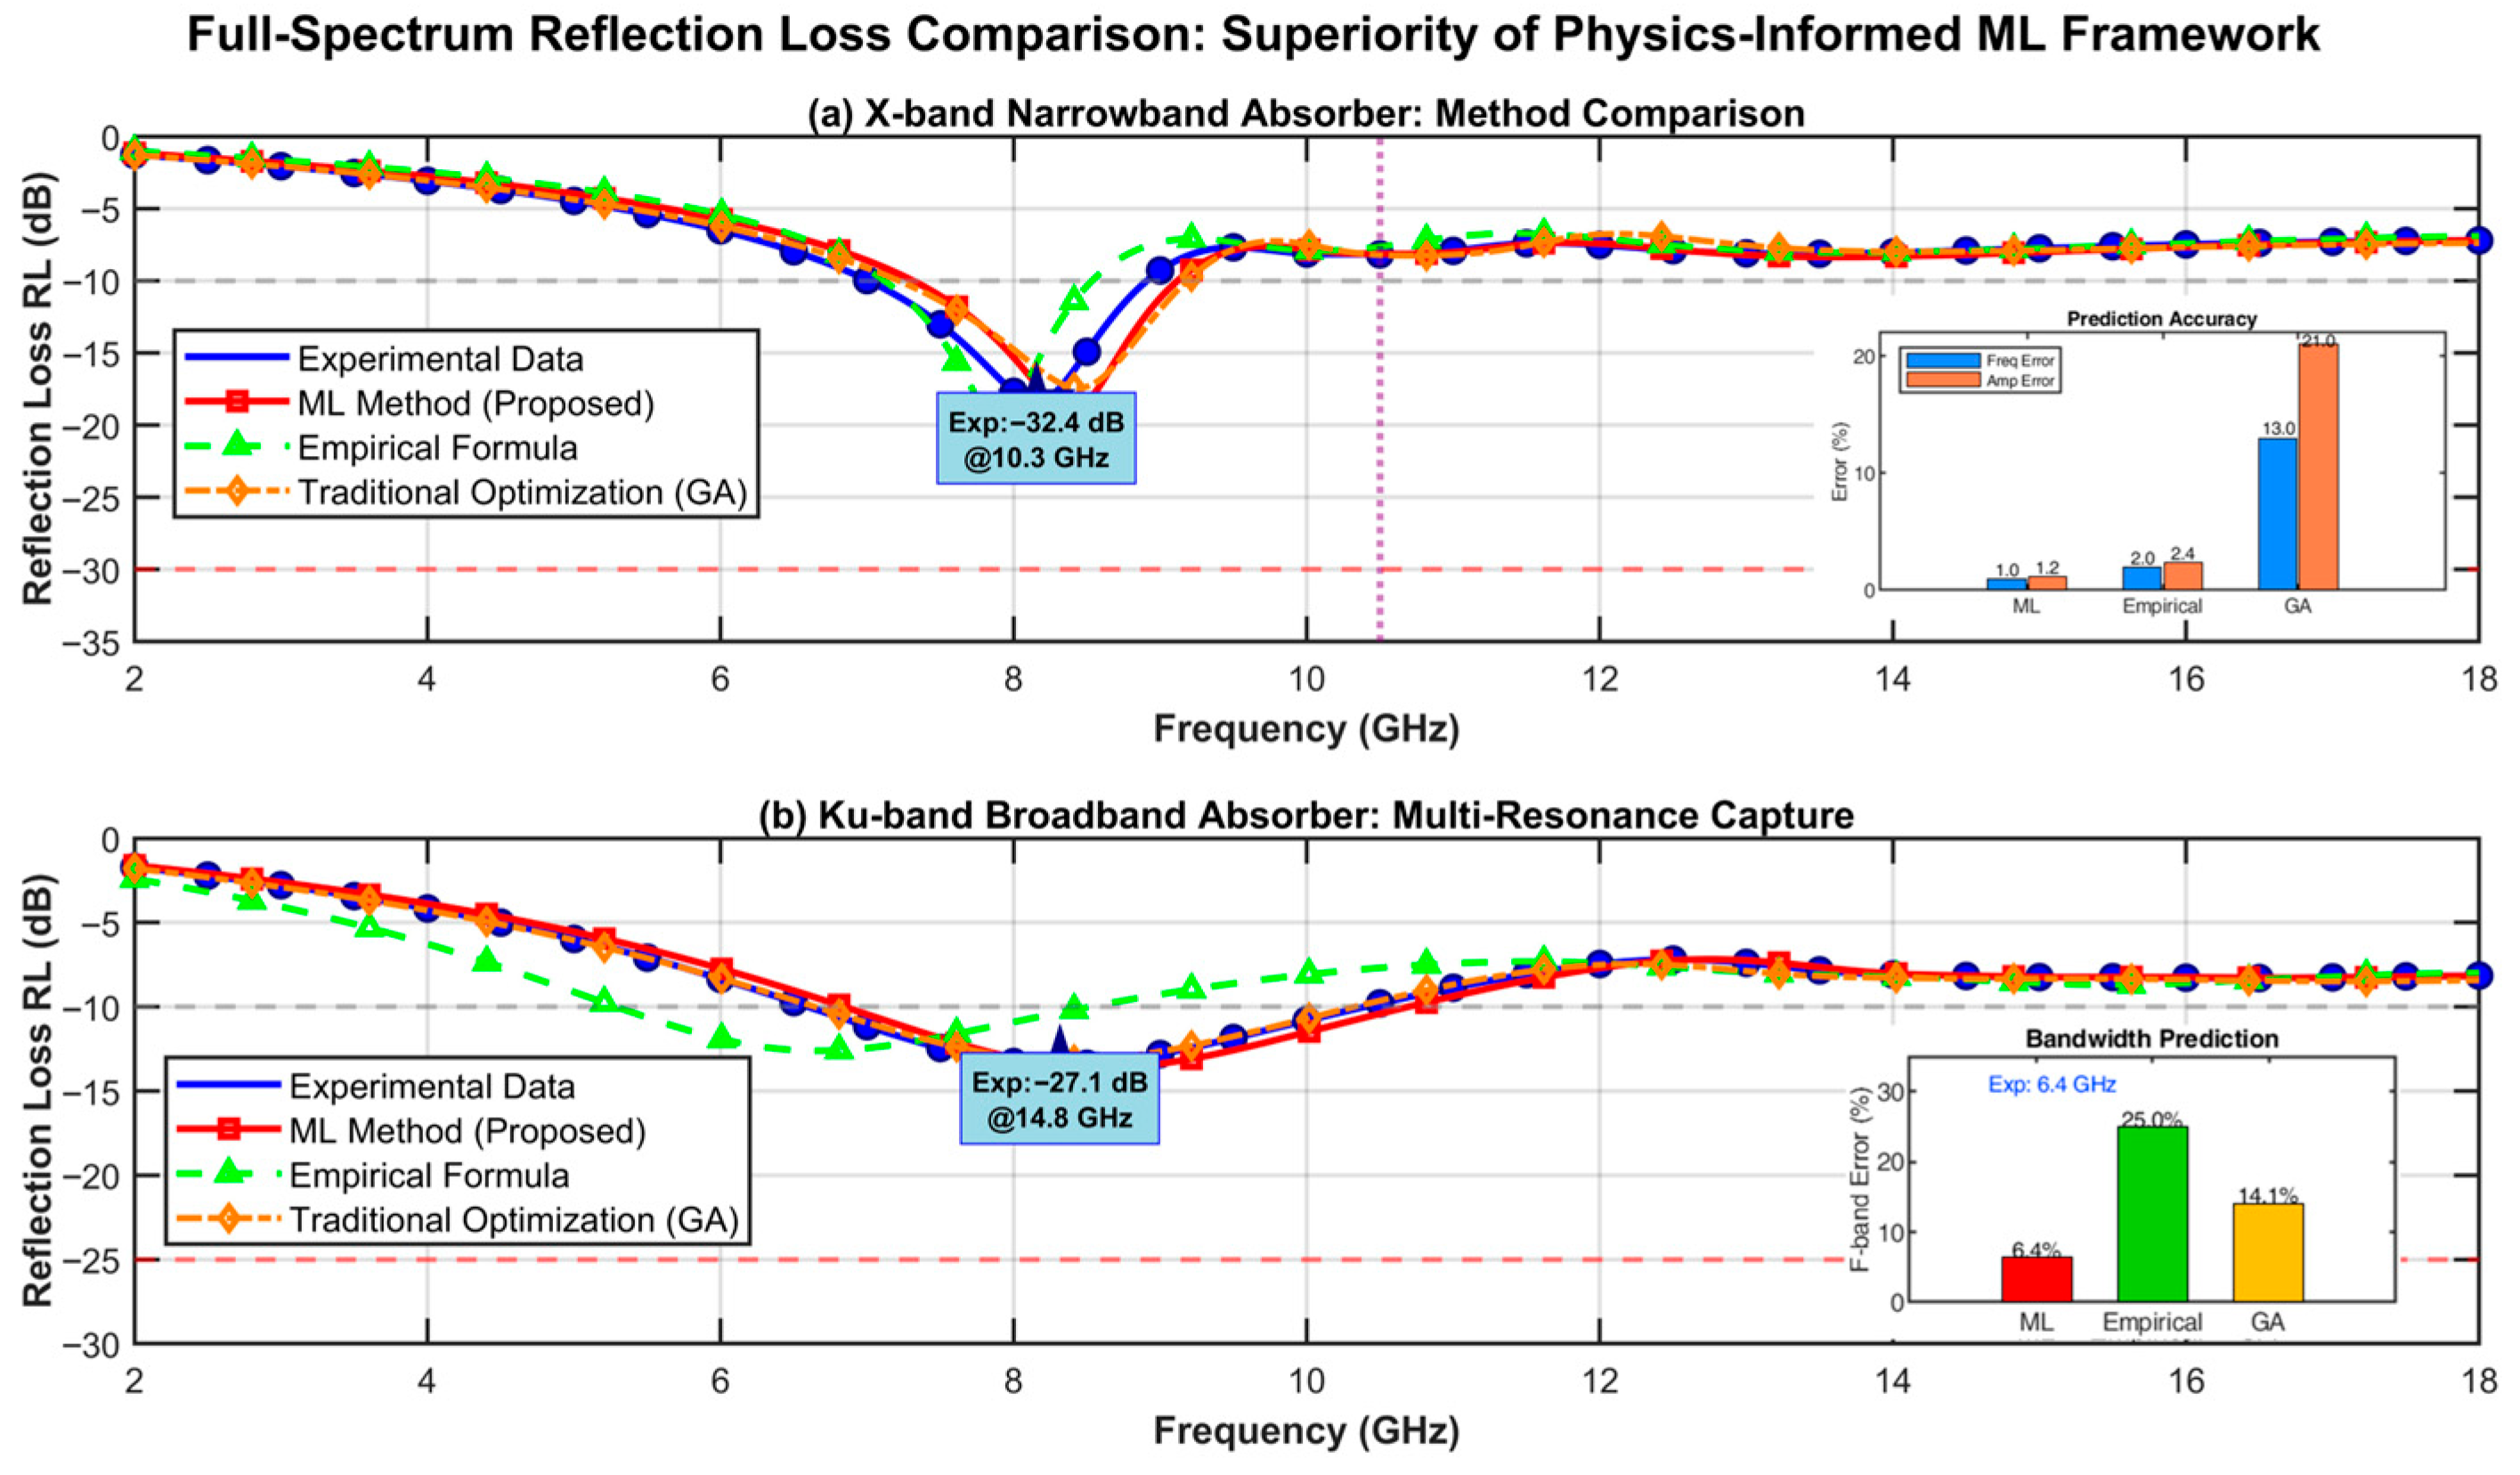

Disclaimer/Publisher’s Note: The statements, opinions and data contained in all publications are solely those of the individual author(s) and contributor(s) and not of MDPI and/or the editor(s). MDPI and/or the editor(s) disclaim responsibility for any injury to people or property resulting from any ideas, methods, instructions or products referred to in the content. |
© 2026 by the authors. Licensee MDPI, Basel, Switzerland. This article is an open access article distributed under the terms and conditions of the Creative Commons Attribution (CC BY) license.