


Abstract
During the COVID-19 pandemic, researchers have made efforts to detect COVID-19 through various methods. In the dataset used for this study, COVID-19 patients were identified using chest computed tomography (CT) images. High dimensionality is frequently an issue in machine learning image classification. Accordingly, this study implemented three dimensionality reduction methods in combination with various machine learning algorithms for improved classification. Principal component analysis (PCA), uniform manifold approximation and projection (UMAP), and diffusion maps were applied to the dataset to extract the most important features of the chest CT images. The extracted features were given as input either to logistic regression or the extreme gradient boosting (XGBoost) algorithm to perform classification. The strongest model identified from this study was diffusion maps in combination with logistic regression. This model, evaluated against existing models from similar studies in recent years, yielded strong performance for detecting COVID-19 cases using chest CT images. Our proposed model achieved 97.35% accuracy, 92.16% sensitivity, and 98.59% specificity on the held-out test set in differentiating between COVID-19-positive cases and healthy, non-COVID-19 cases. This study aimed to detect COVID-19 without the use of viral testing. Importantly, this method could assist clinicians in making an initial diagnosis, especially when viral testing is not available or timely enough for the patient’s case. This study also provides deeper insight into various dimensionality reduction methods and how compatible they are with biomedical imaging data. Models were trained using stratified cross-validation on the training set, with final performance evaluated on a held-out test set at the patient level to prevent data leakage. Additional imbalance-aware metrics were used to assess robustness given class distribution differences.
1. Introduction
One of the largest barriers to image classification using machine learning is high dimensionality, making these models prone to the “curse of dimensionality,” resulting in significant computing time and storage [1,2]. High-dimensional data prove to be especially challenging in biomedical image classification, where high resolution is often necessary to ascertain the difference between a positive or negative case. The effectiveness of different dimensionality reduction methods may vary based on the image modality. Here, we explore the efficacy of various dimensionality reduction methods to analyze chest computed tomography (CT). While CT imaging contains a lot of information that could potentially prove effective when paired with machine learning classification methods, its issue of high dimensionality makes it prone to overfitting unless the dataset is sufficiently large. Even so, massively large datasets may lead to increased computational time [3]. Feature dimensionality reduction combats this issue by mapping high-dimensional spaces into a relatively low-dimensional space. Coronavirus disease 2019 (COVID-19) is an infectious disease caused by the SARS-CoV2 virus [4]. Currently, reverse transcription polymerase chain reaction (RT-PCR) is the gold standard clinical method to diagnose COVID-19 [5,6]. However, these tests often take days to receive results. To address the shortcomings of current COVID-19 testing, the utility of various medical imaging technologies as diagnostic tools has also been investigated, including chest X-ray and chest CT. In this paper, we explore the application of various dimensionality reduction techniques—principal component analysis (PCA), uniform manifold approximation and projection (UMAP), and diffusion maps—in combination with various machine learning algorithms, including logistic regression and extreme gradient boosting (XGBoost). Overall, this work aims to explore the utility of dimensionality reduction in biomedical imaging processing and to develop an optimized COVID-19 classification model using chest CT images. This paper uses data from the COVID-19 Data Archive (COVID-ARC) [7], a repository containing multimodal and longitudinal data related to COVID-19. COVID-ARC helps address the need to understand the spread and global impact of COVID-19 from a scientific perspective. Data archives such as COVID-ARC are essential for research progress by uniting scientists across diverse fields and enabling interdisciplinary disease research.
In this study, our objective was to explore the extent to which dimensionality reduction could preserve the intrinsic patterns of chest CT data and thus preserve accuracy for COVID-19 detection while also reducing computational time and hardware resources necessary for training these models.
Despite the widespread adoption of deep learning approaches for medical image classification, such models often require extensive preprocessing, large annotated datasets, and substantial computational resources, which may limit their transparency and practical deployment in certain clinical or research settings. In contrast, classical dimensionality reduction methods offer a principled and interpretable means of compressing high-dimensional imaging data while retaining clinically relevant structure. However, their comparative behavior on chest CT data, particularly under controlled and leakage-aware evaluation frameworks, remains insufficiently characterized. In this work, we systematically evaluate principal component analysis, uniform manifold approximation and projection, and diffusion maps as dimensionality reduction strategies for chest CT images in combination with lightweight classifiers. By focusing on patient-level evaluation, minimal preprocessing, and imbalance-aware metrics, this study aims to clarify the trade-offs between accuracy, specificity, and computational efficiency and to assess the extent to which reduced-dimensional representations can support reliable COVID-19 classification from CT imaging data.
2. Related Work
2.1. Dimensionality Reduction for Biomedical Image Classification
Principal component analysis (PCA), uniform manifold approximation and projection (UMAP), and diffusion maps are all established feature extraction methods for imaging data. Along with feature extraction, PCA can be used for image compression and denoising [8]. Beyond classical methods, deep learning-based dimensionality reduction approaches, such as convolutional autoencoders and variational autoencoders, have also been applied to medical image analysis, offering the potential for highly compact, task-driven embeddings [9]. However, these methods typically require larger datasets and greater computational resources and may sacrifice interpretability. The present study intentionally focuses on classical, interpretable, and computationally lightweight dimensionality reduction techniques, positioning them as complementary alternatives rather than replacements for deep learning-based embeddings.
2.2. Other Classification Models for COVID-19
Various imaging modalities and machine learning frameworks have been proposed for diagnosing COVID-19. A number of papers have been published on the use of artificial intelligence, deep learning, and machine learning approaches for COVID-19 classification. One study found that, with a database of approximately 2200 images, a ResNet architecture, and no dimensionality reduction, the model achieved an accuracy of 91%, a sensitivity of 92.1%, and a specificity of 90.29% [10]. More recent studies have also pivoted to deep learning methods for classification tools. One study in particular applied Xception to chest CT images to yield 98.4% accuracy, 98.42% sensitivity, and 98.43% specificity [11].
Chest CT imaging poses unique challenges for machine learning classification due to its high spatial resolution, intrinsic three-dimensional structure, and large feature space, which collectively increase computational burden and risk of overfitting when sample sizes are limited. Dimensionality reduction provides a principled approach to preserve clinically meaningful structure while reducing model complexity, particularly in medical imaging applications where interpretability and computational efficiency are important considerations.
3. Materials and Methods
3.1. Dataset
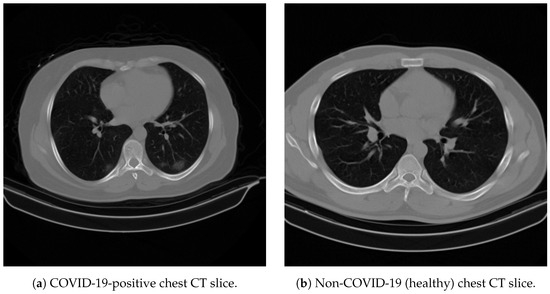
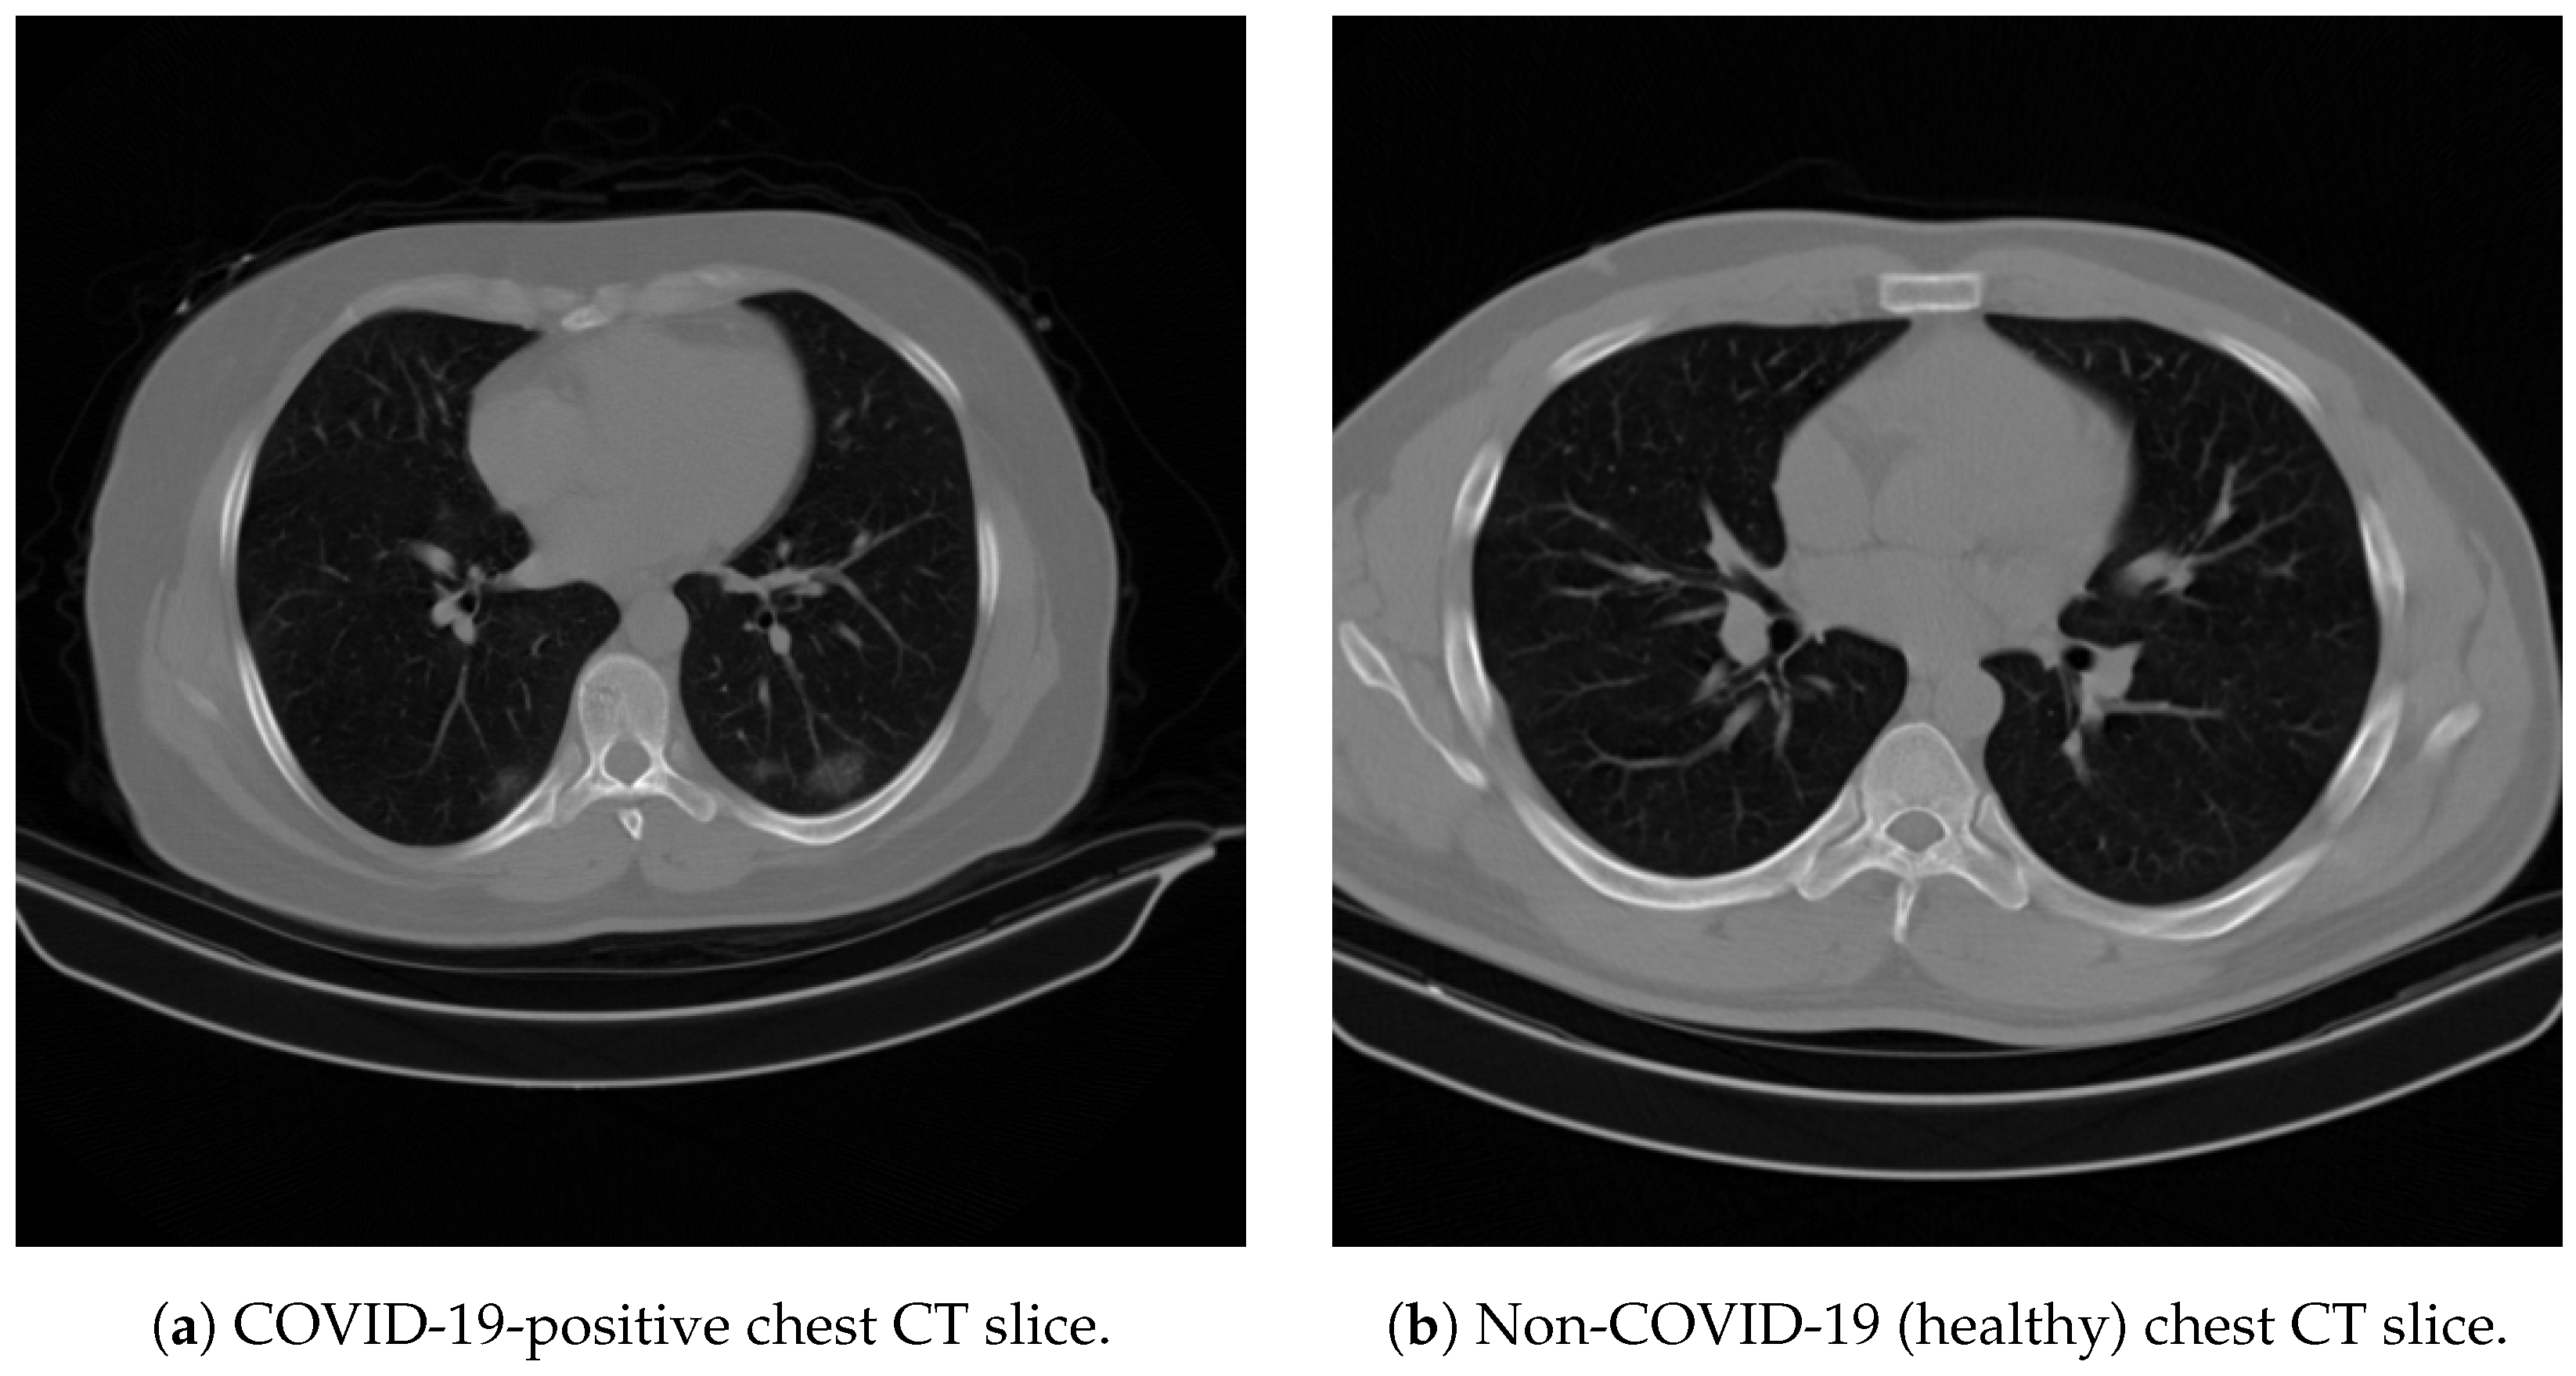
The dataset used in this study consists of 6147 chest CT images, including 4960 COVID-19 images and 1187 non-COVID-19 (healthy) images, for example Figure 1. All images were scaled to 128 × 128 pixels, and intensities were normalized prior to feature extraction. No Hounsfield unit (HU) windowing, lung segmentation, background removal, or data augmentation was applied. This minimal preprocessing was an intentional design choice to assess the discriminative signal at baseline in chest CT images without introducing task-specific assumptions (e.g., segmentation or handcrafted filtering), thereby enabling a fair comparison across dimensionality reduction methods. Seven images from the COVID-19 positive dataset were removed for not meeting the size constraints. Prior to removal, the images included in the experimental dataset originally ranged in size from pixels to pixels.
Figure 1.
Representative axial chest CT slices from the COVID-ARC dataset used in this study. Images are shown for visual context only; all analyses were performed on the full dataset, and these examples did not influence model training or evaluation.
3.2. Dimensionality Reduction
PCA, UMAP, and diffusion maps were used for feature extraction and dimensionality reduction to systematically compare linear and nonlinear approaches under a common evaluation framework. Dimensionality reduction was performed with the intention of reducing the original feature space of 16,384 variables (one per pixel) to a lower-dimensional representation of at most 100 components, thereby reducing computational burden while preserving informative structure relevant for classification. For PCA, the retained components were selected to preserve at least 80% of the variance; for nonlinear methods, an equivalent target dimensionality was used to enable fair comparison across methods.
3.2.1. Principal Component Analysis
PCA is a multivariate statistical technique that extracts important information from a dataset and reduces it to a new set of orthogonal values called principal components, with the goal of preserving the patterns and similarities of the original dataset [12]. The components are obtained from the singular value decomposition of the data matrix X, where
The matrix is the matrix of left singular vectors, the matrix is the matrix of right singular vectors, and is the diagonal matrix of singular values. The matrix gives the coefficients of the linear combinations used to compute scores. Projecting the original data onto the leading principal components yields a lower-dimensional representation that captures the dominant sources of linear variation in the dataset while discarding components associated with lower variance and potential noise.
3.2.2. Uniform Manifold Approximation and Projection
UMAP is a manifold learning technique designed to preserve local neighborhood structure while maintaining aspects of global structure during dimensionality reduction [13]. UMAP constructs a weighted k-neighbor graph from the original dataset. A transform is applied at the edges to the local ambient distance. Then, an objective function is defined that preserves the desired characteristics of the k-neighbor graph, and a low-dimensional representation is determined that optimizes this function [14].
3.2.3. Diffusion Maps
Diffusion maps are a manifold learning technique that retains local structures and interactions between data points within nonlinear data [15]. Diffusion maps are constructed by iterating a Markov matrix to create an associated family of diffusion distances, which define the multiscale geometrics used for dimensionality reduction. First, a kernel k is defined to represent the affinity of the points in the set X such that it k is symmetric and positivity-preserving. Then, from the graph defined by , a reversible Markov chain is constructed on X. If p is the transition kernel of a Markov chain on X, then the matrix P contains geometric information about the dataset X. The decomposition of eigenpairs is performed on the transition matrix P, and the m leading eigenpairs represent the new dimension-reduced dataset. By capturing multiscale diffusion distances, diffusion maps are particularly well-suited for identifying intrinsic geometric structure in high-dimensional biomedical imaging data, where clinically meaningful variation may lie along nonlinear manifolds.
3.3. Classification
3.3.1. Logistic Regression
Logistic regression is a statistical technique that classifies the outcome of a set of independent variables by determining the odds of an event occurring [16]. In this study, each logistic regression model was trained using the reduced-dimensional representations obtained from the methods described in Section 3.2. To prevent data leakage, dataset splitting was performed at the patient level such that no CT slices from the same patient appeared in both training and test sets. All dimensionality reduction models (PCA, UMAP, and diffusion maps) were fit exclusively on the training data and subsequently applied to the held-out test set. No hyperparameter grid search was performed for logistic regression; all models used default scikit-learn parameters (regularization: L2; ; maximum iterations: 4000). Within the training set, stratified five-fold cross-validation was used to evaluate model stability across folds; all reported performance metrics correspond to evaluation on the held-out test set. This training and evaluation strategy ensures that reported performance reflects generalization to unseen patients rather than slice-level correlations.
3.3.2. XGBoost
XGBoost is a scalable end-to-end tree boosting system that is particularly effective for structured and high-dimensional data [17]. The model was trained using reduced-dimensional representations obtained from the methods described in Section 3.2. Dataset splitting was performed at the patient level using an 80/20 train–test split to prevent data leakage. Hyperparameters were optimized using grid search with stratified 5-fold cross-validation on the training set, with accuracy used as the primary scoring metric. For PCA- and UMAP-based models, the grid search explored: n_estimators , learning_rate , and max_depth , with gamma, colsample_bytree, min_child_weight, and subsample fixed at their default values (0, 1, 1, and 1, respectively). For the diffusion maps model, an initial broad search over the same ranges was followed by a refined search over n_estimators and learning_rate . The final selected hyperparameters for each XGBoost model are reported in Table 1. Unless otherwise stated, all reported performance metrics correspond to evaluation on the held-out test set.
Table 1.
Final XGBoost hyperparameters selected by grid search for each dimensionality reduction method.
4. Experimental Results and Discussion
4.1. Evaluation Metrics
In addition to developing predictive models for classifying chest CT images as COVID-19 positive or negative, a primary objective of this study is to assess how different dimensionality reduction methods influence downstream classification performance. Unless otherwise stated, all reported performance metrics correspond to evaluation on the held-out test set. Model performance was quantified using the following metrics, where TP, TN, FP, and FN denote true positives, true negatives, false positives, and false negatives, respectively:
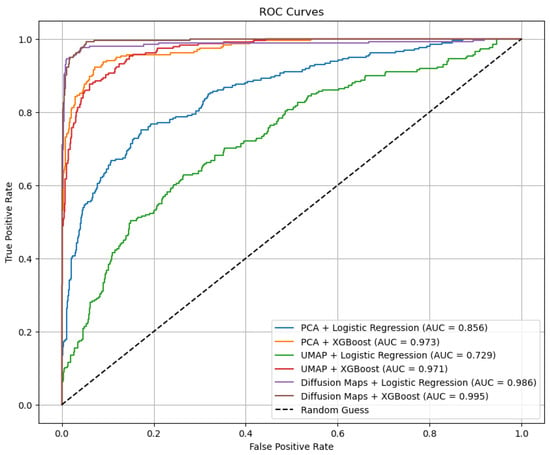
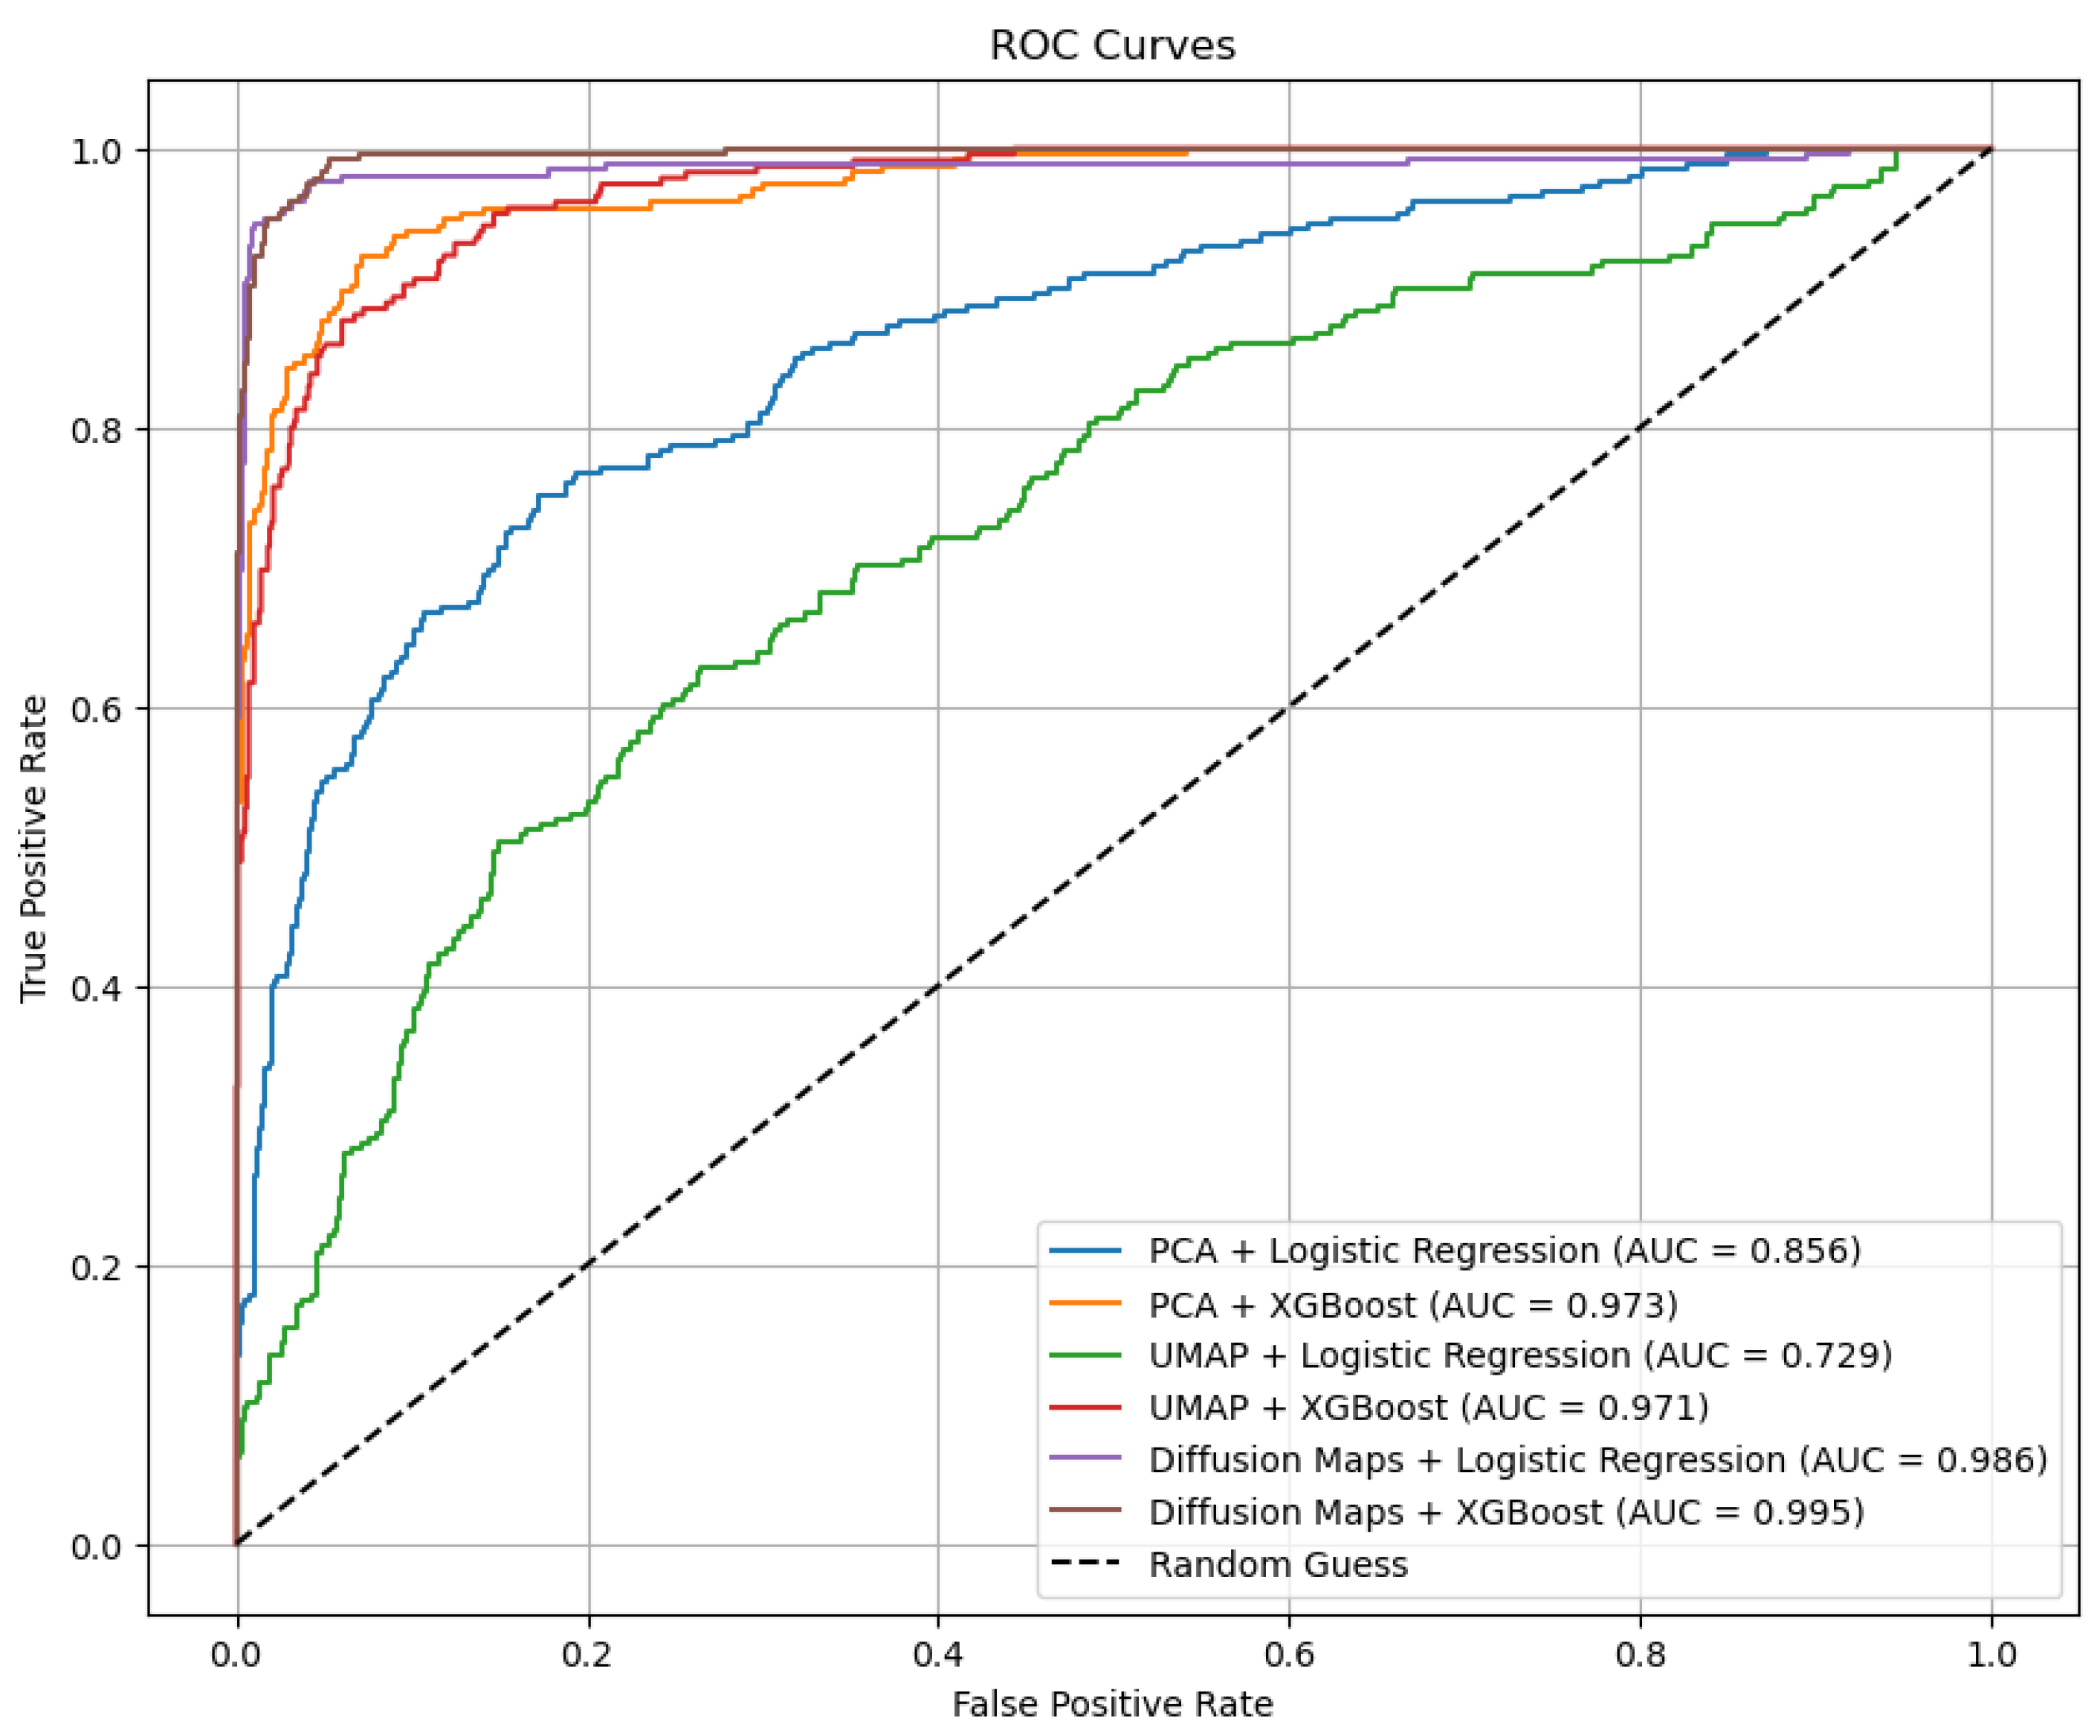
Balanced accuracy and F1-score were included to provide metrics that are more robust to class imbalance, complementing accuracy, sensitivity, and specificity. In addition, receiver operating characteristic (ROC) curves and area under the curve (AUC) values are reported to assess discriminative performance across decision thresholds.
Confusion matrices for the best-performing models were examined to illustrate classification behavior across classes and to contextualize sensitivity–specificity trade-offs under imbalanced class distributions. In particular, sensitivity and specificity were analyzed jointly to reflect clinically relevant trade-offs between false negative and false positive predictions.
4.2. Feature Extraction
To improve computational efficiency and reduce the risk of overfitting, feature extraction was performed using principal component analysis (PCA), uniform manifold approximation and projection (UMAP), and diffusion maps. Each method was applied independently to transform the original 16,384-dimensional pixel space into a lower-dimensional representation suitable for downstream classification.
For PCA, the leading 100 components were retained, corresponding to approximately 80% of the total variance explained. Because UMAP is a nonlinear manifold learning method that does not provide a direct measure of variance preservation, the dimensionality of the UMAP embedding was fixed at 100 components to enable fair comparison with PCA. For diffusion maps, the leading 70 components were retained, capturing approximately 80% of the diffusion energy as determined by the eigenvalue spectrum. This approach allowed dimensionality to be reduced substantially while preserving informative structure relevant for classification. All feature extraction methods were fit exclusively on the training data and subsequently applied to the held-out test set to prevent information leakage.
4.3. Classification
Once the key features of the dataset were extracted by PCA, UMAP, or diffusion maps, each transformed dataset was subsequently used to train the logistic regression model or XGBoost model separately. Diffusion maps with logistic regression yielded the best accuracy of 97.35% and the best sensitivity of 92.16% on the held-out test set. Overall, the strongest model was diffusion maps with logistic regression, with an accuracy, sensitivity, and specificity of 97.35%, 92.16%, and 98.59%, respectively (Table 2).
Table 2.
Results of each model combination (accuracy/sensitivity/specificity/AUC). Bold values indicate the best-performing model combination(s) overall. All values correspond to evaluation on the held-out test set.
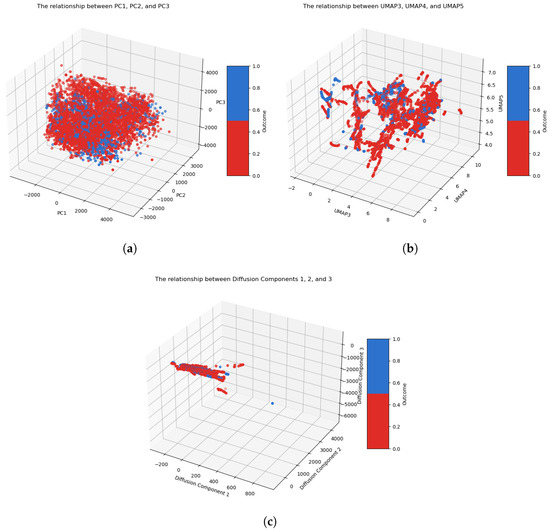
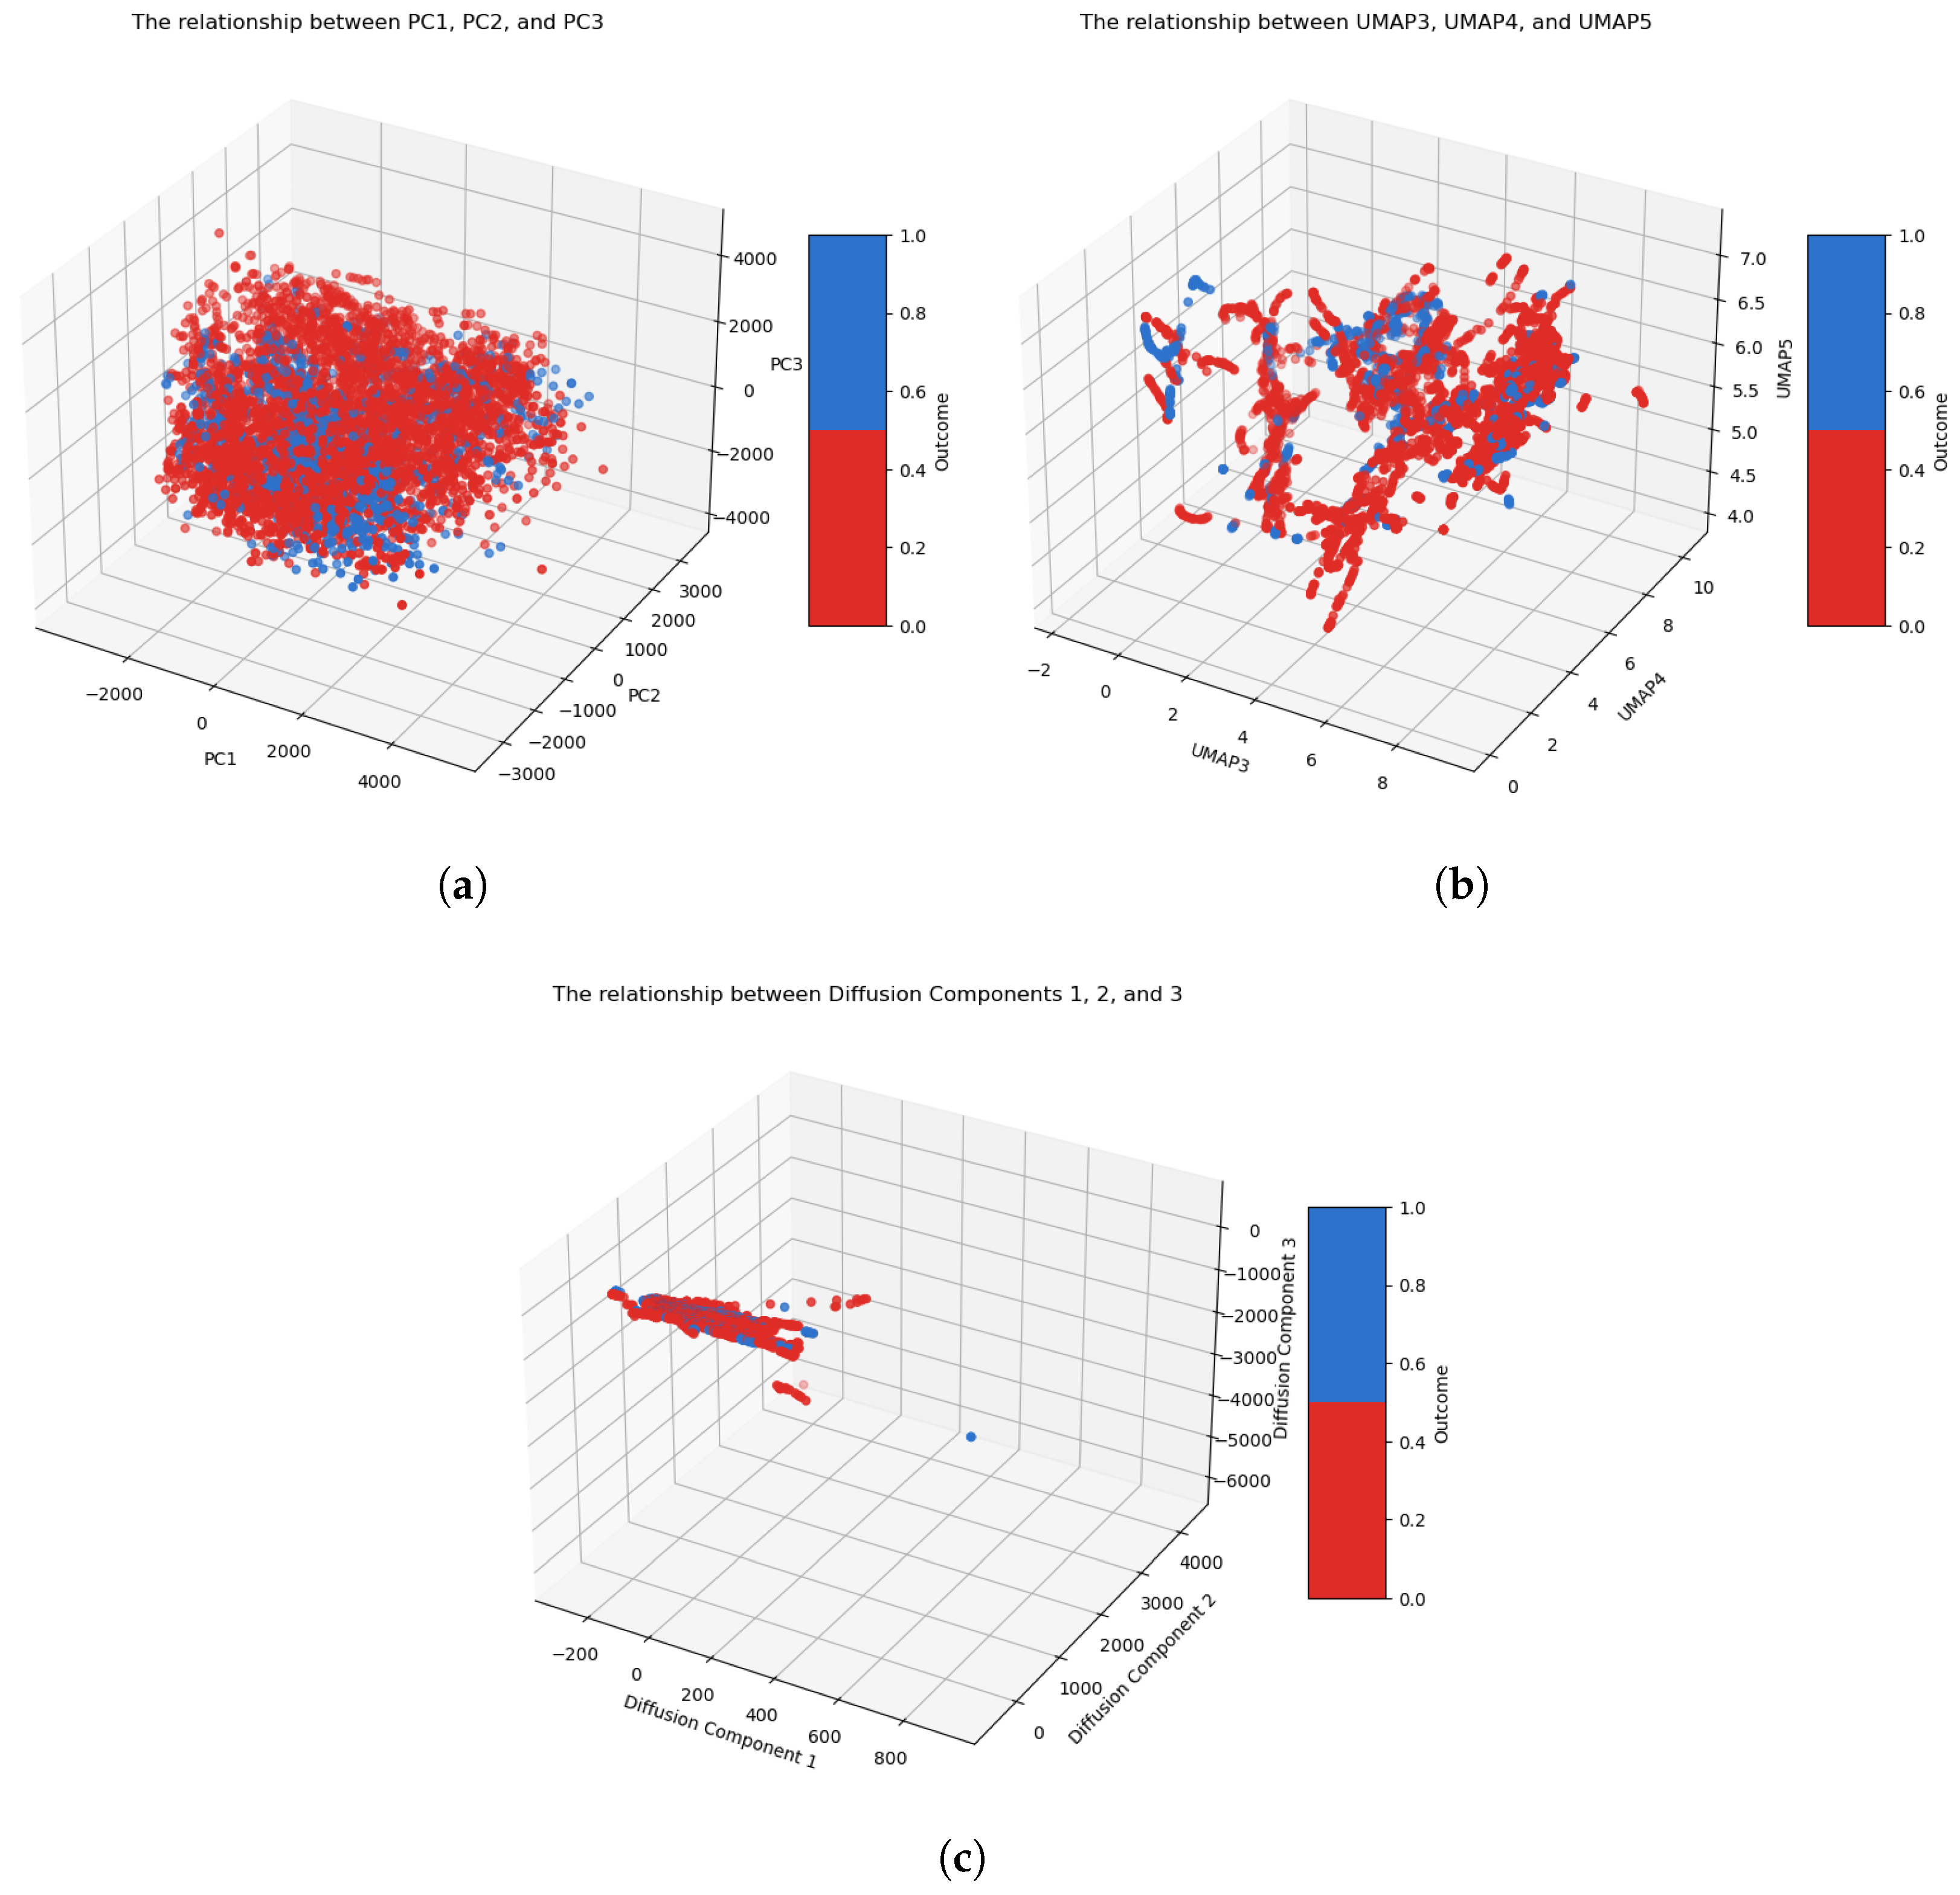
As seen in Figure 2 and Table 2, diffusion maps are overall a strong candidate for dimensionality reduction when working with chest CT data. The three-dimensional embeddings in Figure 2 illustrate that diffusion maps (panel c) produce notably clearer class separation than PCA (panel a) or UMAP (panel b), with COVID-19-positive and non-COVID-19 cases occupying largely distinct regions of the embedding space; this visual separation is consistent with the stronger downstream classification performance observed in Table 2. Prior studies have investigated different combinations of dimensionality reduction methods combined with machine learning algorithms in the context of COVID-19 diagnosis. Table 3 compares our proposed models with other adjacent models.
Figure 2.
Three-dimensional embeddings of chest CT images obtained using each dimensionality reduction method used in this study: (a) PCA components 1, 2, and 3; (b) UMAP components 3, 4, and 5 (selected for visualization); (c) diffusion maps components 1, 2, and 3. Red points represent COVID-19-positive cases, and blue points represent non-COVID-19 (healthy) cases; each point corresponds to an individual CT image slice. Diffusion maps (panel (c)) exhibit notably clearer class separation compared to PCA (panel (a)) and UMAP (panel (b)), consistent with their superior downstream classification performance.
Table 3.
Comparison of the proposed model with previously developed models. Note that studies were conducted using different datasets, imaging modalities (CT or X-ray), sample sizes, and evaluation protocols; comparisons are therefore illustrative and contextual only, and direct quantitative comparison is not appropriate.
The proposed approach demonstrates competitive performance relative to previously published methods for COVID-19 classification using imaging data (Table 3) while emphasizing methodological efficiency and interpretability. Across the evaluated dimensionality reduction techniques, diffusion maps consistently yielded strong classification performance, suggesting that preserving intrinsic nonlinear structure in chest CT data can be beneficial for downstream prediction. Compared to PCA and UMAP, diffusion maps achieved comparable or improved performance using fewer retained components, resulting in reduced feature dimensionality and improved computational efficiency during model training.
It is worth noting that while diffusion maps Figure 3 combined with logistic regression achieved the highest accuracy and sensitivity among the logistic regression models, their specificity (98.59%) was lower than that of PCA + XGBoost (98.94%) and UMAP + XGBoost (98.05%). In clinical contexts where minimizing false positives is a priority, models with higher specificity may be preferable despite lower overall accuracy. Model selection should therefore be guided by the intended clinical objective: sensitivity-optimized models reduce missed diagnoses, while specificity-optimized models reduce unnecessary follow-up burden.
Figure 3.
ROC curves and AUC of each COVID-19 classification model. AUC values correspond to evaluation on the held-out test set.
Error analysis of the best-performing models revealed that false negatives (missed COVID-19 cases) tended to occur in cases with milder or atypical CT appearances—such as subtle ground-glass opacities without consolidation—which may overlap visually with normal parenchymal patterns at the 128 × 128 pixel resolution used in this study. False positives (healthy cases misclassified as COVID-19) were more often associated with image artifacts or non-specific findings that may mimic COVID-19 patterns. Clinically, false negatives carry greater consequences in a screening context, as they represent missed diagnoses, while false positives result in unnecessary follow-up testing. These patterns reinforce the importance of jointly considering sensitivity and specificity in model selection and highlight the potential value of higher-resolution imaging or supplementary preprocessing in future work.
It is important to note that the studies summarized in Table 3 were conducted using different datasets, imaging modalities, and experimental protocols; therefore, the comparisons are intended to be illustrative and contextual only, and direct quantitative comparison is not appropriate. A limitation of the present study is the class imbalance in the COVID-ARC dataset, which may influence sensitivity and specificity trade-offs and underscores the importance of reporting imbalance-aware metrics.
Although diffusion maps are mathematically more involved than PCA or UMAP, their ability to produce compact, information-rich representations makes them attractive for scenarios requiring efficient model training or extensive hyperparameter tuning. In addition, the choice of classifier interacted strongly with the selected dimensionality reduction method. For example, when paired with UMAP, XGBoost substantially outperformed logistic regression, whereas PCA-based representations showed notable performance differences between classifiers. These observations highlight that dimensionality reduction and classification should be considered jointly rather than as independent design choices.
Selecting an appropriate dimensionality reduction method for image-based classification depends on factors such as sample size, image resolution, and the underlying structure of the data. Linear methods such as PCA can provide an initial assessment of variance structure, while nonlinear techniques such as UMAP and diffusion maps can reveal more complex relationships in the data. In practice, evaluating lightweight models and lower-dimensional representations can guide method selection before adopting more computationally intensive approaches.
While this study focused on COVID-19 classification from chest CT images, the results suggest that combining dimensionality reduction with lightweight classifiers may offer a generalizable and computationally efficient framework for other biomedical imaging classification tasks.
5. Conclusions
This study demonstrates that dimensionality reduction can provide strong performance for COVID-19 classification from chest CT images when paired with lightweight machine learning classifiers. Among the evaluated methods, diffusion maps consistently preserved meaningful structure in low-dimensional space and achieved the strongest overall performance when combined with logistic regression and XGBoost on the held-out test set. The embedding visualizations further suggest clearer class separation for diffusion maps relative to PCA and UMAP, consistent with downstream classification performance. These findings support diffusion maps as an effective, interpretable, and computationally efficient approach for feature compression in CT-based classification tasks.
This work has several limitations. The dataset is class-imbalanced, and all experiments were conducted on a single dataset (COVID-ARC) without external validation, which may limit generalizability across scanners, institutions, and populations. In addition, CT slices were analyzed independently rather than as full volumetric scans. Finally, images were resized to pixels with minimal preprocessing as an intentional baseline to assess discriminative signals with minimal task-specific assumptions; this choice may reduce fine-grained spatial information. Future work will prioritize multi-institutional validation, volumetric modeling, code deposition, and extensions that incorporate richer preprocessing or learned feature extractors (e.g., CNN-based representations or diffusion maps applied to CNN-extracted features) while retaining the interpretability advantages of low-dimensional embeddings.
Author Contributions
Conceptualization, D.D. and A.I.S.; Methodology, A.I.S., A.S. and A.B.; Software, A.I.S.; Validation, A.I.S., A.S. and A.B.; Formal analysis, A.I.S.; Investigation, A.I.S.; Resources, D.D.; Data curation, A.I.S.; Writing—original draft preparation, A.I.S.; Writing—review and editing, D.D. and A.I.S.; Visualization, A.I.S.; Supervision, D.D.; Project administration, D.D.; Funding acquisition, D.D. All authors have read and agreed to the published version of the manuscript.
Funding
This research was funded by the National Science Foundation grant number 2027456.
Institutional Review Board Statement
Not applicable.
Informed Consent Statement
Not applicable.
Data Availability Statement
All data used in this study are sourced from the COVID-19 Data Archive (COVID-ARC), a data archive with multimodal and longitudinal COVID-19 data, which can be found at https://covid-arc.loni.usc.edu/ (accessed on 20 February 2026).
Acknowledgments
This paper relies on data from COVID-ARC, a data archive containing multimodal and longitudinal data related to COVID-19. COVID-ARC helps address the need to understand the spread and impact of COVID-19 globally from a scientific perspective. Data archives like COVID-ARC are imperative to research progress by uniting scientists across diverse fields and enabling interdisciplinary disease research.
Conflicts of Interest
The authors declare no conflicts of interest.
Abbreviations
The following abbreviations are used in this manuscript:
| PCA | Principal component analysis |
| UMAP | Uniform manifold approximation and projection |
| LR | Logistic regression |
| CT | Computed tomography |
| KNN | K-nearest neighbors |
| SVM | Support vector machine |
| RF | Random forest |
| GNB | Gaussian naive Bayes |
References
- Altman, N.; Krzywinski, M. The Curse(s) of Dimensionality. Nat. Methods 2018, 15, 399–400. [Google Scholar] [CrossRef] [Scilit] [PubMed]
- Jia, W.; Sun, M.; Lian, J.; Hou, S. Feature Dimensionality Reduction: A Review. Complex Intell. Syst. 2022, 8, 2663–2693. [Google Scholar] [CrossRef] [Scilit]
- Ying, X. An Overview of Overfitting and Its Solutions. J. Phys. Conf. Ser. 2019, 1168, 022022. [Google Scholar] [CrossRef] [Scilit]
- Li, G.; Hilgenfeld, R.; Whitley, R.; De Clercq, E. Therapeutic Strategies for COVID-19: Progress and Lessons Learned. Nat. Rev. Drug Discov. 2023, 22, 449–475. [Google Scholar] [CrossRef] [Scilit] [PubMed]
- Maia, R.; Carvalho, V.; Faria, B.; Miranda, I.; Catarino, S.; Teixeira, S.; Lima, R.; Minas, G.; Ribeiro, J. Diagnosis Methods for COVID-19: A Systematic Review. Micromachines 2022, 13, 1349. [Google Scholar] [CrossRef] [Scilit] [PubMed]
- Chau, C.; Strope, J.; Figg, W. COVID-19 Clinical Diagnostics and Testing Technology. Pharmacother 2020, 40, 857–868. [Google Scholar] [CrossRef] [Scilit] [PubMed]
- Duncan, D. COVID-19 Data Sharing and Collaboration. Commun. Inf. Syst. 2021, 21, 325–340. [Google Scholar] [CrossRef] [Scilit]
- Nandi, D.; Ashour, A.S.; Samanta, S.; Chakraborty, S.; Salem, M.A.M.; Dey, N. Principal Component Analysis in Medical Image Processing: A Study. Int. J. Image Min. 2015, 1, 65–86. [Google Scholar] [CrossRef] [Scilit]
- Sarvamangala, D.R.; Kulkarni, R.V. Convolutional Neural Networks in Medical Image Understanding: A Survey. Evol. Intell. 2022, 15, 1–22. [Google Scholar] [CrossRef] [Scilit] [PubMed]
- Sharma, S. Drawing Insights from COVID-19-Infected Patients Using CT Scan Images and Machine Learning Techniques: A Study on 200 Patients. Environ. Sci. Pollut. Res. 2020, 27, 37155–37163. [Google Scholar] [CrossRef] [Scilit] [PubMed]
- Rezaeijo, S.M.; Ghorvei, M.; Abedi-Firouzjah, R.; Mojtahedi, H.; Zarch, H.E. Detecting COVID-19 in chest images based on deep transfer learning and machine learning algorithms. Egypt. J. Radiol. Nucl. Med. 2021, 52, 145. [Google Scholar] [CrossRef] [Scilit]
- Abdi, H.; Williams, L.J. Principal Component Analysis. WIREs Comput. Stat. 2010, 2, 433–459. [Google Scholar] [CrossRef] [Scilit]
- Healy, J.; McInnes, L. Uniform Manifold Approximation and Projection. Nat. Rev. Methods Prim. 2024, 4, 82. [Google Scholar] [CrossRef] [Scilit]
- McInnes, L.; Healy, J.; Saul, N.; Großberger, L. UMAP: Uniform Manifold Approximation and Projection. J. Open Source Softw. 2018, 3, 861. [Google Scholar] [CrossRef] [Scilit]
- Coifman, R.R.; Lafon, S.; Lee, A.B.; Maggioni, M.; Nadler, B.; Warner, F.; Zucker, S.W. Geometric Diffusions as a Tool for Harmonic Analysis and Structure Definition of Data: Diffusion Maps. Proc. Natl. Acad. Sci. USA 2005, 102, 7426–7431. [Google Scholar] [CrossRef] [Scilit] [PubMed]
- Cox, D.R. The Regression Analysis of Binary Sequences. J. R. Stat. Soc. Ser. B Methodol. 1958, 20, 215–242. [Google Scholar] [CrossRef] [Scilit]
- Chen, T.; Guestrin, C. XGBoost: A Scalable Tree Boosting System. In Proceedings of the 22nd ACM SIGKDD International Conference on Knowledge Discovery and Data Mining; ACM: New York, NY, USA, 2016; pp. 785–794. [Google Scholar] [CrossRef] [Scilit]
- Sayed, S.A.-F.; Elkorany, A.M.; Mohammad, S.S. Applying different machine learning techniques for prediction of COVID-19 severity. IEEE Access 2021, 9, 135697–135707. [Google Scholar] [CrossRef] [Scilit] [PubMed]
- Patel, R.K.; Kashyap, M. Automated diagnosis of COVID stages from lung CT images using statistical features in 2-dimensional flexible analytic wavelet transform. Biocybern. Biomed. Eng. 2022, 42, 829–841. [Google Scholar] [CrossRef] [Scilit] [PubMed]
- Ali, H.A.; Hariri, W.; Zghal, N.S.; Aissa, D.B. Comparing PCA-Based Machine Learning Algorithms for COVID-19 Classification Using Chest X-Ray Images. Baghdad Sci. J. 2025, 22, 27. [Google Scholar] [CrossRef] [Scilit]
- Saygılı, A. A new approach for computer-aided detection of coronavirus (COVID-19) from CT and X-ray images using machine learning methods. Appl. Soft Comput. 2021, 105, 107323. [Google Scholar] [CrossRef] [Scilit] [PubMed]

Disclaimer/Publisher’s Note: The statements, opinions and data contained in all publications are solely those of the individual author(s) and contributor(s) and not of MDPI and/or the editor(s). MDPI and/or the editor(s) disclaim responsibility for any injury to people or property resulting from any ideas, methods, instructions or products referred to in the content. |
© 2026 by the authors. Licensee MDPI, Basel, Switzerland. This article is an open access article distributed under the terms and conditions of the Creative Commons Attribution (CC BY) license.