


Abstract
To address the problem that the detection performance of existing spectrum sensing algorithms degrades or even fails under impulsive noise, this paper proposes a generalized energy detection-based spectrum sensing algorithm. Theoretical analysis verifies that the proposed algorithm can effectively mitigate the adverse effects of impulsive noise, realize high-precision signal detection, and enhance system reliability with fewer samples. Furthermore, through statistical theoretical analysis, the probability density function of the detection statistic is provided for both scenarios where the primary user signal is absent and present. The probabilities of false alarm and missed detection are also derived, and the threshold corresponding to a prescribed false alarm probability is determined. Finally, simulation results demonstrate the effectiveness of the generalized energy detection algorithm.
1. Introduction
With the development of electronic information and communication technologies, radio communication technology is widely applied in traditional industries such as civil aviation, railways, meteorology, and electricity, as well as emerging industries such as smart city construction and the Internet of Things (IoT). It brings exponential growth in the number of radio equipment and wireless services, which has caused a high demand for spectrum resources. Due to the scarcity of spectrum resources, the current static spectrum allocation method has led to an increasingly tight supply of spectrum resources. Against the backdrop of growing spectrum scarcity and the low utilization efficiency of allocated spectrum resources, cognitive radio (CR) has emerged as a highly promising technology to address this critical challenge in modern wireless communication systems [1,2]. A key characteristic of CRtechnology is that secondary users (SUs), who lack spectrum licenses, are authorized to opportunistically utilize the idle spectrum bands when primary users (PUs) are not occupying the frequency bands. To realize this opportunistic spectrum access, SUs must frequently perform spectrum sensing to identify idle licensed spectrum, utilize these available resources efficiently, and immediately relinquish them upon the detection of active PUs. This underscores the pivotal role of spectrum sensing as a core functionality in CR technology.
In the early research on spectrum sensing, a large number of algorithms have been proposed, including the energy detector [3,4], the matched filtering method [5,6], and the cyclostationary detection method [7,8]. Energy detector sensing is the most common way of spectrum sensing. The signal is detected by comparing the output of the energy detector with a threshold. The algorithm has low computational and implementation complexities as receivers do not need any knowledge of the primary users’ signal. However, the detection performance highly depends on the environmental conditions including signal-to-noise ratio (SNR) variations and channel fading. This means that energy detection requires perfect knowledge of the noise power; otherwise, it will lead to an SNR wall and a high false alarm probability [9,10]. The matched filtering method uses less time to achieve a certain detection performance compared to other methods. However, it requires complete prior knowledge of the channel responses from the primary user to the receiver, such as the operating frequency, modulation type, and pulse shaping [11,12,13]. Also, the detection performance decreases under non-Gaussian conditions due to the noise’s long tail features. Cyclostationary detection exploits the cyclostationarity features of the received signals which can differentiate noise from primary users’ signals. However, the cyclic spectrum used in this method has a much higher computational complexity [14,15,16]. It requires more demands on signal processing abilities and longer observation times.
All the aforementioned methods share a common drawback because they only consider the Gaussian noise assumption; however, in practice, this assumption is not always valid since several existing noise types exhibit non-Gaussian and impulsive behavior. As has been proven, the alpha-stable distribution can characterize non-Gaussian noise in practical scenarios and has garnered considerable attention in the signal processing field [17,18]. However, owing to the long-tailed characteristic of α-stable distributed noise, its second- and higher-order moments tend to infinity. Thus, all methods based on second-order or higher-order statistics cannot perform effectively.
Although the alpha-stable distribution does not have finite second or higher moments, its fractional-order moments are finite. Thus, the fractional low-order moment (FLOM) method [14] has been embraced as a viable signal processing approach to deal with alpha-stable distributed noise and reduce the influence of large noise. In addition, some amplitude-limited functions are also employed to mitigate the influence of the infinite higher-order moments of impulsive noise. Then, conventional spectrum sensing algorithms can be employed in impulsive noise environments. There are the logarithmic moment (LM) and arctangent (ARCTAN) detection methods proposed by Luo J et al. [19] and K. Kumar et al. [20], respectively. While these methods partially alleviate the influence of impulsive noise, the data contaminated by such noise remain to have a considerable impact on the detection statistic, which degrades the overall performance of these algorithms.
Furthermore, a kernel energy-driven detector (KED) was proposed by Argin M. and colleagues in [21]. This approach integrates the elementary simplicity of the conventional energy detector with the strong effectiveness of bounded higher-order moments in suppressing and mitigating impulsive noise, thus yielding favorable detection performance. Nevertheless, its detection performance is highly dependent on a width parameter, which is notoriously difficult to tune optimally. Furthermore, the KED exhibits a markedly higher computational complexity in contrast to both the conventional energy detect algorithm and the FLOM algorithm.
In this paper, we propose a generalized energy detection-based spectrum sensing algorithm. The main contributions of this paper are as follows:
- By analyzing the characteristics of the impulsive noise, the GED algorithm is identified as an efficient approach for spectrum sensing, as it satisfies three requirements: robust suppression of impulsive noise, high sensing accuracy, and no requirement for prior knowledge of PU signals.
- Theoretical analysis demonstrates that the GED algorithm exhibits superior sensing performance over the FLOM-based method through the inhibition ratio function and detection sensitivity ratio function, as will be explained in Section 3. Furthermore, analytical comparisons demonstrate that the proposed GED outperforms KED in both detection performance and computational efficiency.
- Through statistical analysis, the probability distribution of the test statistic is provided for both the absence and the presence of primary user signals. The probabilities of false alarm and detection probability are derived. Also, the process of the GED algorithm is given.
- For the case of the alpha-stable noise scenario, the simulation results given in Section 4 show a superior sensing capability of the GED algorithm compared to the FLOM, KED and arctan algorithm. In addition, the GED algorithm has a low computational complexity and good performance with small sample sizes.
2. System Model
The system which consists of a single primary user (PU) and a single sensing user (SU) is adopted in this paper. Multipath propagation exists between the PU and the SU, i.e., a frequency selective channel. The received signal of the sensing user at instant is given by
where is the channel response. is the transmitted primary user signals with zero mean, and it is independent and identically distributed. denotes the noise-free signal; the symbol represents convolution. The sequence of impulsive noise satisfies the alpha-stable distribution. Since the alpha-stable distribution has no closed probability density function [11], it is expressed by the following characteristic function:
The aforementioned characteristic function is fully defined by four parameters: an index of stability or characteristic exponent , a symmetric parameter , a scale parameter and a location parameter . The parameter determines the thickness of the trailing of the distribution function. A smaller indicates a more severe noise spike. indicates a symmetric distribution (), especially while indicates a Gaussian distribution [20,22].
Supposing that is the number of received samples, it can be written as
The objective is to construct the test statistic using the received samples and derive the detection threshold from the probability distribution of the test statistic. On this basis, the test statistic is compared with the threshold to judge whether a signal exists, i.e.,
where assumption denotes that a signal is present, and denotes that a signal is absent.
3. Spectrum Sensing Algorithm Based on Generalized Energy Detection
It is worth noting that fractional low-order moments (FLOMs) have been widely used in the field of spectrum sensing and have better performance than the energy detection algorithms in impulsive noise environments. Equation (5) shows the decision statistics of FLOM:
is the order of the statistic, and must be less than under the alpha-stable distribution noise. We noticed that the FLOM algorithm applies p-order fractional power as the transformation function, which takes the form , applied to the receive signal.
Since the impulse noise satisfied the alpha-stable distribution, it does not have a finite second-order moment as we mentioned in the introduction, causing a failure of the traditional energy detection algorithm. Thus, we need to apply some transformation functions on the signal and construct new statistics which exist at a finite value under the alpha-stable distribution noise. Thus, the algorithm must meet three conditions as follows:
(1) Large values affected by impulsive noise should be suppressed via a transformation function, which should ensure that the statistics are finite and sensitive to changes in the signal to detect whether there is a PU signal.
(2) The algorithm should have low complexity and a short detection time, i.e., a small sample size is required. Because it is in the CR system, the spectrum sensing algorithm should detect the presence of the PU as quickly as possible and take advantage of the vacant spectrum or vacate it immediately.
(3) The algorithm should be effective with little knowledge of the PU’s signal, as there may be multiple PUs that use different operating frequencies, modulation types, etc.
Considering the advantage of the traditional ED sensing algorithm, this paper proposes a spectrum sensing algorithm based on generalized energy detection (GED) to improve performance under impulsive noise. The Gaussian transformation function is written as follows:
When the value of is large, which indicates the presence of impulsive noise, the function value tends to be zero. In contrast, when the value of has a relatively small change, especially when is within the range, the function value has approximately quadratic variation. This characteristic is beneficial to detect the presence of PU’s signal.
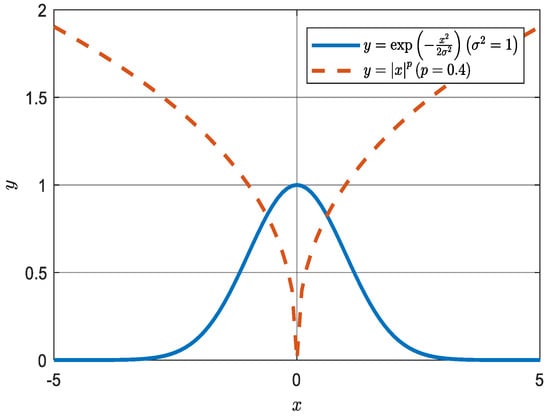
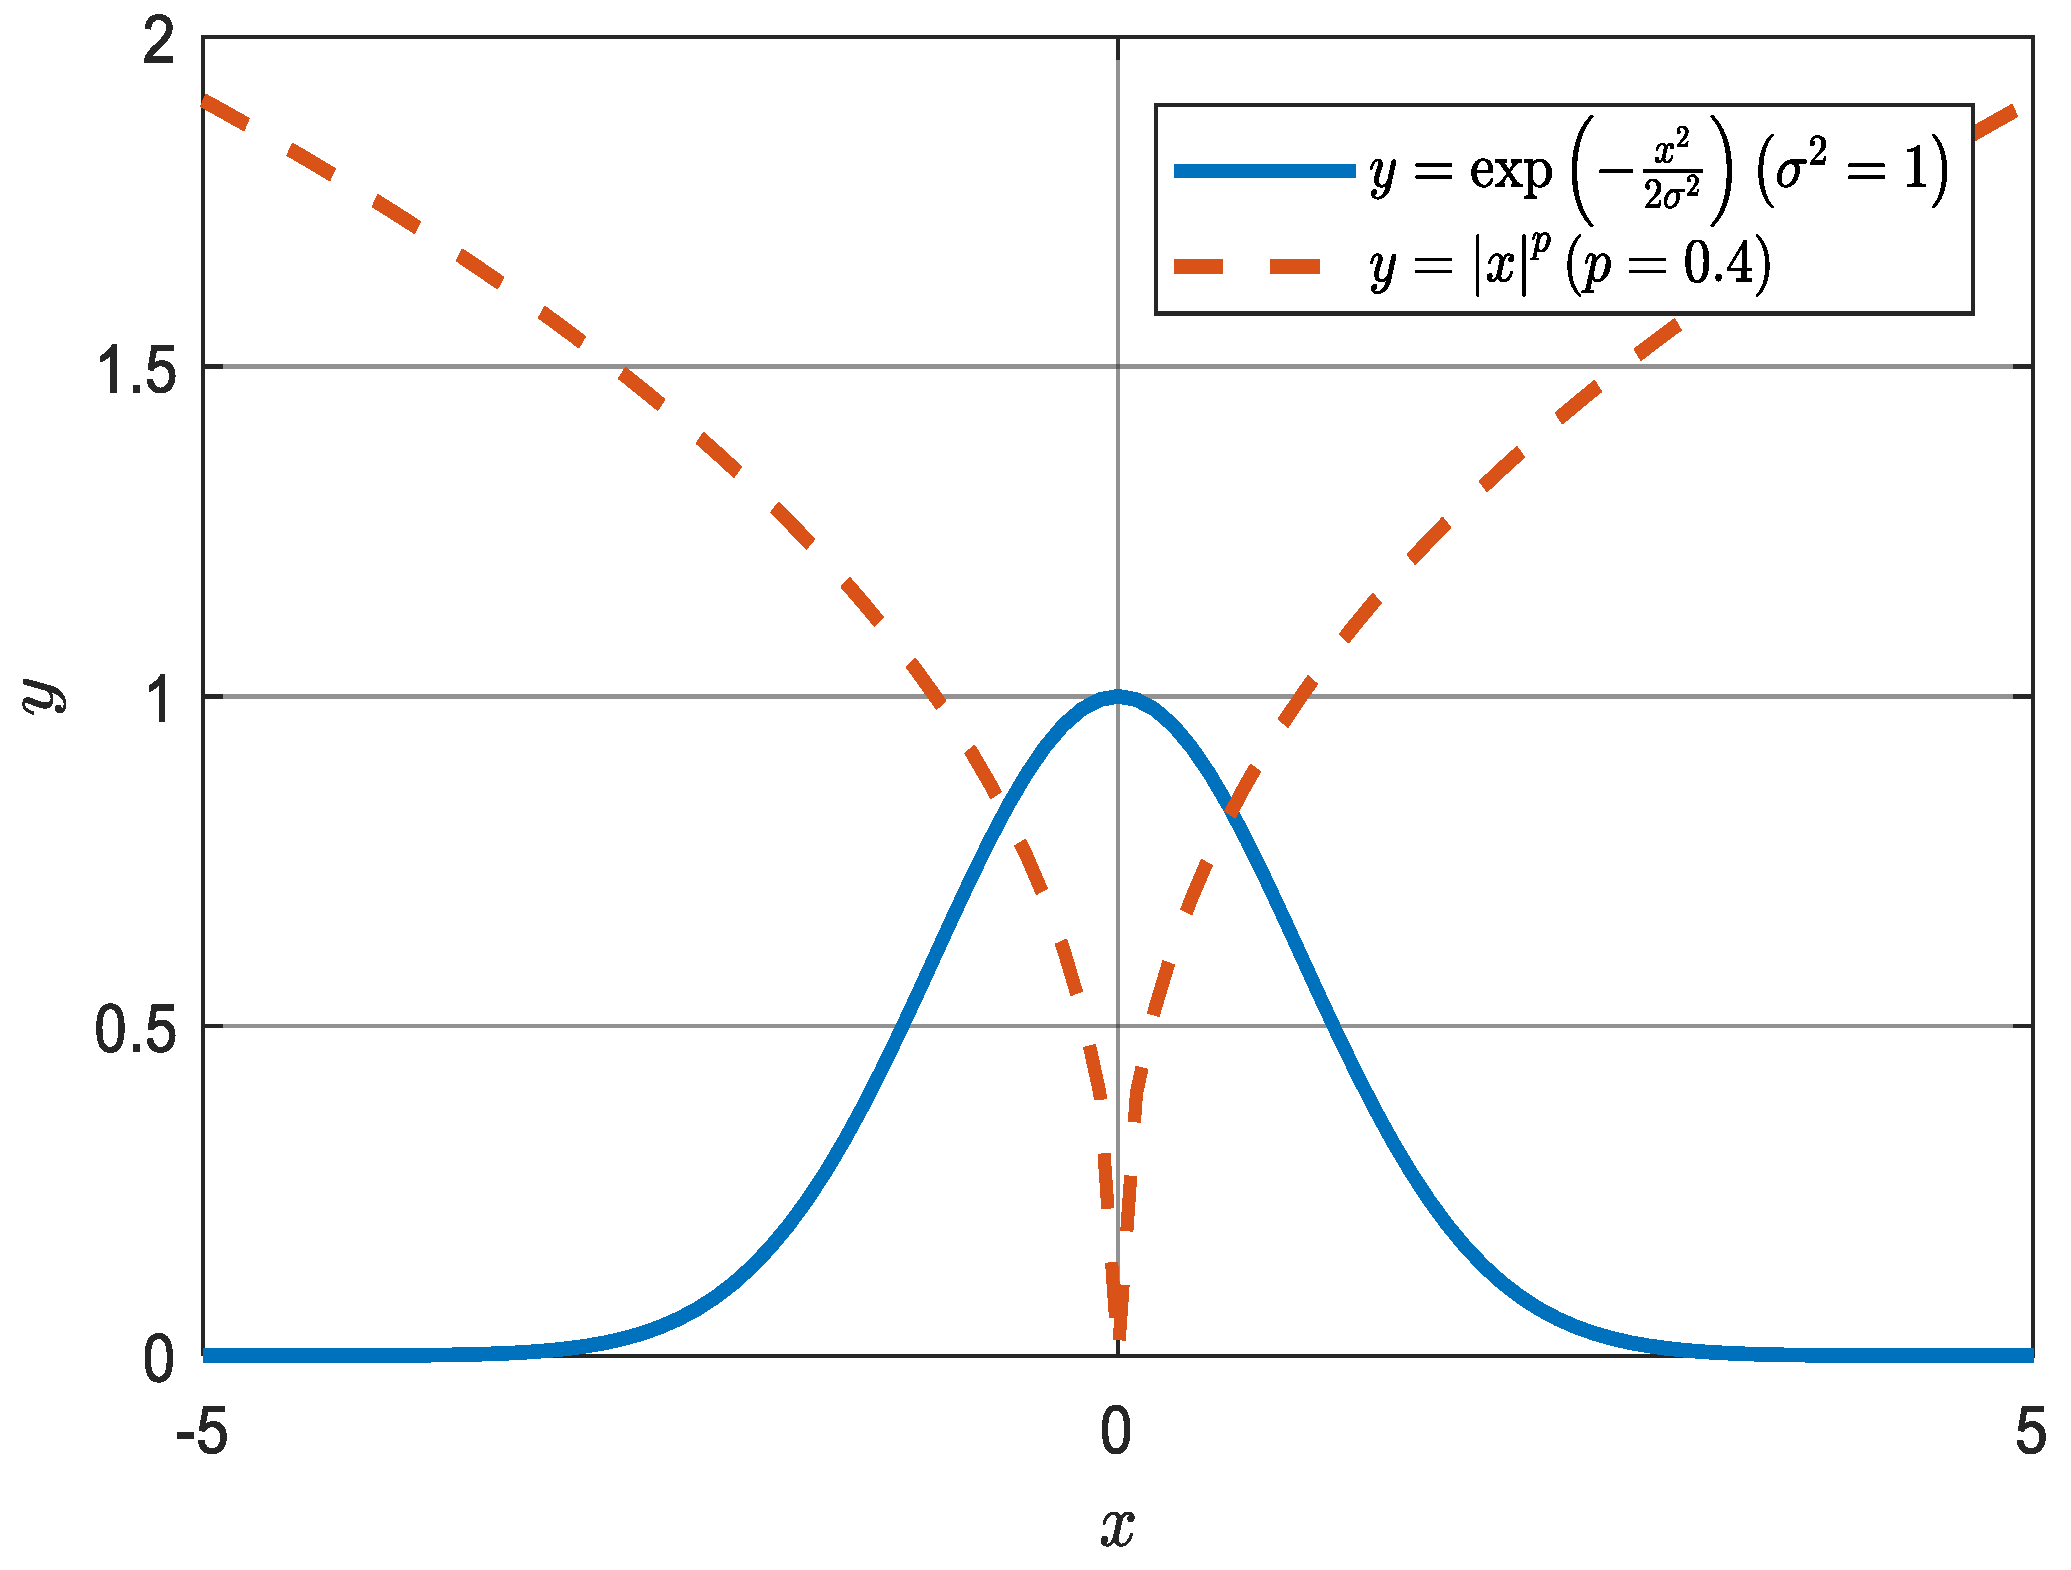
To intuitively compare the differences between the fractional low-order transformation function and the Gaussian function, we plot the curves of these two functions in Figure 1 as follows.
Figure 1.
Comparison of fractional low-order function and Gaussian function.
Figure 1 shows the curves of the Gaussian transformation function and the p-fractional power transformation function. It can be easily observed that the Gaussian transformation function has better performance in suppressing impulsive noise, as its value rapidly falls to zero while the p-fractional power transformation function still has an increasing trend.
In order to quantitatively compare the performance between the FLOM method and the proposed Gaussian transformation function, we define two functions as follows:
(1) The inhibition ratio function is shown in Formula (8):
Here, is the transformation function, e.g., , for the Gaussian transformation; represents the relatively large value under the impulse noise . shows the ability of the particular function to suppress impulse noise. Lower indicates better performance in suppressing impulsive noise, as a small means that the large value contributes little to the detection statistics.
(2) The detection sensitivity ratio function is shown in Formula (8):
where , and the represents the small value changes on the receive signal x.
shows the detection sensitivity of the transformation function. In a low signal-to-noise ratio environment, whether the PU’s signal presence or not could only cause small value changes on receive signal. A larger means that small changes caused by the PU’s signal contribute greatly to the detection statistics. Thus, a larger indicates that the detection statistics have a high detection sensitivity, i.e., are more likely to sense PU’s signal in a low signal-to-noise ratio environment.
Table 1.
Comparison of between FLOM and GED ().
Table 2.
Comparison of between FLOM and GED ().
According to Table 1 and Table 2, it can be concluded that the generalized energy detection has better performance than the FLOM algorithm as the former has both a lower and higher .
Therefore, the decision statistics can be written as follows:
Here, is the sampling points of the received signal and denotes the variance, which determines the width of the Gaussian transformation function.
Remark 1.
Compared with the KED method (), the proposed GED method has the following advantages: (1) the proposed method detects the presence or absence of a signal by exploiting the difference between the received data containing the signal and that with only noise. In contrast, the kernel energy detection method identifies the signal’s presence or absence by leveraging the fact that the discrepancy among received samples when the signal is present in the received data is larger than that among samples when the received data only contain noise. Generally, the data difference between the signal-present and signal-absent scenarios is greater than the difference in the sample discrepancy between the two aforementioned cases. This leads to a better detection performance of the proposed algorithm, which will be further verified by the subsequent simulation analysis. An additional advantage is that this significant discrepancy renders the proposed method less sensitive to the choice of variance , thus enhancing its robustness. (2) In terms of computational complexity, given samples and neglecting addition and subtraction operations, the proposed GED only requires multiplications and exponentiations, while the KED algorithm needs multiplications and exponentiations. Therefore, the following conclusion is drawn: the proposed generalized energy detection algorithm is superior to the kernel energy detection algorithm both in detection performance and computational complexity.
4. Theoretical Analysis
According to (9), the test statistic is a summation over some identically distributed random variables, due to the fact that the transmission signal undergoes convolution in the time domain after being transmitted through the channel. Thus, the received signals are no longer independent of each other, and the central limit theorem cannot be directly applied to find the asymptotic distribution of the . However, the received signal can be divided into several parts, such as , , and so on. Since the convolution characteristic of the channel is the finite length, the elements of are independent and identically distributed if is greater than the channel order. Thus, according to the central limit theorem, the test statistic follows a normal distribution under the assumptions of and as follows:
Here, is the mean value of the test statistic under hypothesis and is the variance of the test statistic under hypothesis .
and are defined and calculated as follows:
and
and are defined and calculated as follows:
and
The mean and variance of the constructed test statistic can be theoretically derived from the probability density function of the noise samples. Nevertheless, as no analytical expression exists for the probability density function of impulsive noise, the mean and variance of the test statistic are instead estimated from the statistical characteristics of the received samples.
and
There are several decision criteria in signal statistical detection theory, such as the minimum mean probability of error criterion, the maximum likelihood criterion, and the Neyman–Pearson criterion. The Neyman–Pearson criterion is particularly suitable for signal detection problems such as radar and sonar. In this type of information system, we are mainly concerned about the false alarm probability, , and the detection probability, . Also, in the Neyman–Pearson criterion, the significance level is predetermined: researchers specify the probability threshold for accepting or rejecting the null hypothesis during hypothesis testing. This renders statistical inference more explicit and controllable, facilitating a reliable assessment of system performance. This makes it applicable to a wide range of signal detection problems.
According to (13) and (14), the false alarm probability of this sensing algorithm is
where is defined as .
When is given, the sensing threshold can be expressed as
And the detection probability of this sensing algorithm is
To sum up, by comparing (9) with the sensing threshold (16), spectrum sensing results can be provided. The detailed operation of the proposed GED is summarized in Algorithm 1.
| Algorithm 1: The Proposed GED |
| (1) Initialization: Acquisition of the received signal ; Do (2) Calculating the detection statistic According to (9); |
| (3) Calculating ) according to (14) to (16), respectively; (4) Obtaining the threshold by using Equation (16); (5) The presence of a primary user signal is determined in accordance with (18). |
| (18) End (6) Return . |
5. Computational Complexity Analysis
In addition to the algorithm performance, another factor we care about is the computational complexity (cost) of the algorithm. Next, we compare the computational complexity of several common spectrum sensing algorithms applicable to impulsive noise environments, including the FLOM, ARCTAN, KED, and GED methods.
Assuming that there are samples and addition–subtraction operations are neglected, FLOM requires one multiplication to compute the sample magnitude and one exponential operation for a single sample. Therefore, FLOM requires approximately multiplications and power operations. Similarly, ARCTAN requires multiplications and arctangent operations. GED requires multiplications and exponential operations. KED determines the presence of a signal by judging the difference between pairs of received samples, which varies depending on whether the samples contain the signal. Therefore, KED processes two samples at a time and requires a relatively large memory. Moreover, for samples, the number of combinations of two distinct samples is . Accordingly, KED requires multiplications and exponential operations.
Finally, the computational complexity of FLOM, ARCTAN, KED and GED is summarized in Table 3.
Table 3.
Computational complexity of FLOM, ARCTAN, KED and GED.
From the above analysis, the computational complexity of GED is comparable to that of FLOM and ARCTAN, while GED exhibits a higher computational complexity. Consequently, the execution of GED requires a longer time.
6. Simulation Results
This part presents the simulation results to compare the performances of various sensing algorithms including FLOM, ARCTAN, and KED with those of GED. The simulation is configured with the following parameters: the channel order is set to be 5, and the channel follows the Rayleigh fading model, i.e., the real and imaginary parts of the channel coefficients follow the Gaussian distribution; the transmission signal is BPSK signal. For the FLOM, its index is set to 0.4. The variance of GED and KED is fixed at 1. The alpha-stable distributed impulse noise is simulated as [23]. In addition, as alpha-stable distributed impulse noise does not have finite power, this paper uses the generalized SNR, i.e., , to measure the SNR under the impulsive noise, where denotes the signal power and is the dispersion coefficient of alpha-stable distribution. To render the GSNR meaningful, normalization of the channel coefficients is necessary, i.e., the -norm of the channel coefficient vector is enforced to be 1. The generation of alpha-stable noise is based on reference [23]. Each simulation result is the average of 500 Monte Carlo trials. Furthermore, the channel is updated once in accordance with the aforementioned channel generation method for every 50 Monte Carlo trials.
Moreover, the receiver operating characteristic (ROC) curves and the detection probability are adopted as the key metrics to quantify the detection performance of the algorithm. Since the theoretical threshold is difficult to obtain, the required detection threshold is estimated and determined through sufficient Monte Carlo experiments in the simulation process.
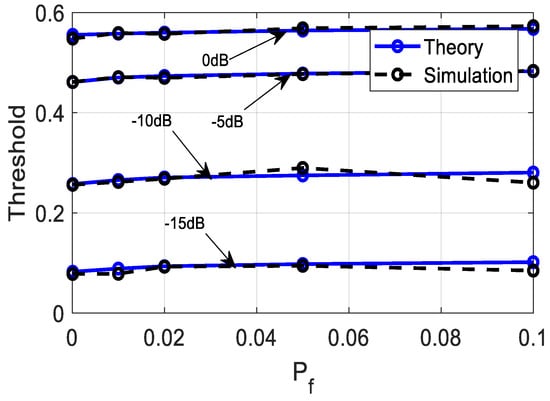
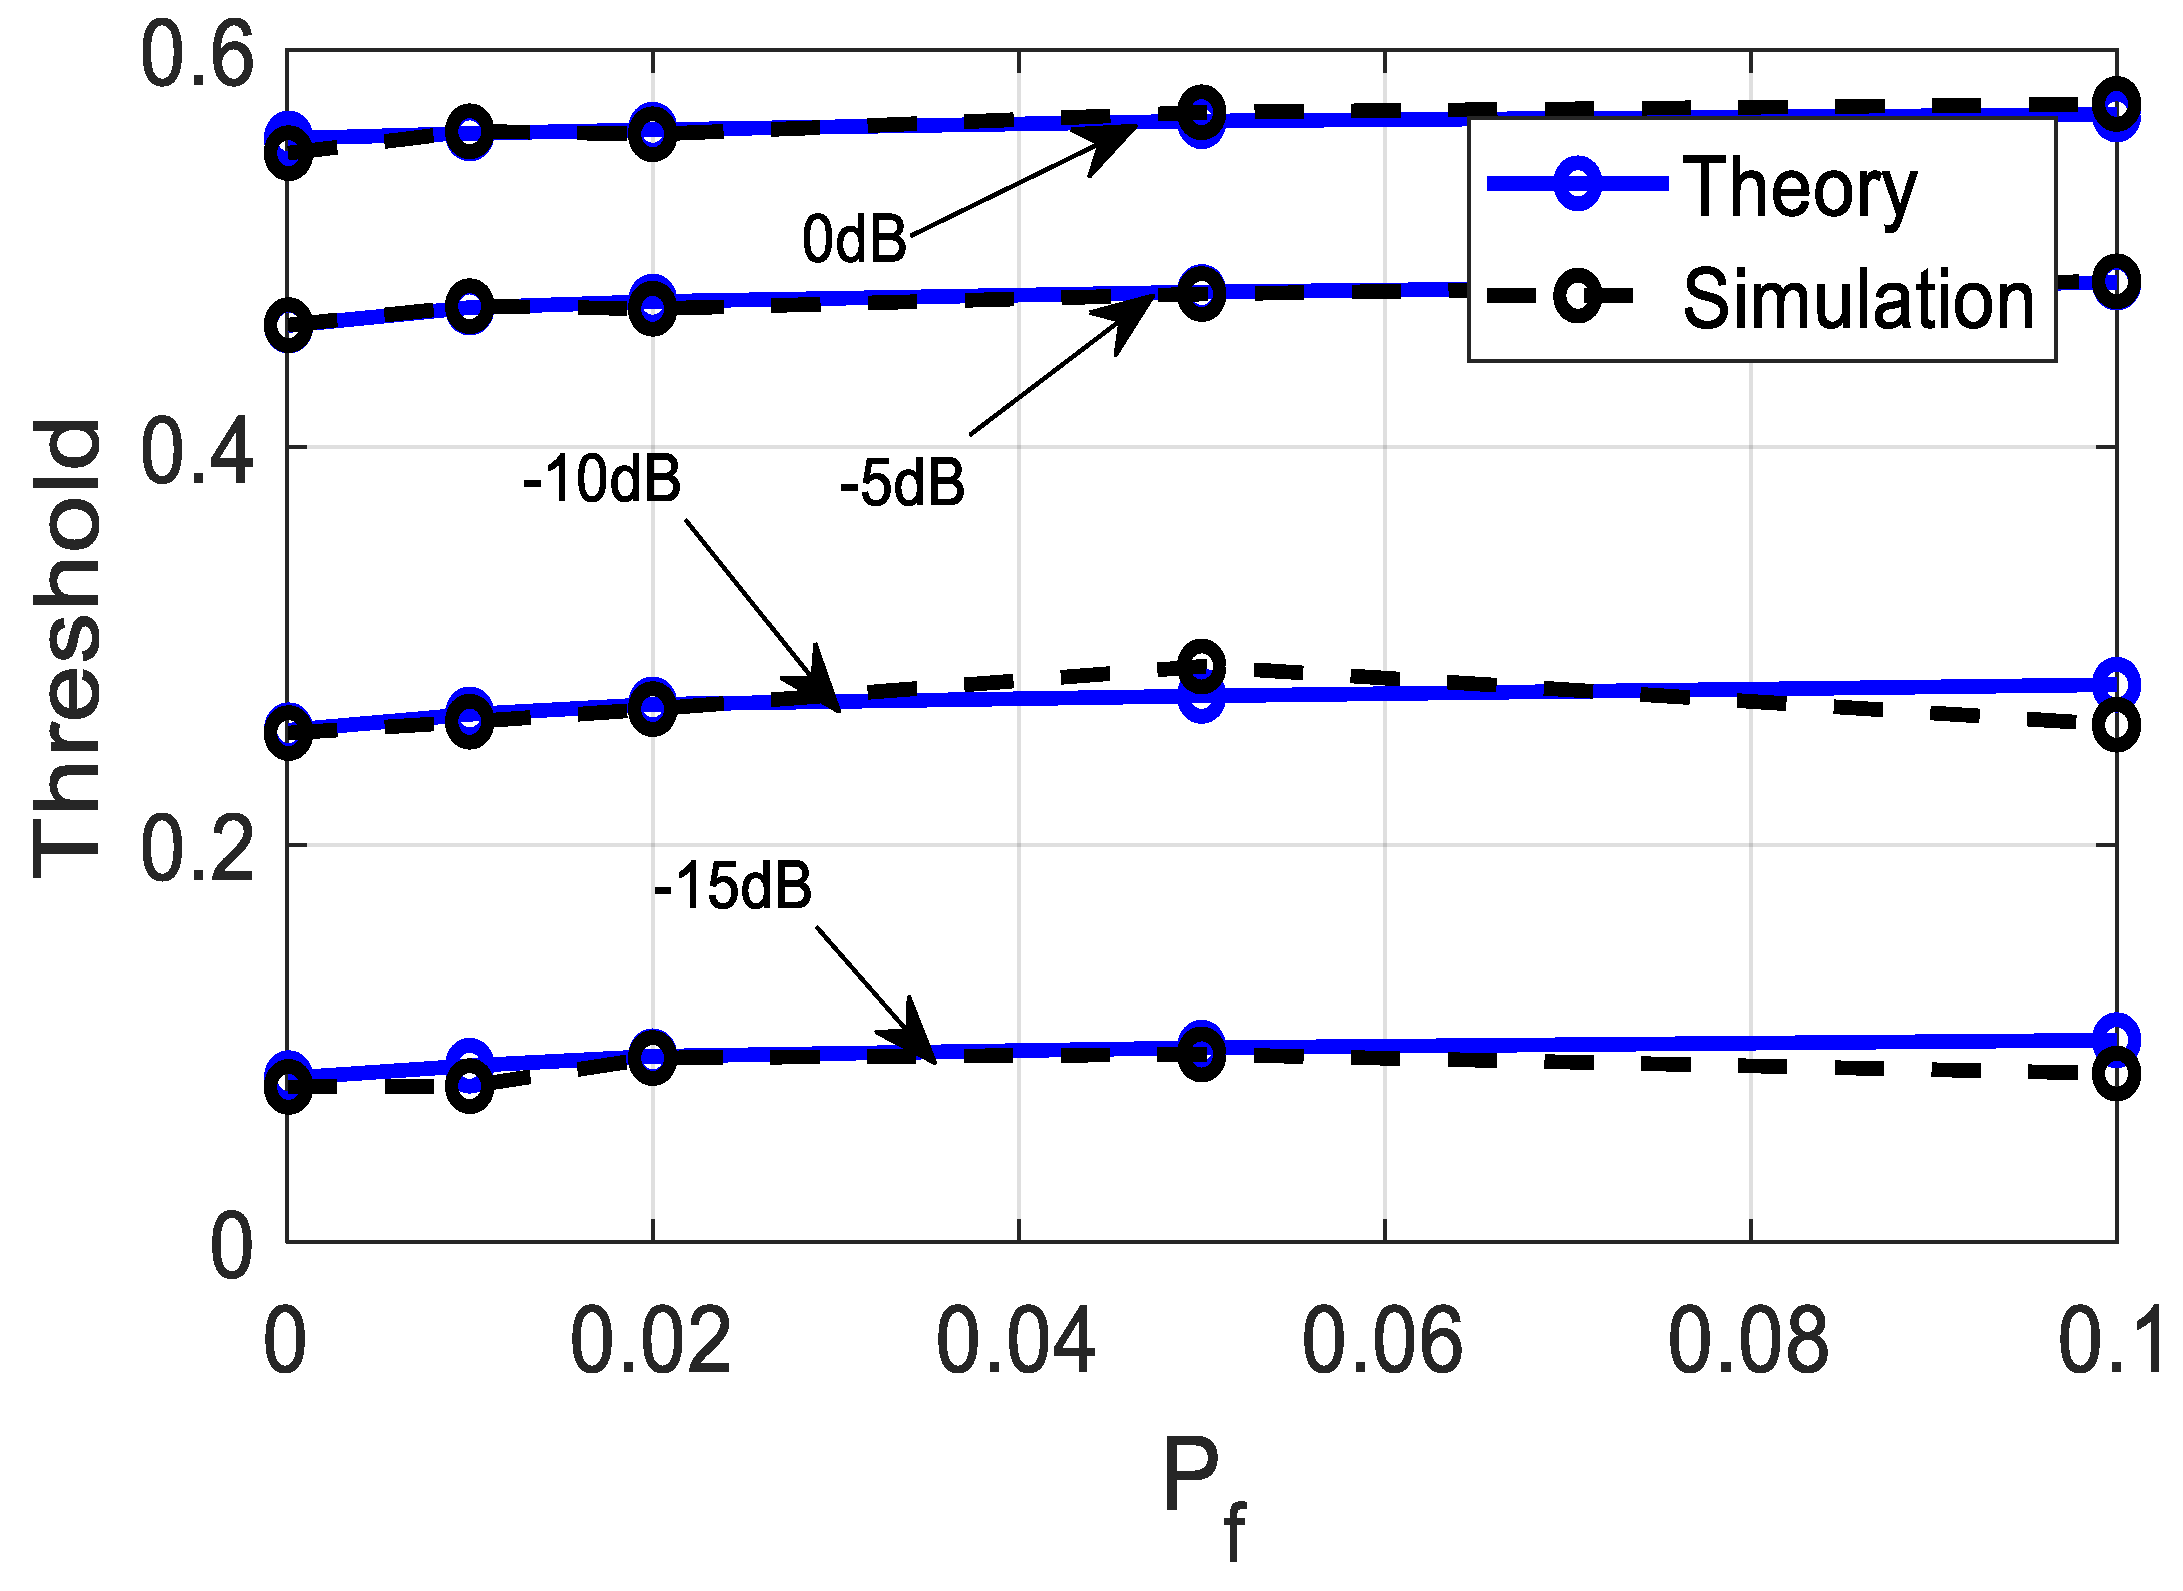
Given 200 samples and , we compared the theoretical thresholds of the proposed method with the simulation thresholds obtained via Monte Carlo experiments under the GSNR conditions ranging from −15 dB to 0 dB with an interval of 5 dB. As can be seen from Figure 2, the simulation thresholds are approximately equal to the theoretical thresholds, which verifies the correctness of our theoretical analysis. It is worth noting that the theoretical thresholds are difficult to calculate due to the absence of an analytical form for the alpha-stable distribution. In addition, it is hard for us to obtain signal-free received data in advance, making it equally impossible to derive the theoretical thresholds by using Equation (15). Thus, the simulation thresholds are adopted for spectrum sensing in practical engineering implementation. Furthermore, the approximation between the simulation thresholds and the theoretically derived thresholds also demonstrates the feasibility of the proposed method. Therefore, the simulation thresholds are used in the subsequent simulations.
Figure 2.
Theoretical threshold and simulation threshold of the proposed GED.
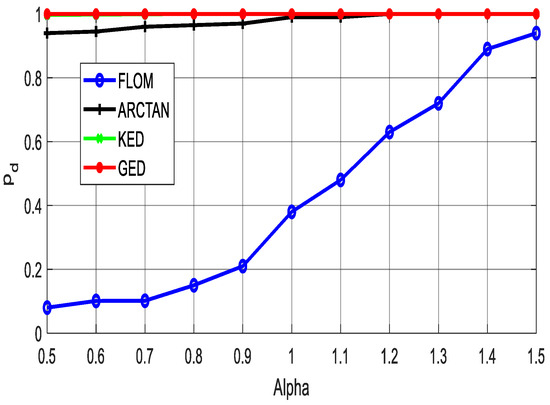
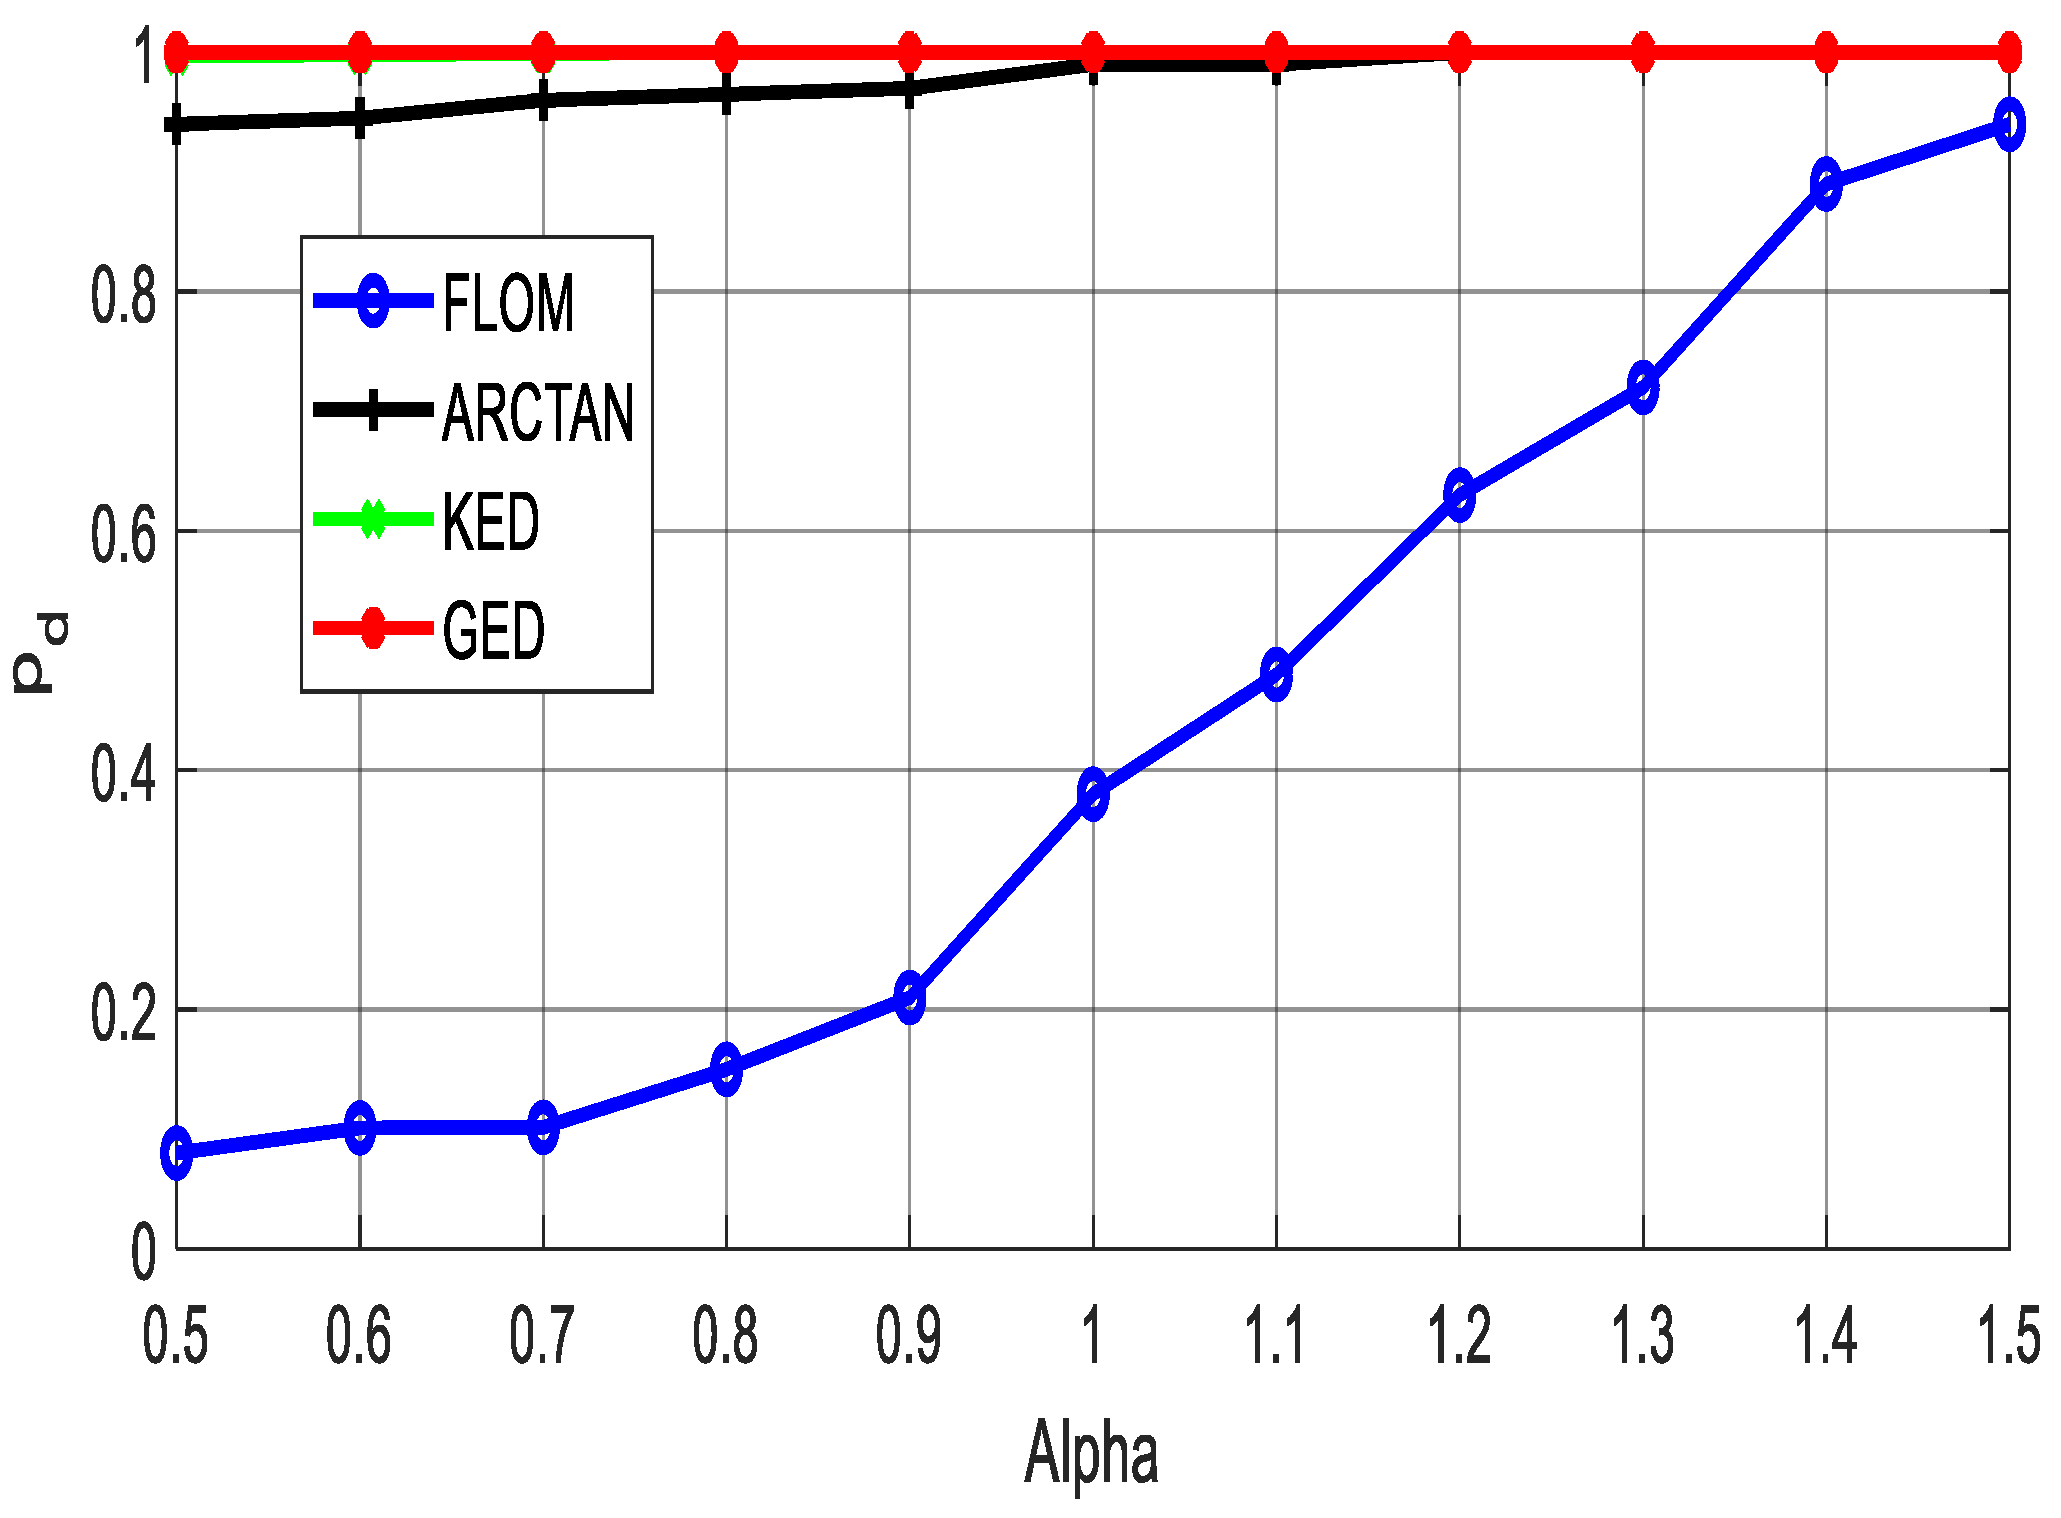
Consider the case that the sample number is 200, dB and . Figure 3 shows the changes in the detection probability with the parameter alpha for the FLOM, ARCTAN, KED, and the proposed GED method. Smaller values represent sharper impulse noise peaks, and a larger value means that the noise is closer to a Gaussian distribution. The results reveal that both the KED, GED and ARCTAN methods have a stable performance as is getting smaller, while the FLOM methods have a severe performance degradation.
Figure 3.
The versus for the FLOM, ARCTAN, KED, and GED methods when , dB and .
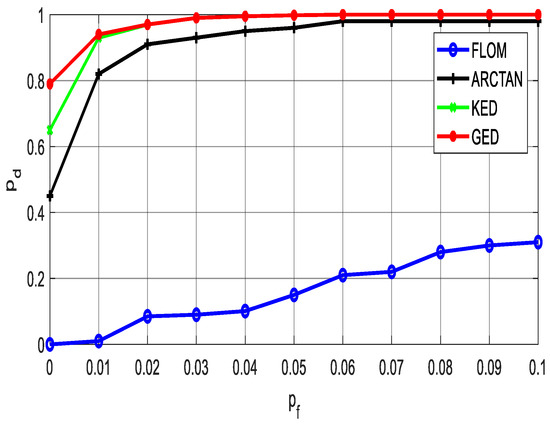
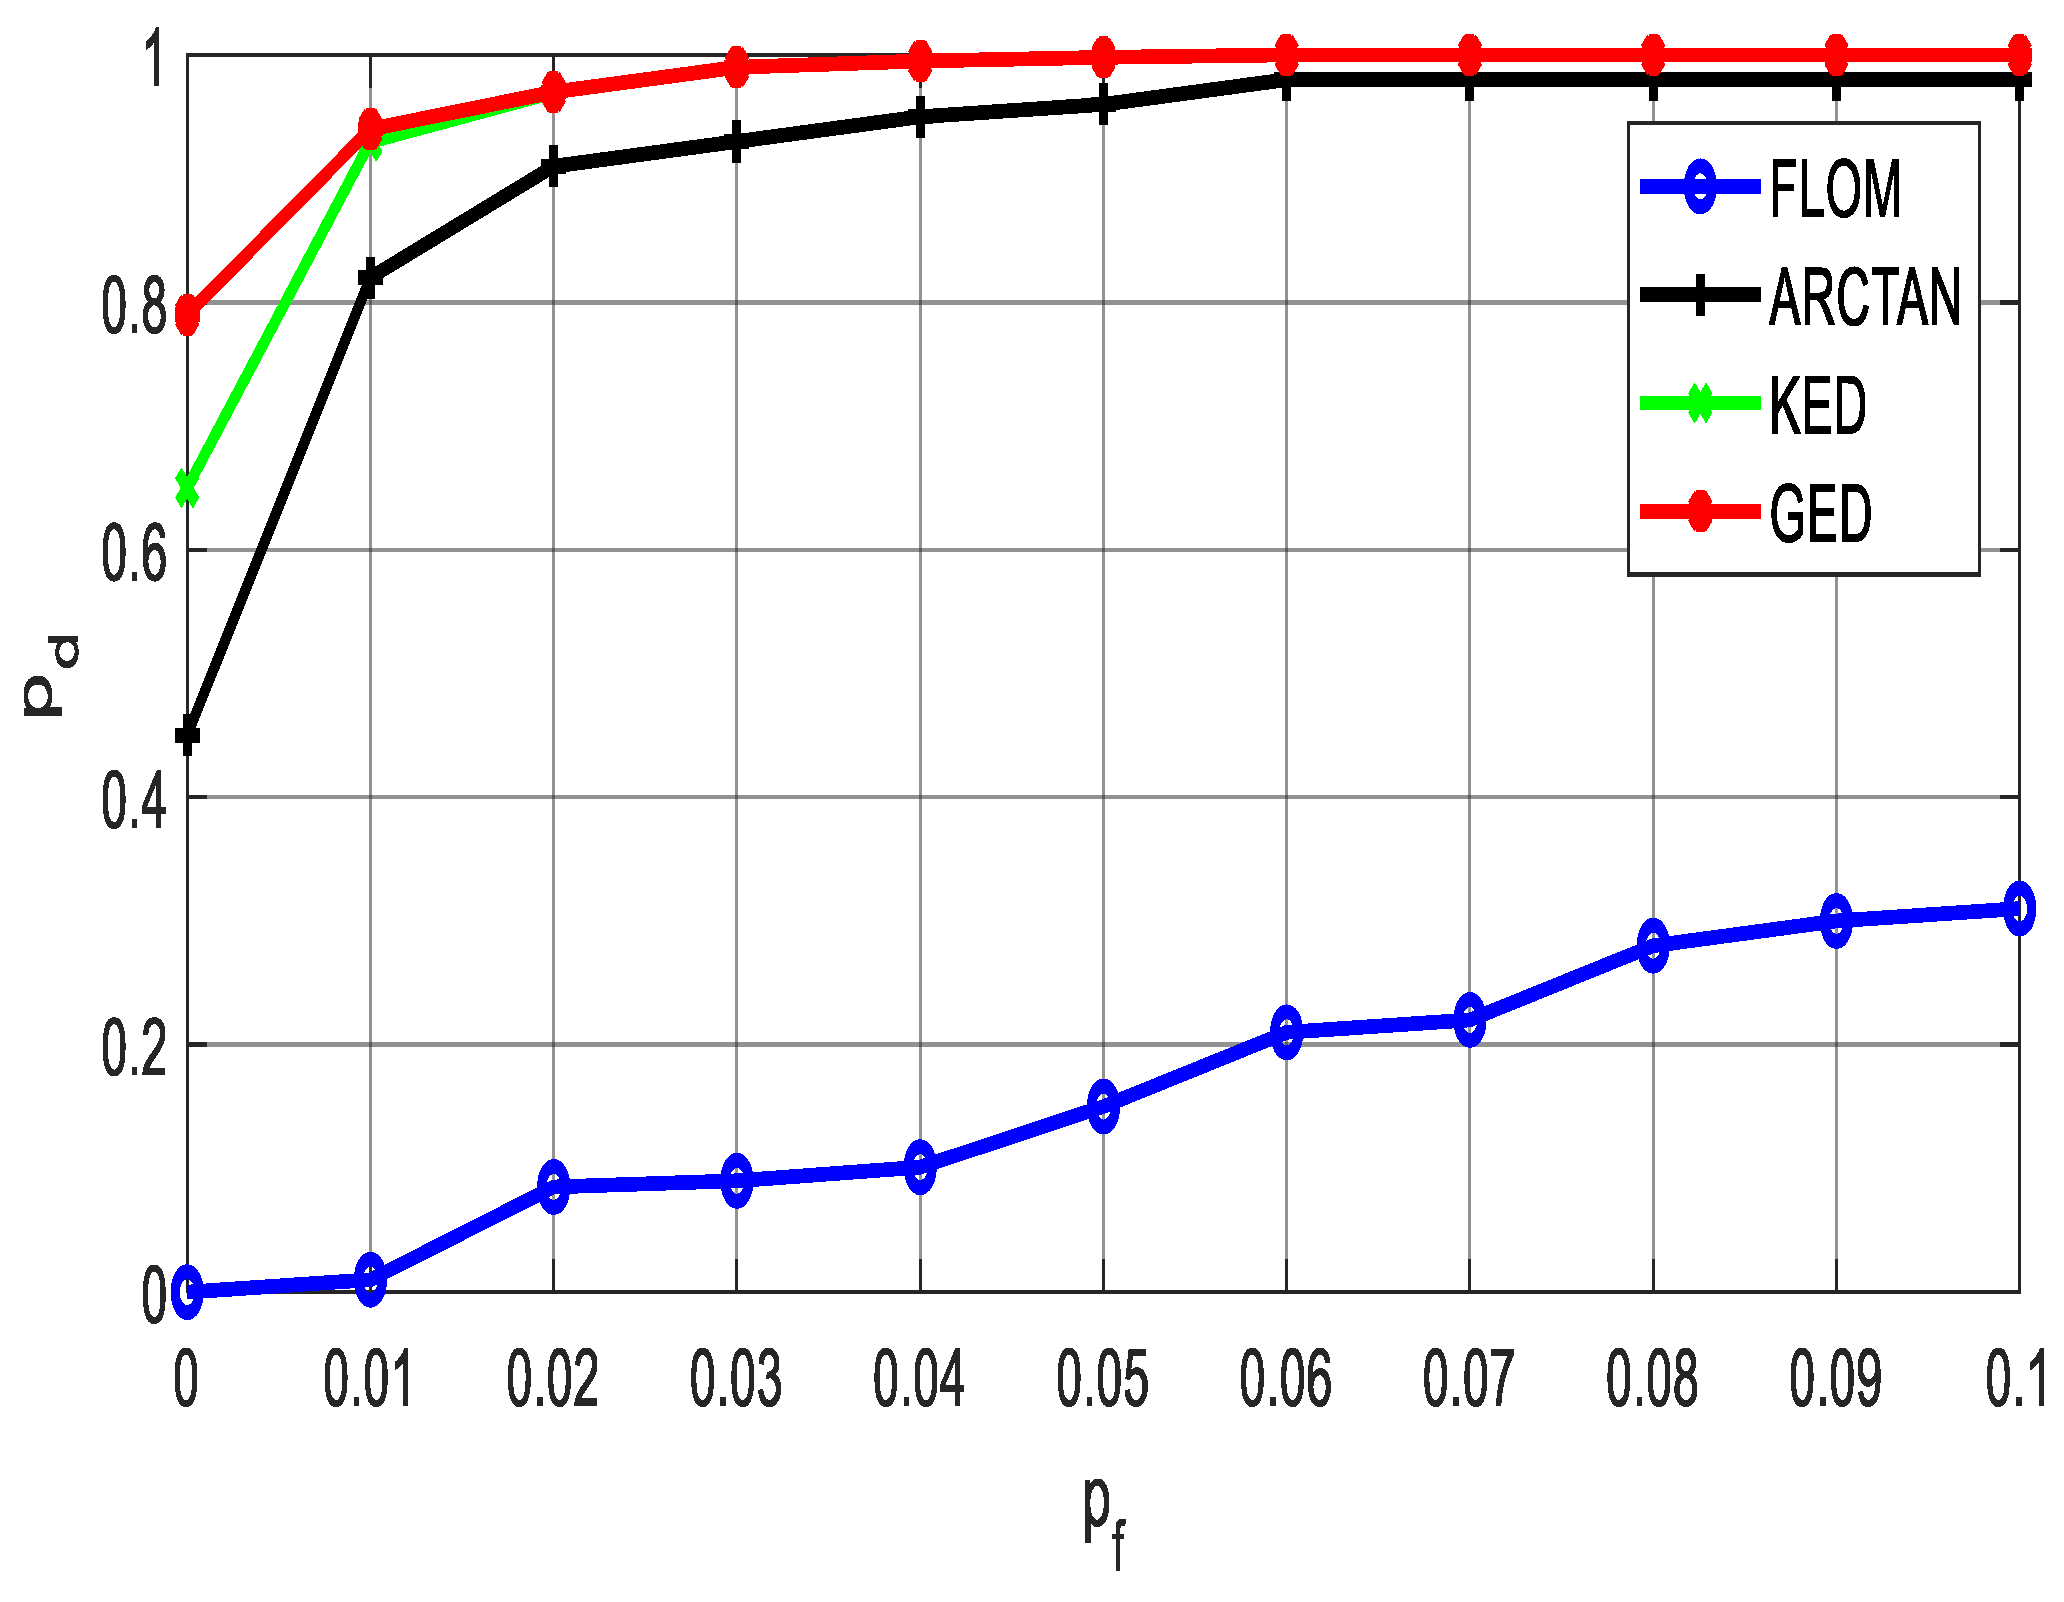
In Figure 4, the ROC curves depict the performance of the FLOM, ARCTAN, KED, and the newly proposed GED method. The GSNR is set to be 0 dB and 200 samples are used in the simulation.
Figure 4.
The ROC for the FLOM, KED, ARCTAN, and GED under the condition and dB.
The results reveal that the KED, GED, and ARCTAN methods outperform the FLOM method. This superiority is attributed to the fact that FLOM is limited to handling impulsive noise, and samples heavily corrupted by noise have a significant impact on the test statistic. Consequently, this method is adversely affected by impulsive noise, leading to suboptimal performance.
In contrast, the GED and KED methods exhibit strong capabilities in suppressing heavy noise, leading to superior detection performance. Specifically, upon comparing the KED and GED methods, it is evident that the GED method achieves a better detection performance when the false alarm probability is low. Additionally, the GED stands out for its simplicity, as its operations are proportional to the number of samples, making it less complex than the exponential operations involved in the KED method.
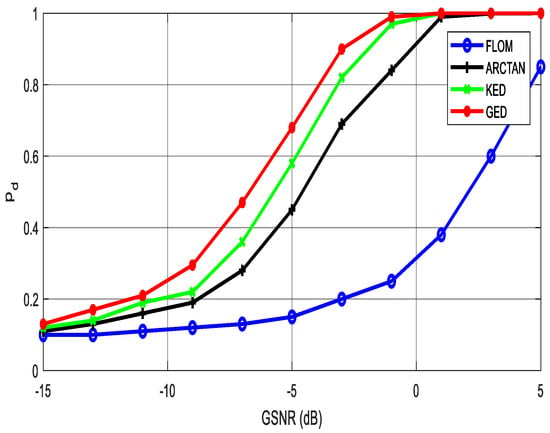
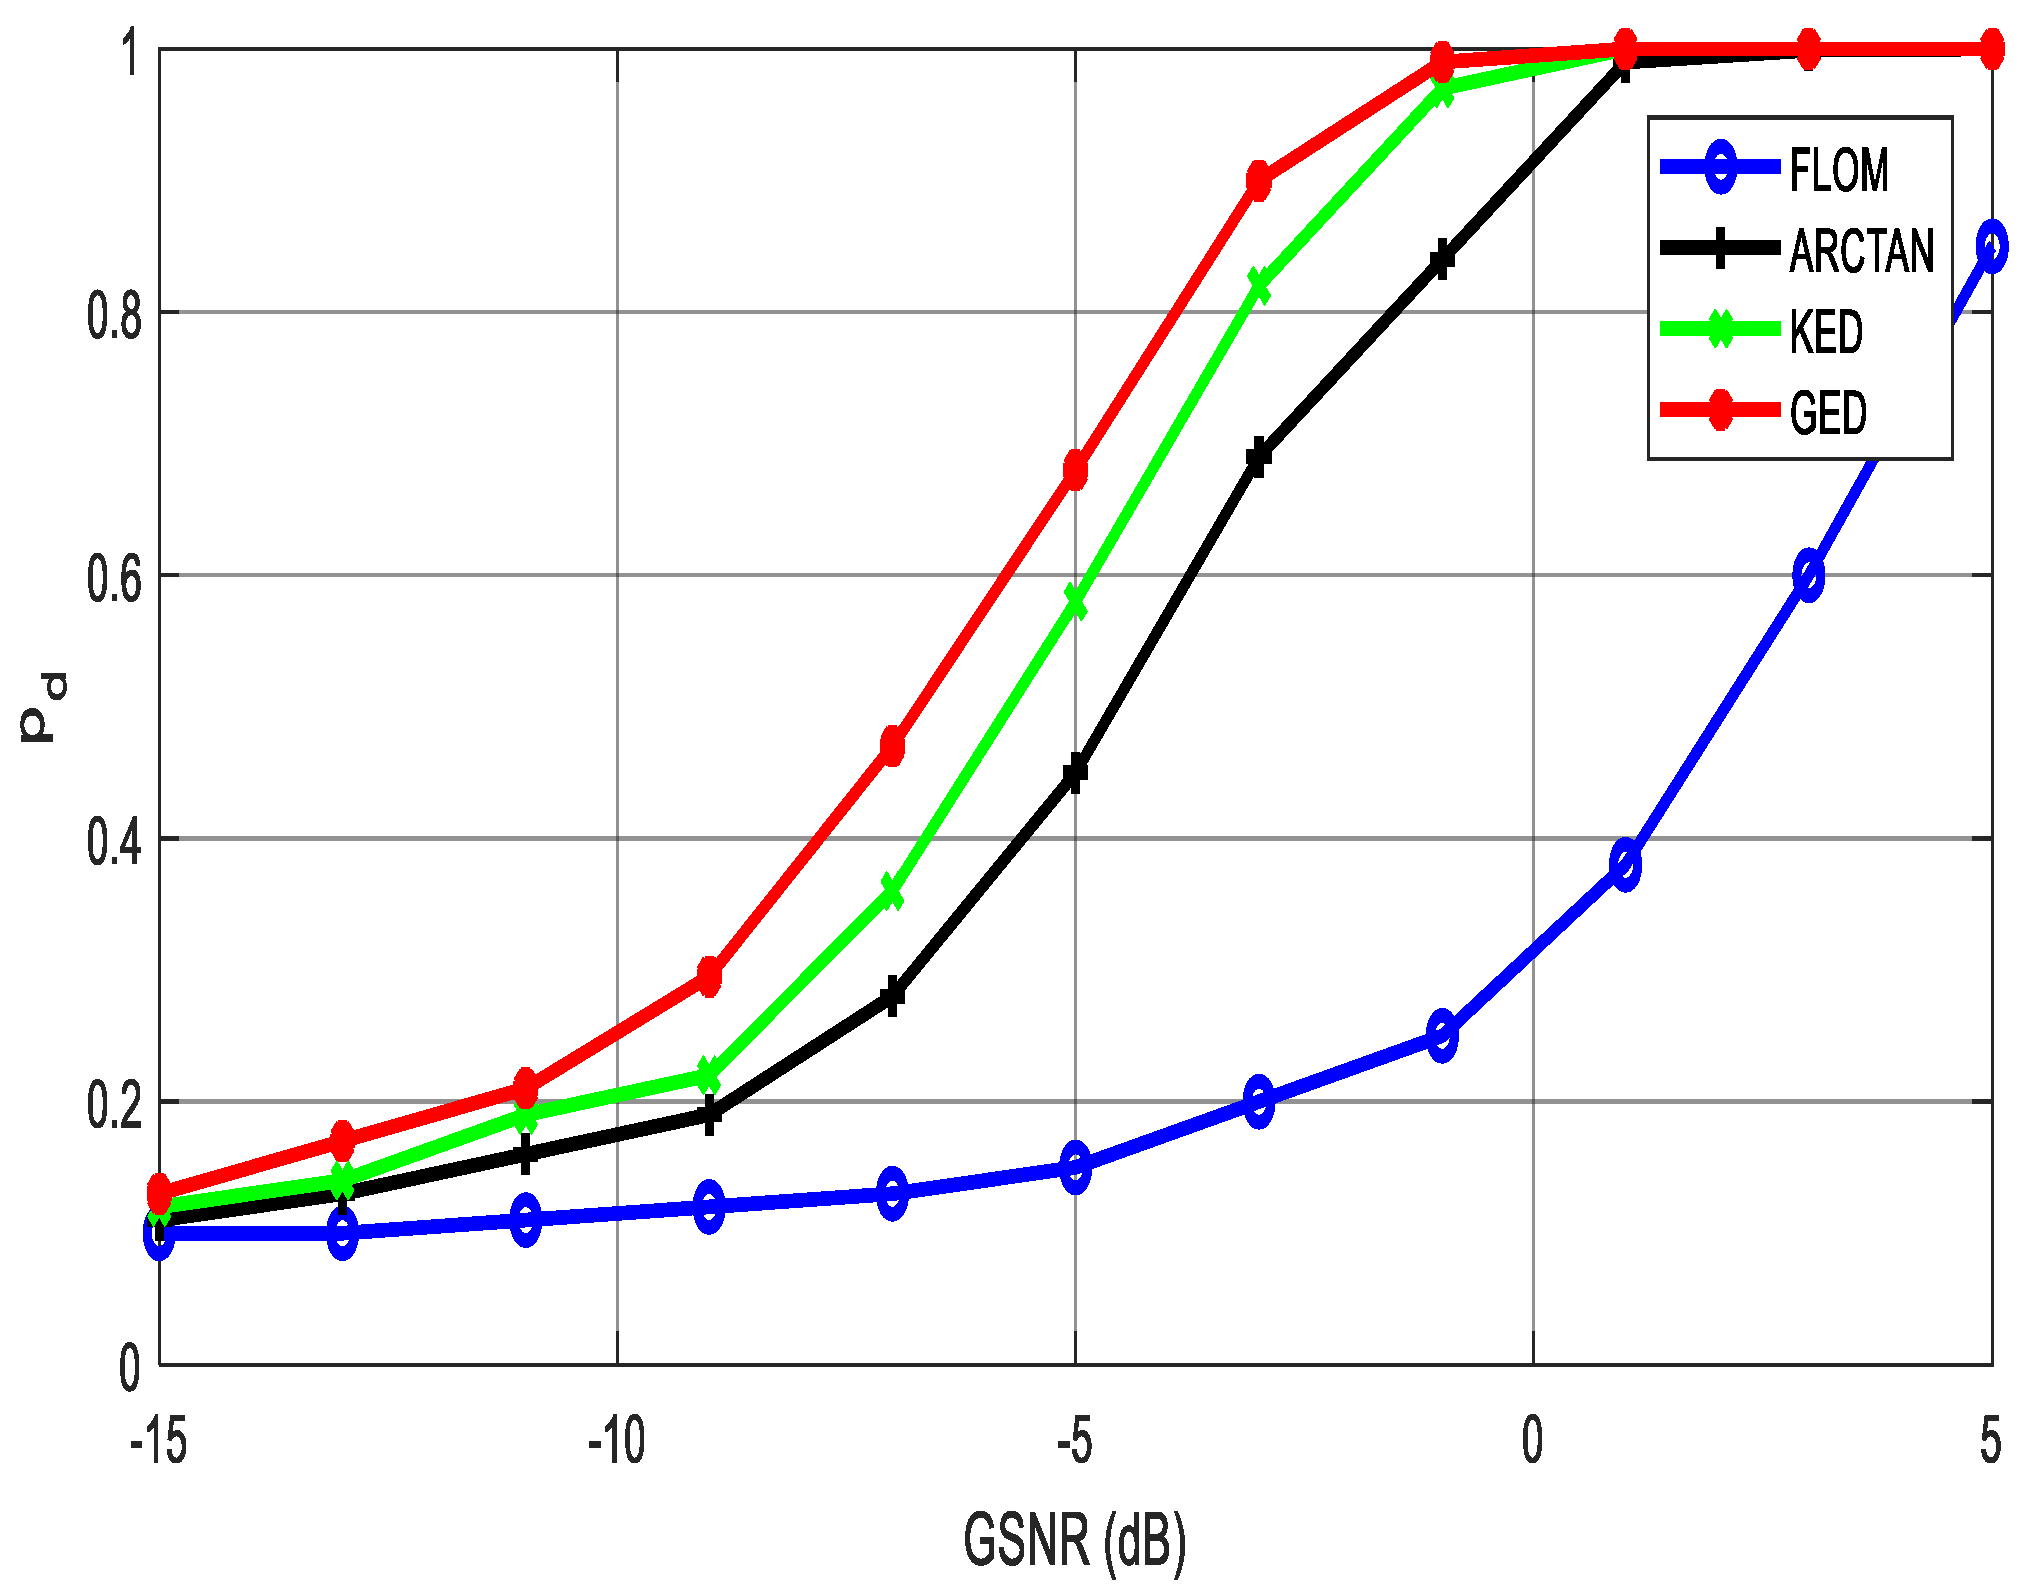
It can be seen from Figure 5 that the proposed GED achieves the best detection performance. In particular, its detection probability is significantly higher than those of other algorithms at low SNR. This is because the proposed GED can not only mitigate the negative impacts of strong noise but also better highlight the difference between the presence and absence of a signal in the observed samples.
Figure 5.
The detection probability versus GSNR for the FLOM, ARCTAN, KED, and GED methods when , , and .
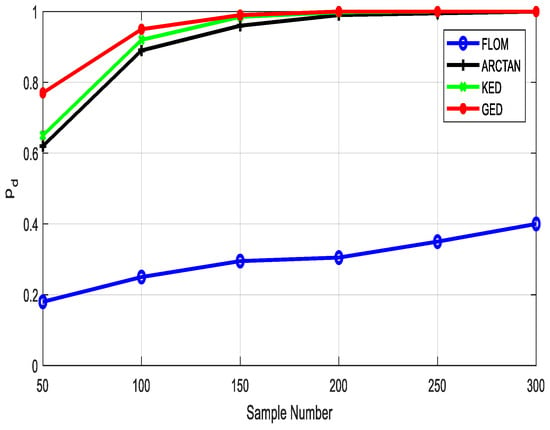
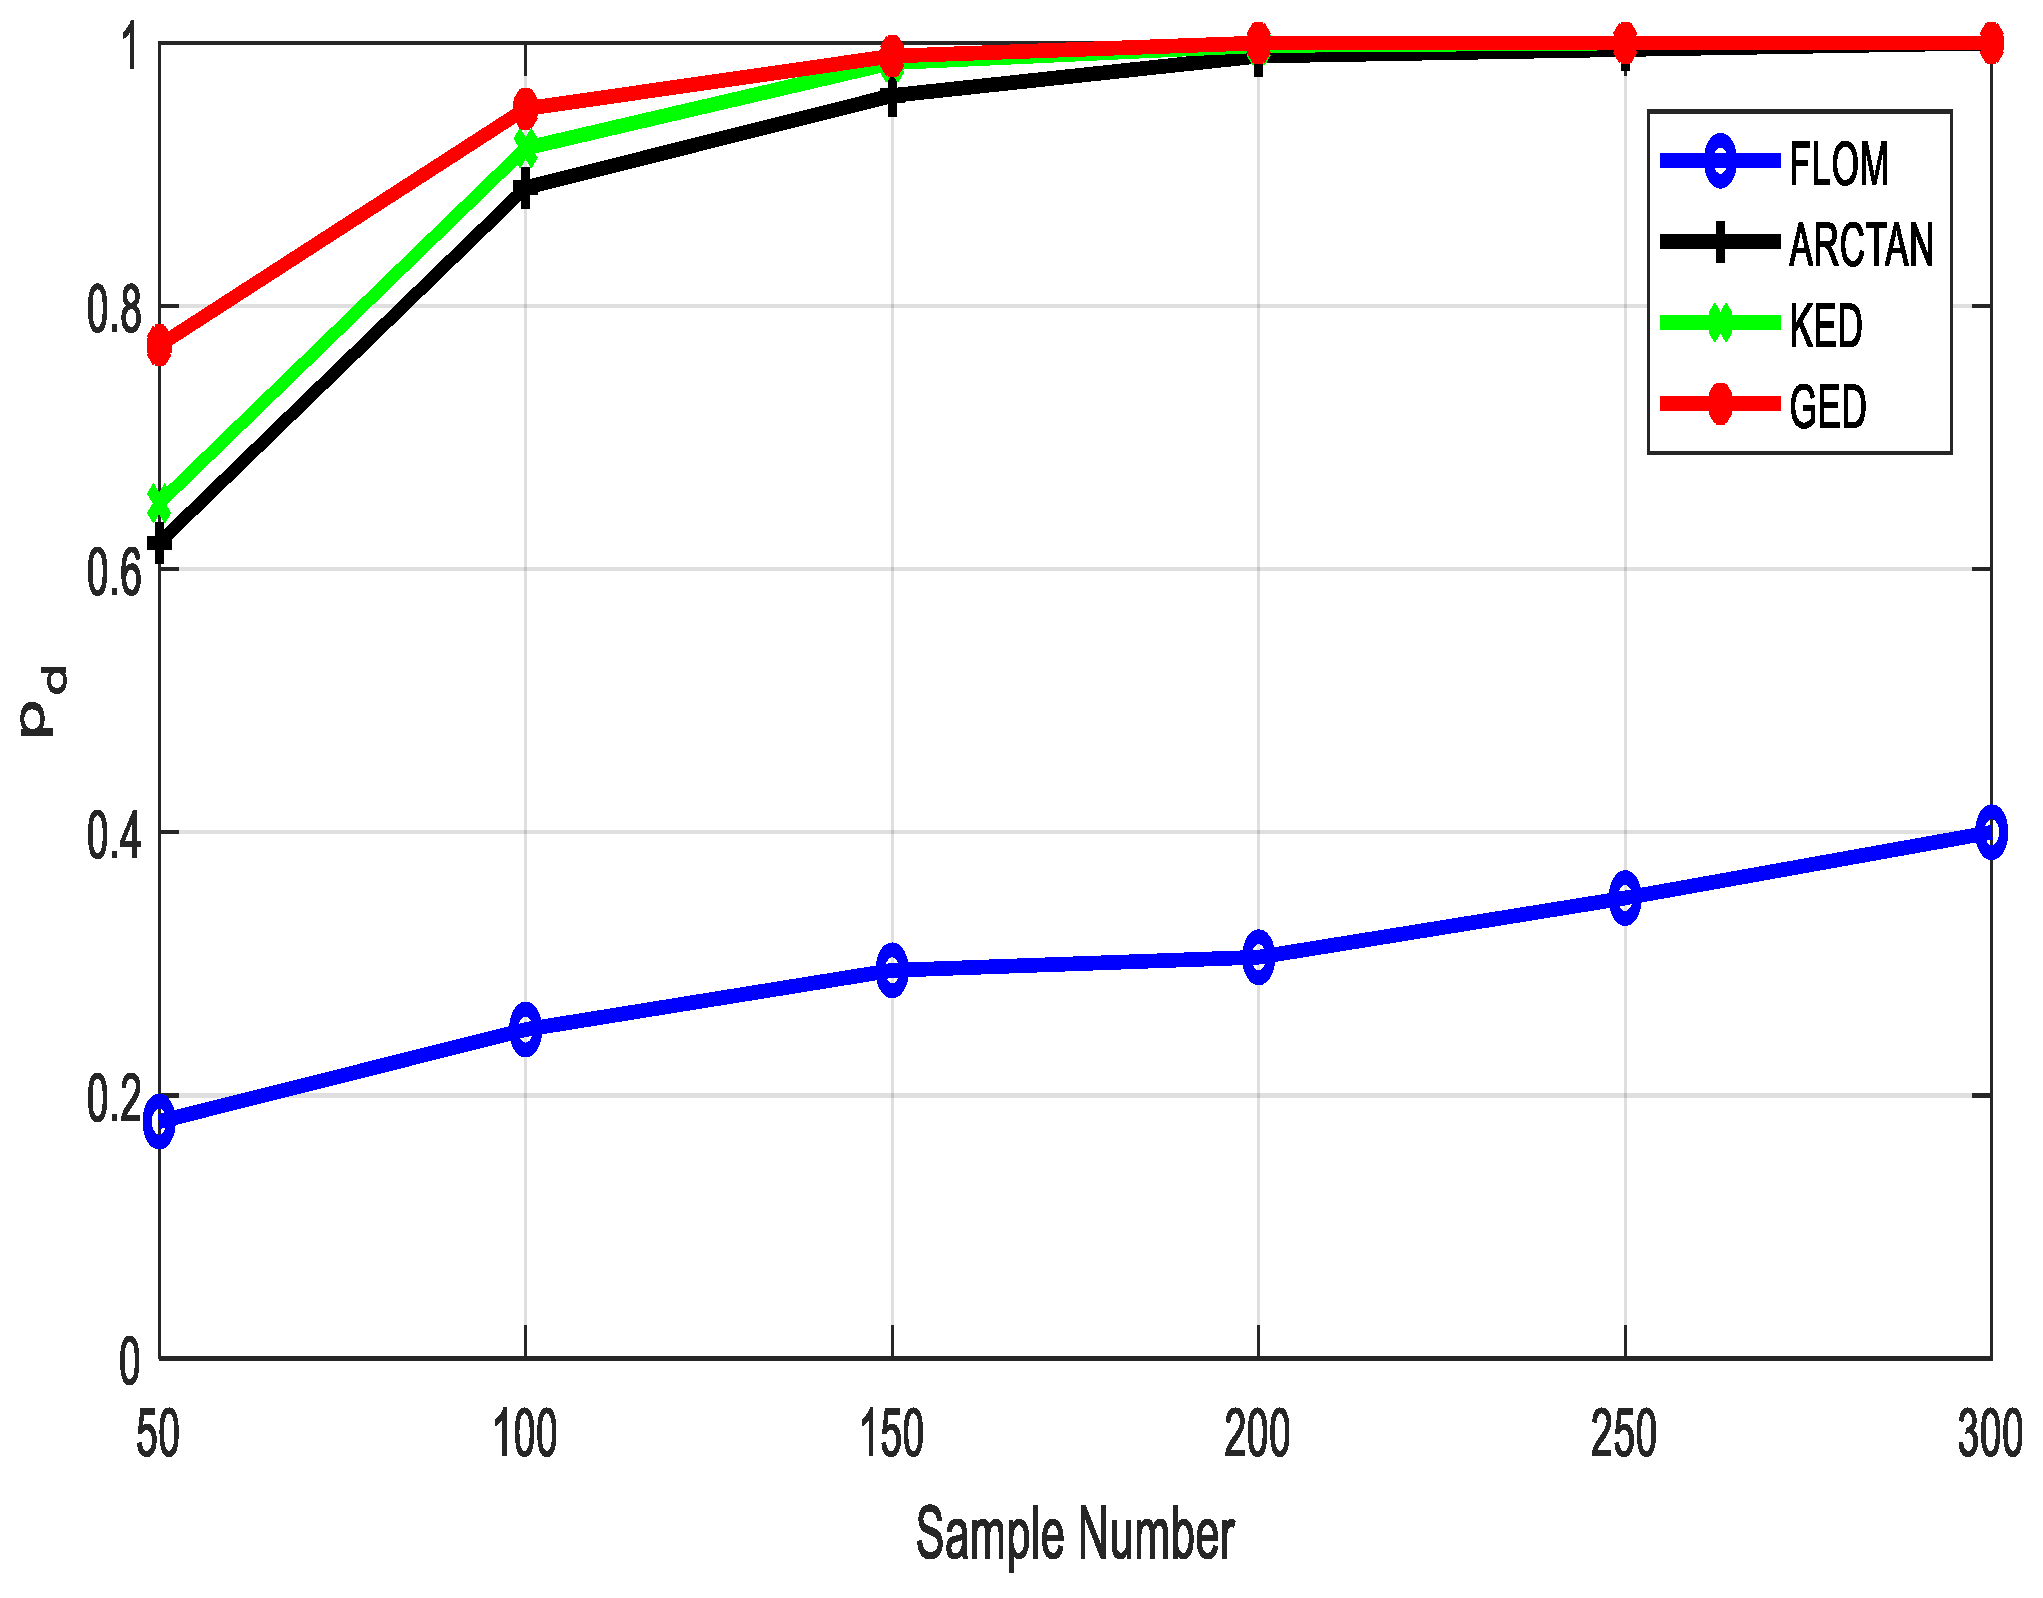
As depicted in Figure 6, the performance of the FLOM, KED, ARCTAN, and GED schemes is evaluated under different sample sizes. It shows that the KED, GED and ARCTAN methods all outperform the FLOM method at an identical sample size, and the GED method further outperforms the other three methods in the case of small sample sizes. These experimental results verify that the proposed method is capable of delivering enhanced detection performance even with a limited number of samples, thus improving the overall detection efficiency. Consequently, the spectrum utilized by primary users can be identified in real time, thereby enhancing the system reliability to a certain degree.
Figure 6.
The detection probability versus the sample size for the FLOM, KED, ARCTAN, and GED methods when and dB.
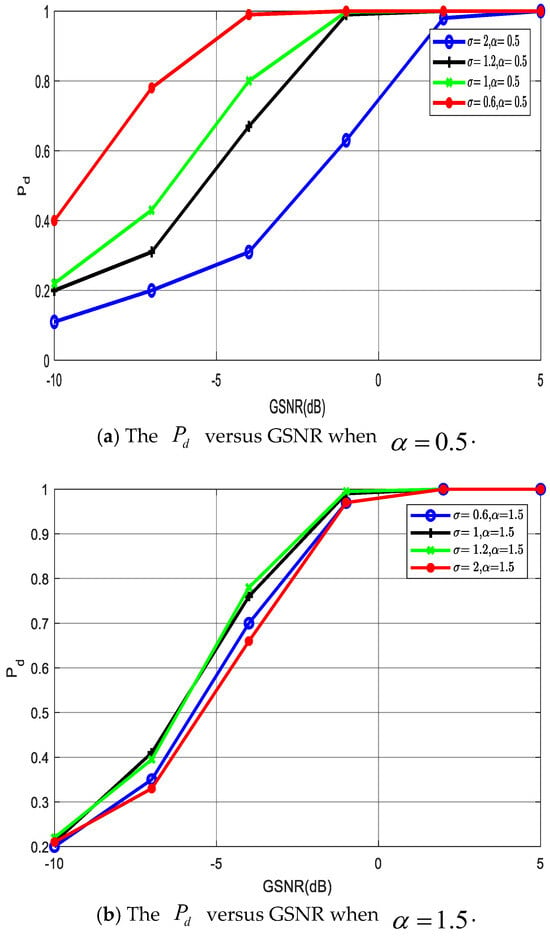
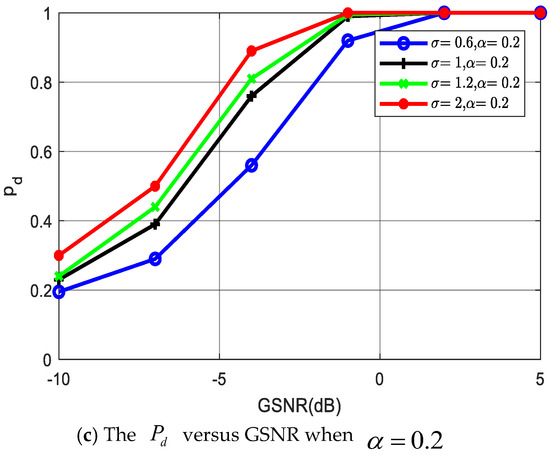
In Figure 7, the performance of the GED algorithm is compared under different values in Formula (6) under the α-stable noise scenario where the versus GSNR curves are ploted. It is observed that when alpha takes a small value, indicating the presence of severe impulsive noise, appropriately reducing the value contributes to better performance. However, this optimization comes at the cost of reduced performance when noise is close to Gaussian distribution. Comparing (a) and (c), the phenomenon of performance inversion with respect to value is evident. Therefore, choosing an appropriate delta value based on noise characteristics is crucial. If the noise characteristics are uncertain or expected to change over time, setting it to 1 is an appropriate choice.
Figure 7.
The versus GSNR for different values and the alpha-stable noise distribution with = 0.5, 1.5, 2, when and .
7. Conclusions
In this paper, we propose a generalized energy detection-based spectrum sensing algorithm in the presence of impulsive noise that follows an alpha-stable distribution. We investigate the effectiveness and superiority of the proposed algorithm compared to traditional algorithms in suppressing impulsive noise and improving detection sensitivity. Moreover, the false alarm probability of the GED is derived. Based on this, the corresponding detection threshold is further determined. Simulations were conducted to compare the performance of the proposed algorithm with traditional and currently mainstream spectrum sensing algorithms. The results show that the proposed algorithm has good performance under low SNR and strong impulsive noise interference.
In future research, based on spectrum sensing, the utilization patterns of spectrum resources can be analyzed. Then, we can establish a dynamic control model for spectrum resources and realize real-time scheduling and optimal allocation of spectrum resources. By means of such dynamic control strategies, the system can break through the limitations of the fixed spectrum allocation scheme and effectively improve the overall utilization efficiency of spectrum resources.
Author Contributions
Conceptualization and writing—original draft preparation, S.D.; methodology and software, H.X. and J.L.; validation and formal analysis, J.F.; investigation and writing—review and editing, S.D. and H.X.; J.F. analyzed the experimental data and results, realized data visualization, and wrote the first draft of the paper. All authors have read and agreed to the published version of the manuscript.
Funding
This work was supported in part by the National Natural Science Foundation of China under Grant 62231027 and Grant 62071364.
Informed Consent Statement
Not applicable.
Data Availability Statement
Not applicable. All data generated or analyzed during this study are included in this article.
Conflicts of Interest
The authors declare that they have no known competing financial interests or personal relationships that could have appeared to influence the work reported in this paper.
References
- Mitola, J. Cognitive radio for flexible mobile multimedia communications. Mob. Netw. Appl. 2001, 6, 435–441. [Google Scholar] [CrossRef] [Scilit]
- Haykin, S. Cognitive radio: Brain-empowered wireless communications. IEEE J. Sel. Areas Commun. 2005, 23, 201–220. [Google Scholar] [CrossRef] [Scilit]
- Dalai, J. VLSI Implementation of Energy Detection Algorithm for WLAN and WiMAX Applications. Master’s Thesis, National Institute of Technology Rourkela, Odisha, India, 2013. [Google Scholar]
- Sobron, I.; Diniz, P.S.R.; Martins, W.A.; Velez, M. Energy Detection Technique for Adaptive Spectrum Sensing. IEEE Trans. Commun. 2015, 63, 617–627. [Google Scholar] [CrossRef] [Scilit]
- Salahdine, F.; El Ghazi, H.; Kaabouch, N.; Fihri, W.F. Matched filter detection with dynamic threshold for cognitive radio networks. In Proceedings of the 2015 International Conference on Wireless Networks and Mobile Communications (WINCOM), Marrakech, Morocco, 20–23 October 2015; pp. 1–6. [Google Scholar]
- Brito, A.; Sebastião, P.; Velez, F.J. Hybrid Matched Filter Detection Spectrum Sensing. IEEE Access 2021, 9, 165504–165516. [Google Scholar] [CrossRef] [Scilit]
- Maeda, K.; Benjebbour, A.; Asai, T.; Furuno, T.; Ohya, T. Recognition among OFDM-based systems utilizing cyclostationarity-inducing transmission. In Proceedings of the IEEE International Symposium on New Frontiers in Dynamic Spectrum Access Networks, Dublin, Ireland, 17–20 April 2007; pp. 516–523. [Google Scholar]
- Khadeeja, S.; Sindhu, V. Cyclostationary Feature Detection for Spectrum Sensing in Cognitive Radio Network. In Proceedings of the 2019 International Conference on Intelligent Computing and Control Systems (ICCS), Madurai, India, 15–17 May 2019; pp. 1250–1254. [Google Scholar]
- Sahai, A.; Cabric, D. Spectrum sensing: Fundamental limits and practical challenges. In Proceedings of the IEEE International Symposium on New Frontiers in Dynamic Spectrum Access Networks, Dyspan 2005, Berkeley, CA, USA, 8–11 November 2005. [Google Scholar]
- Zeng, Y.; Liang, Y.C.; Hoang, A.T.; Zhang, R. A review on spectrum sensing for cognitive radio: Challenges and solutions. EURASIP J. Adv. Signal Process. 2010, 2010, 381465. [Google Scholar] [CrossRef] [Scilit]
- Alom, M.Z.; Godder, T.K.; Morshed, M.N. A survey of spectrum sensing techniques in Cognitive Radio network. In Proceedings of the International Conference on Advances in Electrical Engineering (ICAEE), Dhaka, Bangladesh, 17–19 December 2015. [Google Scholar]
- Syed, S.N.; Lazaridis, P.I.; Khan, F.A.; Ahmed, Q.Z.; Hafeez, M.; Ivanov, A.; Poulkov, V.; Zaharis, Z.D. Deep neural networks for spectrum sensing: A review. IEEE Access 2023, 11, 89591–89615. [Google Scholar] [CrossRef] [Scilit]
- Kaur, J.; Srivastava, N. Framework for emerging spectrum sensing techniques and coexistence of symbiotic radio in Internet of Things environment. IETE J. Res. 2010, 71, 24. [Google Scholar] [CrossRef] [Scilit]
- Shao, M.; Nikias, C.L. Signal processing with fractional lower order moments: Stable processes and their applications. Proc. IEEE 1993, 81, 986–1010. [Google Scholar] [CrossRef] [Scilit]
- Nasser, A.; Hassan, H.A.H.; Chaaya, J.A.; Mansour, A.; Yao, K.-C. Spectrum sensing for cognitive radio: Recent advances and future challenge. Sensors 2021, 21, 2408. [Google Scholar] [CrossRef] [Scilit] [PubMed]
- Muzaffar, M.U.; Sharqi, R. A review of spectrum sensing in modern cognitive radio networks. Telecommun. Syst. Model. Anal. Des. Manag. 2024, 85, 347–363. [Google Scholar] [CrossRef] [Scilit]
- Nikias, C.L.; Shao, M. Signal Processing with Alpha-Stable Distributions and Applications; John Wiley and Sons, Inc.: New York, NY, USA, 1995; pp. 130–150. [Google Scholar]
- Mitola, J.; Maguire, G.Q. Cognitive radio: Making software radios more personal. IEEE Pers. Commun. 1999, 6, 13–18. [Google Scholar] [CrossRef] [Scilit]
- Luo, J.; Wang, S.; Zhang, E.; Man, X. Nonparametric blind signal detection based on logarithmic moments in very impulsive noise. Mob. Inf. Syst. 2018, 2018, 1–9. [Google Scholar] [CrossRef] [Scilit]
- Kumar, K.; Pandey, R.; Bora, S.S.; George, N.V. A robust family of algorithms for adaptive filtering based on the arctangent framework. IEEE Trans. Circuits Syst. II Express Briefs 2022, 69, 1967–1971. [Google Scholar] [CrossRef] [Scilit]
- Margoosian, A.; Abouei, J.; Plataniotis, K.N. Accurate kernel-based spectrum sensing for Gaussian and non-Gaussian noise models. In Proceedings of the 2015 IEEE International Conference on Acoustics, Speech and Signal Processing (ICASSP), South Brisbane, QLD, Australia, 19–24 April 2015; pp. 3152–3156. [Google Scholar]
- Nolan, J.P. Stable Distributions: Models for Heavy Tailed Data; Birkhäuser: Boston, MA, USA, 2012. [Google Scholar]
- Chambers, J.M.; Mallows, L.C.; Stuck, B.W. A method for simulating stable random variables. J. Am. Stat. Assoc. 1976, 71, 340–344. [Google Scholar] [CrossRef]

Disclaimer/Publisher’s Note: The statements, opinions and data contained in all publications are solely those of the individual author(s) and contributor(s) and not of MDPI and/or the editor(s). MDPI and/or the editor(s) disclaim responsibility for any injury to people or property resulting from any ideas, methods, instructions or products referred to in the content. |
© 2026 by the authors. Licensee MDPI, Basel, Switzerland. This article is an open access article distributed under the terms and conditions of the Creative Commons Attribution (CC BY) license.