


Abstract
Switched-inductor converters are ubiquitous in modern electronics. Their switching behavior makes them inherently nonlinear and unsuitable for classical linear frequency-response models, requiring linearization for stability analysis. Common approaches—such as state-space averaging, circuit averaging, and signal-flow graphs—can be algebraically intensive and may offer limited circuit-level interpretability. This paper proposes a direct small-signal AC response model for switched inductors in both CCM and DCM that preserves circuit intuition while maintaining the accuracy of conventional methods. The proposed framework enables the systematic derivation of the duty-cycle-to-output-voltage, duty-cycle-to-output-current, and duty-cycle-to-inductor-current transfer functions within a unified circuit representation. Bode plots of the duty-cycle-to-voltage and duty-cycle-to-current gains confirm that the model accurately captures the LC double pole and associated zeros, including the shift of the load-related zero in the reconstructed inductor-current gain. The resulting model remains straightforward to use, analyze, and simulate and may facilitate control-loop design as well as integration into automated synthesis or optimization tools. In DCM, the model further provides an analytical expression for the duty-cycle-to-inductor-current gain, contributing to a clearer understanding of this relationship in the literature. Results validated in SIMPLIS show excellent agreement with state-space averaging predictions.
1. Modeling the AC Dynamics of Switched Inductors
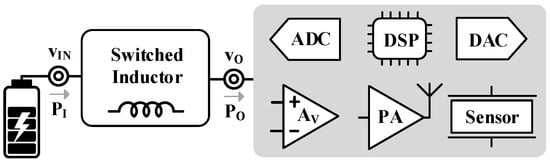
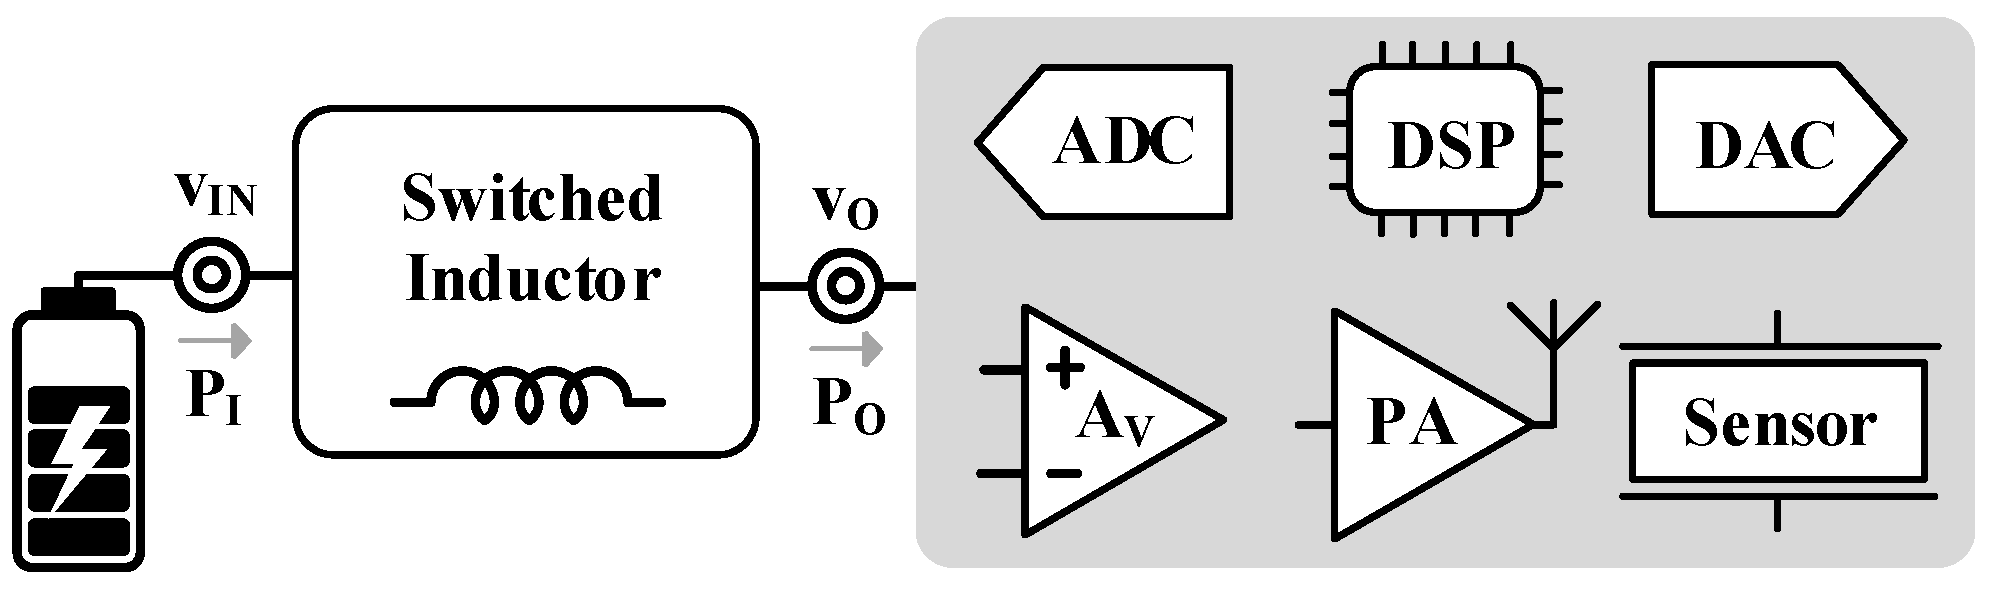
Switched-inductor converters rely on one or more negative feedback loops to regulate their output in response to variations in input voltage (e.g., from a battery) and/or load current (due to diverse load conditions [1], as shown in Figure 1). Modelling their AC dynamics is therefore essential for ensuring stability [2]. Three primary modelling approaches are used: state-space averaging (SSA), circuit averaging, and signal flow graphs [3,4,5,6,7,8,9,10,11].
Figure 1.
Electronic system with power supply and load.
Switched-inductor converters alternate between states, each defined by differential equations for current and voltage. Averaging these over a constant switching period tSW enables small-signal analysis [3,4,5]. SSA also supports matrix representations, which, when combined with digital control, facilitate advanced control techniques [12,13,14,15]. However, modeling linear subcircuits can be algebraically intensive, as this approach requires decomposing each variable into its DC and perturbation components and neglecting higher-order perturbation products for every variable, which can obscure the physical origins of the resulting poles and zeros. Additionally, in DCM, studies [3,4] require the switching period to be divided into three subintervals, with separate sets of equations describing each state; thus, the approach relies on multiple piecewise equations.
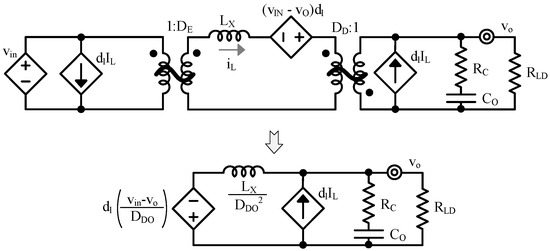
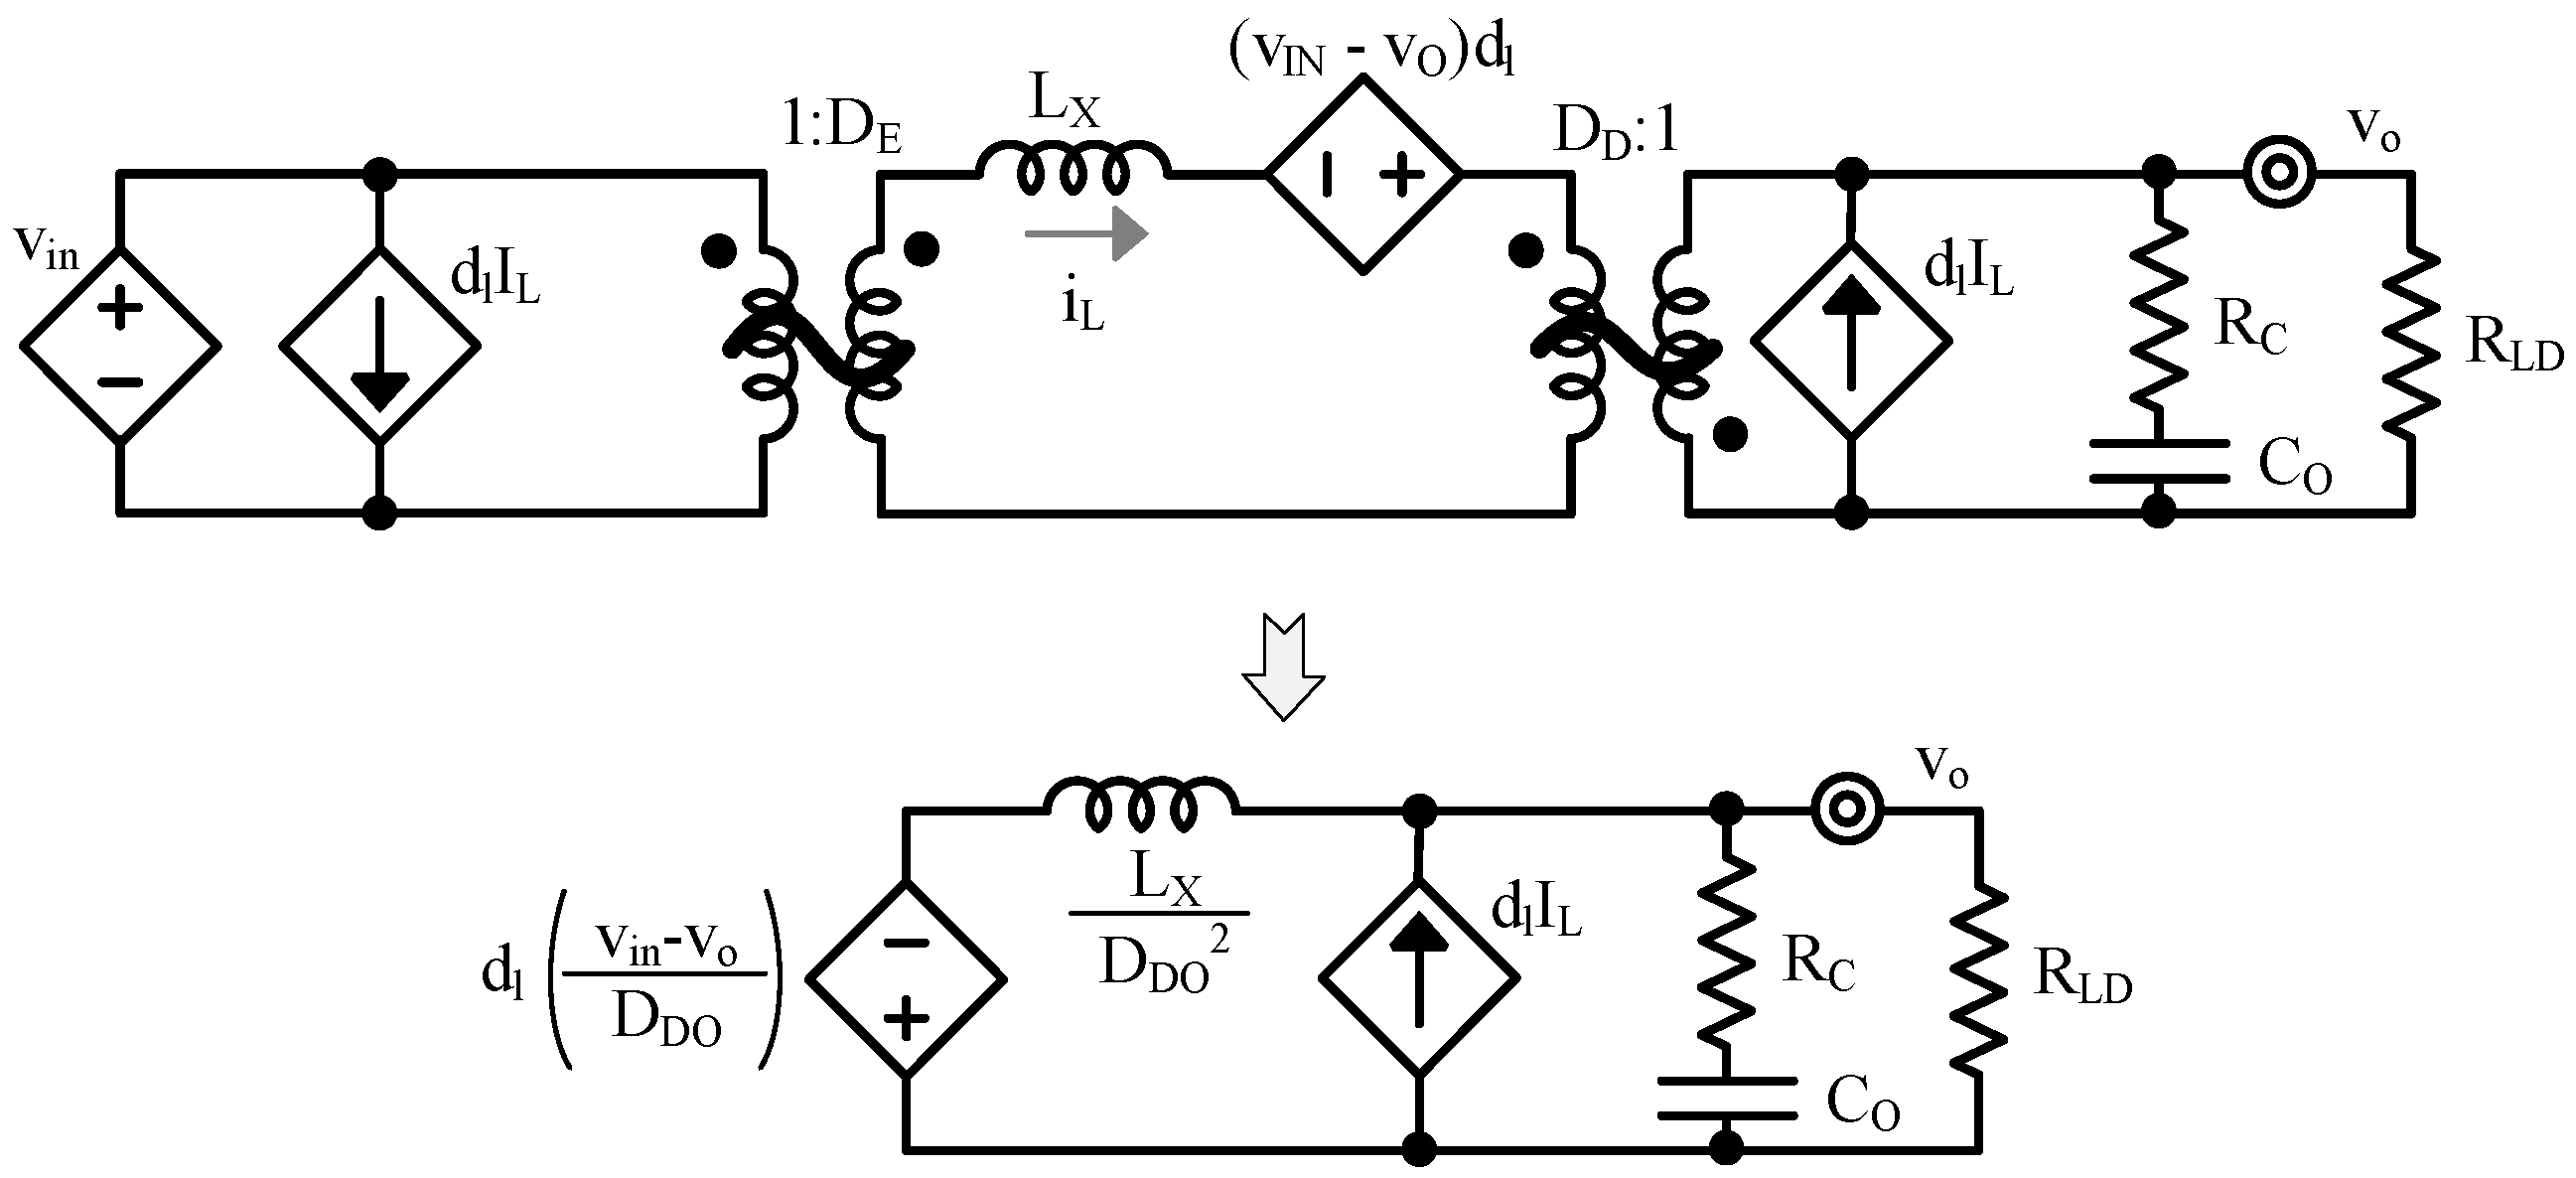
Circuit averaging replaces nonlinear subcircuits with ideal transformers and dependent sources [6,7,8]. These equivalent circuits are derived from SSA-based equations and often provide more intuitive insight. However, the method shares SSA’s mathematical complexity and limitations. Namely, a buck–boost circuit (for instance) must first be converted into its equivalent circuit averaged form, where the switches are replaced by ideal transformers, as illustrated in Figure 2. Additional manipulations are then required to push the inductor and voltage through the transformer, derive the control-to-output transfer function, and superpose the two contributions from the control-signal-dependent current and voltage sources. The inverting zero subsequently appears in the transfer function, but its origin is obscured by all the intermediate steps needed to obtain the equivalent circuit.
Figure 2.
Buck–boost circuit SSA equivalent form.
Flow graphs convert SSA equations into visual representations using nodes and branches, where each branch corresponds to a small-signal transfer function [9,10,11]. This method decomposes the overall AC response into identifiable gain stages and does not require several rounds of transformations to obtain its final form. However, as described in [16], the signal flow graph does not resemble a circuit, offering very little insight into the physical meaning of the different sub-transfer functions.
This work presents a new method for modeling the AC response of switched inductors, based entirely on circuit representation. Like signal flow graphs, it derives the transfer function of each component averaged over tSW. Unlike SSA, it avoids algebraic manipulation and transformer-based modeling to obtain the gains. The method yields equivalent Norton and Thevenin circuits for the switched inductor and its driving network. As with SSA, circuit averaging, and flow-graph approaches, it captures the AC response of converters operating under constant switching-frequency PWM but in the form of a circuit. Specifically, it models the converter’s small-signal response to variations in the duty-cycle command dL. The model presented in this work is straightforward to use, analyze, and simulate, making it suitable for practical implementation and design studies. Being able to rapidly derive the small-signal gains of a switched inductor without going through multiple translation steps saves significant design time. It is important to note that the model is valid for small perturbations around the operating point and constant-frequency operation; effects such as current-mode control strategies, variable-frequency operation, or switching nonlinearities are out of scope and are not captured by this approach.
The proposed modeling procedure requires the following inputs: the converter topology, the switching intervals for each active switch (energizing and draining duty cycles values), and the relevant circuit variables such as inductance, output capacitor, and load and parasitic resistances. From these inputs, the method produces circuit-level equivalents, such as Norton or Thevenin representations of the converter, along with the key small-signal transfer functions describing the control-to-output voltage, control-to-output current, and control-to-inductor current dynamics. This formalization makes the approach directly verifiable: given a converter and its switching pattern, one can reproduce the equivalent circuits and extract the same transfer functions, ensuring reproducibility and transparency in the analysis.
This paper is structured as follows: Section 2 introduces basic switched inductor circuits and small signal models, Section 3 presents the model and its validation in Continuous-Conduction Mode (CCM), while Section 4 covers the Discontinuous-Conduction Mode (DCM) and its validation. Section 5 concludes this article. Throughout this paper, the notation sA represents both large- and small-signal quantities, whereas SA and sa refer to large-signal and small-signal components, respectively.
2. Switched-Inductor DC–DC
2.1. Variants
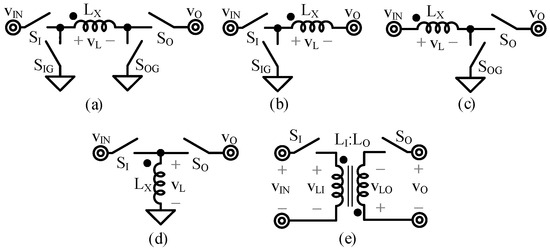
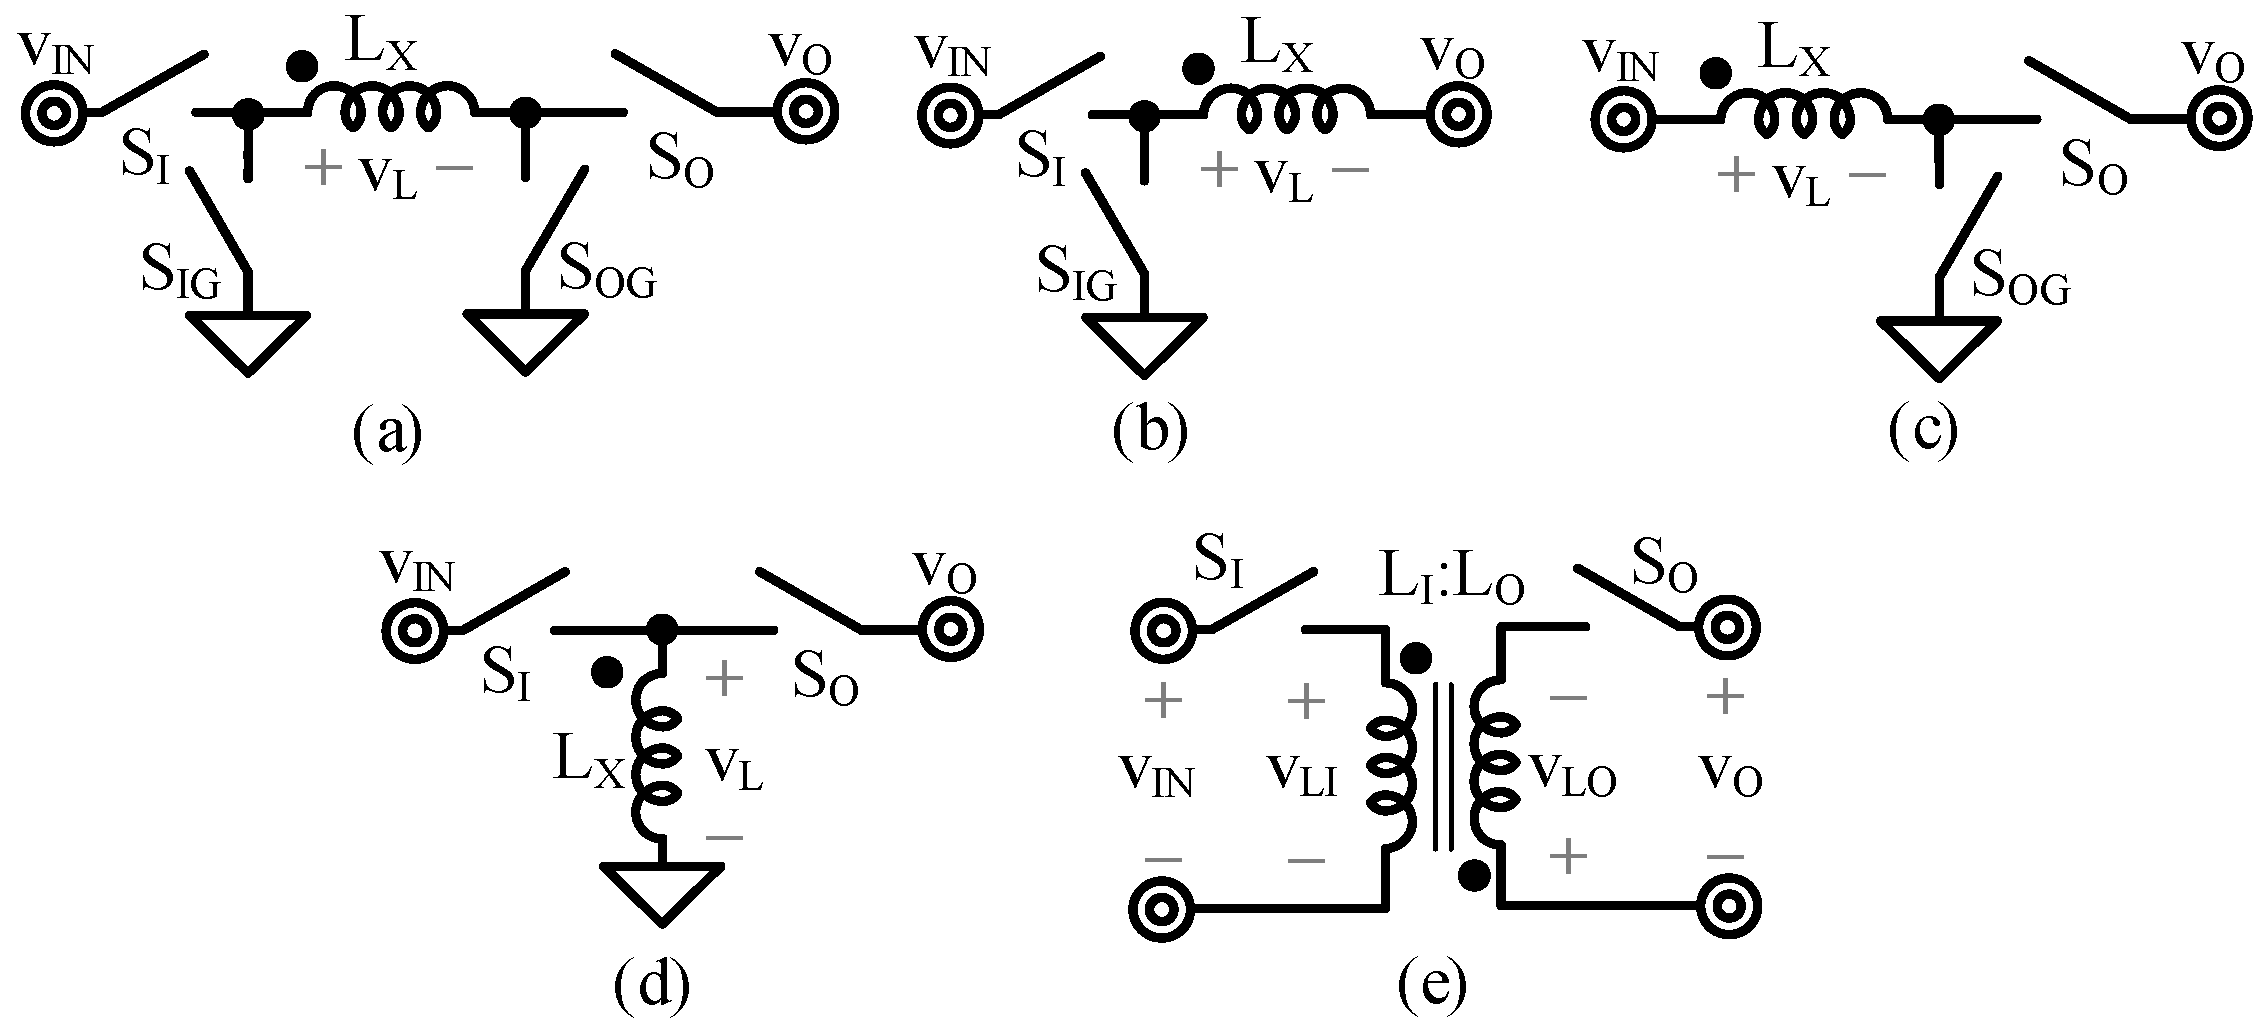
Switched-inductor converters use an inductor LX as an intermediate energy storage element. The inductor is first energized (during an energizing duty cycle fraction dE of tSW) from the input voltage vIN, and then its stored energy is drained to the output vO. Five classical topologies include buck (vIN > vO), boost (vIN < vO), buck–boost (vIN> or <vO), inverting buck–boost (vIN > 0 > vO), and flyback (vIN> or <vO and isolated input and output grounds), as Figure 3 shows. The flyback converter employs a transformer with an input winding denoted as LI and an output winding denoted as LO. The transformer has a turns ratio kL. On the primary (input) side, the inductor voltage and current are vLI and iLI, and on the secondary (output) side they are vLO and iLO. The currents iLI and iLO together form the transformer current iXO (iLI/kL + iLO) as referred to the output side. The buck–boost topology typically uses four switches, whereas the buck converter uses two input-side switches (SI and SIG) and the boost converter uses two output-side switches (SO and SOG).
Figure 3.
Switched-inductor variants: buck–boost (a), buck (b), boost (c), inverting buck–boost (d), and flyback (e).
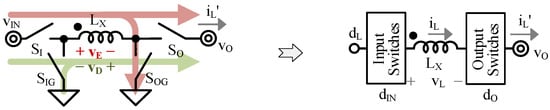
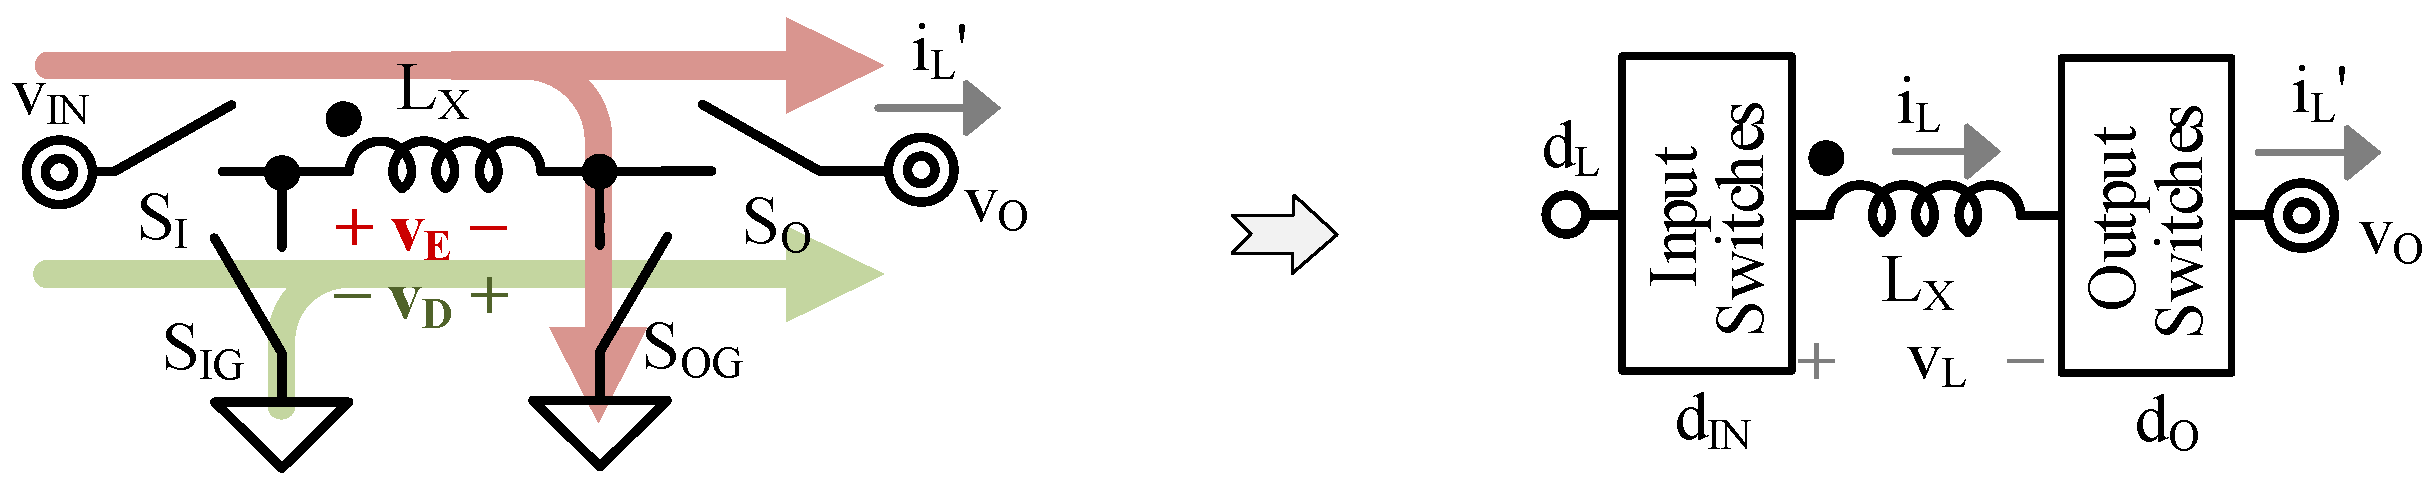
In all these configurations, the switched inductor can be represented as a network of switches connecting the inductor LX to vIN, vO, and ground, as Figure 4 illustrates. dO and dD denote the fractions of tSW during which LX connects to vO, and during which it is draining, respectively. When SO is present, it duty-cycles LX into vO, so dO is dD. When there is no SO, dO is 1. For boost-derived variants, since LX does not always connect to vO, the inductor current iL is a duty cycle dO fraction of the power stage output current iL′. It is important to note that the duty cycles are defined only for the intervals when the inductor is conducting current. The dot on the inductor indicates the positive terminal. When a positive voltage is applied across the inductor relative to this dot, the inductor energizes, whereas applying a negative voltage causes it to drain. Table 1 summarizes the voltages, duty cycles, and output currents for the different converter variants. In this work, the voltage causing the inductor to discharge is treated as a positive quantity, as it is applied with reverse polarity relative to the dot, as illustrated in Figure 4.
Figure 4.
General topology of switched-inductor converters.
Table 1.
Voltages and duty cycles for switched inductor variants.
2.2. Continuous-Conduction Mode
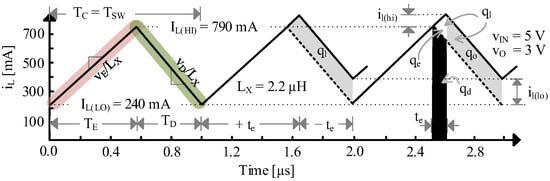
During the energizing phase, the voltage vL applied across LX is the energizing voltage vE, which causes iL to rise to its peak value, iL(HI). In the subsequent draining phase, a draining voltage vD is applied across LX in the opposite direction. Both vE and vD include the effects of ohmic voltage drops due to parasitic resistances. This results in iL decreasing by the same amount, ΔiL, as Figure 5 illustrates.
Figure 5.
iL in CCM and small signal variation (buck, 515 mA load, simulated with LTSpice).
At the end of the draining time tD, a new energizing phase begins. The inductor current iL reaches its minimum value, iL(LO), at the end of the draining phase. When this value is greater than or equal to zero without a zero-current interval, the converter operates in CCM. In this mode, the conduction time tC equals the full switching period tSW, and the energizing time tE is a dE fraction (the energizing duty cycle) of tC. In this case, the duty cycle command dL, which controls the switches, is equal to dE. Equation (1) below defines ΔiL:
dL is the effective control signal governing the power switches, while dE and dD denote the fractions of the conduction interval during which the inductor energizes and discharges, respectively. In continuous conduction mode (CCM), dE is active during the interval in which the inductor is energizing.
2.3. Discontinuous-Conduction Model
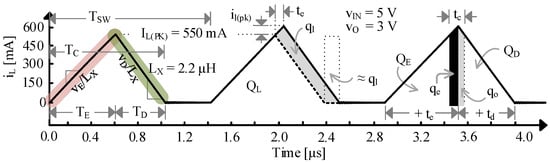
When iL(LO) is zero and the current remains at zero for a finite interval, the converter operates in DCM. In this mode, iL rises during the energizing phase with vE and falls during the draining phase with vD. It then remains at zero until the next switching cycle begins. This causes tC to be effectively shorter than tSW, as Figure 6 below illustrates. As a consequence, TE and TD are dETC and dDTC, respectively.
Figure 6.
iL in DCM and small signal variation (buck, 200 mA load, simulated with LTSpice).
Under these conditions, dE no longer represents the ratio tE/tSW that the duty cycle command dL would typically control. This is because, in addition to the energizing and discharging intervals, a third time interval exists which, together with the conduction intervals, completes the switching period. In DCM, the peak inductor current is denoted as iL(PK):
2.4. Small-Signal Model
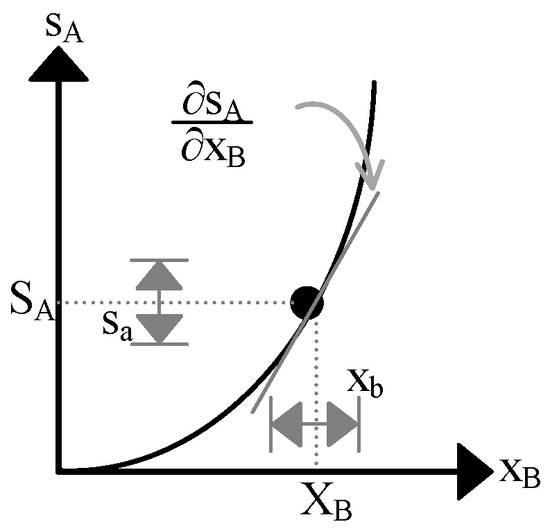
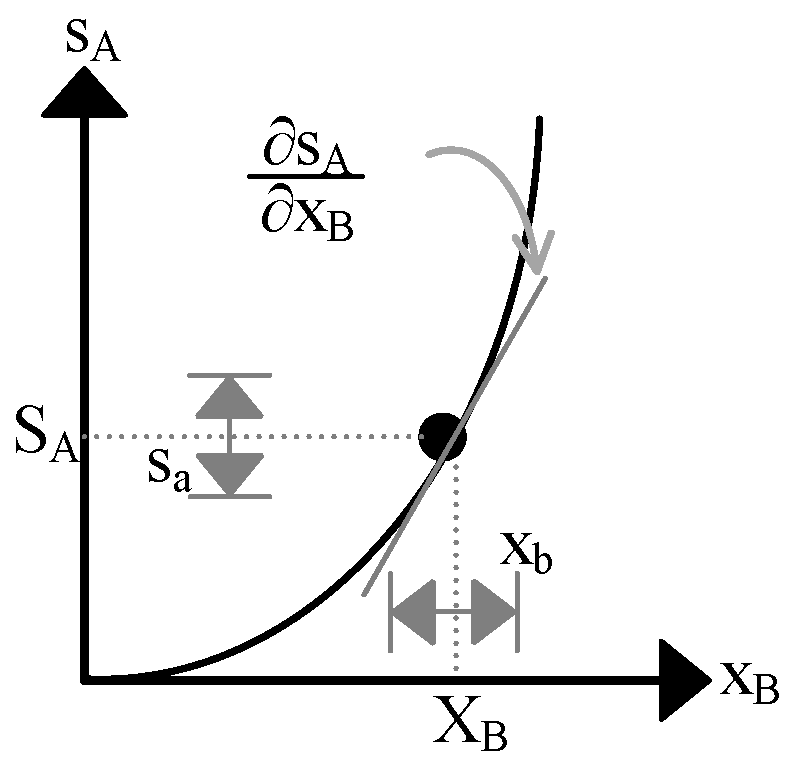
The way regulated systems respond to disturbances depends on small-signal behavior. Fortunately, feedback significantly reduces these variations, allowing linear approximations to model them accurately. For instance, in Figure 7, the linear region of the exponential-like response can translate small changes in the input signal xB to the output signal sA with results that closely match the true variations of sA. The small-signal component xb in xB represents slight deviations around the static point XB; the local slope (partial derivative) of sA with respect to xB at that point determines how these input perturbations produce corresponding small-signal responses sa in sA:
Figure 7.
Linear projection of small-signal variation.
In modern power supplies, dL is connected to the gates of CMOS transistors, as Figure 8 shows. Since these gates exhibit capacitive behavior and are largely unaffected by the network dynamics, dL primarily interacts with the gate capacitance CG. Consequently, the small-signal model that includes this CG does not incorporate any feedback-related effects.
Figure 8.
Small-signal translations.
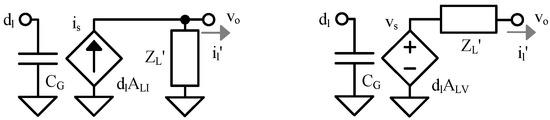
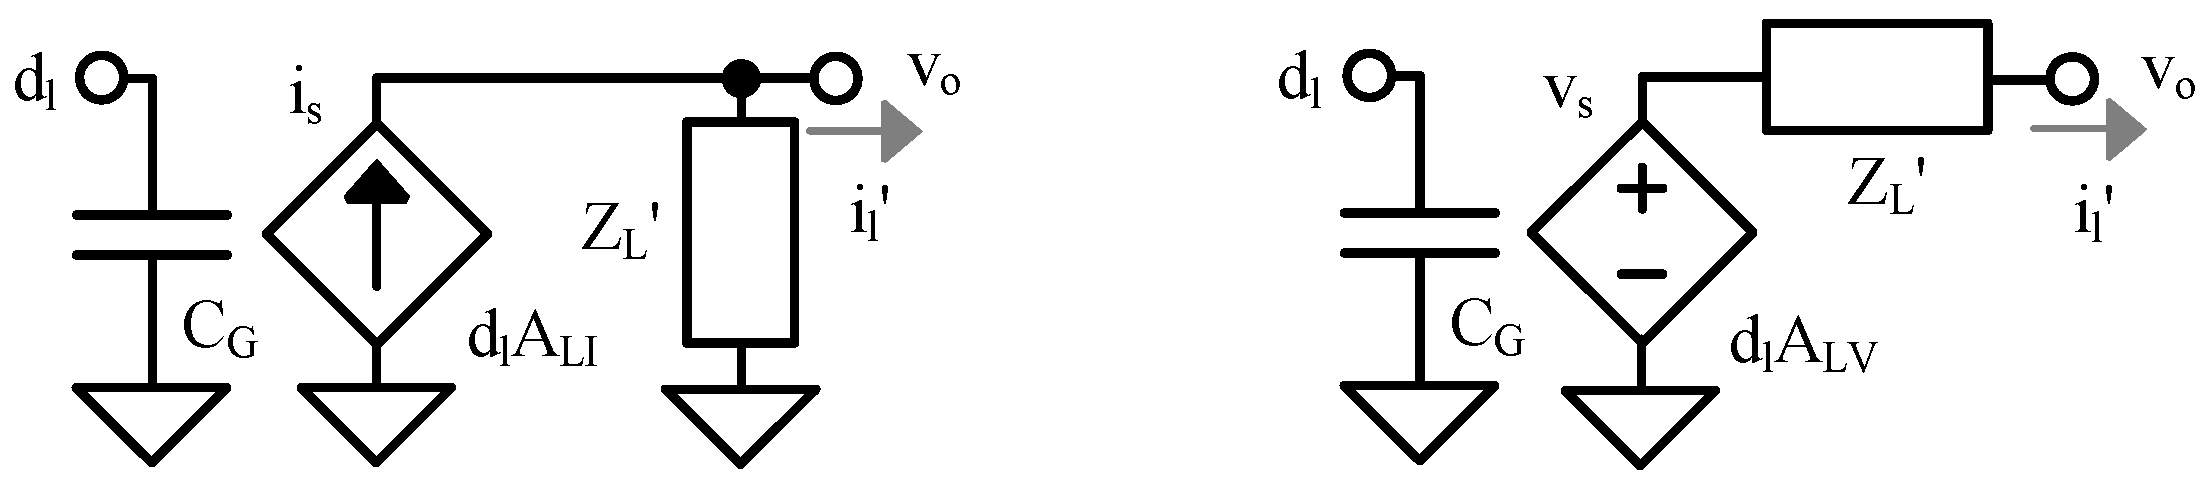
Test Condition: changes in dL ultimately affect the duty-cycled current iL′ output by the network. ZL′ in Figure 9 (left) represents the equivalent impedance that dO duty-cycles when there are no variations dl. ALI in Figure 7 describes the small-signal relationship that maps small changes dl in dL to the corresponding variations il′ in iL′ assuming no vO variations vo (equivalently, vO is grounded, as shown in the right-hand side of Figure 9). ALV is the unloaded voltage that ALI produces across ZL′, which is ALIZL′.
Figure 9.
Test conditions for deriving ZL′ and ALI.
3. Continuous-Conduction Mode
This section presents the model in continuous conduction mode (CCM). Under the assumptions of constant switching-frequency PWM and small perturbations around a steady-state operating point, duty-cycle variations modulate the durations of the energizing and discharging intervals. The modeling procedure then consists of: (i) deriving the expression of the equivalent duty-cycled inductor impedance, including its parasitic resistance; (ii) determining the Norton and Thevenin (current and voltage) gains driving the inductor; and (iii) deriving the small-signal transfer functions of the switched inductor when loaded by a resistance and an output capacitor, including its parasitic resistance.
3.1. Equivalent Impedance
In CCM, ZL′ in Figure 7 has an inductive component LX′, and a resistive component RL′. Because LX only connects to vO a DO fraction of TSW, the equivalent inductive part of the output impedance of the switched inductor is the duty-cycled inductance LX′, which loads vo during TSW and stores the energy drawn by LX during TO. Viewed this way, iLX is the current drawn by LX from vo over the interval TO (TO is DOTSW), and EL is the energy stored in LX after the current ramps up to iLX:
In contrast, iLX′ is the current that LX′ draws from vo throughout the entire switching period TSW, and EL′ is the energy stored in LX′ once the inductor current reaches iLX′:
But since EL′ equals the energy provided by EL, LX′ can be viewed as a reverse quadratic DO translation of LX [17]:
A similar reasoning applies to RL (series resistance of LX). RL dissipates power PR with vl, which is equal to the power PR′ dissipated by the equivalent duty-cycled resistance RL′ with vo:
Hence, RL′ is RL/DO2 [18].
3.2. Unloaded Gain Translations
Inductor Current: in CCM, when dE increases, tE lengthens by the same amount tD shortens, thus increasing iL. This is the Ohmic translation that ALI and ALV model. Under the Norton test conditions that Figure 8 illustrates (ZL′ is disabled, so there are no vo variations, and vIN being an independent voltage source, there are no vin variations; thus, no ve or vd variations), iL becomes an Ohmic translation of vL:
The small-signal inductor current increase il is then the derivative of iL with respect to dE:
il corresponds to the extra inductor charge ql delivered to vo (as Figure 4 shows). AL is the component of ALI in Figure 7 that maps dl to il when small vO variations vo are absent.
Duty-Cycled Current: ALI translates dl to il′ when disabling ZL′ with zero vo as Figure 8 shows. Intuitively, ALI represents the change in inductor current in response to a small perturbation dl, excluding the loading effect by superposition. This short-circuit il′ is a small-signal current source is. In boost-derived variants, since iL and dO in iL′ both vary with dE, is carries 2 components, io and id:
The first component is a DO fraction of il, corresponding to the current io that the charge qo in Figure 5 delivers. The second term is zero in buck converters because dO is 1. In boost converters, however, it becomes an inverting fraction of iL at its peak value IL(HI), since dO equals dD, which is 1 − dE. When ΔiL is much lower than iL, IL(HI) approximates to IL = IL′/DO.
Model Translations: ALV in Figure 7 is the unloaded Ohmic translation that ALI feeds ZL′ (ALV is the gain of the voltage source driving the inductor):
Because RL′ is usually very low, ALV0 approximates to (VE + VD)/DO. IL(HI)ZL′ overcomes and inverts ALV past the inverting zero zDO [18]:
The final component id in (10) represents the charge qe and qd lost by teIL(HI) across TSW. Fortunately, io is much higher than id at low frequency because ZL in io is very low. However, il decreases with frequency as ZL increases with frequency. Because id remains constant, it eventually exceeds il, causing io to drop below id past zDO.
3.3. Direct Small-Signal Model
Figure 10 below illustrates the Thevenin-equivalent model developed in the previous subsection, while Table 2 summarizes the expressions for its components. In CCM, the duty-cycle command dL controls the switched inductor. This inductor behaves as an equivalent impedance driven by the voltage source vs, with a gain ALV relative to dL.
Figure 10.
Switched inductor small-signal direct model in CCM.
Table 2.
Component expressions of the CCM small-signal direct model.
3.4. Loaded Gains
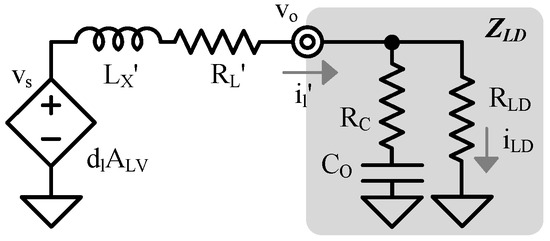
A switched inductor usually connects to a load ZLD, which typically includes a capacitor CO with an associated series resistance RC, and a load resistance RLD, as Figure 11 depicts. ZLD exhibits a pole zLD′ when CO shorts RLD and RC and a zero zCX when CO shorts RC [16]:
Figure 11.
Loaded switched inductor in CCM.
The current that the switched inductor delivers to RLD is iLD. The output voltage of the power stage matches the load voltage.
Duty-Cycled Current: when the switched inductor is connected to ZLD, as Figure 11 shows, it functions as a power stage. The transfer function of LX, CO, RLD, and their parasitics exhibits an LC double pole pLC with quality factor QLC, and a load zero zLD′ arising when CO shorts RLD and RC. AG is the transconductance gain from vs to il′. The output current il′ to duty cycle dl gain, defined as AIL′, is simply:
Inductor Current: Deriving the dl-to-il gain requires reconstructing the current waveform to isolate AL in (10) and accounting for the DC inductor current IL(HI) flowing into the load impedance ZLD in Figure 11 [19]:
il′ denotes the current delivered by the power stage, whereas il is the inductor current. Although sometimes useful for intermediate analysis, il remains an internal signal of the power stage.
Unlike AIL′, the AIL gain to il excludes zDO because il is not affected by the effect of dO. Because of the gain reconstruction, the zero zLD in AIL shifts to:
Because RC is often very low, zCX is often much higher than zLD′, so zLD approximates to zLD′(1 + IL(HI)RLD/ALV0).
Outputs: The dl-to-vo gain AVO is the gain that il′ sets into ZLD: ALVAGZLD [16]. The dl to load current iLD (in Figure 10) gain AILD is then simply AVO/RLD.
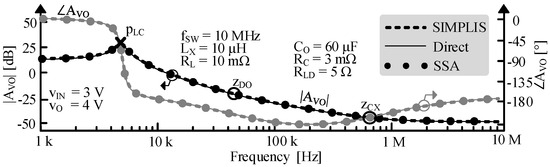
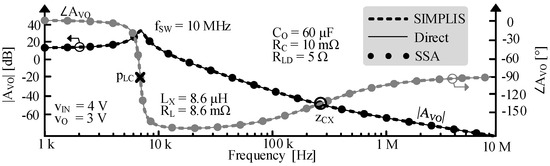
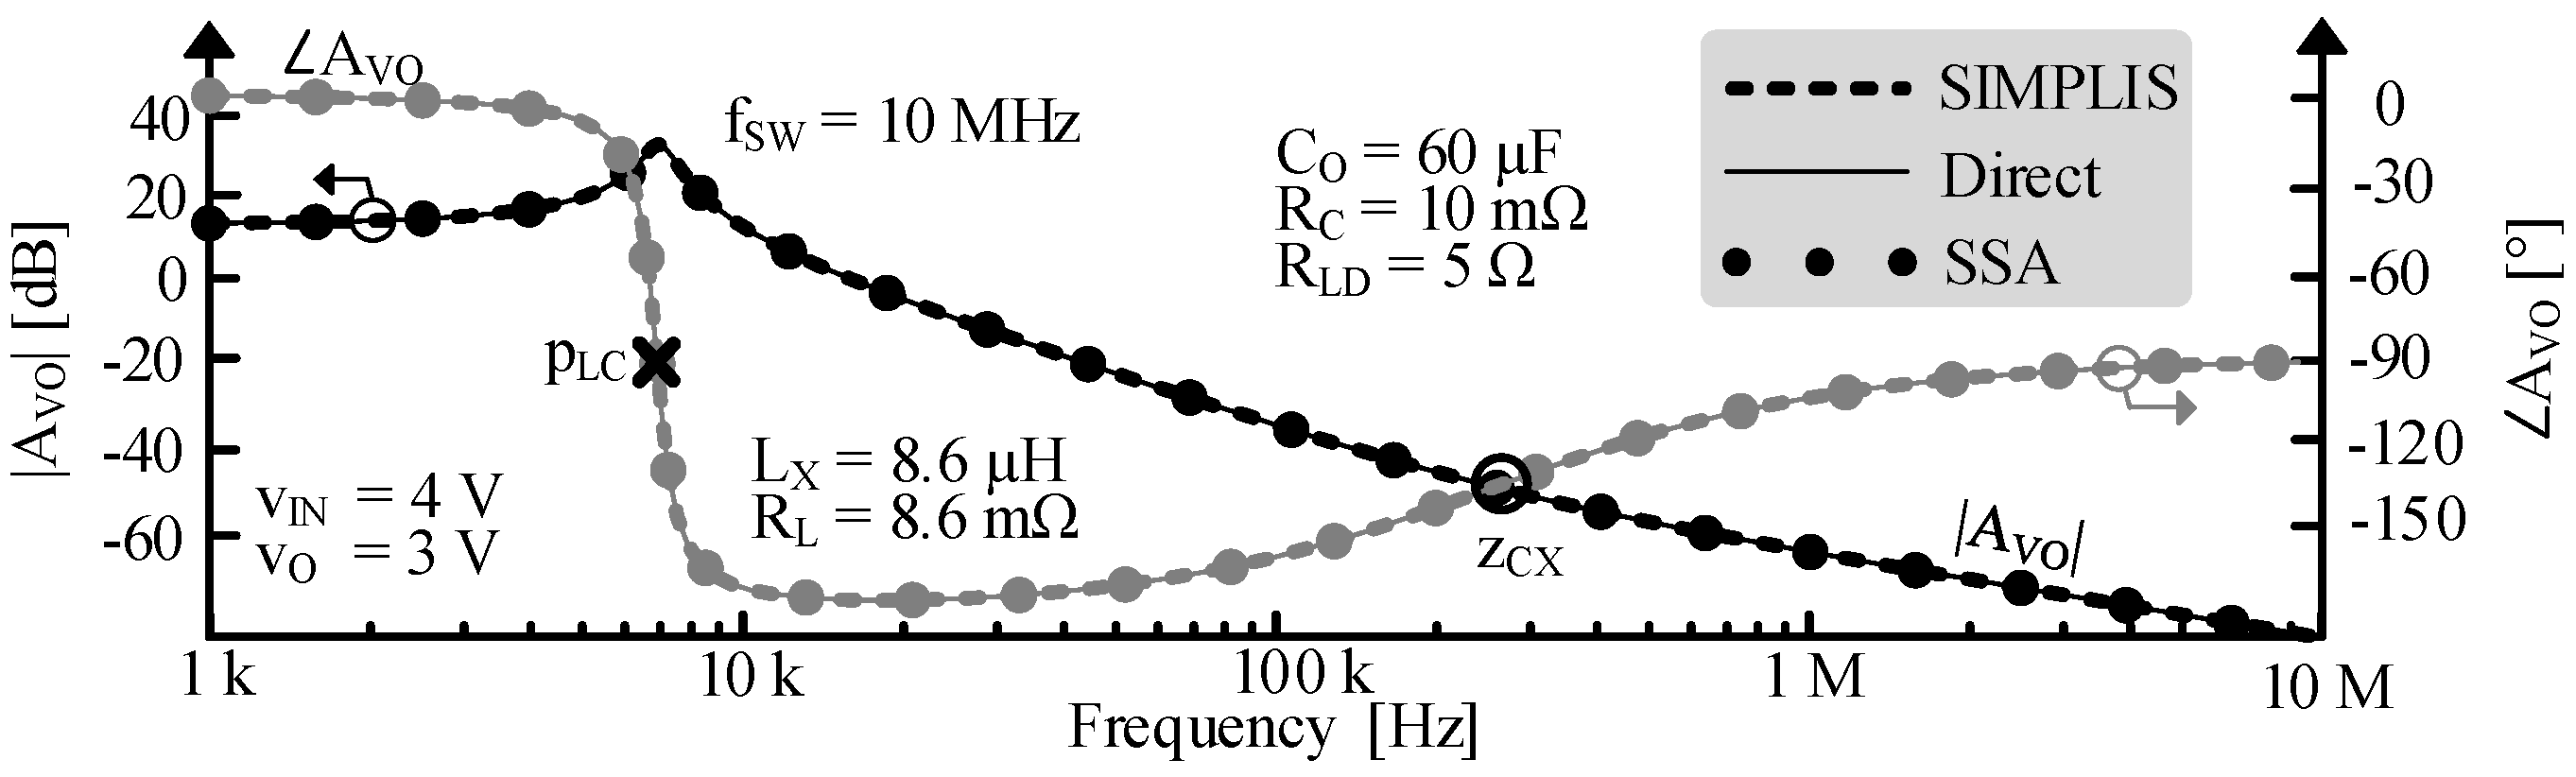
Figure 12 shows the output-voltage-to-duty-cycle gain AVO for a boost converter. The Bode plots are obtained using the proposed direct model and the state-space averaging (SSA) model [4], with SIMPLIS providing the reference simulated response. Since both Circuit Averaging and Signal Flow Graph approaches are fundamentally derived from the SSA formulation, their transfer functions coincide with those obtained from SSA; therefore, only the SSA, proposed model, and SIMPLIS-based results are plotted for clarity. The resulting curves largely overlap, indicating very close agreement between the analytical models and the simulation. The direct model is shown using a thin solid trace, the SIMPLIS simulation using a medium dashed trace, and the SSA model using a thick dotted trace, with magnitude plotted in black and phase in dark gray. Figure 13 presents the corresponding results for a buck converter under the same operating conditions: zDO is absent, and pLC shifts to the left, because dO is 1. As in the boost case, SIMPLIS and the SSA [4] and direct models exhibit essentially identical accuracy. Table 2 below summarizes key parameters of the Bode plots. Despite the inherent uncertainties associated with reading values from simulated Bode plots, theoretical values closely match the simulated ones.
Figure 12.
Simulated and calculated CCM gain to vo for boost.
Figure 13.
Simulated and calculated CCM gain to vo for buck.
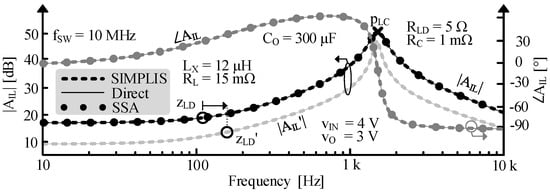
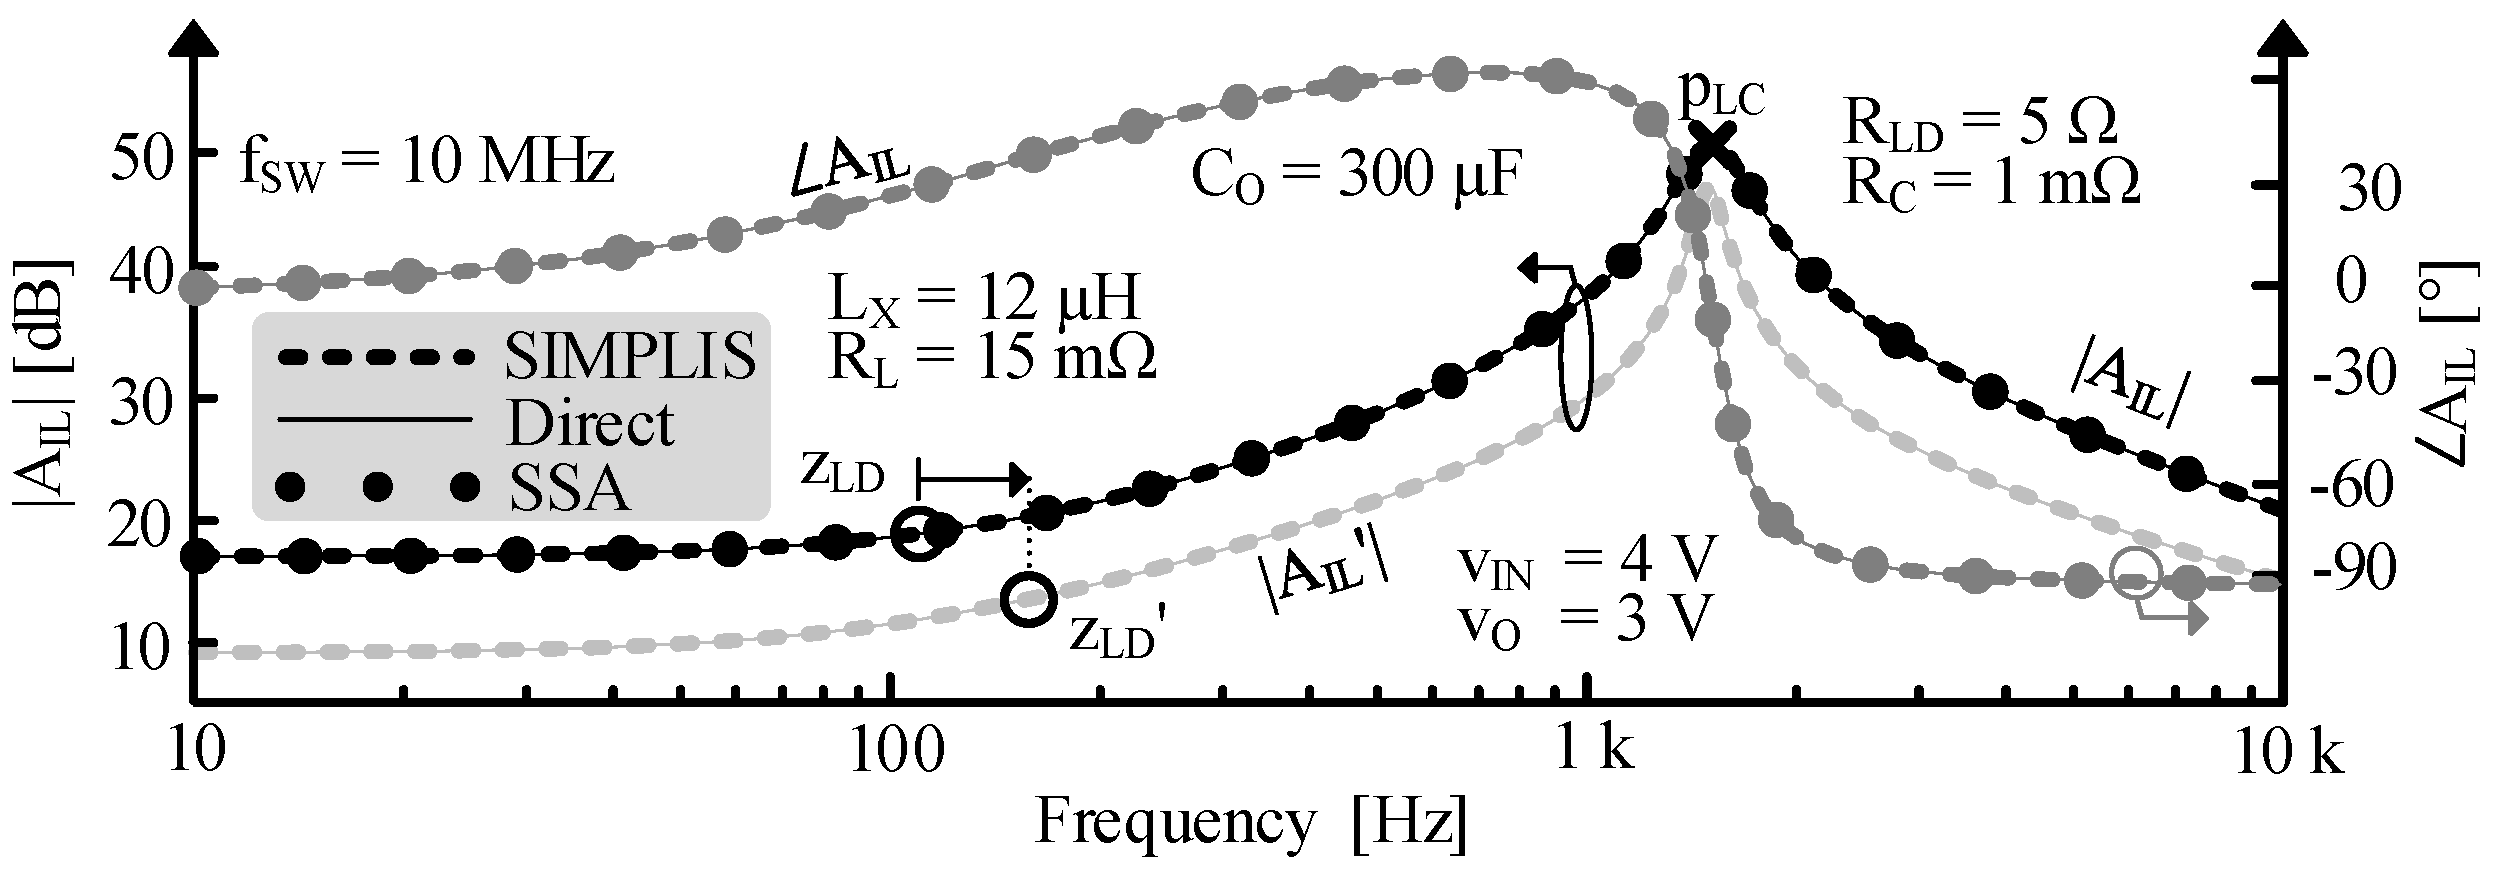
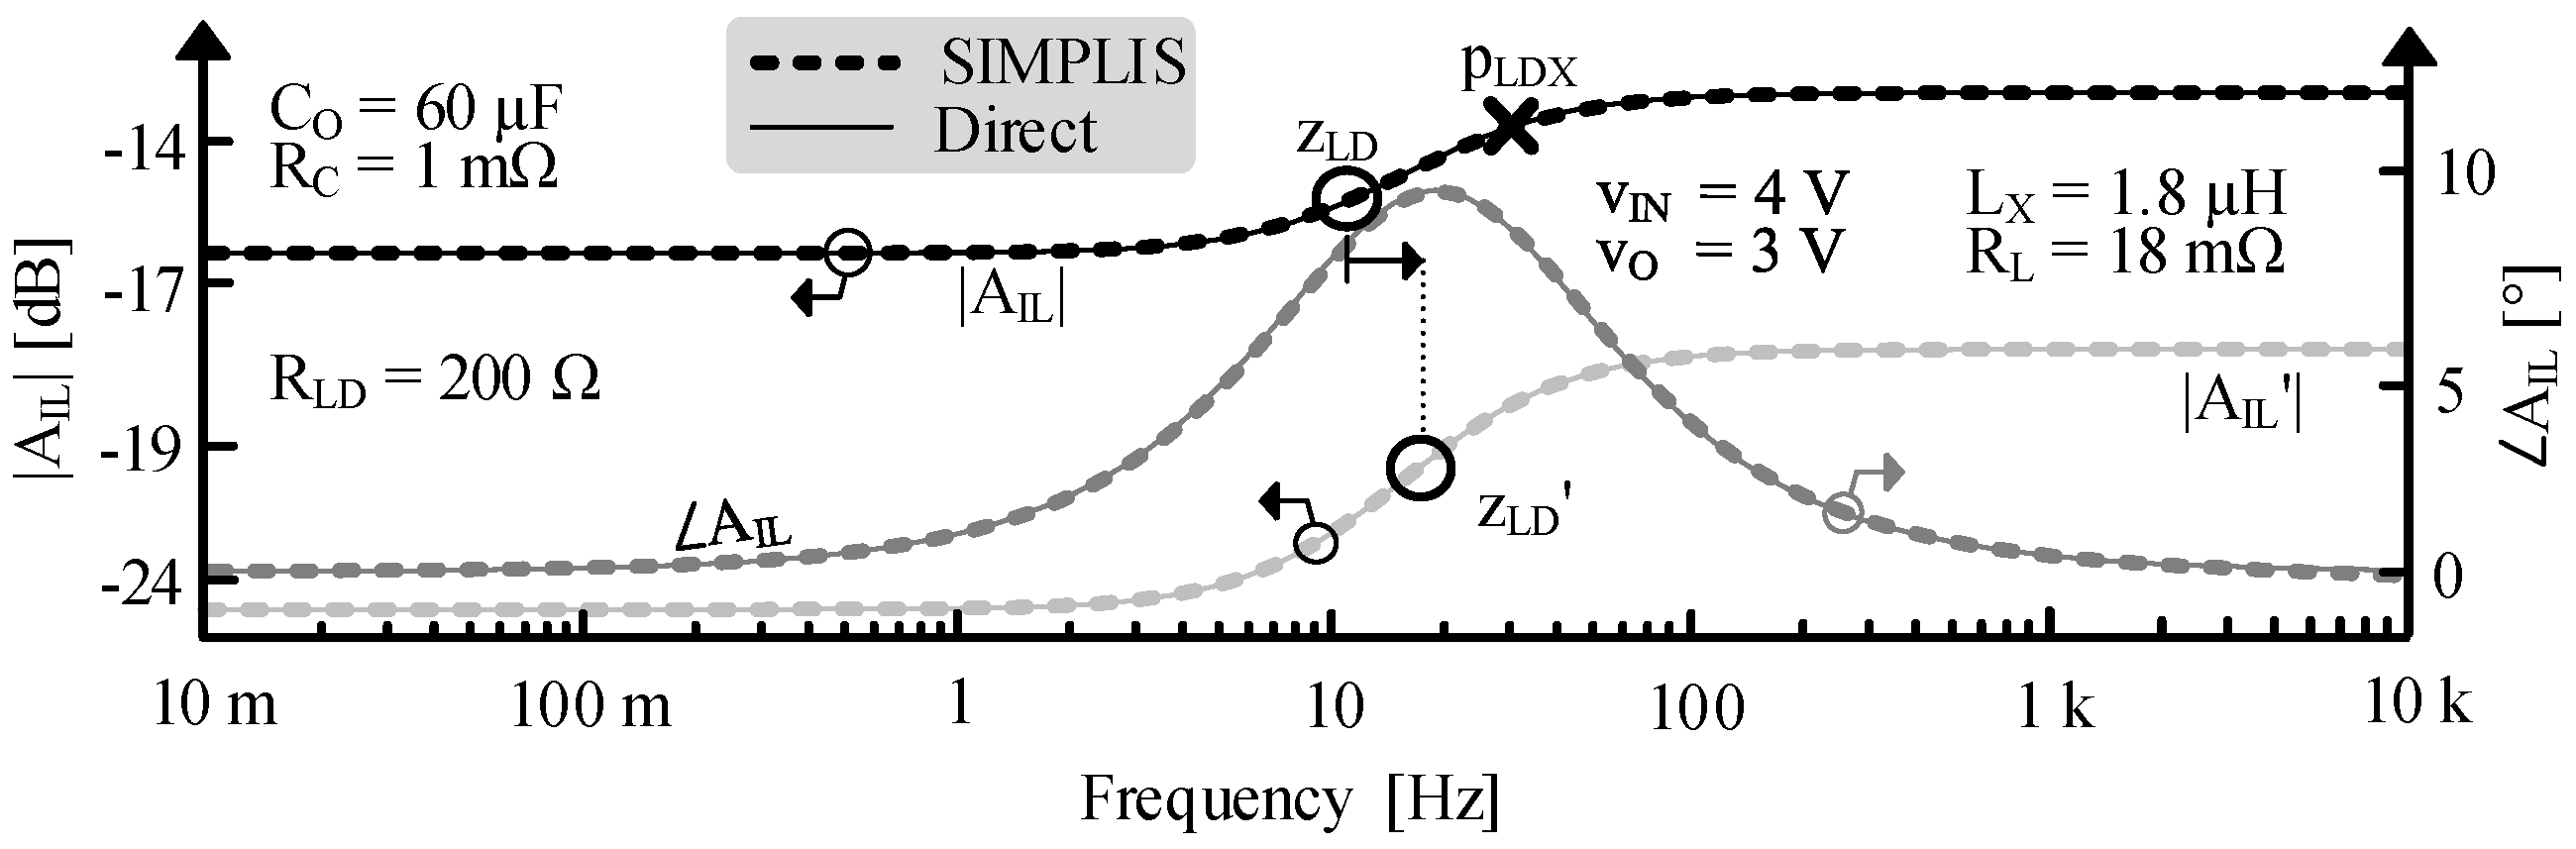
Figure 14 shows the inductor-current-to-duty-cycle gain AIL for a buck–boost converter. The Bode plots include SIMPLIS, the proposed direct model, and the state-space averaging (SSA) model [18], with parameters summarized in Table 3. The resulting curves largely overlap, indicating very close agreement between the two modeling approaches and SIMPLIS. The magnitude /AIL′/ is also shown in light gray to highlight the shift of zLD in AIL, as described by (15).
Figure 14.
Simulated and calculated CCM gain to il for buck–boost.
Table 3.
Summary of CCM gains Bode plots values.
4. Discontinuous-Conduction Model
In DCM, in order to save power, the controller typically turns all power switches off after the inductor has completely discharged, thereby introducing a zero-current interval following the conduction period. The fact that the inductor fully drains before the start of the next cycle means that is loses qe with dO, but no part of qd that would otherwise invert and alter is in CCM. As a result, ALI and ALV in DCM do not include zDO. It also means that a longer tE will require a proportionately longer tD to drain the inductor, because the vE and vD that project iL are static. Therefore, the portion of vE applied to LX by dE cancels out the portion of vD applied by dD. As a result, the net small-signal voltage vl across LX is zero:
Since the projections of vE and vD onto the inductor current remain constant, the ratios of te/td and TE/TD are identical. Changes in tE cause corresponding changes in tC (and tD), which track proportionally with both TE and TC. As a result, the ratio te/TE, denoted as ks, matches the ratio tc/TC:
Therefore, dE is equal to its static value DE, and exhibits no small-signal variations de:
By extension from (2), ks also aligns with the fraction of the peak inductor current il(pk) relative to its steady-state peak IL(PK). In DCM, the small-signal duty-cycle command dl (which is no longer equal to de) effectively modulates the amount of charge drawn by the inductor. The proposed DCM model assumes constant-frequency operation (i.e., fixed switching period) rather than frequency modulation. Regulation is achieved by modulating the inductor charge per cycle through duty-cycle variation, both under small-signal perturbations and under large-signal load changes. In this framework, the switching frequency remains constant while the amount of energy transferred per cycle is adjusted to meet the load demand.
4.1. Equivalent Impedance
Similarly to CCM, ZL′ is the equivalent output impedance of the switched inductor when there are no small-signal variations in dL. Namely, it is the impedance seen into LX when both tC and tSW are static, and LX connects to vO for a dO fraction of tC. Because vL across LX is zero, ZL′ is insensitive to frequency. As a result, ZL′ behaves like a duty-cycled resistance RL′, which loads vO over TSW by the amount of energy that LX draws during the dO portion of TC. In DCM, the output effectively sees the inductance as an equivalent loading resistance RL′.
Viewed this way, iLX is the current that LX draws from vO during the dO portion of TC, and EL is the energy stored in LX once the inductor current iL ramps up to iLX:
This EL is the power PR′ that RL′ burns across TSW [20]:
Thus, RL′ is the frequency-independent equivalent of LX′ in CCM. The duty-cycled contribution of the series resistance RL increases RL′, but typically only slightly:
4.2. Unloaded Gain Translations
Because the inductor current returns to zero at the end of each switching period in DCM, the energy transferred to the output during each cycle is determined by the peak inductor current reached during the energizing interval. Under the assumption that the inductor remains in DCM, it behaves like a current source delivering charge to the output (with a gain with respect to dl given by ALI). The equivalent resistance RL′ then represents the effective loading seen by the output, corresponding to the Norton equivalent resistance of the source.
Duty-Cycled Current: ALI translates the small-signal variation dl into il′ when ZL′ is disabled; in other words, when vO is 0, as Figure 9 shows. While il′ outputs all the charge qL that LX delivers, it excludes the static component QL. Since iL ramps linearly, both qL and QL correspond to the areas under the triangular waveforms traced by iL and IL in Figure 6.
qL′s tC and iL(PK) are TC and IL(PK) plus corresponding ks fractions of TC and IL(PK) because tc and il(pk) scale with TC and IL(PK):
vo then receives the small-signal charges qo, a duty-cycle portion of ql:
Since ks is a small fraction and te/tc = DE, the term 2ks dominates over ks2, and tc can be approximated as te/DE. As a result, qL is approximately the rectangular area defined by tc and IL(PK) in Figure 6, so ALI is is/dl, which is roughly qD/(TSWdl):
4.3. Direct Small-Signal Models
Figure 15 below shows the models that the previous subsection develops, while Table 4 summarizes the expressions for its components. In DCM, a Norton equivalent model models the power stage as a current-sourced resistor. This model can be transformed into a Thevenin equivalent model.
Figure 15.
Switched inductor small-signal direct models in DCM.
Table 4.
Component expressions of the DCM small-signal direct model.
4.4. Loaded Gains
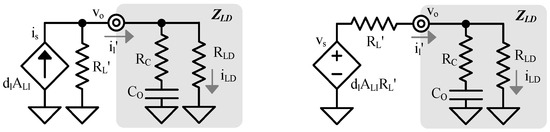
As in Section 3.4, the switched inductor load constitutes a power stage operating in DCM. Figure 16 illustrates the corresponding loaded models. The Norton direct model is shown on the left, and the Thevenin direct model on the right.
Figure 16.
Loaded switched inductor in DCM: Norton (left) and Thevenin (right).
Duty-Cycled Current: similarly to CCM, AG is the transconductance gain from vs to il′ and depends on the nature of the load. When the power stage feeds ZLD like in Figure 16, AG is [21]:
Inductor Current: unlike in CCM, only qe stops reaching the output when de increases. This is why AIL does not show a 1/DO factor in the reconstructed current waveform:
Thus, the zero zLD in AIL in DCM shifts to:
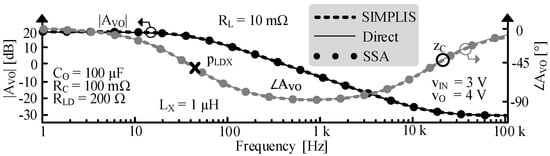
Outputs: by defining AZ as the parallel combination of RL′ and ZLD, AVO in DCM becomes ALIAZ, and AILD is AVO/RLD. Figure 17 below shows AVO for a boost in DCM [22]. The responses obtained from SIMPLIS, the SSA, and the proposed direct model largely overlap, indicating very close agreement between the two approaches.
Figure 17.
Simulated and calculated DCM gain to vo for boost.
Figure 18 shows AIL for a buck–boost converter under the same load conditions, with key parameters listed in Table 3. The response predicted by the proposed direct model closely overlaps the SIMPLIS simulation, demonstrating excellent agreement. Figure 18 also plots the magnitude |AIL′| in light gray to highlight the shift of zLD in AIL in DCM, as described by (29). To the authors′ knowledge, no SSA model for AIL in this operating mode has been reported in the literature.
Figure 18.
Simulated and calculated DCM gain to il for buck–boost.
5. Conclusions
This work presents a direct small-signal AC response model for switched inductors in both DCM and CCM that preserves circuit-level insight while maintaining the accuracy of established modeling approaches. The voltage and current gains derived from the proposed model closely match those obtained using state-space averaging, as confirmed by Bode-plot comparisons that show nearly overlapping frequency responses. In both conduction modes, the method enables the systematic derivation of the duty-cycle-to-output-voltage, duty-cycle-to-output-current, and duty-cycle-to-inductor-current transfer functions within a unified circuit framework. The model accurately captures the LC double pole and associated zeros, including the shift of the load-related zero in the reconstructed duty-cycle-to-inductor-current gain. In addition to supporting the derivation of these key gains, the proposed approach retains direct circuit interpretability and remains straightforward to use, analyze, and simulate. These characteristics suggest that the method could facilitate control-loop design and may be suitable for integration into automated synthesis or optimization frameworks. Furthermore, the analytical expression obtained for the DCM duty-cycle-to-inductor-current gain contributes to clarifying this relationship within the existing literature.
Author Contributions
Conceptualization, G.G. and G.A.R.-M.; methodology, G.A.R.-M.; validation, G.G.; formal analysis, G.G. and G.A.R.-M.; investigation, G.G. and G.A.R.-M.; resources, G.A.R.-M.; writing—original draft preparation, G.G.; writing—review and editing, G.G. and G.A.R.-M.; visualization, G.G.; supervision, G.A.R.-M.; project administration, G.A.R.-M.; funding acquisition, G.A.R.-M. All authors have read and agreed to the published version of the manuscript.
Funding
This research was funded by Texas Instruments (Grant # AWD-001786).
Data Availability Statement
The paper contains all necessary information for the readers to be able to resimulate all the results.
Acknowledgments
The authors thank Texas Instruments (TI) for sponsoring this research and Orlando Lazaro, Tianyu Chang, Raveesh Magod, and Jeff Morroni for their support and advice.
Conflicts of Interest
The authors declare that this study received funding from Texas Instruments Grant # AWD-001786. Texas Instruments was not involved in the study design, collection, analysis, interpretation of data, the writing of this article or the decision to submit it for publication.
Nomenclature
| AG | Transconductance gain from vs to il′. |
| AG0 | Low-frequency component of AG. |
| AIL | dl-to-il gain. |
| AIL0 | Low-frequency component of AIL. |
| AIL′ | dl-to-il′ gain. |
| AL | Inductor current gain. |
| ALI | Output grounded gain from is to dl. |
| ALV | Open circuit gain from dl to vs. |
| ALV0 | Low-frequency component of ALV. |
| AVO | dl-to-vo gain. |
| AVO0 | Low-frequency component of AVO. |
| AZ | Parallel combination of RL′ and ZLD (in DCM). |
| CG | Switches’ gate capacitance. |
| CO | Power stage output capacitor. |
| dE | Energizing duty-cyle. |
| dD | Draining duty-cycle. |
| dL | Duty-cycle command. |
| dO | Output duty-cycle. |
| EL | Energy stored in LX when deriving LX′. |
| EL′ | Energy stored in LX′ when deriving LX′. |
| id | Small-signal current that qd delivers. |
| ie | Small-signal current that qe delivers. |
| iL | Inductor current. |
| iL′ | Power stage output current. |
| iL(HI) | Inductor peak current in CCM. |
| iL(LO) | Inductor valley current in CCM. |
| iL(PK) | Inductor peak current in DCM. |
| iLD | Load current. |
| iLI | Flyback primary (input) side current. |
| iLO | Flyback secondary (output) side current. |
| iLX | Equivalent current in LX when deriving LX′. |
| iLX′ | Equivalent current in LX′ when deriving LX′. |
| iXO | Flyback output side equivalent transformer current. |
| ΔiL | Inductor ripple current in CCM. |
| io | Small-signal current that qo delivers. |
| is | Small-signal current source in the direct model. |
| kL | Transformer turn ratio. |
| ks | Ratio of te/TE in DCM. |
| LX | Inductance. |
| LX′ | Duty-cycled inductance. |
| pLC | LC double pole. |
| pLDX | Load pole in DCM when CO shorts RC and RL′ // RLD. |
| qd | Additional small-signal charge lost by vO in CCM. |
| qe | Small-signal charge lost by vO. |
| qL | Total charge carried by the inductor. |
| QLC | LC quality factor. |
| qo | Small-signal charge delivered to the output. |
| RC | Parasitic resistance of CO. |
| RL | Inductor’s parasitic resistance. |
| RL′ | Resistive part of ZL′. |
| RLD | Load resistance. |
| SI | Input switch. |
| SIG | Input ground switch. |
| SO | Output switch. |
| SOG | Output ground switch. |
| tC | Conduction period. |
| tD | Draining portion of the switching period. |
| tE | Energizing portion of the switching period. |
| tO | dO fraction of the switching period. |
| tSW | Switching period. |
| vE | Energizing voltage across the inductor. |
| vD | Draining voltage across the inductor. |
| vIN | Input voltage. |
| vL | Inductor voltage. |
| vLI | Flyback primary (input) side voltage. |
| vLO | Flyback secondary (output) side voltage. |
| vs | Small-signal voltage source in the direct model. |
| zCX | Output capacitor zero when RC current-limits CO. |
| zDO | Inverting zero in boost-derived topologies. |
| ZL′ | Duty-cycled inductor equivalent impedance. |
| ZLD | Load impedance. |
| zLD | Load pole/zero when CO shorts RC and RLD. |
| zLD′ | Shifted zero zLD in AIL′. |
References
- Chen, W.-C.; Chen, C.-C.; Yao, C.-Y.; Yang, R.-J. A Fast-Transient Wide-Voltage-Range Digital-Controlled Buck Converter with Cycle-Controlled DPWM. IEEE Trans. Very Large Scale Integr. Syst. 2016, 24, 17–25. [Google Scholar] [CrossRef] [Scilit]
- Rincón-Mora, G.A. Analog IC Design with Low-Dropout Regulators; McGraw-Hill: New York, NY, USA, 2009. [Google Scholar]
- Maksimovic, D.; Cuk, S. A Unified Analysis of PWM Converters in Discontinuous Modes. IEEE Trans. Power Electron. 1991, 6, 476–490. [Google Scholar] [CrossRef] [Scilit]
- Sun, J.; Mitchell, D.; Greuel, M.; Krein, P.; Bass, R. Averaged Modeling of PWM Converters Operating in Discontinuous Conduction Mode. IEEE Trans. Power Electron. 2001, 16, 482–492. [Google Scholar] [CrossRef] [Scilit]
- Surya, S.; Srinivasan, M.K.; Williamson, S. Modeling of Average Current in Non-Ideal Buck and Synchronous Buck Converters for Low Power Application. Electronics 2021, 10, 2672. [Google Scholar] [CrossRef] [Scilit]
- Vorpérian, V. Simplified Analysis of PWM Converters Using Model of PWM Switch Part I & II. IEEE Trans. Aerosp. Electron. Syst. 1990, 26, 490–505. [Google Scholar]
- Paduvalli, V.; Taylor, R.J.; Balsara, P.T. Analysis of Zeros in a Boost DC–DC Converter: State Diagram Approach. IEEE Trans. Circuits Syst. II Expr. Briefs 2017, 64, 550–554. [Google Scholar] [CrossRef] [Scilit]
- Saini, D.K.; Kazimierczuk, M.K. Open-loop transfer functions of buck–boost converter by circuit-averaging technique. IET Power Electron. 2019, 12, 2858–2864. [Google Scholar] [CrossRef] [Scilit]
- Ki, W. Signal Flow Graph in Loop Gain Analysis of DC-DC PWM CCM Switching Converters. IEEE Trans. Circuits Sys. I 1998, 45, 644–655. [Google Scholar]
- Ma, Y.; Smedley, K. Switching Flow-Graph Nonlinear Modeling Method for Multistate-Switching Converters. IEEE Trans. Power Electron. 1997, 12, 854–861. [Google Scholar]
- Veerachary, M. Analysis of Fourth-Order DC-DC Converters: A Flow Graph Approach. IEEE Trans. Ind. Electron. 2008, 55, 133–141. [Google Scholar] [CrossRef] [Scilit]
- Corti, F.; Laudani, A.; Lozito, G.M.; Reatti, A.; Bartolini, A.; Ciani, L.; Kazimierczuk, M.K. Modelling of a pulse-skipping modulated DC–DC buck converter. IET Power Electron. 2022, 16, 243–254. [Google Scholar] [CrossRef] [Scilit]
- Kroičs, K.; Gaspersons, K.; Zdanowski, M. Modular DC-DC Converter with Adaptable Fast Controller for Supercapacitor Energy Storage Integration into DC Microgrid. Electronics 2025, 14, 700. [Google Scholar] [CrossRef] [Scilit]
- Abbas, G.; Gu, J.; Farooq, U.; Abid, M.I.; Raza, A.; Asad, M.U.; Balas, V.E.; Balas, M.E. Optimized Digital Controllers for Switching-Mode DC-DC Step-Down Converter. Electronics 2018, 7, 412. [Google Scholar] [CrossRef] [Scilit]
- Firpo, P.; Ravera, A.; Oliveri, A.; Lodi, M.; Storace, M. Use of a Partially Saturating Inductor in a Boost Converter with Model Predictive Control. Electronics 2023, 12, 3013. [Google Scholar] [CrossRef] [Scilit]
- Yao, J.; Abramovitz, A. Fast SFG Modeling of Integrated Converters. IEEE J. Emerg. Sel. Top. Power Electron. 2017, 5, 1008–1019. [Google Scholar] [CrossRef] [Scilit]
- Kim, S.; Rincon-Mora, G.A.; Kwon, D. Extracting the frequency response of switching DC-DC converters in CCM and DCM from time-domain simulations. In Proceedings of the 2011 International SoC Design Conference, Jeju, Republic of Korea, 17–18 November 2011; pp. 385–388. [Google Scholar]
- Cuk, S. Modeling, Analysis, and Design of Switching Converters. Ph.D. Thesis, California Institute of Technology, Pasadena, CA, USA, November 1976. [Google Scholar]
- Zhu, M.; Luo, F.L. Graphical Analytical Method for Power DC-DC Converters: Averaging Binary Tree Structure Representation. IEEE Trans. Power Electron. 2007, 22, 701–705. [Google Scholar] [CrossRef] [Scilit]
- Kwon, D.; Rincon-Mora, G.A. Operation-based signal-flow AC analysis of switching DC-DC converters in CCM and DCM. In Proceedings of the 2009 52nd IEEE International Midwest Symposium on Circuits and Systems, Cancun, Mexico, 2–5 August 2009; pp. 957–960. [Google Scholar]
- Erickson, R.; Maksimović, D. Fundamentals of Power Electronics, 2nd ed.; Springer Science & Business Media, LLC: New York, NY, USA, 2001. [Google Scholar]
- Ćuk, S.; Middlebrook, R. A general unified approach to modeling switching dc-to-dc converters in discontinuous conduction mode. In Proceedings of the IEEE Power Electronics Specialists Conference, Palo Alto, CA, USA, 14–16 June 1977; pp. 36–57. [Google Scholar]







Disclaimer/Publisher’s Note: The statements, opinions and data contained in all publications are solely those of the individual author(s) and contributor(s) and not of MDPI and/or the editor(s). MDPI and/or the editor(s) disclaim responsibility for any injury to people or property resulting from any ideas, methods, instructions or products referred to in the content. |
© 2026 by the authors. Licensee MDPI, Basel, Switzerland. This article is an open access article distributed under the terms and conditions of the Creative Commons Attribution (CC BY) license.