


Abstract
To address the degradation in he ranging accuracy of phase-sensitive radar systems caused by RF front-end group delay mismatch, this paper establishes a nonlinear group delay interference model. Using Monte Carlo simulations, we derive the group delay constraints required to achieve millimeter-level ranging accuracy, and, based on these constraints, we propose a novel negative group delay circuit (NGDC). The proposed NGDC attains a figure of merit (FoM) of 0.063, outperforming related designs while offering low insertion loss and high tuning flexibility. After cascading the NGDC, the group delay of a 200–400 MHz bandpass filter (BPF) was improved from ns to ns. When incorporated into the radar system, the NGDC reduces the root mean square (RMS) ranging error from 17.17 mm to 9.25 mm at dB, approaching the theoretical limit of 5.07 mm. These results demonstrate that the proposed hardware provides effective support for high-precision phase linearization in radar systems and offers substantial engineering value.
1. Introduction
Ice shelves fringe much of the Antarctic continent, and their evolution has become a key uncertainty in assessing Antarctica’s contribution to future sea-level change. In recent years, global warming has intensified basal melting beneath these ice shelves. To accurately obtain melt rates, phase-sensitive frequency-modulated continuous-wave (FMCW) radar has emerged [1]. Unlike traditional radar systems that rely primarily on spectral peaks for centimeter-level ranging, phase-sensitive radar can, in principle, achieve millimeter-level deformation monitoring over a 200 MHz–400 MHz bandwidth by exploiting the signal phase [2]. Achieving such extreme precision critically depends on the fidelity of the intermediate-frequency (IF) signal phase, because even slight phase distortions can directly translate into ranging biases.
This demand for high precision extends the utility of phase-sensitive architectures beyond radar to other sensing domains. Traditionally, many sensing platforms rely on gain/phase detectors (GPDs) for static measurements. However, GPD-based systems are often limited by analog noise and narrow dynamic ranges. Modulation-based paradigms, such as FMCW, provide a more robust alternative. These frameworks map target variations into precise frequency or phase shifts, achieving higher resolution and better noise immunity. For instance, Tseng et al. [3] developed a high-sensitivity microfluidic sensor based on a frequency-modulation mechanism. Similarly, Wang et al. [4] utilized the multimode characteristics of metamaterial resonators for dielectric characterization. In both radar and precision sensing, phase linearity remains a critical factor for measurement fidelity. Group delay ripples directly cause frequency-estimation jitter, which limits the system’s performance. Therefore, the hardware-level linear-phase circuit is essential for ensuring signal integrity in diverse high-precision platforms.
When a wideband signal propagates through a dispersive medium or RF front-end components, frequency-dependent delays across the spectrum cause the received phase response to depart from linearity, resulting in phase distortion. Group delay, defined as the negative derivative of phase with respect to frequency, is a key metric for quantifying dispersion and phase linearity in transmission systems [5]. In practice, a radar RF front-end is not dispersion-free and inevitably exhibits a nonlinear phase response over the sweep bandwidth. Arsalan et al. modeled the group delay as linearly varying [6]; however, the group delay response in real systems is often nonlinear, which motivates a more rigorous theoretical treatment. For phase-sensitive radar, ranging refinement relies on phase differences to reach millimeter-level accuracy; consequently, phase is the central variable, and group delay anomalies translate directly into phase offsets in IF signal. To address these phase non-idealities, several sophisticated digital algorithms have been developed. For instance, variational nonlinear chirp mode decomposition (VNCMD) [7] has been employed to extract distortion parameters. Furthermore, neural network models utilizing joint ADAM and LBFGS optimization [8] have demonstrated high precision in correcting periodic phase errors. However, internal temperature drifts in the hardware can dynamically alter the signal’s nonlinear profile [9], which increases the complexity of purely algorithmic solutions. Therefore, developing a quantitative framework to assess the impact of nonlinear group delay on phases, and designing efficient hardware compensation circuits remain key bottlenecks for robust phase-sensitive radar operation in polar environments.
A variety of negative group delay (NGD) circuit topologies have been reported to compensate group delay distortion in RF systems. Ravelo et al. investigated a “Li”-shaped NGD topology and obtained bandpass NGD values of ns and ns at 0.92 GHz and 2.56 GHz, respectively, by scaling “Li”-type prototype circuits [10]. Yuan combined a bandstop filter with an NGD network and reported an NGD of ns at 120 MHz with an insertion loss of 6.72 dB [11]. Wu proposed a compact arbitrarily terminated power divider with bandwidth-enhanced NGD behavior, achieving an NGD of ns while exhibiting a 14 dB insertion loss [12]. More recent efforts have emphasized improving NGD flatness over the operating band and extending the applicability of analytical models. Meng presented a compact broadband NGD circuit based on high-impedance transmission lines and coupled lines; by fine tuning the characteristic impedance, an ultra-wideband flat response with a fractional bandwidth of 50.9% was obtained around 1.0 GHz, suppressing delay fluctuations within the passband [13]. From a filter-theory perspective, Nako examined power-law non-integer-order NGD filters, which offer additional degrees of freedom for delay compensation under complex dispersive conditions [14]. Despite these advances, many NGD realizations still face practical limitations, most notably high loss and limited bandwidth [15,16,17,18,19,20]. For ice-penetrating phase-sensitive radar, where phase-linearity requirements are extremely stringent, the key issue is to achieve sufficient group delay flatness while keeping the insertion loss low.
Based on the parameters of a phase-sensitive radar prototype system [21], this work derives analytical expressions, carries out theoretical analysis, and performs simulations to quantify how RF group delay characteristics affect the intermediate-frequency (IF) signal, thereby establishing explicit hardware design constraints. To satisfy these constraints, we design and implement a novel multiband, dual-resonance negative group delay circuit (NGDC). The proposed NGDC provides NGD responses of approximately ns and ns with insertion losses of about 1.3 dB and 2.3 dB, respectively, comparing favorably with related designs. When integrated with a conventional bandpass filter, measurements show that the passband group delay is ns over 200–400 MHz, which satisfies the design requirement. The insertion loss is 2.1 dB at the center frequency, and the in-band magnitude variation is approximately 1.2 dB. The measured responses are then used in system-level simulations of the phase-sensitive radar. At an SNR of 16 dB, the simulated RMS ranging error decreases from 17.38 mm to 9.06 mm, approaching the theoretical limit of 5.07 mm.
2. Nonlinear Group Delay Modeling and Tolerance Requirements for Phase-Sensitive Radar System
2.1. Nonlinear Group Delay Modeling
To quantitatively assess how group delay nonidealities affect radar measurements, the non-ideal group delay response of the RF front-end must be modeled and analyzed. In a phase-sensitive radar system, the transmitted waveform is a linear frequency-modulated (LFM) signal, whose phase can be written as
where denotes the starting frequency and denotes the sweep slope (B is the signal bandwidth and T is the signal period).
In the ideal case, after the signal reaches the target and returns, the phase expression of the echo signal is
where is the time required for the signal to reach the target and return.
When modeling the group delay of the LO and TX/RX paths in an FMCW radar, the dominant contribution to the inter-path group delay mismatch typically arises from the bandpass filter [22]. To isolate the effects of the nominal group delay and the fluctuation amplitude on the ranging performance of phase-sensitive radar, the group delay can be expressed as
where f is the instantaneous frequency at time t (i.e., ). is the nominal group delay within the passband and represents the inherent propagation delay of the system. , , and are the amplitude, the normalized number of cycles across the passband, and the phase offset of the i-th harmonic component, respectively.
In a radar system, if the transfer function of the LTI system is denoted as , the group delay expression is
Furthermore, it can be obtained that
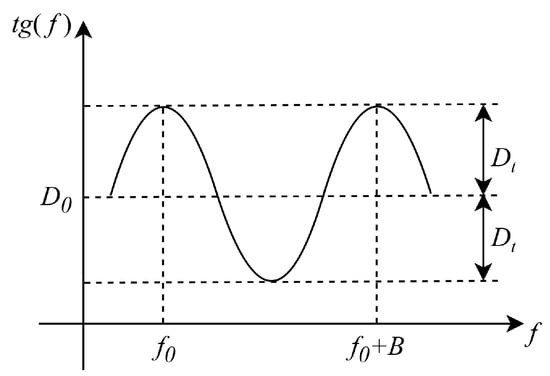
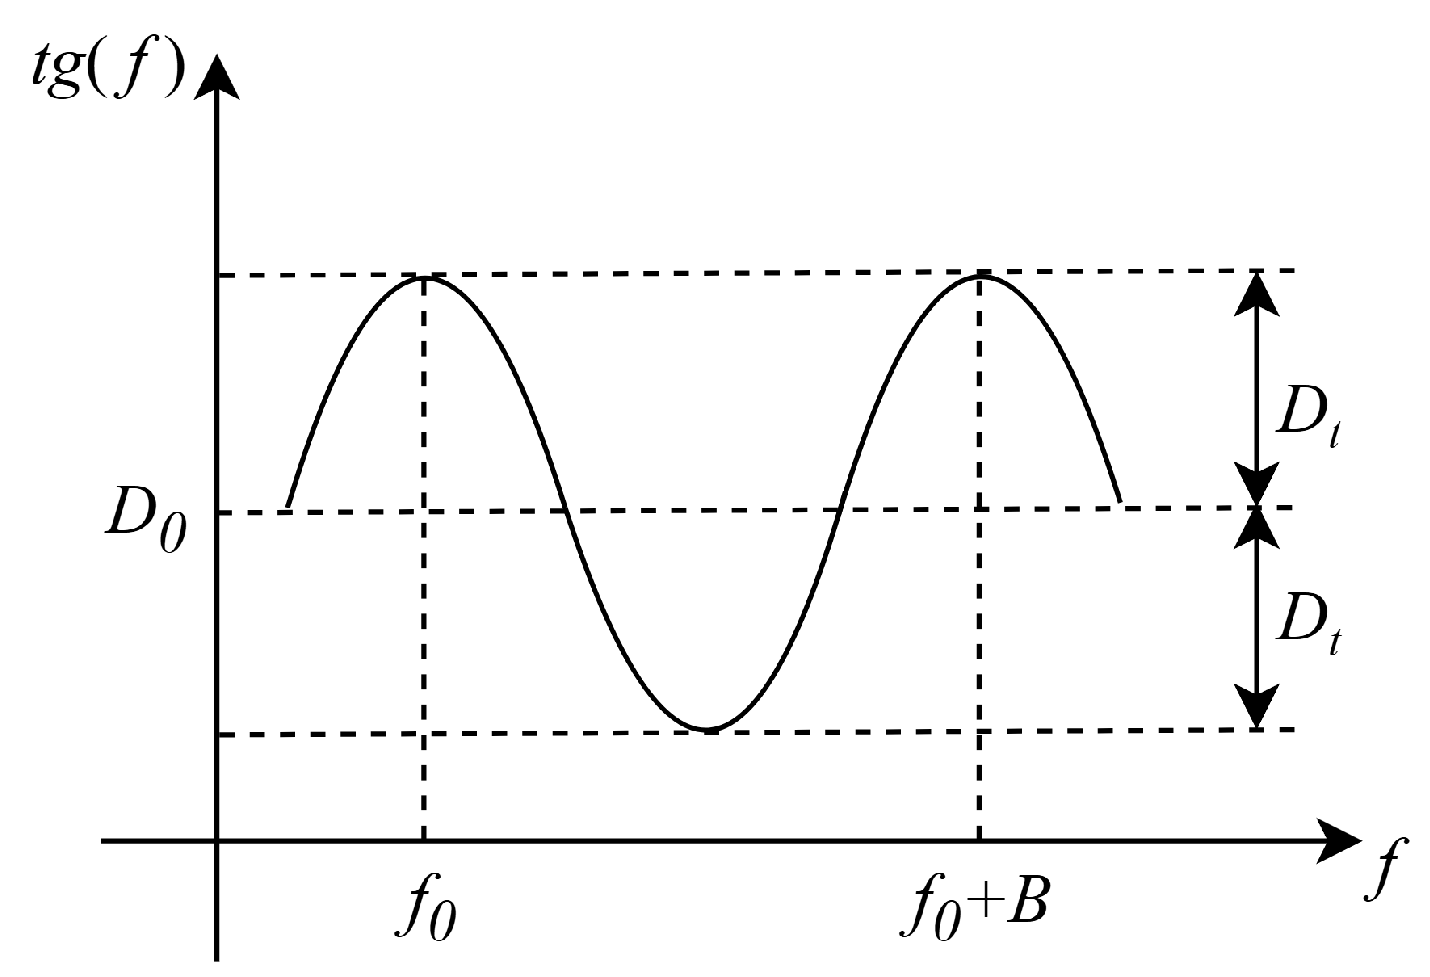
In practical RF implementations, the group delay response is often viewed as a dominant envelope superimposed with smaller, higher-frequency ripples. In general, higher-order terms with larger tend to exhibit smaller fluctuation amplitudes . By contrast, the component that most strongly contributes to phase distortion typically shows a single-cycle variation (), and its delay peak is frequently observed near the passband edges (corresponding to an initial phase offset ) [23,24]. To quantify the maximum potential interference introduced by group delay nonlinearity into the IF phase, Equation (5) can be reduced to a form that retains only the dominant harmonic term:
The simplified group delay diagram is shown in Figure 1.
Figure 1.
Nonlinear group delay model.
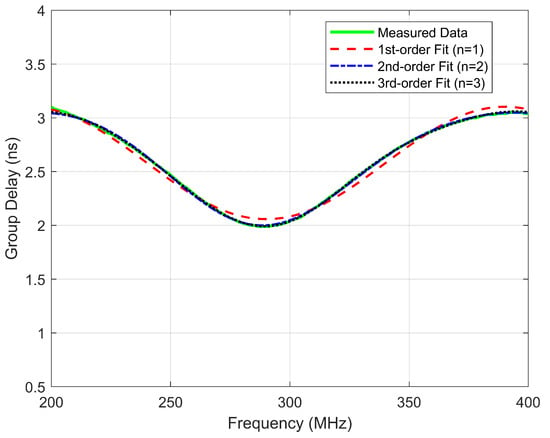
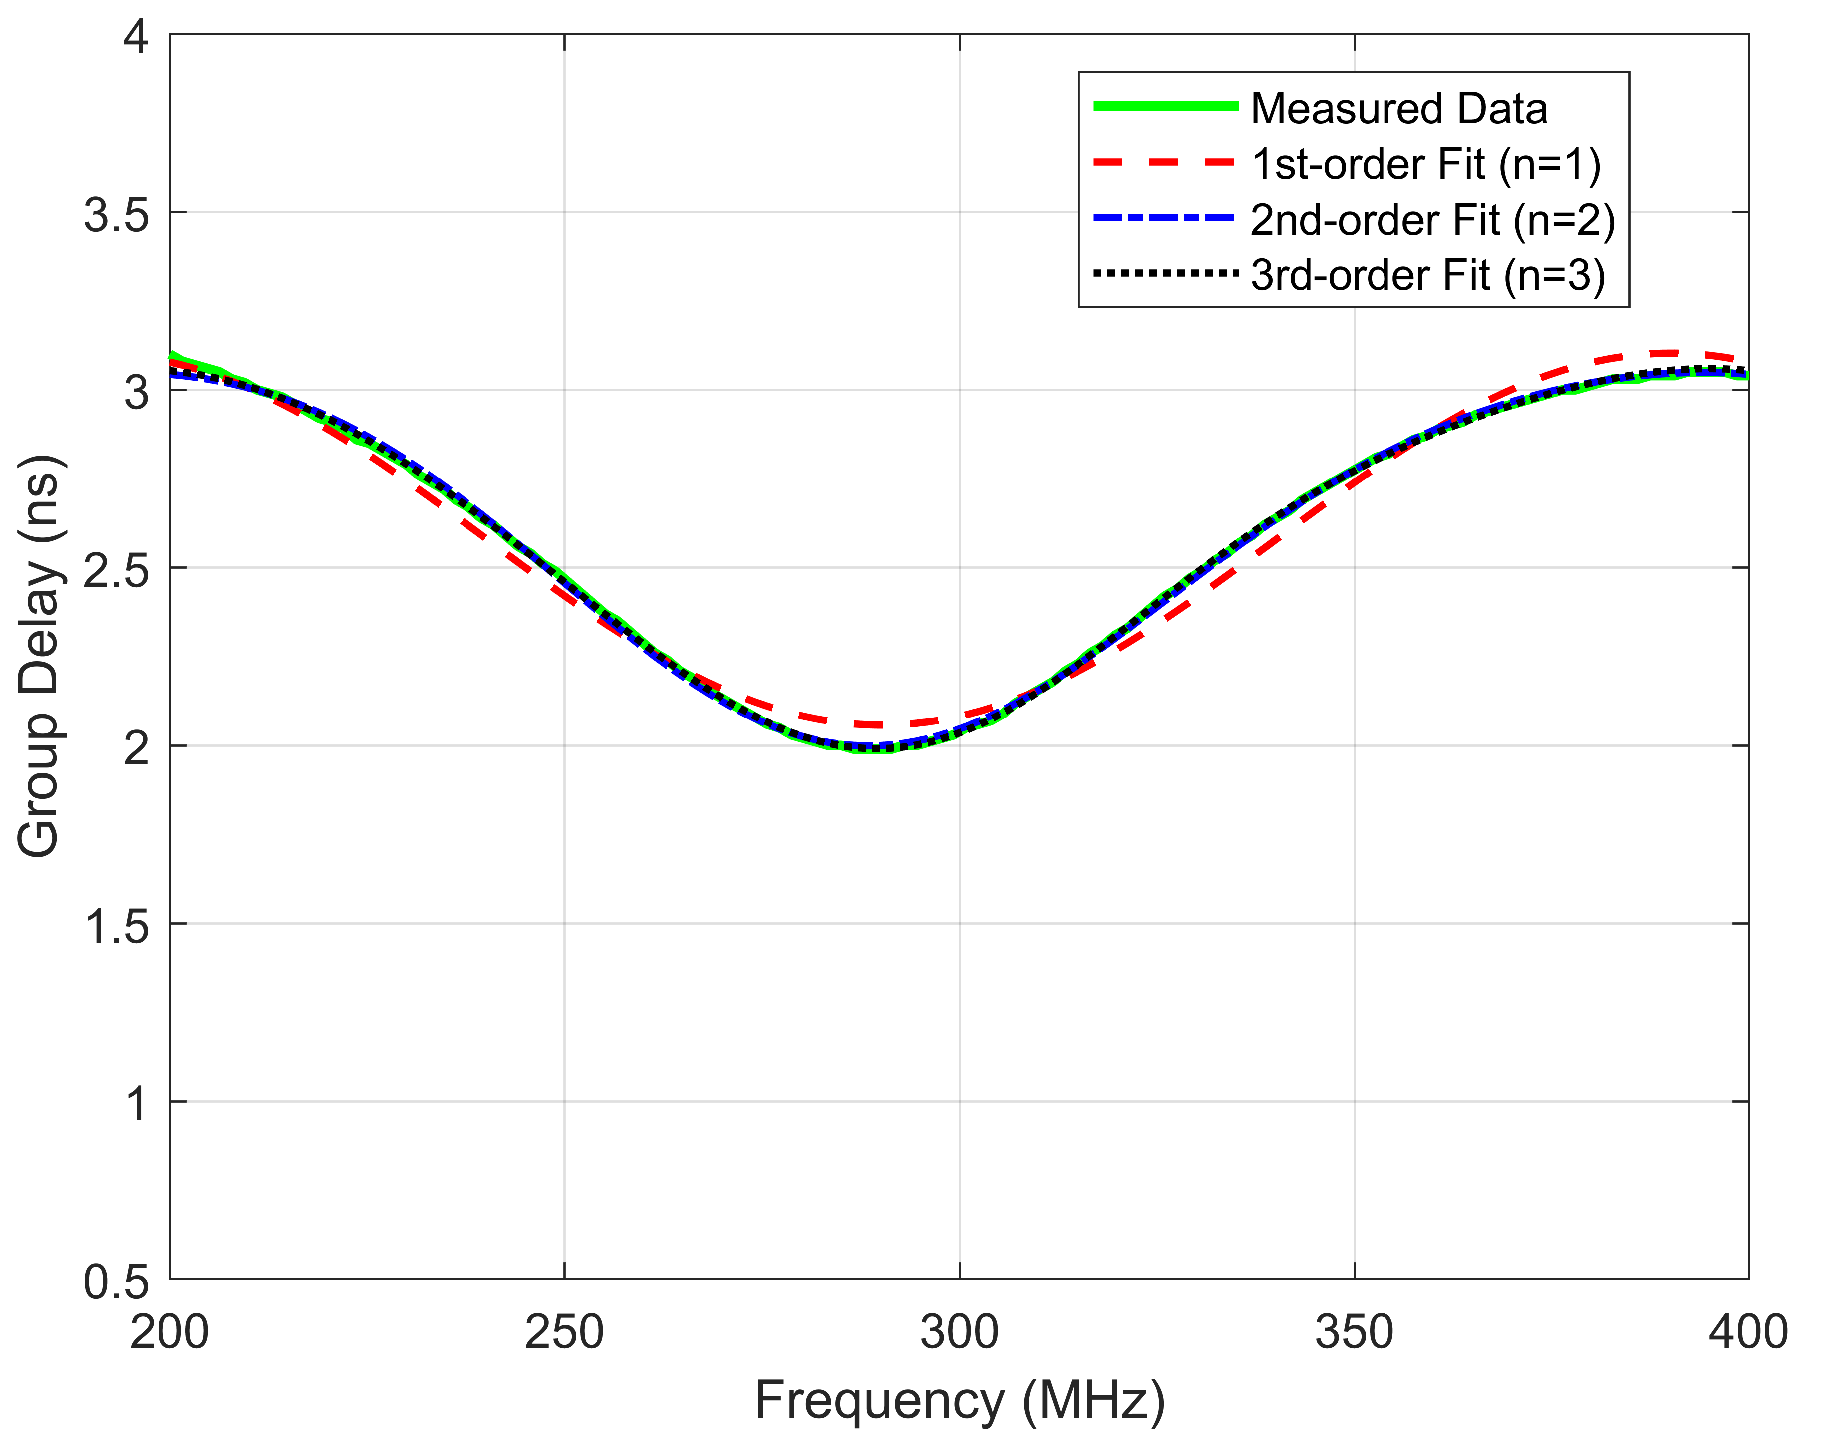
To validate the simplification of the nonlinear group delay model to a single dominant harmonic term, a multi-order harmonic fitting analysis was performed on the measured group delay of the BPF. As illustrated in Figure 2, the first-order harmonic () effectively captures the primary “bowl-shaped” dispersion characteristic, accounting for over 90% of the total fluctuation energy within the 200–400 MHz bandwidth. While higher-order harmonics () provide a more refined fit by capturing minor asymmetries and ripples, their contribution to the overall delay variation is marginal. The residual error of the single-harmonic model remains below 0.1 ns. Consequently, the first-order approximation is sufficient for characterizing the dominant dispersion behavior and evaluating the system-level ranging accuracy.
Figure 2.
Comparison between multi-order harmonic fitting and measured group delay of the BPF.
Table 1 summarizes the RMSE for different harmonic fitting orders. The RMSE for the first-order model () is only 0.0441 ns, which is significantly smaller than the peak-to-peak group delay fluctuation. Although increasing the order to further reduces the RMSE to 0.0082 ns, this marginal improvement does not justify the increased complexity for system-level analysis. Therefore, the single-harmonic model is both computationally efficient and sufficiently accurate for evaluating the phase-sensitive radar performance.
Table 1.
RMSE analysis of different harmonic fitting orders for the measured BPF group delay.
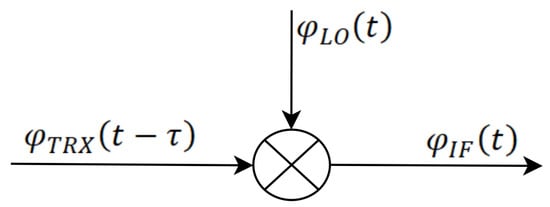
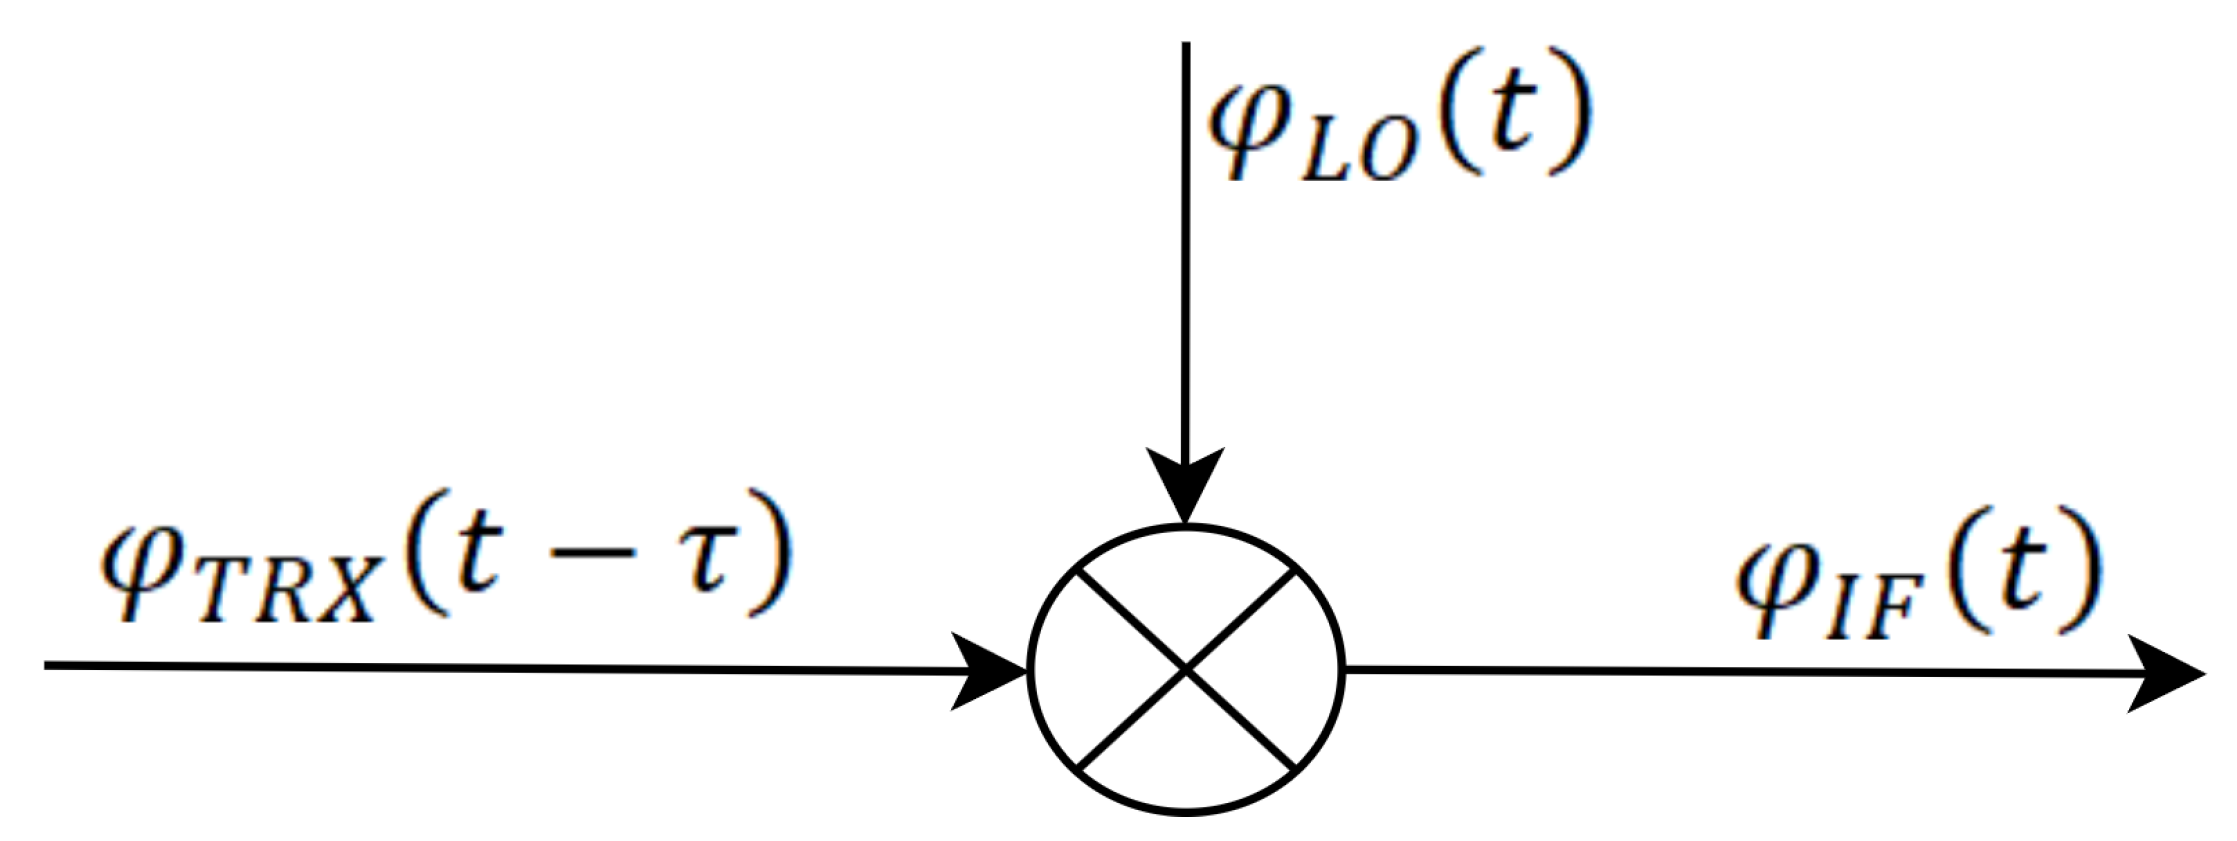
Under the quasi-static assumption, the chirp duration is typically much longer than the link group delay, so the IF phase can be approximated by subtracting the phase of the TX/RX path from that of the LO path [25], as illustrated in Figure 3. The phases of the LO and TX/RX paths are expressed as
Figure 3.
Block diagram of IF signal generation.
To avoid ambiguity, the subscripts LO and TRX refer to the local-oscillator path and the echo (TX/RX) path, respectively. Let be the IF signal phase expression in the ideal case; denote the difference in inherent group delay between the two paths, and denote the difference in fluctuation amplitude of the group delay between the two paths. Since is small, a certain approximation can be made: . The actual IF signal phase expression can be approximated as
Considering that the devices with large group delay values in the radar system are distributed in the TRX path, while the group delay in the local oscillator path is small (generally in the picosecond range); for analytical convenience, in Equation (8) is approximated as , and as during simulation.
In phase-sensitive radar, after obtaining a rough ranging result from the spectral peak, phase information at the peak is further used to extract a corrected distance . The combination of these two constitutes the millimeter-level high-precision measurement result. In an actual radar RF front-end, to ensure signal purity and suppress out-of-band interference, a bandpass filter is usually integrated into each of the transmitting and receiving links. Since the signal passes through the filter network twice during the detection process, the inherent group delay and its fluctuations will have an accumulation effect [26]. Typically, the inherent group delay mismatch in the link can be measured using closed-loop tests, and is introduced to eliminate the linear frequency offset it causes, keeping the IF frequency stable. Furthermore, violent group delay fluctuations cause the phase response to deviate from linearity. If the phase distortion accumulates within the sweep bandwidth beyond a certain range, for the case where the actual distance is located at the edge of a range cell and the SNR is low, the phase unwrapping process may fail, resulting in a phase offset and thereby a half-wavelength error [21]. Group delay mismatch also further leads to elevated range-wise sidelobes. In polar ice detection, weak echoes from deep layers are easily masked by the sidelobes of strong echoes. Compared with introducing calibration signals to mitigate the effects of group delay ripple, implementing hardware-level phase linearization a priori can suppress sidelobes in the range profile and improve the effective dynamic range as well as weak-echo detectability. It can also reduce the probability of half-wavelength errors, thereby enhancing the measurement robustness of phase-sensitive radar in dispersive environments.
2.2. Impact Analysis of Group Delay Mismatch on Ranging Accuracy
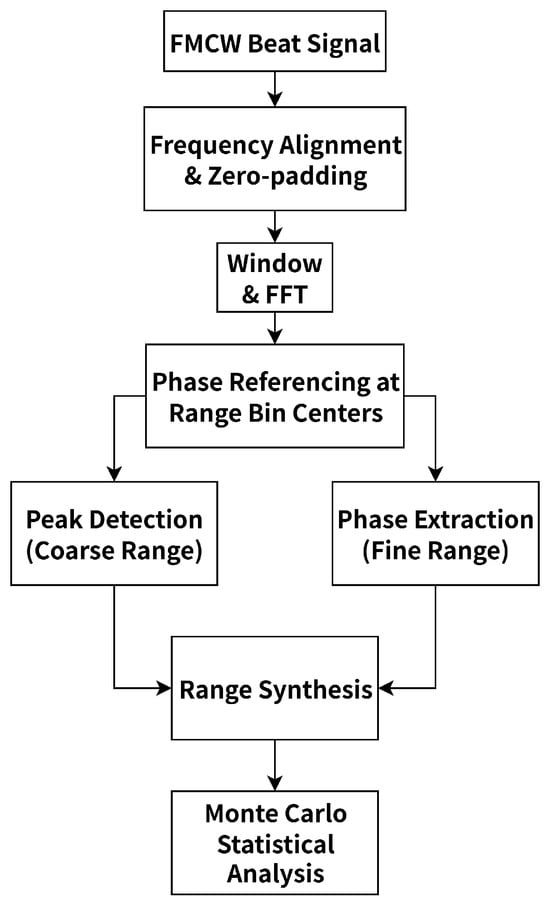
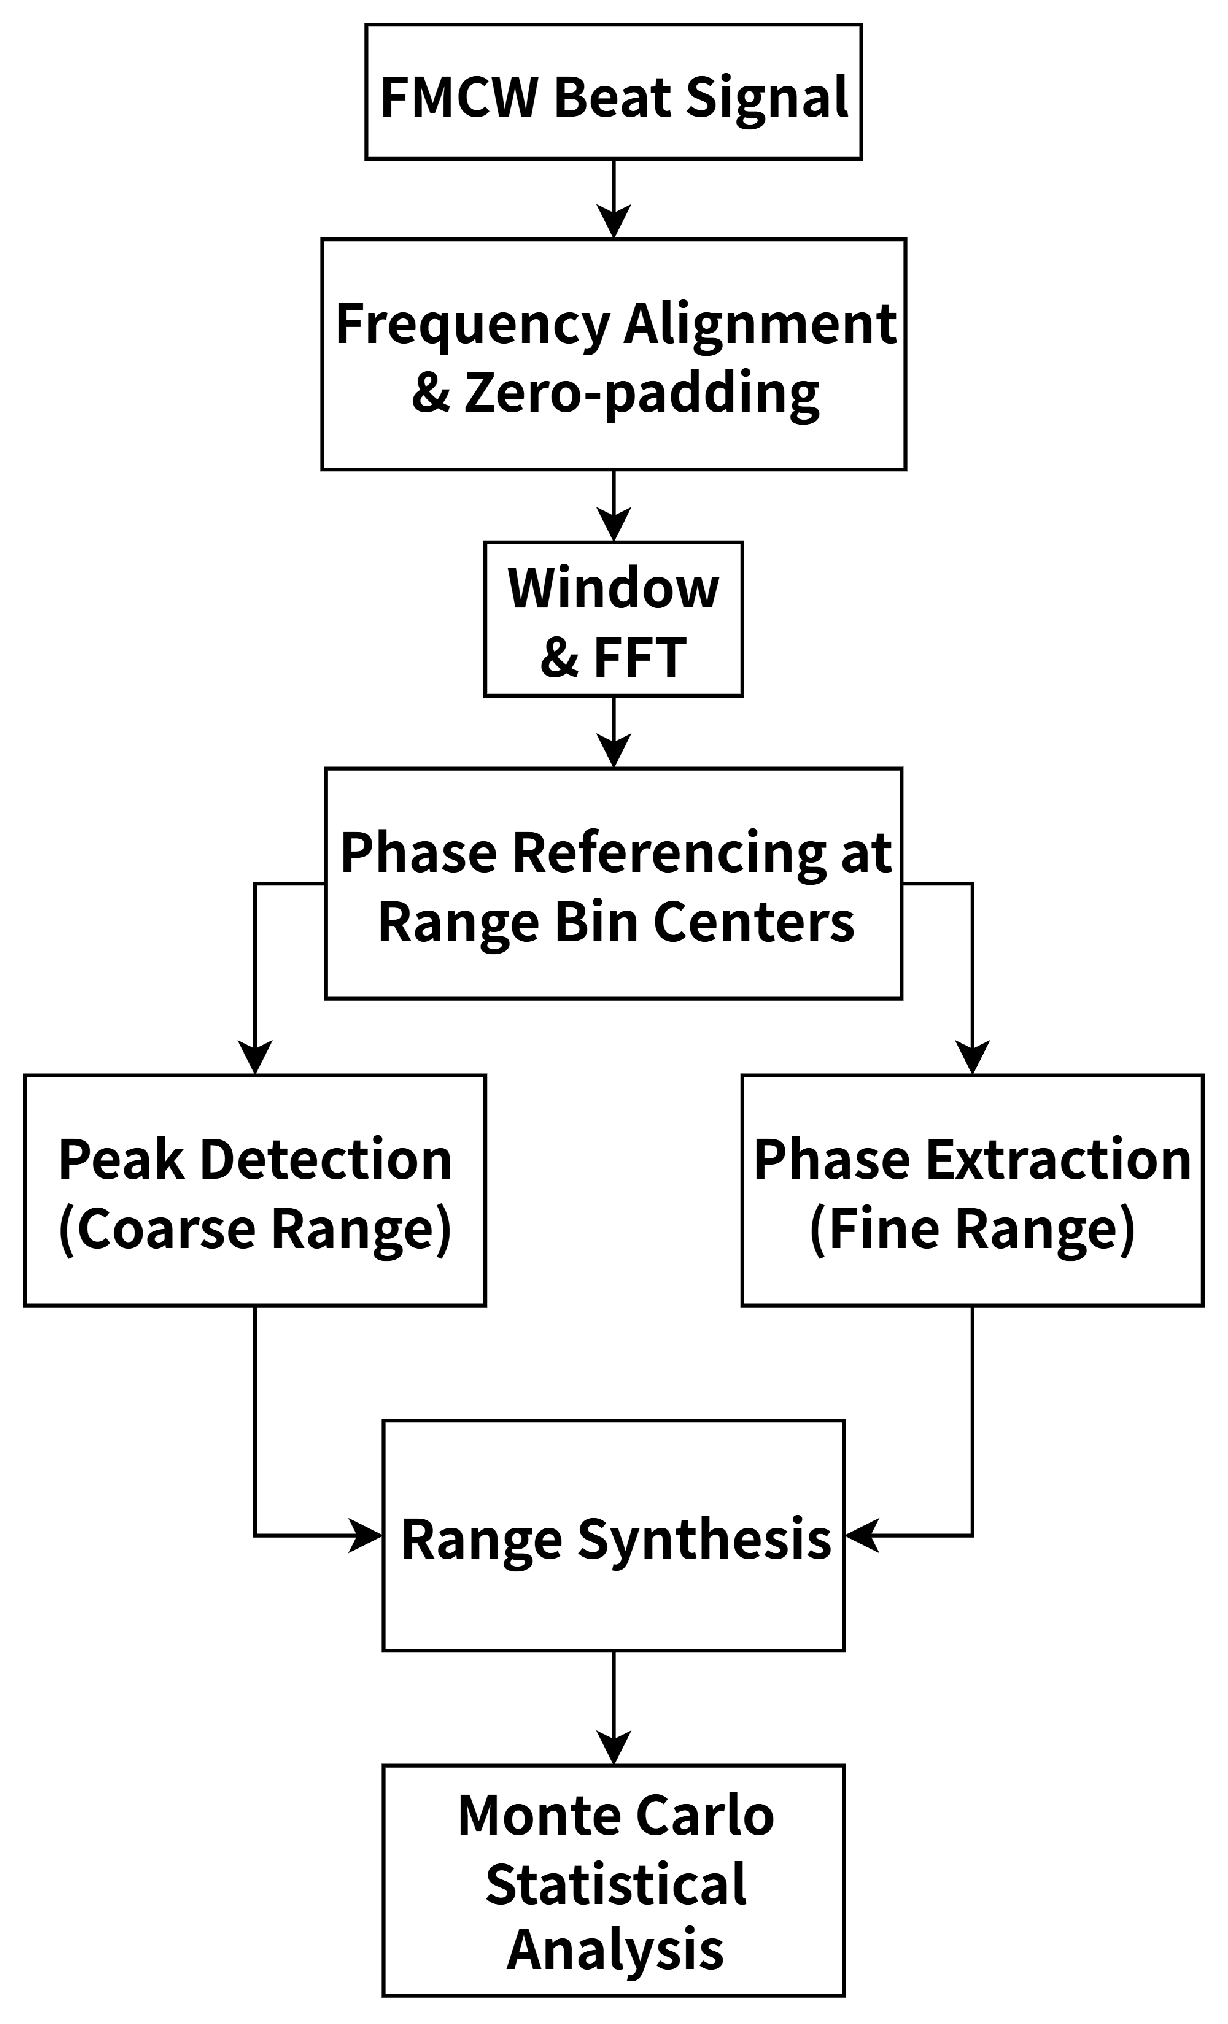
Referring to the standard processing procedure of phase-sensitive radar [27], this paper develops a signal processing and precision evaluation workflow, as shown in Figure 4. The workflow first applies frequency alignment and zero-padding to an IF signal containing group delay (GD) induced distortion, so that the energy at the spectral peak does not leak into adjacent ranging intervals, thereby improving the accuracy of the coarse ranging result. Subsequently, the extracted phase is referenced to the range-cell center via phase zeroing. Finally, a Monte Carlo simulation is carried out by randomly sampling target ranges within the detection region. The root mean square (RMS) error before and after optimization is then statistically compared to quantitatively characterize how hardware GD characteristics constrain radar detection performance.
Figure 4.
Simulation flow chart.
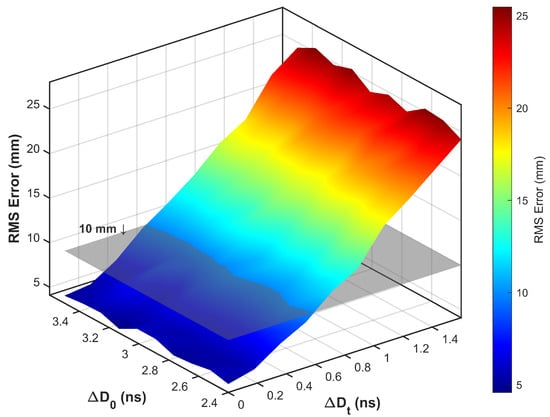
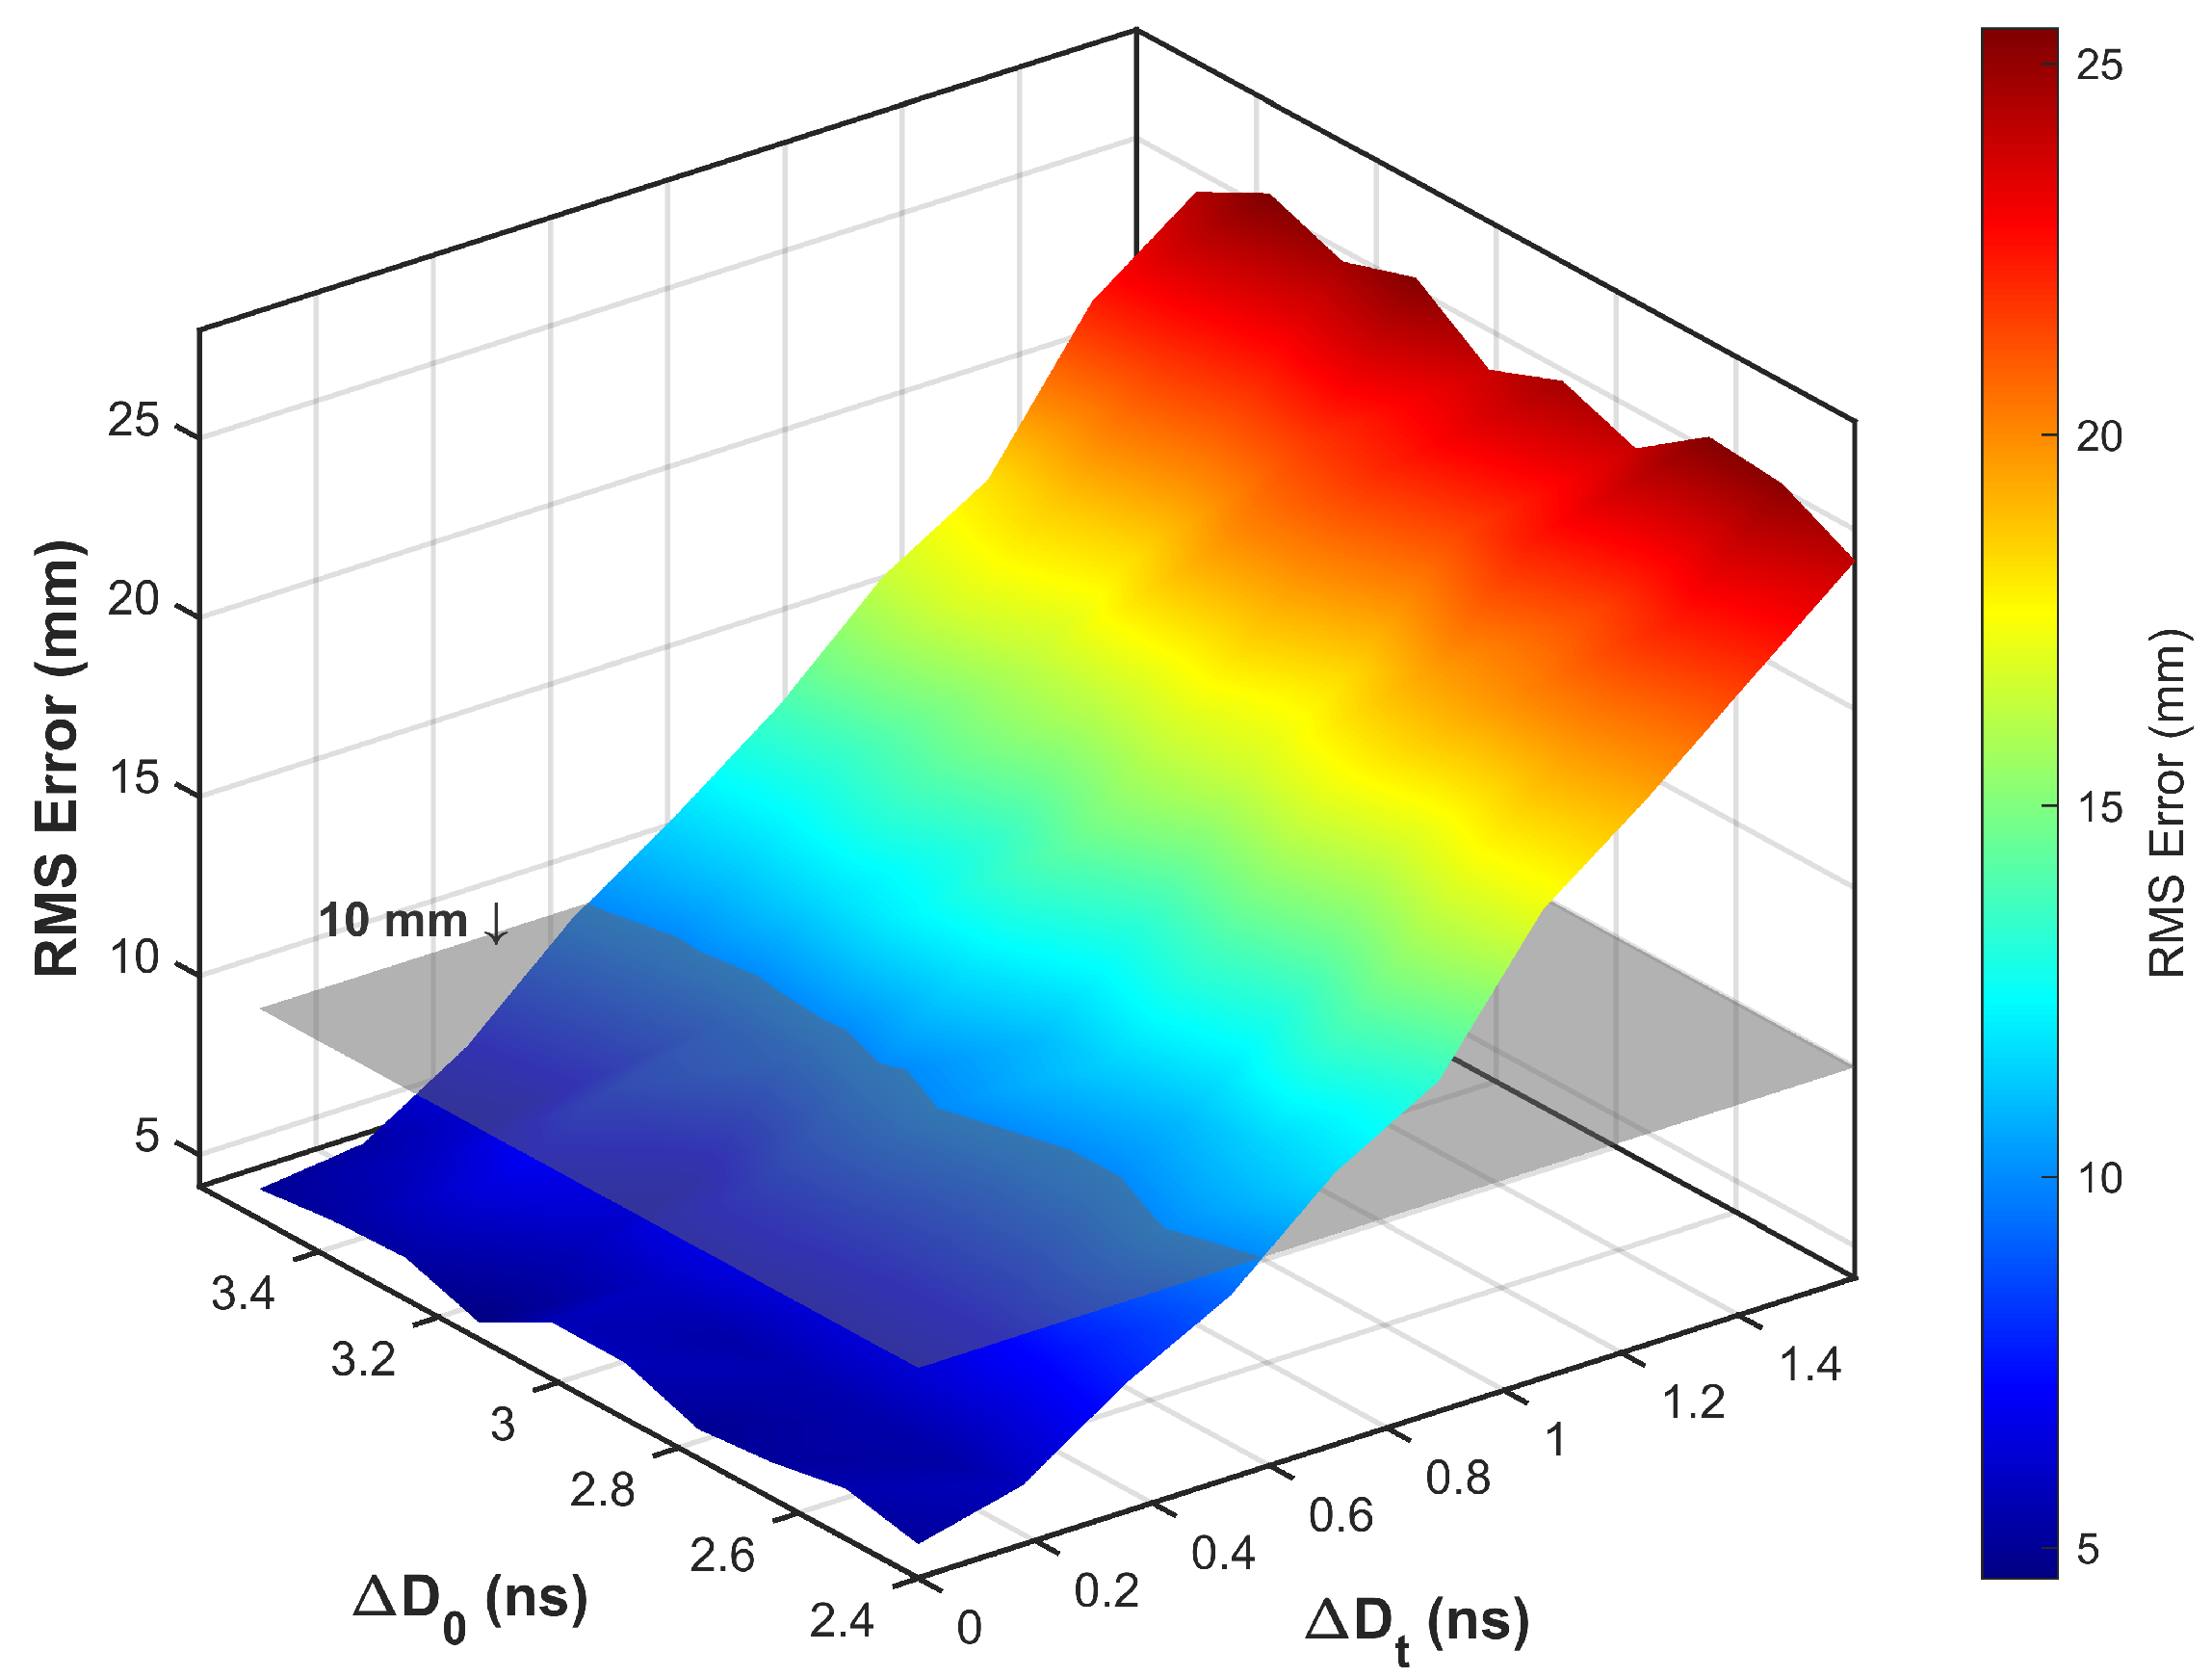
The simulation parameters are summarized in Table 2. A total of 1000 Monte Carlo simulations were conducted for targets located near a range of 500 m, and the results are presented in Figure 5. The results show that phase nonlinearity induced by the two pass accumulation of GD ripple introduces errors in phase-based high-precision range correction. When the signal to noise ratio (SNR) is 16 dB, millimeter-level accuracy is defined as an RMS error below 10 mm. Under this criterion, the maximum deviation from the nominal group delay of a single bandpass filter (BPF) in the link should not exceed 0.6 ns. The validity of using a single-harmonic model for this derivation is further justified by the fact that its fitting residual (RMSE ≈ 0.04 ns) is significantly lower than the 0.6 ns tolerance limit, ensuring that the simplified model captures the dominant error sources accurately.
Table 2.
Basic parameters used in the simulation.
Figure 5.
Impact of single bandpass filter group delay distribution on ranging error at SNR of 16 dB.
3. Design and Analysis of the Proposed Negative Group Delay Circuit
3.1. Circuit Topology and Analytical Model
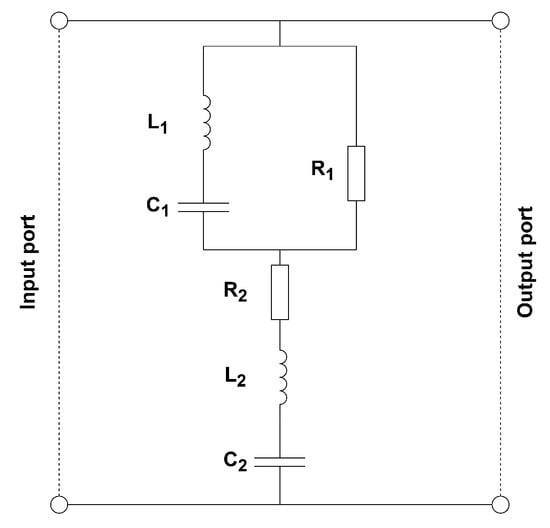
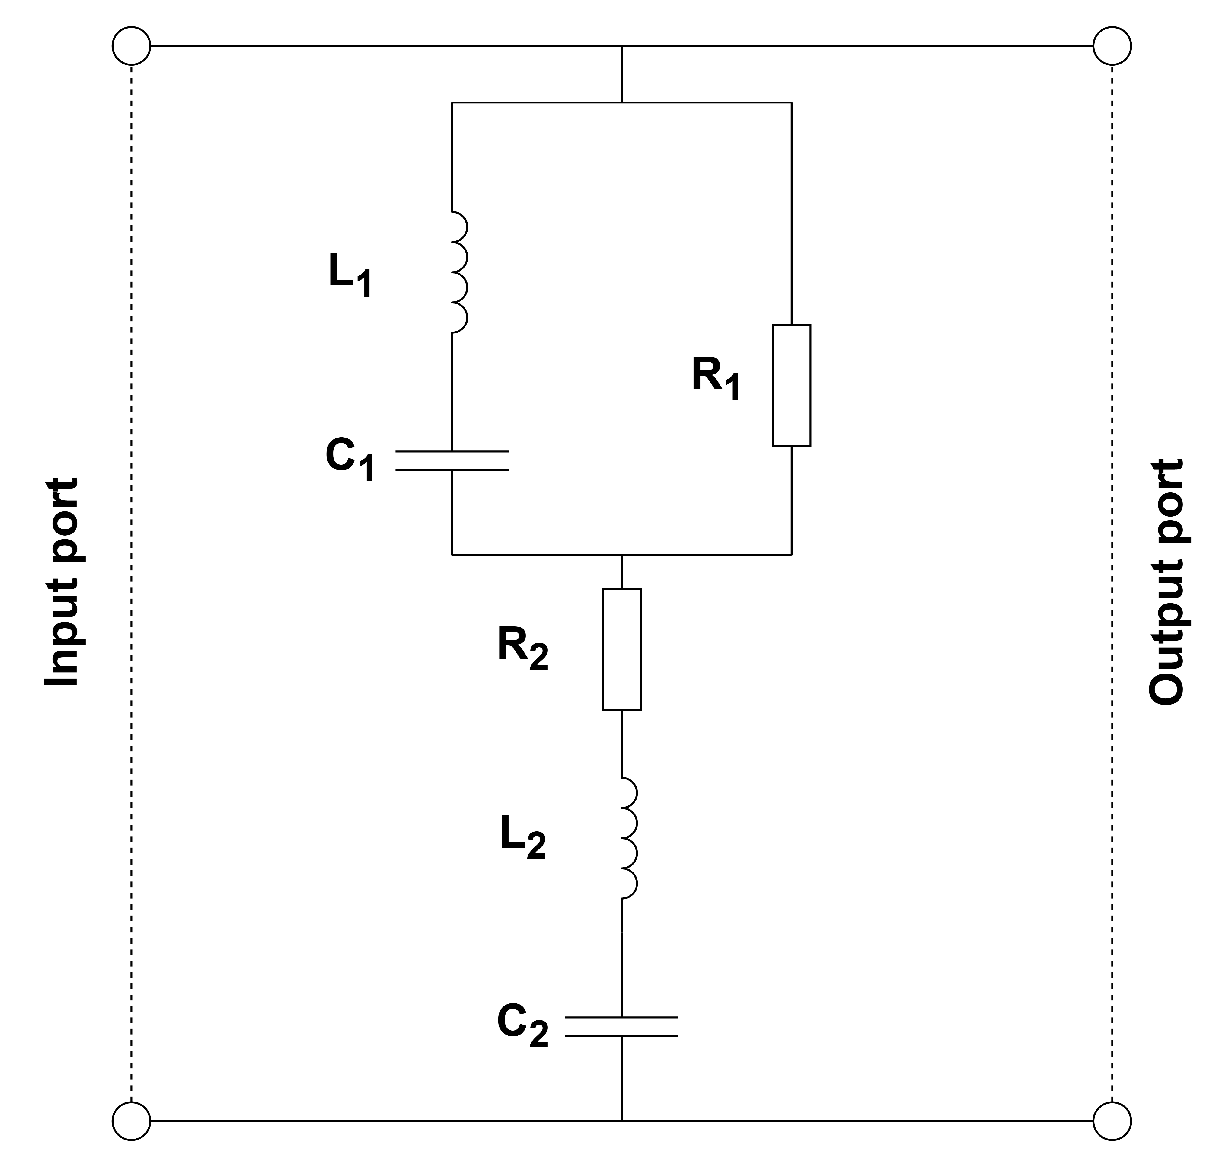
To satisfy the stringent GD constraints derived above, conventional group delay equalization techniques can improve the linearity of the system amplitude–phase characteristics. However, their “increment-for-flatness” mechanism typically relies on introducing additional delay elements, which inevitably increases the effective signal propagation path length, and hence the overall GD, while offering limited tuning flexibility [28,29]. Moreover, when severe nonlinear GD variations occur near the passband edges, passive equalization often encounters an inherent trade-off between insufficient compensation depth and excessive insertion loss (IL). Accordingly, this paper introduces a novel bandpass negative group delay compensation structure based on a dual-resonant network to compensate for the GD peaks of conventional filters. The basic unit structure is shown in Figure 6.
Figure 6.
Unit of bandpass negative group delay structure.
This structure is connected between the network input and output ports. Its core is a bandpass NGD unit connected in parallel to a 50 transmission line. Its upper part consists of an inductor and a capacitor connected in series and then in parallel with a resistor ; its lower part consists of a resistor , an inductor , and a capacitor connected in series. The two sub-circuits of this topology collaboratively induce anomalous dispersion, thereby generating the required NGD response. The multi-parameter design architecture provides sufficient degrees of freedom for design, not only enabling the precise synthesis and calibration of group delay indicators, but also facilitating the simultaneous optimization of impedance matching performance in the target frequency band.
Let the impedance of the upper part be and the impedance of the lower part be . The formula for calculating the impedance of the upper part is
Simplifying gives
The impedance of the lower part is
Let (), the total impedance is simplified as
where denotes the angular frequency and j denotes the imaginary unit.
Since the proposed unit constitutes a two-port network, its forward transmission coefficient can be conveniently derived using the standard transformation between the ABCD (transmission) matrix and the S-parameter matrix. The S-parameter matrix of a two-port network is given by
The expression for the forward transmission coefficient is
where A, B, C, and D denote the four elements of the ABCD (transmission) matrix. Since the proposed circuit is a shunt-admittance element, the corresponding ABCD matrix is written as
Then the transmission function of the single-band bandpass NGD unit is
The above formula is the S21 calculation formula for the single-band bandpass NGD circuit. According to the phase difference between the numerator and denominator, the expression for phase can be calculated:
GD is defined as the negative derivative of the phase with respect to angular frequency. The maximum negative group delay (NGD) typically occurs at the resonant angular frequency , where the input reactance vanishes (). Further derivation and simplification yield
where is the derivative of the imaginary part with respect to the angular frequency.
In actual design, to optimize impedance matching and flatten the NGD response, a high-value resistor (e.g., 1000 ∼ 3000 ) is usually selected. Considering that near the resonant angular frequency, to simplify subsequent analysis, the impedance term in Equation (12) can be converted to
At this stage, the derivative of the input reactance, , reduces to the linear superposition of the reactance slopes contributed by the two subcircuits:
This yields simplified closed-form expressions, in terms of the full set of circuit parameters, for the forward transmission coefficient at and for the corresponding peak NGD:
In the special case where the upper and lower branches resonate synchronously (), Equations (23) and (24) can be further simplified to
From the derived results, it can be seen that when is large, the insertion loss at the resonant frequency in the current circuit structure is mainly related to and , and is always greater than 0, so the group delay is always negative. According to Equations (23) and (24), is linearly related to , while is inversely related to the square of . This means that the negative group delay depth is more sensitive to changes in , enabling the circuit structure to generate a larger NGD depth at smaller insertion losses.
According to electromagnetic field theory, violent changes in phase characteristics are accompanied by energy absorption [30]. Therefore, the generation of NGD is often at the cost of significant insertion loss. The core logic of the design in this paper lies in the fact that, through the collaborative induction of parallel and series branches, decoupled control of group delay depth and insertion loss is achieved, thereby enabling energy absorption to be controlled within a range acceptable to the system. At the same time, the superposition effect of dual resonance points is utilized to linearize the phase response curve, thus physically solving the phase distortion caused by group delay fluctuations. A comparative analysis of this design with other NGD structures will be presented in Section 5.
To quantitatively evaluate the impedance matching performance, the reflection coefficient of the NGDC unit, is derived as
where is the total input impedance of the shunt branch. According to the approximations in Equations (20) and (21), the input impedance at the target frequency can be expressed as
By substituting the impedance expression into the formula, the complex form of the reflection coefficient is obtained:
The magnitude of the reflection coefficient is then given by
The derived formula quantitatively defines the mapping relationship between the reflection coefficient magnitude and the key design parameters. The first term in the denominator, , represents the fundamental contribution of resistive components to impedance matching, where the high-value resistor effectively buffers the impact of variations on the real part of the shunt impedance. The second term, , accounts for the reflection induced by reactive mismatch. Since the total denominator remains significantly larger than the numerator within the tuning range, is guaranteed to stay at a consistently low level while achieving the desired NGD depth, validating the impedance robustness of the proposed topology.
3.2. Physical Mechanism of Dual-Resonance NGD Network
To elucidate the underlying physical principles of the dual-resonant negative group delay (NGD) behavior, this section provides an analytical decomposition of the frequency-domain responses based on the isolated and integrated branches of the NGDC.
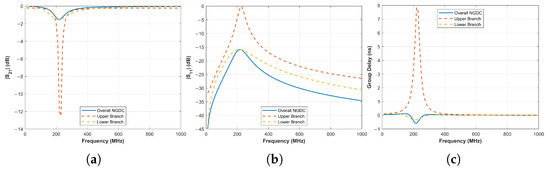
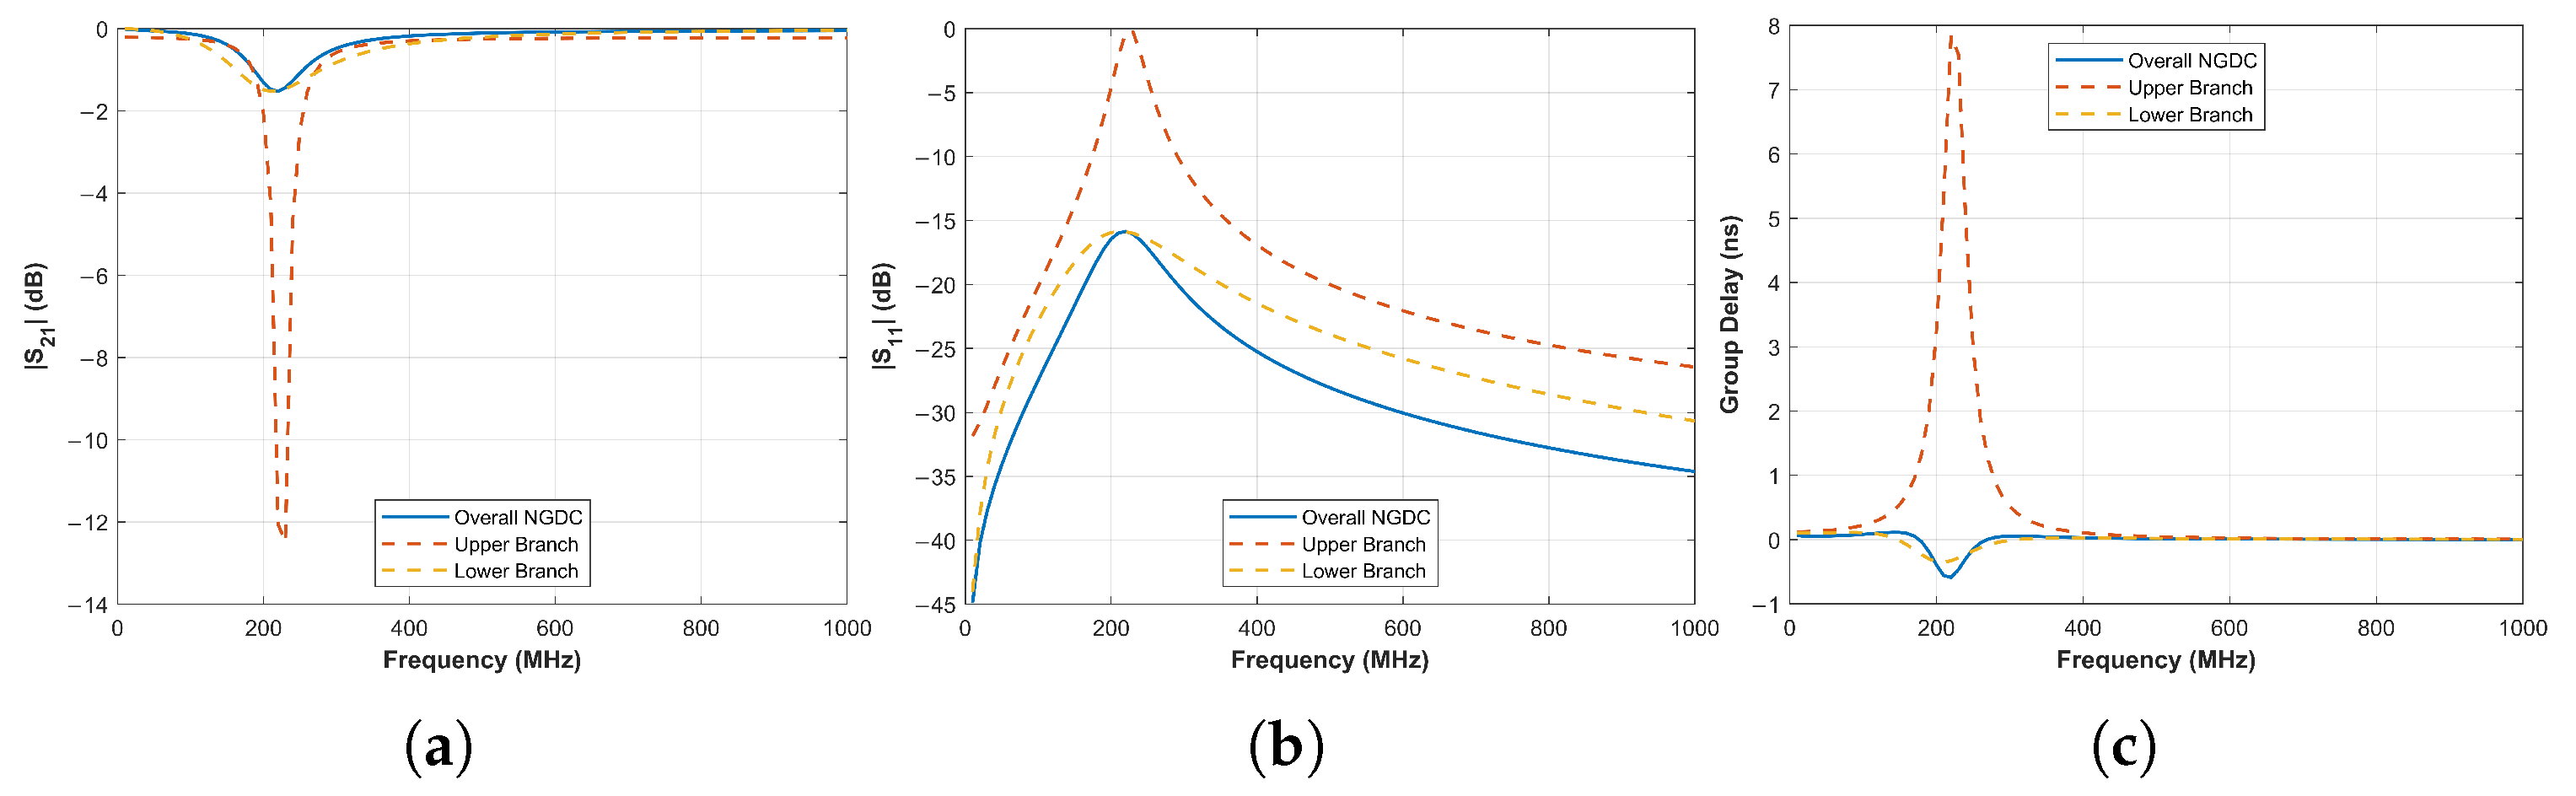
Synchronous Resonance Mode: Under the synchronous configuration (), the resonant frequencies of the upper and lower sub-circuits are precisely aligned. As illustrated in Figure 7, the isolated simulation of the upper branch (shunt-series LC structure) revealed a profound magnitude notch (Figure 7a) and a severe positive group delay (PGD) spike of approximately 8 ns (Figure 7c), characteristic of low-impedance absorptive networks. However, the integration of the lower branch facilitates reactive cancellation, which inverts the network characteristic from a low-impedance notch to a high-impedance resonance, causing the total input impedance to reach a local maximum. This impedance inversion results in a reversal of the phase derivative with respect to frequency, thereby “flipping” the 8 ns PGD peak into a deep NGD response. Furthermore, Figure 7b confirms that the integrated return loss is suppressed below −15 dB, despite the strong reflections of individual branches, validating the impedance self-correction capability.
Figure 7.
Synchronous Resonance Mode: (a) response; (b) response; (c) group delay response.
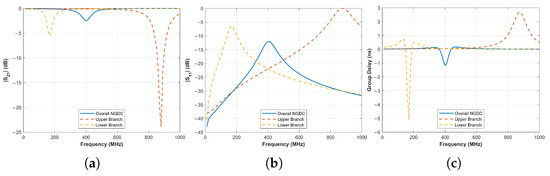
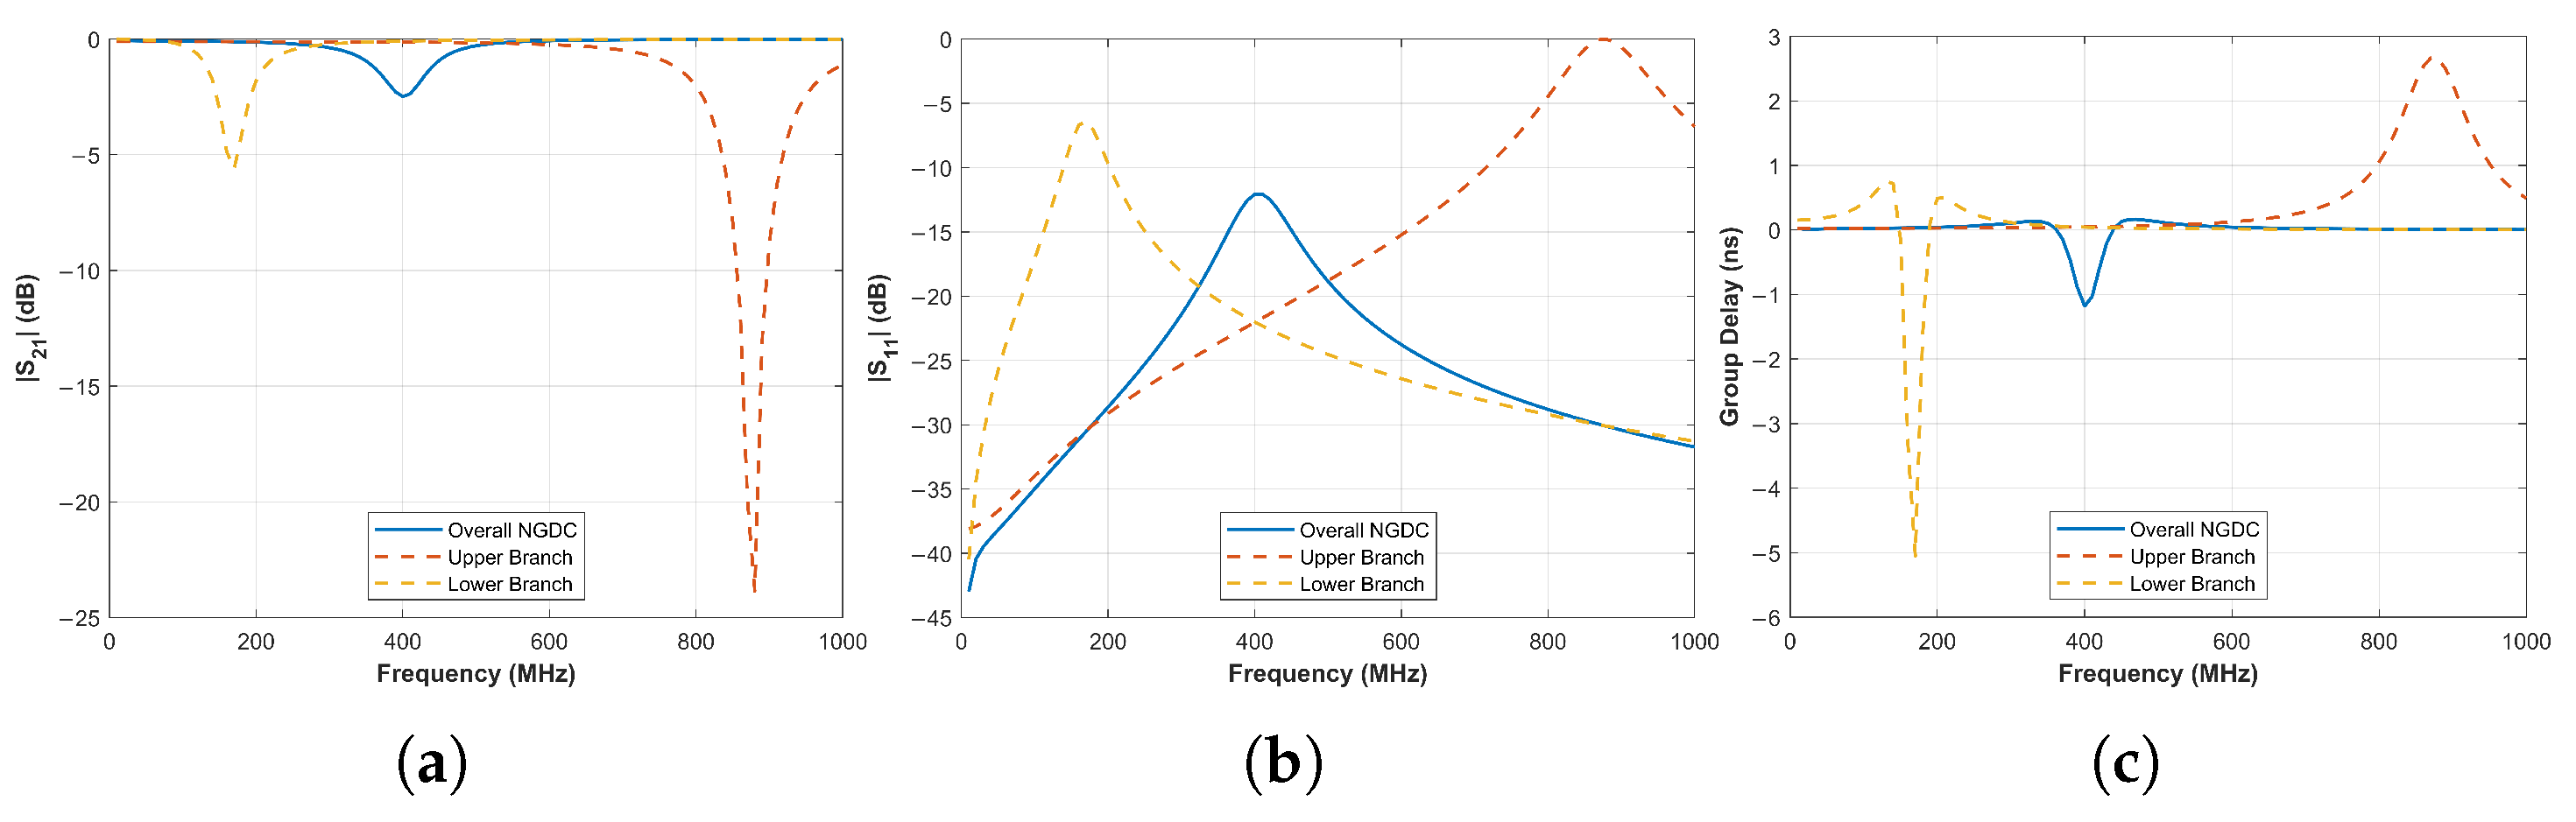
Asynchronous Resonance Mode: In the asynchronous configuration (Figure 8), the resonant poles of the sub-circuits are strategically staggered and positioned away from the target frequency of 400 MHz. As observed in Figure 8c, the resulting negative group delay (NGD) peak at 400 MHz is not a product of singular branch resonance; instead, it constitutes a synthetic response formed by the superposition of the reactive slopes from both branches in their off-resonance regions. This mechanism provides the flexibility to precisely tailor the NGD curvature by adjusting the detuning degree, which is essential for neutralizing the steep and complex group delay gradients typically found at the transition edges of the bandpass filter. Regarding the reflection characteristics, Figure 8b illustrates that despite the strong reflection peaks of the isolated branches near 170 MHz and 880 MHz, the overall return loss of the NGDC remains suppressed below −12 dB within the 400 MHz compensation band through collaborative multi-parameter optimization. Such an impedance self-balancing capability demonstrates the engineering robustness of the multi-parameter topology in handling broadband nonlinear distortions, ensuring high-precision phase linearization while preserving signal integrity.
Figure 8.
Asynchronous Resonance Mode: (a) response; (b) response; (c) group delay response.
3.3. Parameter Sensitivity Analysis
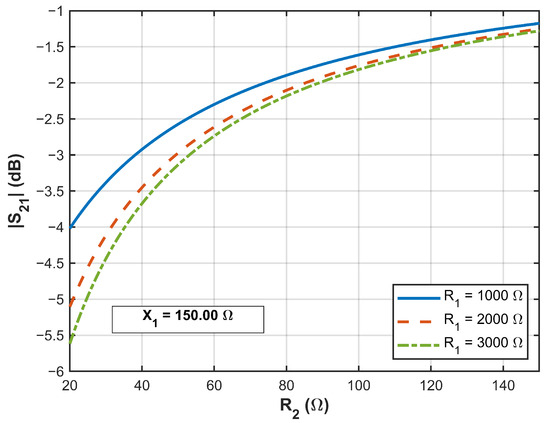
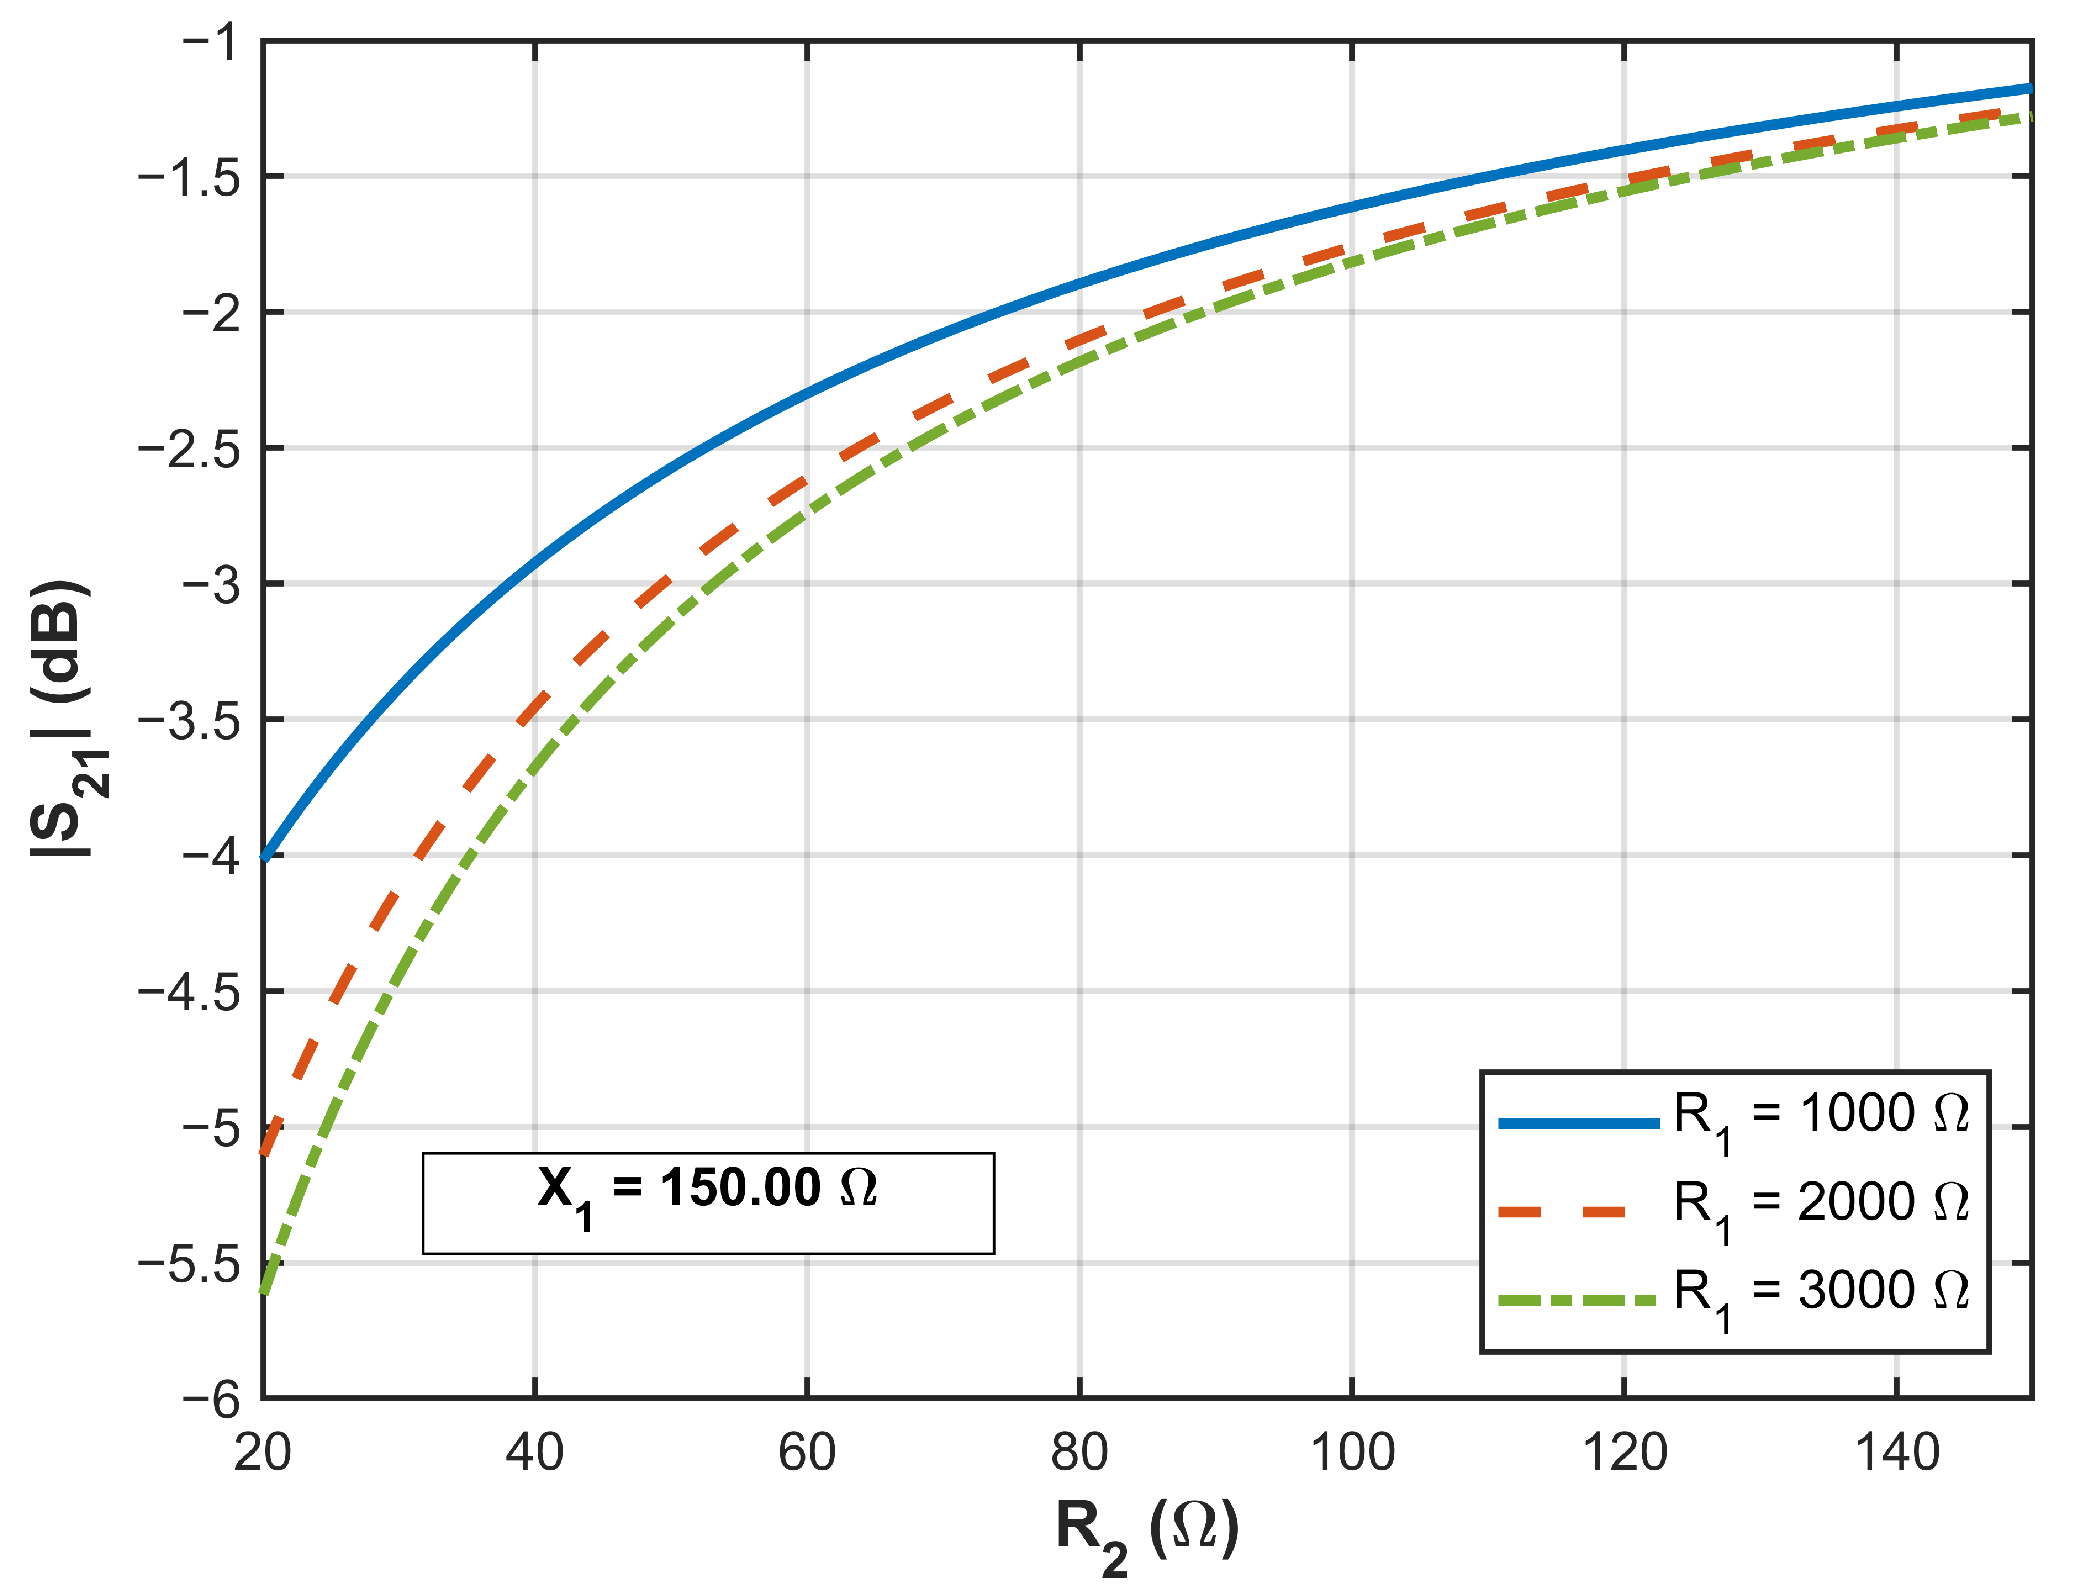
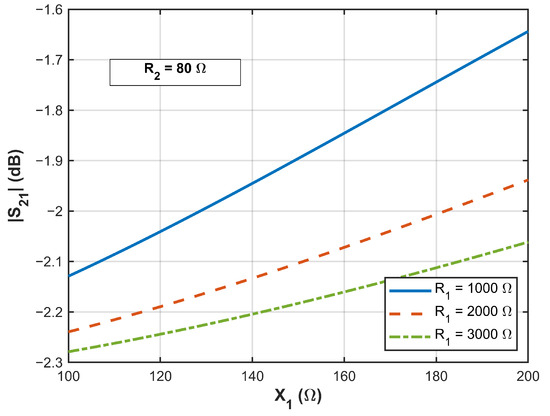
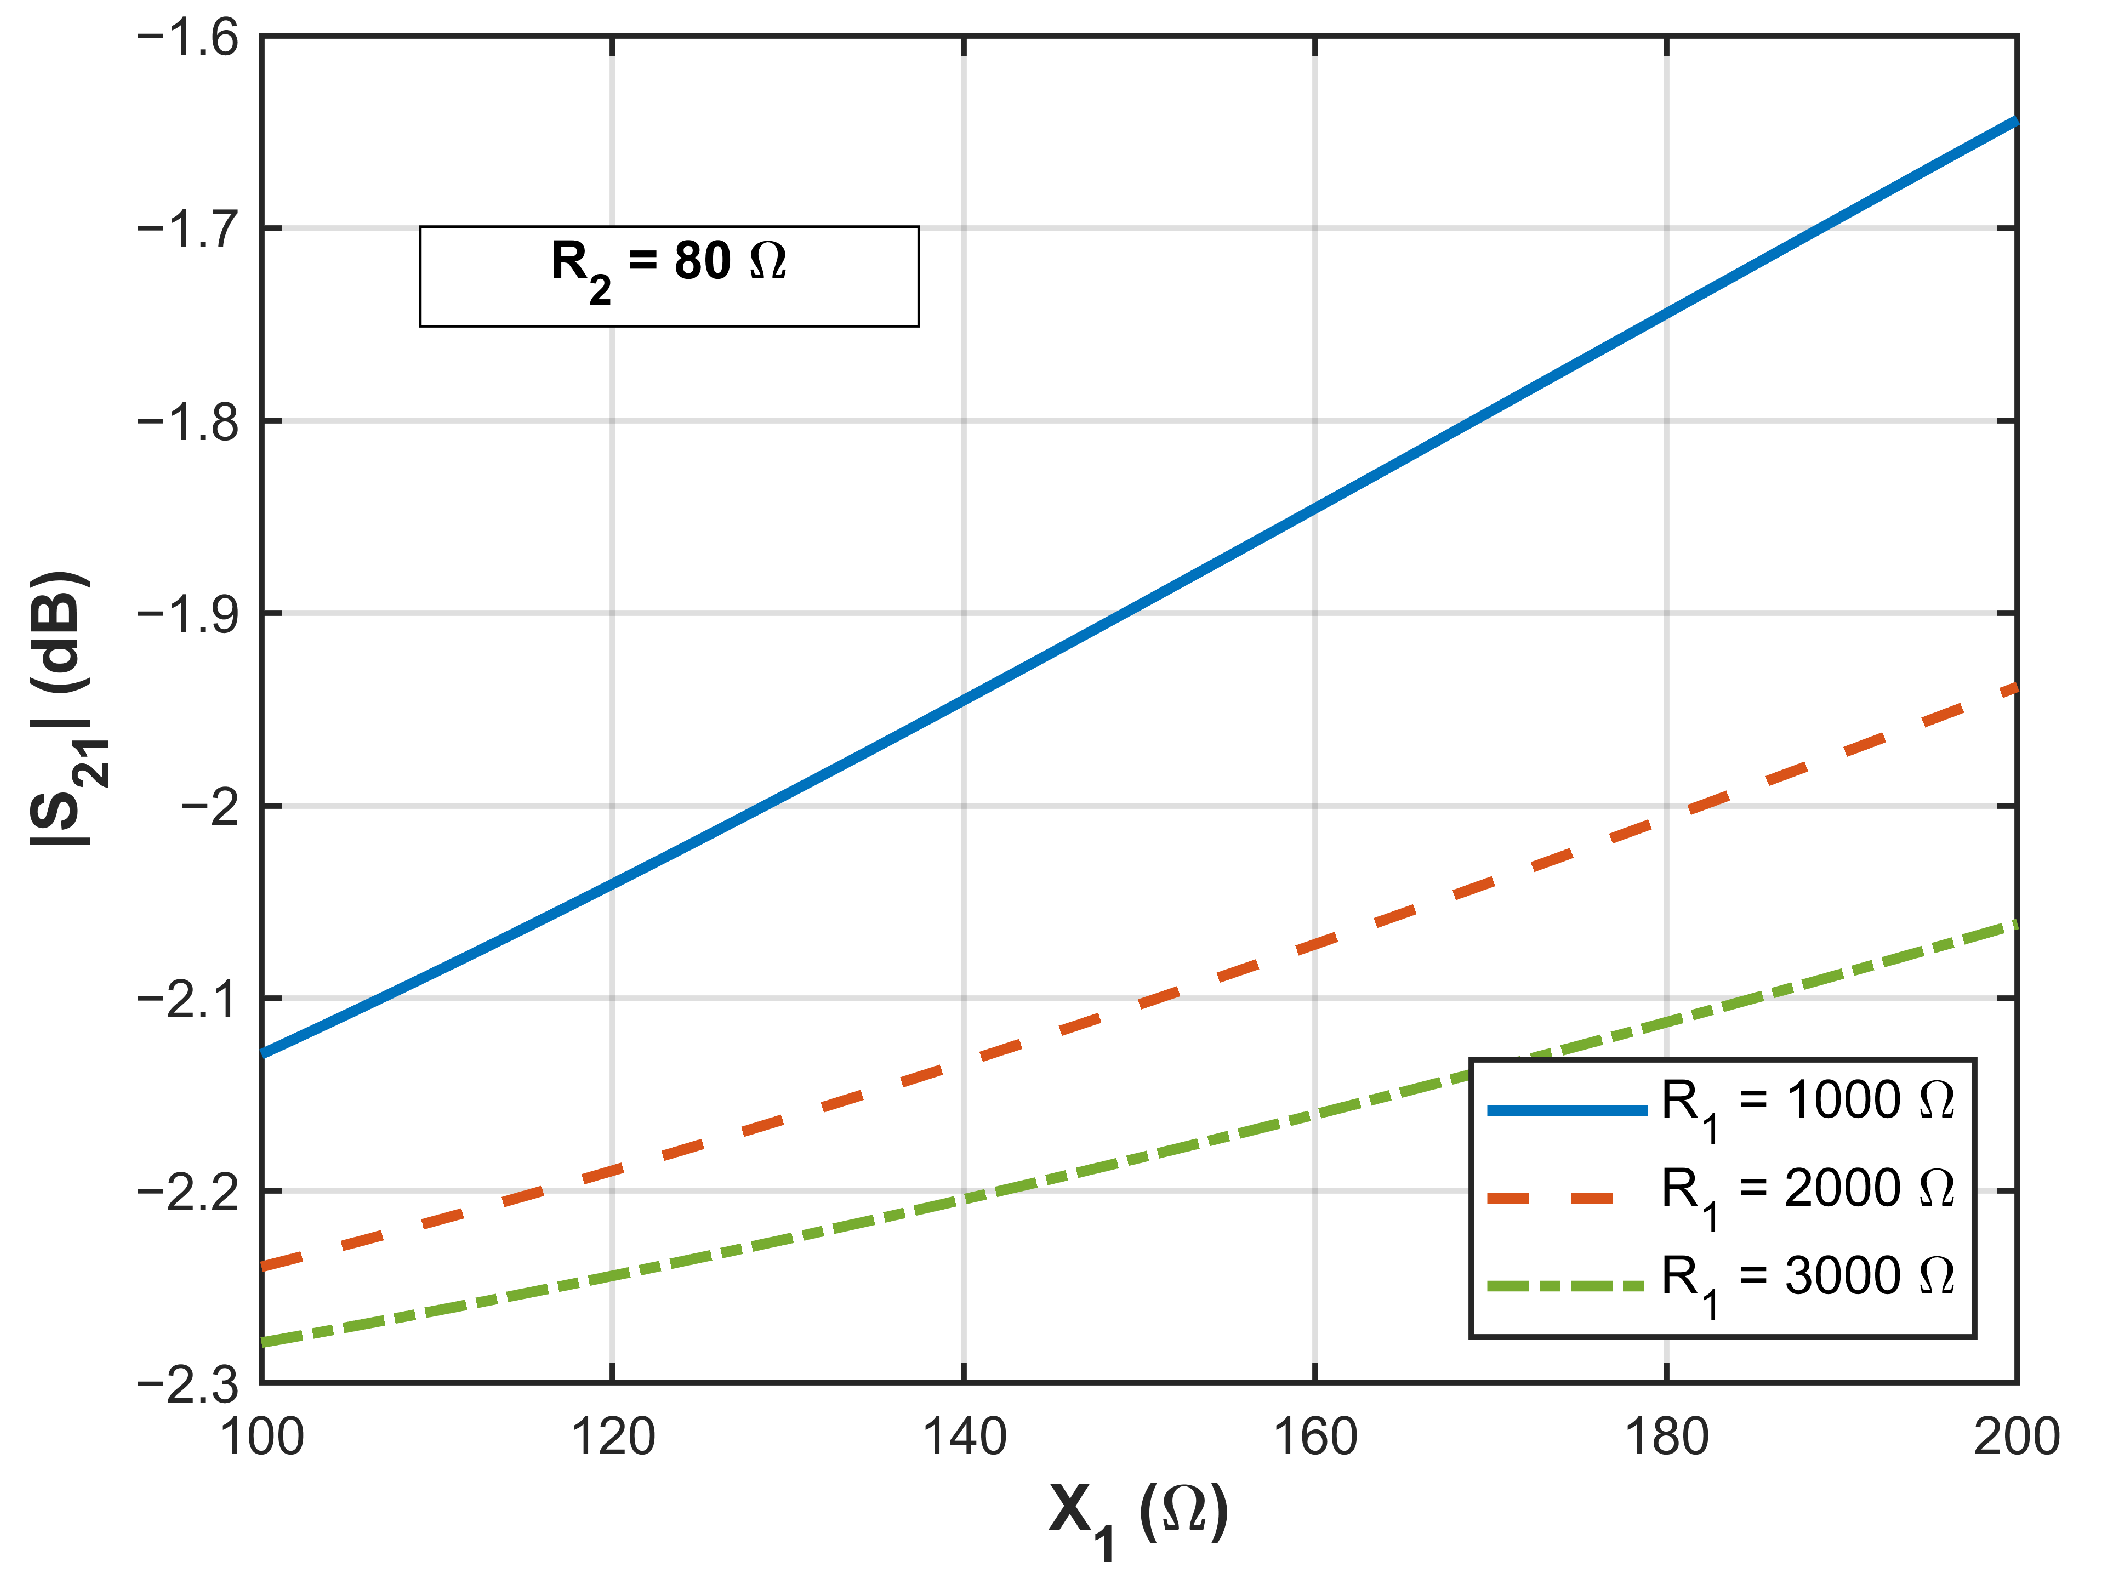
To elucidate the physical mechanism of the proposed NGDC and to guide practical design, we conducted a detailed sensitivity analysis of the key circuit parameters based on the derived analytical expressions. According to Equation (23), the insertion loss (IL) at the center frequency is mainly governed by the equivalent branch resistance . As shown in Figure 9, increasing the series resistance raises the equivalent branch resistance, causing the transmission magnitude response (in dB) to shift upward and gradually approach dB. This observation indicates that is the dominant parameter controlling signal attenuation. Figure 10 illustrates the influence of the detuned reactance on the amplitude under asynchronous resonance (, with and ). As increases, the additional loss term introduced by the parallel branch becomes larger, leading to a reduced (i.e., a higher IL). Meanwhile, the high-value resistor effectively mitigates the pronounced impact of variations on the amplitude, highlighting the flexibility of the multi-parameter design for impedance-matching optimization.
Figure 9.
Effect of on at the resonant frequency .
Figure 10.
Effect of on at the resonant frequency .
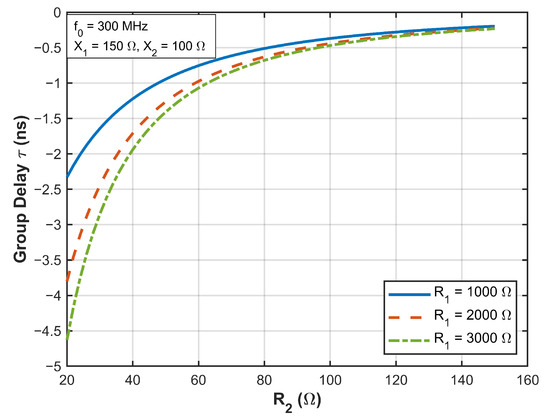
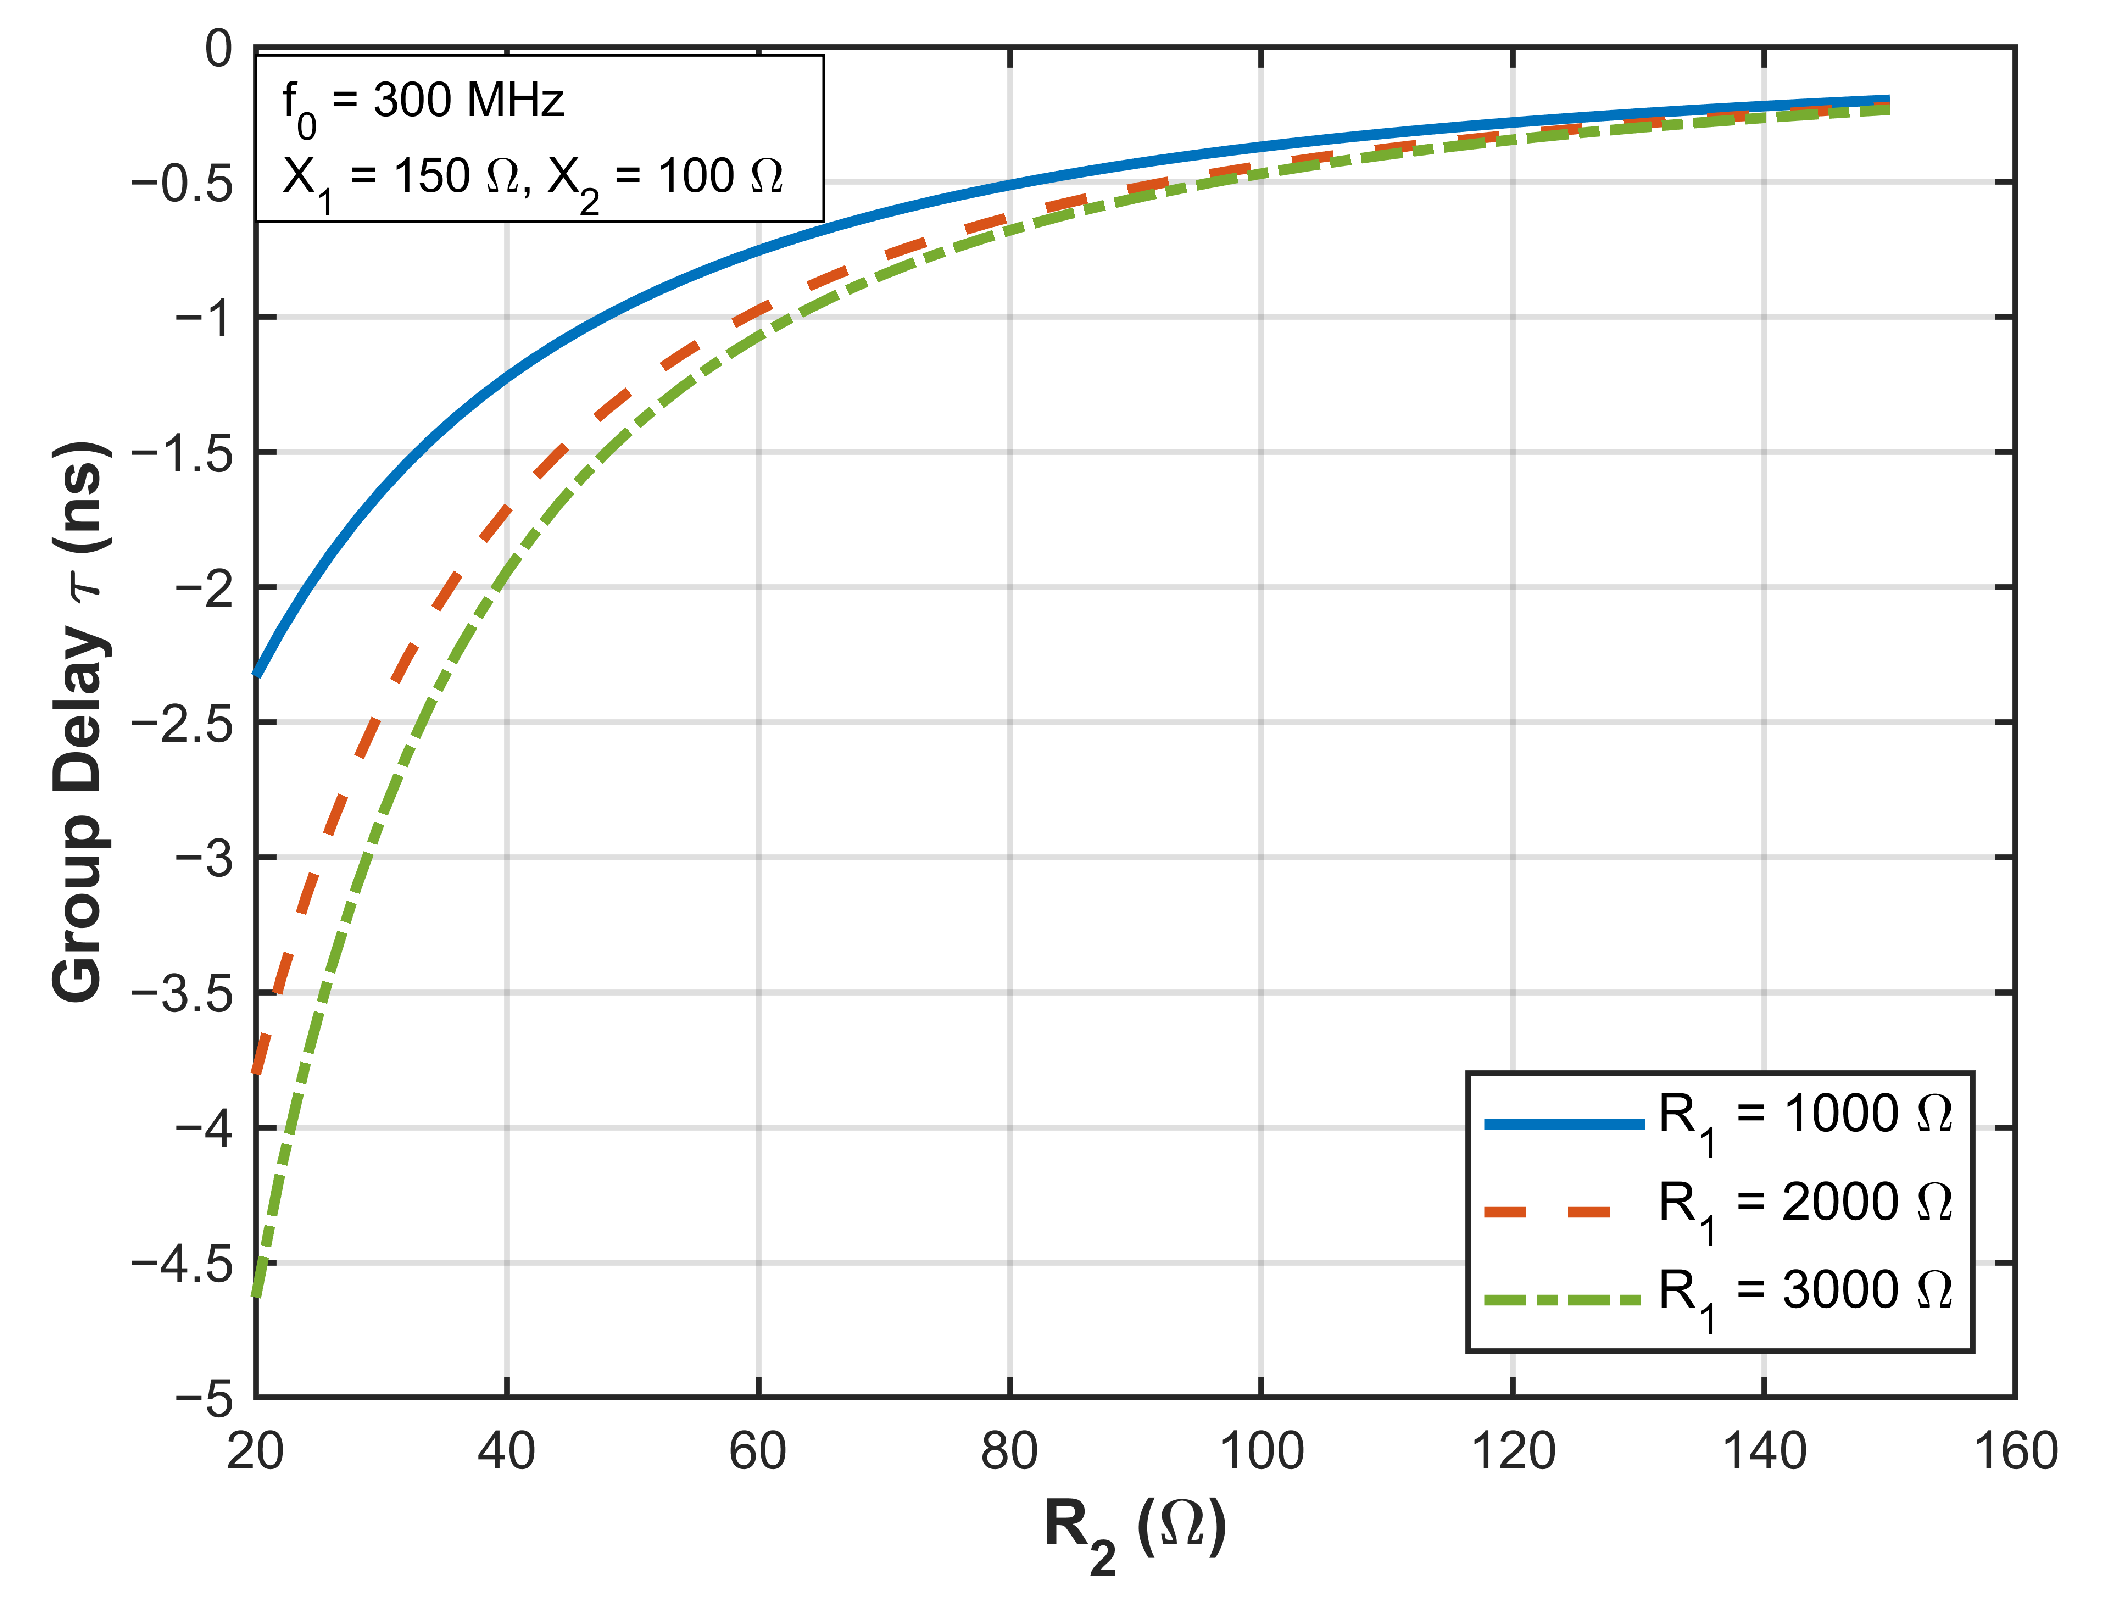
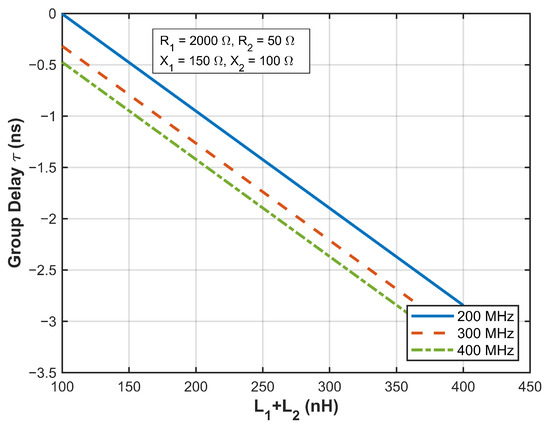
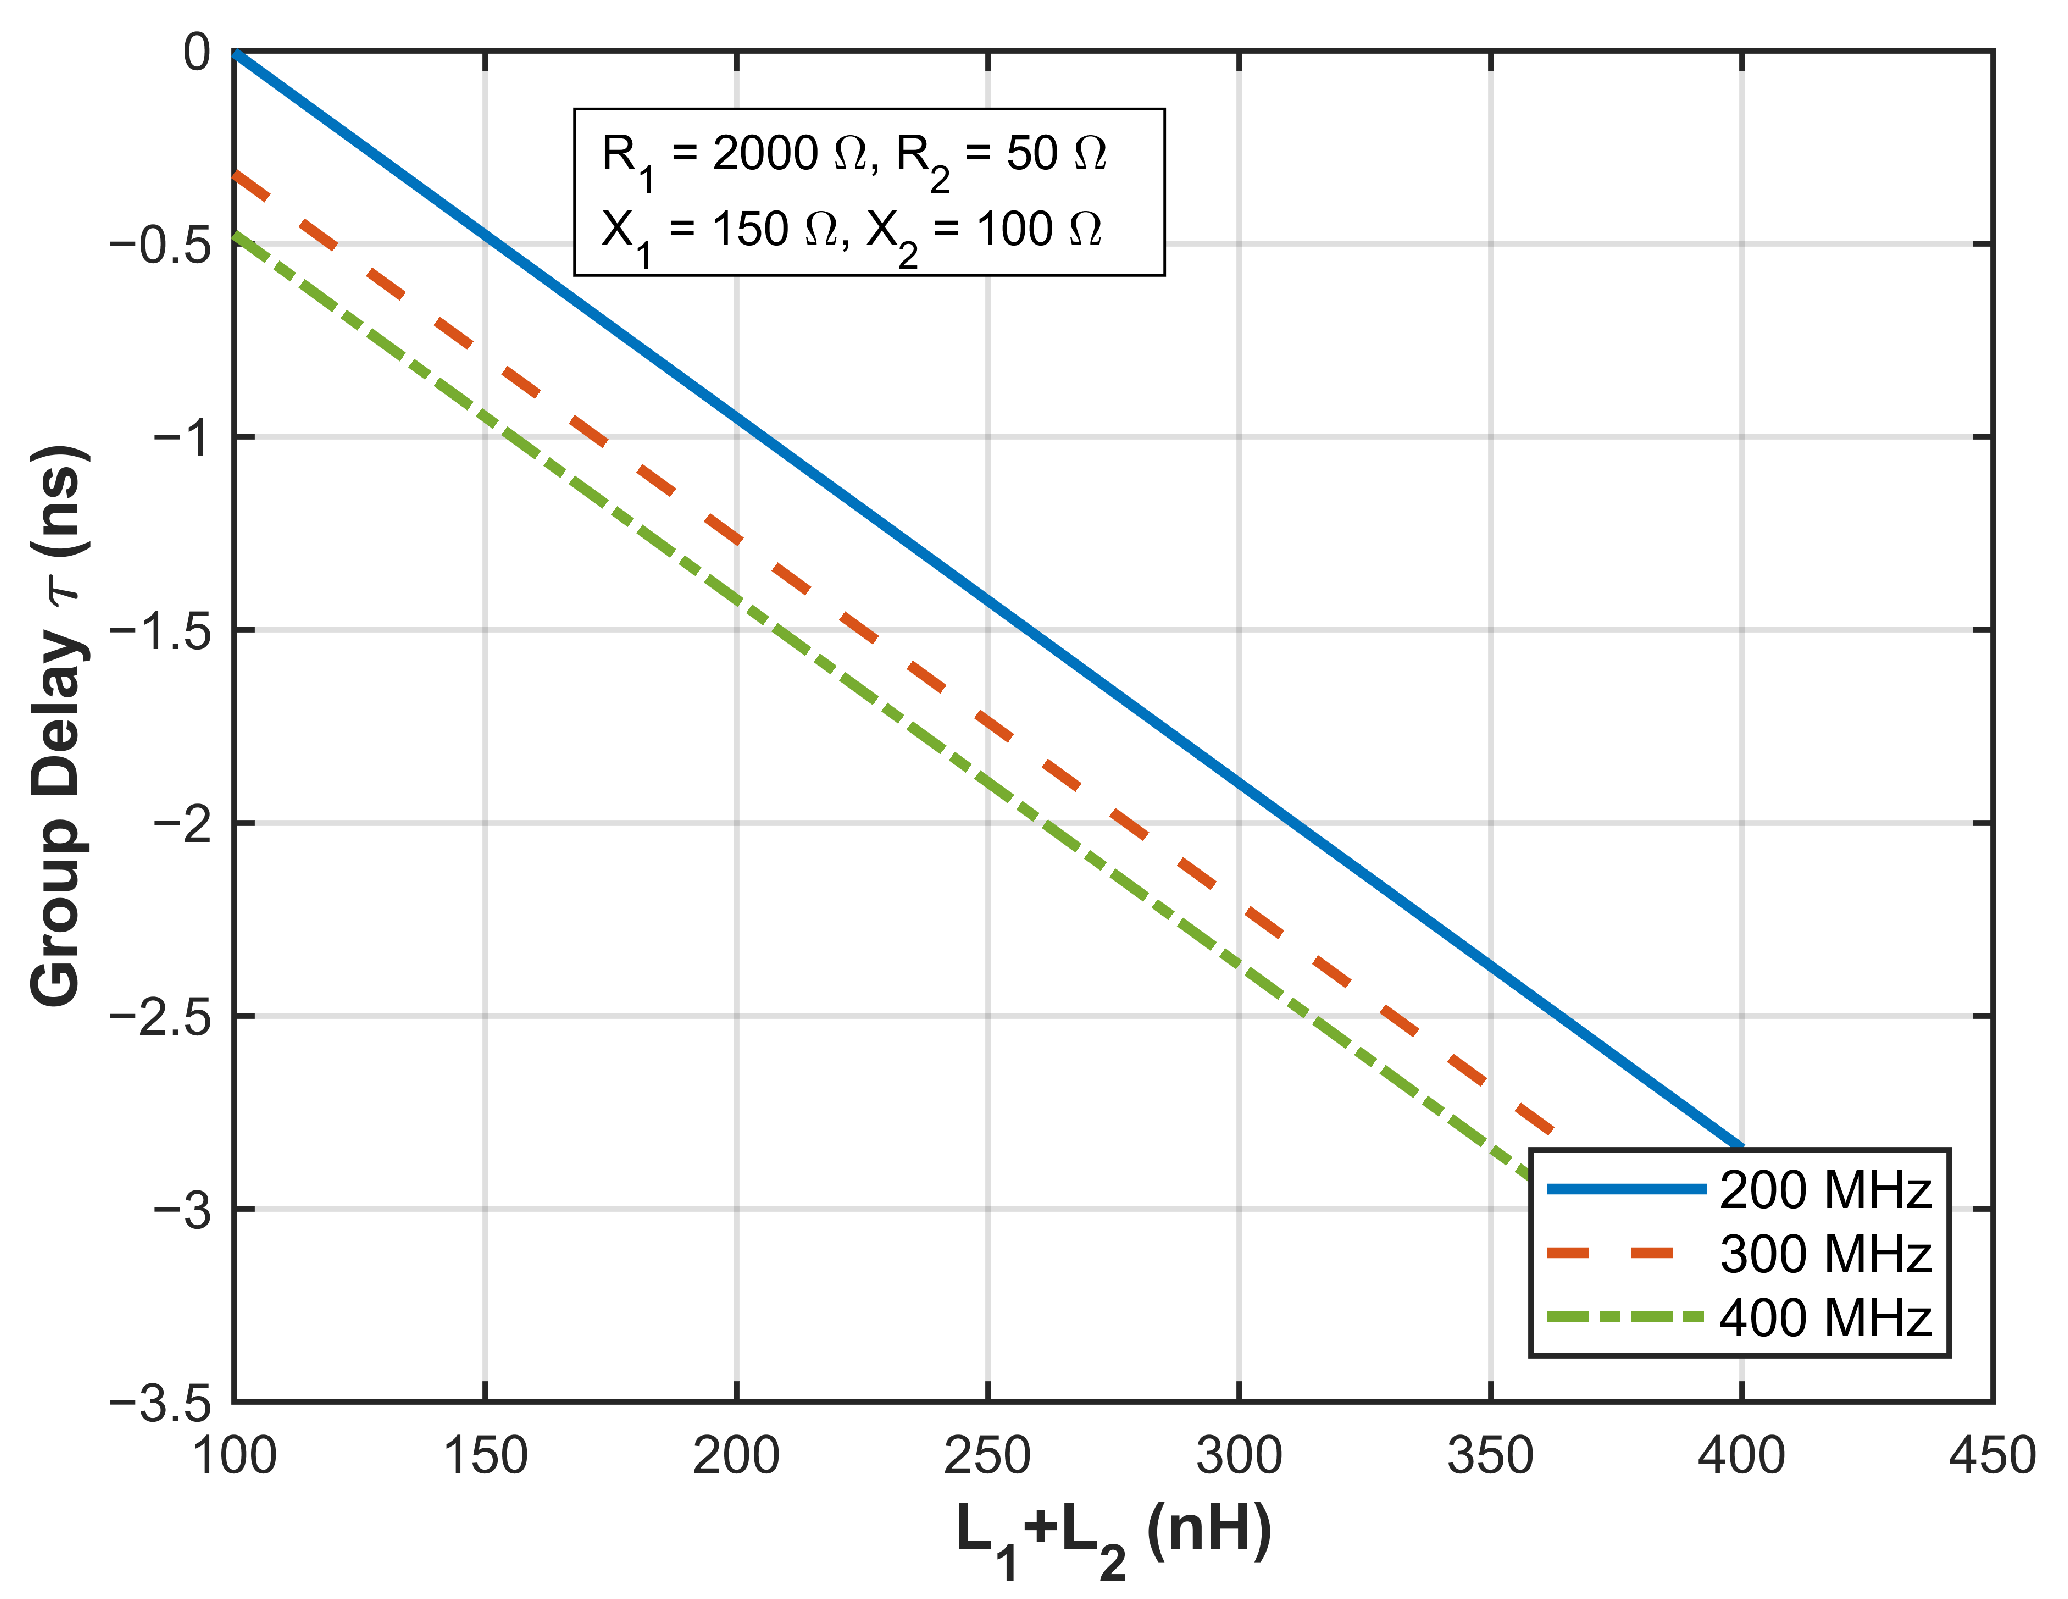
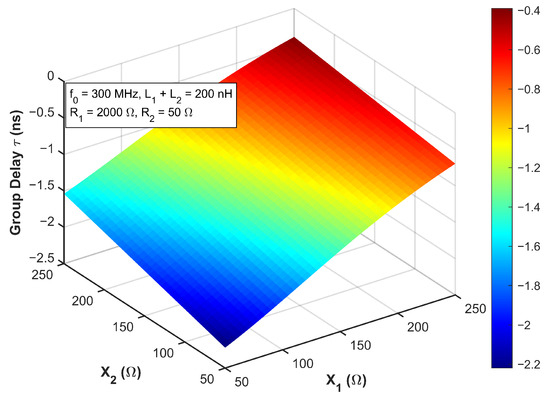
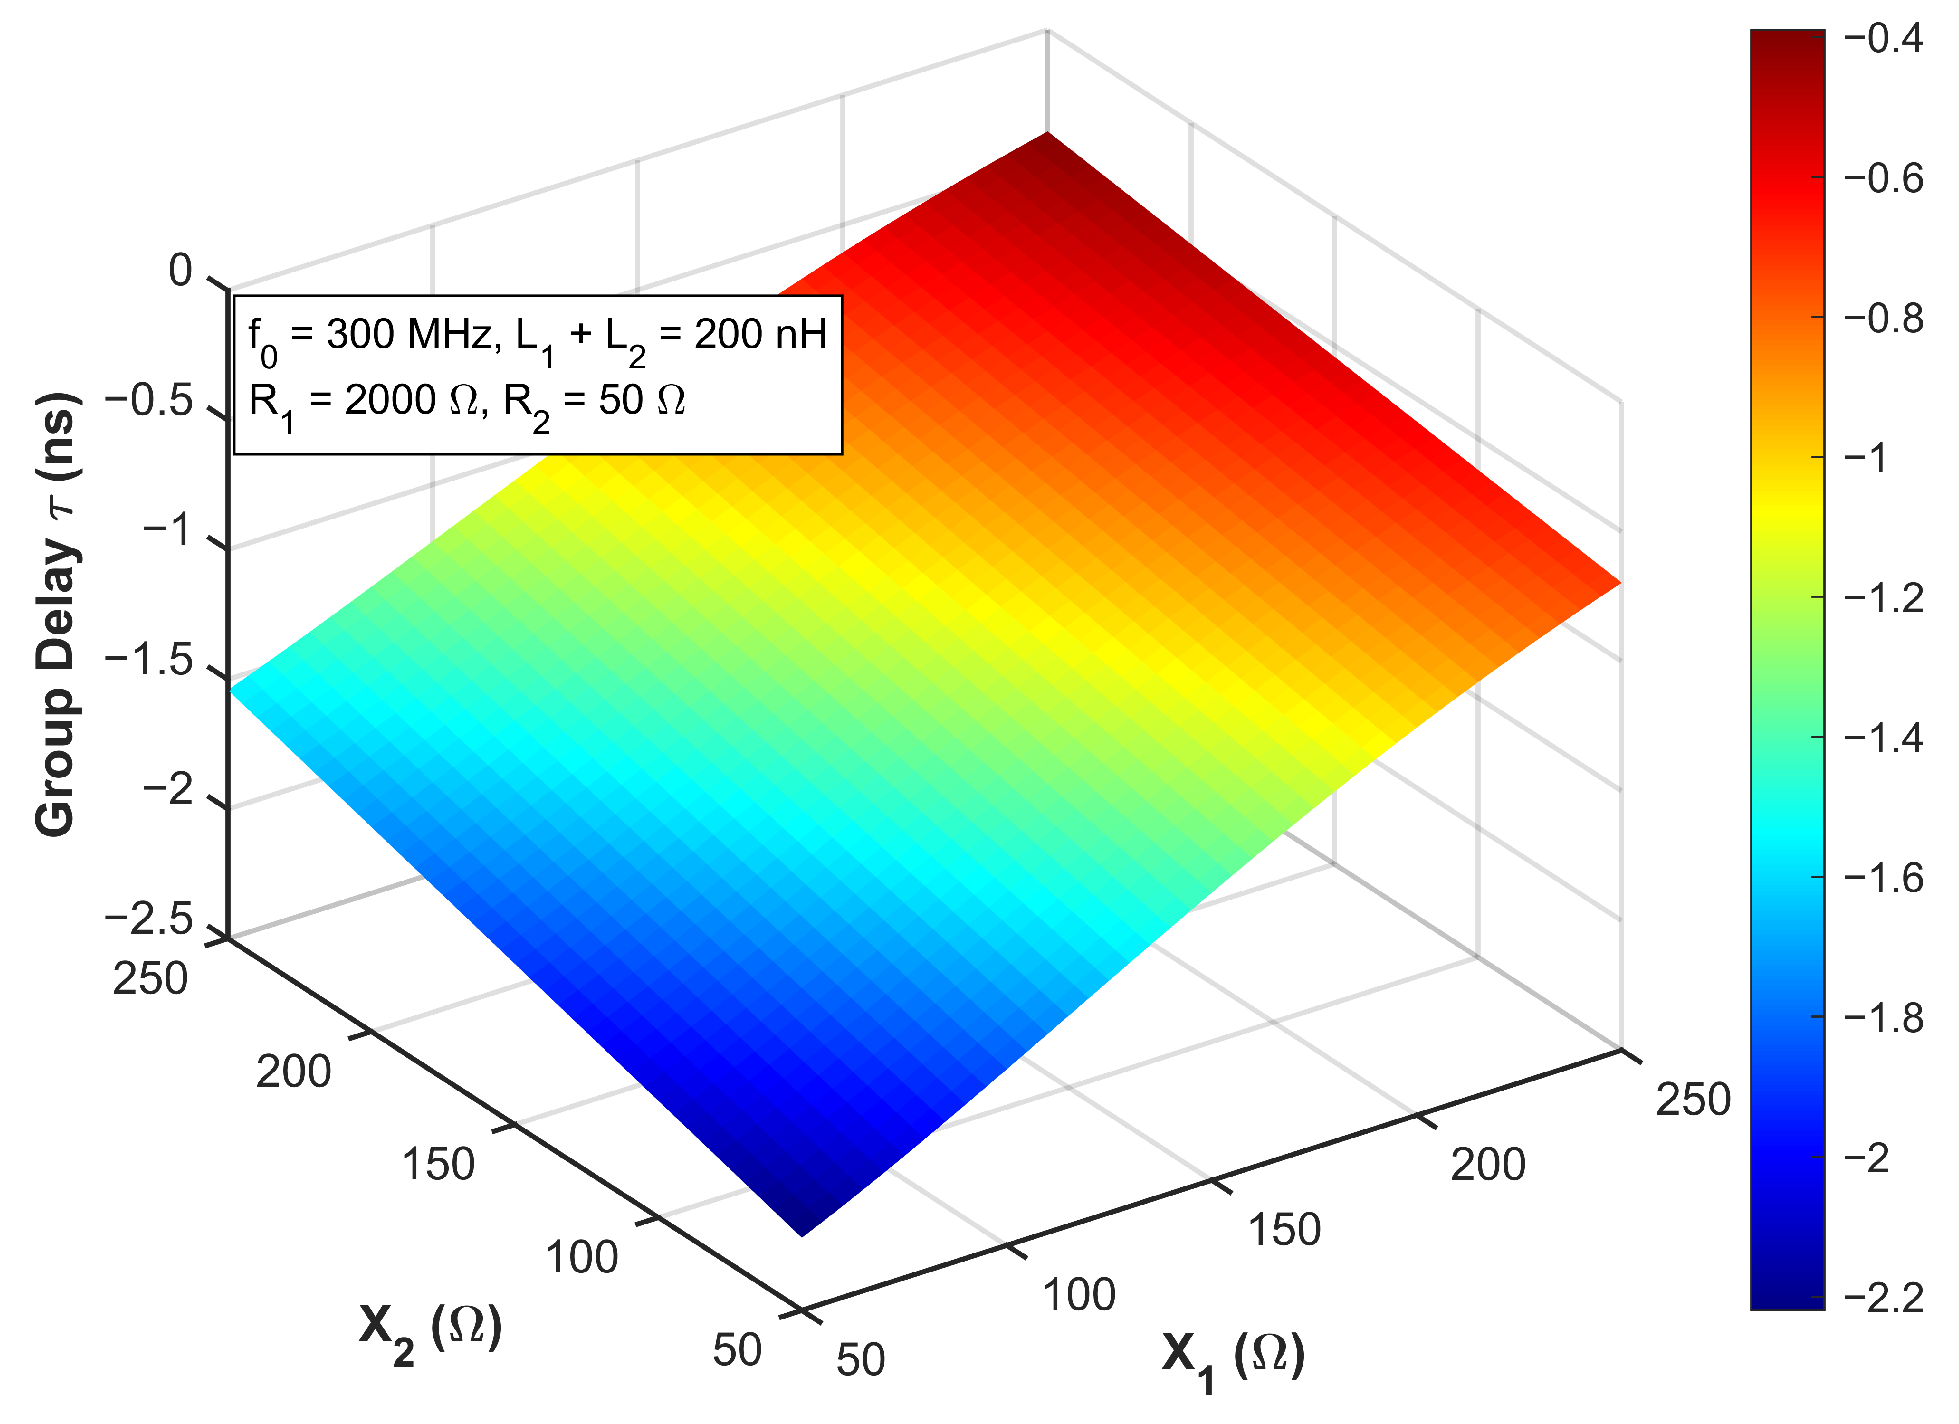
The analytical expression of the group delay peak in Equation (24) reveals that the delay magnitude is jointly determined by the energy-storage elements and the dissipative elements. Figure 11 shows the variation of with , where reducing can markedly increase the NGD’s magnitude. A comparison among the curves corresponding to different values further indicates that a deep NGD response can be maintained when is large. Figure 12 verifies the linear negative correlation between the group delay and the total inductance , implying that increasing the inductance provides a direct and effective way to enhance the NGD effect. Moreover, by comparing the responses at different frequencies, we observe that, in higher-frequency bands (e.g., 400 MHz), the angular frequency exhibits a weaker cancellation effect in the numerator term, leading to higher delay-generation efficiency. Finally, Figure 13 presents a 3D surface illustrating the impact of the asynchronous-resonance parameters and on the group delay. By finely tuning the detuning of these two parameters, the target synthesized NGD response can be induced. This multi-dimensional parameter dependence provides ample design freedom for precise group delay correction in complex RF environments.
Figure 11.
Effect of on at the resonant frequency .
Figure 12.
Effect of on at the resonant frequency .
Figure 13.
Effect of and on at the resonant frequency .
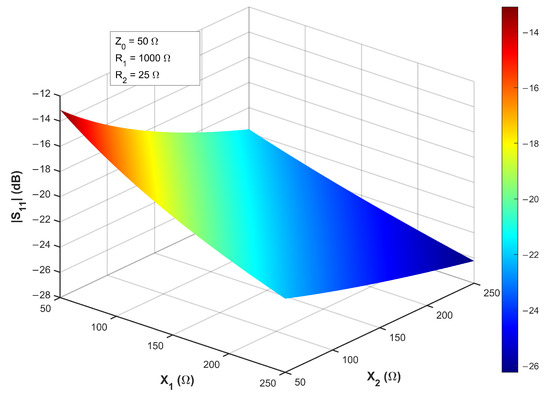
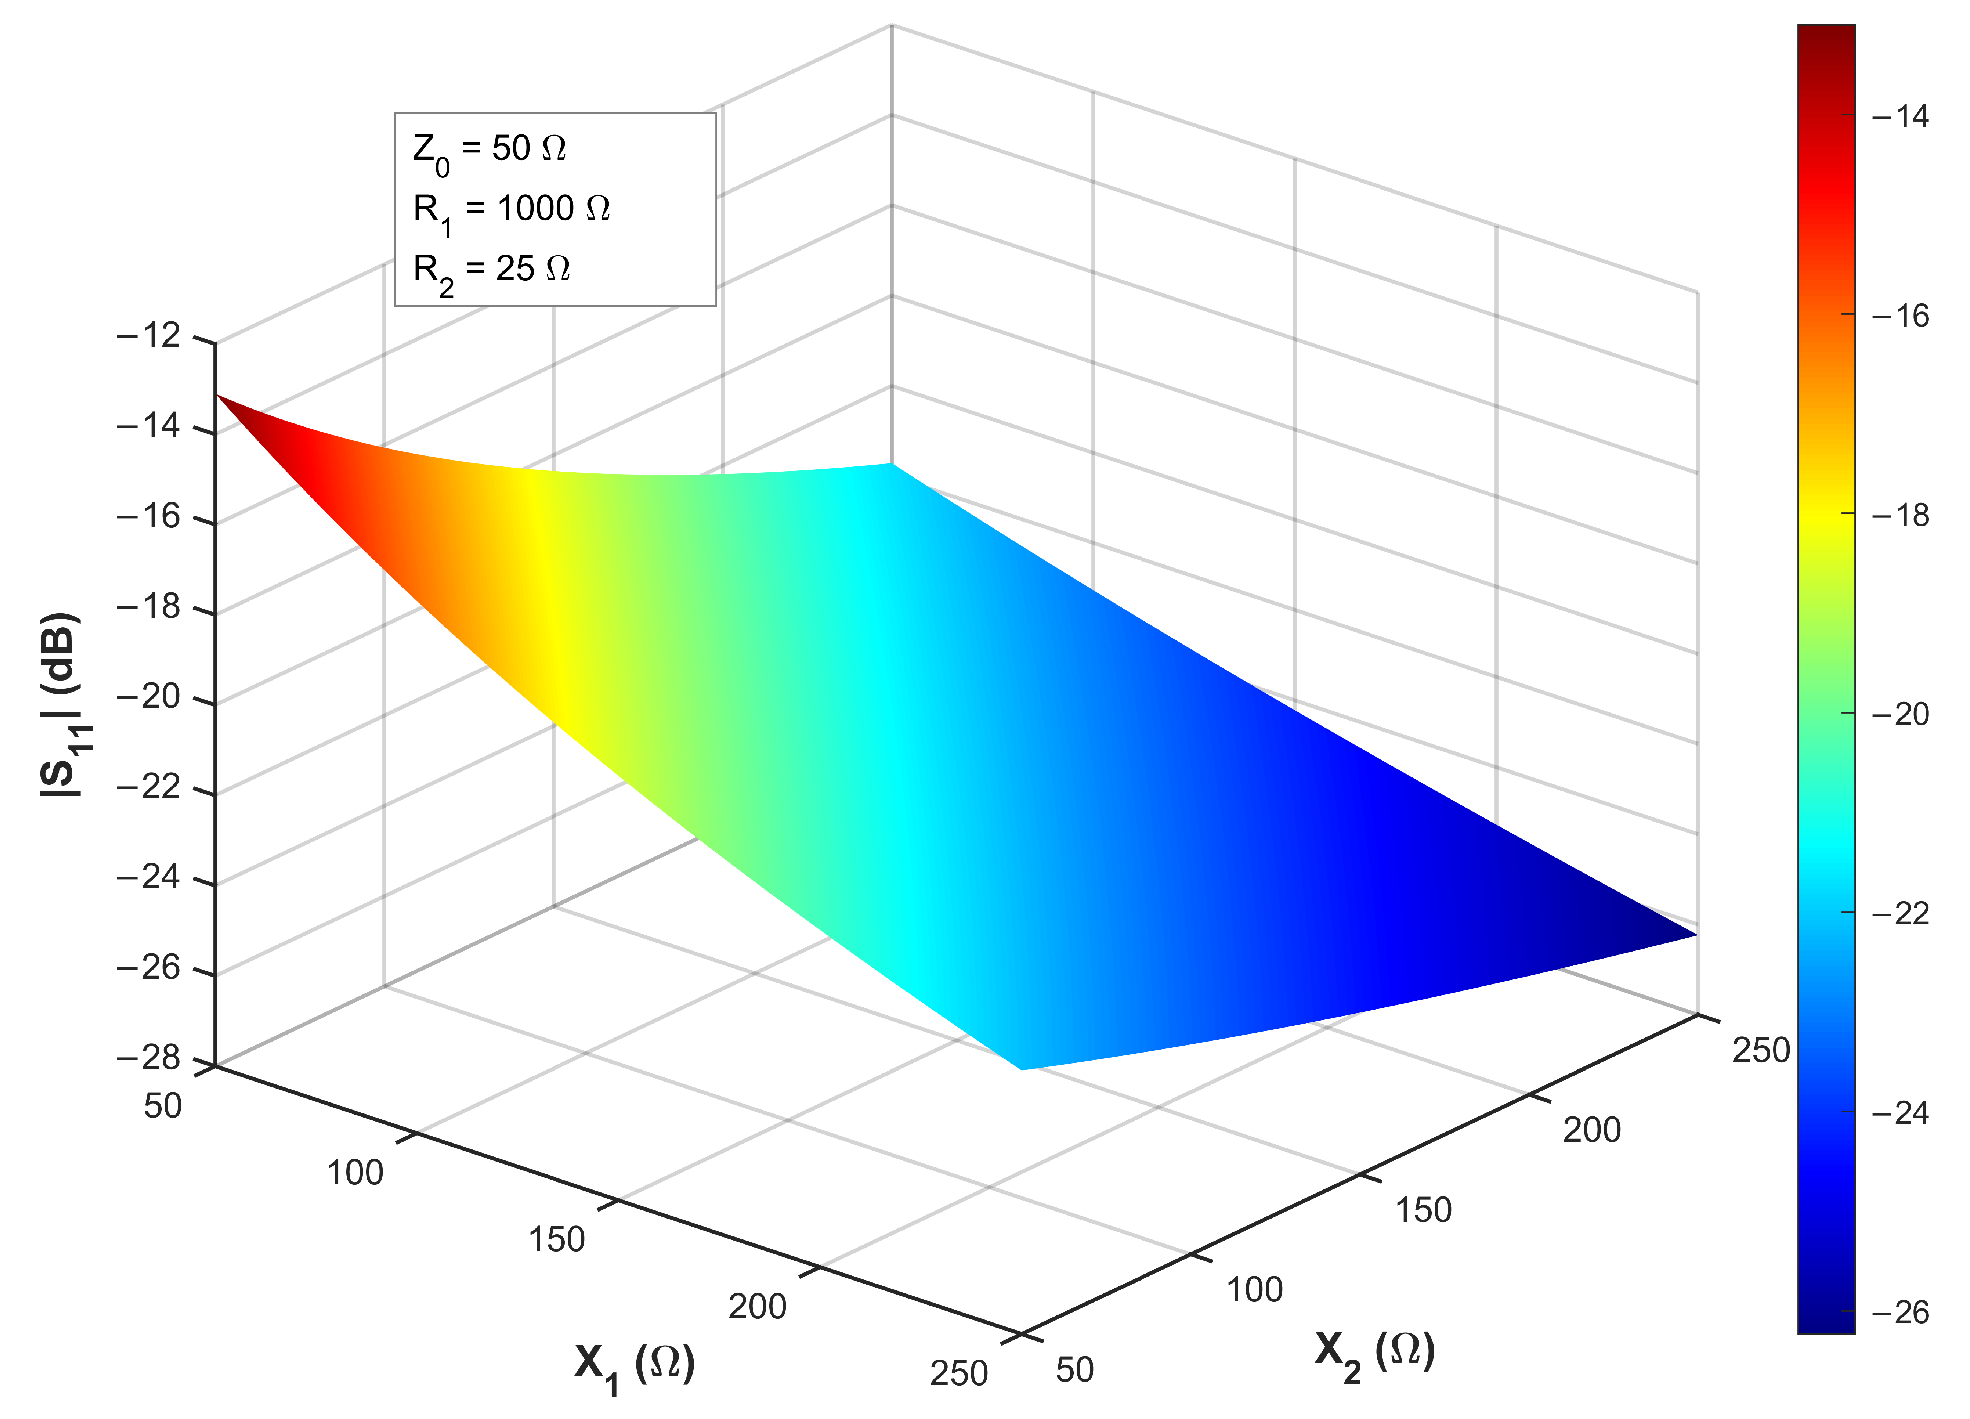
To further evaluate the robustness of impedance matching and the practical operability of the proposed topology, Figure 14 illustrates the response surface of the reflection coefficient magnitude as a function of the reactance parameters and at the center frequency . According to the analytical derivation in Equation (30), within the typical tuning range of 50 ≤ 250 , the remains consistently below dB and further improves to less than dB as the reactance values increase. This trend indicates that the adjustment of and to achieve the desired NGD depth (as previously shown in Figure 14) does not lead to a severe degradation in the port impedance matching. Such a characteristic provides a broad “design window” and superior engineering operability, allowing for designers to precisely calibrate the NGD profile through fine-tuning of the reactive components without sacrificing signal integrity. This confirms the feasibility of hardware-level phase linearization for high-precision phase-sensitive radar systems.
Figure 14.
Effect of and on at the resonant frequency .
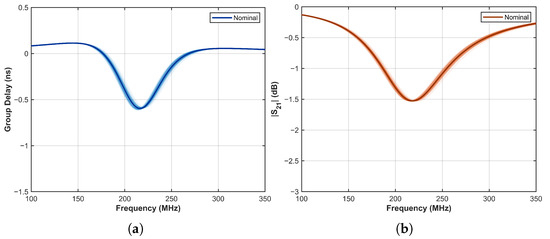
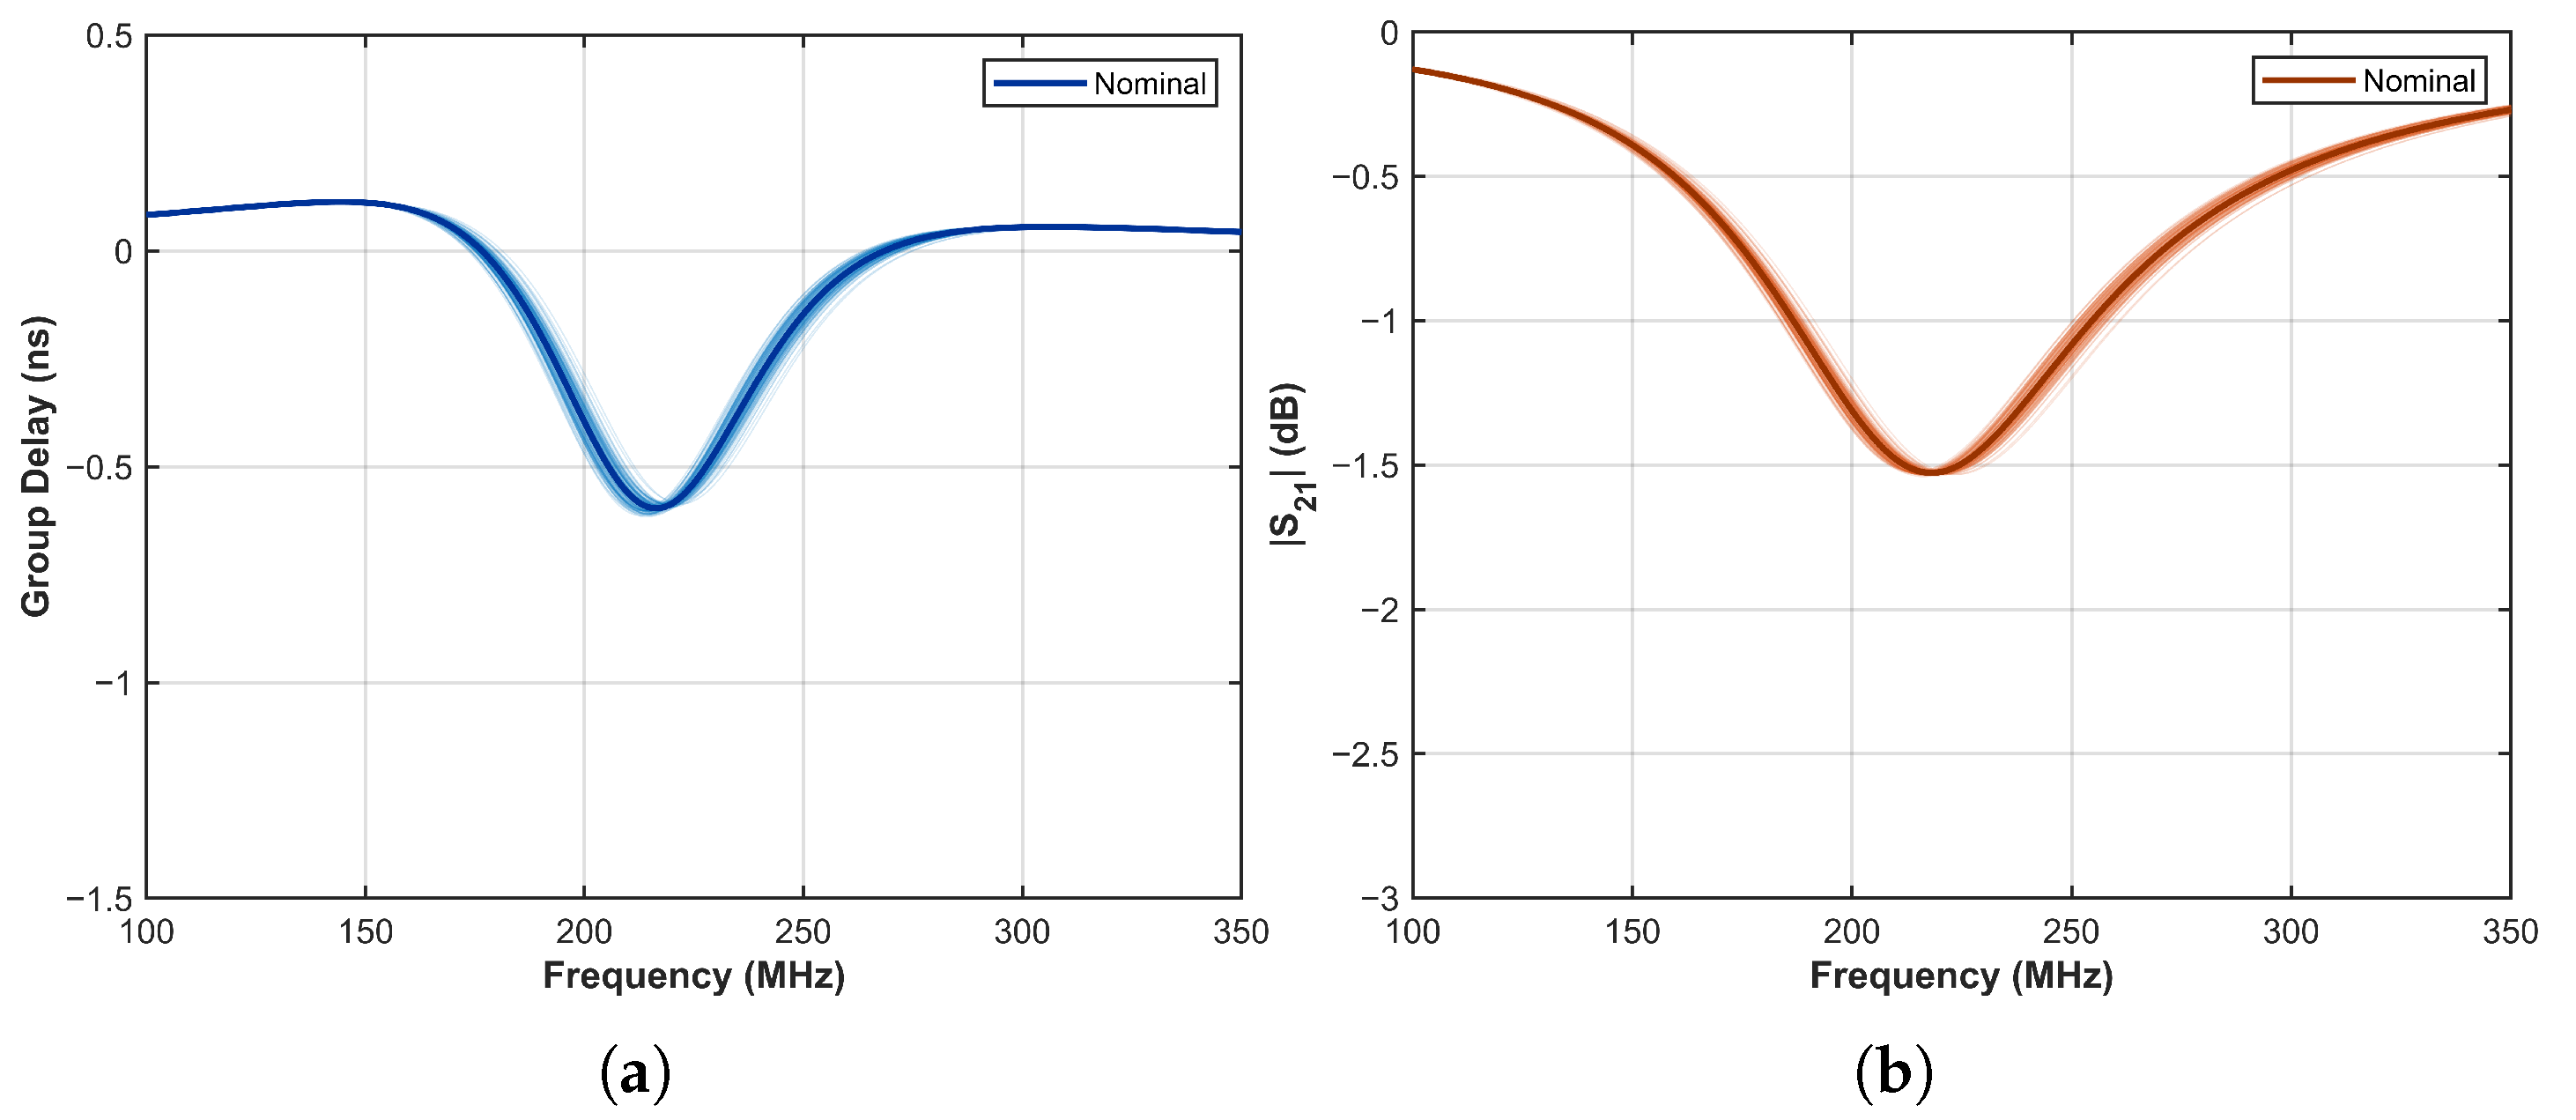
Beyond the nominal sensitivity analysis, the practical robustness of the proposed NGDC must be evaluated against simultaneous component tolerances. To this end, a 100-iteration Monte Carlo analysis was conducted, assuming a ±5% Gaussian distribution for LC components and ±1% for resistors. As depicted in Figure 15, the performance envelopes for both group delay and magnitude response remain remarkably stable despite these joint perturbations. Specifically, the NGD peaks stay well-aligned with the target frequency bands, while the insertion loss fluctuation at the center frequency is restricted to within ±0.02 dB. Such results confirm the circuit’s high tolerance to fabrication variability, ensuring reliable performance in real-world radar front-end integration.
Figure 15.
(a) Group delay considering component tolerances; (b) considering component tolerances.
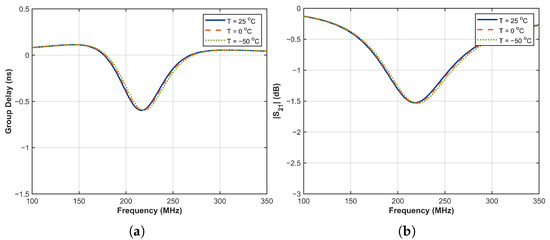
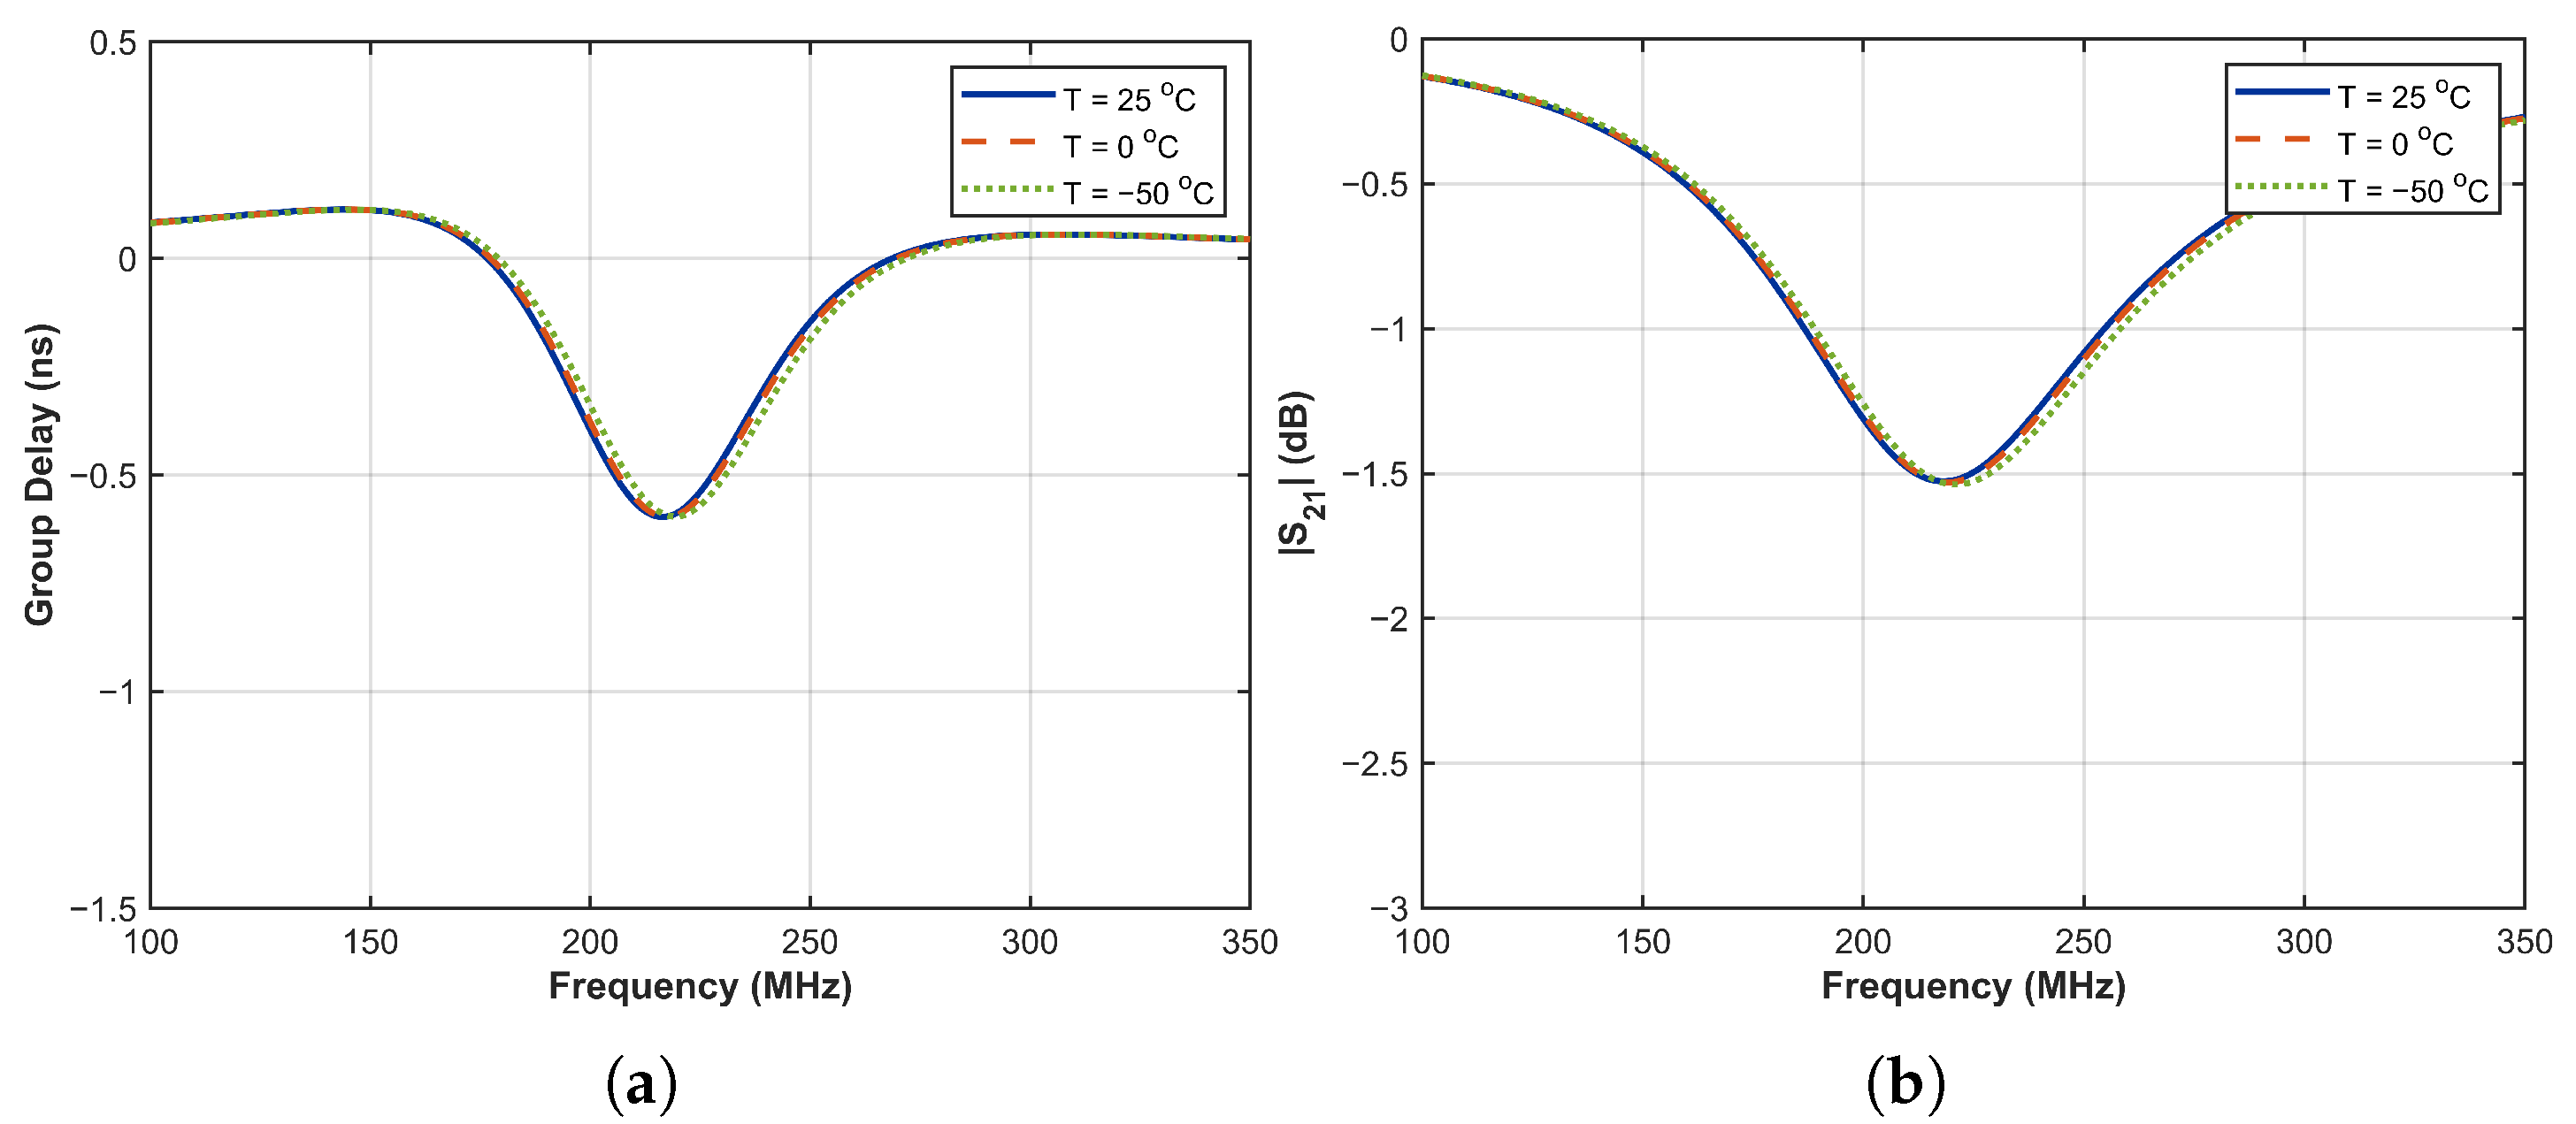
The thermal stability of the NGDC is a key consideration for polar radar applications. To evaluate this, the circuit response was simulated from −50 °C to +25 °C using standard component temperature coefficients. As shown in Figure 16, both the group delay and magnitude responses remain stable across this wide temperature range. Although the NGD peak frequency shifts by approximately 2 MHz, this variation is negligible compared to the 200 MHz radar bandwidth.
Figure 16.
(a) Group delay considering temperature coefficients; (b) considering temperature coefficients.
To bridge the gap between radar ranging precision and hardware specifications, we propose a general design methodology. The fundamental rule for phase-sensitive radar is that the ranging accuracy is intrinsically constrained by the phase linearity (or group delay flatness) of the RF front-end. By mapping the system-level error budget (e.g., the millimeter-level accuracy defined in Section 2) to hardware constraints (e.g., the 0.6 ns group delay ripple limit), the design of the NGDC can be streamlined into the following four hierarchical stages:
Step 1: Specify the target operating conditions of the circuit, including the center frequency , the required NGD magnitude , and the maximum allowable insertion loss (IL). These key specifications serve as the design benchmarks for subsequent parameter estimation and refinement.
Step 2: Start with the synchronous-resonance mode (assume ) to simplify the analysis. Then, use Equations (25) and (26) to obtain initial estimates of the series resistance and the total inductance , which serve as reference values for subsequent optimization.
Step 3: If the reflection coefficient or the optimized group delay flatness in synchronous mode cannot meet the rigorous radar system indicators, then introduce the asynchronous resonance mechanism. By introducing controlled detuning amounts and , and cooperating with the regulation of high-value resistor , further adjust the impedance matching with the target application structure, thus achieving the lowest reflection coefficient while meeting design requirements.
Step 4: Conduct circuit simulation and parameter optimization in ADS. If the provided NGD depth is insufficient, prioritize decreasing or increasing the total inductance ; if the flatness or bandwidth is limited: increase the resistance or fine-tune the ratio of asynchronous reactances and . Iterate until the simulated response fully satisfies the system-level tolerance requirements and then proceed to fabrication and experimental verification.
4. Bandpass Filter Group Delay Compensation and System Simulation
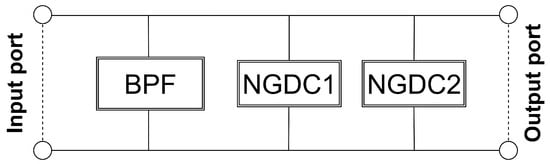
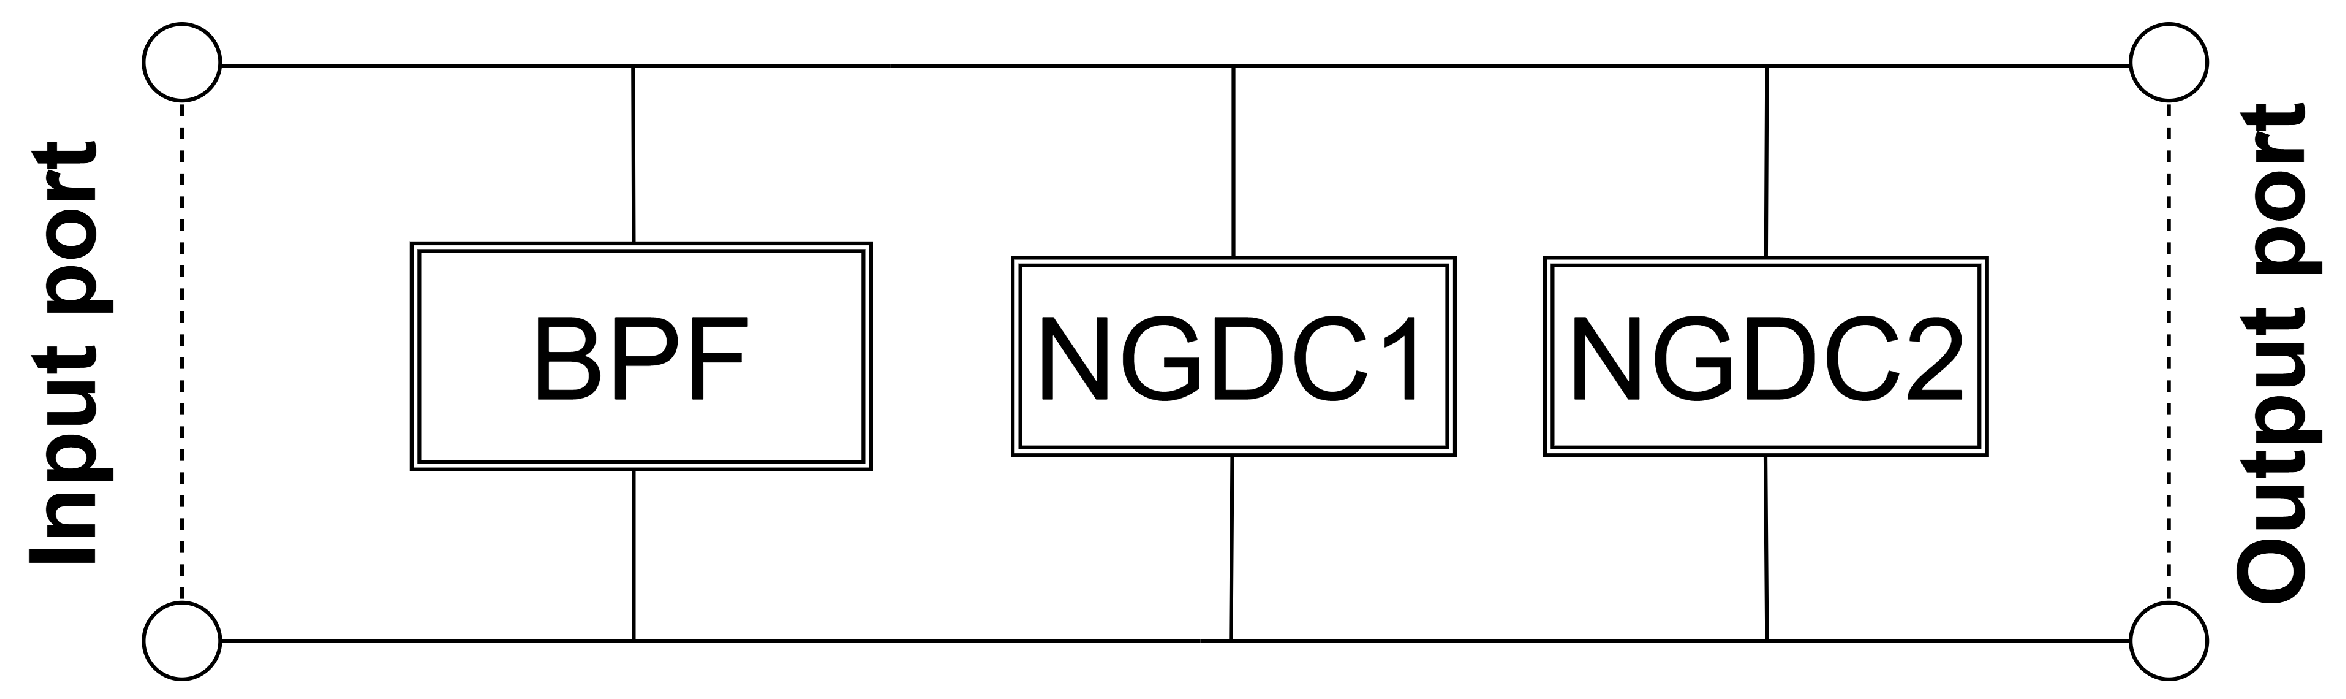
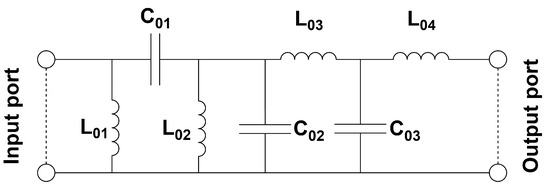
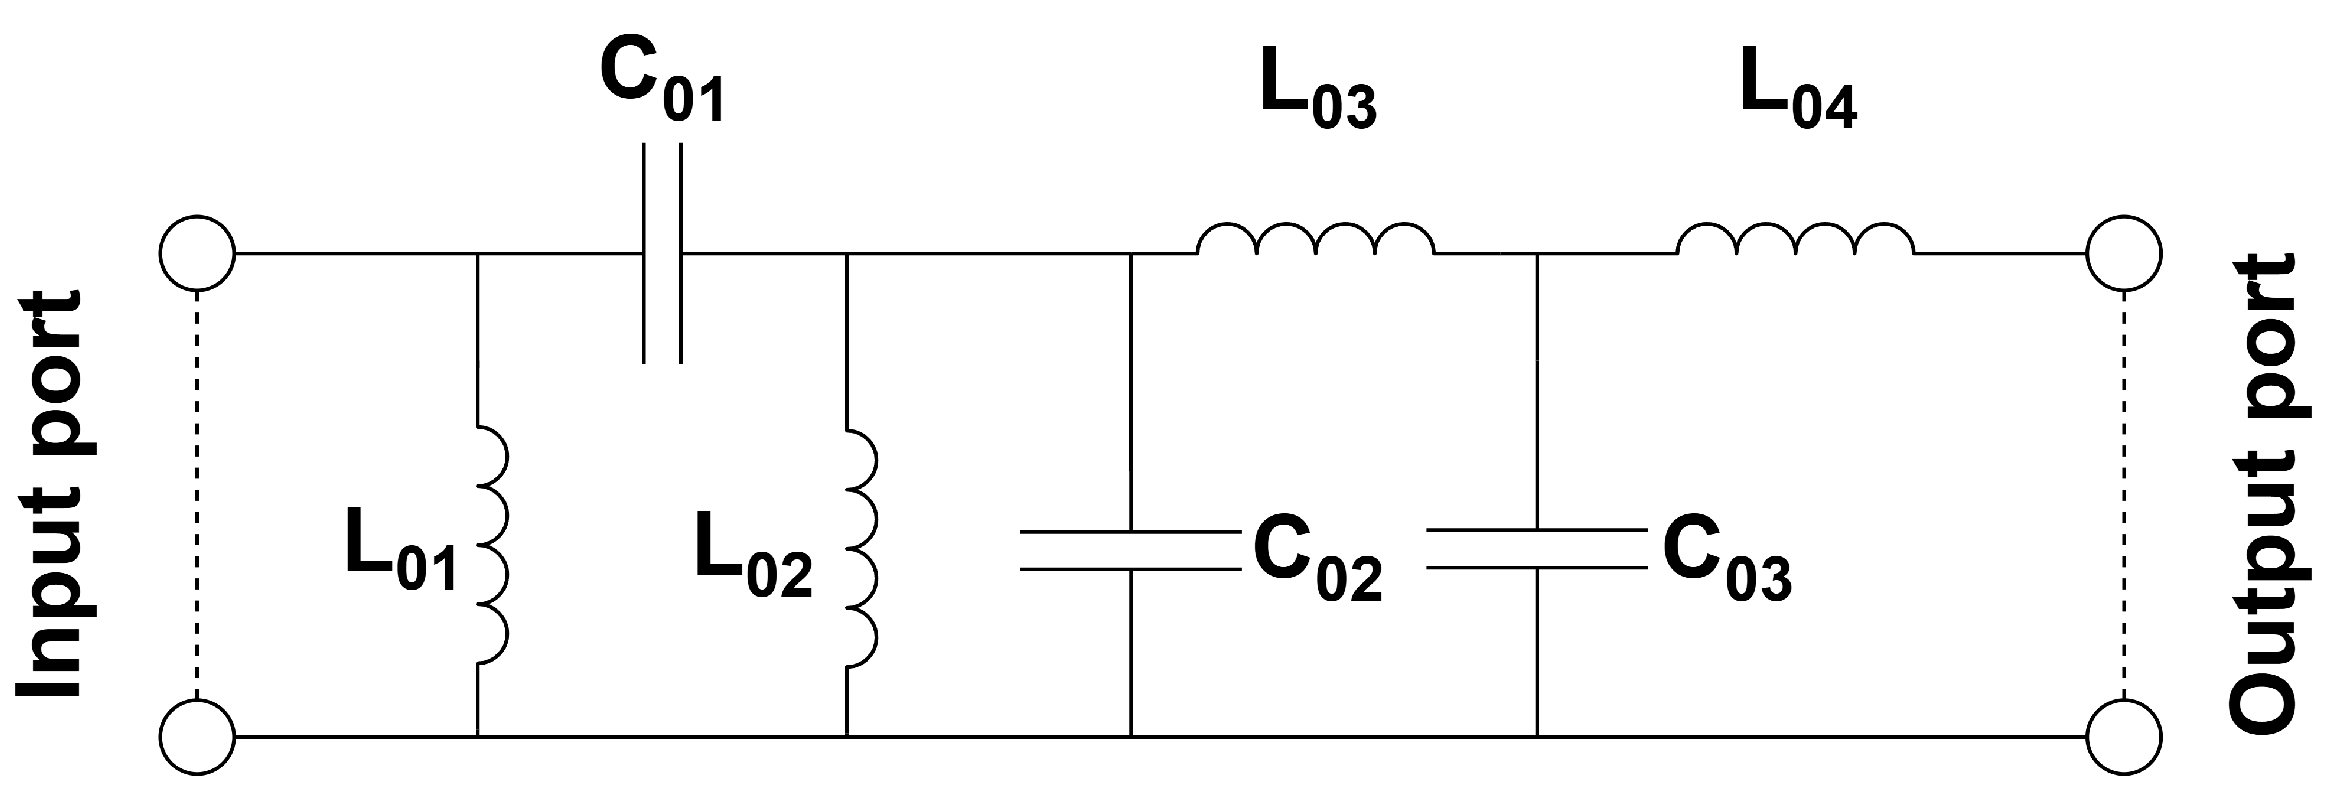
As discussed above, the theoretical tolerance of the phase-sensitive radar system to group delay fluctuations was quantified. The simulation results indicate that the group delay fluctuation along the signal path must be strictly constrained to within 0.6 ns. However, the 200–400 MHz bandpass filters commonly used in RF front-ends inevitably exhibit sharp group delay transitions near the passband edges, making it difficult to satisfy the system-level specifications [31]. To address this issue, two previously designed negative group delay circuits (NGDCs) are cascaded with the bandpass filter. By exploiting the multi-parameter tuning capability of the proposed NGDCs, the positive delay fluctuations of the filter are precisely counteracted, thereby bringing the overall channel group delay response back within the tolerance range required by the radar system while maintaining good impedance matching. The resulting configuration is shown in Figure 17, and the bandpass filter structure is shown in Figure 18.
Figure 17.
Bandpass filter loaded with NGDCs.
Figure 18.
Structure of the bandpass filter.
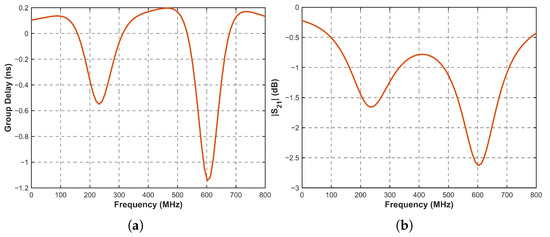
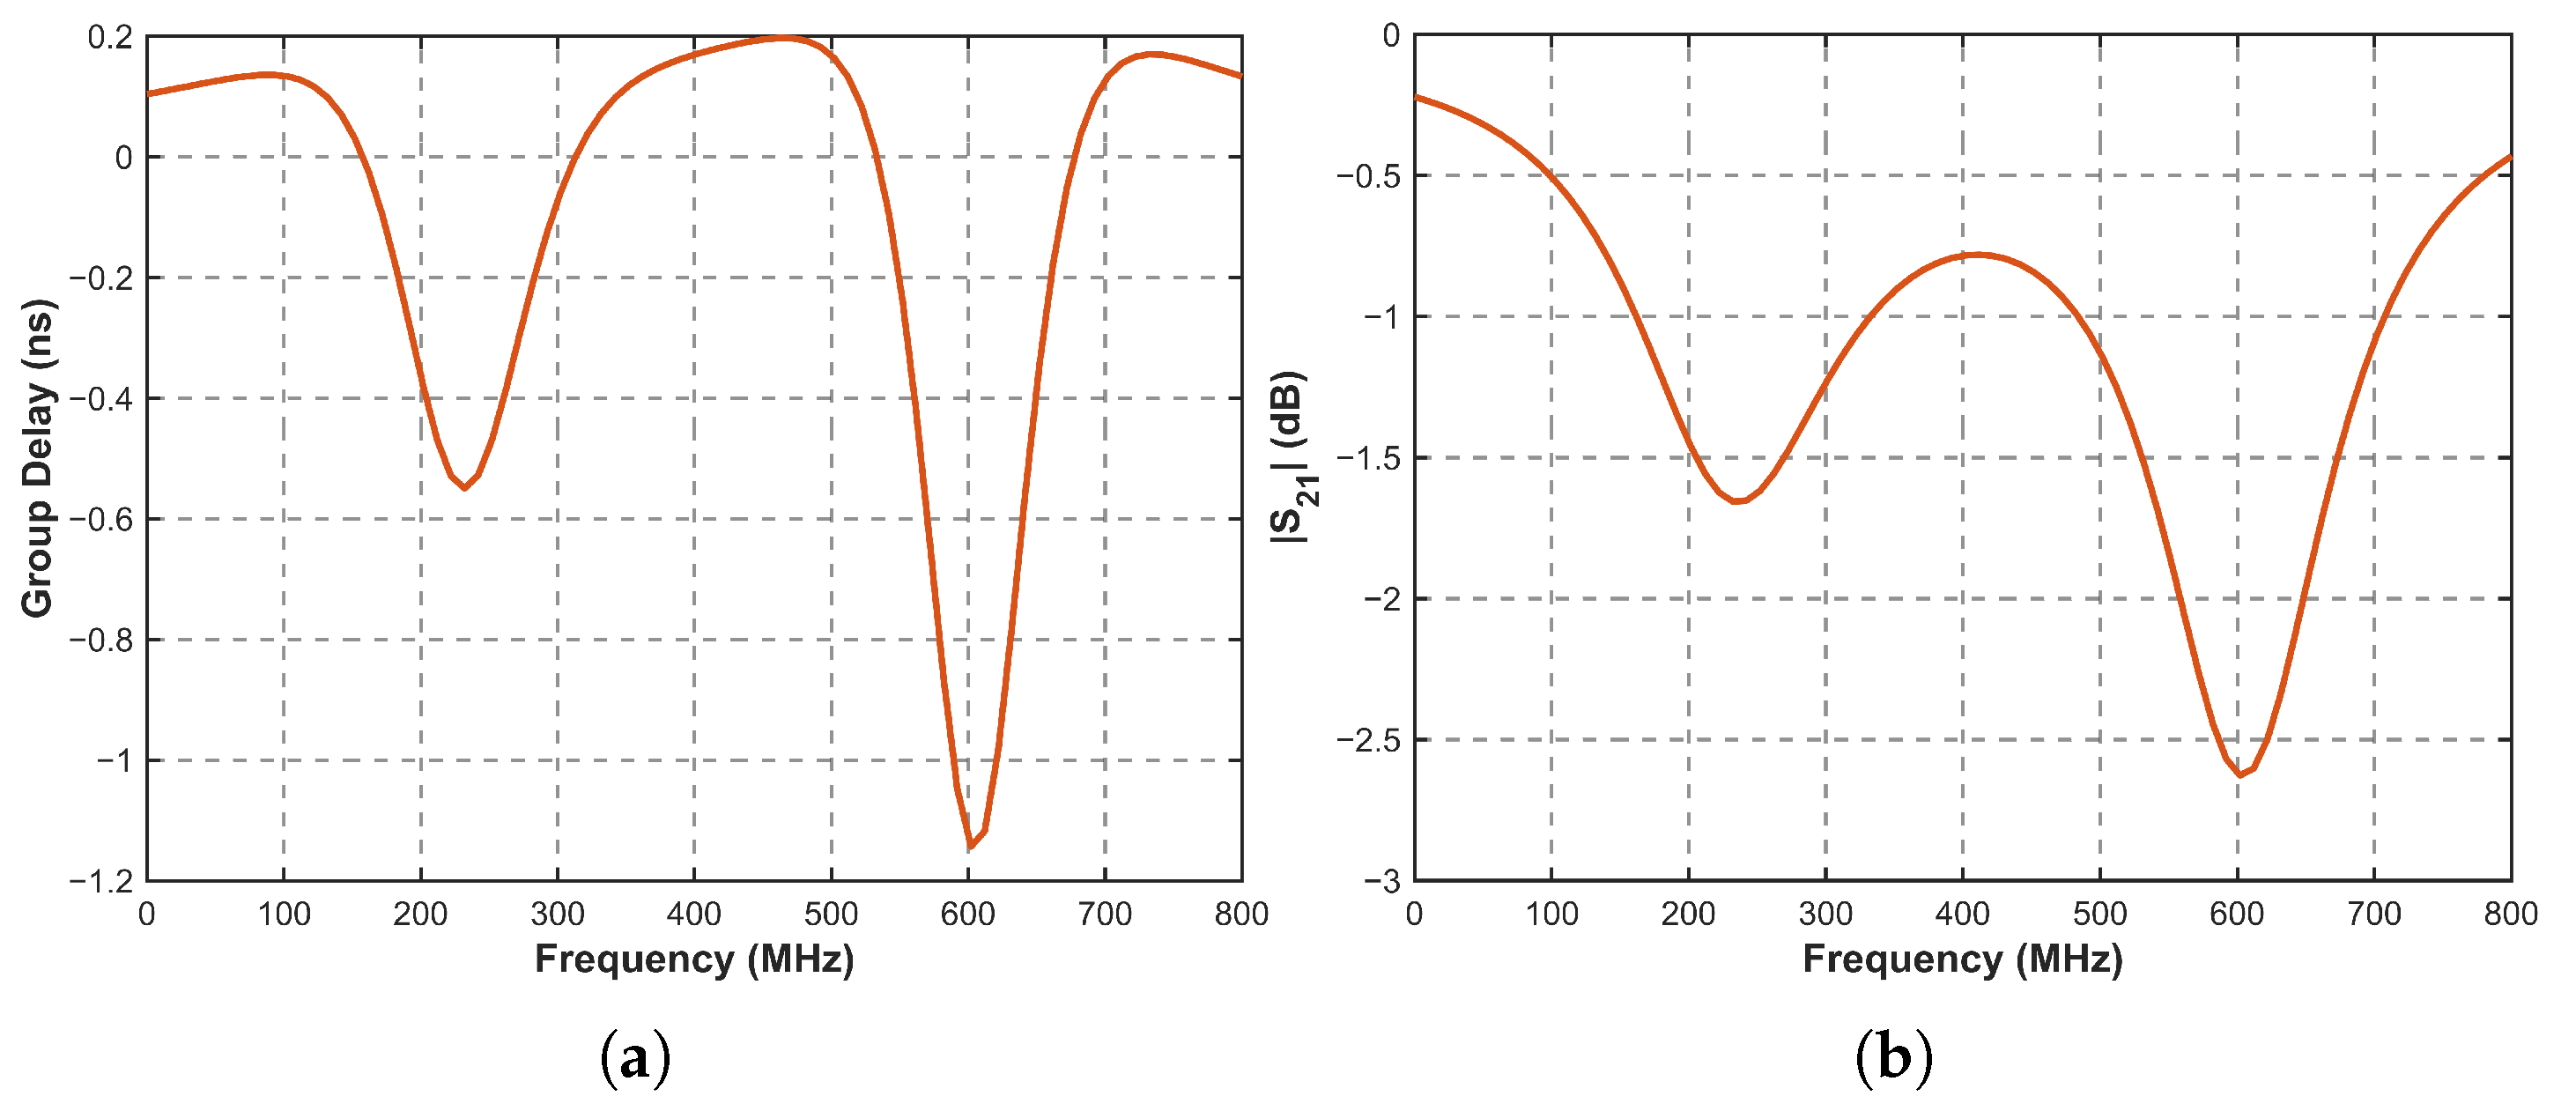
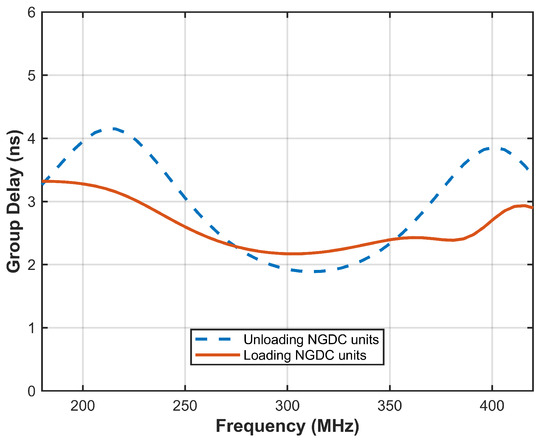
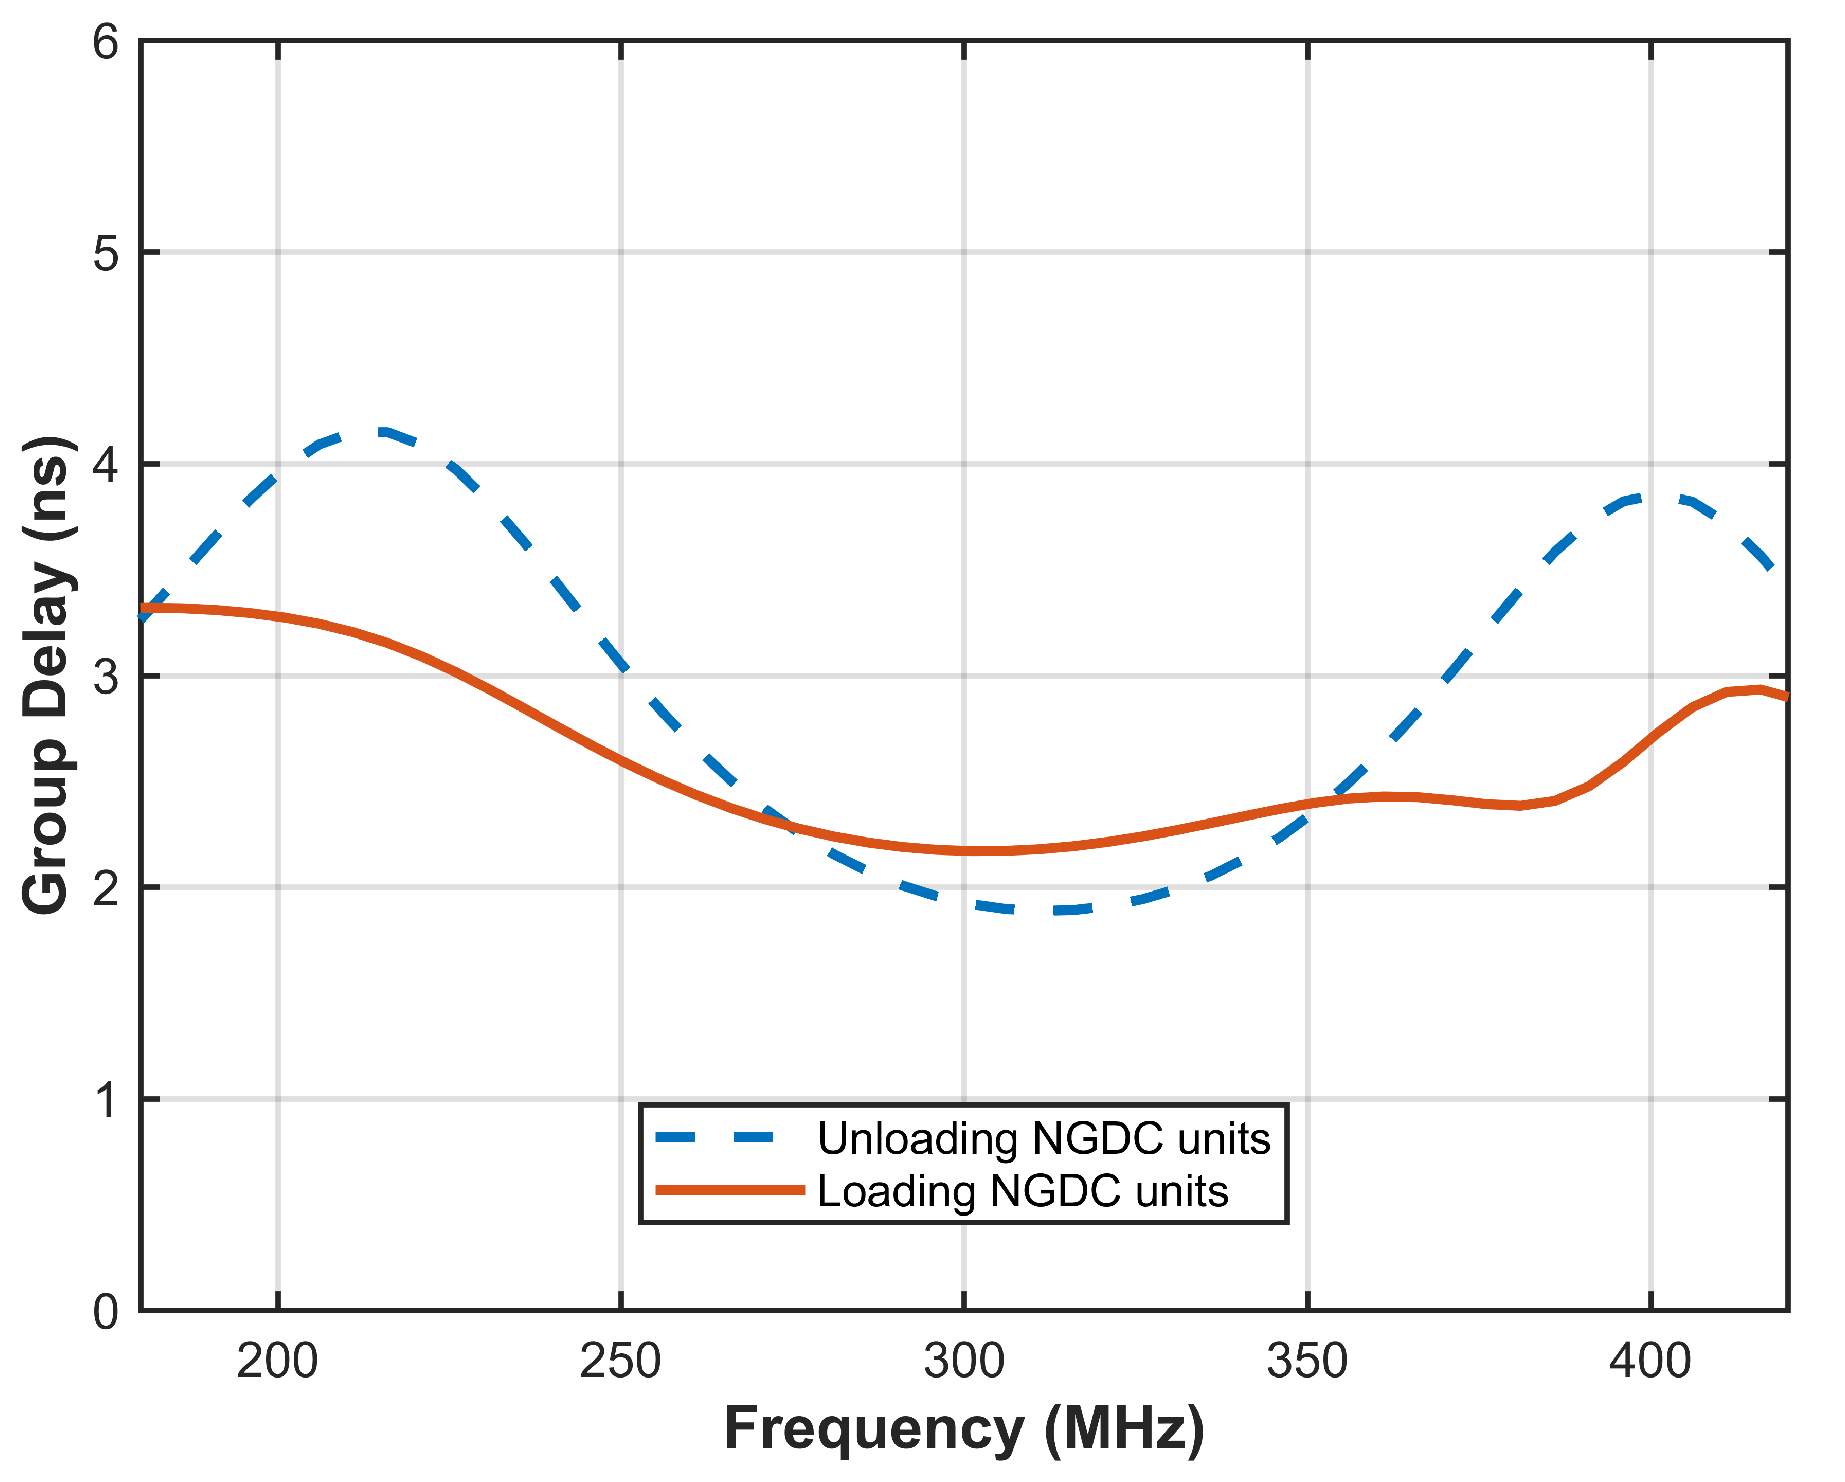
In phase-sensitive radar, optimization of the group delay to within the theoretical range is sufficient to meet requirements; therefore, there is no need to trade larger insertion loss for more extreme flatness. The bandpass filter parameters are shown in Table 3. After optimization iterations, the parameters of the two bandpass NGD units are shown in Table 4. Figure 19 show the simulation results when the two NGDCs are cascaded. Unit 1 resonates synchronously at 216 MHz and generates bandpass NGD within 178–256 MHz; Unit 2 resonates asynchronously at 400 MHz and generates bandpass NGD within 366–441 MHz. Figure 20 shows the group delay of the bandpass filter before and after the introduction of the NGD structures. After introduction, the nominal group delay within the 200–400 MHz passband is reduced from 3.015 ns to 2.53 ns, and the maximum fluctuation amplitude is reduced from approximately 1.135 ns to approximately 0.55 ns, successfully achieving the previously calculated design requirements.
Table 3.
Parameter values in the bandpass filter.
Table 4.
Parameter values in the bandpass NGD structures.
Figure 19.
(a) Group delay of two cascaded NGDC units; (b) of two cascaded NGDC units.
Figure 20.
Group delay simulation before and after optimization.
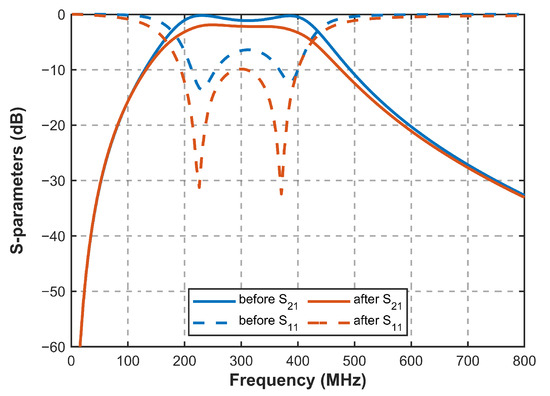
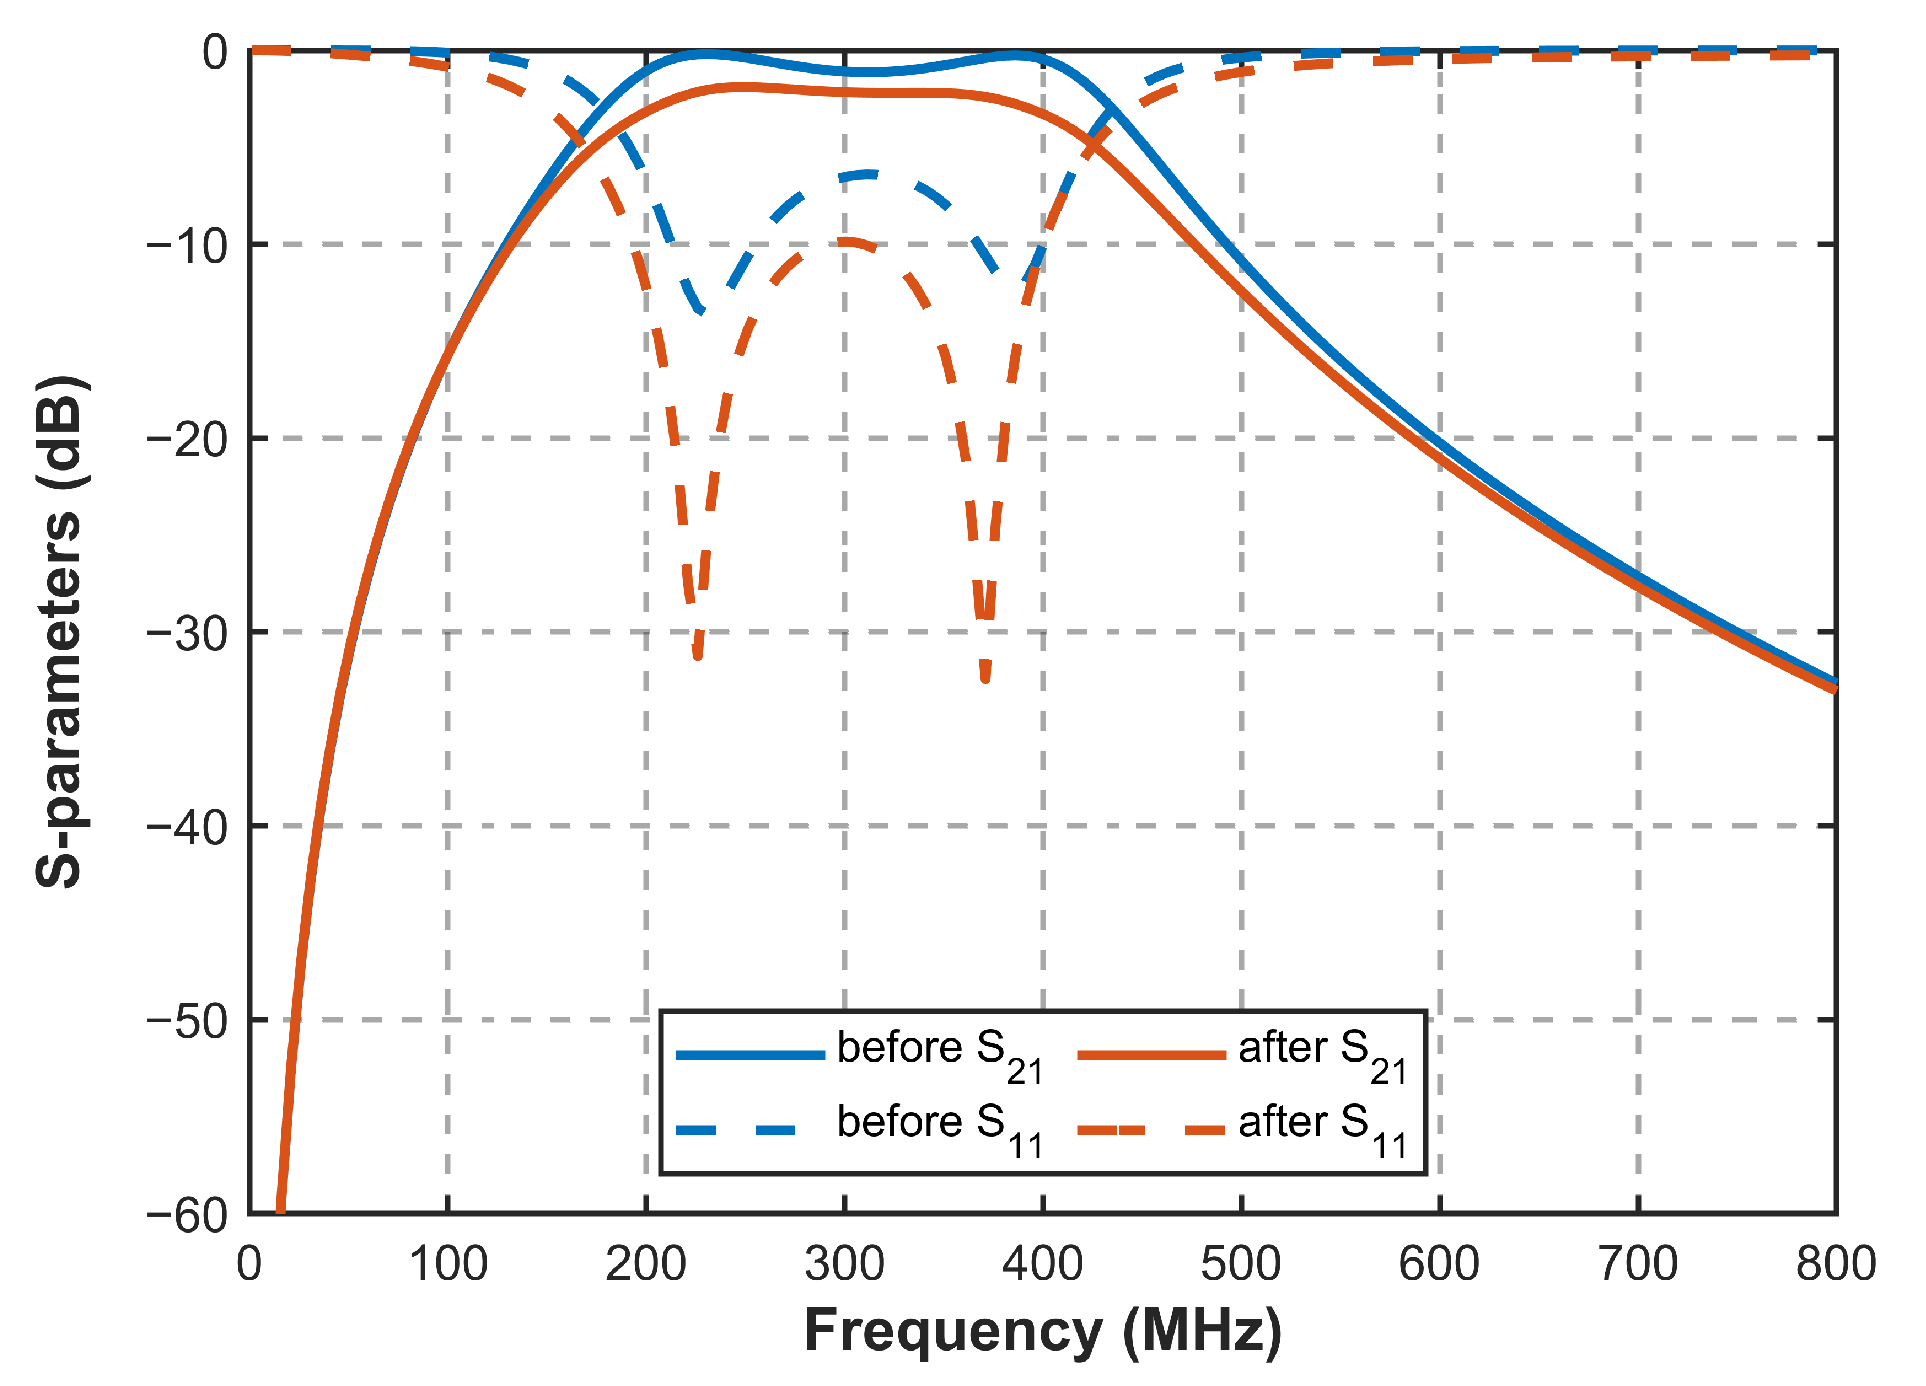
Figure 21 compares the simulated S-parameters before and after cascading the NGDCs with the bandpass filter. The in-band insertion loss increases only slightly after compensation, reaching approximately 2 dB at the center frequency, with passband fluctuations of less than 1.5 dB. In addition, the reflection performance is improved after introducing the NGDCs, indicating better impedance matching of the overall network. These results demonstrate the high design flexibility of the proposed multi-parameter NGDC structure, which enables precise impedance control while providing group delay compensation and maintaining good matching to the system interface.
Figure 21.
S-parameter simulation results before and after optimization.
5. Experimental Validation and Performance Comparison
5.1. Analysis of Hardware Measurement Results
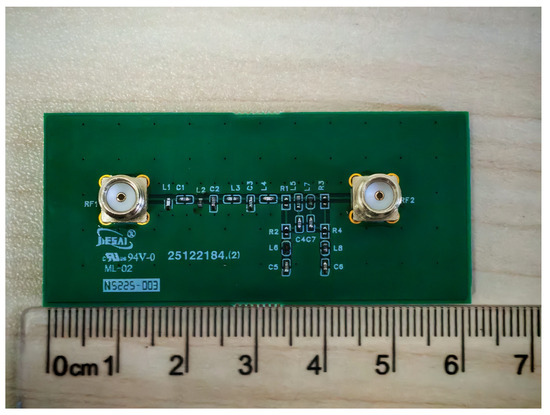
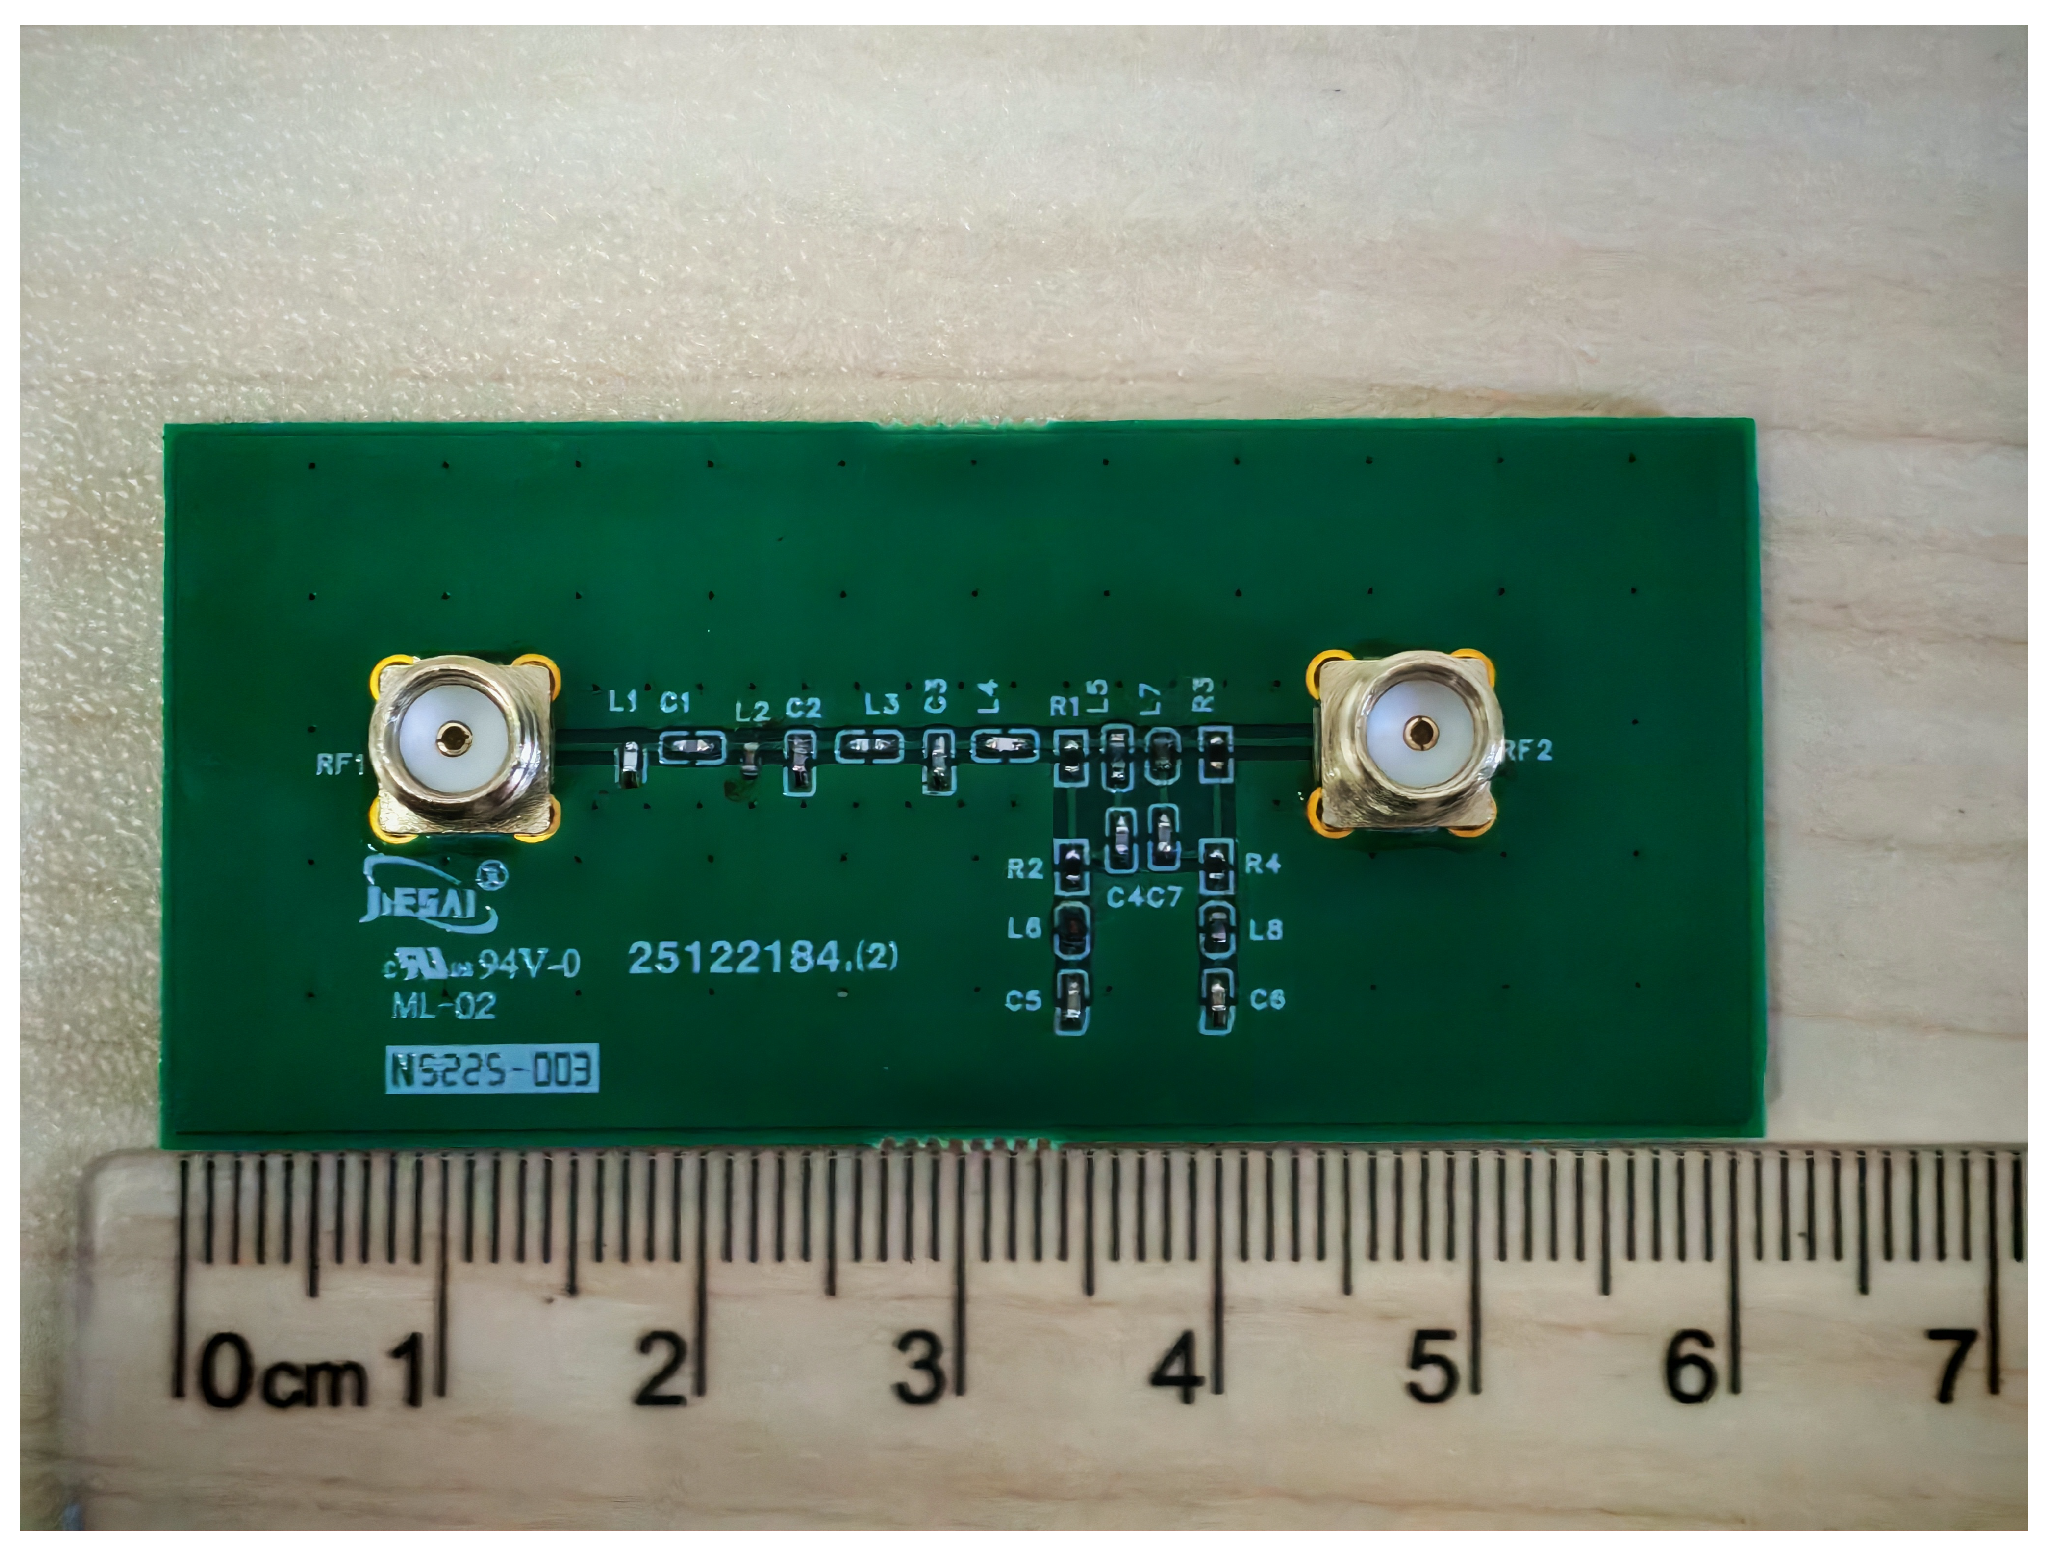
To verify the validity of the theoretical design and simulation results, a physical prototype of the proposed structure was fabricated. Figure 22 shows the PCB photograph of the circuit. Subsequently, its performance was further evaluated using experimental measurements.
Figure 22.
Photograph of the fabricated prototype.
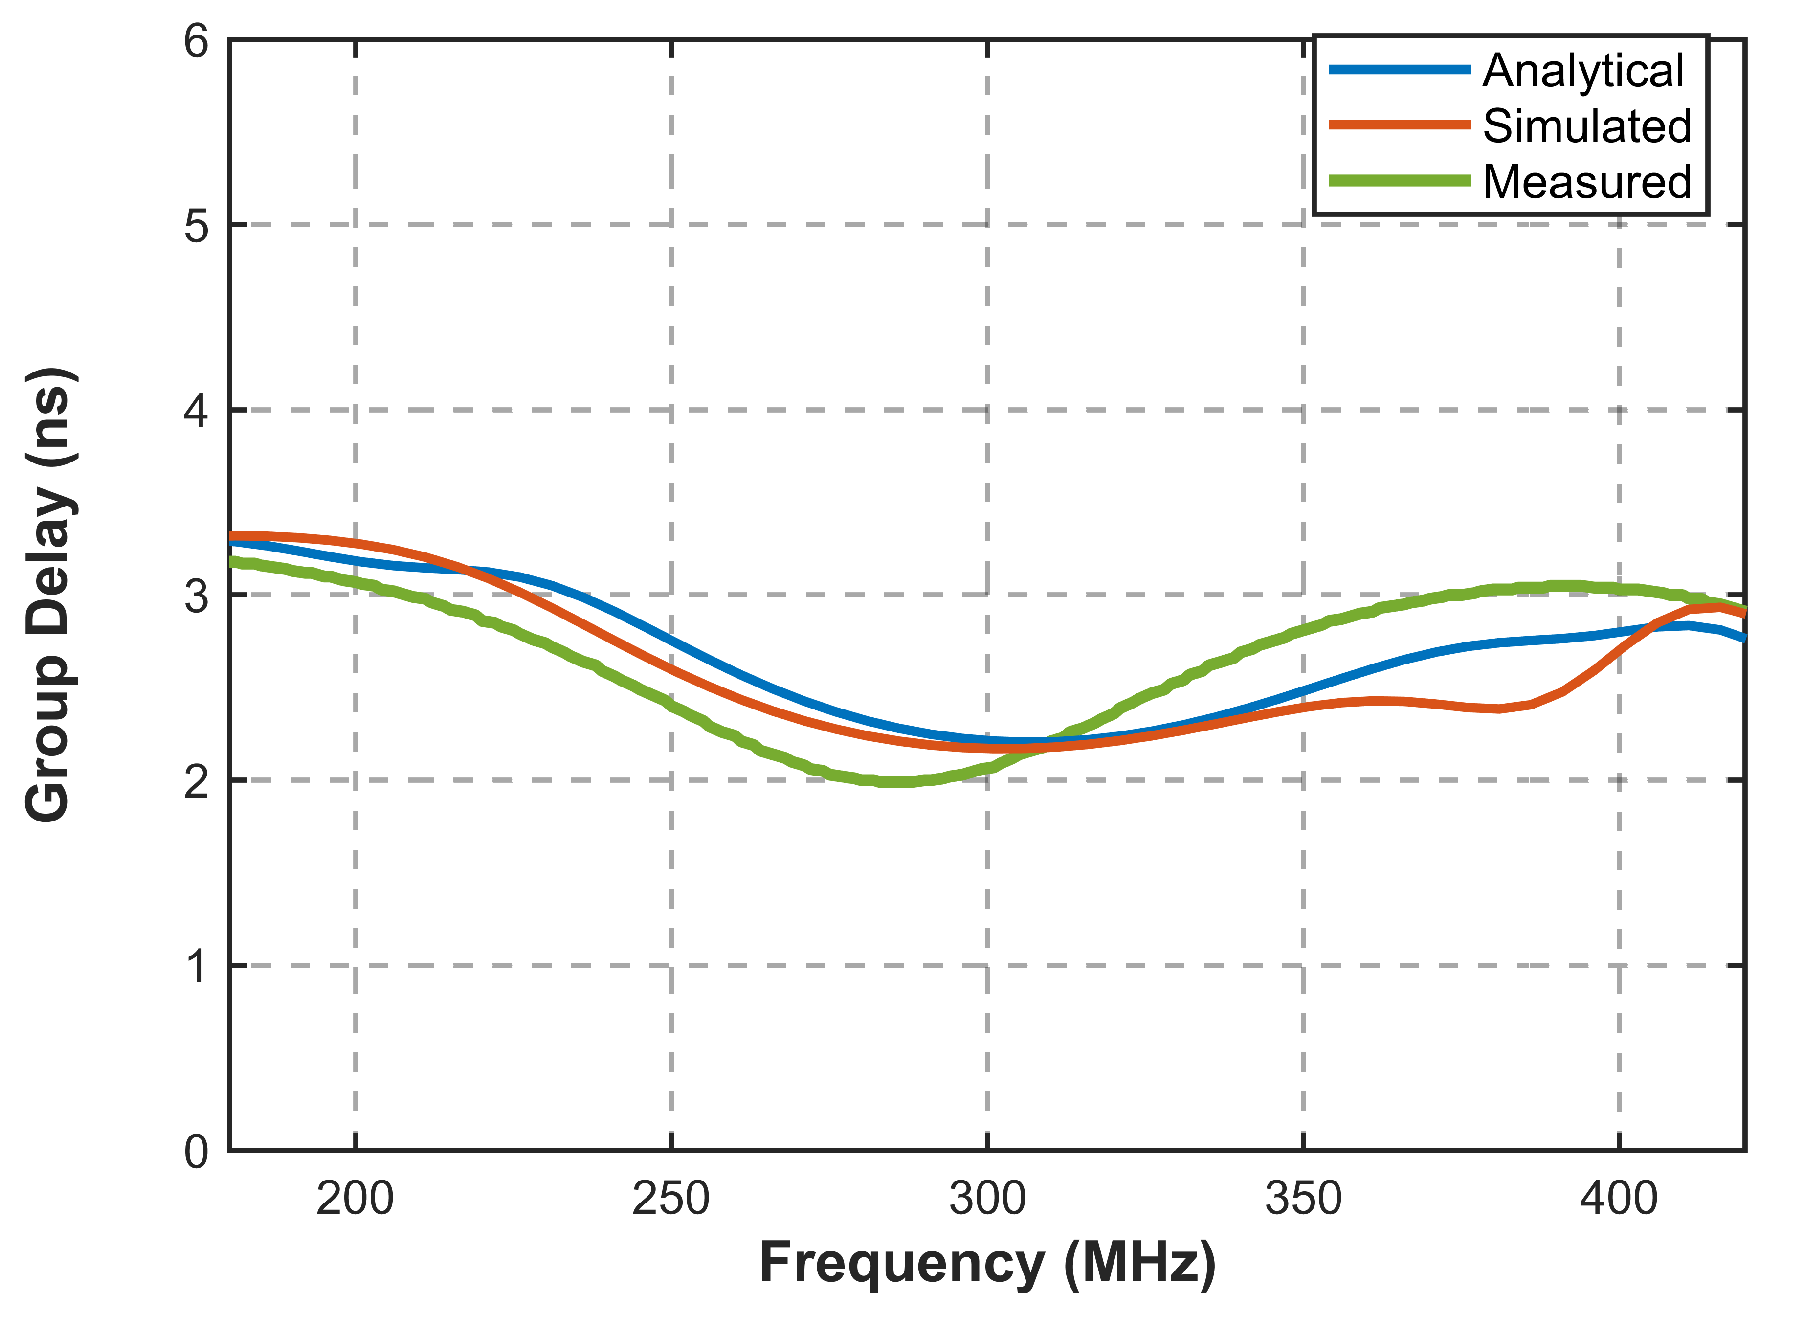
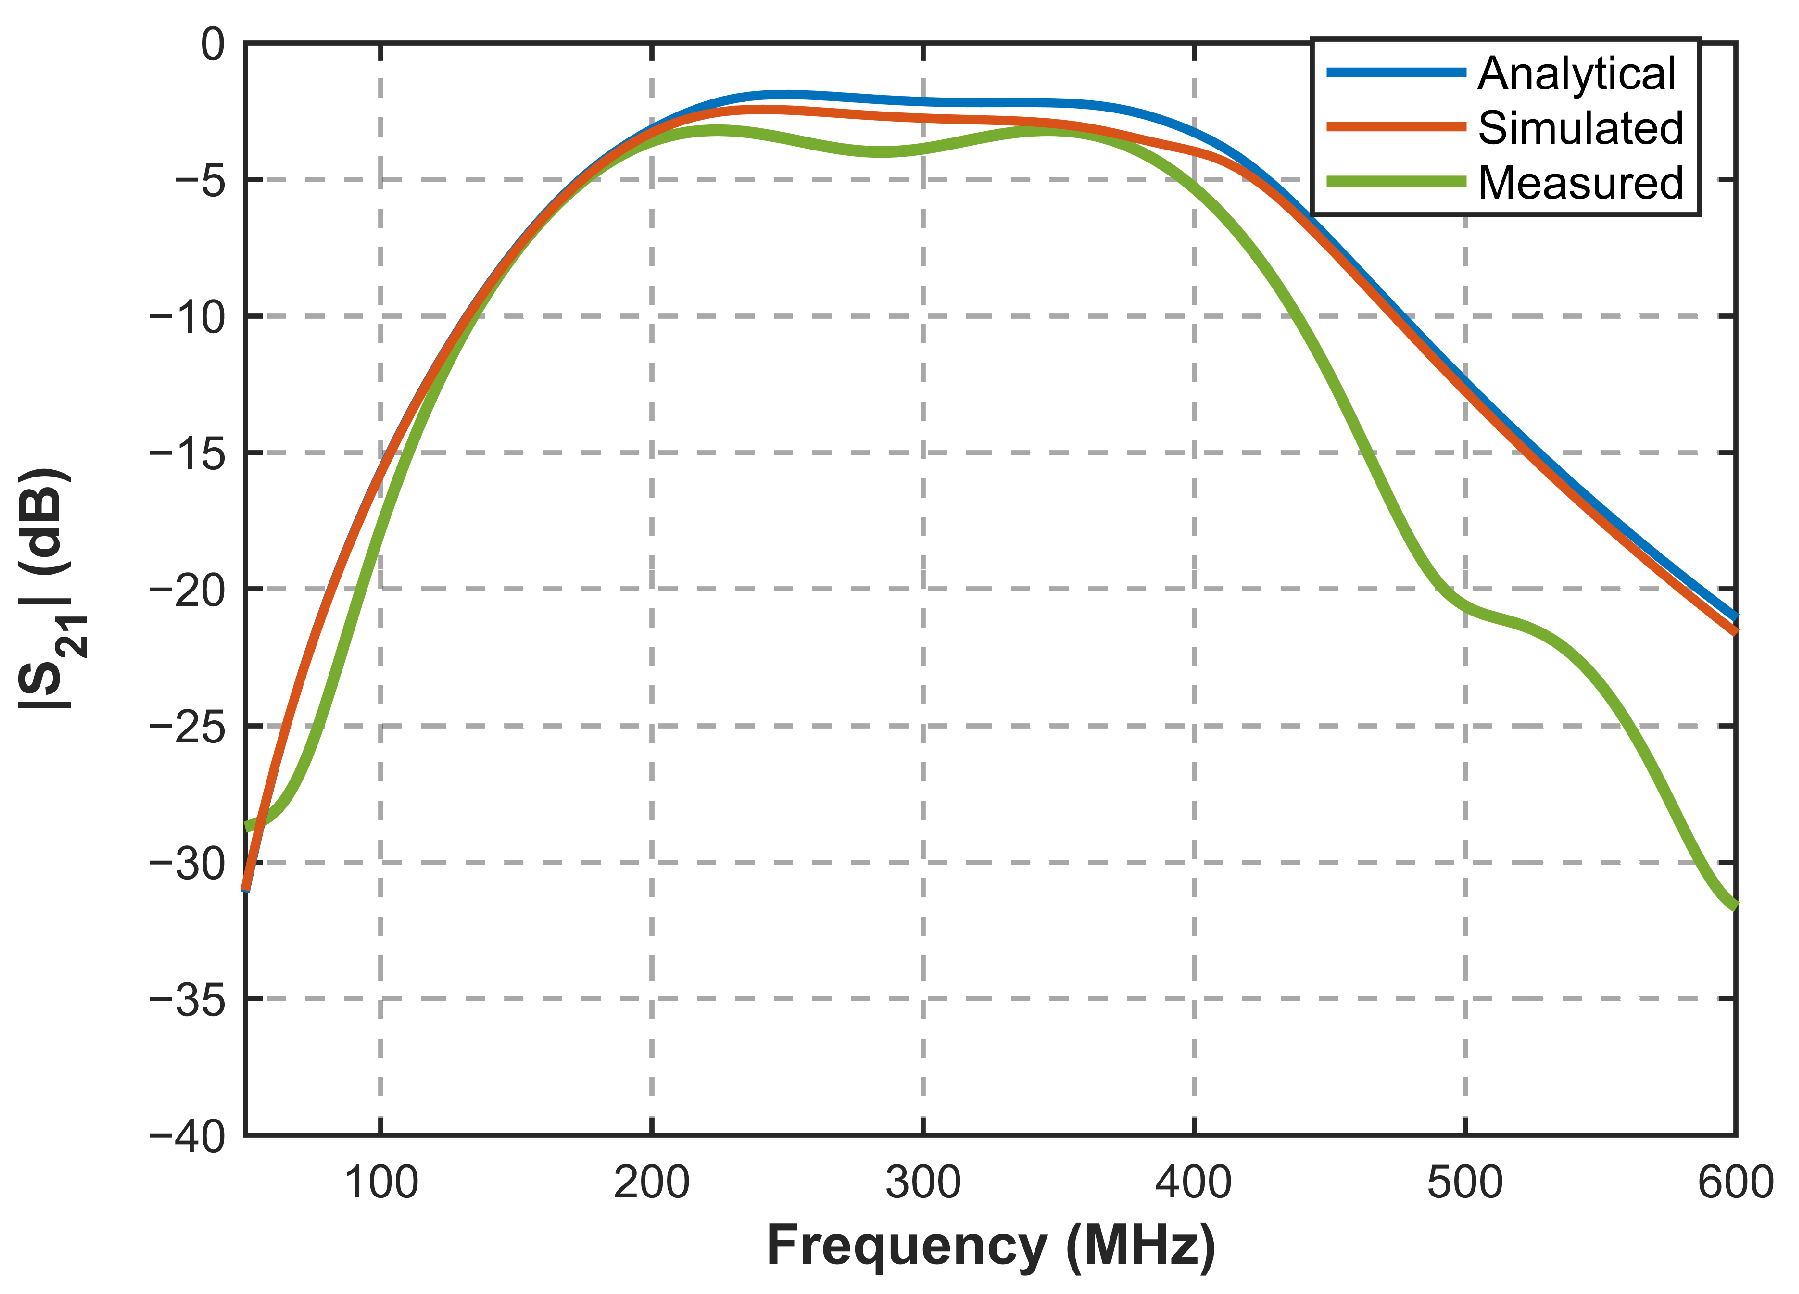
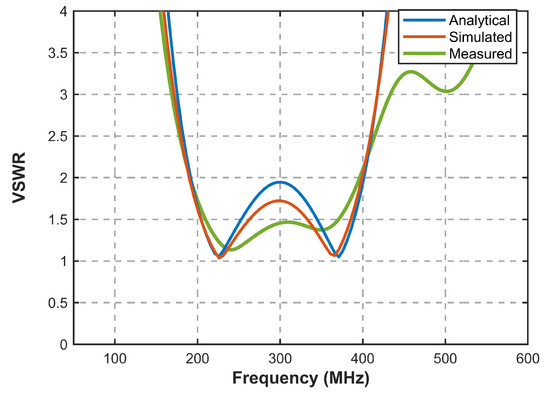
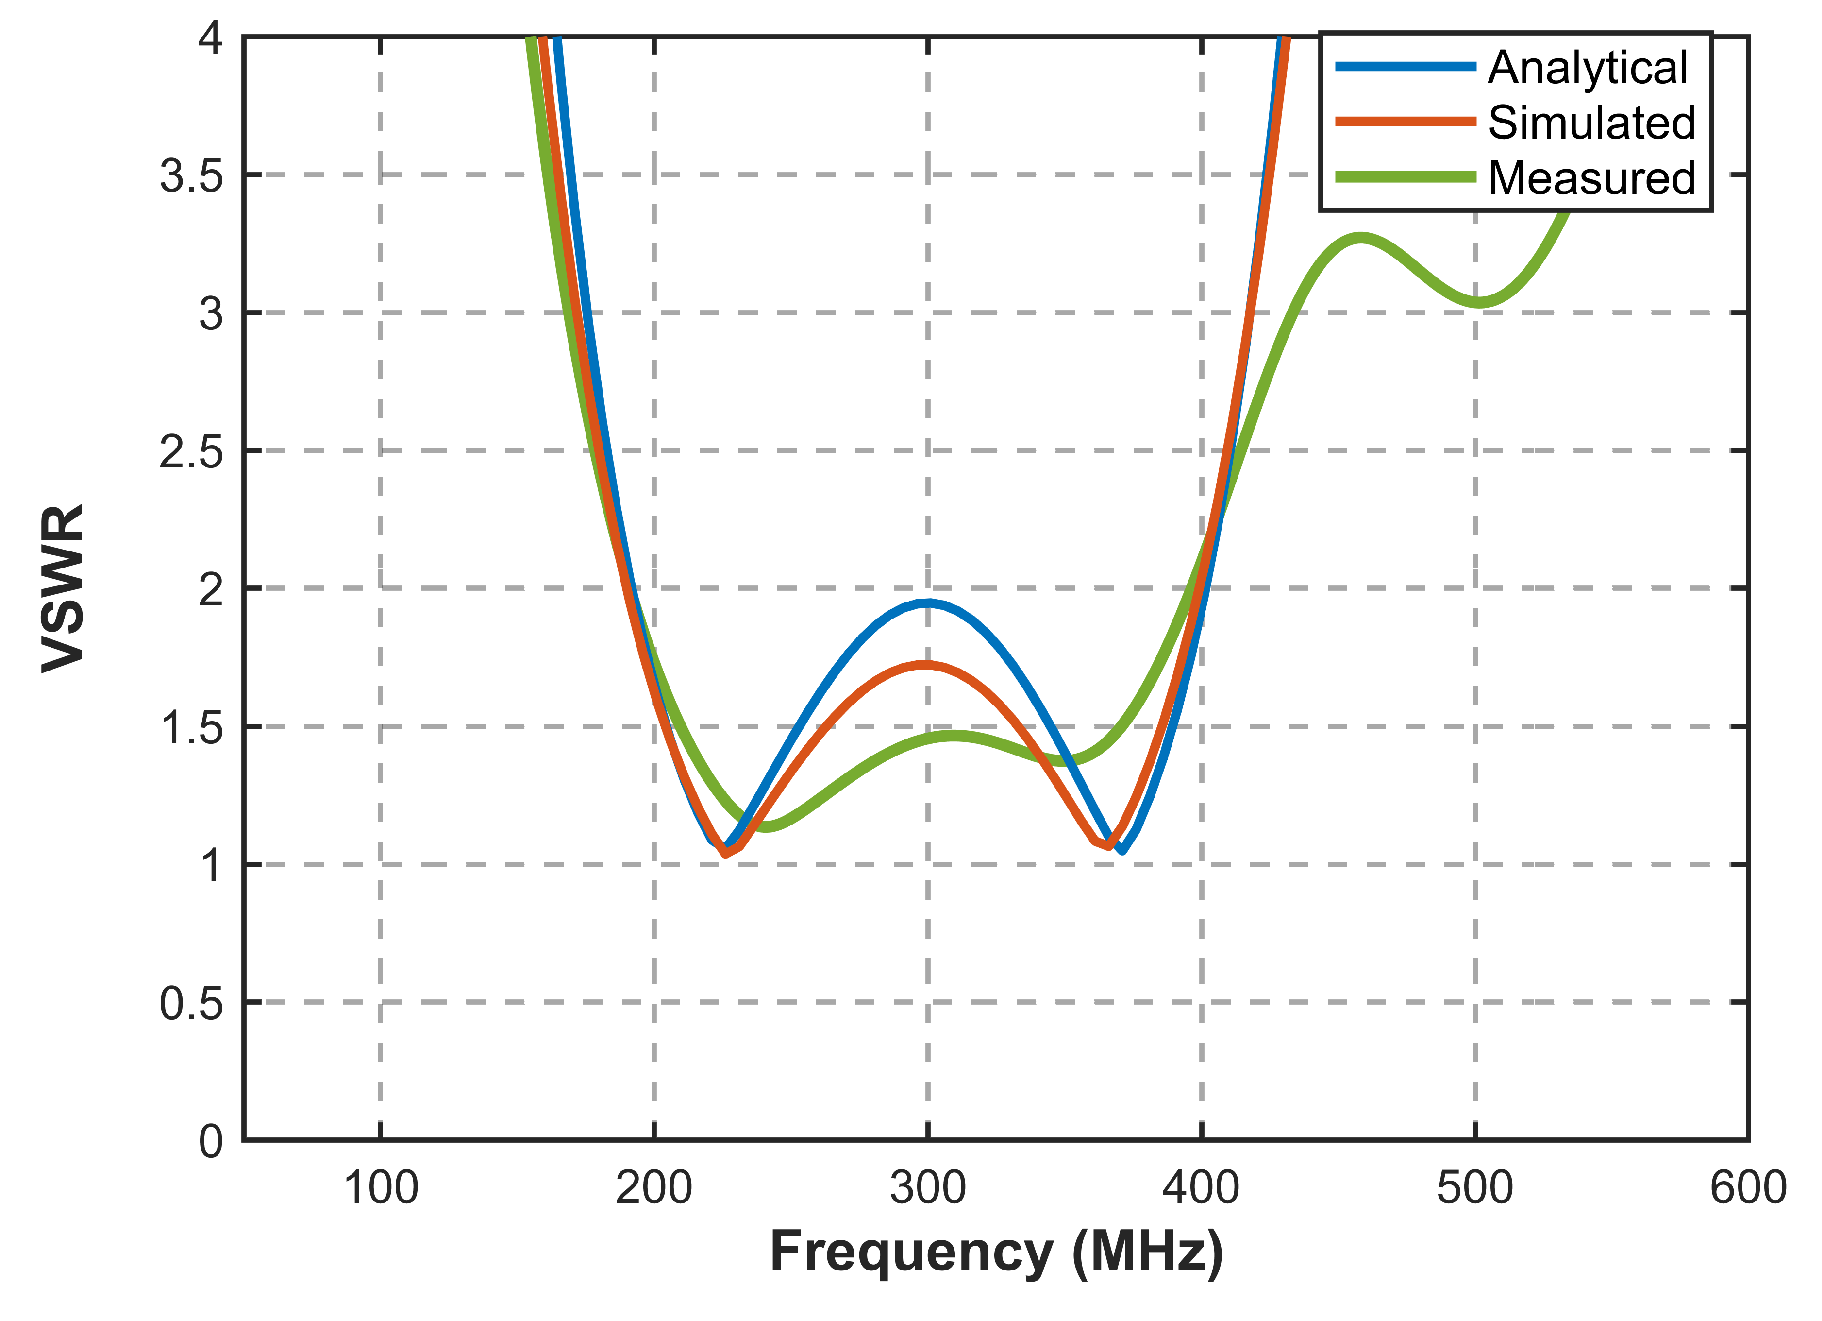
Figure 23, Figure 24 and Figure 25 compare the calculated, simulated, and measured results in terms of group delay, , and voltage standing-wave ratio (VSWR). Within the 200–400 MHz target band, the group delay is effectively flattened and remains between 1.99 ns and 3.07 ns, showing good agreement with the theoretical prediction and thereby validating the ability of NGDC to compensate the filter dispersion. Compared with the calculated and simulated results, the measured IL is higher by approximately 1–2 dB, which can be mainly attributed to SMA connector losses, PCB dielectric losses, and additional series resistance introduced by manual soldering. Nevertheless, the passband gain flatness remains satisfactory, and the out-of-band rejection meets the selectivity requirements of the RF front-end. Meanwhile, good impedance matching is maintained, with the measured VSWR staying below 2.0 across the passband. These results confirm that the proposed multi-parameter tuning strategy achieves group delay compensation while preserving excellent impedance matching.
Figure 23.
Comparison of group delay results.
Figure 24.
Comparison of results.
Figure 25.
Comparison of VSWR results.
5.2. Performance Comparison and FoM Analysis
Given the specific group delay tolerance of the phase-sensitive radar system, the design philosophy of this work is to ensure that the compensated system meets the prescribed engineering thresholds rather than pursuing unnecessarily stringent group delay flatness. Therefore, to objectively assess the intrinsic performance of the proposed NGDC topology, we adopt the figure of merit (FoM)—a commonly used metric in NGD circuit design—as the primary evaluation index [32]. The FoM quantitatively captures the trade-off among the NGD magnitude at the resonant frequency, , the effective NGD bandwidth, , and the forward transmission coefficient at , :
Table 5 compares the proposed circuit with representative designs reported in the literature. For a fair comparison, and are extracted at the frequency where each design achieves its most negative group delay (the NGD peak). The results show that, enabled by the multi-parameter tuning capability, the proposed NGDC operating in the asynchronous-resonance mode attains an FoM of 0.063, which is higher than those of the compared designs. This indicates that the proposed circuit provides sufficient delay-compensation magnitude while maintaining low insertion loss. Such a balance is particularly important for phase-sensitive radar systems because it not only improves phase linearity, but also helps preserve a sufficient SNR for extracting weak echoes from deep polar ice.
Table 5.
Performance comparison with other designs.
It should be noted that the FoM comparison in Table 5 serves as a general benchmark for the trade-off between NGD magnitude, bandwidth, and insertion loss. However, as these designs operate across diverse frequency bands, their specific design constraints vary significantly. For instance, achieving a high FoM in the VHF/UHF band is particularly challenging due to the requirement for a large fractional bandwidth and the need to maintain low insertion loss for radar sensitivity. While some high-frequency designs may offer larger absolute NGD values, they often suffer from excessive loss or narrow operating bands.
5.3. System-Level Ranging Error Evaluation
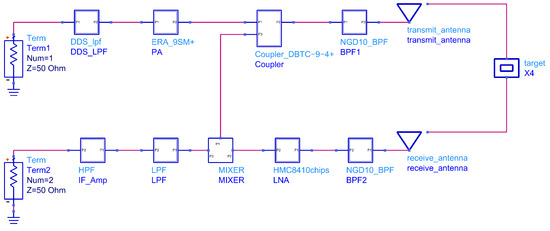
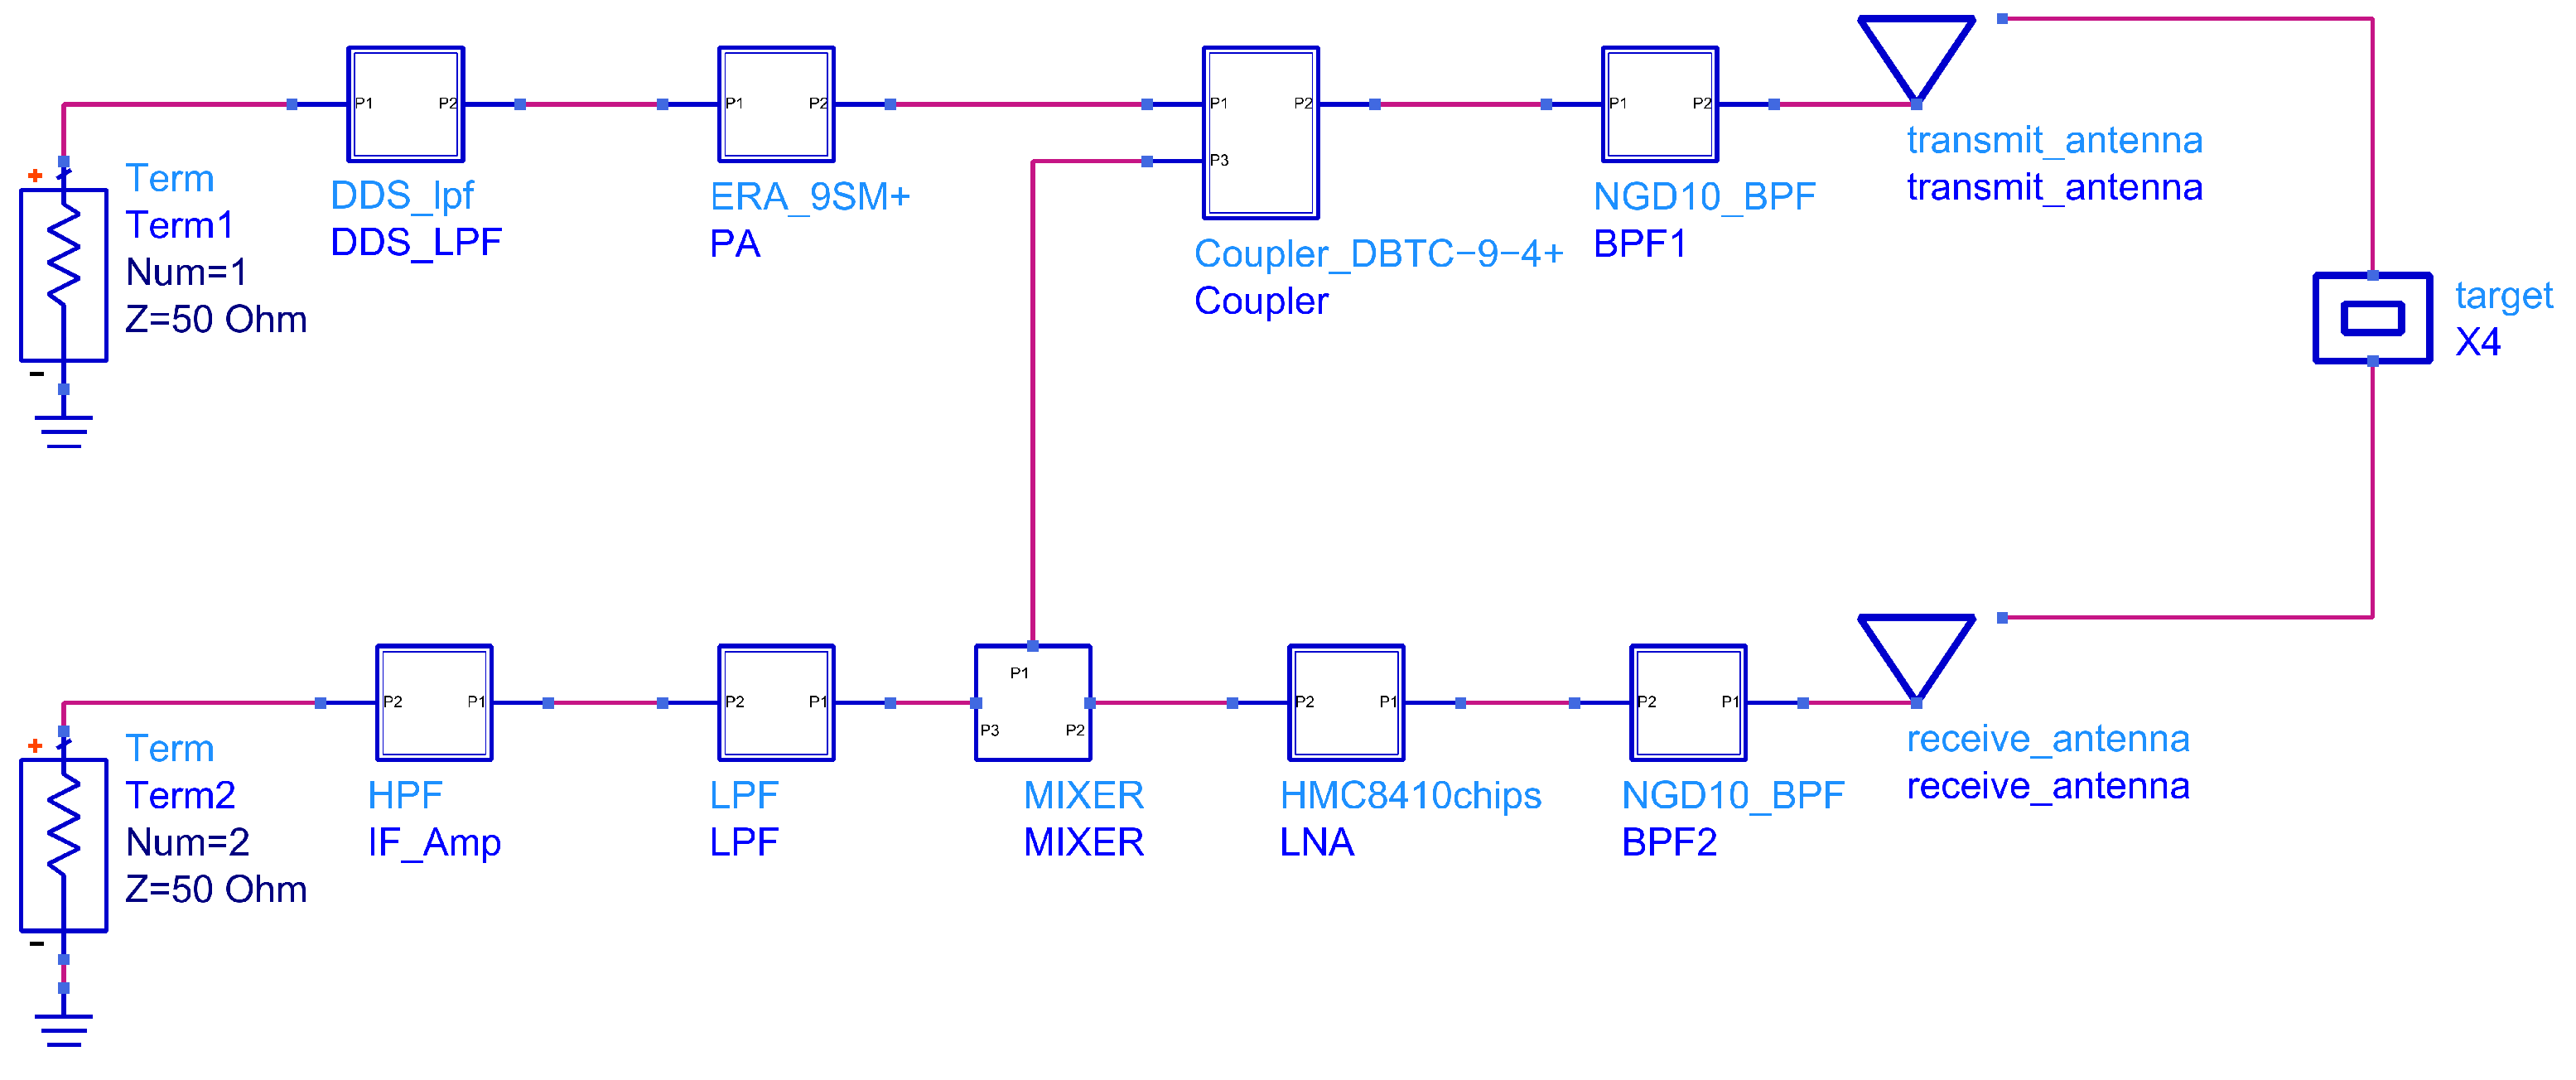
To bridge the gap between component-level characterization and full-system performance, a high-fidelity circuit-system co-simulation framework was established in ADS, as depicted in Figure 26. This model integrates the measured S-parameters of the fabricated NGDC prototype with manufacturer-validated models for commercial off-the-shelf (COTS) components. Such an approach ensures that the simulation captures realistic RF interactions, including impedance mismatch and the double-pass group delay accumulation characteristic of radar transceivers.
Figure 26.
Schematic of the radar transceiver link in ADS.
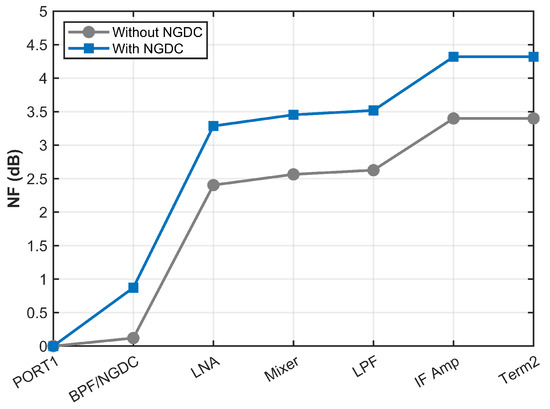
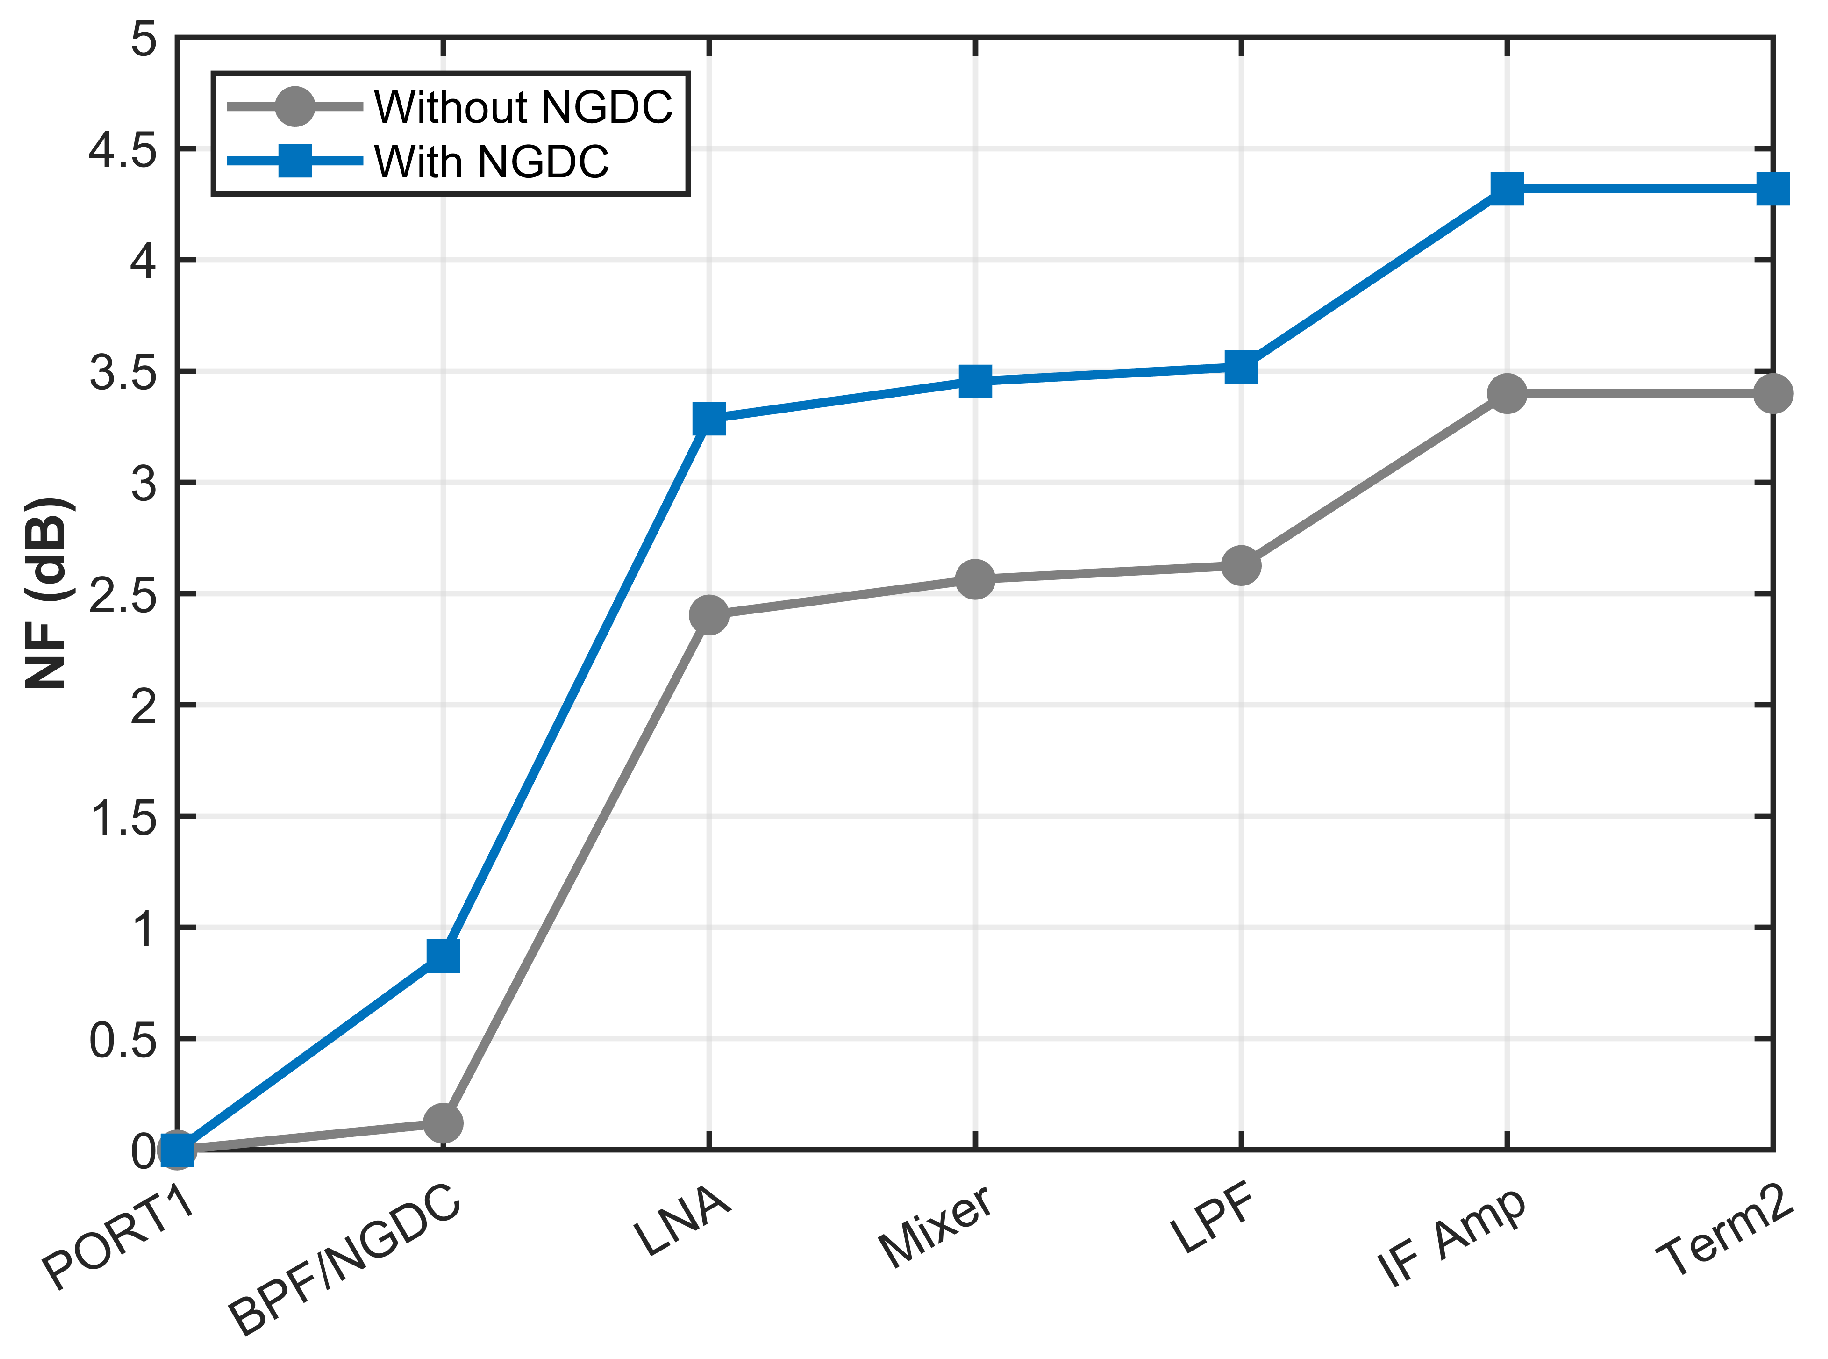
A primary concern in hardware-level compensation is the potential degradation of system sensitivity due to the NGDC’s insertion loss. Figure 27 illustrates the comparative cascaded noise figure (NF) analysis of the receiver link to quantify this effect. The original system exhibits a total cascaded NF of 3.4 dB, which increases to 4.3 dB upon the integration of the NGDC. Consequently, the system’s NF and overall sensitivity degrade by only 0.9 dB, and the signal-to-noise ratio (SNR) remains robust. This confirms that the trade-off made to achieve superior phase linearity is highly reasonable and well within the acceptable margins for radar performance.
Figure 27.
Cascaded NF comparison.
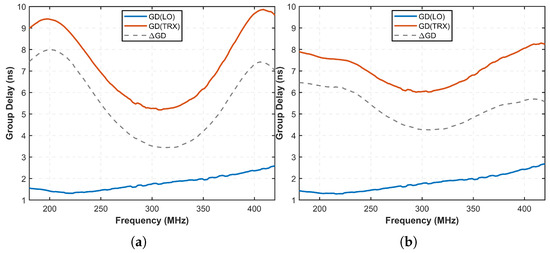
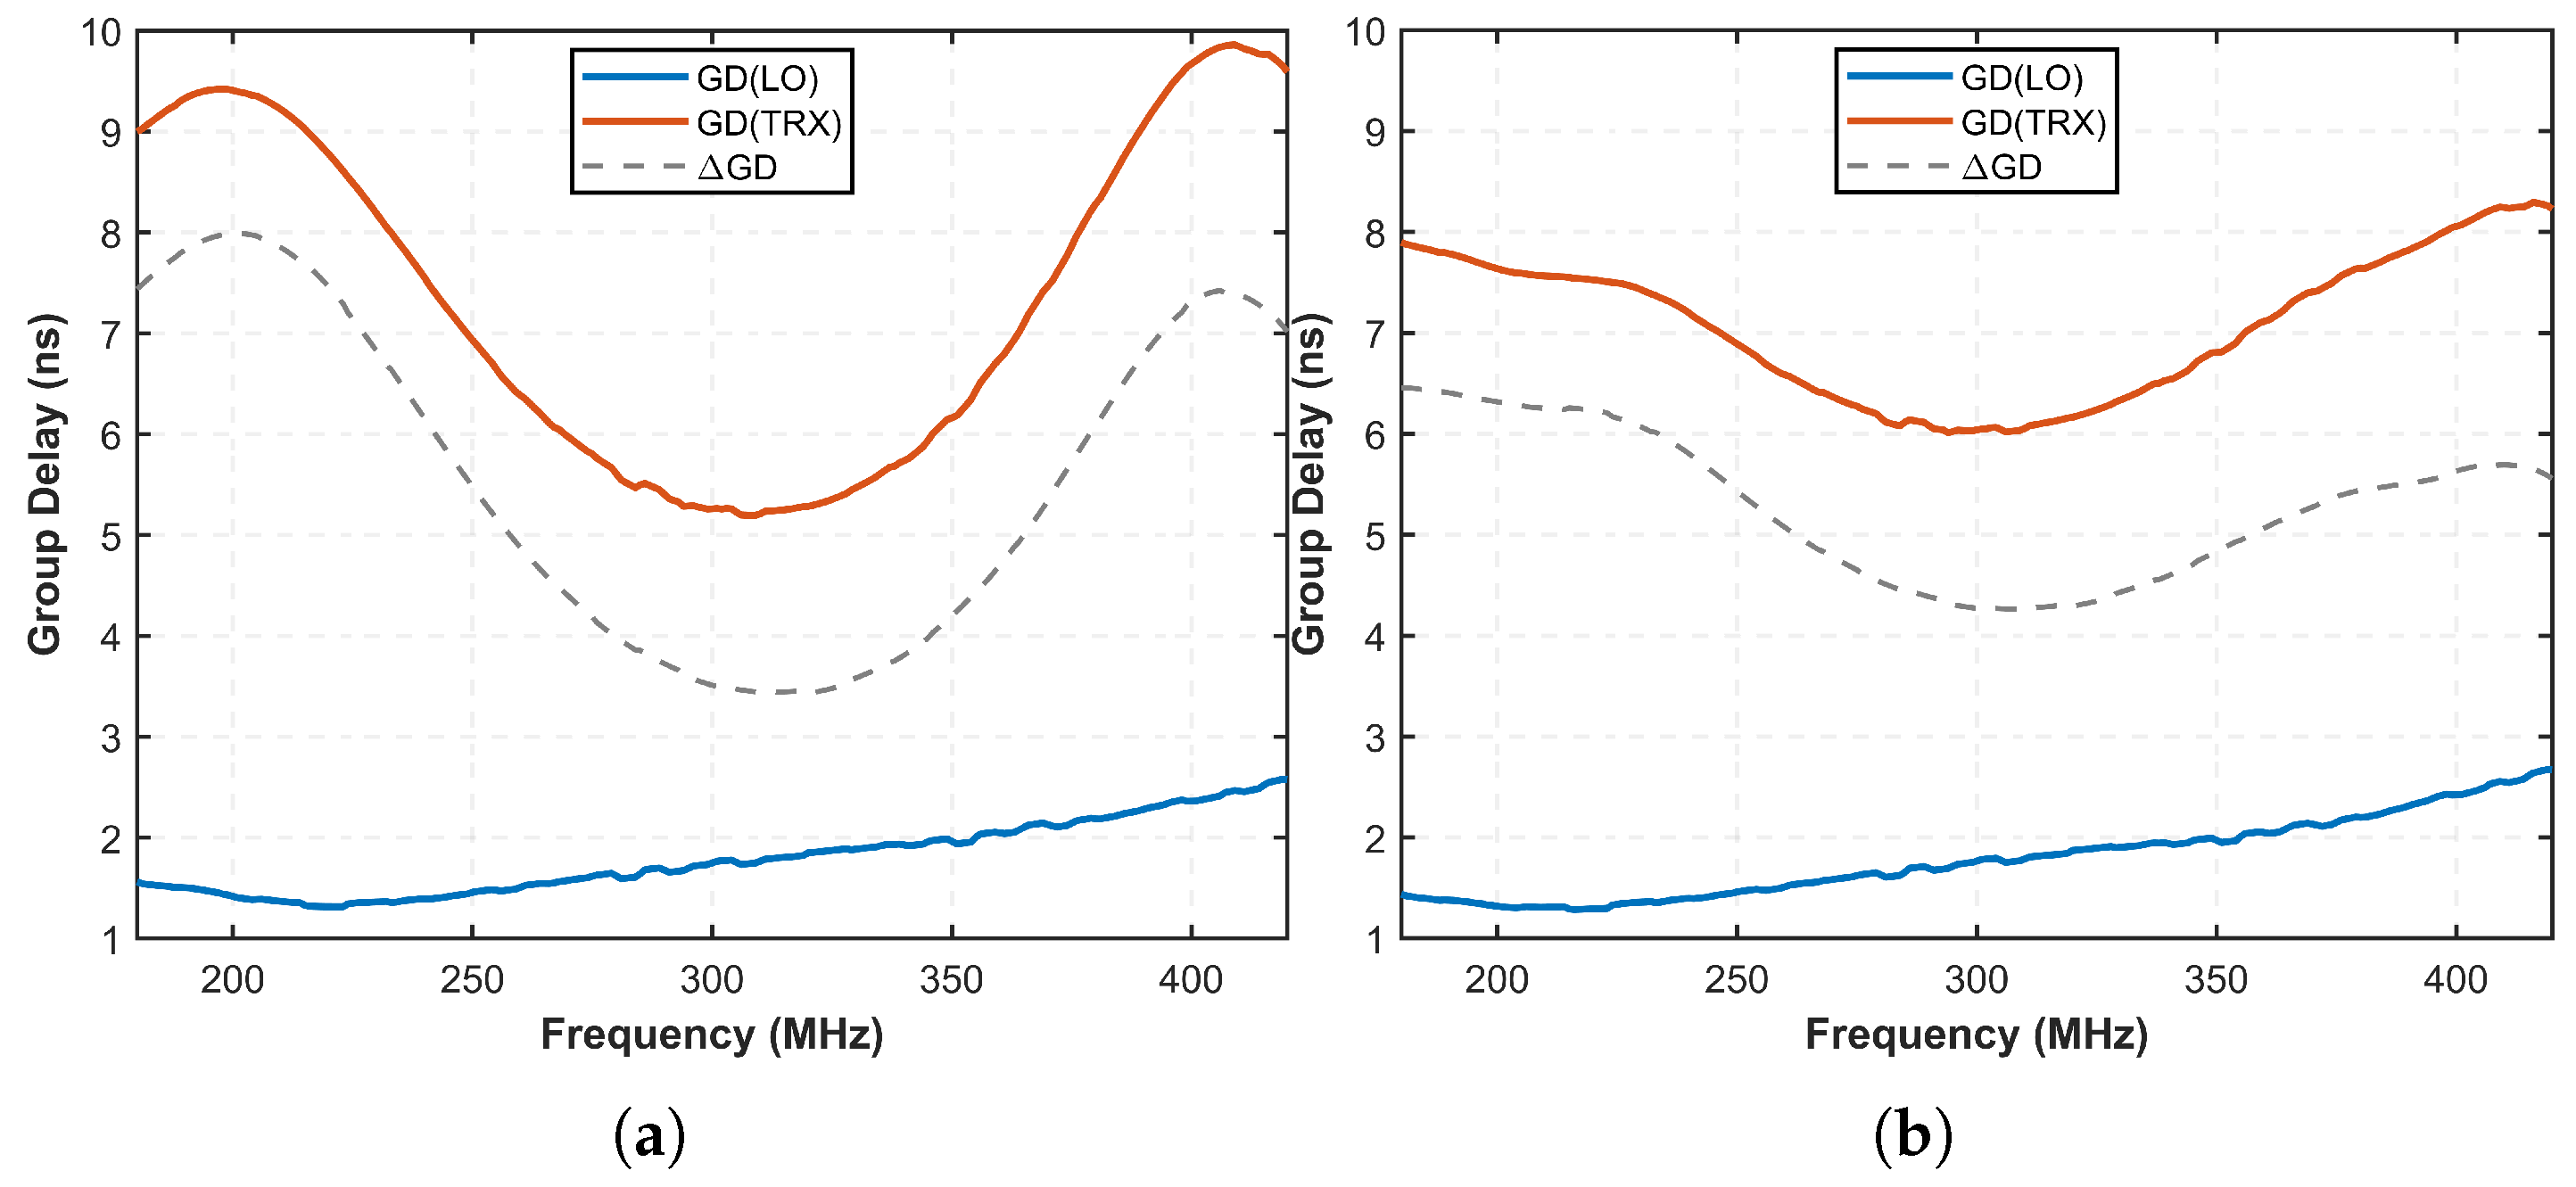
The efficacy of the NGDC in counteracting link dispersion is further substantiated in Figure 28. In the unoptimized configuration, the TRX path manifests significant group delay fluctuations, leading to a severe frequency-dependent mismatch () relative to the LO path, with a peak-to-peak variation of approximately 4.55 ns. In contrast, the optimized link successfully suppresses this variation, reducing the total fluctuation to 2.05 ns. This hardware-level equalization minimizes phase distortion within the beat signal, thereby providing the requisite signal integrity to ensure millimeter-level ranging precision in phase-sensitive radar applications.
Figure 28.
Simulated link group delay: (a) Unoptimized. (b) Optimized.
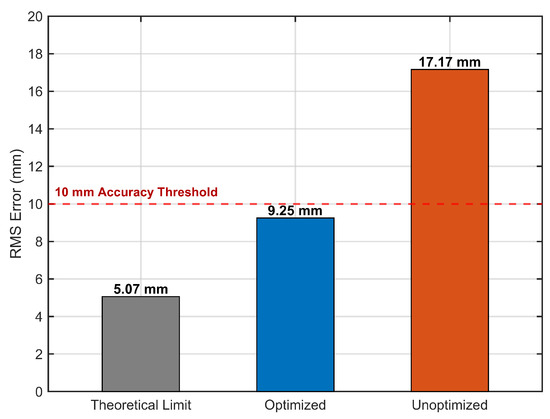
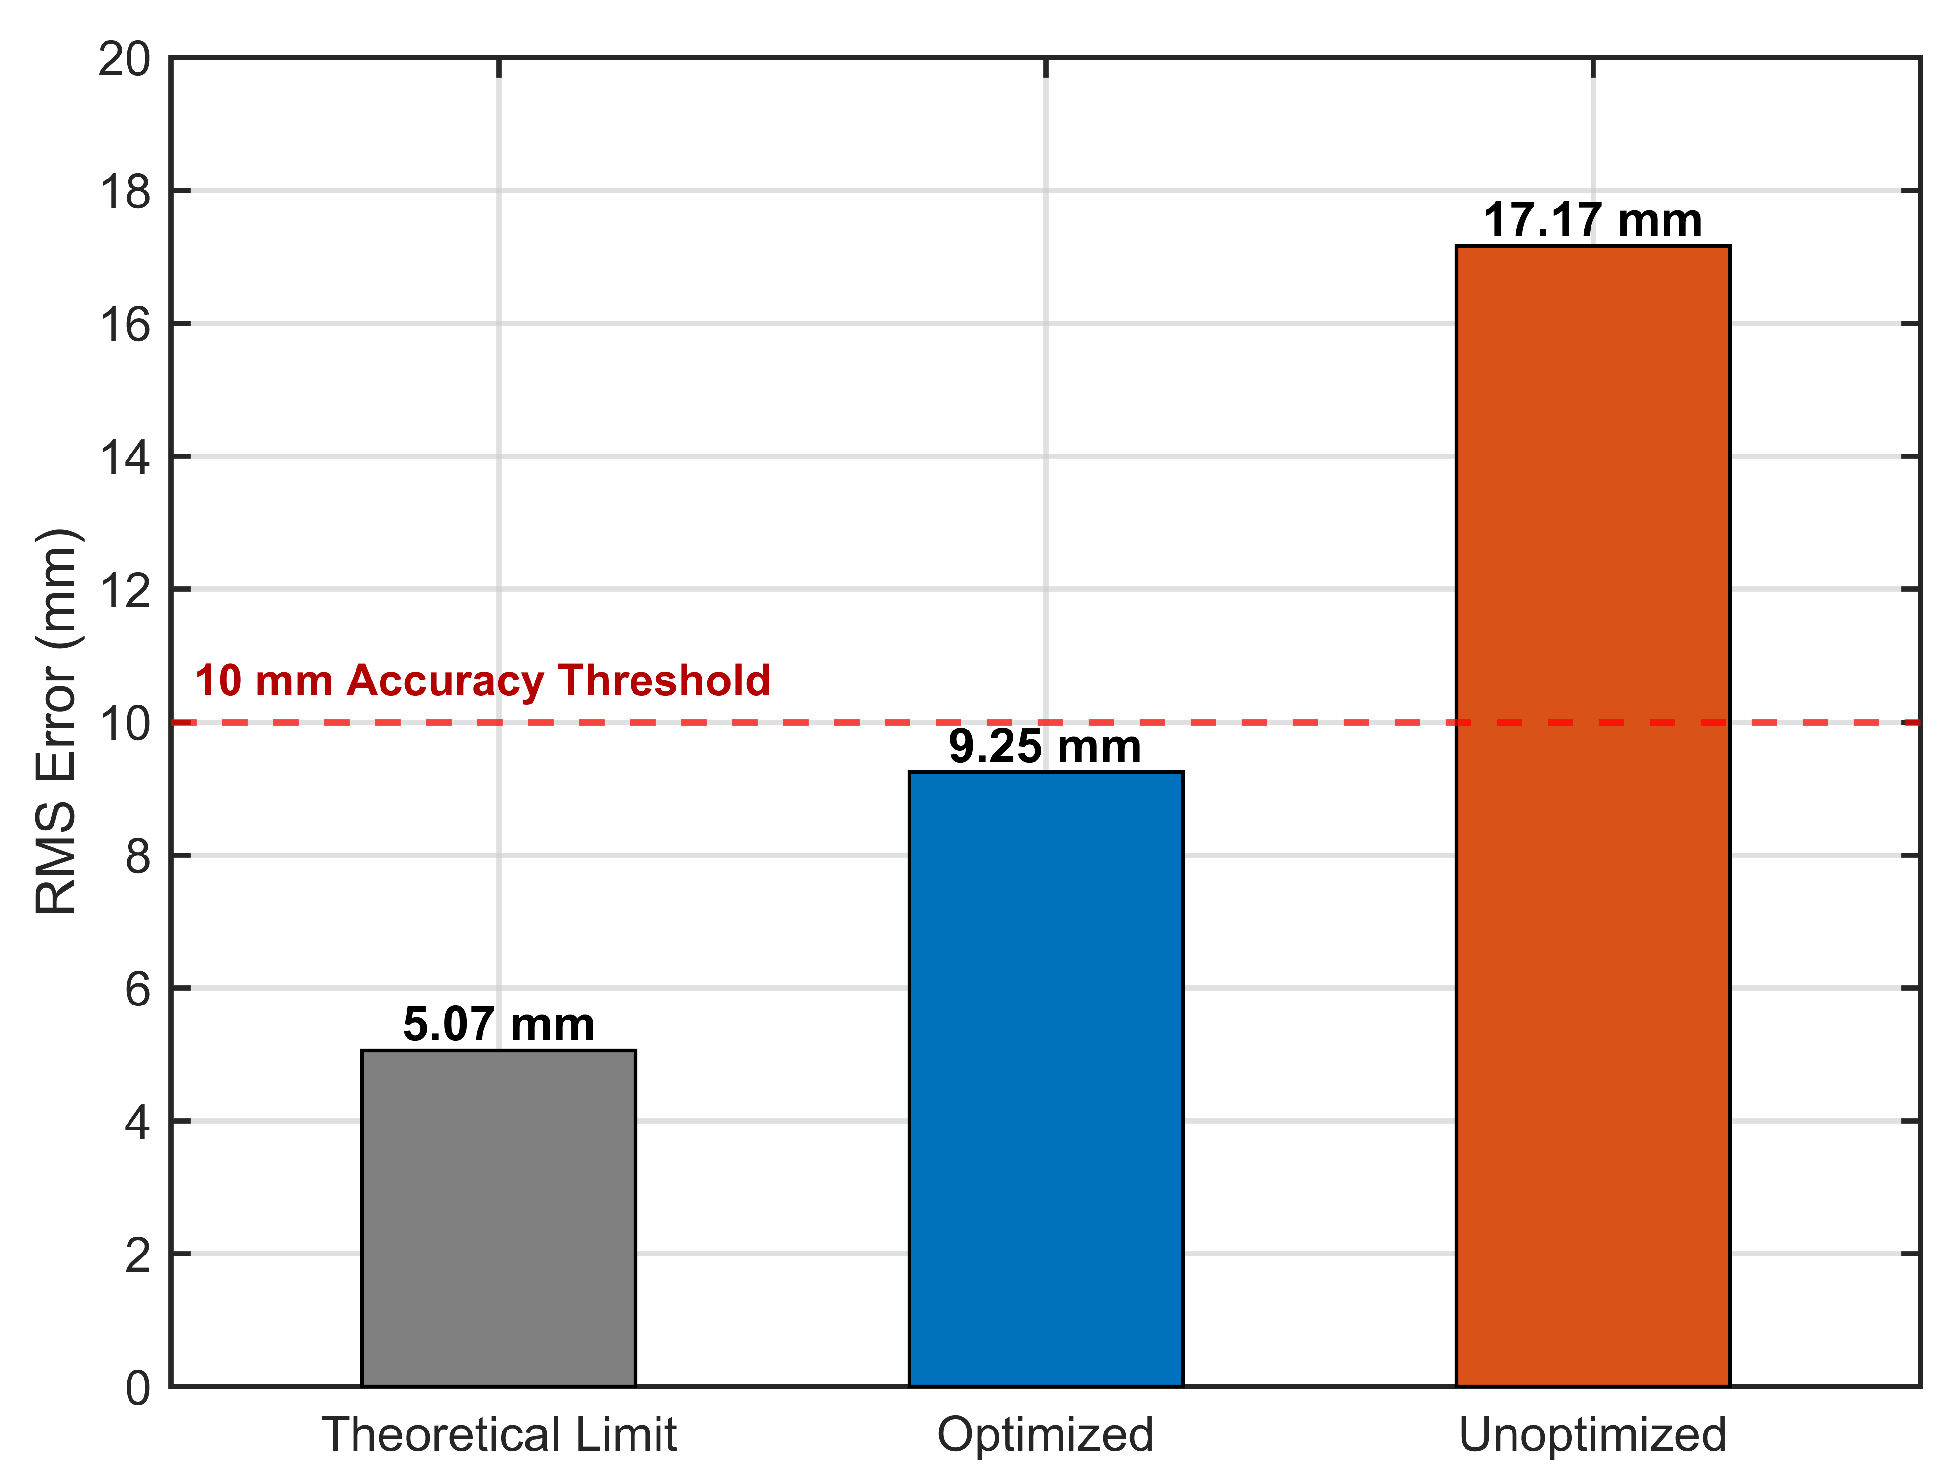
Figure 29 presents a quantitative comparison of the phase-sensitive radar ranging accuracy under different group delay conditions. To establish the theoretical limit of the system precision, we first analyze the ranging error induced by SNR. The relationship between SNR and the associated phase noise can be expressed as follows [33,34]:
Further, it can be obtained that
where is the wavelength in ice and SNR is the linear value of the signal-to-noise ratio. In a 16 dB SNR environment, the theoretical limit is calculated to be 5.07 mm (as shown by the gray bars in the figure).
Figure 29.
Phase-sensitive radar ranging accuracy at dB under different group delay conditions.
Previous simulation results indicate that, prior to optimization, the total link group delay mismatch () exhibited a peak-to-peak fluctuation of approximately 4.55 ns. Under these dispersive conditions, with an SNR of 16 dB, the system’s RMS ranging error reaches 17.17 mm, exceeding the 10 mm accuracy threshold. This confirms that the cumulative group delay mismatch across the transceiver link is the dominant factor leading to the failure of high-precision detection. After integrating the NGDC for hardware-level compensation, the link characteristics are substantially improved, with the fluctuation reduced to 2.05 ns. Consequently, the system’s RMS error is significantly decreased to 9.25 mm, effectively mitigating the probability of half-wavelength errors. The achieved ranging accuracy satisfies the target requirement (<10 mm) and closely approaches the theoretical limit under the same SNR condition.
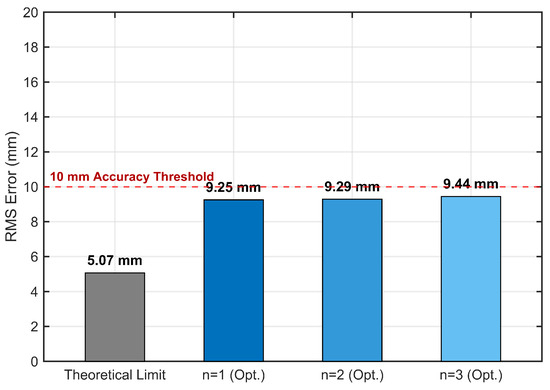
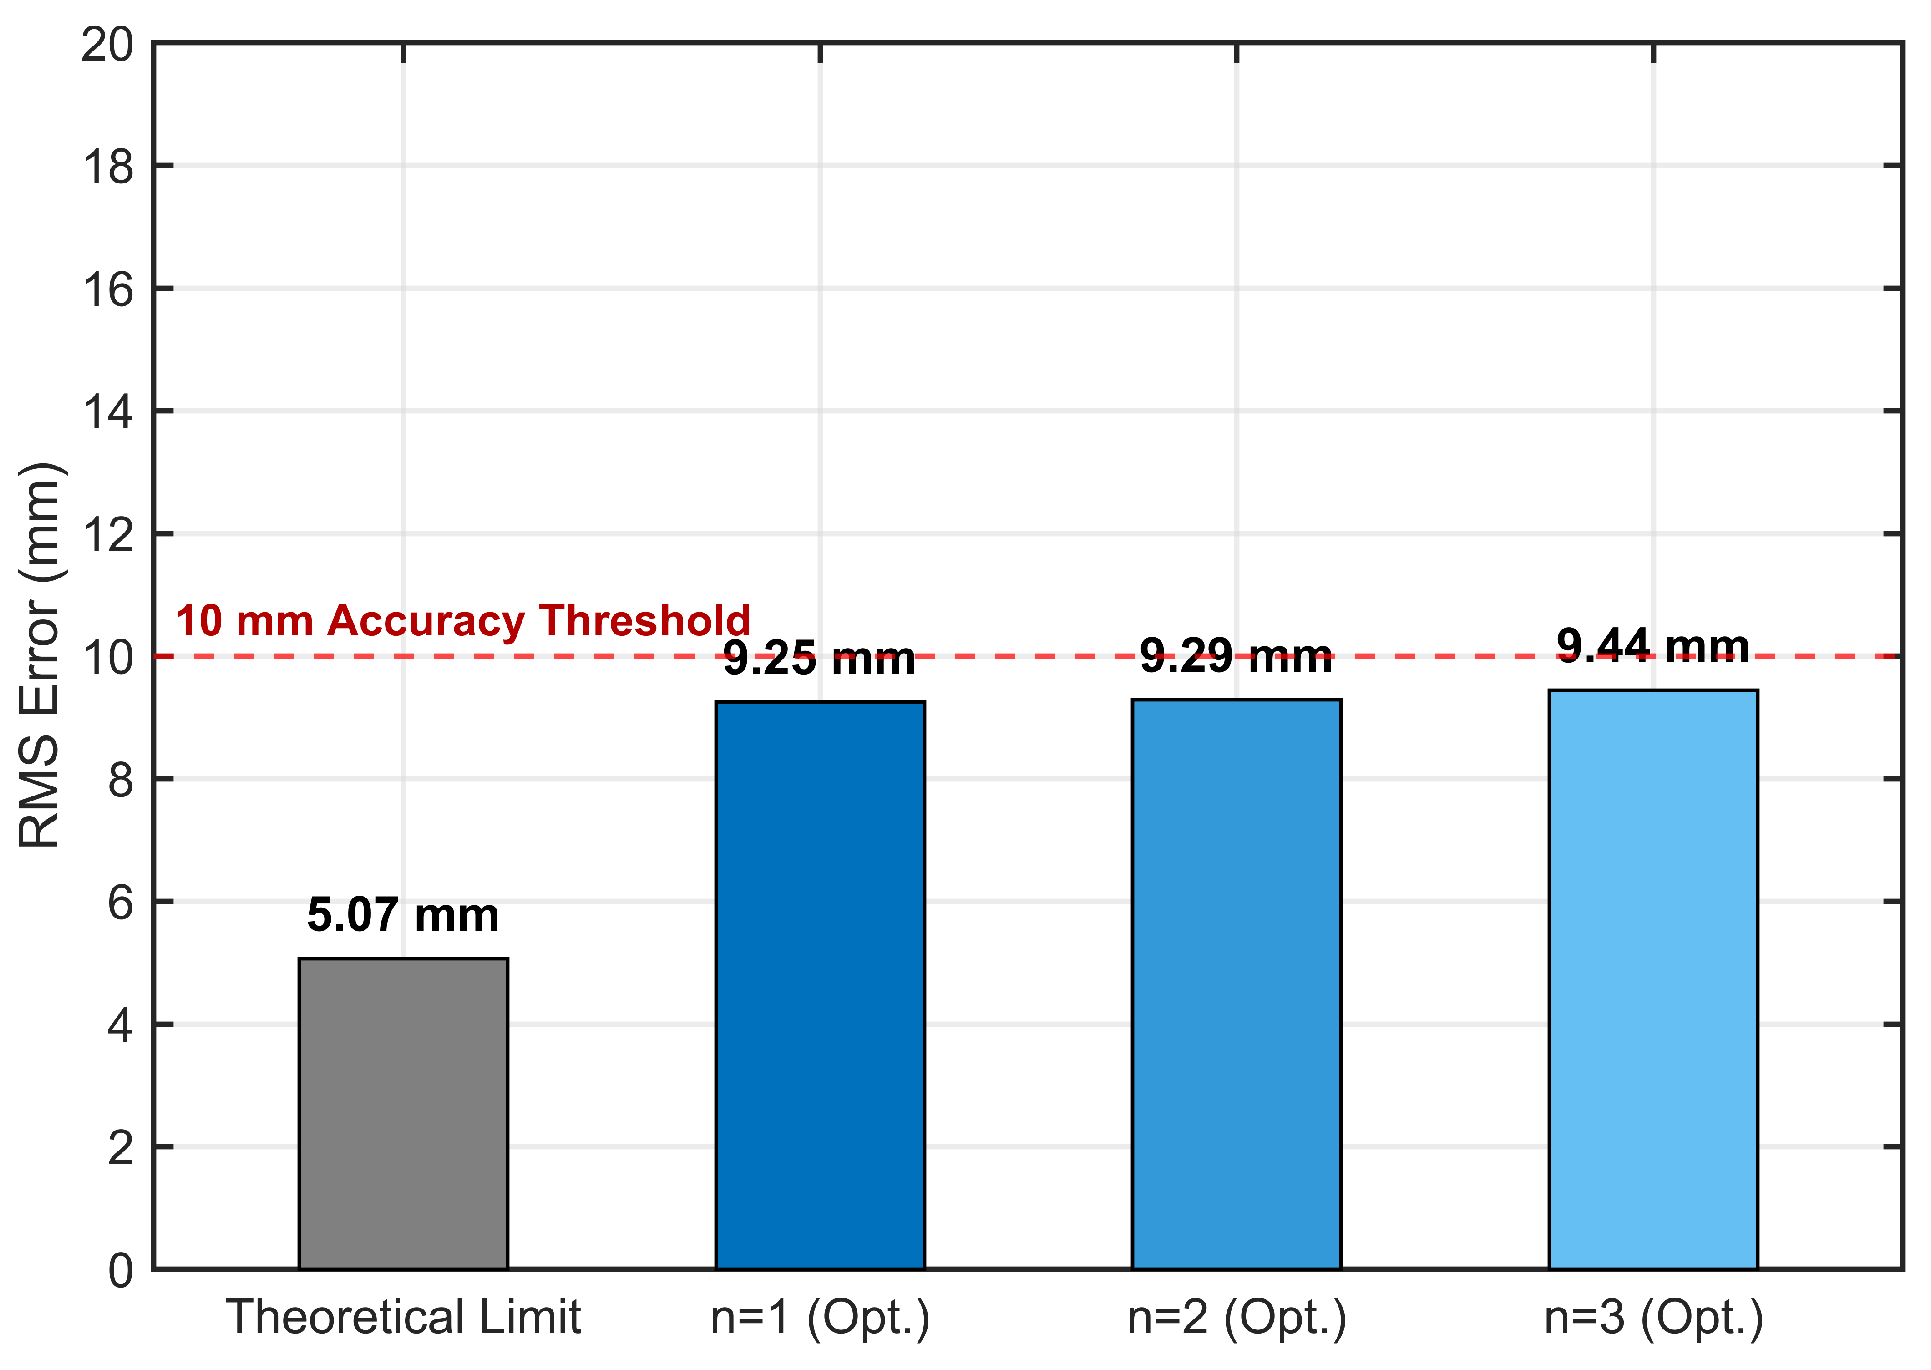
To further investigate the impact of higher-order group delay ripples on the system’s precision, the RMS ranging error was re-evaluated using the 2nd- and 3rd-order fitting parameters of the optimized NGDC. As shown in Figure 30, the ranging error remains robustly below the 10 mm accuracy threshold across all fitting orders, with values ranging from 9.25 mm to 9.44 mm. The marginal variation in error between the and models confirms that the primary ranging bias is driven by the fundamental group delay fluctuation, while the higher-order components have a negligible effect on the phase-sensitive ranging correction. These results demonstrate that the proposed hardware compensation scheme is effective and reliable.
Figure 30.
Comparison of RMS ranging error across different harmonic fitting orders.
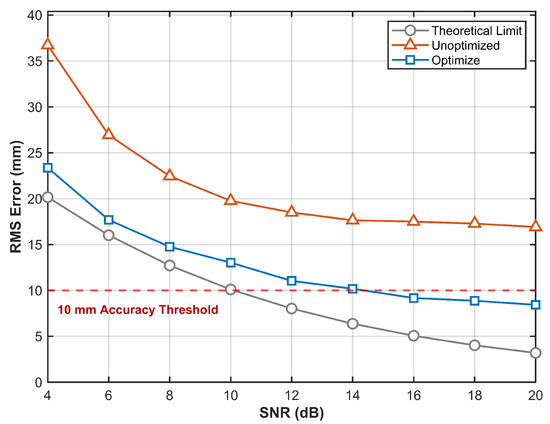
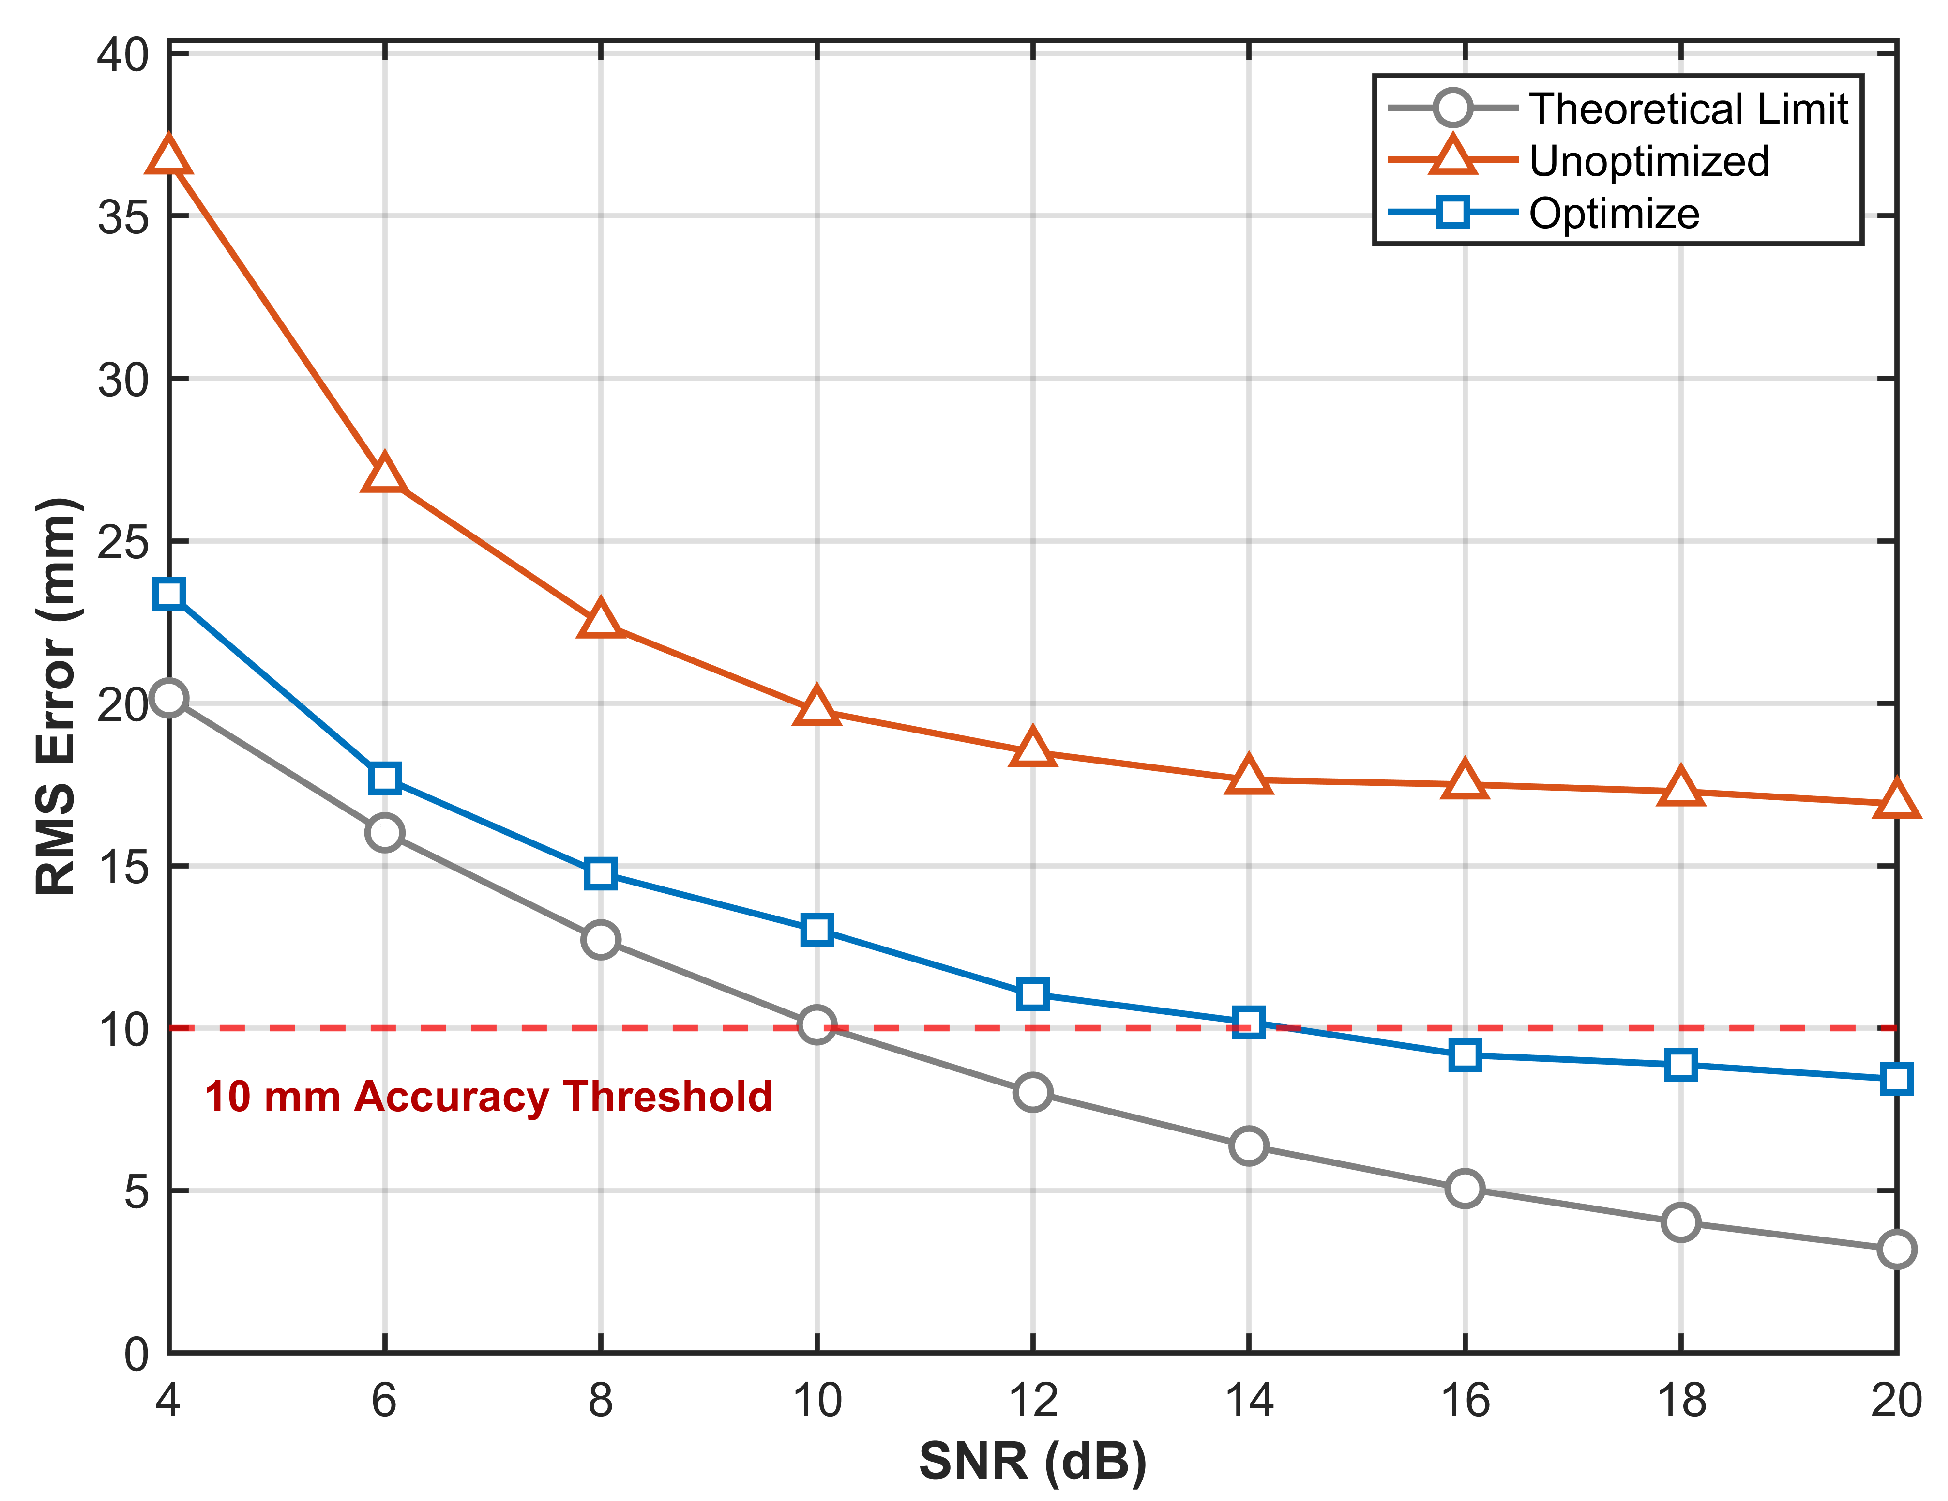
Figure 31 summarizes the simulated RMS range error as a function of the signal-to-noise ratio (SNR) for the theoretical limit, the unoptimized system, and the optimized system. As SNR increases, the RMS range error decreases markedly for both systems, which is consistent with the preceding analysis: a higher SNR suppresses phase ambiguity during IF signal phase estimation, thereby reducing the occurrence of large-error outliers such as half-wavelength errors. The theoretical-limit curve follows the expected statistical trend, decreasing monotonically with increasing SNR and crossing the 10 mm accuracy threshold at approximately . In contrast, in the unoptimized system, severe group delay variations dominate the phase distortion; consequently, even at , the RMS error saturates at about 17 mm and consistently fails to meet the accuracy requirement. With the proposed hardware optimization scheme, the performance of the optimized system is substantially improved: although residual hardware nonlinearity introduces an approximately offset of about 5 mm relative to the theoretical limit, the RMS range error is reduced below 10 mm when . These results demonstrate that hardware-level group delay flattening is a prerequisite for overcoming systemic accuracy bottlenecks in phase-sensitive radar design.
Figure 31.
Distribution of ranging accuracy versus SNR.
5.4. Scalability and Feasibility Analysis for Higher-Frequency Applications
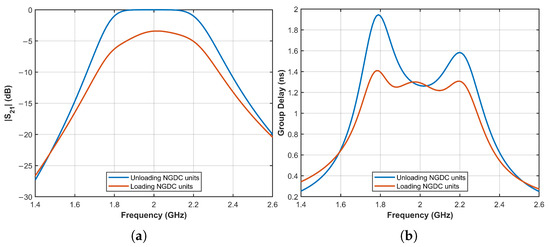
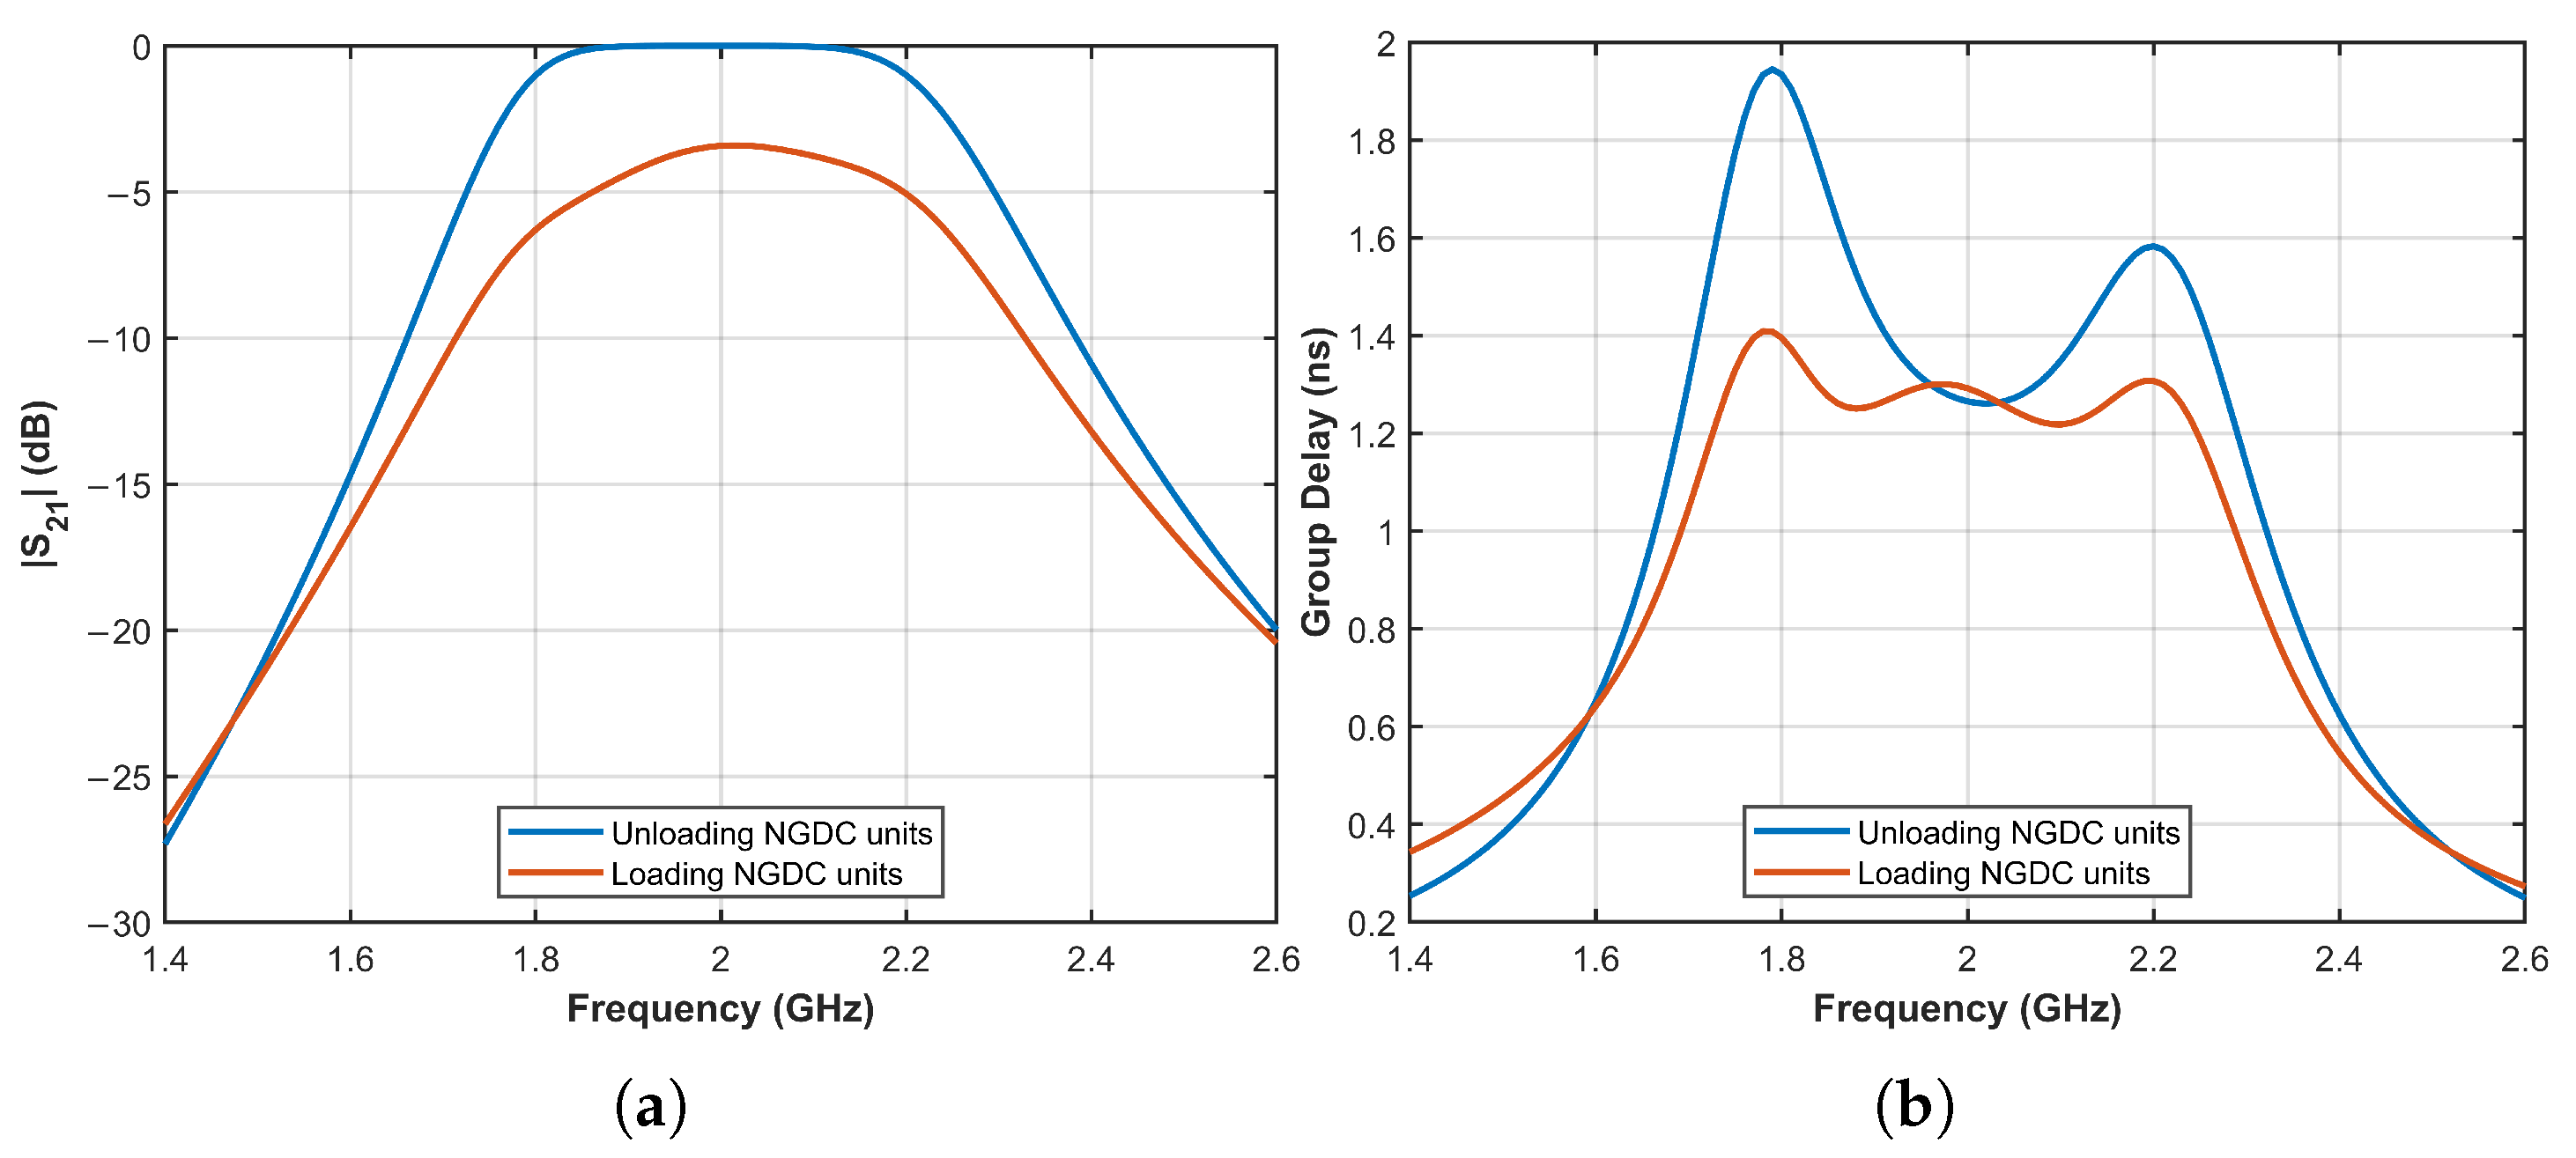
To address the feasibility of the proposed NGDC topology for higher-frequency applications, a validation model centered at 2.0 GHz was designed and simulated. Figure 32 illustrates the magnitude and group delay responses from 1.8 GHz to 2.2 GHz.
Figure 32.
(a) simulation before and after optimization. (b) Group delay simulation before and after optimization.
As shown in Figure 32b, the inherent group delay of the high-frequency bandpass filter (BPF) exhibits typical nonlinear fluctuations with a peak-to-peak value of approximately 0.68 ns. After incorporating the NGDC units, the group delay ripple is significantly suppressed to below 0.2 ns within the target band, achieving a flattening improvement of over 70%. Figure 32a shows the magnitude response (). At the center frequency of 2.0 GHz, the insertion loss increases by approximately 3.4 dB after cascading the NGDC units compared to the original BPF. Throughout the 1.8–2.2 GHz operating band, the magnitude variation remains within 3 dB, which satisfies the general engineering requirements for gain flatness in radar front-ends. These results confirm that the multi-parameter dual-resonance topology is highly scalable and can be effectively implemented in higher-frequency radar and sensing systems.
6. Conclusions
To address the group-delay mismatch encountered by phase-sensitive radar in polar-ice monitoring, this paper proposes and validates a hardware optimization scheme based on a multi-parameter negative group-delay circuit. First, by establishing a nonlinear group delay interference model, we theoretically elucidate how hardware dispersion degrades millimeter-level ranging accuracy in phase-sensitive radar, thereby providing a quantitative basis for the subsequent design of compensation circuits. Second, the proposed multi-parameter dual-resonance NGDC achieves efficient delay equalization under a low-IL constraint, enabled by its flexible impedance-tuning capability. Comparative results further show that the proposed topology attains an advanced figure of merit (FoM) among related designs. Finally, system-level verification confirms that the proposed scheme suppresses the filter group delay variations within practical engineering tolerances, markedly reduces the likelihood of half-wavelength errors, and enables the ranging accuracy to improve from the centimeter level to the millimeter level, approaching the theoretical limit. Overall, this work not only mitigates the group-delay mismatch in the RF front-end of phase-sensitive radar, but also provides reliable hardware support for high-precision deformation monitoring in polar environments, demonstrating strong engineering potential.
Author Contributions
Conceptualization, X.Y. and B.Z.; methodology, X.Y. and B.Z.; software, X.Y.; validation, X.Y., X.L. and B.Z.; formal analysis, X.Y.; investigation, X.Y.; resources, X.L. and B.Z.; data curation, X.Y.; writing—original draft preparation, X.Y.; writing—review and editing, X.Y., X.L. and B.Z.; visualization, X.Y.; supervision, X.L. and B.Z.; project administration, B.Z.; funding acquisition, B.Z. All authors have read and agreed to the published version of the manuscript.
Funding
This research was funded by the National Key R&D Program of China, grant number 2023YFF1303501.
Data Availability Statement
Data are contained within the article.
Conflicts of Interest
The authors declare no conflicts of interest.
Abbreviations
The following abbreviations are used in this manuscript:
| RF | Radio frequency |
| NGDC | Negative group delay circuit |
| BPF | Bandpass filter |
| RMS | Root mean square |
| SNR | Signal-to-noise ratio |
| FMCW | Frequency-modulated continuous-wave |
| IF | Intermediate-frequency |
| LO | Local-oscillator |
| TX | Transmitter |
| RX | Receiver |
| NGD | Negative group delay |
| LFM | Linear frequency-modulated |
| LTI | Linear time-invariant |
| IL | Insertion loss |
| VSWR | Voltage standing-wave ratio |
| FoM | Figure of merit |
References
- Cui, X.; Hao, T.; Lang, S.; Zhao, B.; Xiao, P.; Ai, S.; Cai, Y.; Liu, Y.; Zhao, W.; Xing, Z.; et al. Polar radioglaciology: Frontiers in technology and methods. Chin. J. Polar Res. 2022, 34, 397–400. [Google Scholar]
- Xing, Z.; Lang, S.; Zhao, B.; Dou, Y.; Xiao, P.; Li, L.; Sun, B.; Cui, X. Review and prospect of ice radar technology for polar ice and snow detection. Chin. J. Polar Res. 2023, 35, 591–606. [Google Scholar]
- Tseng, C.-H.; Pai, C.-H.; Chang, H.-C. A New Microwave Oscillator-Based Microfluidic Dielectric Sensor. IEEE Trans. Microw. Theory Tech. 2024, 72, 628–637. [Google Scholar] [CrossRef] [Scilit]
- Wang, S.; Wan, C.; Chung, K.L.; Zheng, Y. Investigation of Compact Near-Equidistant Multimode Resonator Integrating Skyrmionic Metamaterial With SIW Cavity and Its Application in Dielectric Material Detection. IEEE Trans. Microw. Theory Tech. 2025, 73, 6–20. [Google Scholar] [CrossRef] [Scilit]
- Ravelo, B. On low-pass, high-pass, bandpass, and stop-band NGD RF passive circuits. URSI Radio Sci. Bull. 2017, 363, 10–27. [Google Scholar] [CrossRef] [Scilit]
- Arsalan, H.; Eryildirim, A.; Thumann, M.; Zeh, T.; Schneider, S.-A. Influence of RF Group Delay on the Performance of FMCW Automotive Radar Sensor. In Proceedings of the 2021 IEEE 21st Annual Wireless and Microwave Technology Conference (WAMICON), Sand Key, FL, USA, 28–29 April 2021; pp. 1–6. [Google Scholar]
- Wang, B.; Lai, T.; Huang, H.; Wang, Q. A Nonlinear Phase Compensation Method for FMCW Radar Based on VNCMD. IEEE Sensors J. 2024, 24, 35156–35165. [Google Scholar] [CrossRef] [Scilit]
- Wang, B.; Lai, T.; Wang, Q.; Huang, H. A Nonlinear Compensation Method for Enhancing the Detection Accuracy of Weak Targets in FMCW Radar. Remote Sens. 2025, 17, 829. [Google Scholar] [CrossRef] [Scilit]
- Salami, D.; Bahmani, N.; Yiǧitler, H.; Sigg, S. Adaptive Internal Calibration for Temperature-Robust mmWave FMCW Radars. In Proceedings of the UbiComp Companion ’25: Companion of the 2025 ACM International Joint Conference on Pervasive and Ubiquitous Computing, Espoo, Finland, 12–16 October 2025; pp. 1100–1105. [Google Scholar]
- Ravelo, B.; Wu, L.; Wan, F.; Rahajandraibe, W.; Murad, N.M. Negative Group Delay Theory on Li Topology. IEEE Access 2020, 8, 47596–47606. [Google Scholar] [CrossRef] [Scilit]
- Yuan, A.; Chang, N.; Liu, J.; Lan, Z.; Meng, Y.; Guo, X. Novel Bandstop Filter With Improved Flat NGD Characteristics and Signal Attenuation in Passband. IEEE Access 2024, 12, 28575–28581. [Google Scholar] [CrossRef] [Scilit]
- Wang, H.; Wu, Y.; Wu, Z.; Wang, W.; Liu, Y. Compact arbitrary terminated power divider with bandwidth-enhanced negative group delay characteristics. Int. J. Circuit Theory Appl. 2019, 47, 909–916. [Google Scholar] [CrossRef] [Scilit]
- Meng, Y.; Li, P.; Yuan, A.; Lan, Z. Compact Broadband Negative Group Delay Circuit with Flatness and Bandwidth Enhancement. Electronics 2024, 13, 3056. [Google Scholar] [CrossRef] [Scilit]
- Nako, J.; Psychalinos, C.; Elwakil, A.S.; Maundy, B.J. Power-Law Negative Group Delay Filters. Electronics 2024, 13, 522. [Google Scholar] [CrossRef] [Scilit]
- Shao, T.; Wang, Z.; Fang, S.; Liu, H.; Chen, Z.N. A full-passband linear-phase band-pass filter equalized with negative group delay circuits. IEEE Access 2020, 8, 43336–43343. [Google Scholar] [CrossRef] [Scilit]
- Choi, H.; Jeong, Y.; Lim, J.; Eom, S.-Y.; Jung, Y.-B. A Novel Design for a Dual-Band Negative Group Delay Circuit. IEEE Microw. Wirel. Compon. Lett. 2011, 21, 19–21. [Google Scholar] [CrossRef] [Scilit]
- Wan, F.; Liu, Y.; Nebhen, J.; Xu, Z.; Chan, G.; Lallechere, S.; Vauche, R.; Rahajandraibe, W.; Ravelo, B. Bandpass Negative Group Delay Theory of Fully Capacitive Δ-Network. IEEE Access 2021, 9, 62430–62445. [Google Scholar] [CrossRef] [Scilit]
- Wan, F.; Gu, T.; Ravelo, B.; Li, B.; Cheng, J.; Yuan, Q.; Ge, J. Negative Group Delay Theory of a Four-Port RC-Network Feedback Operational Amplifier. IEEE Access 2019, 7, 75708–75720. [Google Scholar] [CrossRef] [Scilit]
- Ravelo, B.; Wan, F.; Feng, J. All-Pass Negative Group Delay Function With Transmission Line Feedback Topology. IEEE Access 2019, 7, 155711–155723. [Google Scholar] [CrossRef] [Scilit]
- Wan, F.; Wu, L.; Ravelo, B.; Ge, J. Analysis of Interconnect Line Coupled With a Radial-Stub Terminated Negative Group Delay Circuit. IEEE Trans. Electromagn. Compat. 2020, 62, 1813–1821. [Google Scholar] [CrossRef] [Scilit]
- Brennan, P.V.; Lok, L.B.; Nicholls, K.; Corr, H. Phase-sensitive FMCW radar system for high-precision Antarctic ice shelf profile monitoring. IET Radar Sonar Navig. 2014, 8, 776–786. [Google Scholar] [CrossRef] [Scilit]
- Richards, M.A. Fundamentals of Radar Signal Processing, 3rd ed.; McGraw Hill: New York, NY, USA, 2022. [Google Scholar]
- Li, L.; Shen, Z.; Wu, W. Compact Absorptive Microstrip Bandpass Filter with Adjustable Bandwidth and Phase. Electronics 2024, 13, 3037. [Google Scholar] [CrossRef] [Scilit]
- Claus, N.; Kapusuz, K.Y.; Verhaevert, J.; Rogier, H. Compact and Hybrid Dual-Band Bandpass Filter Using Folded Multimode Resonators and Second-Mode Suppression. Electronics 2024, 13, 1921. [Google Scholar] [CrossRef] [Scilit]
- Li, D.; Xia, Q.; Huang, J.; Li, J.; Chang, H.; Sun, B.; Liu, H. A 24 GHz Direct Conversion Receiver for FMCW Ranging Radar Based on Low Flicker Noise Mixer. Electronics 2021, 10, 722. [Google Scholar] [CrossRef] [Scilit]
- Wittemeier, J.; Sievert, B.; Dedic, M.; Erni, D.; Rennings, A.; Pohl, N. The Impact of Group Delay Dispersion on Radar Imaging With Multiresonant Antennas. IEEE Microw. Wirel. Compon. Lett. 2022, 32, 241–244. [Google Scholar] [CrossRef] [Scilit]
- Kingslake, J.; Hindmarsh, R.C.A.; Aðalgeirsdóttir, G.; Conway, H.; Corr, H.F.J.; Gillet-Chaulet, F.; Martín, C.; King, E.C.; Mulvaney, R.; Pritchard, H.D. Full-depth englacial vertical ice sheet velocities measured using phase-sensitive radar. J. Geophys. Res. Earth Surf. 2014, 119, 2604–2618. [Google Scholar] [CrossRef] [Scilit]
- Ahn, K.-P.; Ishikawa, R.; Honjo, K. Low Noise Group Delay Equalization Technique for UWB InGaP/GaAs HBT LNA. IEEE Microw. Wirel. Compon. Lett. 2010, 20, 405–407. [Google Scholar] [CrossRef] [Scilit]
- Chaudhary, G.; Jeong, Y.; Lim, J. Microstrip Line Negative Group Delay Filters for Microwave Circuits. IEEE Trans. Microw. Theory Tech. 2014, 62, 234–243. [Google Scholar] [CrossRef] [Scilit]
- Mitchell, M.W.; Chiao, R.Y. Causality and negative group delays in a simple bandpass amplifier. Am. J. Phys. 1998, 66, 14–19. [Google Scholar] [CrossRef] [Scilit]
- Ravelo, B.; Wan, F.; Nebhen, J.; Rahajandraibe, W.; Lalléchère, S. Resonance Effect Reduction With Bandpass Negative Group Delay Fully Passive Function. IEEE Trans. Circuits Syst. II Express Briefs 2021, 68, 2364–2368. [Google Scholar] [CrossRef] [Scilit]
- Sambatra, E.J.R.; Mombo Boussougou, Y.C.; Ramifidisoa, L.; Kouadio, J.-P.; Ngoho, S.; Jaomiary, A.; Murad, N.M. Band Pass Negative Group Delay demonstration on a VHF RLC parallel passive lumped circuit. Adv. Electromagn. 2022, 11, 9–21. [Google Scholar] [CrossRef] [Scilit]
- Brennan, P.V. Phase-Locked Loops: Principles and Practice; Macmillan Press: Basingstoke, UK, 1996. [Google Scholar]
- Robins, W.P. Phase Noise in Signal Sources: Theory and Applications; Peregrinus: London, UK, 1984. [Google Scholar]

Disclaimer/Publisher’s Note: The statements, opinions and data contained in all publications are solely those of the individual author(s) and contributor(s) and not of MDPI and/or the editor(s). MDPI and/or the editor(s) disclaim responsibility for any injury to people or property resulting from any ideas, methods, instructions or products referred to in the content. |
© 2026 by the authors. Licensee MDPI, Basel, Switzerland. This article is an open access article distributed under the terms and conditions of the Creative Commons Attribution (CC BY) license.