


Abstract
Median crossover crashes are among the most severe roadway safety events due to their high-energy nature and strong association with fatal and incapacitating injuries, posing a substantial public health burden. This study develops a multimodal intelligent analytics framework to evaluate the cable median barrier performance in Tennessee by integrating structured crash data, roadway and traffic characteristics, post-impact vehicle responses, and unstructured police narratives. Across 6094 crashes on 576 cable barrier segments, 1196 involved barrier impacts and 914 included complete post-impact response information. Deep learning-based text mining using a BERT transformer model was applied to narrative descriptions from fatal, serious injury, and minor injury crashes to extract contextual indicators of loss of control, impact dynamics, and injury mechanisms. Safety effectiveness evaluation using Empirical Bayes methods showed substantial reductions after installation, including a 96% decrease in fatal crashes and an 88% reduction in serious-injury crashes. Vehicle–barrier interactions—classified as containment, redirection, rollover, or penetration—were modeled using a multinomial logit framework with marginal effects to assess the influence of geometric, operational, and vehicle-related factors. Reduced barrier offset, narrow shoulders, high traffic volumes, outer-lane departures, and heavy-vehicle involvement significantly increased the likelihood of rollover and penetration events, which are strongly linked to higher injury severity. Through fusing multimodal data and combining explainable statistical models with deep learning text analysis, this study provided a scalable, trustworthy approach to characterizing injury risk, aligning transportation safety analytics with emerging intelligent healthcare and big-data methodologies aimed at preventing severe and fatal trauma.
1. Introduction
1.1. Study Overview and Objectives
Median crossover crashes represent one of the most catastrophic roadway safety challenges in the United States, posing not only a traffic engineering problem but a significant public health threat, due to their disproportionate contribution to severe and fatal injuries. Occurring predominantly on high-speed freeways where kinetic energy transfer is extreme, these crashes frequently lead to devastating outcomes such as head-on collisions, vehicle rollovers, occupant ejection, and life-altering trauma that place substantial burdens on emergency medical systems and long-term healthcare resources. Over the past decade, the Federal Highway Administration (FHWA) and state Departments of Transportation (DOTs) have intensified nationwide efforts to reduce roadway fatalities, with particular emphasis on freeway environments where speed, volume, and crash severity intersect at dangerous levels. Among high-risk crash types, median crossover events consistently emerge as one of the most lethal, creating an urgent need for evidence-based countermeasures. Median cable barriers have therefore become a widely deployed strategy to mitigate and prevent these high-energy events; however, their real-world injury-reduction performance depends on complex interactions involving vehicle characteristics, roadway geometry, traffic conditions, and barrier placement. Given that the injury outcomes of these crashes mirror patterns that are commonly analyzed in clinical trauma epidemiology—ranging from non-serious injuries to severe incapacitation and fatality—there is a growing recognition that highway safety must be approached as a multidisciplinary health and technology domain. This aligns with emerging trends in intelligent healthcare, where multimodal data integration and machine learning are leveraged to characterize injury mechanisms, predict risk, and support prevention strategies. Understanding median crossover crashes through such a data-driven lens directly links transportation injury biomechanics, public health impact, and advanced AI-enabled analytic methods to guide safer infrastructure design and reduce the burden of trauma on communities.
Cable barrier installations in the United States have been in practice for over 60 years [1,2,3,4,5,6,7,8,9,10,11,12,13,14,15]. In Tennessee, the Tennessee Department of Transportation (TDOT) has invested heavily in median cable barrier systems since 2005, installing over 596 segments covering hundreds of miles. The core purpose of these installations has been to physically prevent vehicles that leave their travel lane from crossing the median into opposing traffic, thereby dramatically reducing the likelihood of fatal or incapacitating crashes. Yet, despite this significant investment, understanding how and why these crashes occur—and how effective the barriers truly are under varied conditions—requires more than just aggregate crash counts. It demands a deeper look into the actual contributing causes and contextual factors described at the crash scene. This is where the unique contribution of this study lies: placing machine learning-based intelligent text mining and crash narrative analysis at the heart of the safety evaluation, making it a major methodological innovation for comprehensively uncovering the root causes of median crossover incidents and injury severities. Conventional safety analyses have relied on descriptive statistics, Empirical Bayes (EB) methods, and the development of safety performance functions (SPFs), as outlined in the Highway Safety Manual [16].
To comprehensively investigate the safety and injury implications of median crossover crashes, this study employs a multimodal data-driven methodological framework that integrates conventional statistical modeling with modern machine learning approaches. First, detailed crash information that is relevant to median crossover events is extracted from police reports and narrative descriptions, leveraging machine learning-based text mining to capture the critical contextual factors that are often missed in structured databases. The analysis then incorporates descriptive statistics and safety performance evaluations comparing crash characteristics before and after cable barrier installation. To understand the dynamics of post-impact events, vehicle–barrier interactions are categorized into four principal response modes—containment, redirection, rollover, and penetration—which serve as key indicators of real-world barrier effectiveness. Injury severity outcomes, including fatal, injury, and property-damage-only crashes, are modeled using categorical outcome-based statistical methods: specifically, the multinomial logit framework, allowing for simultaneous assessment of multiple competing injury states. Marginal effects are computed to quantify the influence of roadway-, vehicle-, and barrier-related factors on different injury outcomes. Finally, complementary machine learning models are applied to capture nonlinear interactions and enhance predictive insight into injury risk, thereby aligning the study with contemporary intelligent healthcare methodologies focused on risk stratification, trauma prediction, and AI-enabled decision support.
1.2. Use of Machine Learning-Based Text Mining and Analysis
Machine learning-based text mining and analysis is one of methods applied in this study. While traditional methods used to analyze such crashes establish what safety benefit occurs, they often do not explain why the benefit occurs or which detailed factors play the biggest role in causing these crashes to begin with. As Chowdhury and Alzarrad [17] and Kutela et al. [18] argue, narrative text mining in transportation is increasingly vital for uncovering insights from unstructured reports that are overlooked in numeric crash summaries. Every crash report filed by police officers includes a narrative section that often contains crucial context—describing vehicle behavior, driver actions, weather, road features, and witness statements—all of which help reveal the sequence of events that lead to a median incursion. Despite the explosion of available digital crash data, few studies have leveraged the full potential of text mining for in-depth causal analysis of median crossovers. Arteaga-Sanchez [19] highlights the unique challenge of extracting structured meaning from free-form language, but modern text mining and text network analysis address this by systematically mapping word relationships, collocations, and clusters. By applying these advanced machine learning methods to hundreds of fatal, serious injury, and minor injury reports in Tennessee, this study extracts high-frequency keywords and bigrams such as “vehicle traveling,” “lost control,” “cable barrier,” and “overturned”—all of which appear repeatedly in officer narratives describing how vehicles leave the lane, fail to negotiate curves, strike barriers, or come to rest after severe loss of control.
1.3. Consideration of Post Cable Collision Impact to Injury Severity
Recently, high tension cable barriers have gained an increased use as they have higher efficiency in capturing the impacting vehicles than the low tension types. They also have considerably lower deflection than the lower tension type [1]. On collision with a cable barrier, an errant vehicle can either be redirected back to traffic, penetrate the cable barrier, contained by the cable barrier (and hence stopped) or even rollover. Preferably, a cable barrier is supposed to contain an errant vehicle and then bring it to stop or re-direct it back to the impact side. Vehicle rollovers after impact or barrier penetrations are associated with the poor performance of the installed median barrier [1]. NCHRP report 350 and MASH requires manufactured cable barriers to pass a series of tests before acceptance for installation by a respective jurisdiction [1,2]. The manuals specify vehicle types that should be contained or re-directed by the cables under specified impact conditions and describes the testing procedures for the barriers to ensure that the cable can perform to the specified level. Since the testing conditions specified cannot adequately simulate the actual site conditions, in-service performance evaluation is usually carried out to ensure that cables perform in the required manner.
Several researchers conducted an in-service performance evaluation of the installed median barriers to determine the cable performance during vehicle–cable impacts. Using crash data, the collision diagrams, maintenance records, and police reports, the crash scenario we examined to determine whether there are cases associated with the poor performance of the cable barriers [8,9]. Monsere et al. [8] analyzed the performance of three cable-median barrier installations along interstate-5 in Oregon with respect to the potential crossovers, penetrations and cable under-ride responses. In addition, several articles have been looking into safety performances through before–after studies of crash data that are specified in the Highway Safety Manual [8,9,10]. Many studies focused on evaluating crashes which were associated with cable barrier penetrations and rollover. In most cases, such performance was related to impact conditions such as the angle of impact and impact speeds. Crash reconstruction processes were used in impact condition determination. Sicking and Stolle [9] analyzed the influence of impact conditions on the vehicles’ barrier failures. The study considered events of penetration and rollover on different sets of impact angles and speeds. In addition to the impact conditions, Sicking and Stolle [6] performed an observation on the performance of different cable barrier types (proprietary types). The results indicated that various proprietary barrier systems had markedly different rates of penetration and rollover. Due to the limited information necessary for crash reconstruction, limited sample size, and uncertainties associated with the data presented, the accuracy and reliability of the results is compromised.
This study therefore uses cable barrier crash incidents to determine the performance of such barriers in terms of vehicle–cable impact outcomes: namely, penetration, rollover, re-direction and containment. The collision diagrams were used in determining the correlation of actual vehicular–barrier crash responses to different variables associated with the crash. Traffic characteristics, road geometry, cable barrier placement and weather-related variables were used in the modeling process, as they are considered to influence the vehicle–barrier impact outcome. A multinomial logit regression approach was used to study the possible categorical outcomes and how the geometry, installations and traffic characteristics affect the impact responses. Furthermore, variables like cable barrier offset, vehicle type, and curvature data are used to assess how they specifically affect the performance of the cable barriers.
The different sample sizes reported in this study should be noted, which reflect the multi-stage structure of the analysis. The full dataset contained 6094 crashes across 576 cable barrier segments. Of these, 1196 crashes involved a direct vehicle–cable barrier impact. Within this group, 914 cases included complete roadway, offset, lane-of-origin, and traffic information needed for statistical modeling. A further subset of 749 cases was used for the detailed vehicle impact response analysis, as only these crashes had sufficiently clear police diagrams and narrative details to classify the four collision outcomes (containment, redirection, rollover, penetration). As a result, each analytical component utilized the portion of the dataset that was most appropriate for its specific objective.
2. Machine Learning-Based Cross over Crash Reports Text Mining and Analysis
2.1. Overview
This analysis presents the machine learning-based text mining framework used to extract meaningful crash-related information from police narrative reports. The workflow integrates standard text preprocessing procedures with transformer-based semantic embedding using a pre-trained BERT model, followed by co-occurrence and keyword–network analysis to identify key patterns associated with median-crossover crashes. The objective is to complement structured crash and roadway data by capturing contextual language elements describing the vehicle behavior, environmental conditions, and crash circumstances that are not available in coded crash databases.
2.2. Extracting Crash Report Narrative Section
A core methodological component of this study was the integration of advanced machine learning (ML) text mining techniques—specifically, a transformer-based natural language processing (NLP) model, BERT (Bidirectional Encoder Representations from Transformers)—with traditional text network analysis to investigate the underlying causes of median crossover crashes. The machine-learning text mining approach in this study therefore employed the BERT transformer architecture, which relies on the scaled dot-product attention mechanism (and multi-head attention to learn contextual relationships within the narrative sections of crash reports). The BERT-based text mining model used in this study is grounded in the transformer architecture, whose mathematical formulation is summarized in Equations (1)–(5). These equations describe how the crash narratives are transformed from raw text into contextual embeddings and, ultimately, into probabilistic predictions that are relevant to median crossover crash mechanisms and injury outcomes [20,21].
which is first mapped to input embeddings . The BERT encorder then applies stacked self-attention layers. The core operation is the scaled dot product attention:
where , and are the query, key, and value projections of the input embeddings, and is the dimensionality of the key vectors.
To capture multiple types of semantic relationships (e.g., loss of control, lane departure, impact with barrier), multi-head attention is applied:
where is the number of attention heads, and are learned parameter matrices. Stacking several such layers with feed-forward sublayers yields a contextualized representation:
where each is a deep contextual embedding of token , encoding its meaning in the full crash narrative (e.g., how overturned relates to median and loss of control). For the downstream crash narrative classification or feature extraction task (e.g., mapping a narrative to an impact/injury-related label), we use the special token representation as the aggregated sequence embedding and apply a softmax classifier:
where is a categorical label (e.g., narrative pattern class, impact response category, or injury-related text class), and are trainable parameters. During fine-tuning, the model parameters are optimized by minimizing the cross-entropy loss between the predicted distribution and the true labels.
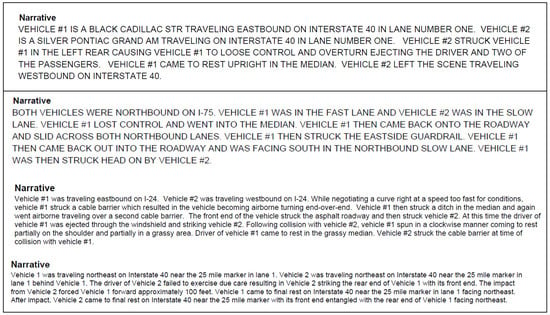
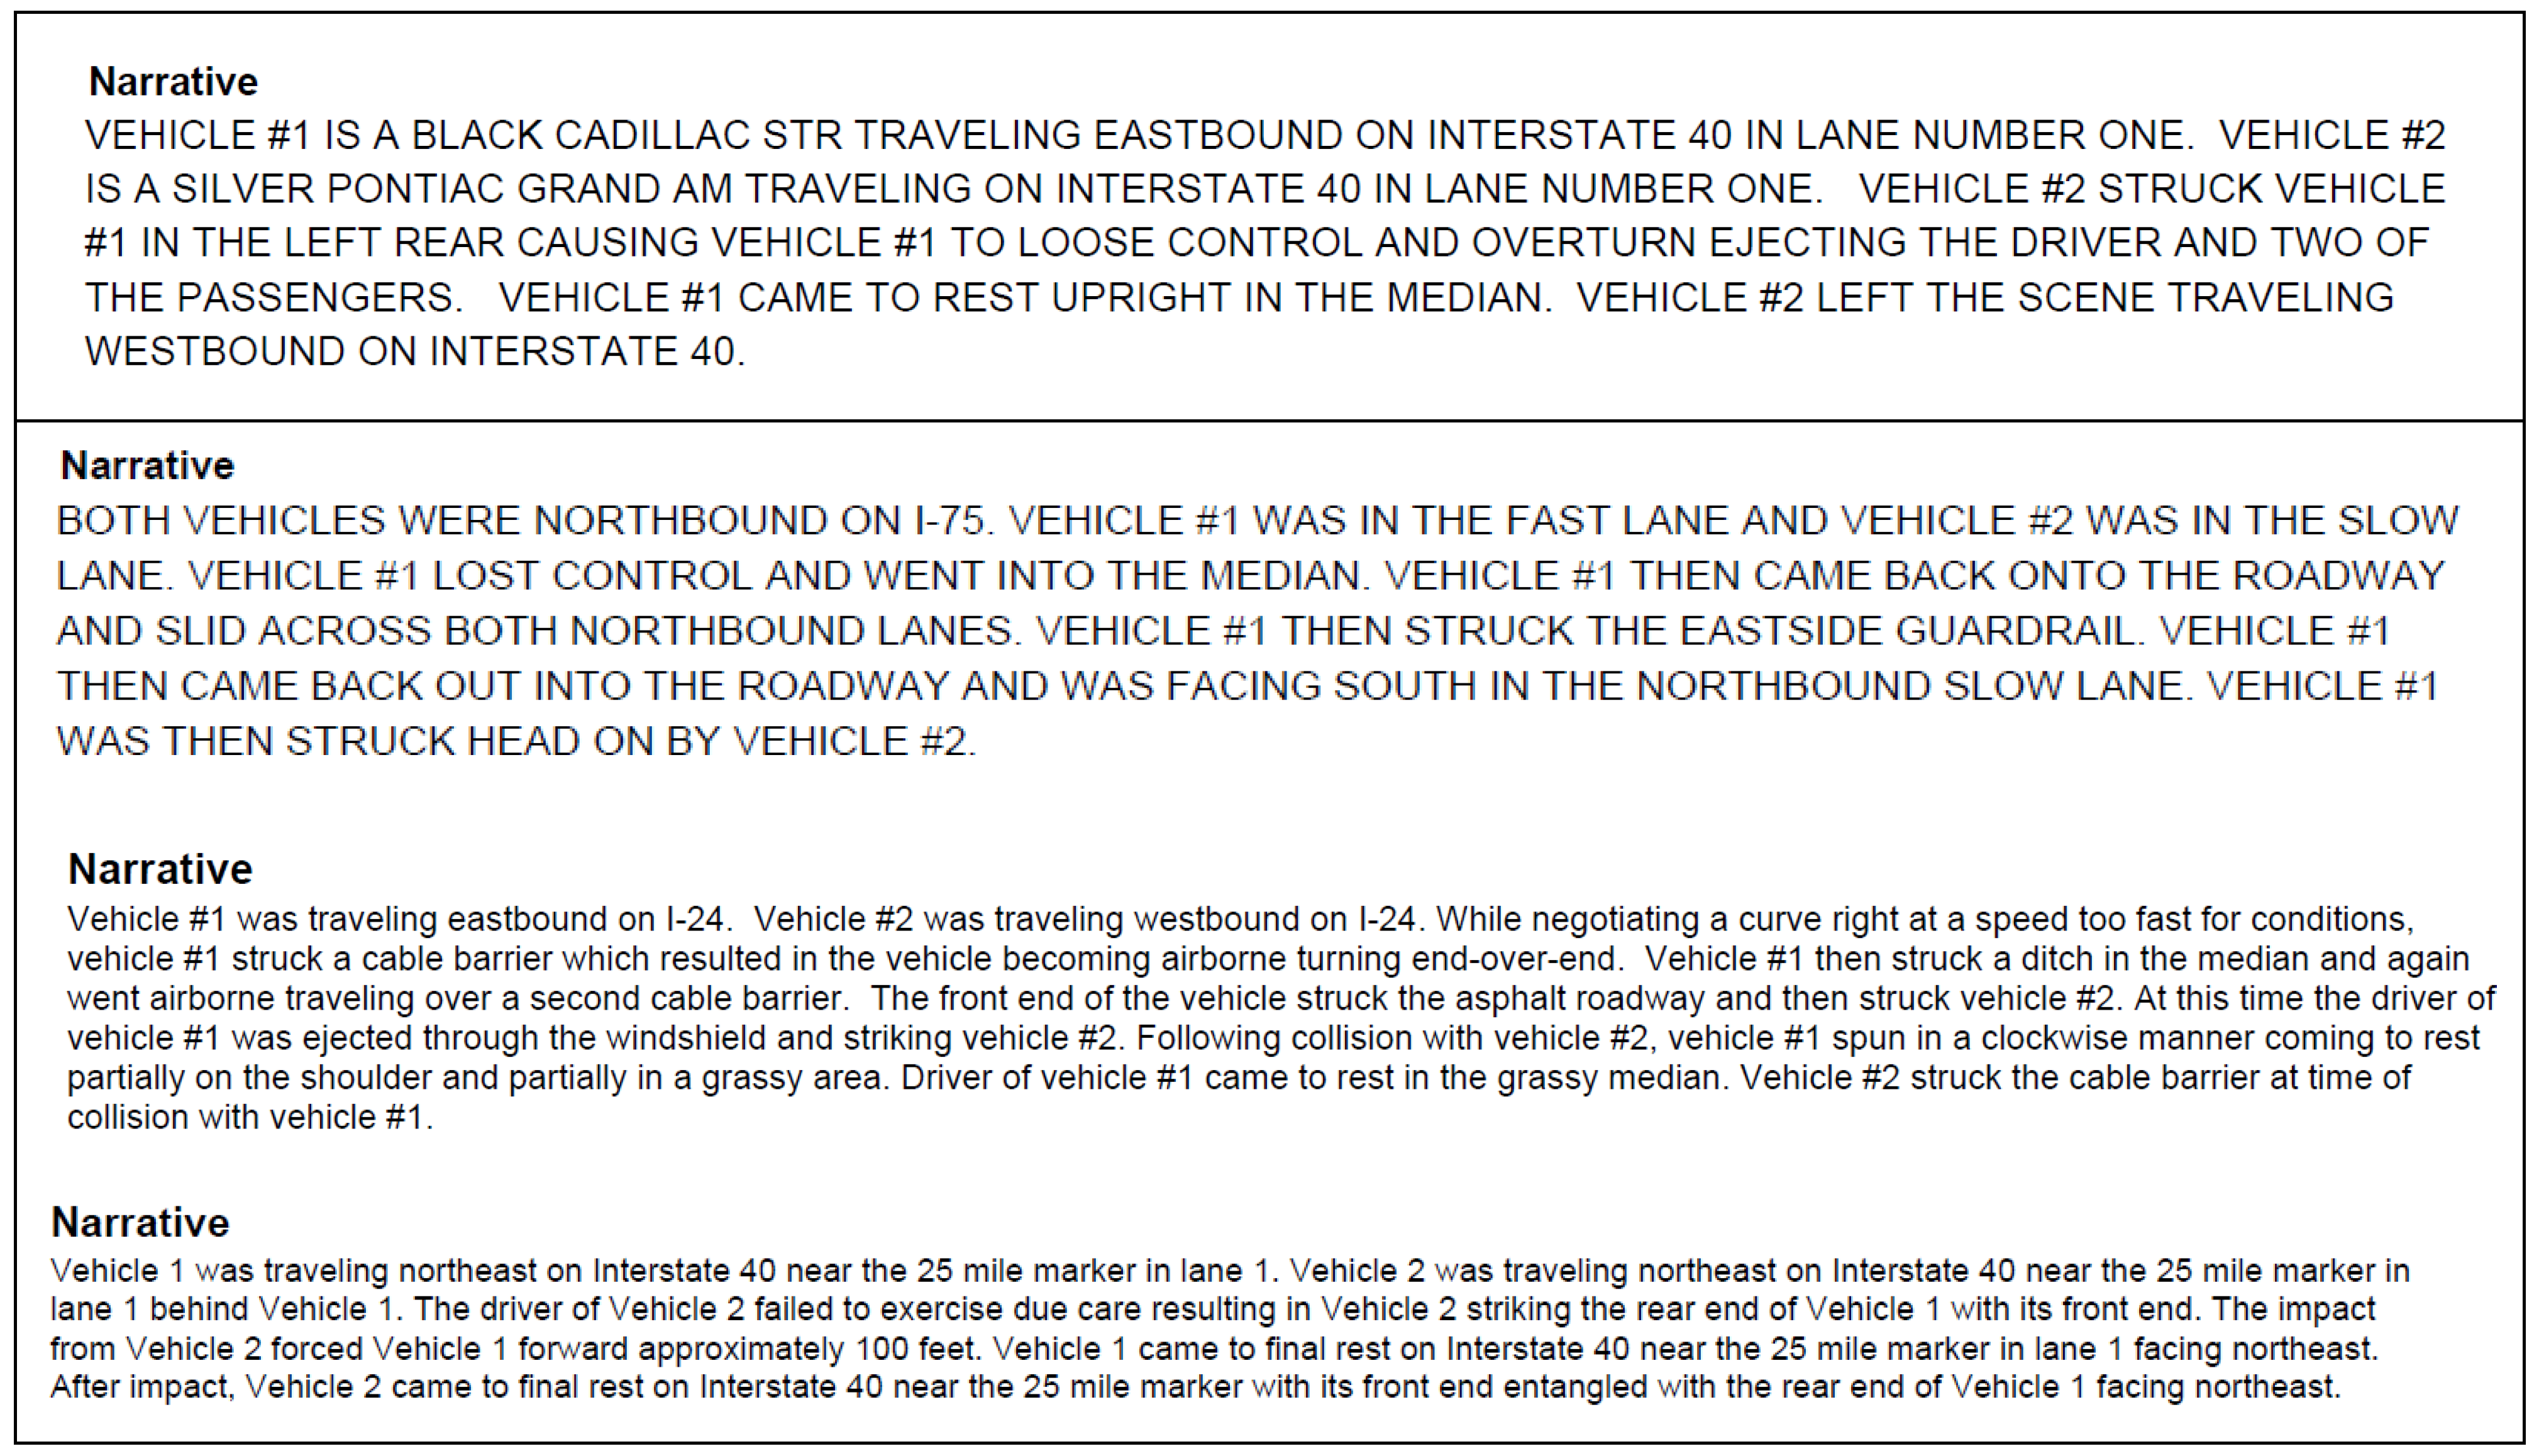
This mathematical foundation enables the model to capture nuanced semantic patterns in the descriptions of median crossover crashes, such as loss-of-control sequences, impact dynamics, and roadway-related contributing factors. Each crash report contains a narrative section with detailed descriptions from police officers and witnesses, capturing nuanced behavioral, environmental, and vehicle-related factors that are rarely available in coded databases, Figure 1. In total, 366 fatal crash reports, 328 serious injury reports, and 193 minor injury reports were reviewed and processed using this ML-enhanced text mining workflow to extract structured insights from unstructured narratives. The objective was to identify recurring phrases, semantic relationships, and contextual indicators that reveal how real-world median crossovers evolve and how these patterns relate to injury outcomes.
Figure 1.
Sample crash report narratives used for text mining.
2.3. Theory of Machine Learning-Based Text Mining Analysis
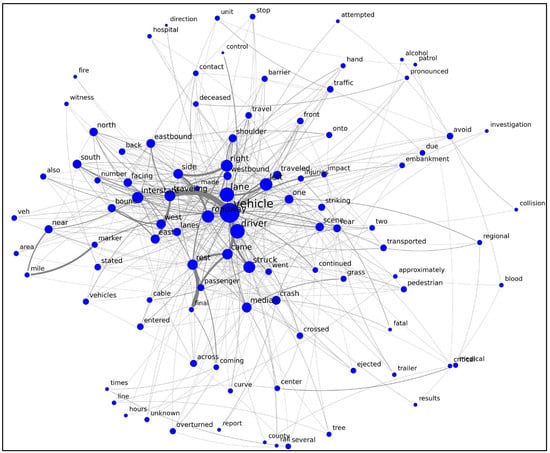
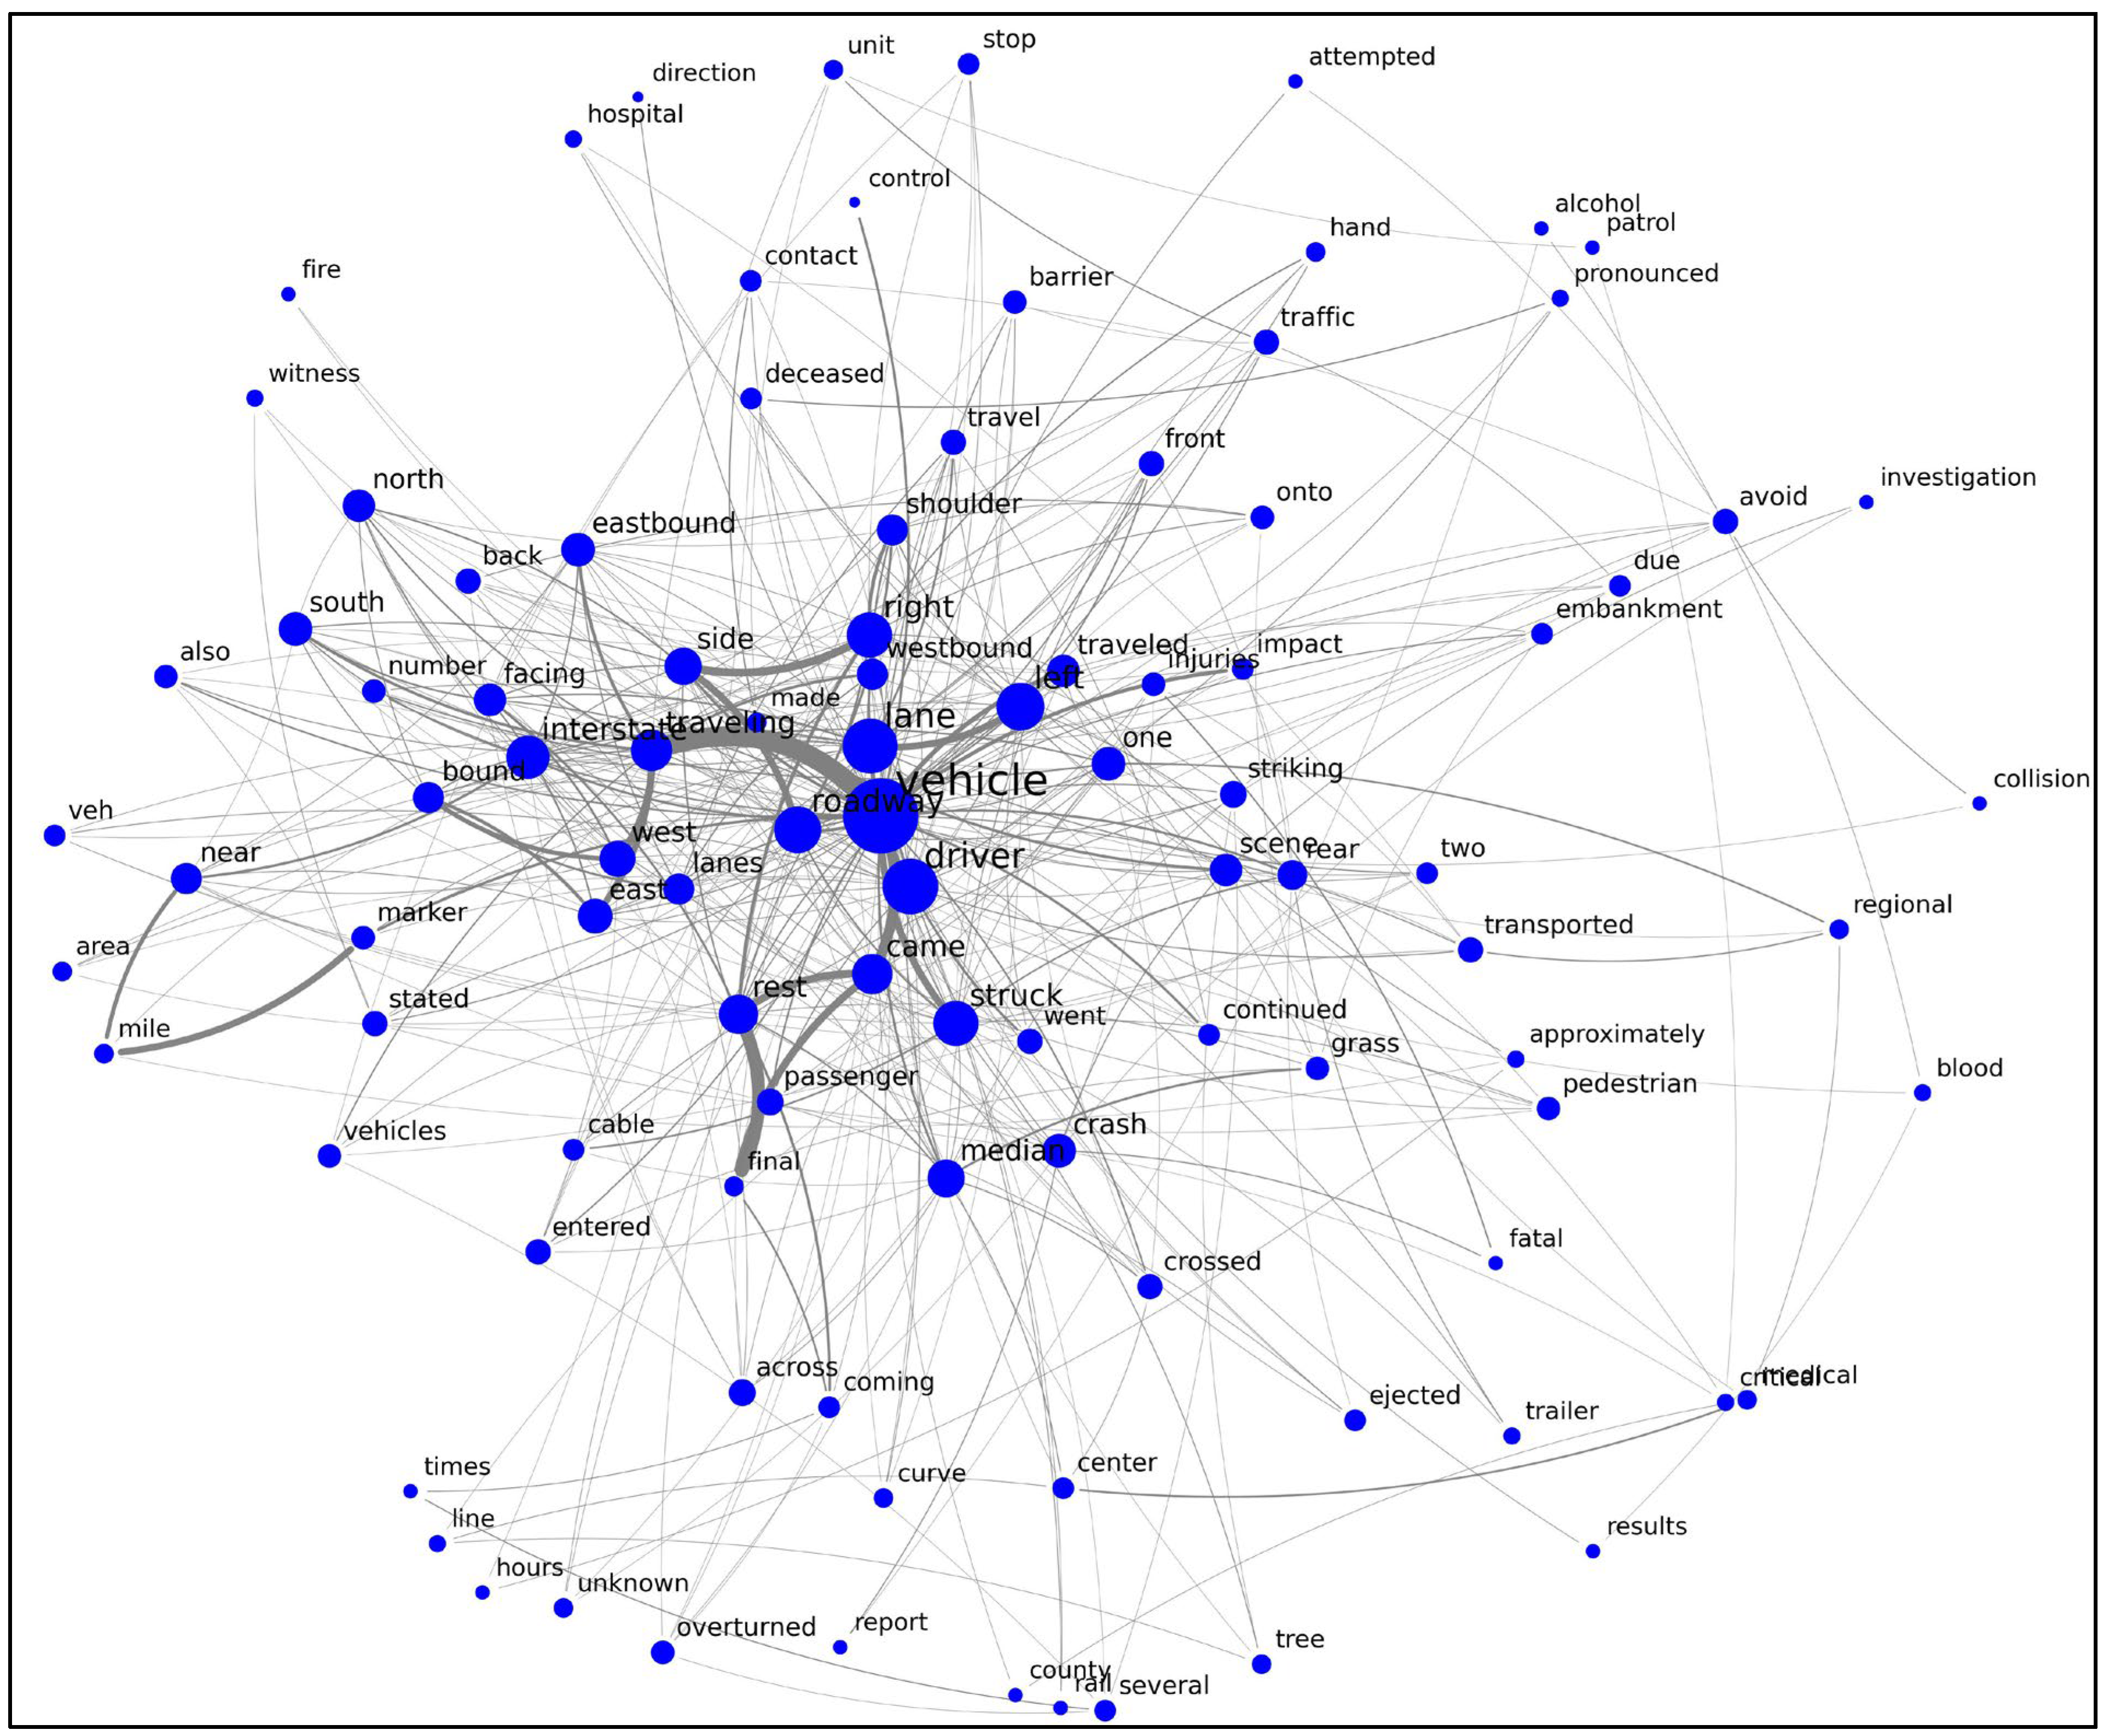
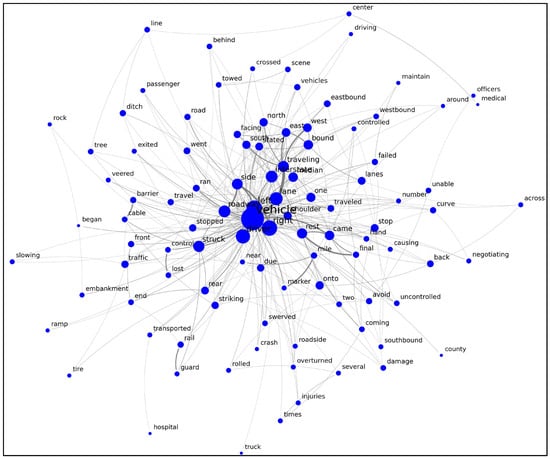
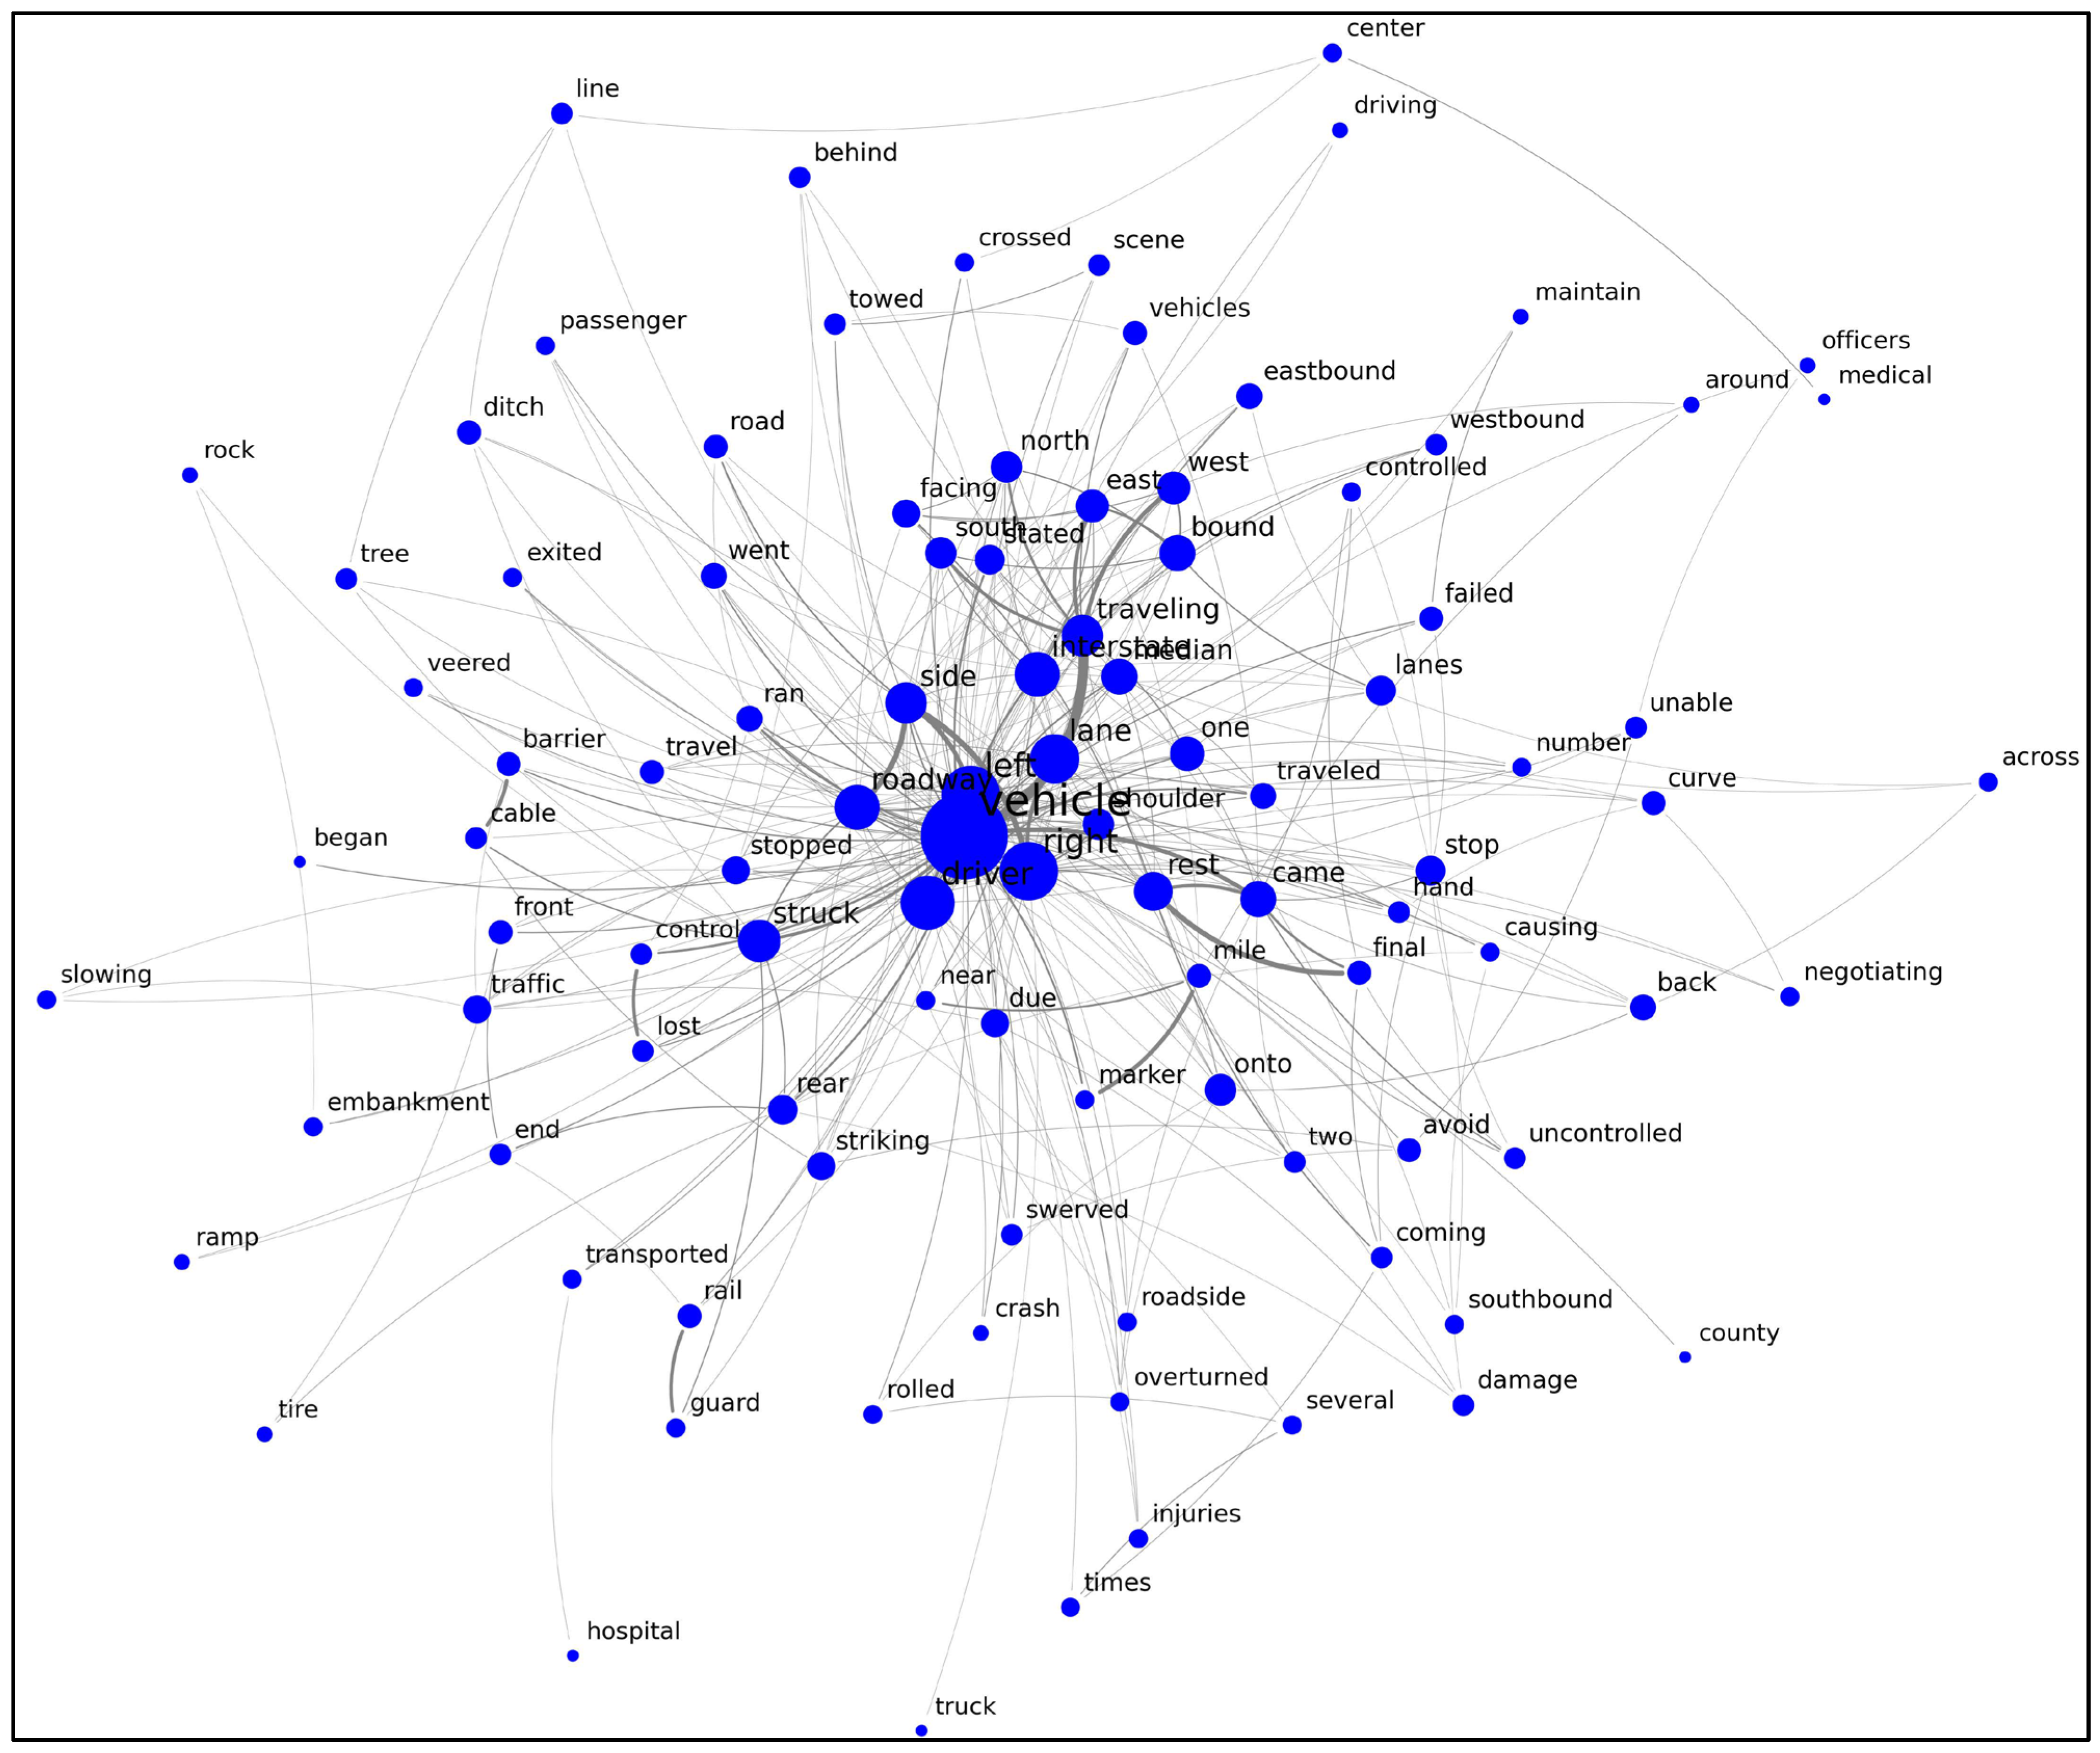
The relevance of text mining in this context is underscored by the unstructured nature of narrative crash reports, which requires sophisticated NLP methods for efficient and accurate information extraction [17]. Traditional manual review is slow, subjective, and often impractical, given the growing volume of digital crash records [22]. To address these limitations, this study applies BERT—a state-of-the-art deep learning architecture that is widely used for text classification, semantic embedding, and contextual interpretation—to enhance the extraction of meaningful content from the narratives. BERT’s bidirectional attention mechanism allows it to interpret each word in the full context of the sentence, enabling the model to detect subtle indicators of crash dynamics such as loss of control, overcorrection, lane departure, and pre-impact behavior. These semantic embeddings were combined with text network analysis to structure and visualize keyword relationships, a technique that has proven effective in literature mapping and forensic linguistics [18]. In the resulting text networks, keywords function as nodes while edges represent co-occurrence frequencies, revealing strong associative patterns and thematic clusters [23]. Clusters of interlinked nodes form communities that can reveal dominant themes or causal patterns [24]. Centrality measures—degree centrality and betweenness centrality [25]—were computed to identify the most influential terms governing crash causation. The workflow began with data normalization, followed by transformation into a keyword frequency and ML-derived semantic similarity matrix. Document frequency, collocation frequency, and BERT-based contextual similarity were jointly used to select salient terms and to form coherent clusters that reflect the underlying causes of median crossover crashes. Visualization in Python version 3.13.12 allowed for the interpretation of relationships between key contributors such as driver behavior, roadway geometry, barrier performance, and secondary impacts [25]. Through this integrated ML-text mining process, the study moved beyond simple word counts to uncover deeper semantic structures embedded within crash narratives, providing insights that are critical for understanding high-severity median crossover events, Figure 2.
Figure 2.
Text mining results for fatal crash reports.
2.4. Interpretation of Text Mining Findings
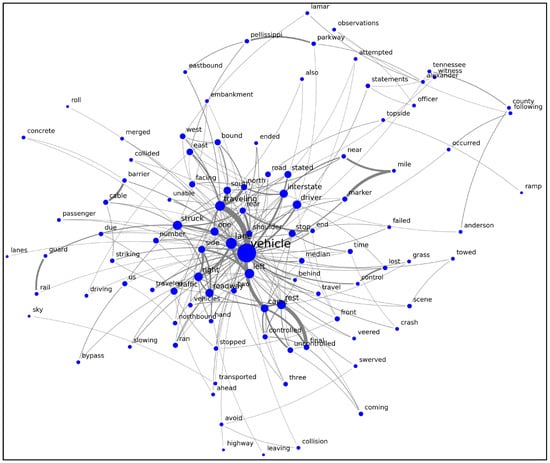
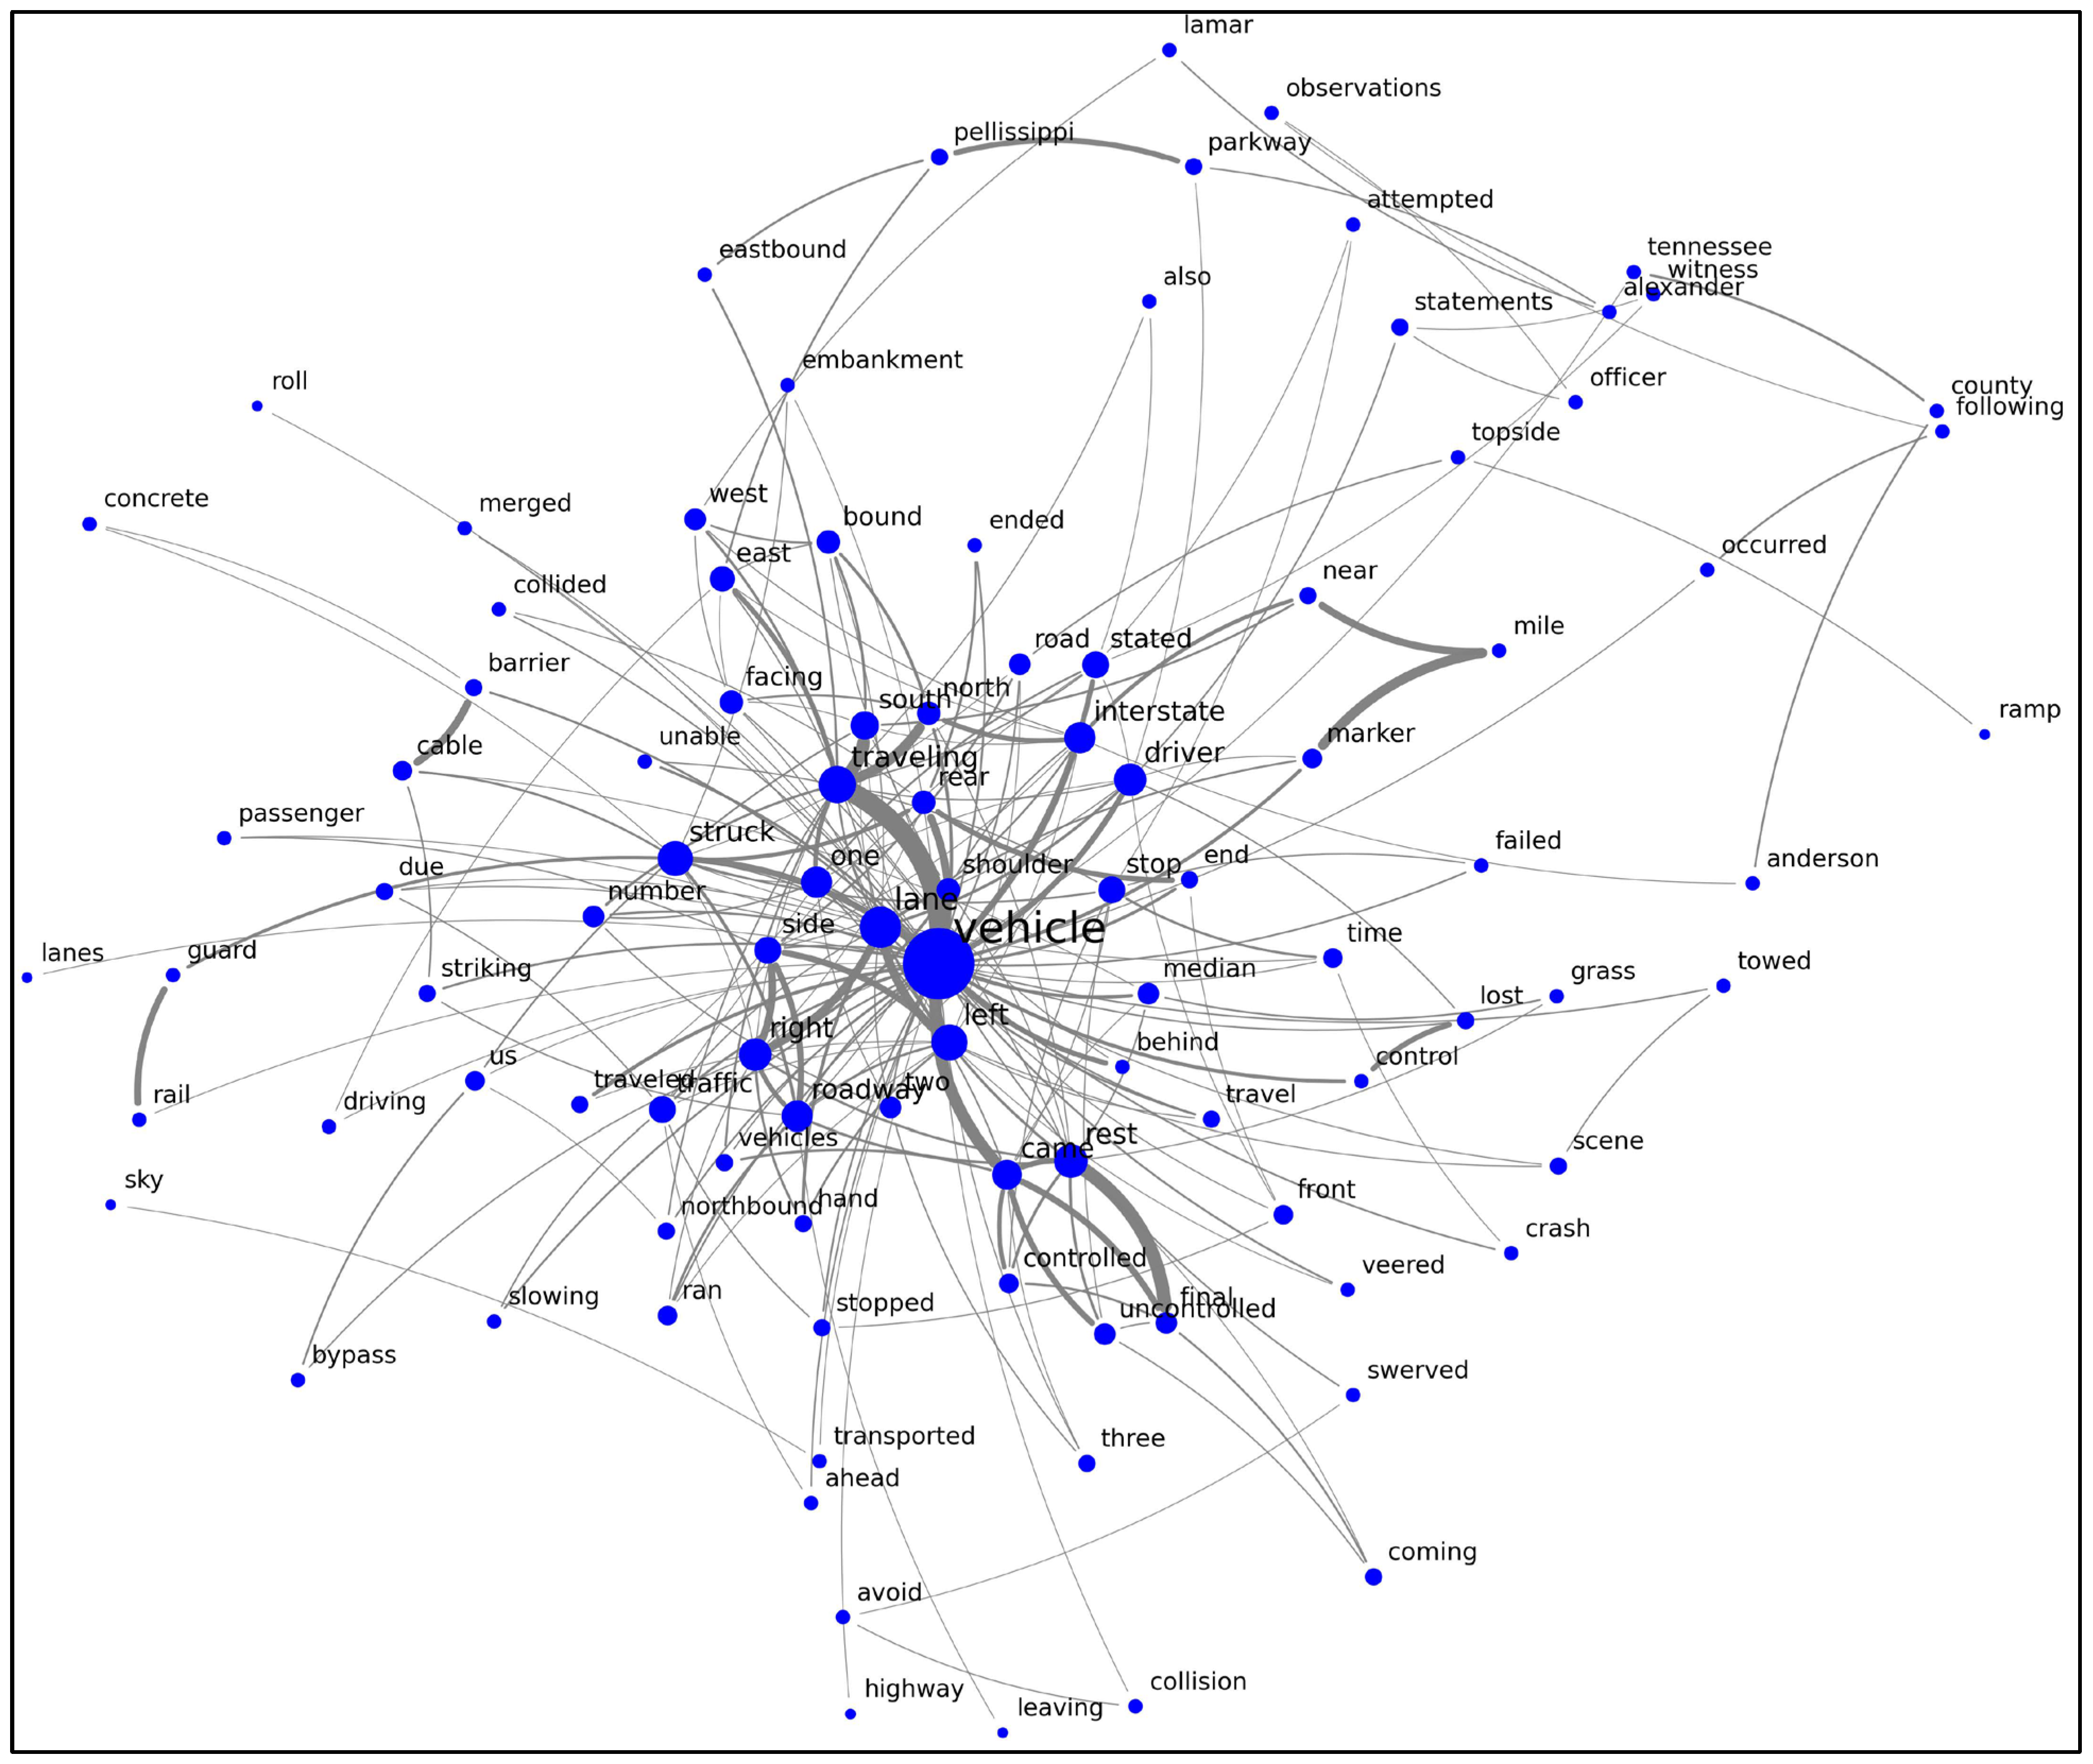
The combined machine learning and text network analysis produced a rich, multilayered understanding of the factors contributing to fatal, serious injury, and minor injury median crossover crashes. For fatal crashes, BERT-derived embeddings and co-occurrence patterns highlighted dominant terms such as vehicle, driver, control, overturned, median, struck, and left lane, indicating a repeated sequence of loss of control, lane departure, violent impact, and rollover (Figure 2). The ML model consistently associated the semantic cluster of lost control → median → struck → overturned with high-severity outcomes, confirming the catastrophic energy transfer in these events. For serious injury crashes, additional contextual keywords emerged—negotiating, failed, avoid, traffic, ditch, tree, and cable—which the ML algorithm connected to near-fatal scenarios where drivers attempted evasive maneuvers or struggled in curved or constrained roadway sections, Figure 3. The increased presence of the cable and barrier terms suggested that the median cable barriers successfully interrupted vehicle trajectories, reducing the severity but not always preventing significant injury. The appearance of the cable, barrier, and stopped signals are notable: in many serious injury events, the cable barriers or roadside barriers perform as intended by arresting the vehicle’s motion before a fatal collision occurs—but the impact can still produce serious injuries, depending on speed and trajectory. Traffic and slowing also suggest interaction with other vehicles and sudden deceleration, which contribute to complex crash chains in serious injury cases.
Figure 3.
Text mining results for serious injury crash reports.
For minor injury cases, the same dominant terms appeared, but their embedding clusters reflected lower-energy interactions: slowing, stopped, traffic, and ditch appeared with lighter connectivity, indicating loss-of-control events at lower speeds or under less hazardous roadway conditions (Figure 4). The transformer model effectively separated high-severity and low-severity semantic patterns by clustering more violent descriptors (e.g., overturned, striking, embankment) apart from lower-risk terms. The recurrence of negotiating, failed, and uncontrolled demonstrates that human error—misjudging curves, overcorrecting, or failing to maintain control—is still a key factor, even in lower-severity events.
Figure 4.
Text mining results for minor injury crash reports.
When integrated, the ML-enhanced text mining results reveal a consistent narrative: loss of vehicle control, driver handling challenges, and lane departure are the primary initiators of median crossover crashes. The prominence of median and lane in high-severity clusters confirms the critical danger zone, where small errors escalate into catastrophic outcomes. Importantly, the presence of cable, barrier, and stopped across all severity levels—detected through BERT’s contextual modeling—demonstrates that cable barriers frequently intervene as the final line of defense, preventing head-on collisions and mitigating fatal trajectories. These findings emphasize the health and injury-prevention significance of median cable barriers. The ML methodology used here directly applies deep learning to unstructured narrative data to uncover injury mechanisms, risk factors, and real-world system performance—mirroring the approaches used in clinical injury epidemiology and trauma analytics.
It should be noted that, in this study, the BERT-base-uncased model was used in feature-extraction mode, rather than for supervised prediction; therefore, no task-specific hyperparameter tuning, fine-tuning, or optimization was required. The model’s default transformer parameters (embedding dimension, hidden size, number of attention heads, and dropout settings) were retained because the goal was to obtain contextual semantic representations of police narrative text, rather than to train a classifier. Prior to embedding generation, the narrative data underwent standard preprocessing, including tokenization, normalization, lower-casing, removal of stop-words, and elimination of non-informative tokens such as isolated numbers and road names. This workflow follows the established practice in descriptive transformer-based text mining studies. Because the objective of the text mining stage was interpretive thematic extraction, rather than predictive modeling, traditional evaluation metrics (accuracy, precision, recall, or macro-F1) do not apply. Instead, evaluation relied on the internal consistency, thematic coherence, and cross-group stability of high-centrality keywords and semantic clusters. These patterns showed strong alignment with known crash-causation mechanisms, providing qualitative validation of the text mining outputs.
3. Impact of Cable Barriers on Reducing Injury Severities
Analysis of the impact of median cable barriers used a subset of the data that involved 576 individual highway segments with median cable barriers in the state of Tennessee. The analyzed cable barriers covered 48 counties and 32 different highways. A total of 6094 crashes that occurred along the segments with cable barriers, covering six years before and after installation, were downloaded. The crashes were further reviewed to obtain only the hit-barrier crashes, through selection of crashes with “cable barrier” as their first harmful event, where 1196 crashes were found. Further review of the hit-barrier crashes was done to determine the type of outcome (response) from the vehicle–cable collision. This was done by observing the vehicle trajectory after impact and police narratives provided in the PDF crash records known as crash hard copies obtained from TITANS, another online database. Collision diagrams proved to be the most useful tool in understanding the location and progression of events in a crash. After review, only 914 crashes had complete information on the observed impact responses. Safety effectiveness evaluation was a critical part of this study, conducted through rigorous methodologies to determine the impact of median cable barriers on reducing the crash frequency and injury severity. The evaluation process adhered strictly to the procedures outlined in the Highway Safety Manual (HSM), utilizing Empirical Bayes (EB) methods combined with safety performance functions (SPFs). The first step in the safety effectiveness evaluation process was the development of prediction models (safety performance functions, SPFs) which incorporated the number of crashes per segment, cable segment length and average annual daily traffic (AADT) per segment. The models built a baseline for the analysis, using the before cable crashes, then predicted the number of crashes which should have occurred if the median cable barriers were not installed. All coefficients used in the SPF calibration were estimated from the Tennessee crash dataset and were statistically significant at the 95% confidence level or higher. The direction and approximate magnitude of these Tennessee-specific coefficients were consistent with those reported in the Highway Safety Manual (HSM). The development of the model coefficients is shown in Table 1 [16].
Table 1.
Safety effectiveness evaluation models.
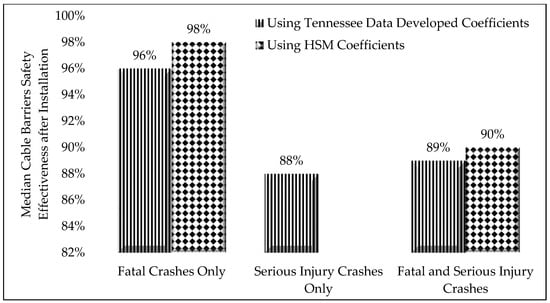
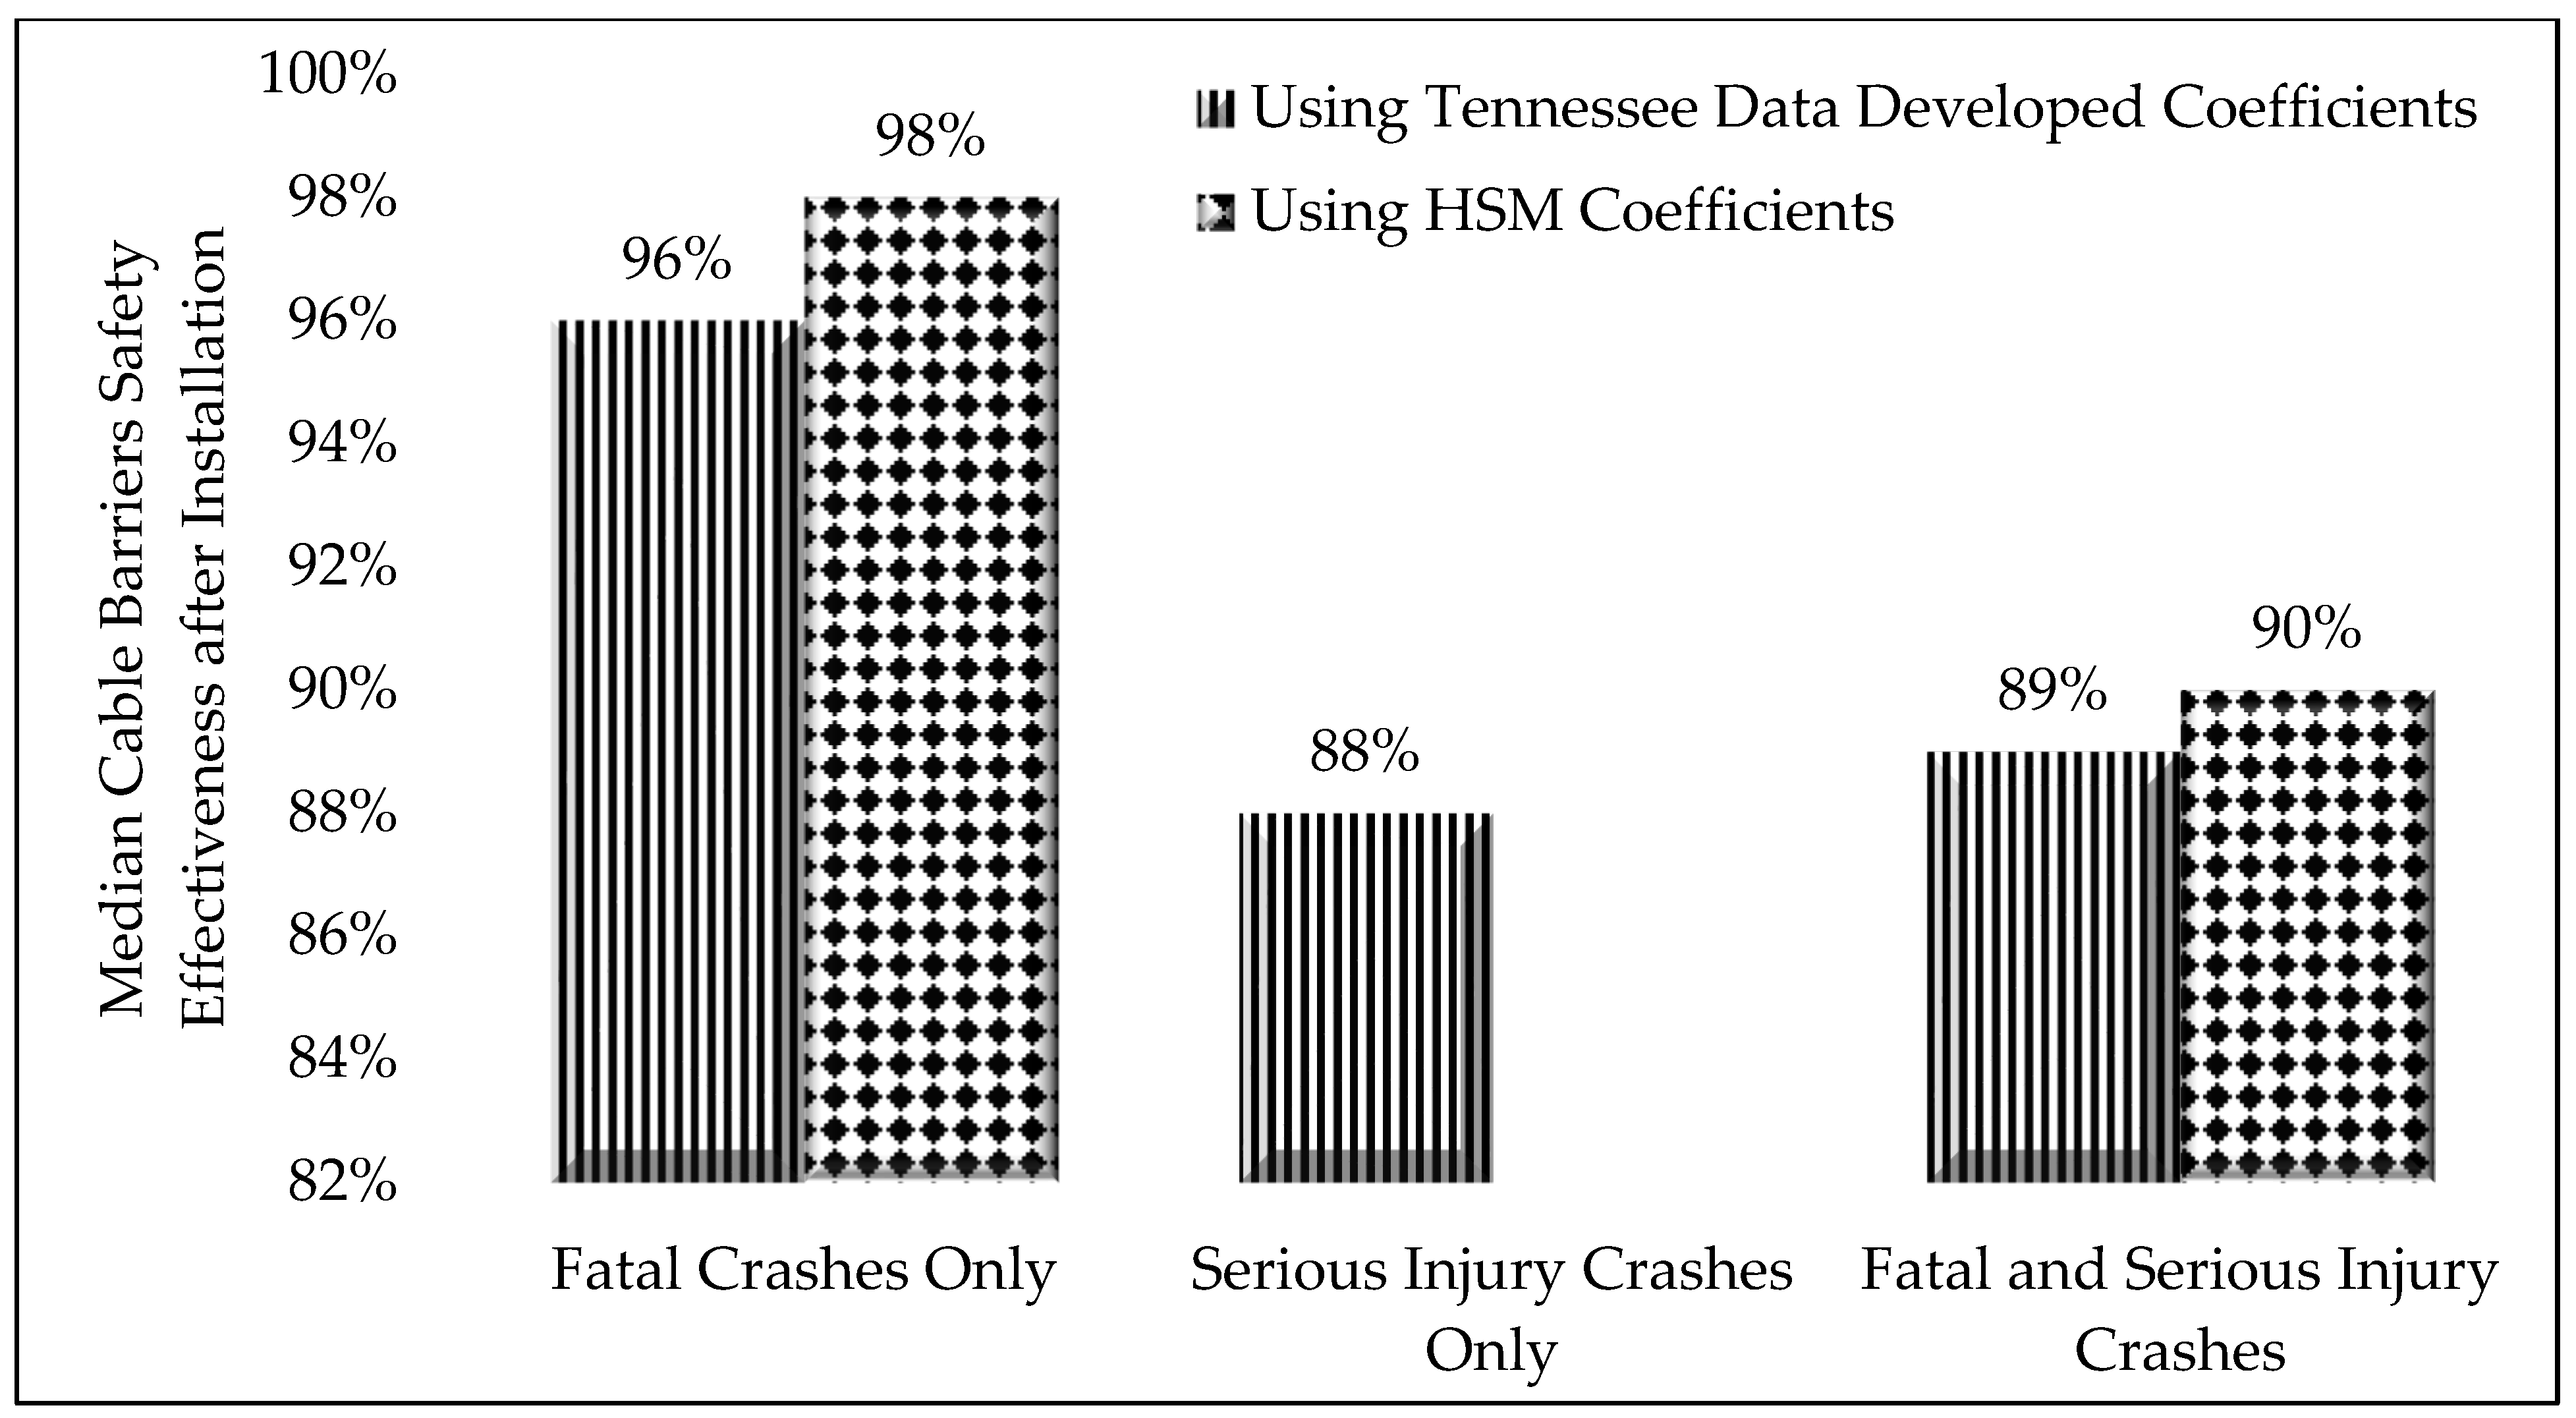
Key results from the safety effectiveness evaluation revealed substantial statewide reductions in severe crash occurrences following the installation of median cable barriers. Specifically, fatal crashes saw a safety effectiveness rate of 96%, serious injury crashes recorded 88% effectiveness, and combined fatal and serious injury crashes had an 89% reduction rate, Figure 5. These high percentages reflect significant safety enhancements that are attributable to cable barrier installations, affirming their effectiveness in significantly mitigating severe and potentially fatal median crossover crashes.
Figure 5.
Statewide median cable barrier safety effectiveness.
4. Vehicle Impact Responses
4.1. Overview of Impact Responses
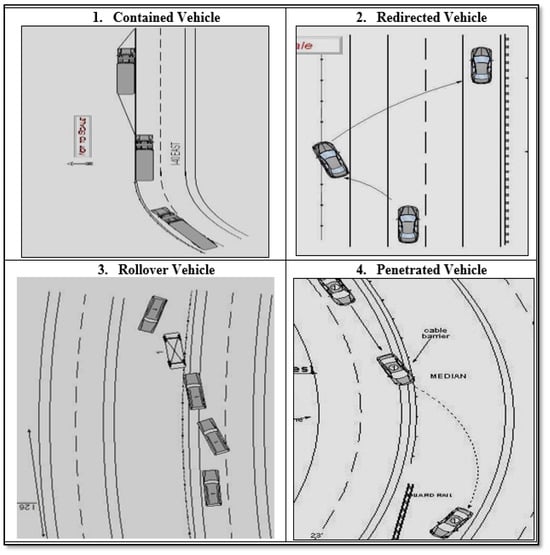
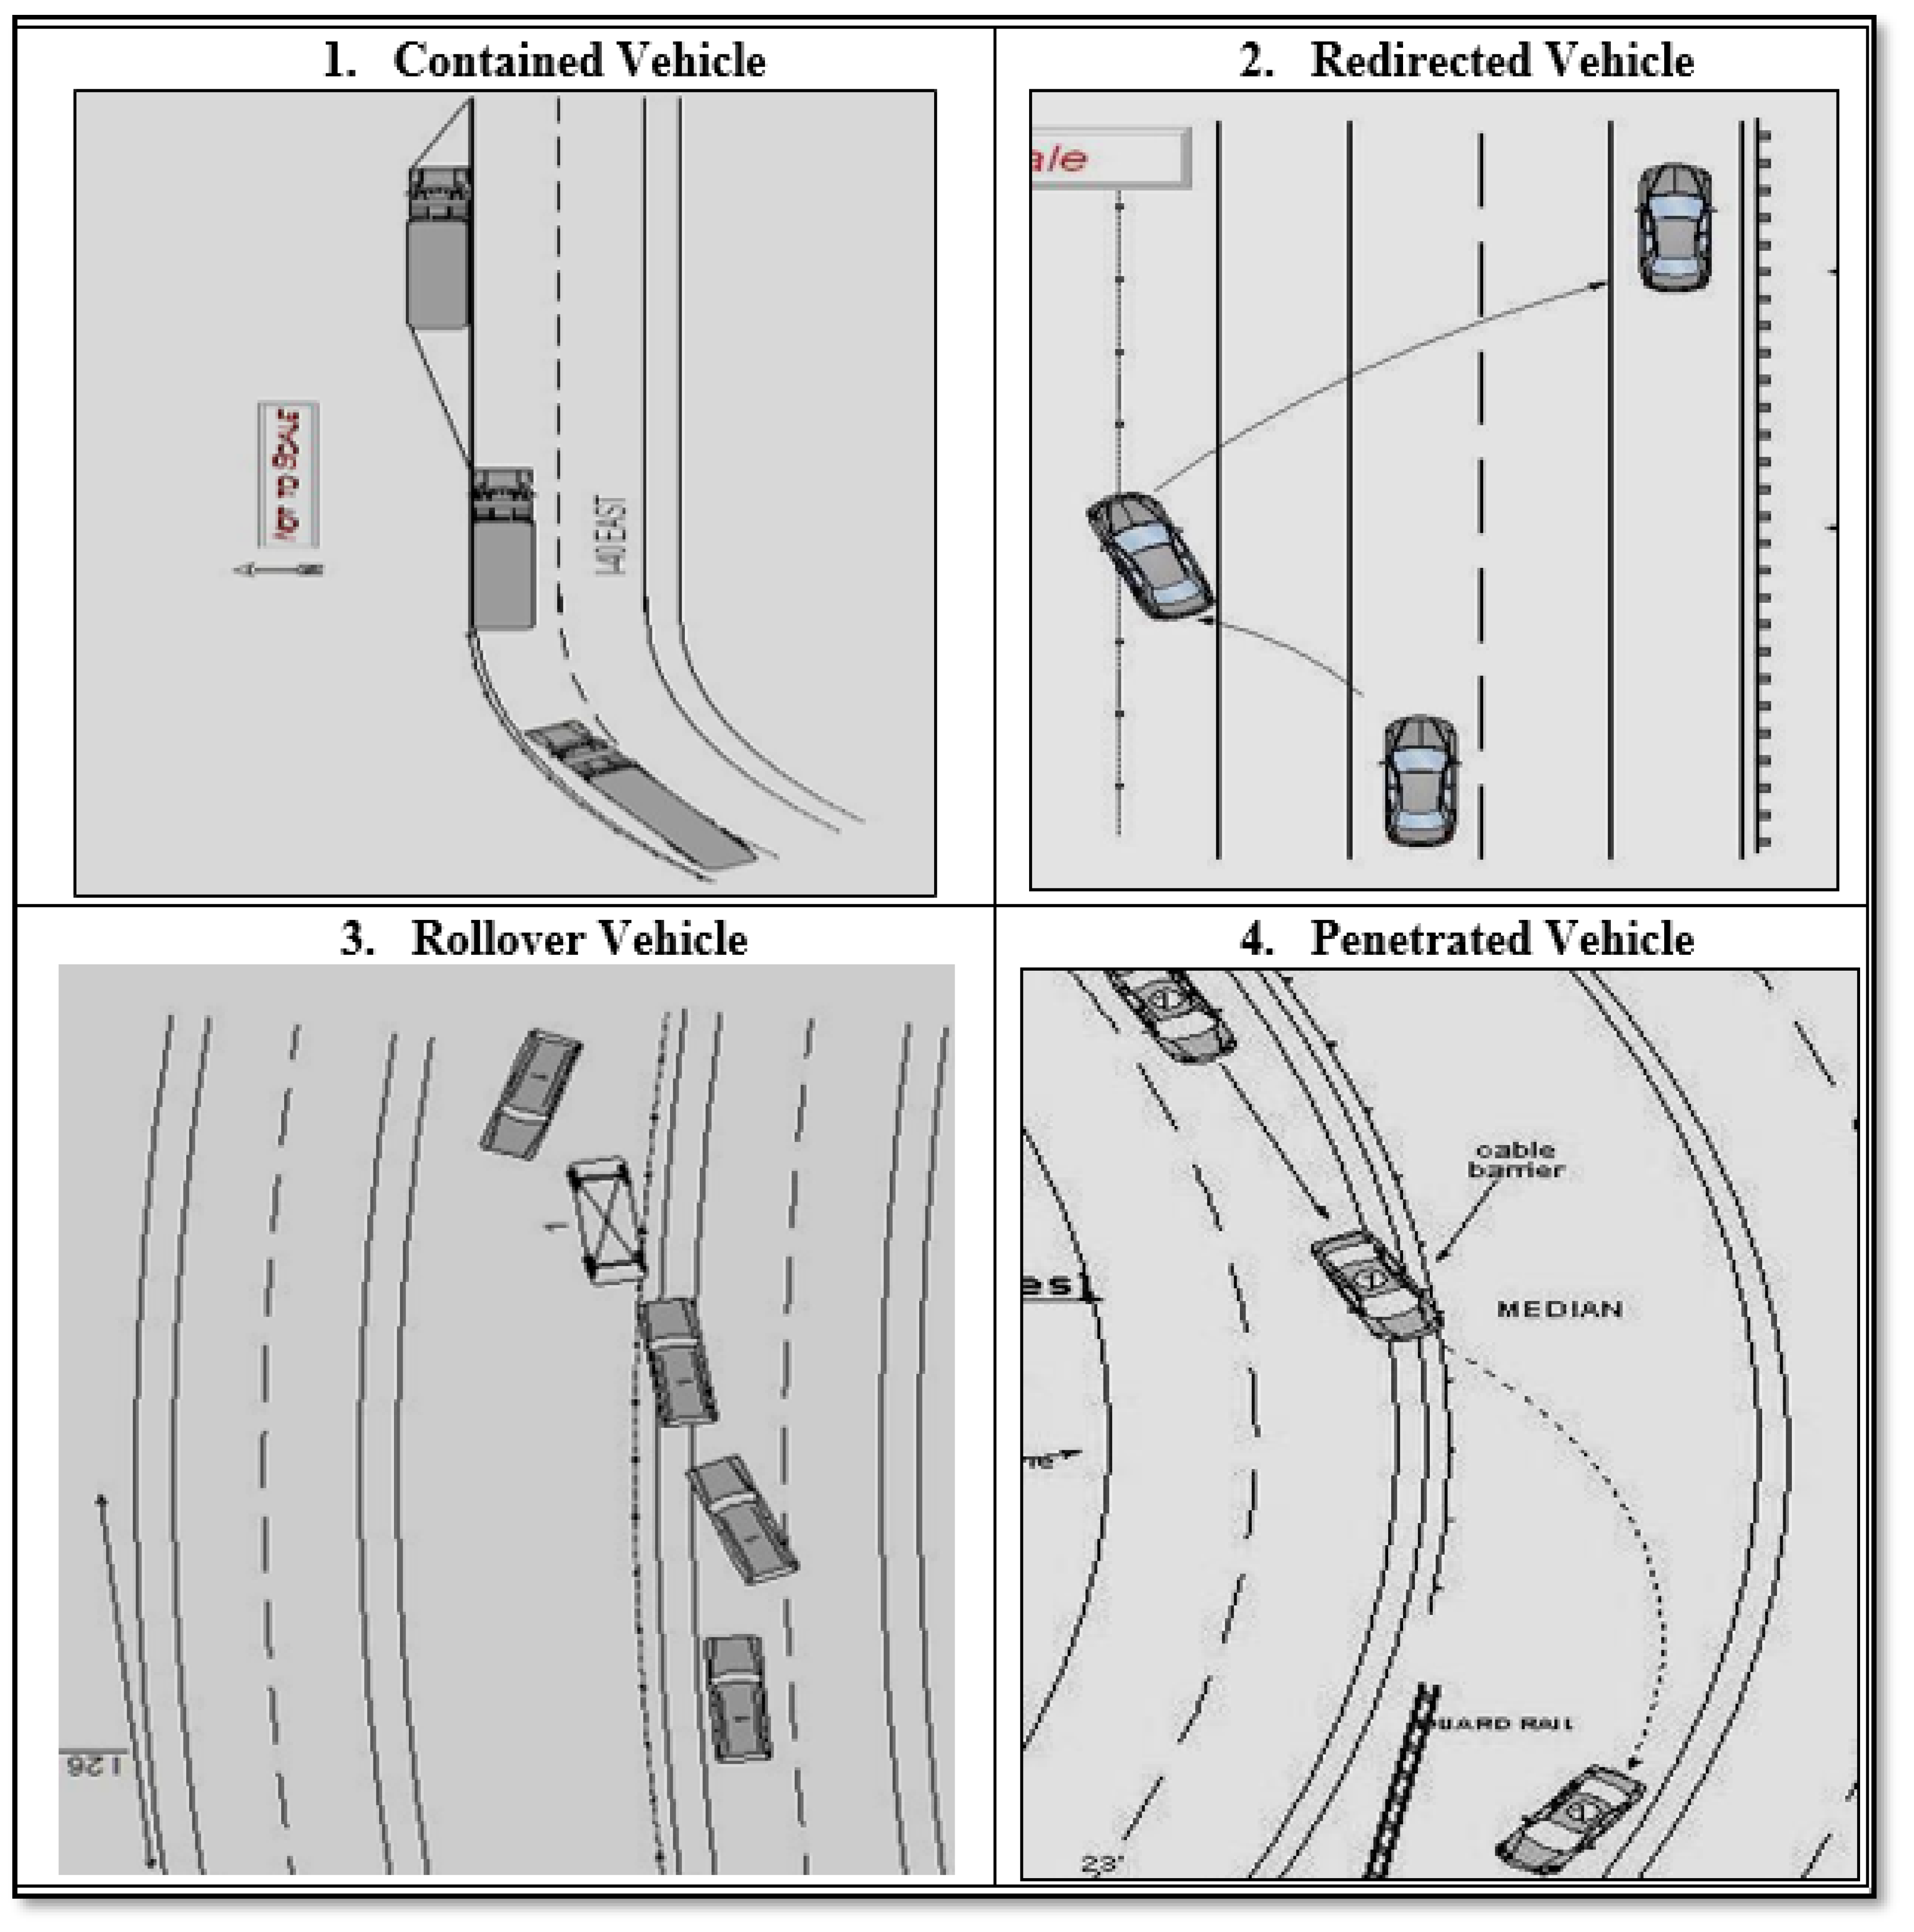
Each vehicle–cable impact was then categorized as containment, re-direction, rollover or penetration. Figure 6 depicts different vehicle–cable impact scenarios considered to be post-impact vehicular responses (PIVR) in this study. As shown in Figure 6, the containment category is considered to occur when a vehicle is contained and then brought to rest after the impact with the cable barrier. Redirection of the vehicle is said to occur when a vehicle is directed back to the travel lane after the impact with the cable barrier. The rollover response is said to occur when a vehicle flips as a result of hitting the barrier. Penetration crashes were defined as any crash in which the vehicle passed/broke through the barrier to the opposite side [13]. Such penetrations can be override, underride or through-cable penetration. The better illustrations of such cases are as shown in Figure 1, extracted from the reviewed police collision diagrams. In addition, the study considered the vehicle types that were involved in the collision. Information on the vehicle body type involved is provided in the crash characteristics. The vehicle classifications can take different forms, depending on the type of study. Stolle and Sicking [13] used a combination of Highway Loss Data Index (HLDI) vehicle classifications and National Highway Transportation Safety Administration (NHTSA) definitions to classify vehicles for studying impact conditions [1]. This study follows the same classifications by HLDI, in which five categories were obtained. Furthermore, traffic data and roadway geometry were included in the study. The traffic data were obtained from the TDOT traffic history website, which is open access. Roadway geometry data were also obtained from the ETRIMS website, where the information on shoulder width, median width and other aspects were obtained. Considering the reviewed sample, a larger percentage of the collision responses were containment and re-direction. Of the 749 collisions, only 7 rollovers and 44 penetrations were observed. Of the seven rollover cases, six involved light vehicles of the small and mid-size vehicle category. Only one heavy vehicle was involved. In addition, the distribution of responses within a given vehicle type indicates that heavy vehicles are associated with a larger percentage of penetrations (9 out of 25) compared with other vehicle types. These results imply that cable barrier penetrations are more associated with heavy vehicles than light vehicles. On the other hand, vehicle rollover is more pronounced among the light vehicles than the heavy vehicles.
Figure 6.
Post-impact vehicular responses.
4.2. MNL Regression
To examine the factors influencing impact responses, a multinomial logit (MNL) regression model was employed. As an extension of the binary logit model, MNL regression is appropriate when the dependent variable consists of more than two categories or outcomes [26,27]. In traffic safety research, MNL has been widely applied in the development of injury severity models, where outcomes such as fatal, injury, and possible injury represent the response categories [28]. The MNL model assumes that the choice between any pair of alternatives is independent of the availability of other alternatives, an assumption known as the independence of irrelevant alternatives (IIA) [29]. Even when the response categories are not ordered, MNL regression remains suitable. Additionally, independent variables in an MNL model may be either metric or non-metric in nature. In MNL regression, one outcome category is designated as the reference (base) category, against which all other categories are compared, resulting in multiple comparison groups. The model estimates the odds of membership in a given category, relative to the base category. For a response variable with J categories, the MNL model estimates J-1 equations, each representing a binary logistic comparison between a non-reference category and the base category. Using maximum likelihood estimation, the MNL model simultaneously estimates these J-1 logit functions. The probabilities of membership in each non-reference category are compared with the probability of membership in the reference category and are expressed as the logarithm of probability ratios or odds ratios, as shown below [30,31]:
where β are the coefficients and P is the probability of an outcome j under the given values of explanatory variables and n is the number of variables. To obtain the probability ratios, the equation can be re-arranged as follows [30]:
Considering the probability for the individual category given, the general logistic equation is given as (19)
where Xk is the independent variable, βi is the coefficient associated with each independent variable, and qk is a response variable with category j.
4.3. Variables Used
Four collision impact outcome categories—containment, redirection, rollover, and penetration—following vehicle–cable barrier collisions were defined as the response variables. Some previous studies, such as Sicking et al. [9], considered only rollover and penetration outcomes, while Stolle [13] examined factors contributing specifically to penetration responses involving median cable barriers. The performance of cable barriers is often evaluated by analyzing cases in which barrier breach or vehicle rollover occurs. However, including scenarios that demonstrate satisfactory cable barrier performance, in addition to failure cases, and subsequently applying regression modeling provides a more comprehensive understanding of the characteristics that influence cable barrier performance, both positively and negatively. Accordingly, this study incorporates all four possible outcome categories to examine the relationships between impact responses and various site and installation characteristics. This approach facilitates a more complete assessment of the site conditions associated with both poor and improved cable barrier performance. As noted earlier, the impact outcomes are influenced by a combination of environmental, roadway, and cable barrier installation characteristics. Therefore, impact responses were modeled as a function of the speed limit, shoulder width, cable barrier offset, segment length, initial run-off lane, median width, vehicle type, AADT, and surface condition as independent variables. Descriptive statistics were computed and the results are presented in Table 2.
Table 2.
Descriptive statistics of variables used.
4.4. Model Results
Among the four outcome categories, cable barrier containment was selected as the base category. The MNL model was estimated by using Stata 12 software [32], and the results are presented in Table 3. The table includes the model coefficients and their corresponding p-values as significance tests. Interpretation of the effects of the explanatory variables on the response categories is based on comparing each coefficient to that of the reference (base) category. Thus, redirection, rollover, and penetration outcomes are modeled relative to the reference category of containment. Both the magnitude and the sign of each coefficient are used for interpretation [33]. The model results show that cable barrier offset significantly influences the impact responses. Cable barriers installed closer to the traveled way are associated with higher probabilities of rollover and penetration compared to barriers installed farther from the roadway.
Table 3.
MNL results for containment as base outcome category.
In addition, cable barriers were found to more effectively contain and redirect passenger cars than heavy vehicles. The relationship between shoulder width and cable barrier offset is also noteworthy. Both wider shoulders and larger offset distances imply an increased recovery area and may be associated with impacts at relatively larger angles compared to segments with narrower shoulders and smaller offsets. Segments with wider shoulders also tend to be associated with higher levels of vehicle containment. For categorical variables—for example, speed limit—a positive coefficient indicates that vehicle–cable barrier impacts on segments posted at 65 or 70 mph have a higher probability of resulting in redirection rather than containment, compared to impacts occurring on segments with lower posted speed limits. Magnitude differences for the same variable across outcome categories retain their literal interpretation: the smaller the coefficient, the lower the influence of that variable on the likelihood of that outcome. For instance, the traffic volume (logAADT) exerts the strongest influence on the likelihood of penetration responses (coefficient 1.210), followed by rollover responses (coefficient 0.936), and has the least influence on redirection responses (coefficient 0.071), which are all relative to containment. Applying this interpretive logic, it can be seen that traffic volume (AADT), initial run-off lane (inner lane), and speed limit increase the probability of redirection, rollover, or penetration, relative to containment.
The remaining variables have negative coefficients, indicating a decreasing effect on the likelihood of redirection, rollover, or penetration when compared to containment. A brief evaluation of the independence of irrelevant alternatives (IIA) assumption was made by comparing the coefficient patterns across the three non-reference outcomes in Table 3. The results do not show proportional or parallel shifts in coefficients that would suggest dependence among alternatives. Key predictors—such as offset, shoulder width, AADT, and vehicle type—affect redirection, rollover, and penetration in distinct ways, rather than uniformly, indicating that the odds between any two categories are not being systematically influenced by the presence of the others. Although a formal Hausman–McFadden test could not be applied in the Rollover category due to a small sample size, the heterogeneous coefficient structure provides no practical indication of IIA violation in this dataset.
4.5. Predictive Margins
The influence of variables such as vehicle type, offset, alignment, and shoulder width can be better understood through the use of marginal probabilities. Recently, marginal plots have gained wide application because they provide a visual interpretation of logistic regression results. Using marginal effects, the change in the probability of each impact outcome due to a unit change in the predictor variables was determined. The marginal effect of an independent variable Xk on the choice probability for alternative j can be expressed as follows [29]:
Equation (4) depends not only on the parameter βjk but also on the mean of all other alternatives.
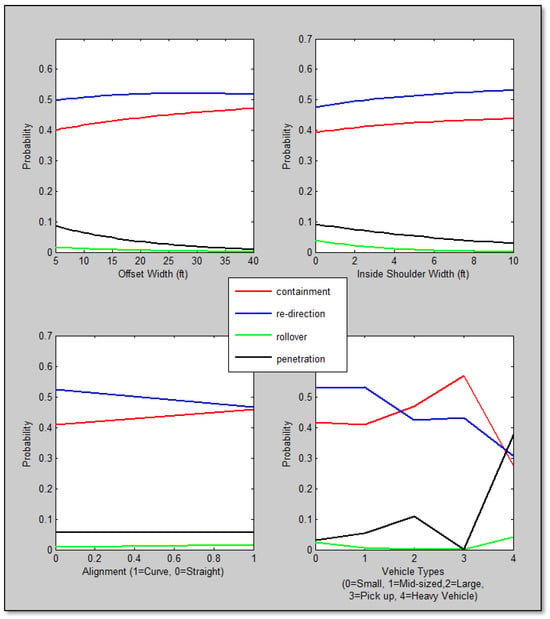
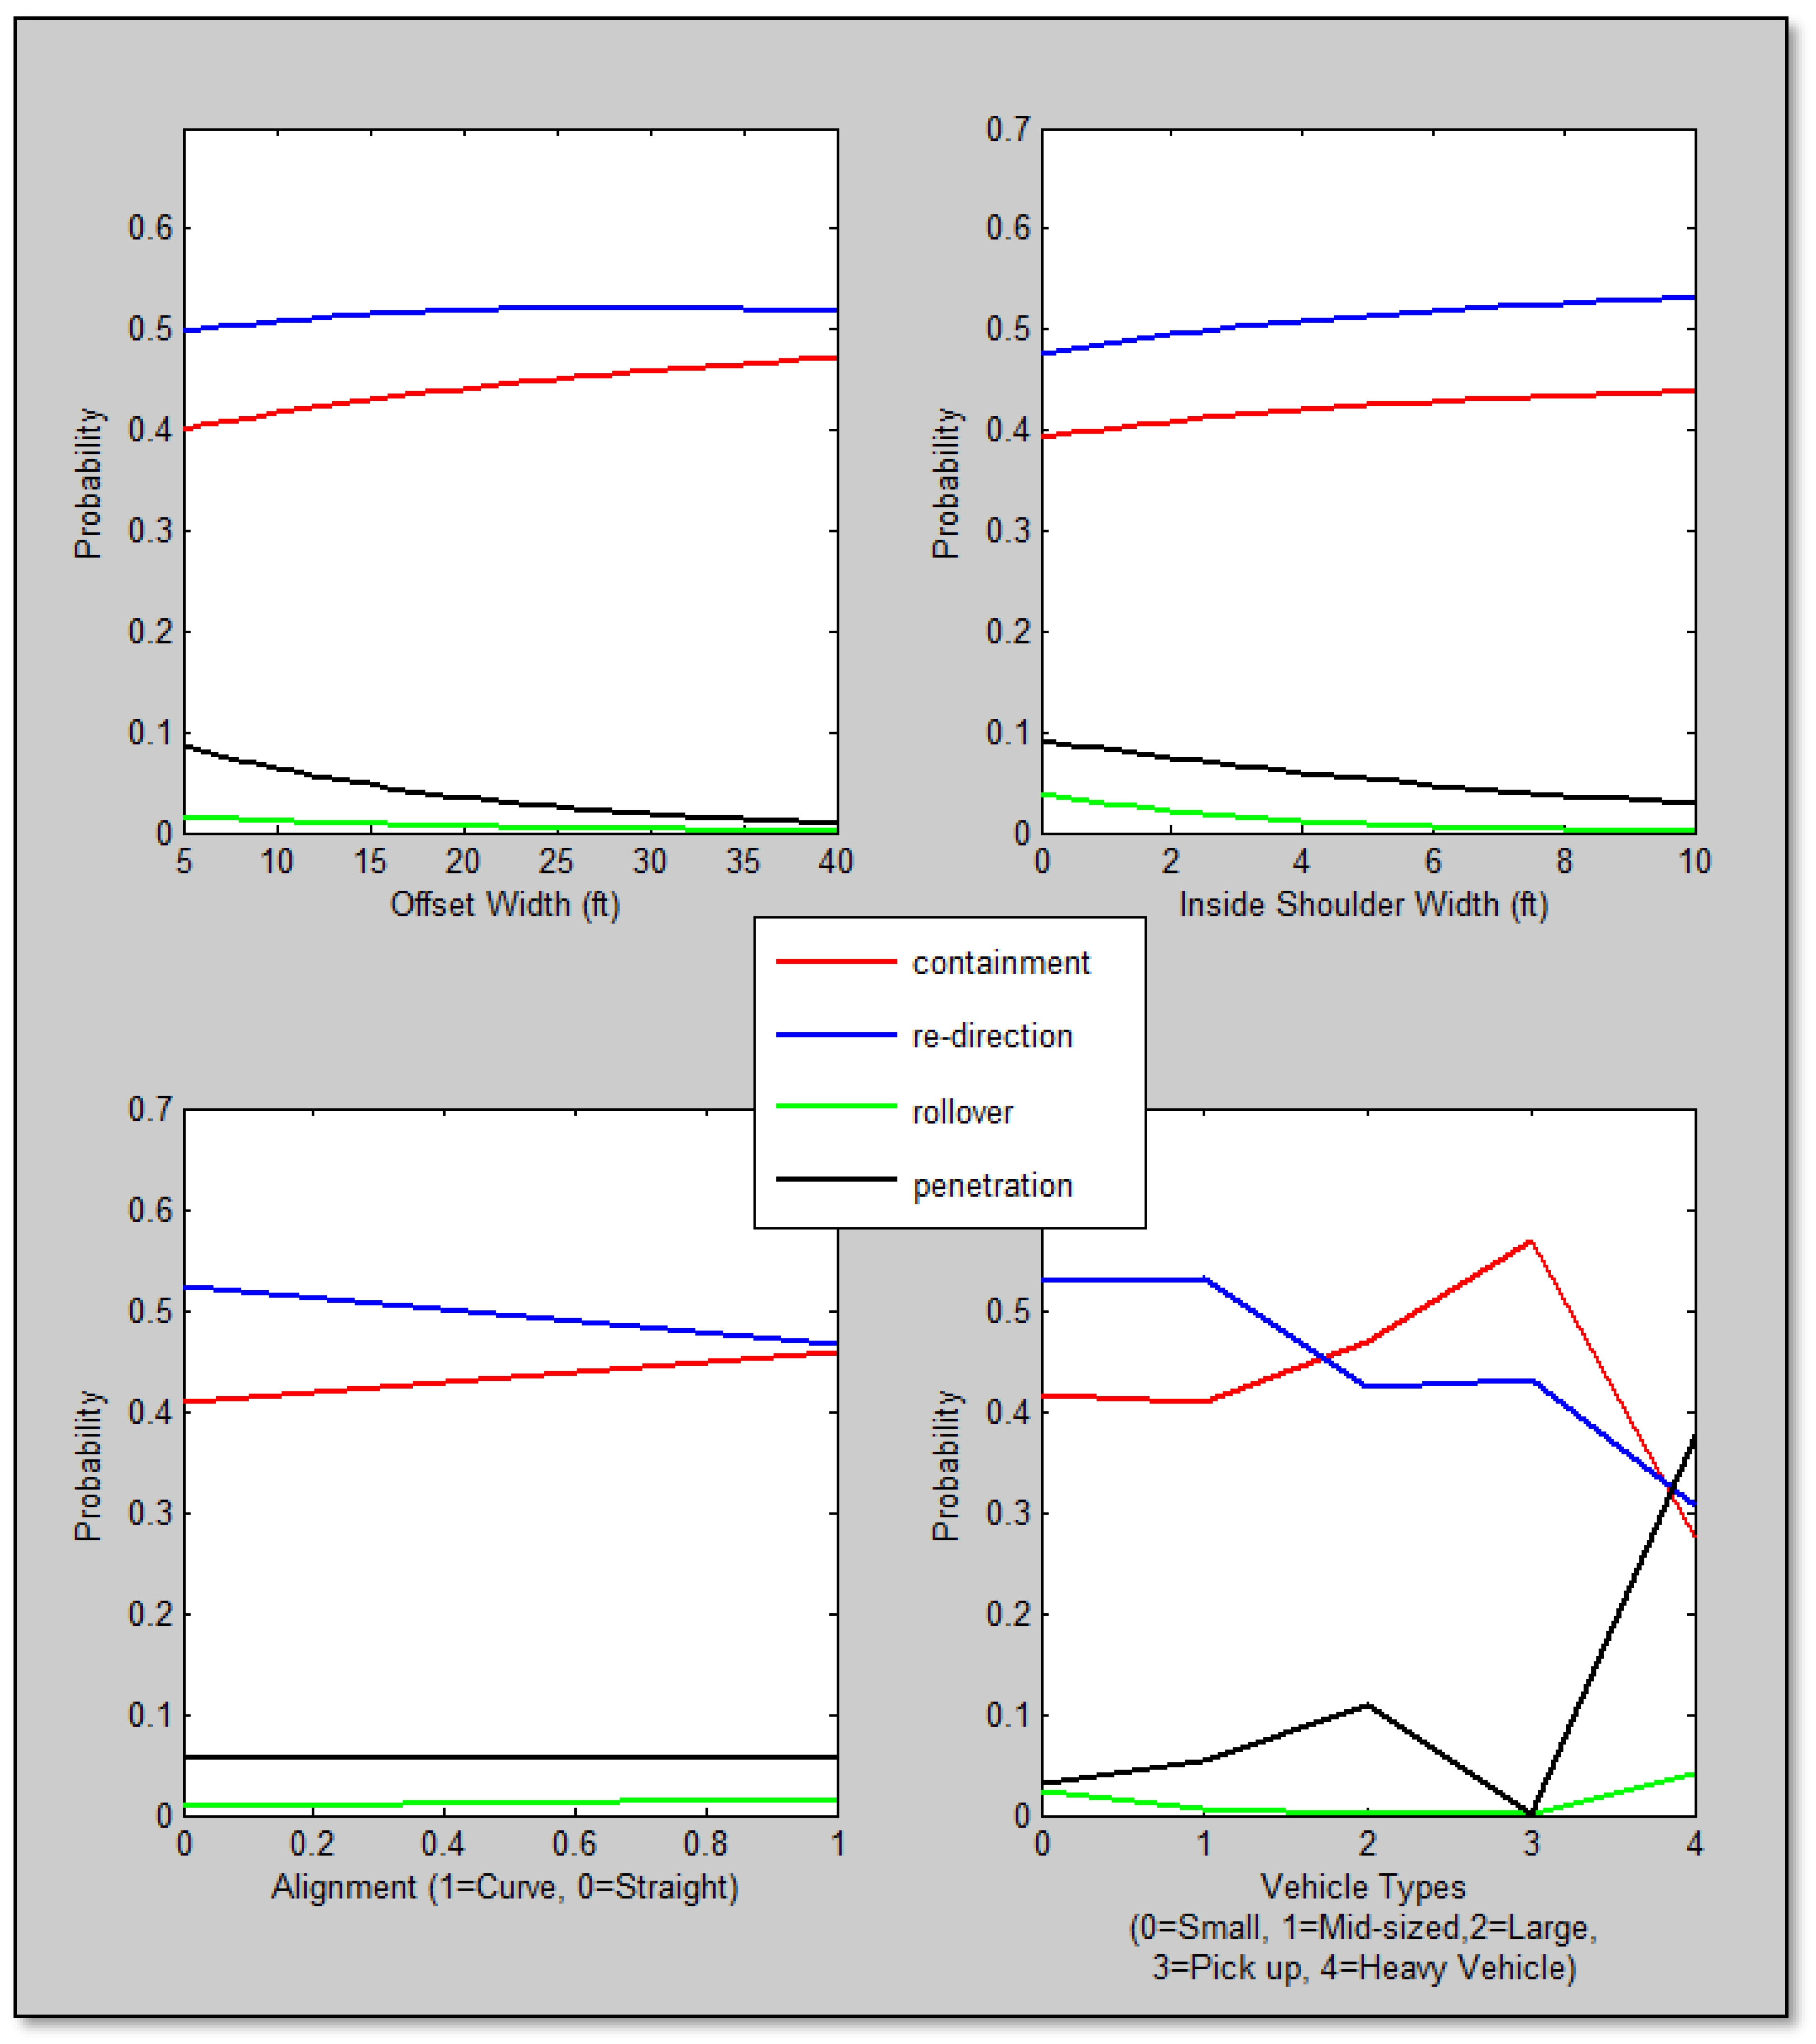
The marginal effect of a predictor is defined as the partial derivative of the event probability, with respect to the predictor of interest. A more direct measure is the change in predicted probability for a unit change in the predictor [34]. For a continuous variable, this refers to the change in predicted probability associated with a one-unit increase in the predictor value. For a categorical variable, the change in predicted probability reflects switching from one category (the base category) to another. Marginal effect plots were generated for different levels of continuous variables and for the different categories of categorical variables. Figure 7 shows the marginal probability plots for the analysis results for both continuous and categorical variables. As shown in Figure 7, the marginal probabilities for the containment and redirection responses are generally higher across nearly all plots compared to those for rollover and penetration. This indicates that vehicles have a higher likelihood of being contained or redirected than rolling over or penetrating the cable barrier. Since rollover and penetration represent poor performance of median cable barriers, the results suggest that cable barriers perform well by containing or redirecting a large percentage of vehicles. For continuous variables, the probabilities of containment or redirection increase with larger offset and shoulder width. Conversely, the probabilities of rollover and penetration also increase with offset and shoulder width. For categorical variables (alignment and vehicle type), the presence of curvature is associated with an increase in the containment probability and a reduction in the redirection probability. Surprisingly, the presence or absence of curvature appears to have almost no influence on the probabilities of rollover and penetration. This implies that penetration and rollover responses do not depend on whether the section is curved or straight.
Figure 7.
The marginal probability plot for selected variables.
As the vehicle type changes from a small vehicle to a heavy one, the probability of the vehicle being redirected decreases, while the probability of penetration increases. This aligns with the understanding that heavy vehicles possess higher inertial mass and therefore dissipate more energy into the cable barrier during impact. Conversely, the probabilities of containment and redirection decrease when heavier vehicles are involved.
The initial run-off lane is associated with lower containment probabilities for the outer lane compared to the inner lanes, although this pattern does not appear for the rollover and penetration responses. This indicates that lower approach angles—characteristic of inner run-off lanes—favor vehicle containment more than higher approach angles from outer lanes. An increase in speed is associated with a decrease in the vehicle containment probability and an increase in the redirection probability. A similar diminishing trend is observed for the penetration probability, while the rollover probability tends to increase with higher speeds. A surprising pattern emerges for the cable barrier redirection probability, which appears to increase over time.
It is important to note that two of the post-impact categories—rollover and penetration—represent relatively rare outcomes within the dataset, which can contribute to higher variance in parameter estimates. However, the estimated coefficients for these categories remained behaviorally consistent, statistically significant, and stable across repeated model estimations, indicating no evidence of the sign instability or reversal typically associated with rare-event bias. While the small sample size warrants cautious interpretation, the direction and magnitude of the effects align with the expected crash mechanics and prior research, supporting the robustness of the reported results.
5. Conclusions
This study presented a comprehensive, multimodal evaluation of median crossover crashes and the cable median barrier performance by integrating large-scale crash records, roadway and traffic characteristics, post-impact vehicle responses, and unstructured police crash narratives within a unified statistical and machine learning framework. Treating median crossover crashes as both a transportation safety problem and a population-level injury and public health concern, the research advanced conventional infrastructure safety analysis toward a data-driven, injury-focused paradigm that was consistent with emerging intelligent healthcare analytics. The safety effectiveness evaluation was conducted using Empirical Bayes methods and safety performance functions, and demonstrated substantial reductions in severe outcomes following cable barrier installation, including marked decreases in fatal and serious injury crashes across Tennessee freeway corridors. Beyond aggregate safety benefits, the study examined real-world vehicle–barrier interaction mechanisms by categorizing post-impact responses into containment, redirection, rollover, and penetration. Multinomial logit modeling with marginal effects revealed that geometric design and operational factors—particularly the cable barrier offset, shoulder width, traffic exposure, initial run-off lane, speed environment, and vehicle type—play critical roles in determining the impact outcomes and, by extension, injury severity. Rollover and penetration responses, which are strongly associated with elevated injury risk, were more likely under conditions of reduced offset, narrow shoulders, outer-lane departures, high traffic volumes, and heavy-vehicle involvement, while larger offsets and wider shoulders increased the likelihood of containment or redirection. These findings provide actionable, evidence-based insights for improving barrier placement, roadway design, and system-level injury mitigation strategies.
A key contribution of this work lies in its application of deep learning-based text mining, using a BERT transformer model to analyze police crash narratives. By extracting semantic patterns related to loss of control, impact dynamics, and contextual contributing factors, the machine learning analysis revealed injury-mechanism insights that are not captured in structured crash databases alone. The convergence of narrative-derived indicators with statistical and regression-based findings reinforced the value of multimodal data fusion for understanding complex, high-severity events. This approach mirrors contemporary intelligent healthcare practices that integrate heterogeneous data sources to improve diagnosis, prognosis, and risk stratification, while emphasizing explainable and trustworthy modeling. This also supports some previous studies that demonstrated the advantages of textual data and reliable network analysis in which it was pointed out that text data analysis proves to be more convenient, yielding a richer array of comprehensive information while demanding less subjective judgment [35].
Although the multinomial logit (MNL) framework applied in this study provides valuable insights into the influence of roadway, traffic, and vehicle characteristics on post-impact outcomes, it does not explicitly account for unobserved heterogeneity across crashes. Median crossover events often involve latent factors—such as instantaneous driver reactions, subtle geometric variations, or unrecorded crash dynamics—that may vary across observations but are not captured in the available dataset. Because the MNL model assumes parameter homogeneity, the estimated effects may not fully reflect this underlying variability. Future work could incorporate advanced modeling approaches such as random-parameter logit, mixed logit, or latent-class models to better account for unobserved heterogeneity and produce more flexible, behaviorally realistic estimates of impact response probabilities. The study demonstrated how transportation safety data can be repurposed within a multimodal intelligent analytics framework to support injury prevention, infrastructure decision-making, and population-level health impact reduction. Through combining explainable econometric models with deep learning-enabled text analysis, the proposed methodology offered a scalable and transferable blueprint for cross-domain applications where unstructured and structured data must be jointly interpreted. Future research may extend this framework by incorporating barrier proprietary types, richer vehicle dynamics information, curve directionality, and privacy-preserving or federated learning architectures to support broader cross-jurisdictional deployment. In doing so, this work contributes to the growing intersection of intelligent systems, biomedical-inspired injury analytics, and data-driven healthcare methodologies.
Author Contributions
The research was conceptualized and led by D.C.; data acquisition, preprocessing, and modeling were conducted by D.C., S.B., J.M., P.M. and W.M. contributed to the technical oversight and methodological guidance throughout the project; both authors ensured alignment with the study goals; the manuscript was drafted, revised and formatted by both D.C. and the co-authors. All authors have read and agreed to the published version of the manuscript.
Funding
This research received no external funding.
Institutional Review Board Statement
The study did not require ethical approval, as the study does not involve humans or animals. It is just publicly available data.
Data Availability Statement
The crash data and roadway characteristics were requested from the Tennessee Department of Transportation (TDOT)-managed eTRIMS database and through publicly available sources like https://tdot.public.ms2soft.com/tcds/tsearch.asp?loc=Tdot&mod=TCDS, Accessed on 07 July 2025.
Conflicts of Interest
The authors declare no conflicts of interest related to the publication of this research.
References
- Marzougui, D.; Mahadevaiah, U.; Tahan, F.; Kan, C.D.; McGinnis, R.; Powers, R. National Cooperative Highway Research Program. Report 711 Guidance for the Selection, Use, and Maintenance of Cable Barrier Systems; Transportation Research Board of the National Academies: Washington, DC, USA, 2012. [Google Scholar]
- Ross, H.E., Jr.; Sicking, D.L.; Zimmer, R.A.; Michie, J.D. National Cooperative Highway Research Program. Report 350 Recommended Procedures for the Safety Perfomance Evaluation of Highway Features; National Academy Press: Washington, DC, USA, 1993. [Google Scholar]
- American Association of State Highway and Transportation Officials (AASHTO). Summary of Differences Between MASH and NCHRP 350. Online. Available online: https://bookstore.transportation.org/imageview.aspx?id=708&DB=3 (accessed on 18 June 2025).
- Tuan, C.Y.; Sarmah, R.D.; Tuan, A.Y.; Kao, C.-S.; Li, Q. Progressive Failure Simulation of Security Cable Barriers. Int. J. Nonlinear Sci. Numer. Simul. 2010, 11, 753–773. [Google Scholar] [CrossRef] [Scilit]
- Federal Highway Administration. Acceptance Letter to Gibraltar, Washington, DC, 2005. Available online: https://www.gibraltarglobal.com/wp-content/uploads/2018/02/NCHRP350-TL33-Cable.pdf (accessed on 9 February 2026).
- Stolle, C.S.; Sicking, D.L. Cable Median Barrier Failure Analysis and Prevention; Final Report to the Midwest State’s Regional Pooled Fund Program and Mid-America Transportation Center (MATC), Transportation Research Report No. TRP-03-275-12; MATC WBS: 25-1121-0001-428; 2012; Project Code: MATC TRB RiP No. 28495; Midwest Roadside Safety Facility, University of Nebras-ka-Lincoln: Lincoln, NE, USA, 2012. [Google Scholar]
- King, M.; Dean, S.; Daniel, B.; Brian, C. National Co-operative Highway Research Program (NCHRP 665). In Identification of Vehicular Impact Conditions Associated with Serious Ran-off-Road Crashes; Transportation Research Board: Washington, DC, USA, 2010; Available online: https://trid.trb.org/View/1082900 (accessed on 5 July 2025).
- Monsere, C.M.; Sposito, B.; Johnston, S. Safety Effectiveness and Operating Performance of Three-Cable Median Barrier on Interstate 5 in Oregon. In Institute of Transportation Engineers 2003 Annual Meeting and Exhibit (Held in Conjunction with ITE District 6 Annual Meeting); Institute of Transportation Engineers (ITE): Washington, DC, USA, 2003. [Google Scholar]
- Sicking, D.L.; Stolle, C.S. Factors Leading to Cable Median Barrier Failures. Available online: https://trid.trb.org/View/1289494 (accessed on 31 December 2025).
- Coon, B.A. Development of Crash Reconstruction Procedures For Roadside Safety Appurtenances; The University of Nebraska-Lincoln: Lincoln, NE, USA, 2003. [Google Scholar]
- Chimba, D.; Macha, I. Updating Median Cable Barrier System Safety Effectiveness Evaluation; Tennessee Department of Transportation (TDOT): Nashville, TN, USA, 2025. Available online: https://www.tn.gov/content/dam/tn/tdot/research/final-reports/2023-final-reports-and-summaries/RES2023-22-Final%20Report.pdf (accessed on 8 March 2025).
- Shankar, V.; Chayanan, S.; Sittkariya, S.; Shyu, M.B.; Ulfarsson, G.; Juvva, N.K. Median Crossover Accident Analyses and The Effectiveness of Median Barriers; Washington State Transportation Commission: Seattle, WA, USA, 2004. [Google Scholar]
- Stolle, C.S. Factors Contributing to Cable Median Barrier Penetrations. In Proceedings of the Transportation Research Board 93rd Annual Meeting, Washington, DC, USA, 12–16 January 2014. [Google Scholar]
- Chimba, D.; Emaasit, D.; Allen, S.; Hurst, B.; Nelson, M. Factors affecting Median Cable Barrier Crash Frequency: New Insights. J. Transp. Saf. Secur. 2014, 6, 62–77. [Google Scholar] [CrossRef] [Scilit]
- Chimba, D.; Ruhazwe, E.; Allen, S.; Waters, J. Digesting the Safety Effectiveness of Cable Barrier Systems by Numbers. J. Transp. Res. Part A: Policy Pract. 2017, 95, 227–237. [Google Scholar] [CrossRef] [Scilit]
- American Association of State Highway and Transportation Officials (AASHTO). Highway Safety Manual; AASHTO: Washington, DC, USA, 2010. [Google Scholar]
- Sudipta, C.; Alzarrad, A. Applications of Text Mining in the Transportation Infrastructure Sector: A Review. Information 2023, 14, 201. [Google Scholar] [CrossRef] [Scilit]
- Kutela, B.; Combs, T.; Mwekh’iga, R.J.; Langa, N. Insights into the long-term effects of COVID-19 responses on transportation facilities. Transp. Res. Part D: Transp. Environ. 2022, 111, 103463. [Google Scholar] [CrossRef] [Scilit] [PubMed]
- Arteaga-Sanchez, C. Identification of Factors Contributing to Traffic Crashes by Analysis of Text Narratives. Doctoral Dissertation, University of Nevada, Las Vegas, NV, USA, 2022. Available online: https://www.proquest.com/dissertations-theses/identification-factors-contributing-traffic/docview/2825739607/se-2 (accessed on 9 July 2025).
- Devlin, J.; Chang, M.-W.; Lee, K.; Toutanova, K. BERT: Pre-training of Deep Bidirectional Transformers for Language Understanding. In Proceedings of the NAACL-HLT 2019, Minneapolis, MN, USA, 2–7 June 2019; pp. 4171–4186. Available online: https://arxiv.org/abs/1810.04805 (accessed on 31 December 2025).
- Vaswani, A.; Shazeer, N.; Parmar, N.; Uszkoreit, J.; Jones, L.; Gomez, A.N.; Kaiser, Ł.; Polosukhin, I. Attention Is All You Need. Adv. Neural Inf. Process. Syst. (NeurIPS) 2017, 30. Available online: https://arxiv.org/pdf/1706.03762 (accessed on 31 December 2025).
- Simplilearn. What is Text Mining in Data Mining?|Simplilearn. 2022. Available online: https://www.simplilearn.com/what-is-text-mining-in-data-mining-article#GoTop (accessed on 1 January 2026).
- Yoon, B.; Park, Y. A text-mining-based patent network: Analytical tool for high-technology trend. J. High Technol. Manag. Res. 2004, 15, 37–50. [Google Scholar] [CrossRef] [Scilit]
- Youngji, K.; Jang, S. Mapping the knowledge structure of frailty in journal articles by text network analysis. PLoS ONE 2018, 13, e0196104. [Google Scholar] [CrossRef] [Scilit]
- Kutela, B.; Li, S.; Das, S.; Liu, J. ChatGPT as the Transportation Equity Information Source for Scientific Writing. arXiv 2023, arXiv:2303.11158. [Google Scholar]
- Quddus, M.A.; Noland, R.B.; Chin, H.C. An analysis of motorcycle injury and vehicle damage severity using ordered Probit models. J. Saf. Res. 2002, 33, 445–462. [Google Scholar] [CrossRef] [Scilit] [PubMed]
- Mouskos, K.C.; Sun, W.; Qu, T. Impact of Access Driveways on Accident Rates At Multilane Highways; National Center for Transportation and Industrial Productivity: Newark, NJ, USA, 1999. [Google Scholar]
- Geedipally, S.R.; Lord, D. Investigating the Effect of Modeling Single-Vehicle and Multi-Vehicle. Accid. Anal. Prev. 2010, 42, 1273–1282. [Google Scholar] [CrossRef] [Scilit] [PubMed]
- Chimba, D.; Sando, T. Multinomial Probability Assessment of Motorcycle Injury Severities. Adv. Transp. Stud. Int. J. 2010, 21, 73–81. [Google Scholar]
- Rodriguez, G. Princeton University: Generalized Linear Models. Available online: https://grodri.github.io/glms/notes/ (accessed on 18 July 2025).
- Washington, S.; Karlaftis, M.; Mannering, F.L. Statistical and Econometric Methods for Transportation Data Analysis; Chapman & Hall/CRC: Boca Raton, FL, USA, 2002. [Google Scholar]
- UCLA Statistical Consulting Group. Stata Annotated Output: Multinomial Logistic Regression. Available online: https://stats.oarc.ucla.edu/stata/output/multinomial-logistic-regression/ (accessed on 27 July 2025).
- IBM SPSS Statistics. Available online: https://www.ibm.com/docs/en/spss-statistics/30.0.0?topic=regression-linear-statistics (accessed on 9 February 2026).
- Usage Note 22604: Marginal Effect Estimation for Predictors in Logistic and Probit Models, SAS Software Webpage, 2005. Available online: http://support.sas.com/kb/22/604.html (accessed on 29 July 2025).
- Zhao, Y.; Kang, K.; Jia, W.; Guo, Z.; Zhang, J.; Zhu, T. Examining traffic violations in severe casualty truck crashes: A text mining and reliable network analysis of narrative reports. Traffic Inj. Prev. 2025, 1–10. Available online: https://www.tandfonline.com/doi/full/10.1080/15389588.2025.2553194 (accessed on 24 July 2025). [CrossRef] [Scilit] [PubMed]

Disclaimer/Publisher’s Note: The statements, opinions and data contained in all publications are solely those of the individual author(s) and contributor(s) and not of MDPI and/or the editor(s). MDPI and/or the editor(s) disclaim responsibility for any injury to people or property resulting from any ideas, methods, instructions or products referred to in the content. |
© 2026 by the authors. Licensee MDPI, Basel, Switzerland. This article is an open access article distributed under the terms and conditions of the Creative Commons Attribution (CC BY) license.