


Abstract
The lack of power system inertia caused by the large-scale integration of renewable energy seriously threatens frequency stability. In this paper, a control strategy for collaborating multiple wind farms in frequency support considering the frequency distribution characteristic is presented. Firstly, the DC power flow analysis model of the power system is established, the analytical relation between the node frequency and the active power disturbance is derived, and the system frequency distribution characteristic is mathematically analyzed. Secondly, based on the frequency distribution characteristic, a control strategy for collaborating multiple wind farms using virtual inertia control and droop control to provide frequency support is presented. Finally, the four-machine two-area system integrated with two wind farms is implemented in Matlab 2020, and the effectiveness of the proposed collaborative control strategy for frequency support is validated through simulation results.
1. Introduction
Due to the exhaustion of fossil fuels and global goals to reduce carbon emissions, developing renewable energy is essential to addressing the current energy crisis and environmental issues. Nowadays, the high penetration of renewable energy and the increasing proportion of power electronic equipment are becoming the main characteristics of the new-type power system in China [1,2,3]. By the end of 2023, the installed capacity of renewable energy exceeded 1.05 billion kW [4,5]. On the one hand, renewable energy cannot provide effective inertia for the power system because maximum power point tracking (MPPT) control is often used, decoupling frequency and active power [6,7]. On the other hand, traditional synchronous generators are gradually being replaced by renewable energy sources, resulting in a continuous decline in the level of power system frequency stability [8,9,10]. Therefore, it is of great importance to thoroughly study and develop an effective method to improve the frequency stability of a power system with high penetration of renewable energy.
Scholars have conducted extensive, in-depth research on wind farms participating in frequency support. Droop control is often employed by wind farms to provide frequency support. The design rule of the droop control coefficient is presented in [11], and the maximum droop coefficient considering the rotor speed constraint is given. Next, the time-variable droop characteristic is proposed in [12], where the positive droop coefficient is followed by a duration of a negative droop coefficient to achieve smooth recovery of the kinetic energy. Virtual inertia control is another control method frequently adopted by wind farms to participate in frequency support. A lag-lead-based phase compensator is proposed to reduce the low-pass filter delay in the virtual inertia control loop and increase its response speed [13]. Considering varying wind speeds, an adaptive virtual inertia control based on fuzzy logic theory is further proposed [14]. To improve frequency support performance, an adaptive frequency support control strategy for a wind farm is presented in [15,16]. The proportional gain is adaptively adjusted based on rotor speed so that the secondary frequency drop is avoided and rotor speed recovery is improved. In order to achieve frequency regulation similar to synchronous generators, the rotor speed and pitch angle are combined to enable wind farms to pre-reserve a portion of wind power [17]. Moreover, based on linear optimization, a coordinated power reserve for a wind farm is implemented, which can maximize kinetic energy and minimize the blade pitch action of the wind turbine generator [18].
Traditionally, the frequency of all system nodes after a disturbance can be approximately represented by a certain system node frequency. With the increasing proportion of renewable energy, for the same disturbance, the frequency difference across system nodes at the same time becomes larger due to decreased system inertia, and the frequency of all system nodes cannot be represented by a single node frequency [19]. This phenomenon is also called the frequency distribution characteristic. Additionally, in the above current frequency support control strategy, each wind farm provides frequency support independently. In order to improve the frequency distribution characteristic and frequency support performance, mutual cooperation between wind farms warrants attention; such research is rare. Therefore, a collaborative control strategy of wind farms for frequency support is put forward, where the wind farm could adjust its participation intensity based on the node location of the system frequency extremum. The effectiveness is further validated by Matlab-based simulation results.
The remainder of this paper is organized as follows. In Section 2, the DC power flow analysis model of the power system is established. Then, the analytical relation between the different system node frequencies and the active power disturbance is derived theoretically, and its frequency distribution characteristic is further analyzed mathematically. In Section 3, based on the frequency distribution characteristic, a collaborative control strategy for multiple wind farms adopting virtual inertia control and droop control is proposed to participate in frequency support. Finally, the effectiveness of the frequency support collaborative control strategy is validated through simulation results of the improved four-machine two-area power system in Section 4. Section 5 concludes this paper.
2. Frequency Distribution Characteristic
2.1. Frequency Distribution Characteristic of Multi-Machine Systems
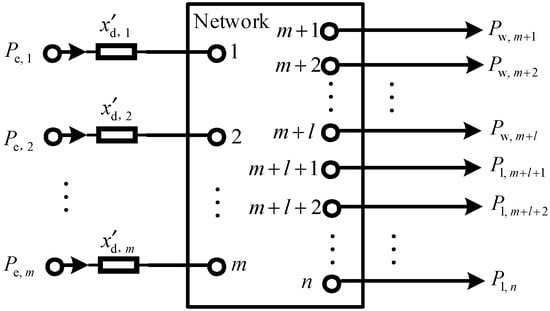
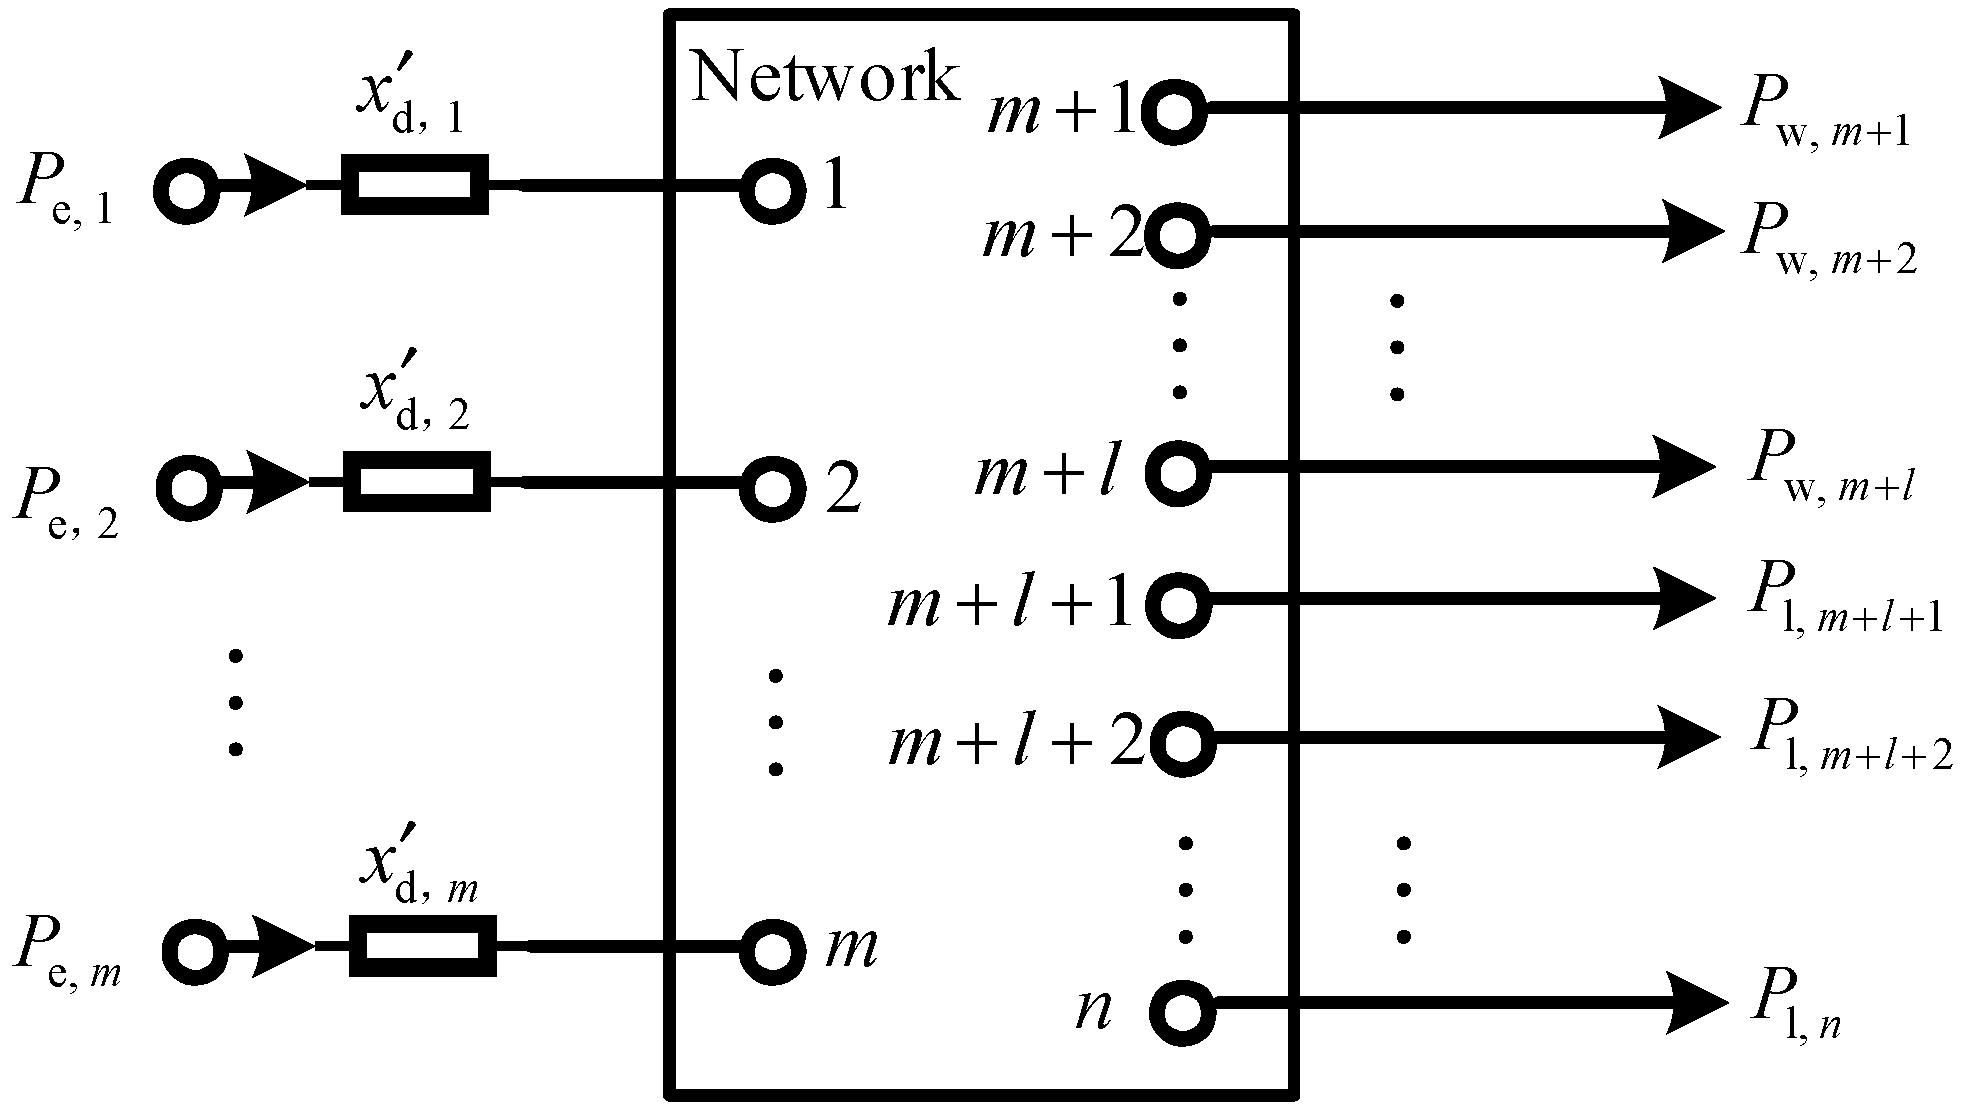
For the high-voltage transmission power system, the line resistance is much smaller than the reactance. The DC power flow method can be employed to approximately establish the mathematical relation between active power and rotor angle (phase angle), and the frequency derivation at each system node after an active power disturbance can then be further deduced [20]. Therefore, the following three assumptions are given: (1) the active power losses are ignored; (2) the effects of the reactive power and bus voltages are neglected; and (3) both synchronous generators and wind farms are regarded as power injection models at the corresponding buses. Next, the equivalent model of the power system with buses, including generator buses and wind farm buses, is given in Figure 1, where , and are the active power of -th synchronous generator, -th wind farm and -th load and is the transient reactance of -th synchronous generator.
Figure 1.
Equivalent model of a power system integrated with multiple wind farms.
Then, Equation (1) is further obtained.
where is the set of synchronous generator nodes and is the set of load nodes, where the wind farm nodes are regarded as part of the set of load nodes. , , and are the corresponding susceptance matrices. and are the rotor angle of the synchronous generator and the phase angle of the load node, respectively.
It can be further obtained from Equation (1) that
When the load changes from to in a short time , the power variation of the synchronous generator is
The dynamic characteristic of the -th synchronous generator can be represented by [21]:
where , is the rotor angle, and are the angular velocity and rated angular velocity, and are the mechanical power and electromagnetic power, and is the inertia coefficient.
Next, it can be known from Equations (3) and (4) that
Due to the fact that , Equation (6) is further obtained.
Without considering the primary frequency modulation and damping of synchronous generators, we can get from Equation (6) that the frequency of the -th generator node in can be represented by
where is the frequency deviation of the -th generator node and is the rated frequency.
According to Equation (7), the frequency of the synchronous generator node after the active power disturbance is related to the network structure and its inertia.
Furthermore, it can be deduced from Equation (1) that
The frequency deviation of the -th load node can be obtained by taking the derivative of Equation (8) with respect to time .
Then, we can get that
Moreover, due to the fact that , the frequency of the -th load node satisfies the following relation.
Based on Equations (7) and (11), the frequency distribution characteristic of the power system after an active power disturbance is analyzed mathematically as follows.
- (1)
- For the synchronous generator node, its frequency variation is related to the network structure and its inertia;
- (2)
- For the load node, its frequency variation is determined by the network structure and the frequency variations of each synchronous generator node, and the frequency magnitude will be between the maximum and minimum frequencies of the synchronous generator nodes.
2.2. Verification of the Frequency Distribution Characteristic
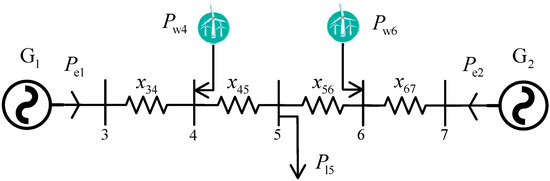
To verify the derived system frequency distribution characteristic, a two-machine power system integrated with two wind farms is built, as shown in Figure 2. , , and represent the reactance between Bus-3 and 4, 4 and 5, 5 and 6, 6 and 7.
Figure 2.
A two-machine power system integrated with two wind farms.
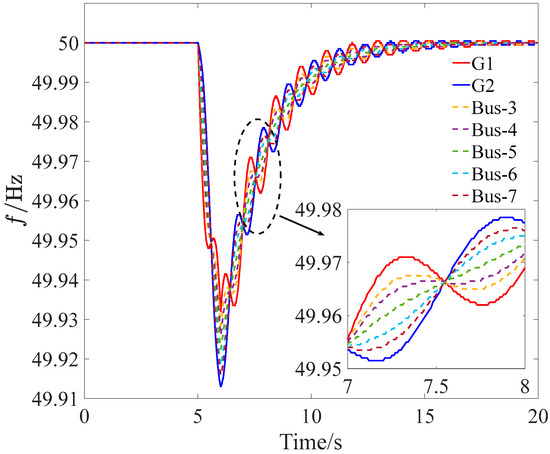
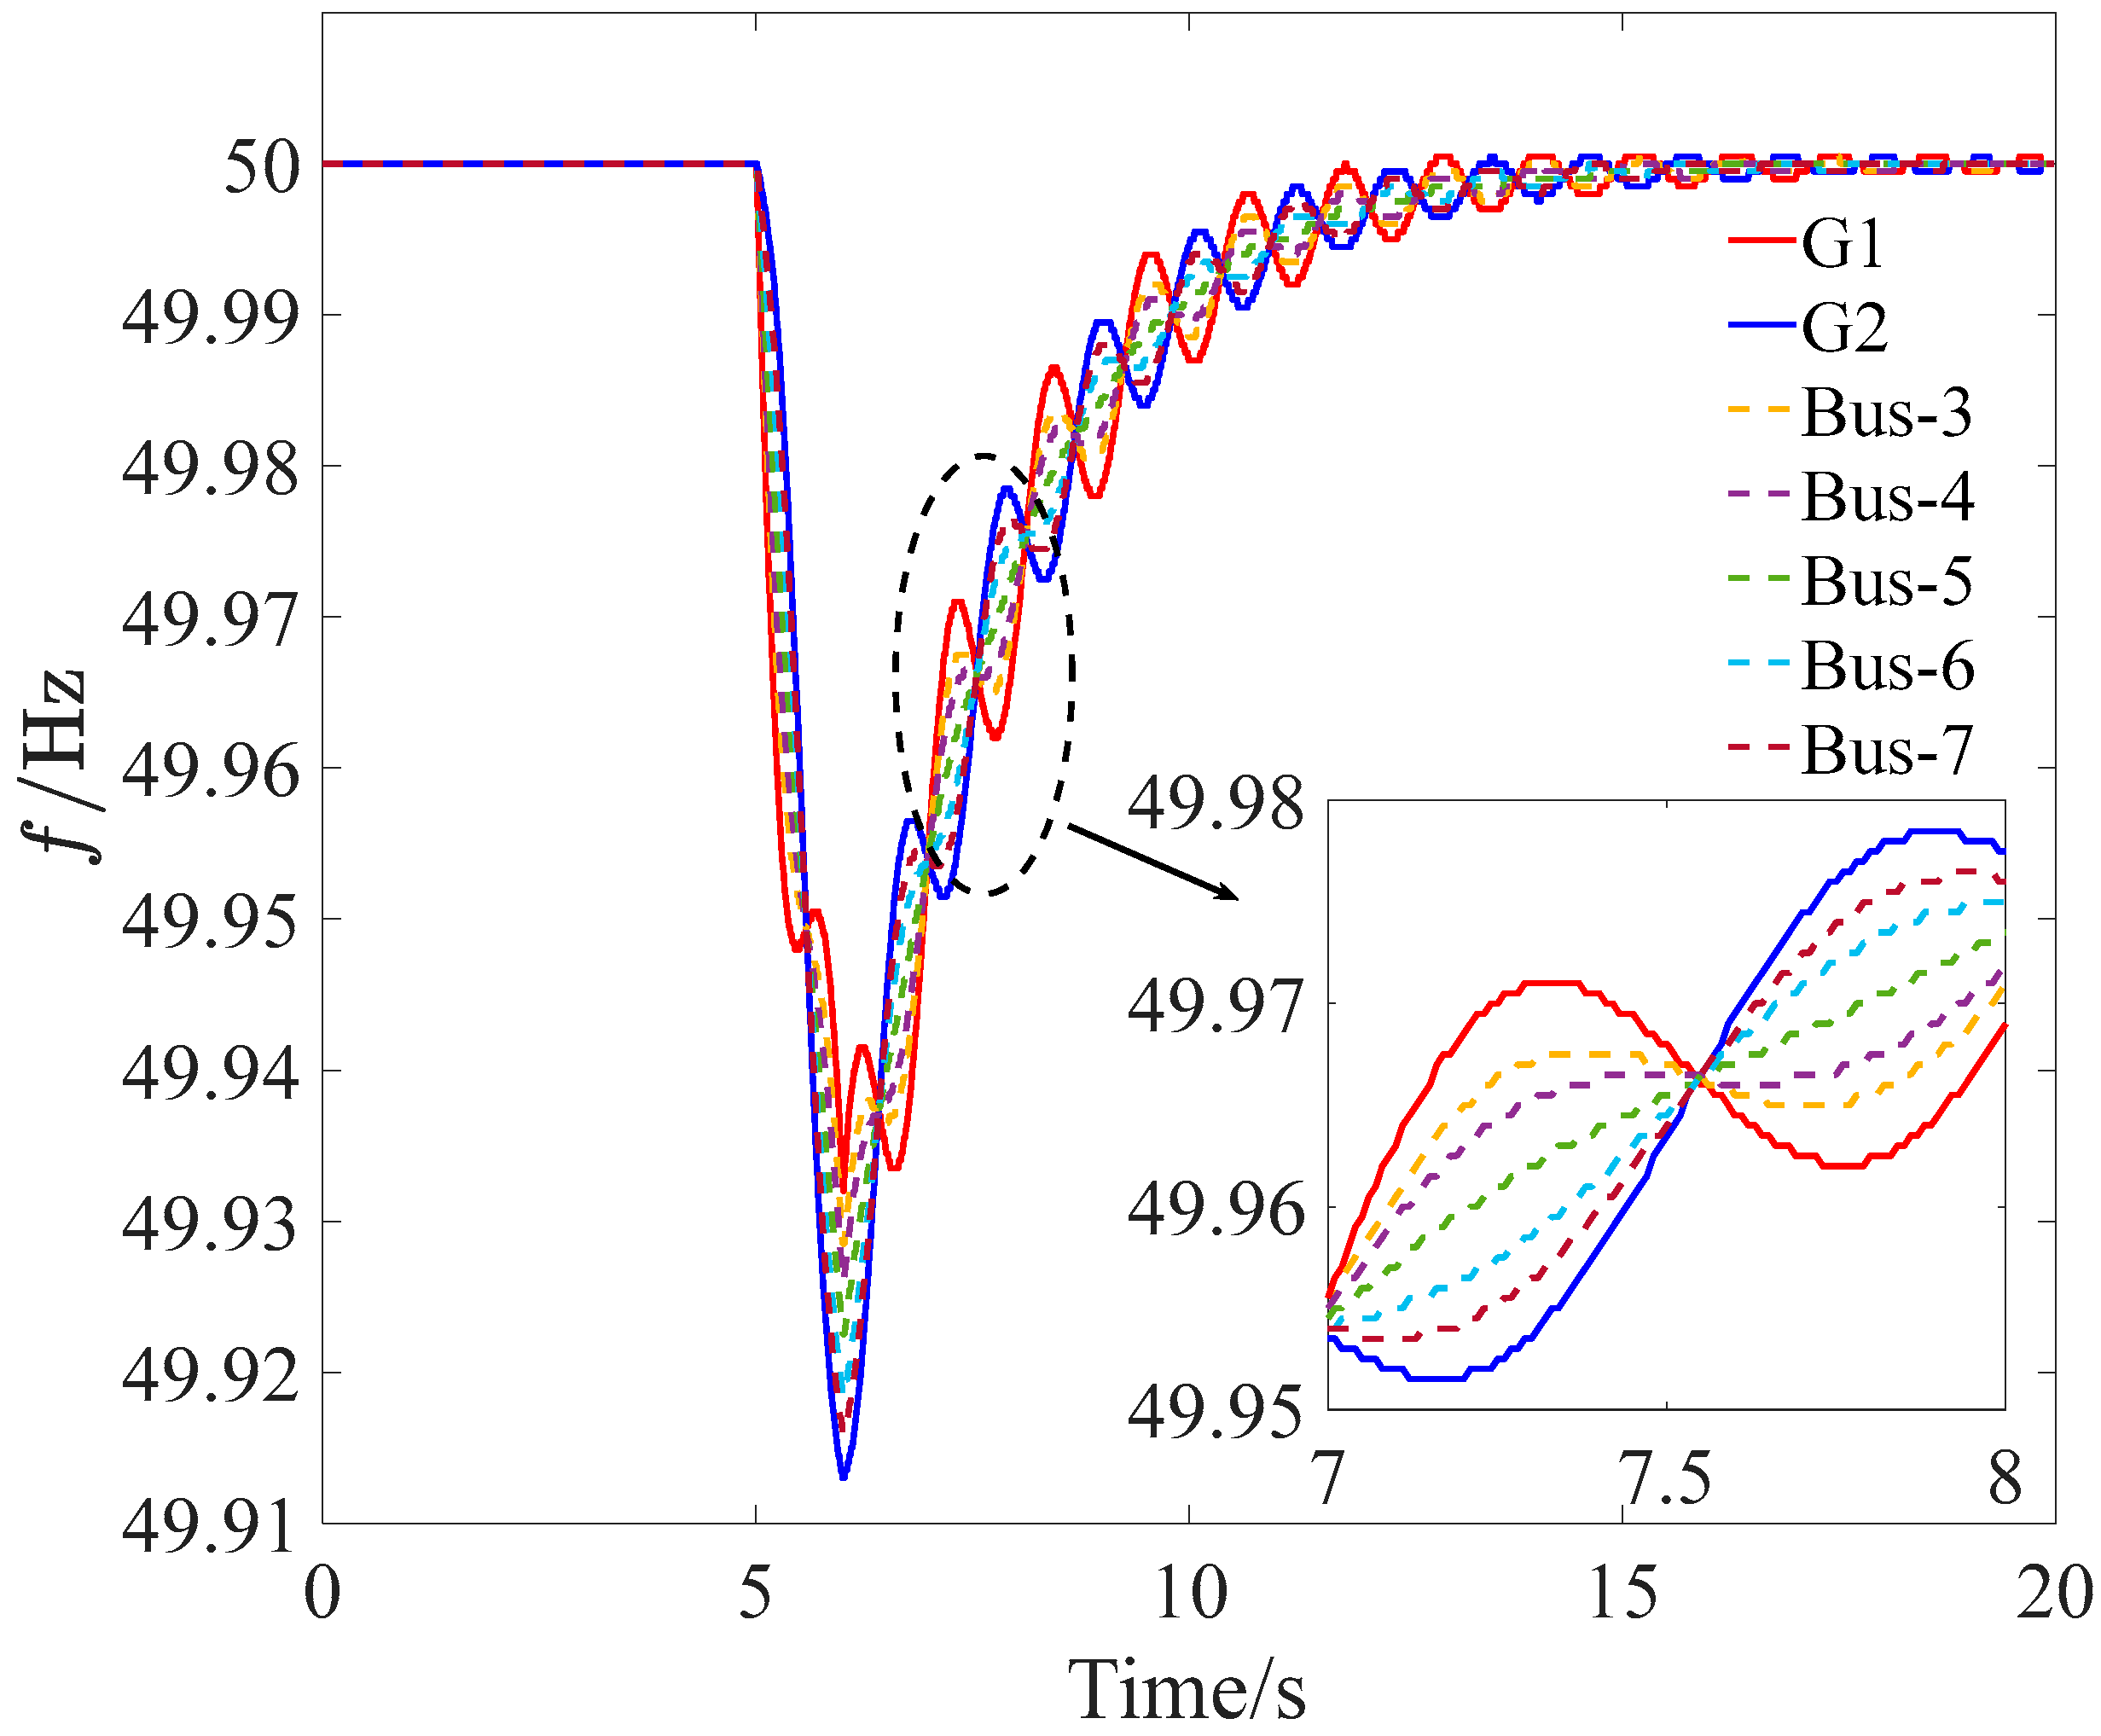
An active power disturbance is set at t = 5.0 s and lasts for 1.0 s. The simulation results of the different node frequencies are given in Figure 3. The frequency of each system node varies over time, and the system node with the lowest frequency changes over time. In addition, the frequency curves of and serve as the envelope, and the frequency curves of Bus-3, Bus-4, Bus-5, Bus-6, and Bus-7 fluctuate within the envelope range, which validates the derived frequency distribution characteristic.
Figure 3.
Frequency curves of different nodes after an active power disturbance.
3. Collaborative Control Strategy of Wind Farms for Frequency Support
The control of the DFIG consists of rotor-side converter (RSC) and grid-side converter (GSC) vector control. The goal of RSC control is to track a given reference value for active power while reactive power runs at a unit power factor on the rotor side, and the goal of GSC control is to keep the DC link voltage stable and maintain unit power factor operation on the AC side [22].
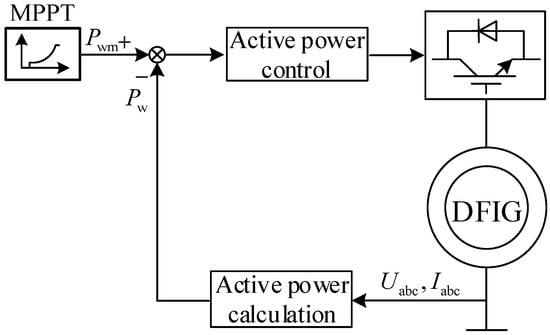
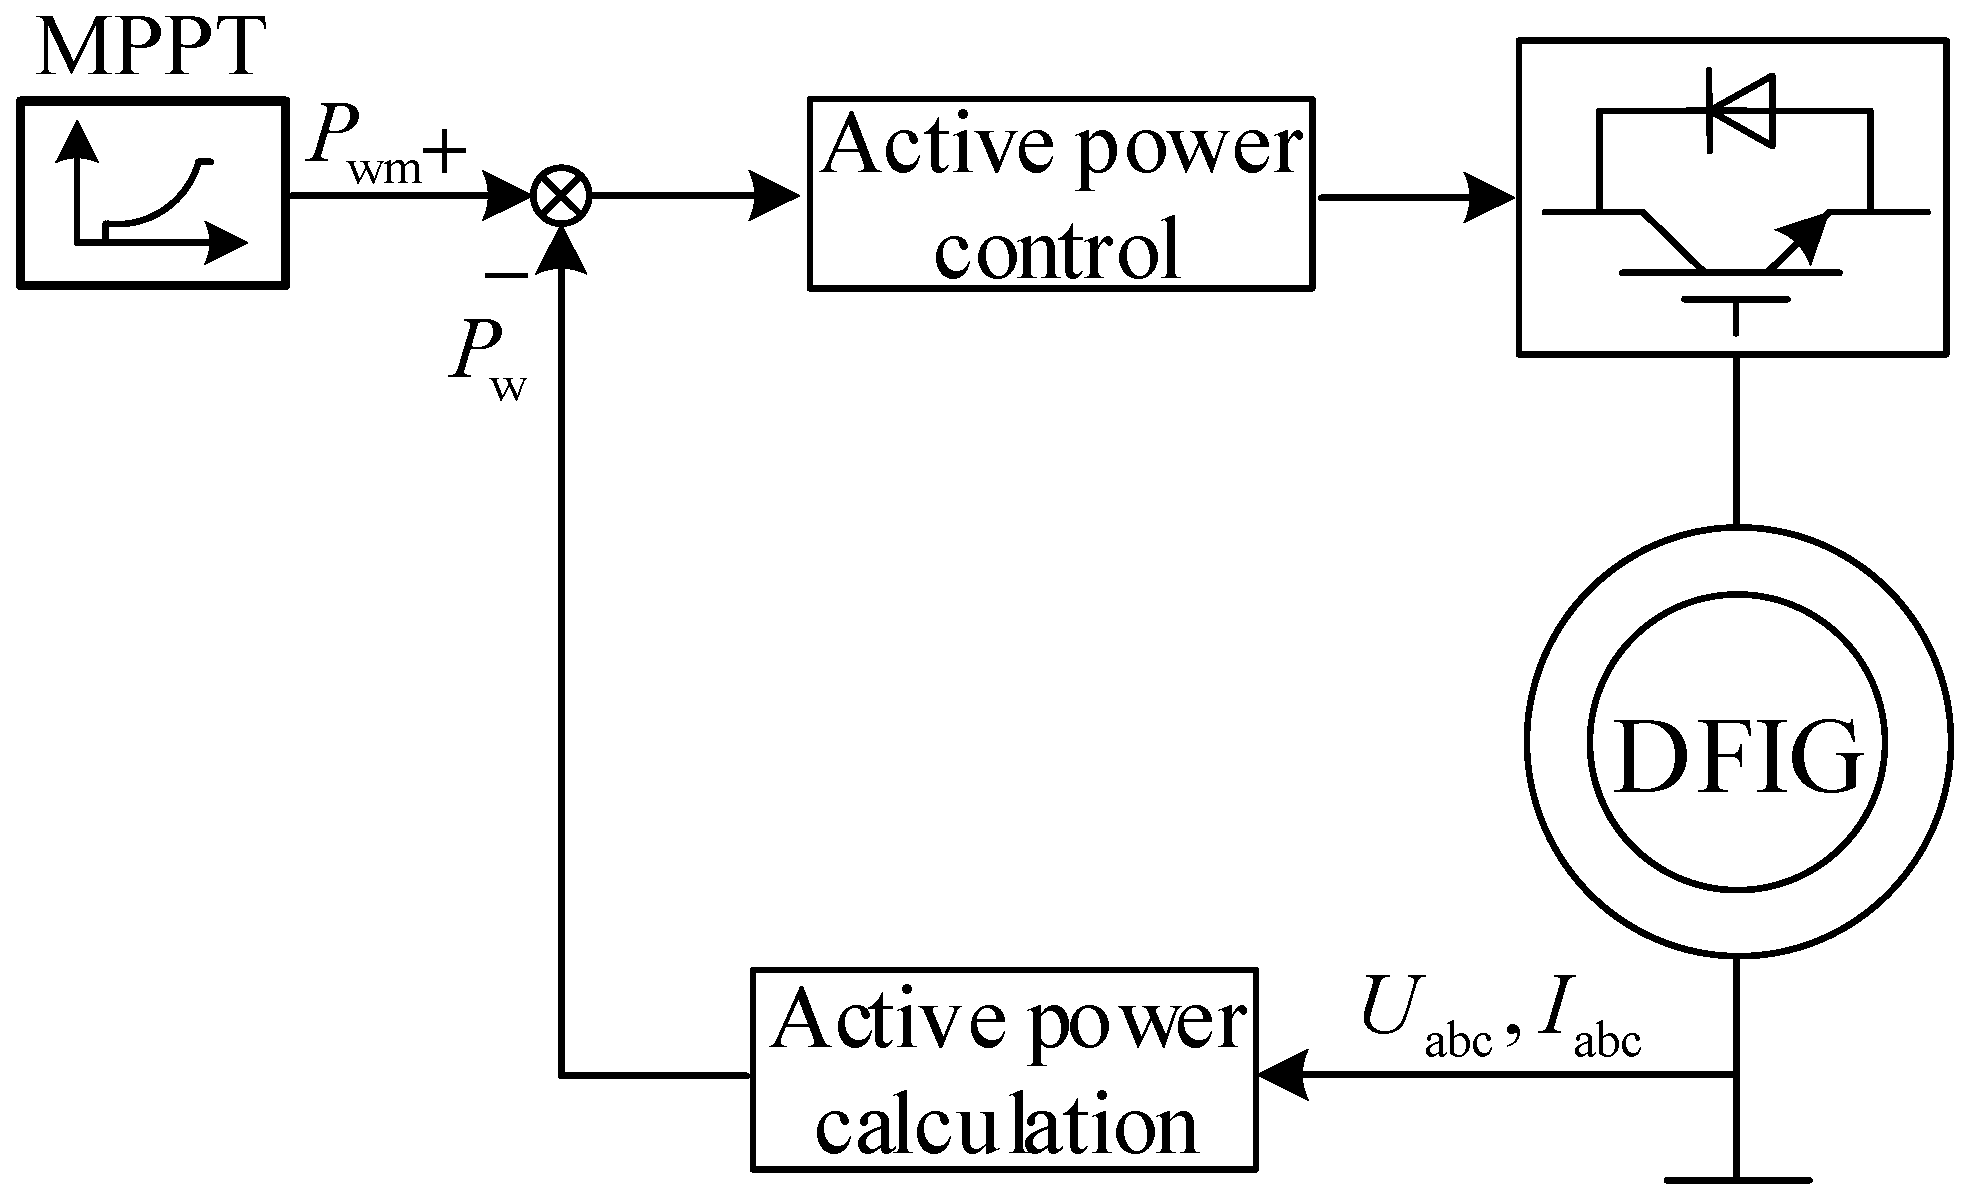
The active power reference value for RSC control is provided by the rotor-side maximum power point tracking (MPPT) control, as shown in Figure 4, and its mathematical model is given in Equation (12).
where is the air density, is the swept area, and are the wind speed, the cut-in wind speed and cut-out wind speed, respectively, is the wind energy capture coefficient, which is determined by the tip speed ratio and the pitch angle , and is the mechanical power.
Figure 4.
Active power control of RSC.
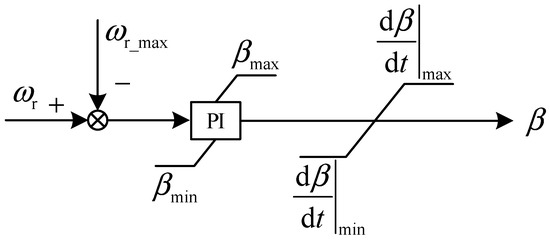
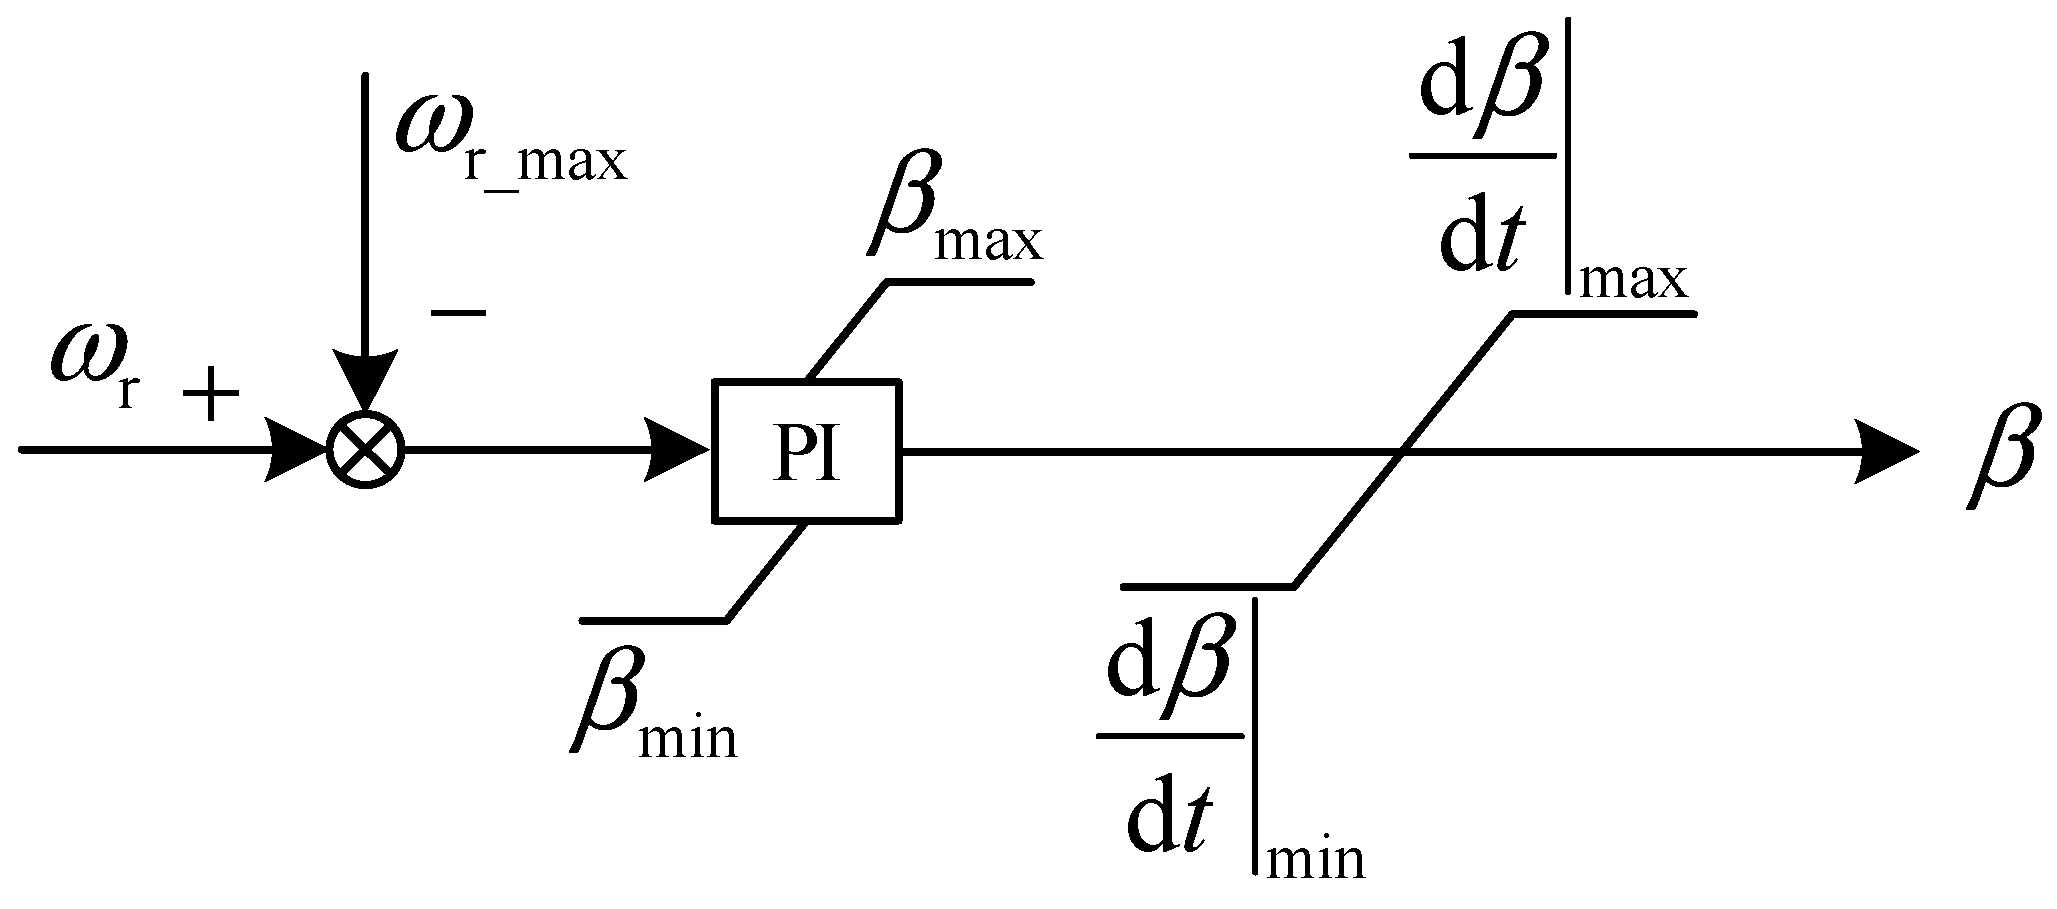
Furthermore, pitch angle control is employed by the DFIG to achieve wind power reserve [23]. When the captured wind power is below the reference power, the controller sets the blade pitch angle to 0°. When the captured wind power exceeds the reference power, the blade pitch angle increases, thereby limiting the DFIG’s output power. The control logic diagram is given in Figure 5.
Figure 5.
Pitch angle control.
3.1. Frequency Support Control of Wind Farms
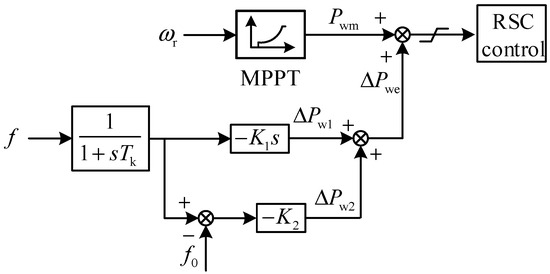
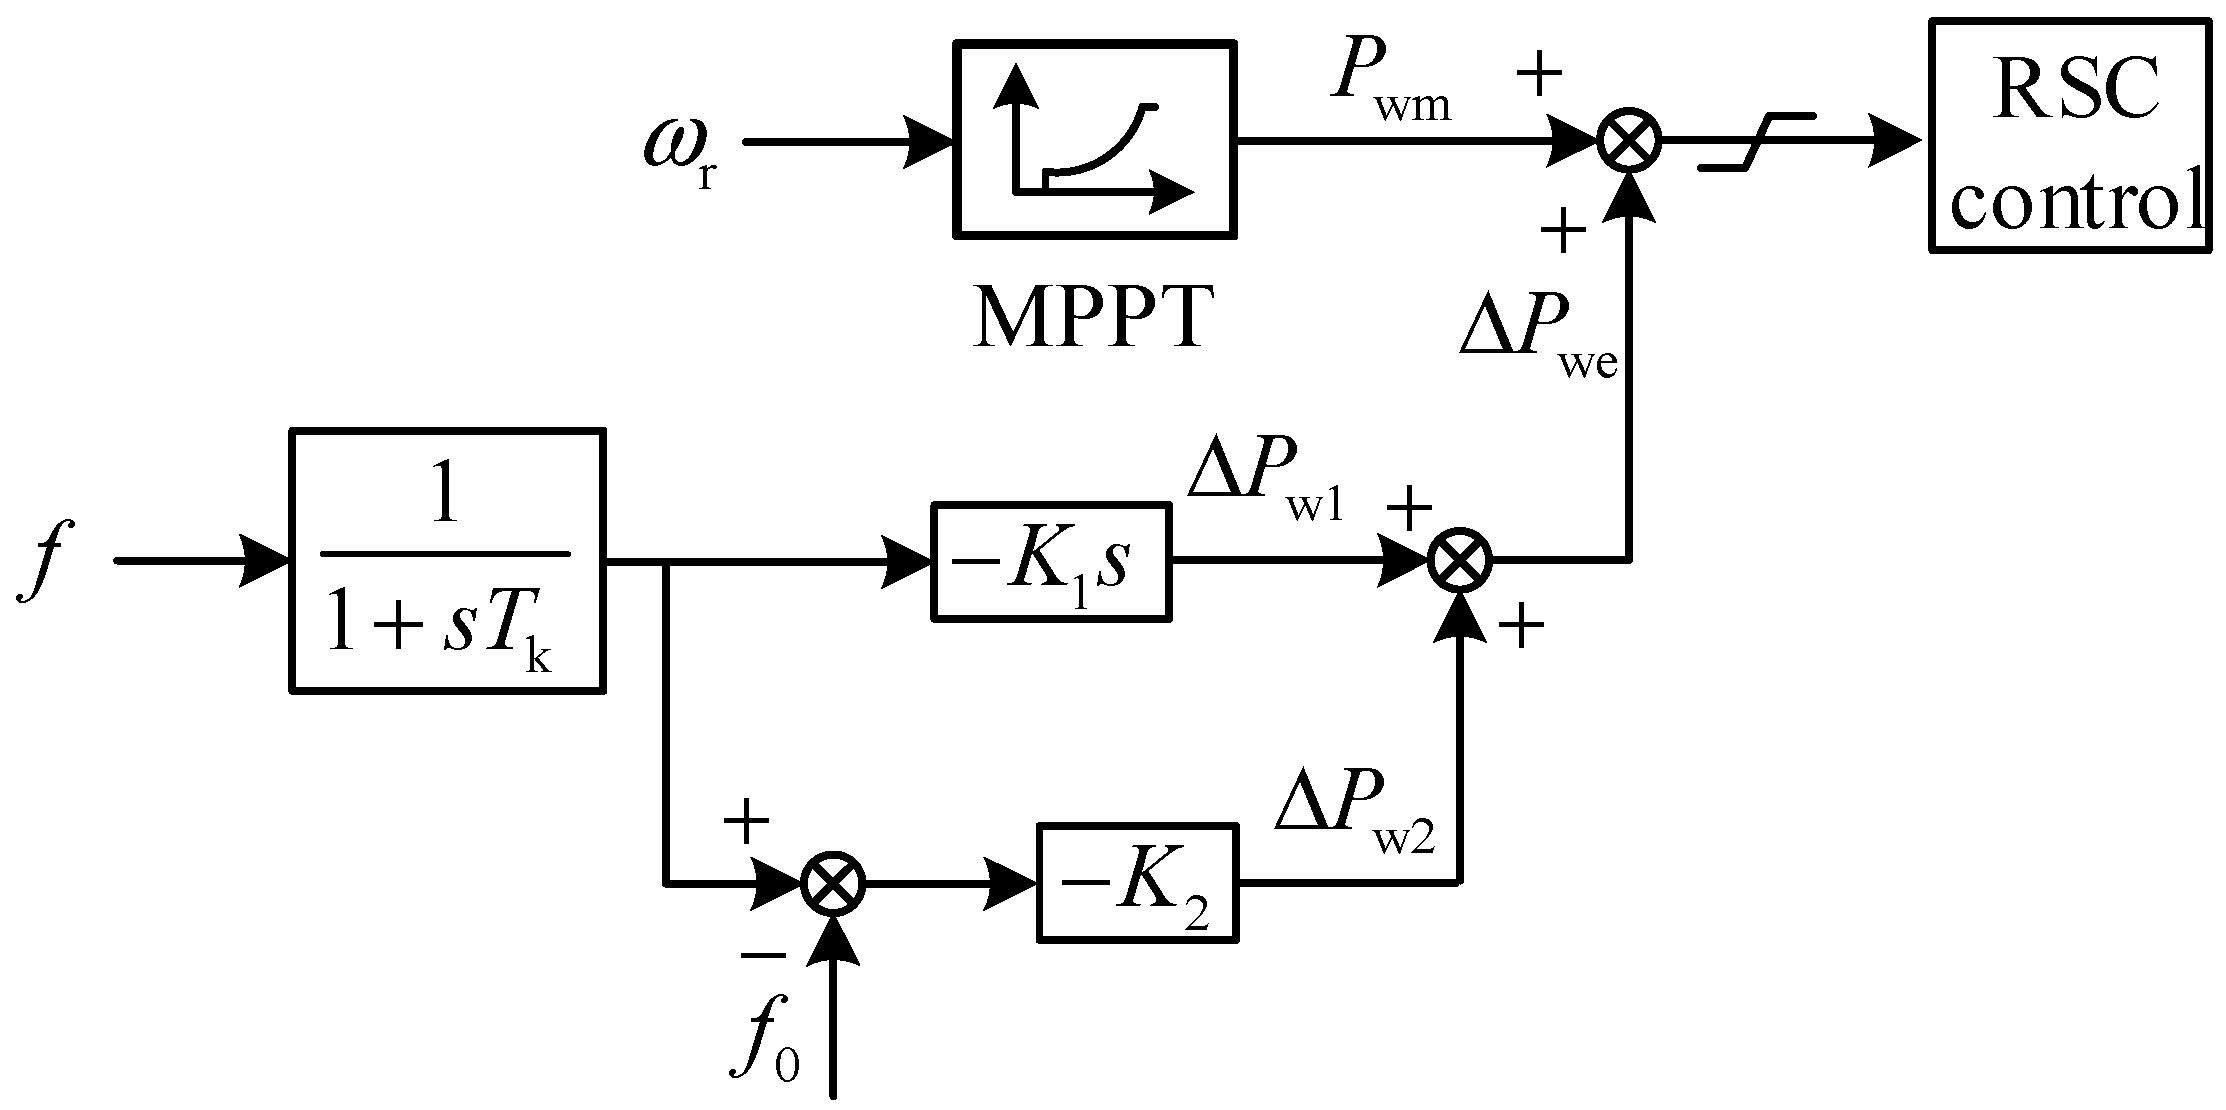
Since a DFIG-based wind farm utilizes MPPT control, it cannot release or absorb rotor kinetic energy like a synchronous generator when the system frequency varies. If the rate of change of frequency (ROCOF) signal is added to the DFIG control system to track frequency variations, it can provide virtual inertia support to the power system [24]. Therefore, the ROCOF signal is employed to implement virtual inertial control, and is added on the basis of the active power reference value of the MPPT, as given in Equation (13).
where is the differential loop coefficient and is the synchronous generator node frequency.
In order to improve the frequency response characteristic, the frequency deviation signal is further employed by referring to the primary frequency modulation of synchronous generators [25], that is, the power signal is added on the basis of the active power reference value of MPPT to implement droop control, as given in Equation (14).
where is the droop control coefficient and .
Based on Equations (13) and (14), the frequency support control strategy of the DFIG-based wind farm includes virtual inertial control and droop control, as shown in Figure 6. is the total additional power output.
Figure 6.
Control strategy of frequency support.
For a 50 Hz power system, the regulation stipulates that the allowed maximum frequency deviation is 0.1 Hz. The frequency deviation will be alarmed when it exceeds 0.05 Hz, and frequency control measures will be carried out. Therefore, the maximum node frequency deviation is set to enable frequency support control, and is set to disable frequency support control.
3.2. Collaborative Control Strategy of Multiple Wind Farms
In the power system integrated with wind farms, under the traditional frequency support control strategy, each wind farm provides frequency support independently. For the -th wind farm, the additional output power is when it adopts the frequency support control strategy given in Figure 6. Then, we can get from Equation (3) that the power variation of the -th synchronous generator is
where represents the power impact sensitivity of the -th wind farm to the -th synchronous generator.
Equation (15) reflects two situations:
- (1)
- When the power system frequency increases or decreases, the virtual inertial control of the wind farm will suppress the change in the frequency and reduce the frequency deviation amplitude, but when the system frequency begins to recover, the virtual inertial control will also suppress its recovery.
- (2)
- The node location of the system frequency extremum changes over time, and the fixed control parameters are not adaptive. The wind farm’s frequency support performance can be further improved.
Therefore, for the power system with multiple wind farms, it is of great significance to collaborate multiple wind farms to provide frequency support, thereby reducing the real-time maximum frequency deviation and improving the frequency distribution characteristic.
When an active power disturbance occurs, the synchronous generator nodes are sorted from largest to smallest by the absolute value of their frequency deviation, and the first p synchronous generator nodes are selected as a set . Then, for the -th wind farm, we define that
where represents the total power impact sensitivity of the -th wind farm to the p synchronous generators in set , and .
Next, the wind farm with > 0.5 indicates that its frequency support is more effective for the set , and further selects for parameter optimization to reduce the real-time maximum frequency deviation of the power system. Based on the virtual inertia control and the droop control proposed in Section 3.1, a collaborative control strategy for multiple wind farms is presented, specifically as follows:
- (1)
- When the minimum node frequency is lower than the rated value and is decreasing, or the maximum node frequency is greater than the rated value and is increasing, the control parameters of the selected -th wind farm are optimized aswhere and . The greater or is, the better the frequency support performance will be.
- (2)
- When the minimum node frequency is lower than the rated value and is increasing, or the maximum node frequency is greater than the rated value and is decreasing, the control parameters of the selected -th wind farm are optimized aswhere . The smaller is, the better the frequency support performance will be.
In practice, for safety, the change in amplitude of control parameters should not be too large. In this paper, the change in amplitude is set to 0.5 times of the original control parameters, that is, , and .
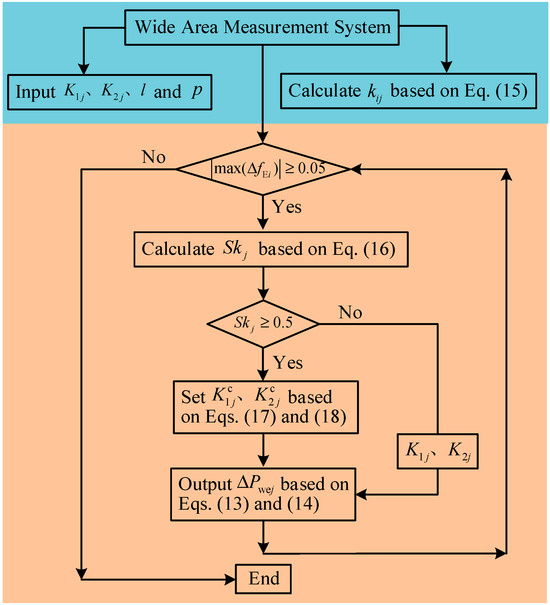
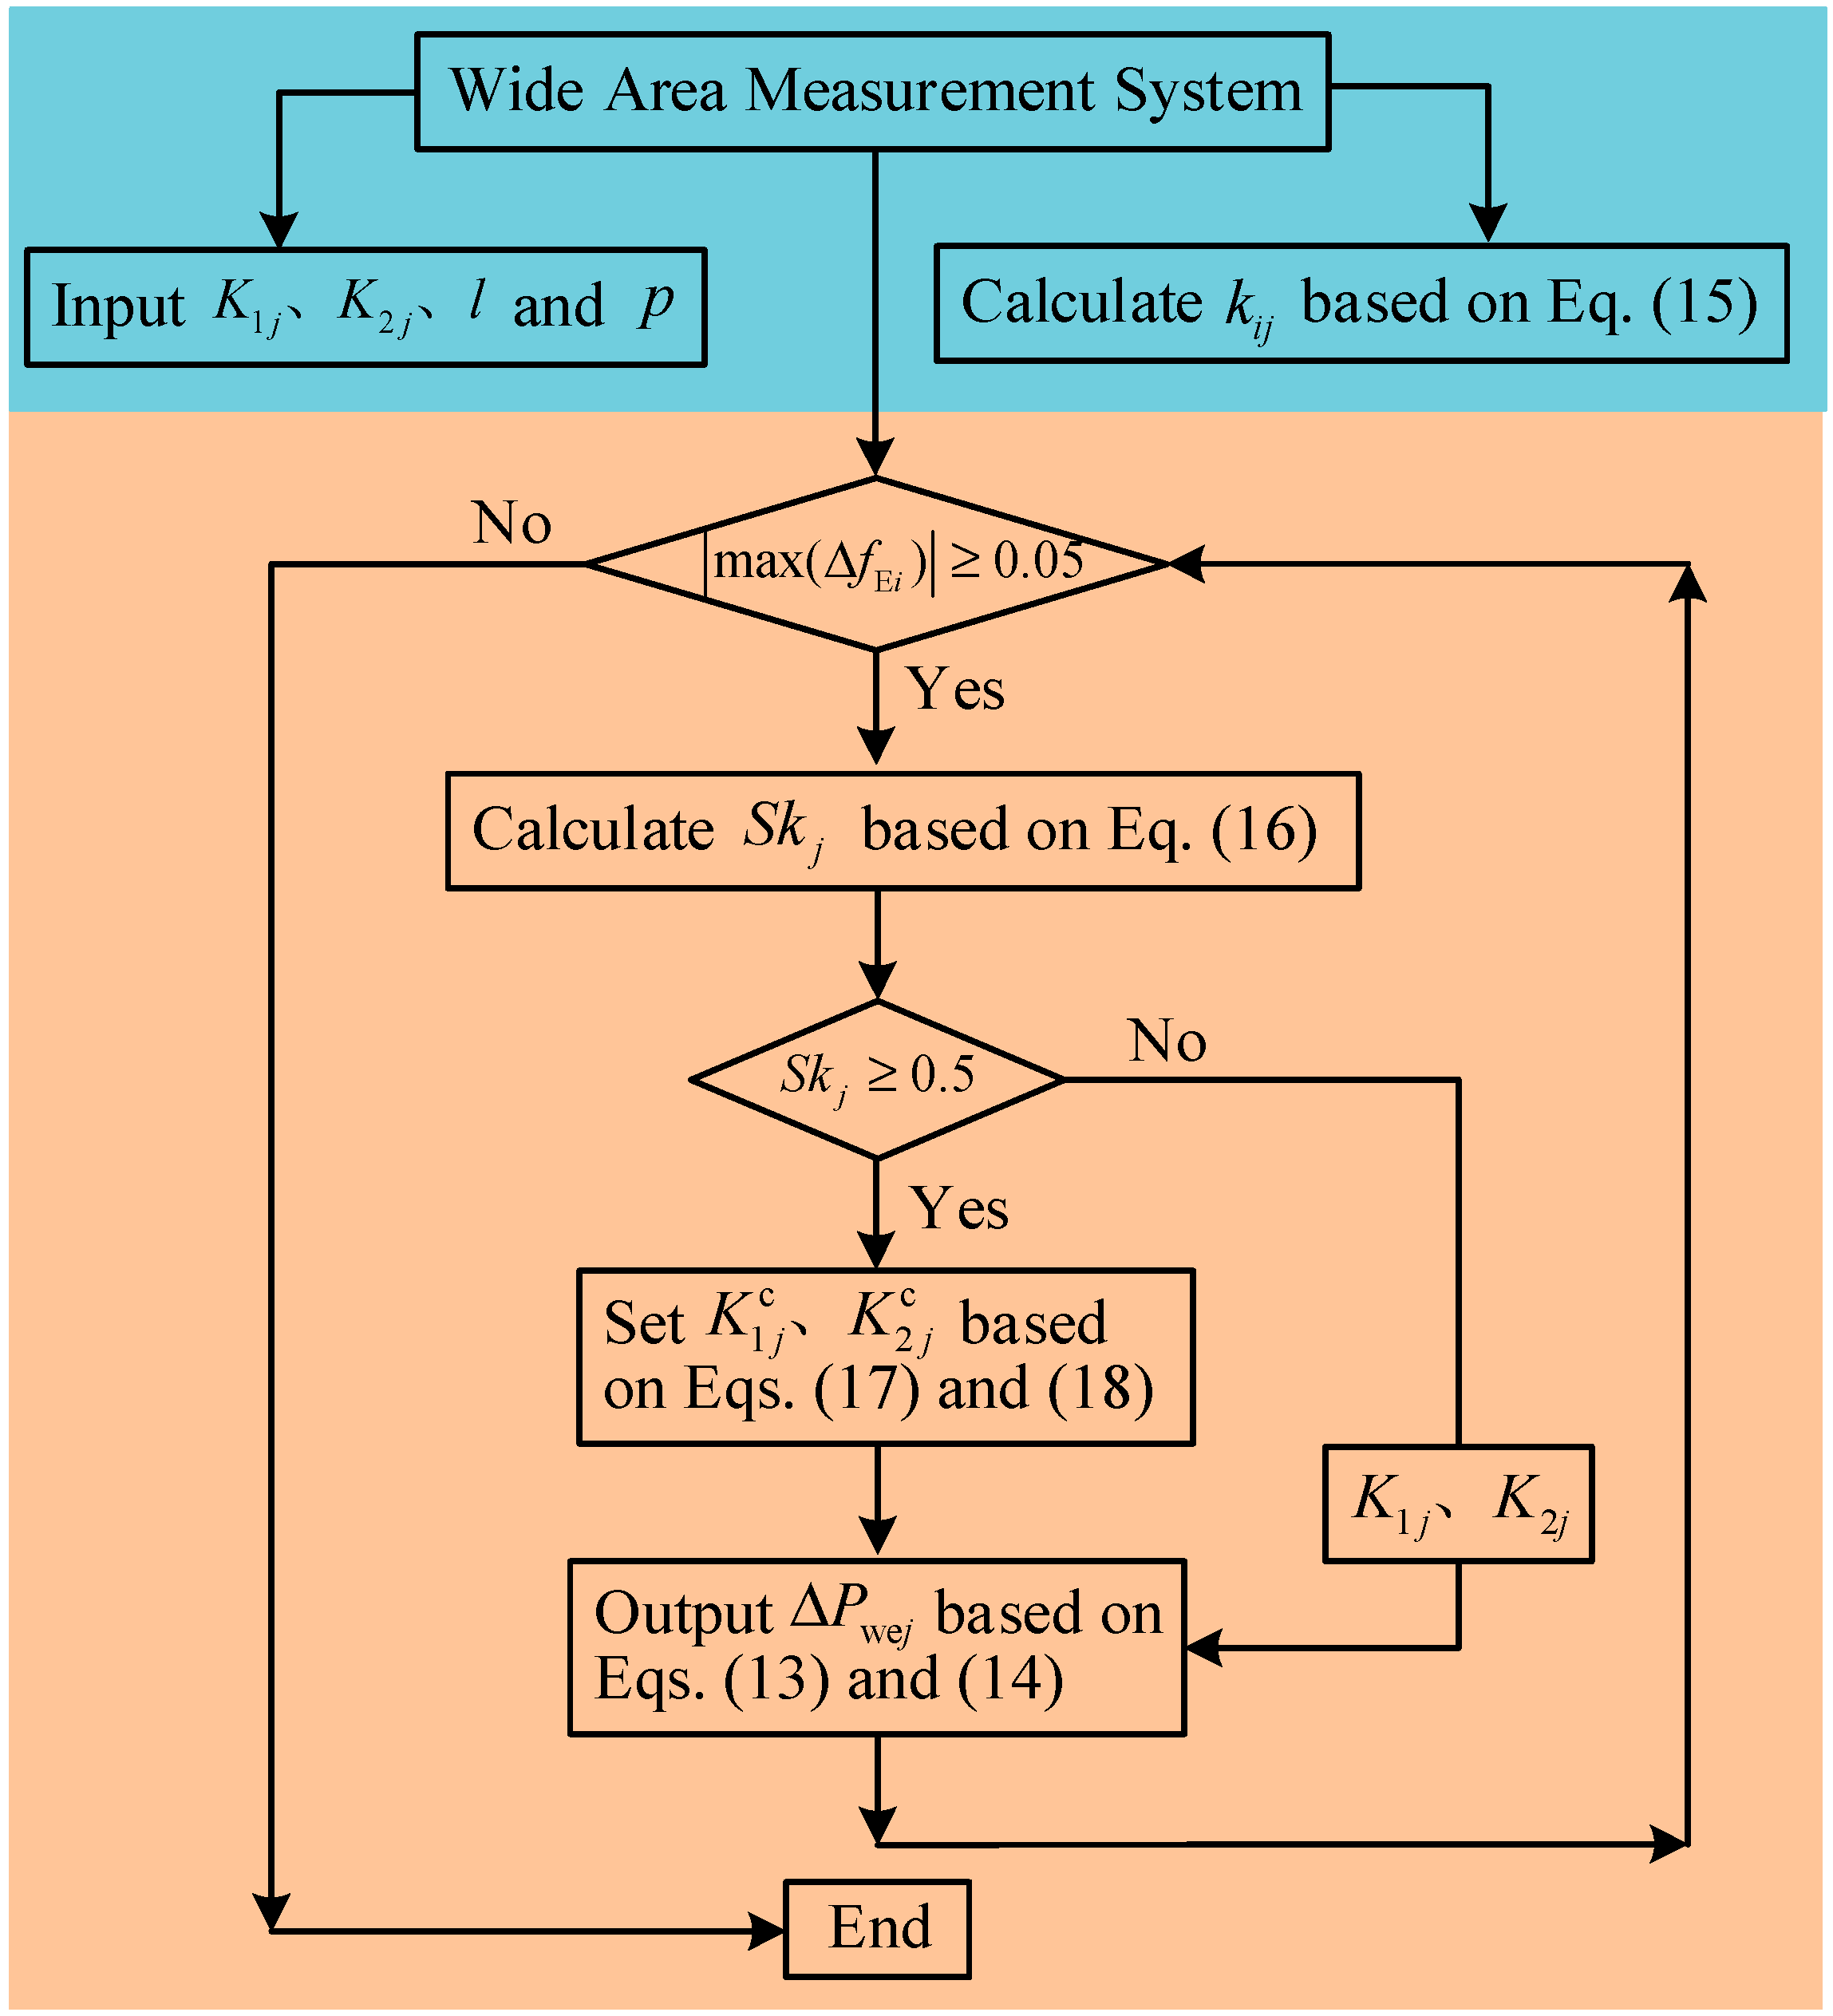
Therefore, the flowchart of the collaborative control strategy for multiple wind farms participating in frequency support is shown in Figure 7.
Figure 7.
Flowchart of the implementation of the collaborative control strategy.
4. Simulation Validation and Comparative Analysis
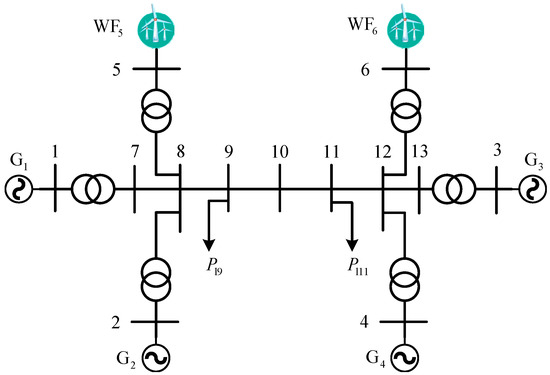
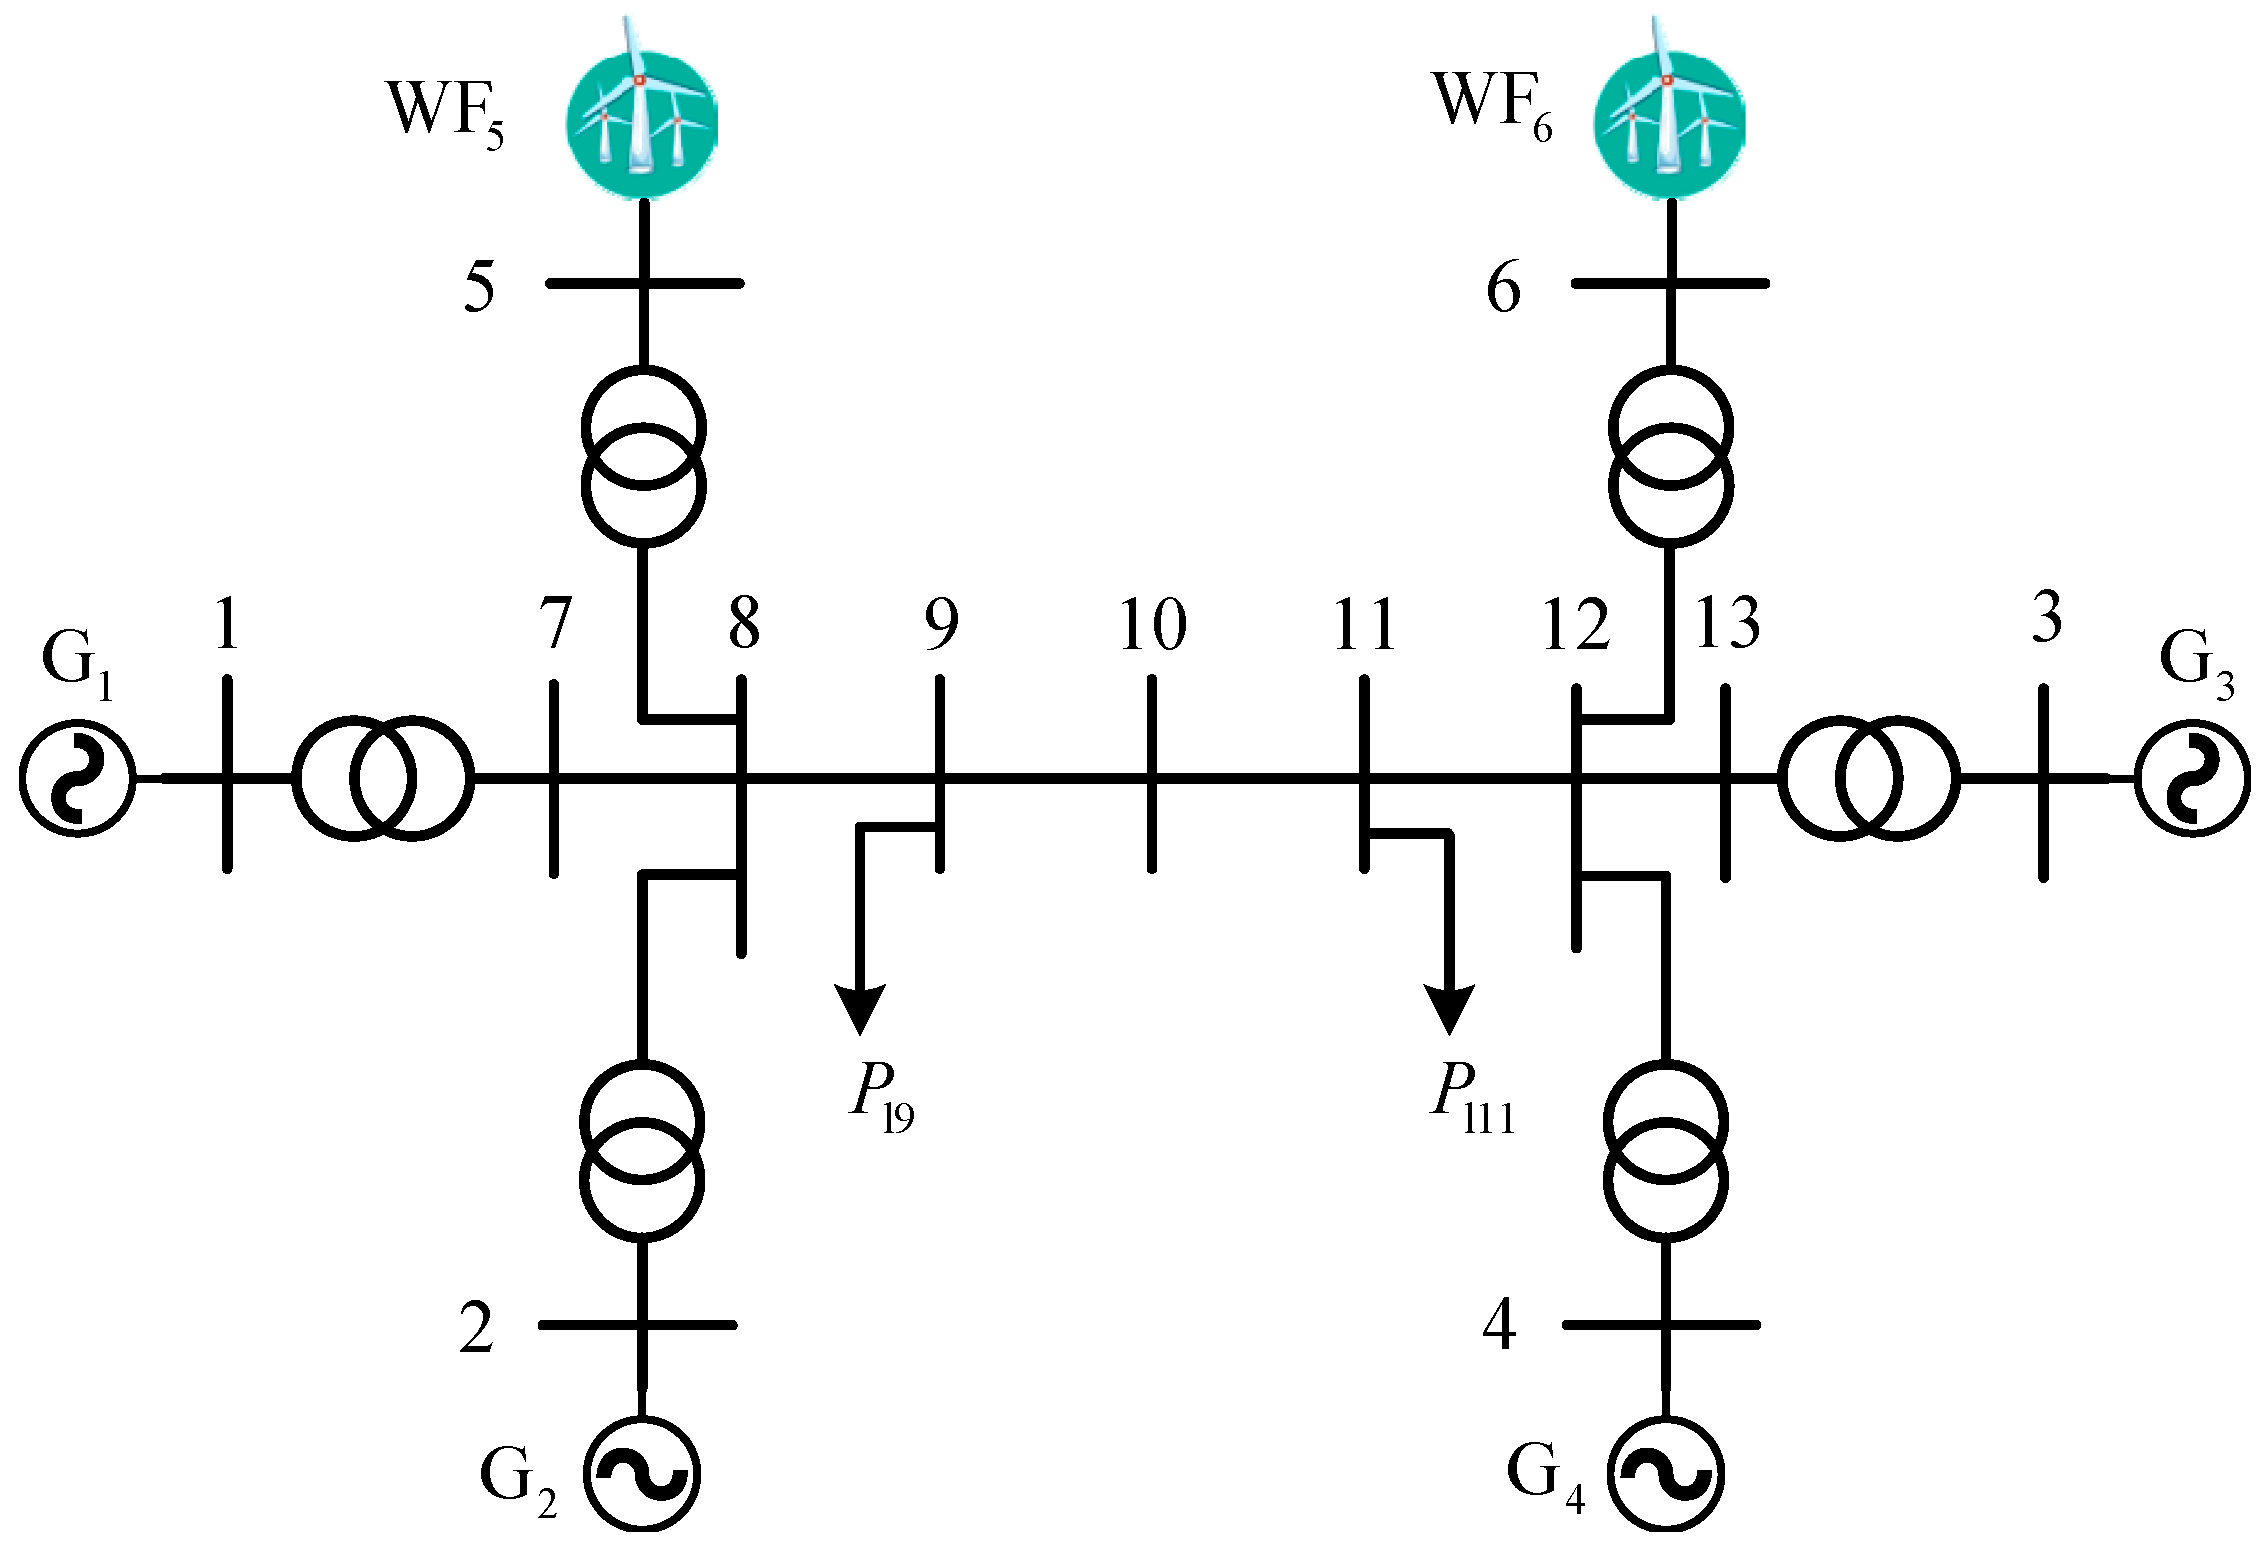
In order to validate the effectiveness of the presented frequency support collaborative control strategy, the simulation model of a four-machine and two-area power system integrated with two wind farms is built in Matlab/Simulink. The network topology is shown in Figure 8, and its parameter data are given in Appendix A.
Figure 8.
Four-machine two-area power system integrated with two wind farms.
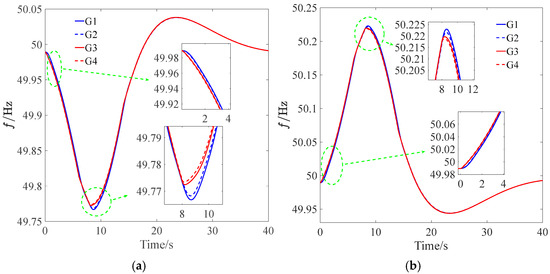
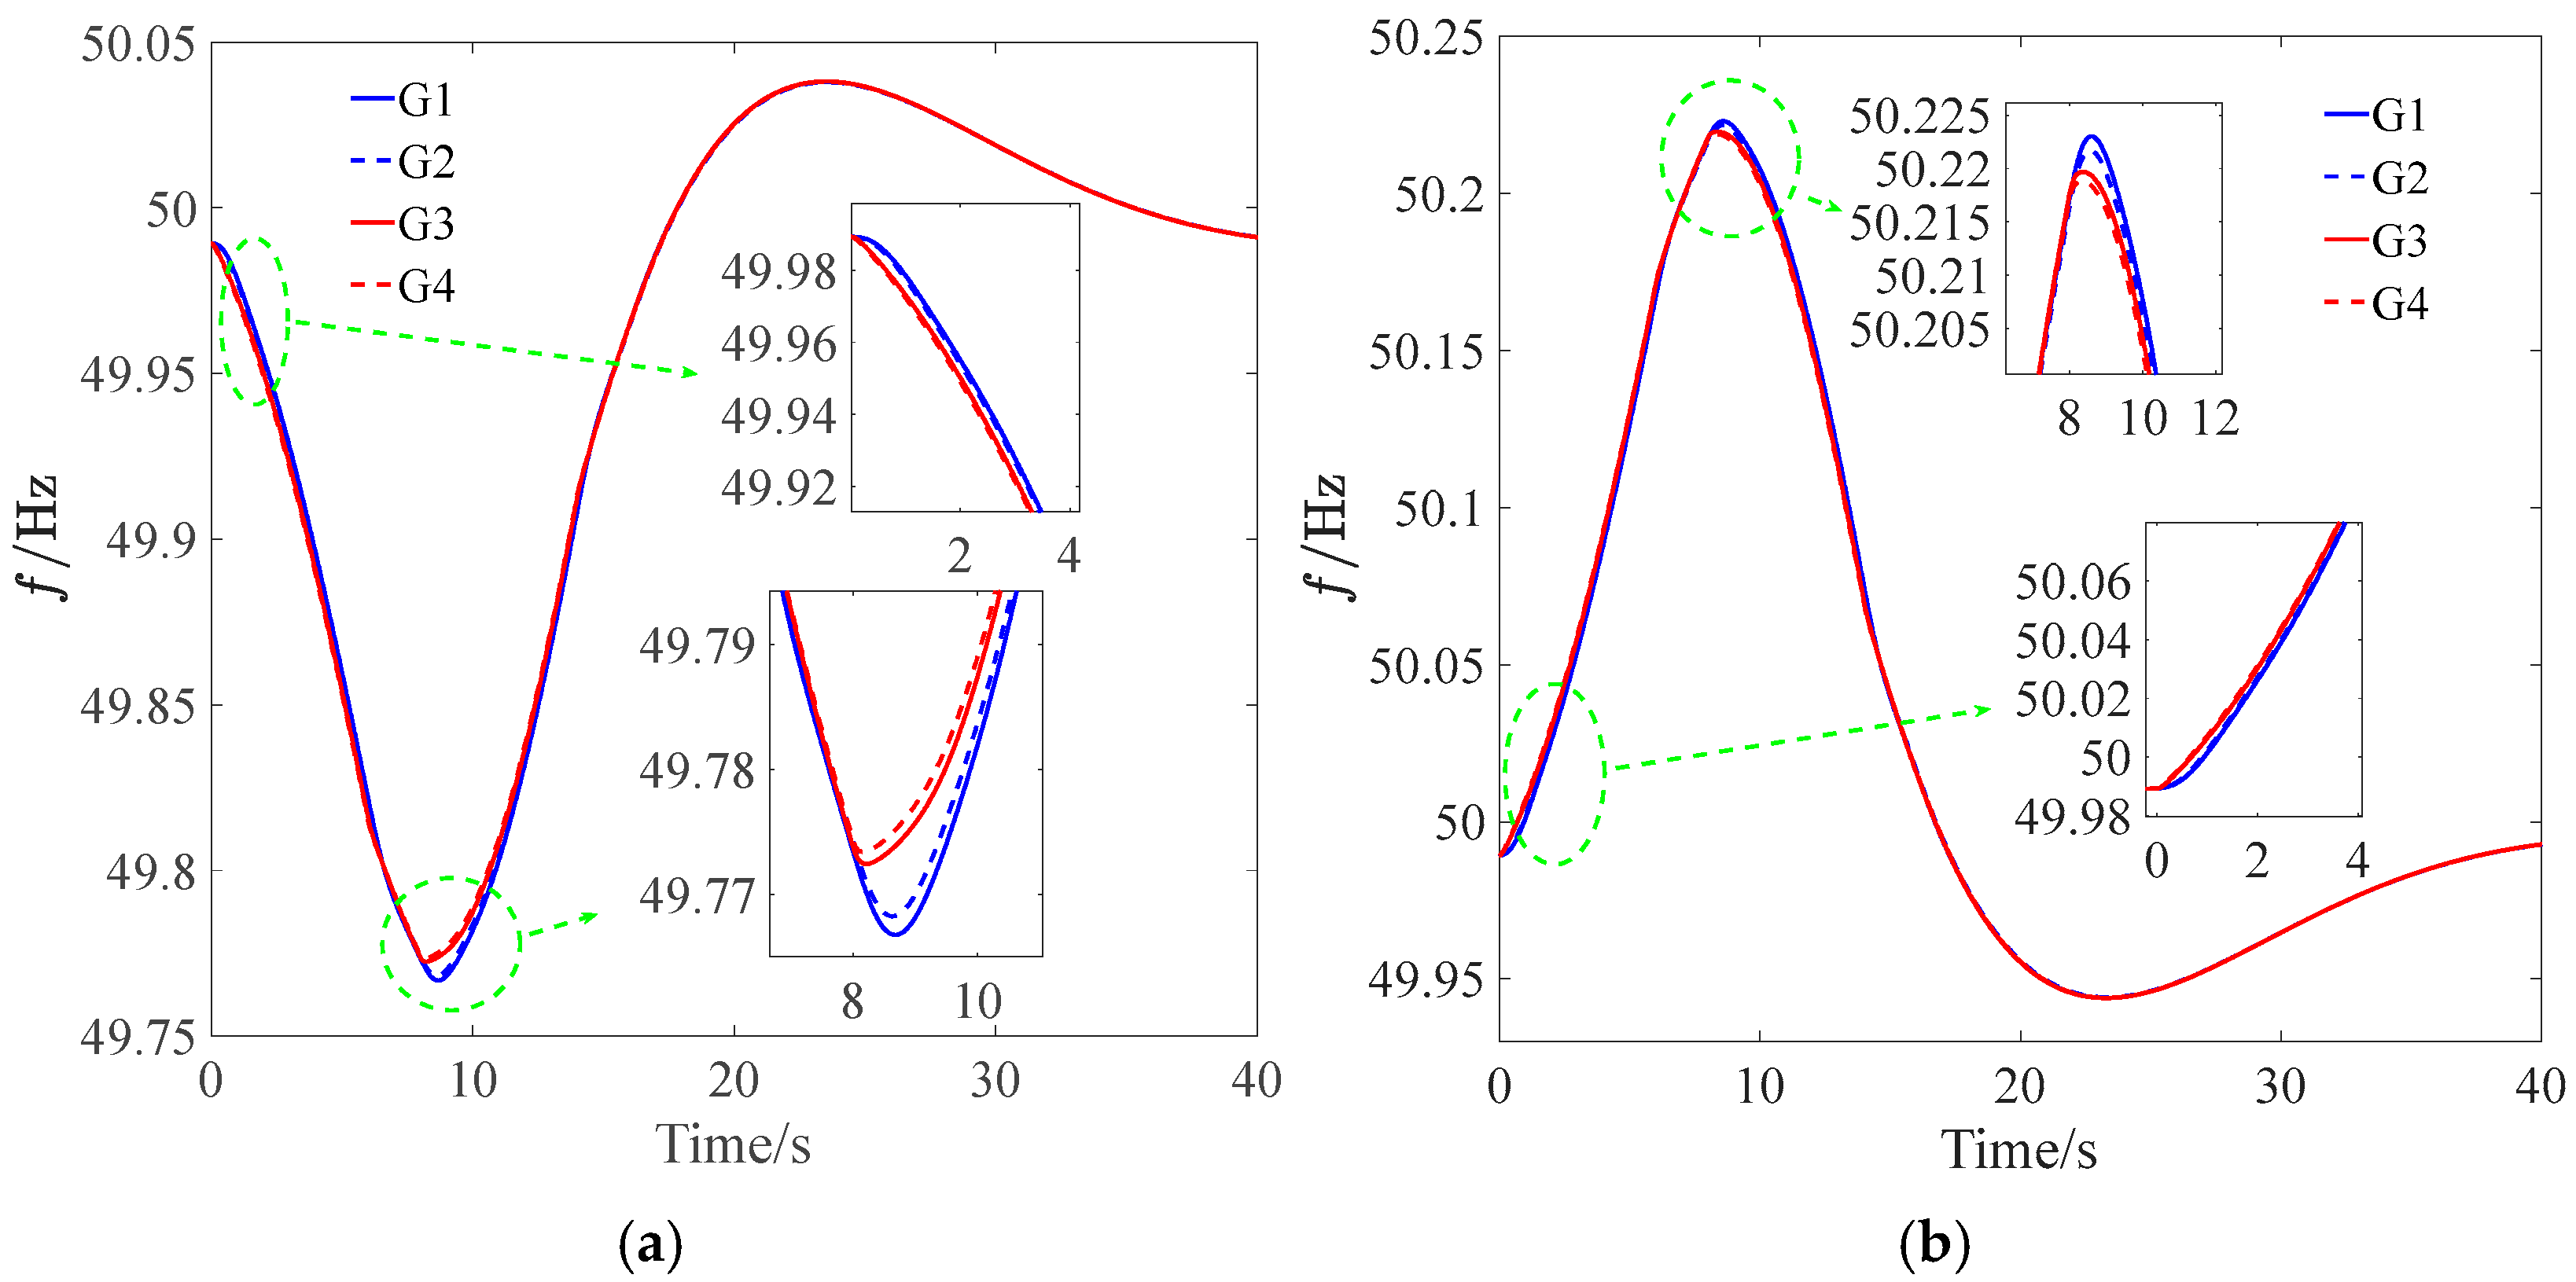
In Figure 8, , , , , , , , and . The wind power penetration rate of the power system is about 30%. Both WF5 and WF6 adopt MPPT control, and pitch angle control is employed to ensure that the wind farm maintains a power reserve to support frequency. The presented collaborative control strategy for wind farms’ frequency support is enabled when the node frequency deviation exceeds 0.05 Hz. A load disturbance is set at Bus-11. The frequency of the synchronous generator node during a sudden load increase/decrease and subsequent recovery is given in Figure 9. The node location of the real-time frequency extremum changes over time, showing the frequency distribution characteristic of the power system after a disturbance.
Figure 9.
Frequency curves of synchronous generator nodes under different scenarios. (a) Sudden load increase and then recovery. (b) Sudden load decrease and then recovery.
Next, taking p = 2, the following control strategies are defined:
No control: WF5 and WF6 do not participate in frequency support control.
Control strategy 1 (CS-1): WF5 and WF6 participate in frequency support control independently, and the control parameters are = = 3, = = 0.4.
Control strategy 2 (CS-2): WF5 and WF6 participate in frequency support control independently, and the control parameters are , .
Control strategy 3 (CS-3): WF5 and WF6 participate in frequency support control, and the control parameters and are optimized by the proposed collaborative control strategy.
4.1. Simulation Validation
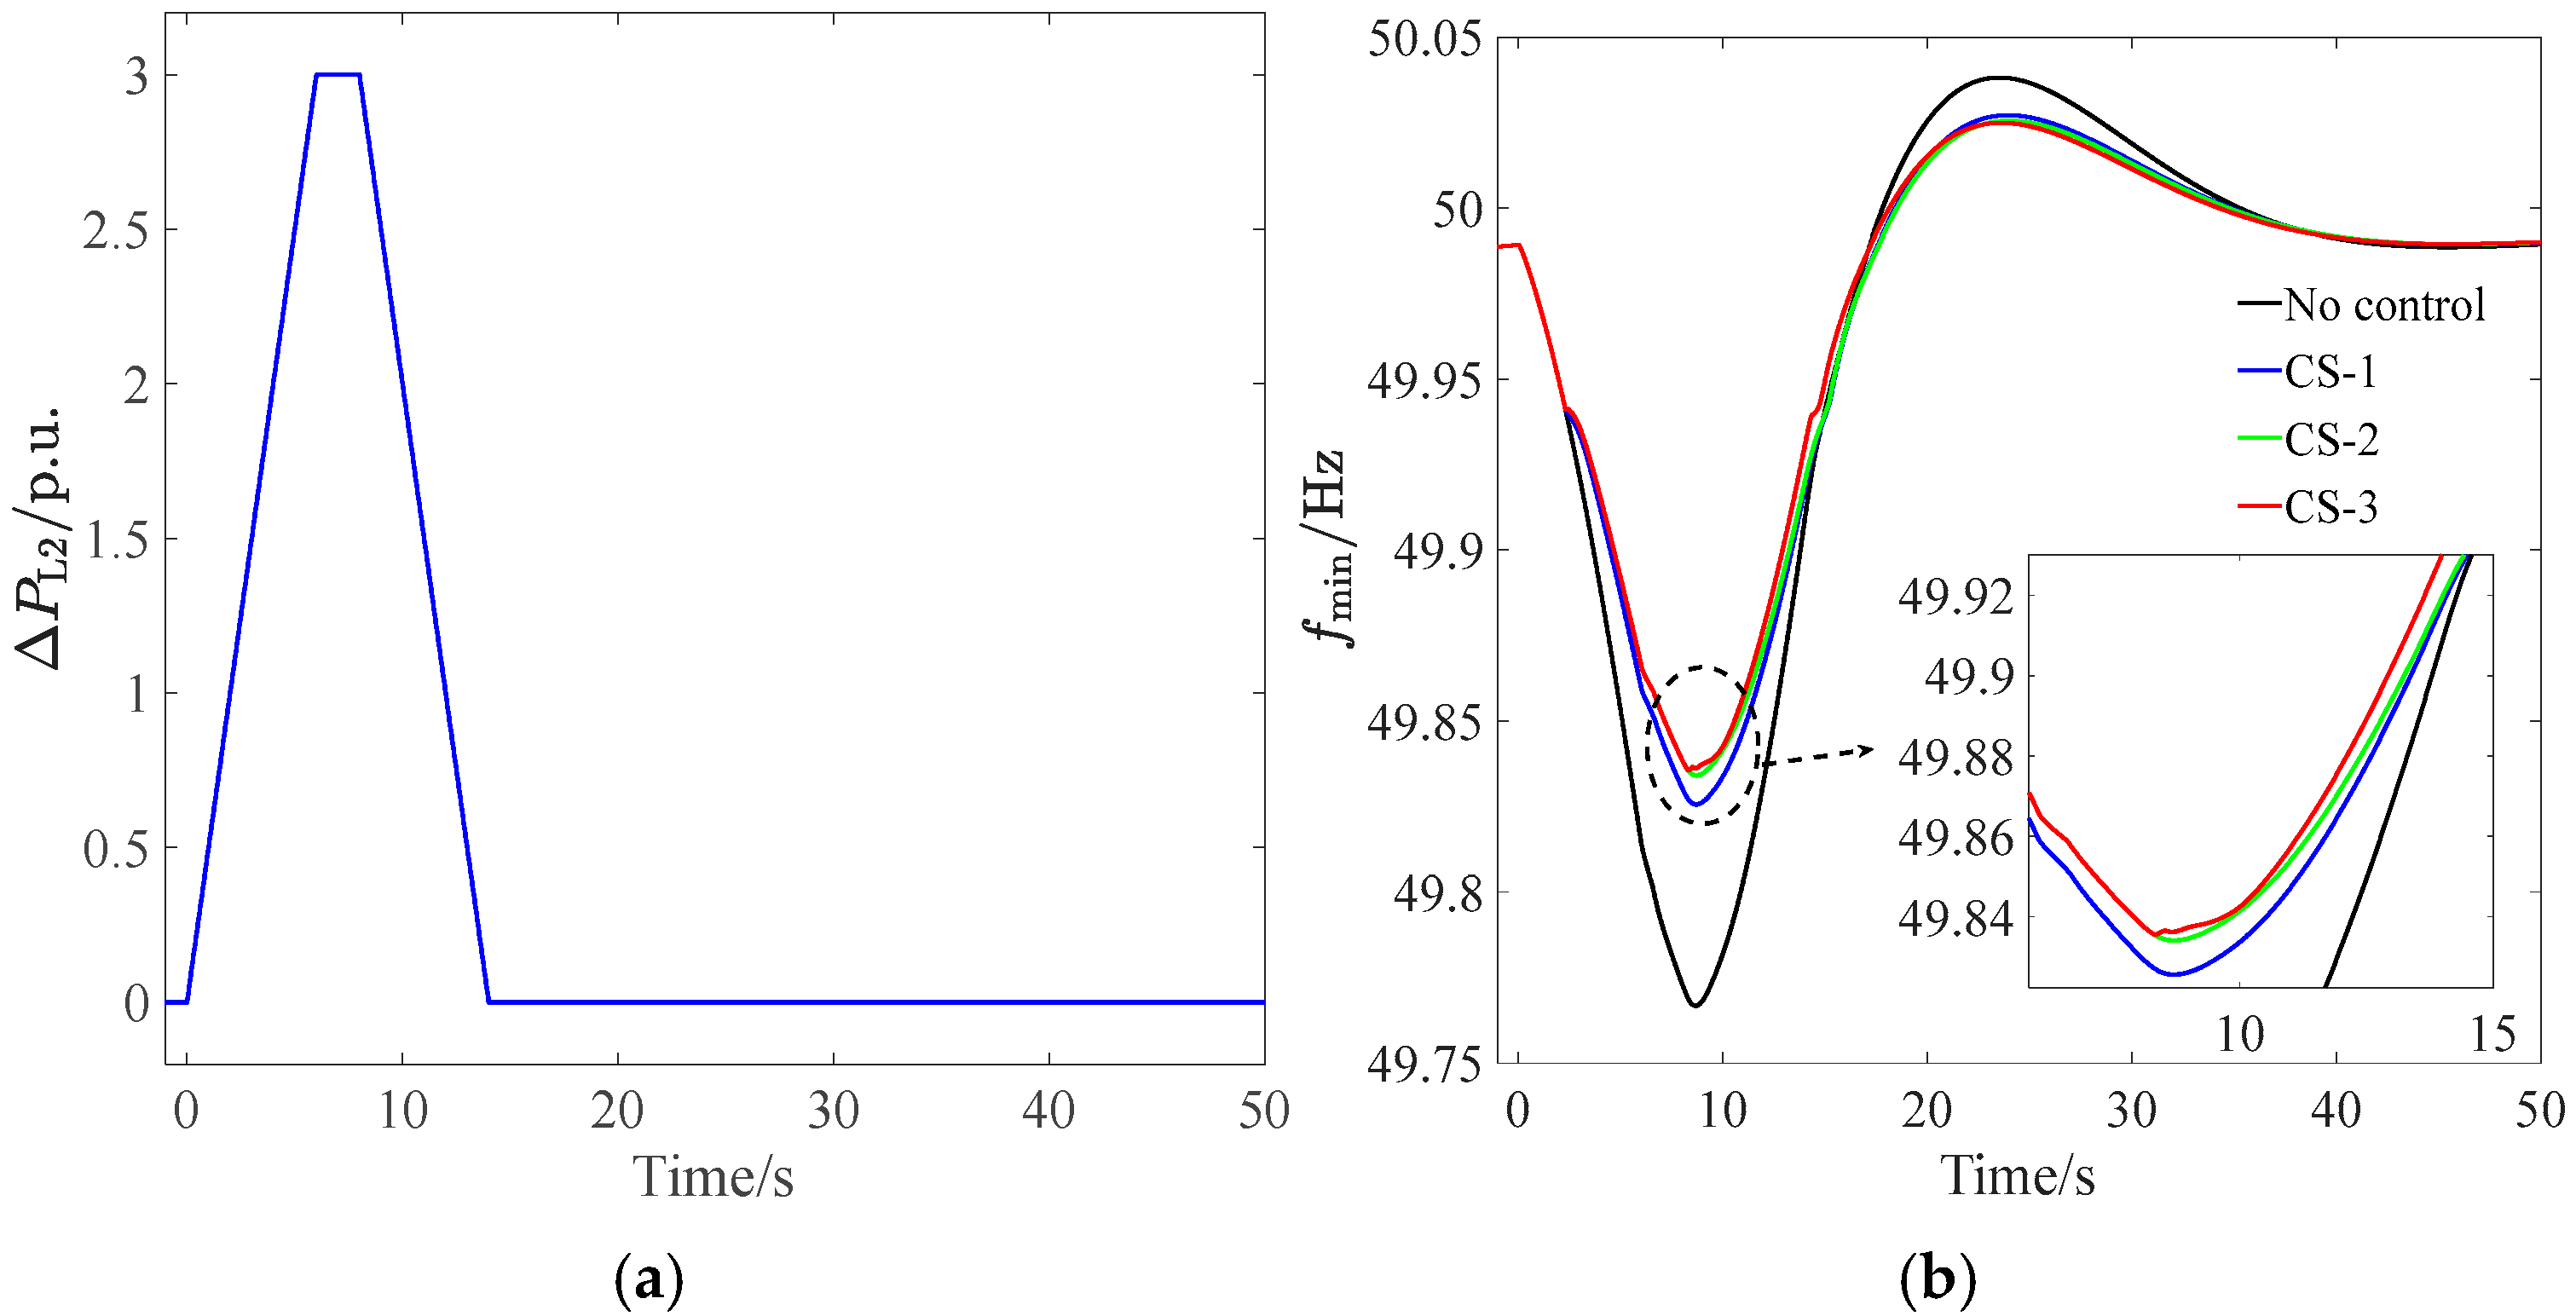
Scenario 1: The load increases by 300 MW at the speed of 50 MW/s and then recovers at the speed of 50 MW/s after 2 s.
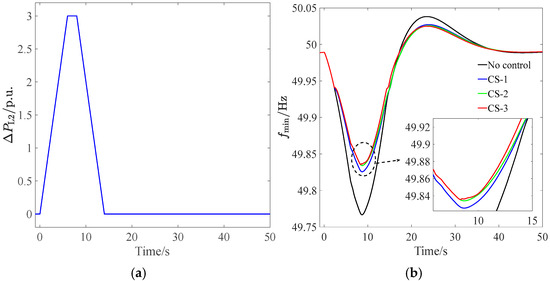
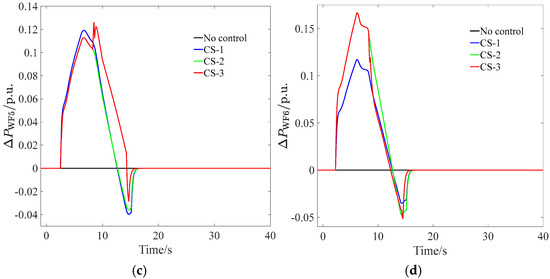
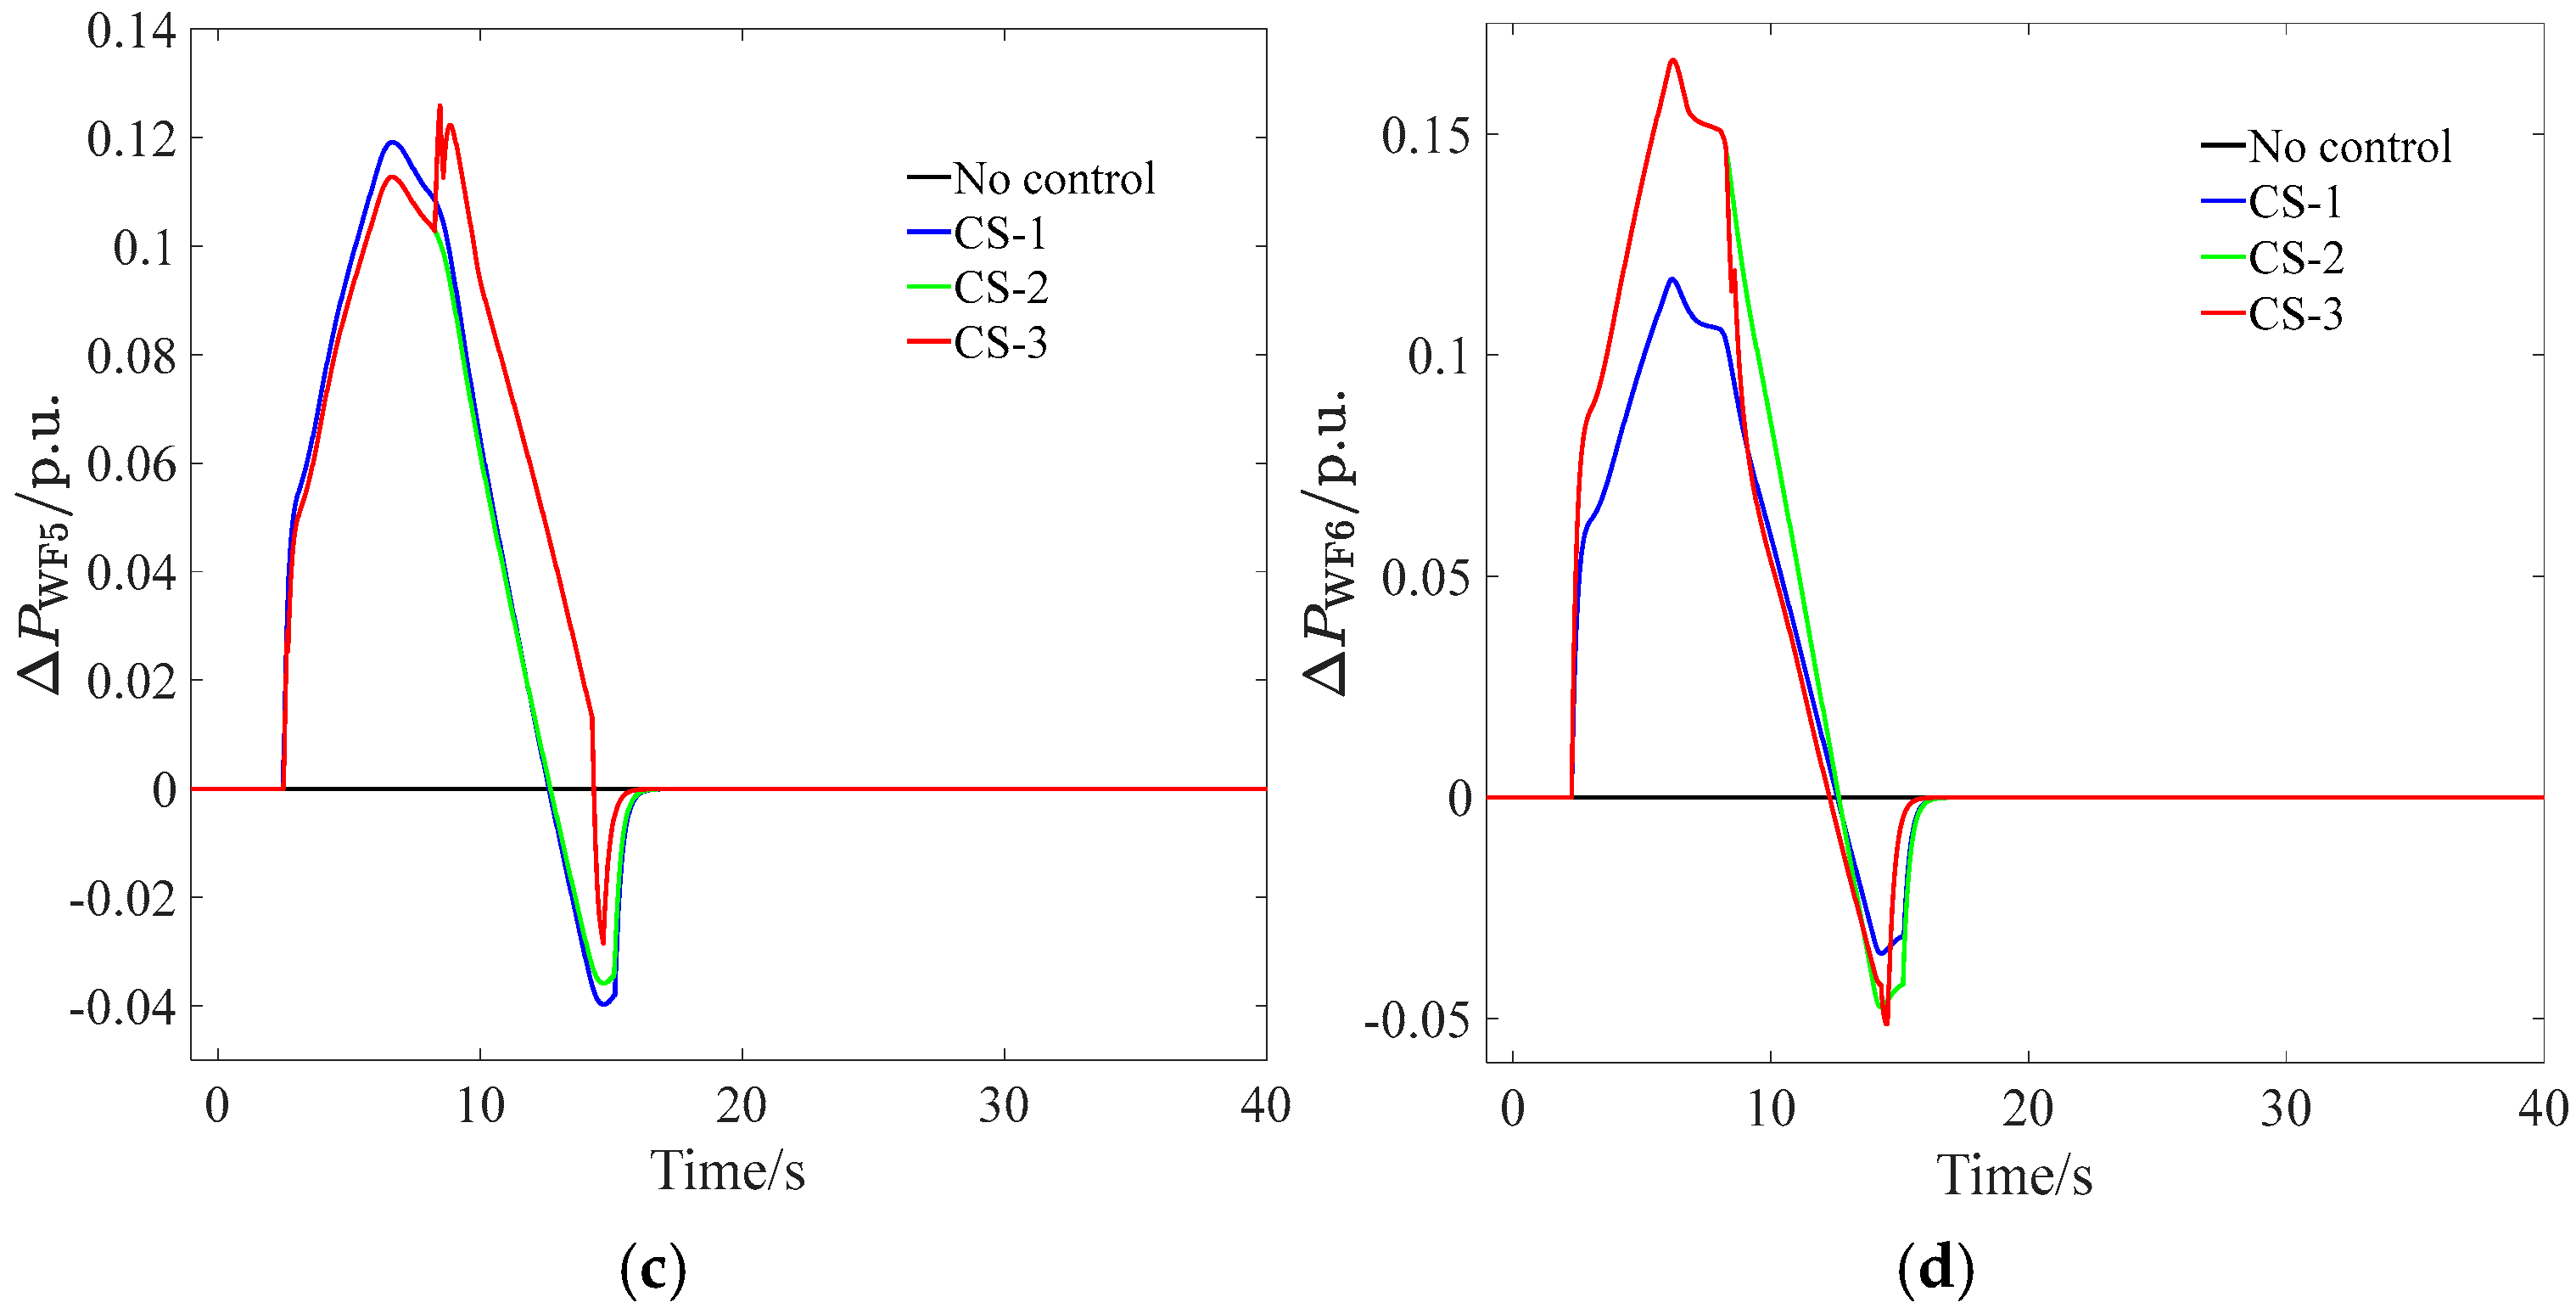
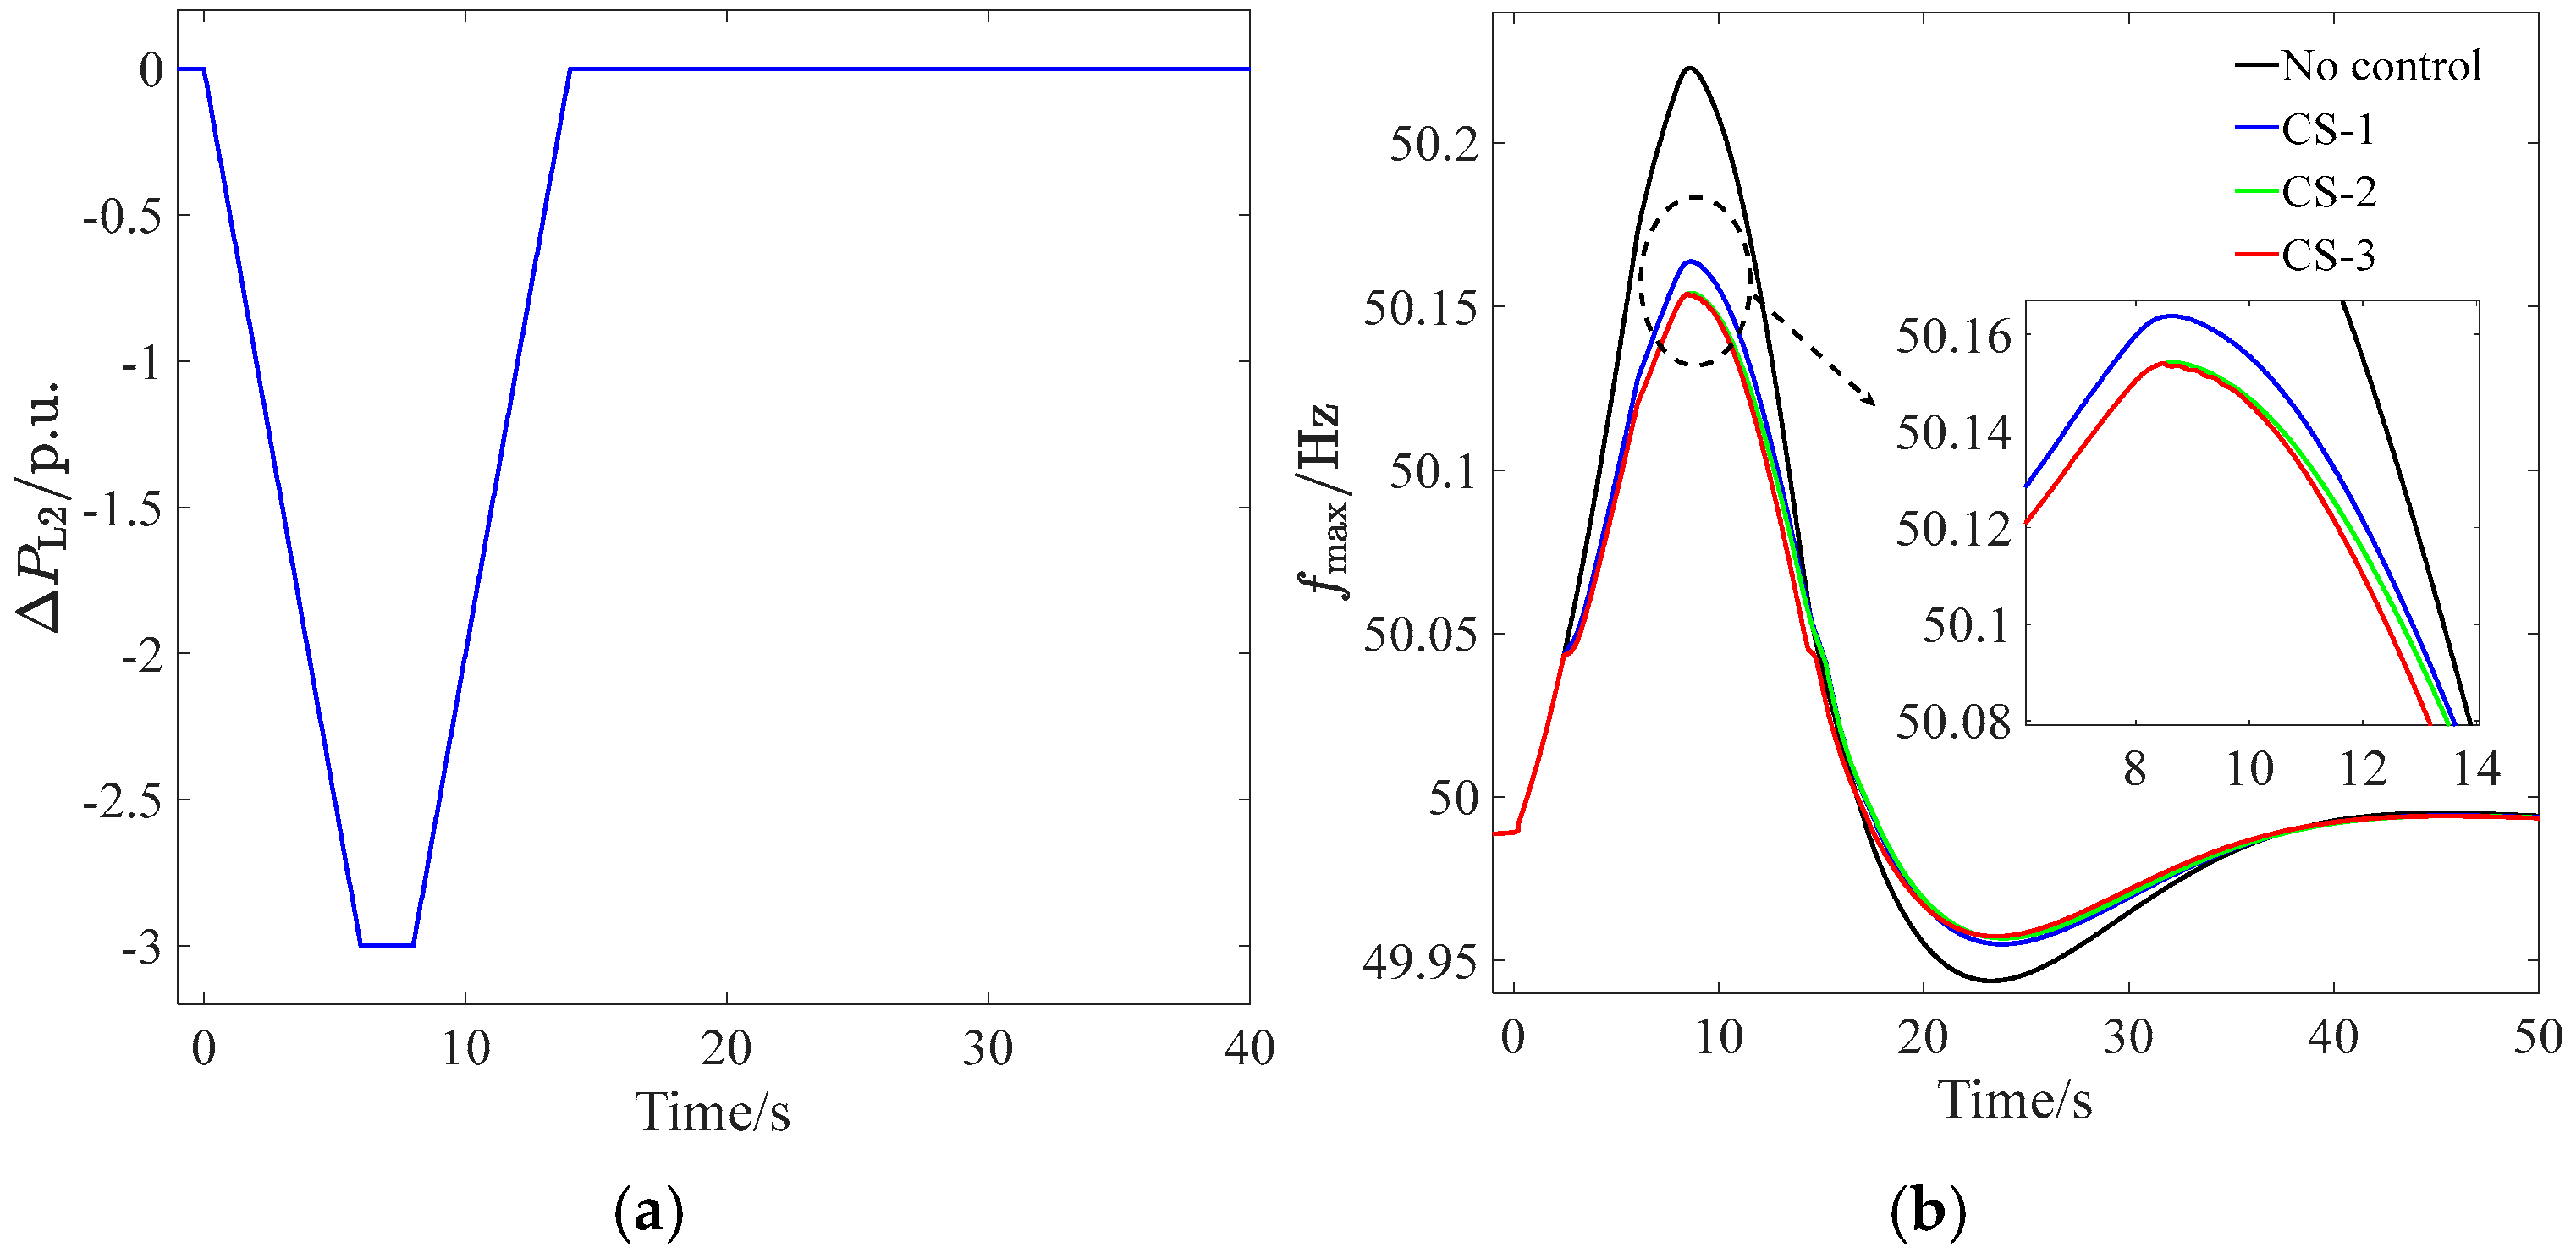
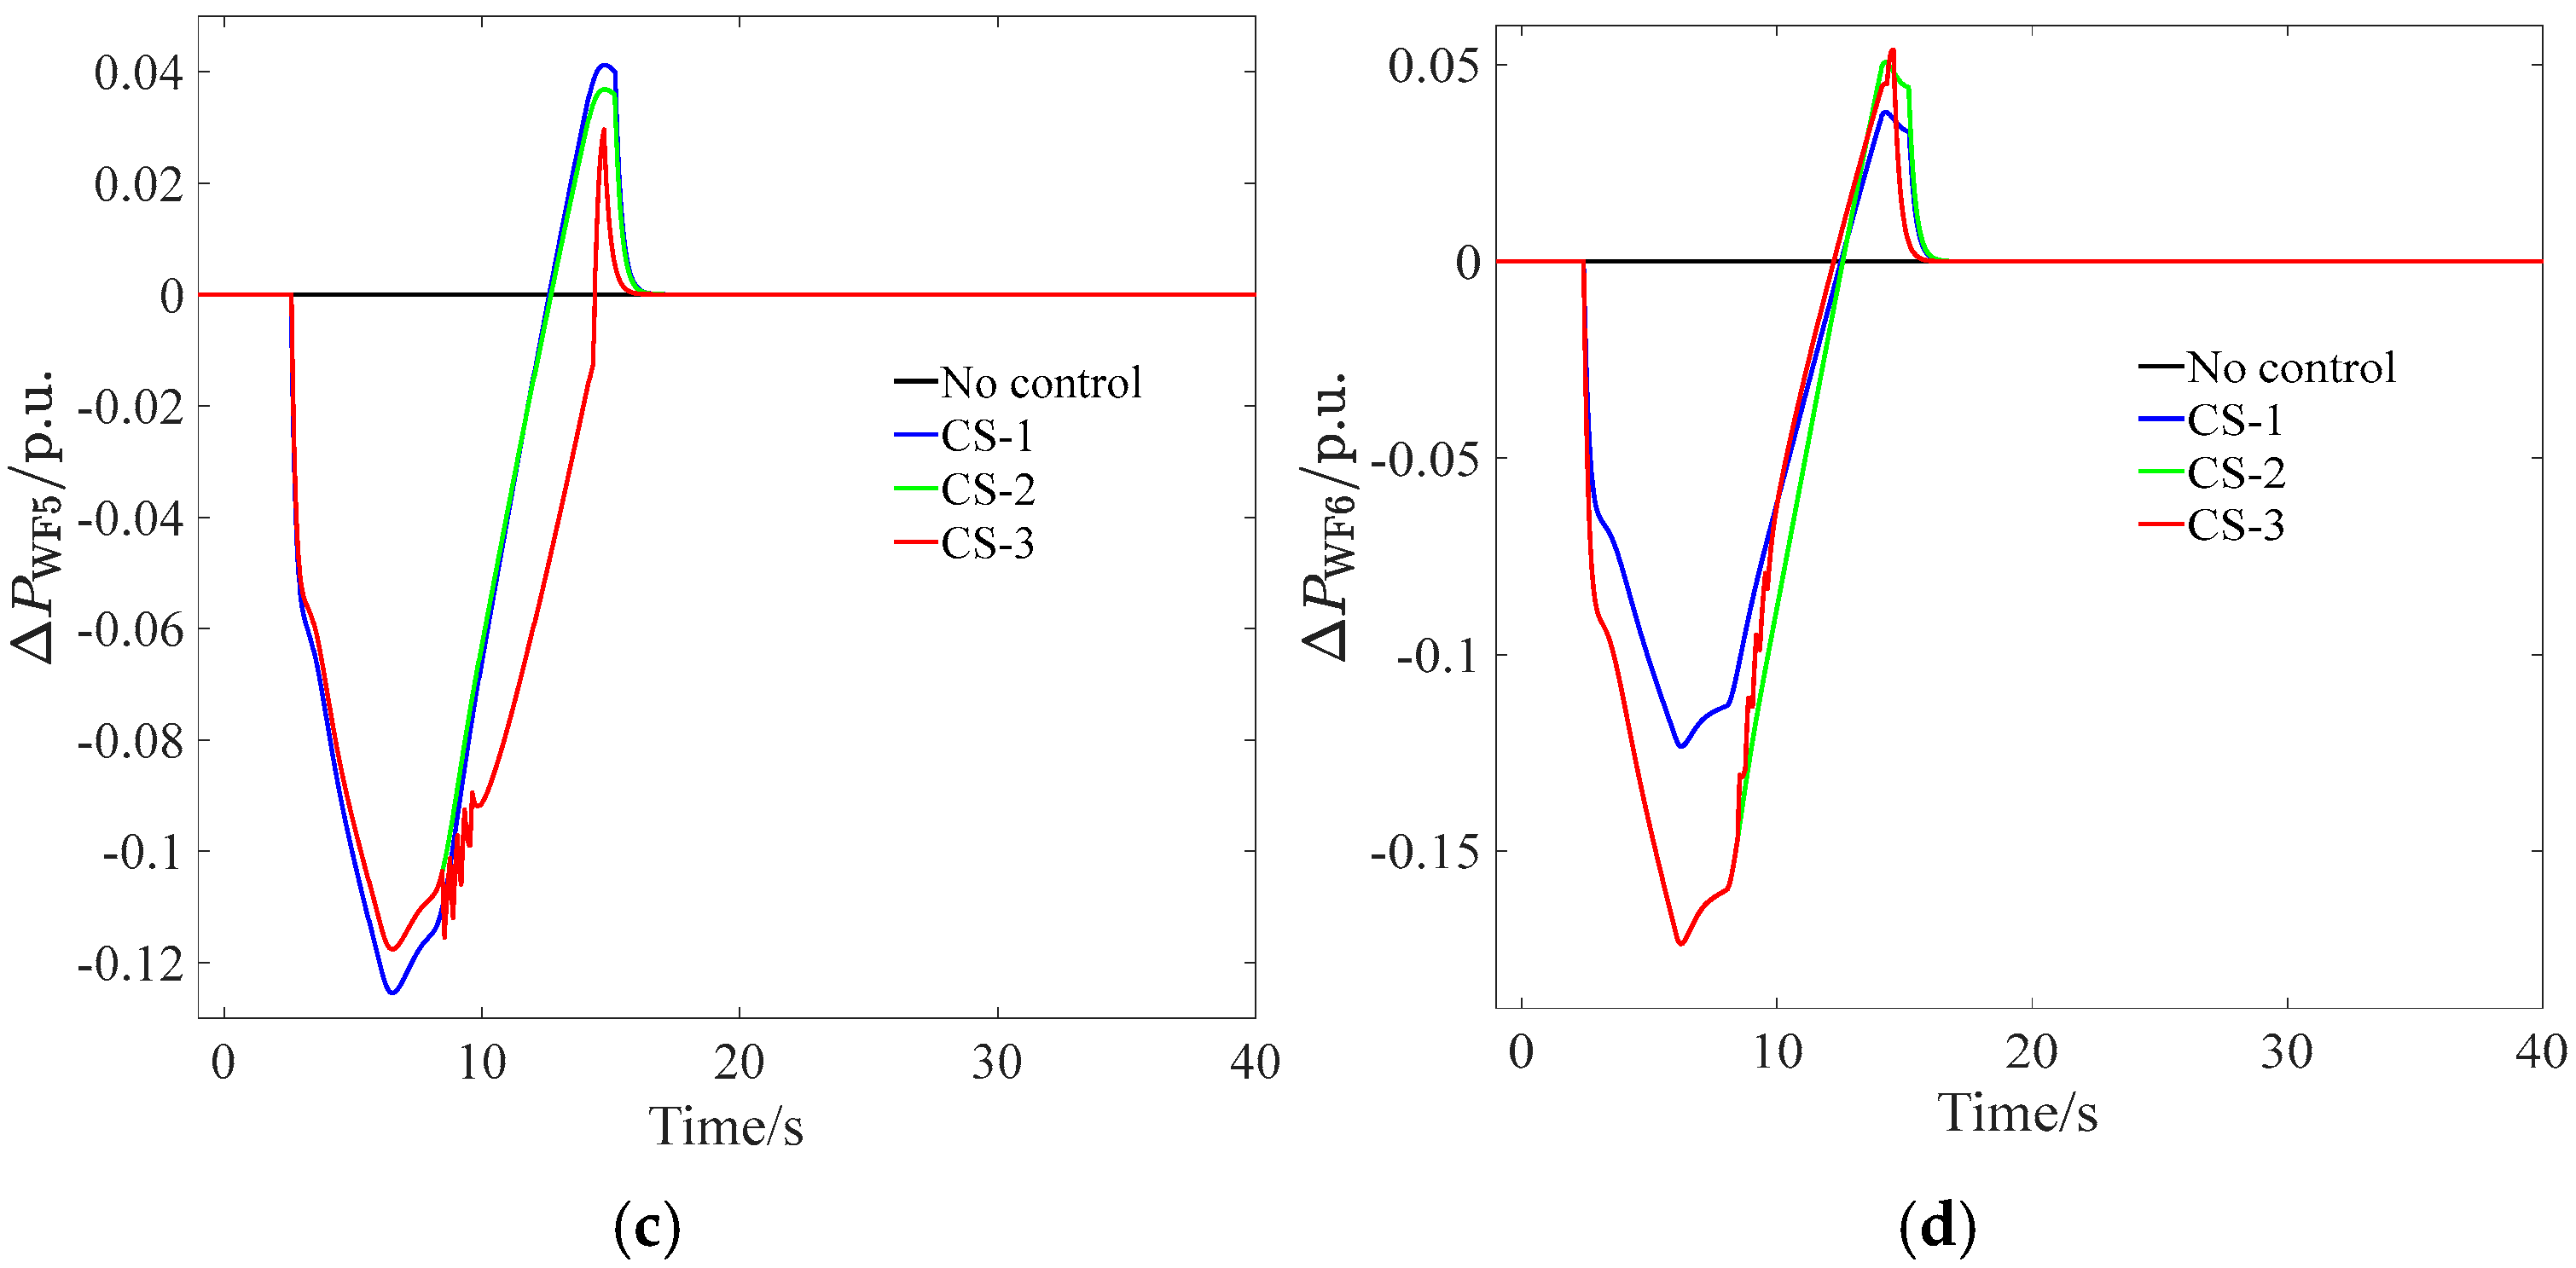
The simulation results of scenario 1 are given in Figure 10. As shown in Figure 10a,b, the load suddenly increases and then recovers; meanwhile, the power system node frequency also decreases and then recovers. During this process, Sk5 = 0.16 and Sk6 = 0.84; then, Sk5 = 0.84 and Sk6 = 0.16 based on Equation (18). The real-time extreme frequency values of the system node with No control, CS-1, CS-2 and CS-3 are shown in the black, blue, green and red curves in Figure 10b. Compared with No control, WF5 and WF6 participating in frequency support control can significantly reduce the frequency deviation after a disturbance. Compared with CS-1, the greater parameter of droop control in CS-2 and CS-3 will benefit frequency support. Moreover, compared with CS-2, CS-3 can further reduce the system node frequency deviation and accelerate its recovery. Consequently, the system frequency distribution characteristic is improved. The additional power output of WF5 and WF6 with different control strategies during the frequency support process is shown in Figure 10c and d, respectively. The wind farm could adjust the participation intensity in frequency support based on the node location of the system frequency extremum, thereby maximizing the frequency support performance of the wind farm.
Figure 10.
Simulation results of scenario 1. (a) Load disturbance; (b) extreme frequency of the system node; (c) additional power output of WF5; (d) additional power output of WF6.
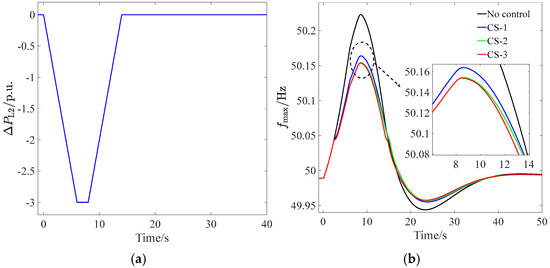
Scenario 2: The load decreases by 300 MW at the speed of 50 MW/s and then recovers at the speed of 50 MW/s after 2 s.
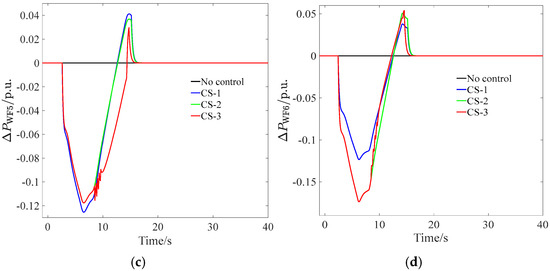
The simulation results of scenario 2 are shown in Figure 11. As given in Figure 11a,b, the system node frequency increases and then recovers when the load suddenly decreases and then recovers. During this process, Sk5 = 0.16 and Sk6 = 0.84; then, Sk5 = 0.84 and Sk6 = 0.16 based on Equation (18). The real-time extreme frequency values of the system node with No control, CS-1, CS-2 and CS-3 are shown in Figure 11b. Compared with No control, WF5 and WF6 participating in frequency support control can greatly reduce the frequency deviation after a disturbance. Compared with CS-1, the greater droop control parameter in CS-2 and CS-3 will benefit frequency support. Additionally, compared with CS-2, CS-3 can further reduce the system node frequency deviation and accelerate its recovery. The simulation results of scenarios 1 and 2 validate the effectiveness of the proposed collaborative control strategy.
Figure 11.
Simulation results of scenario 2. (a) Load disturbance; (b) extreme frequency of the system node; (c) additional power output of WF5; (d) additional power output of WF6.
4.2. Comparative Analysis
In order to further validate the effectiveness of the proposed collaborative control strategy of wind farms in frequency support, different levels of load disturbance are set, and the maximum improvement comparison of the system node frequency deviation under different control strategies is given in Table 1. Mode 1 represents that increases by at the speed of 50 MW/s and then recovers at the speed of 50 MW/s after 2 s, and mode 2 represents that decreases by at the speed of 50 MW/s and then recovers at the speed of 50 MW/s after 2 s.
Table 1.
Maximum improvement comparison of system node frequency deviation.
As shown in Table 1, compared with CS-1 and CS-2, CS-3 can reduce the system node frequency deviation and accelerate the frequency recovery across different disturbance scenarios, further validating the effectiveness of the proposed collaborative control strategy.
5. Conclusions
This paper presents a collaborative control strategy for wind farms to provide frequency support, which adjusts the wind farm’s participation intensity based on the node location of the system frequency extremum, thereby improving the frequency support performance of the wind farm. Simulation results show that the proposed collaborative control strategy can further reduce the node frequency deviation after disturbances and accelerate its recovery, which validates its effectiveness. Consequently, the frequency distribution characteristic is improved, and the frequency stability level of the power system is enhanced.
Due to the utilization of the DC power flow method, there is an error in the calculation of . Moreover, it is assumed that wind farms have sufficient frequency support capacity during parameter optimization. Therefore, future work will focus on the following two aspects. Firstly, the power impact of wind farms on synchronous generators will be further precisely characterized to provide guidance for collaborative frequency support control of wind farms. Secondly, the real-time maximum frequency support capability evaluation of wind farms will be further studied to enable collaborative control that considers wind farm operational states, which will promote the practical application.
Author Contributions
Conceptualization, X.D.; methodology, J.H.; software, Y.Z.; validation, Z.F.; formal analysis, Z.C.; investigation, J.H.; resources, X.D.; data curation, Y.Z.; writing—original draft preparation, J.H.; writing—review and editing, J.R. and Z.F.; visualization, Z.C.; supervision, J.R.; project administration, Y.Z.; funding acquisition, X.D. All authors have read and agreed to the published version of the manuscript.
Funding
This research was funded by a science and technology project of state grid corporation, grant number 5100-202404010A-1-1-ZN.
Data Availability Statement
The data that support the findings of this study are available on request from the corresponding author. The data are not publicly available due to privacy or ethical restrictions.
Conflicts of Interest
Authors Jiawei Hu, Xiangming Dong, Zhongzhong Chen and Zeya Fang were employed by the company Central China Branch of State Grid Corporation of China. Author Yue Zhang was employed by the company State Grid Electric Power Research Institute Co., Ltd and Beijing KeDong Electric Power Control System Co., Ltd. The remaining authors declare that the research was conducted in the absence of any commercial or financial relationships that could be construed as a potential conflict of interest.
Appendix A
The parameter data of the four-machine two-area power system integrated with two wind farms shown in Figure 8 are given in Table A1, Table A2, Table A3 and Table A4.
Table A1.
Synchronous generator data (Base Power: 900 MVA, Base Voltage: 20 kV).
Table A2.
Load data (Base Power: 100 MVA, Base Voltage: 230 kV).
Table A3.
Line data (Base Power: 100 MVA, Base Voltage: 230 kV).
Table A4.
Transformer data (Base Power: 100 MVA, Base Voltage: 230 kV).
References
- Shu, Y.; Tang, Y. Analysis and recommendations for the adaptability of China’s power system security and stability relevant standards. CSEE J. Power Energy Syst. 2017, 3, 334–339. [Google Scholar] [CrossRef] [Scilit]
- Liang, X.; Abbasipour, M. HVDC Transmission and its Potential Application in Remote Communities: Current Practice and Future Trend. IEEE Trans. Ind. Appl. 2022, 58, 1706–1719. [Google Scholar] [CrossRef] [Scilit]
- Jin, X.; Nian, H. Overvoltage Suppression Strategy for Sending AC Grid with High Penetration of Wind Power in the LCC-HVdc System Under Commutation Failure. IEEE Trans. Power Electron. 2021, 36, 10265–10277. [Google Scholar] [CrossRef] [Scilit]
- Yan, K.; Li, G.; Zhang, R.; Xu, Y.; Jiang, T.; Li, X. Frequency Control and Optimal Operation of Low-Inertia Power Systems with HVDC and Renewable Energy: A Review. IEEE Trans. Power Syst. 2024, 39, 4279–4295. [Google Scholar] [CrossRef] [Scilit]
- Hu, J.; Wang, T.; Wang, Z. Transient stability margin assessment of AC/DC hybrid system with commutation failure involved. Int. J. Electr. Power Energy Syst. 2021, 131, 107056. [Google Scholar] [CrossRef] [Scilit]
- Zou, Y.; Elbuluk, M.; Sozer, Y. Stability Analysis of Maximum Power Point Tracking (MPPT) Method in Wind Power Systems. IEEE Trans. Ind. Appl. 2013, 49, 1129–1136. [Google Scholar] [CrossRef] [Scilit]
- Zarifakis, M.; Coffey, W.; Kalmykov, Y.; Titov, S.; Byrne, D.; Carrig, S. Active Damping of Power Oscillations Following Frequency Changes in Low Inertia Power Systems. IEEE Trans. Power Syst. 2019, 34, 4984–4992. [Google Scholar] [CrossRef] [Scilit]
- Hou, Q.; Du, E.; Zhang, N.; Kang, C. Impact of High Renewable Penetration on the Power System Operation Mode: A Data-Driven Approach. IEEE Trans. Power Syst. 2020, 35, 731–741. [Google Scholar] [CrossRef] [Scilit]
- Suh, J.; Yoon, D.; Cho, Y.; Jang, G. Flexible Frequency Operation Strategy of Power System with High Renewable Penetration. IEEE Trans. Sustain. Energy 2017, 8, 192–199. [Google Scholar] [CrossRef] [Scilit]
- Wu, Q.; Bose, A.; Singh, C.; Chow, J.; Mu, G.; Sun, Y.; Liu, Z.; Li, Z.; Liu, Y. Control and Stability of Large-scale Power System with Highly Distributed Renewable Energy Generation: Viewpoints from Six Aspects. CSEE J. Power Energy Syst. 2023, 9, 8–14. [Google Scholar] [CrossRef] [Scilit]
- Li, Y.; Li, W.; Yang, D.; Yang, S.; Yan, G.; Du, Z. Droop Coefficient Design of Wind Turbine Considering Rotor Speed Constraints. IEEE Trans. Sustain. Energy 2024, 15, 2130–2133. [Google Scholar] [CrossRef] [Scilit]
- Garmroodi, M.; Verbič, G.; Hill, D. Frequency Support from Wind Turbine Generators with a Time-Variable Droop Characteristic. IEEE Trans. Sustain. Energy 2018, 9, 676–684. [Google Scholar] [CrossRef] [Scilit]
- Ding, X.; Zhang, Y. Adaptive Virtual Inertia in Doubly Fed Induction Generators for Enhanced Frequency Regulation. IEEE Access 2025, 13, 55616–55626. [Google Scholar] [CrossRef] [Scilit]
- Xie, Z.; Feng, Y.; Ma, M.; Zhang, X. An Improved Virtual Inertia Control Strategy of DFIG-Based Wind Turbines for Grid Frequency Support. IEEE J. Emerg. Sel. Top. Power Electron. 2021, 9, 5465–5477. [Google Scholar] [CrossRef] [Scilit]
- Tang, Y.; Yang, P.; Yang, Y.; Zhao, Z.; Lai, L. Fuzzy Adaptive Frequency Support Control Strategy for Wind Turbines with Improved Rotor Speed Recovery. IEEE Trans. Sustain. Energy 2024, 15, 1351–1364. [Google Scholar] [CrossRef] [Scilit]
- Meng, L.; Qin, C.; Zeng, Y.; Gao, Y.; Jiang, Y.; Zhang, J.; Shao, C. Two-stage adaptive frequency control method for wind power considering second frequency events in rotor speed recovery. CSEE J. Power Energy Syst. 2025, 1–11. Available online: https://ieeexplore.ieee.org/document/11006463 (accessed on 10 February 2026).
- Chen, W.; Yang, W.; Qi, H.; Shi, Z.; Geng, H. Coordinated Power Reserve Control of Wind Farm for Frequency Regulation. IEEE Access 2023, 11, 55465–55473. [Google Scholar] [CrossRef] [Scilit]
- Tu, G.; Li, Y.; Xiang, J. Coordinated Rotor Speed and Pitch Angle Control of Wind Turbines for Accurate and Efficient Frequency Response. IEEE Trans. Power Syst. 2022, 37, 3566–3576. [Google Scholar] [CrossRef] [Scilit]
- You, C.; Zhao, Y.; Hou, S.; Zhang, Y.; Lv, Y. Research on Centre of Inertia Based Frequency Sampling and System Frequency Distribution Characteristics. IEEE Access 2024, 12, 71371–71378. [Google Scholar] [CrossRef] [Scilit]
- Lin, Y.; Hu, J.; Wang, T.; Wang, Z. Impact Mechanisms of Commutation Failure Caused by a Sending-End AC Fault and Its Recovery Speed on Transient Stability. Electronics 2023, 12, 3439. [Google Scholar] [CrossRef] [Scilit]
- Rimorov, D.; Wang, X.; Kamwa, I.; Joós, G. An Approach to Constructing Analytical Energy Function for Synchronous Generator Models with Subtransient Dynamics. IEEE Trans. Power Syst. 2018, 33, 5958–5967. [Google Scholar] [CrossRef] [Scilit]
- Cardenas, R.; Pena, R.; Alepuz, S.; Asher, G. Overview of Control Systems for the Operation of DFIGs in Wind Energy Applications. IEEE Trans. Ind. Electron. 2013, 60, 2776–2798. [Google Scholar] [CrossRef] [Scilit]
- Van, T.; Nguyen, T.; Lee, D. Advanced Pitch Angle Control Based on Fuzzy Logic for Variable-Speed Wind Turbine Systems. IEEE Trans. Energy Convers. 2015, 30, 578–587. [Google Scholar] [CrossRef] [Scilit]
- Arani, M.; El-Saadany, E. Implementing Virtual Inertia in DFIG-Based Wind Power Generation. IEEE Trans. Power Syst. 2013, 28, 1373–1384. [Google Scholar] [CrossRef] [Scilit]
- Wang, Z.; Wu, W. Coordinated Control Method for DFIG-Based Wind Farm to Provide Primary Frequency Regulation Service. IEEE Trans. Power Syst. 2018, 33, 2644–2659. [Google Scholar] [CrossRef] [Scilit]

Disclaimer/Publisher’s Note: The statements, opinions and data contained in all publications are solely those of the individual author(s) and contributor(s) and not of MDPI and/or the editor(s). MDPI and/or the editor(s) disclaim responsibility for any injury to people or property resulting from any ideas, methods, instructions or products referred to in the content. |
© 2026 by the authors. Licensee MDPI, Basel, Switzerland. This article is an open access article distributed under the terms and conditions of the Creative Commons Attribution (CC BY) license.