


Abstract
This article presents PrevOccupAI-HAR, a new publicly available dataset designed to advance smartphone-based human activity recognition (HAR) in office environments. PrevOccupAI-HAR comprises two sub-datasets: (1) a model development dataset collected under controlled conditions, featuring 20 subjects performing nine sub-activities associated to three main activity classes (sitting, standing, and walking), and (2) a real-world dataset captured in an unconstrained office setting captured from 13 subjects carrying out their daily office work for six hours continuously. Three machine learning models—namely, k-nearest neighbors (KNN), support vector machine (SVM), and Random Forest (RF)—were trained on the model development dataset to classify the three main classes independently of sub-activity variation. The KNN, SVM, and RF models achieved accuracies of 90.94%, 92.33%, and 93.02%, respectively, on the development dataset. When deployed on the real-world dataset, the models attained mean accuracies of 69.32%, 79.43%, and 77.81%, reflecting performance degradations between 21.62% and 12.90%. Analysis of sequential predictions revealed frequent short-duration misclassifications, predominantly between sitting and standing, resulting in unstable model outputs. The findings highlight key challenges in transitioning HAR models from controlled to real-world contexts and point to future research directions involving temporal deep learning architectures or post-processing methods to enhance prediction consistency.
1. Introduction
Over the past two decades, the prevalence of sedentary and office-based work has increased substantially. A Eurostat survey conducted in 2017 reported that 39% employees in the European Union (EU) perform sedentary work [1], a trend that is expected to continue in the future. Office work is predominately characterized by low-variability activities, including prolonged sitting, often accompanied by static postures [2]. Prolonged static sitting has been associated with lower back, neck, and shoulder pain; type 2 diabetes; cardiovascular diseases; and obesity [2,3]. Moreover, high job demands, combined with low job resources, impact office workers’ psychosocial well-being [4]. The compound effects of these factors contribute to the development of work-related musculoskeletal disorders (WRMDs), stress, depression, and anxiety, which affect 7.4% of workers in the EU [5]. More generally, WRMSDs arise from a combination of occupational risk factors, including high mechanical demands, repetitive or forceful tasks, sustained or extreme postures, and insufficient recovery [6]. While high-demand lifting tasks are well-known contributors to WRMSDs in many occupational settings, physically demanding postures are also recognized as relevant risk factors, particularly when involving non-neutral body postures in either dynamic or static configurations engaging relatively vulnerable muscle regions, such as the shoulders, neck, upper limbs, or lower back [6]. In typical office work, static configurations are more prevalent due to prolonged sedentary behavior, resulting in low-load but long-duration postural exposure, which still represents a relevant occupational risk profile. WRMDs negatively impact worker productivity and increase absenteeism, resulting in increased economic costs and medical burdens for individuals and organizations [6,7]. Given their complex, multifactorial nature, the prevention of WRMDs and associated mental health conditions requires goal-oriented strategies that target various factors, including exposure to physical, psychosocial, and environmental risks [8].
Assessing these occupational risk factors effectively requires a context-aware assessment framework, meaning that it is necessary to know which activity the worker is carrying out at any moment throughout the workday. Such contextual information enables the extraction of activity-specific features relevant for characterizing occupational risks, such as posture-related indicators during sitting or standing and gait-related indicators during walking, among others. A suitable approach for addressing this problem is machine learning (ML)-based human activity recognition (HAR). HAR aims to identify human physical activities using sensor or video data [8,9]. In office environments, sensor-based HAR is generally preferable, as video-based approaches may compromise worker privacy and are additionally affected by practical limitations such as sensitivity to illumination conditions, occlusions caused by furniture or other occupants, and reduced portability across different workspaces [10,11].
Reliable human activity recognition requires the availability of well-designed, annotated datasets that capture the variability of human behavior across different contexts and populations. HAR datasets play a central role in the development, training, and evaluation of machine learning models, as they define not only the set of activities to be recognized but also the conditions under which these activities are performed, such as environmental constraints, sensor placement, activity duration, and inter- and intra-subject variability [12]. The quality and representativeness of these datasets therefore strongly influence the generalizability and real-world applicability of HAR algorithms.
Although several sensor-based HAR datasets have been proposed, many are limited to a small set of highly constrained activities, often exhibiting low inter- and intra-class variability and being recorded over short durations [13,14,15]. Moreover, a substantial portion of existing datasets focuses on activities of daily living (ADLs) rather tan office-specific work tasks [13,14,15,16,17]. In this work, office activities are considered distinct from generic activities of daily living, as they are performed in a specific occupational context and are characterized by prolonged sedentary behavior, task repetitiveness, and constrained postures that are not typically captured in ADL-focused datasets. As a result, these datasets do not adequately reflect the variability, temporal continuity, and contextual ambiguity encountered in real-world office environments. Furthermore, most available datasets are collected under controlled conditions, capturing clearly defined activities, limiting their utility for the evaluation of model generalization and robustness in unconstrained, real-world settings. Consequently, there remains a need for datasets that capture realistic work activities and support the evaluation of ML models under both controlled and real-world conditions.
The presented work addresses this gap by introducing a novel smartphone sensor-based dataset: the PrevOccupAI-HAR dataset. It consists of two labeled sub-datasets: a model development (MD) dataset capturing nine sub-activities that can be associated with three main activities (sitting, standing, and walking), performed by 20 subjects in a controlled environment, and a model evaluation (ME) dataset comprising six hour-long recordings from 13 subjects performing their daily office work. In addition to the proposed datasets, the current manuscript evaluates how identifiable each activity is in each set. Three ML models—namely k-nearest neighbors (KNN), support vector machine (SVM), and Random Forest (RF)—are trained on the MD dataset and subsequently evaluated on the ME dataset to establish a performance baseline and assess differences between activity identification in controlled and unrestricted scenarios. Thus, the main contributions of this work can be summarized as follows:
- Introduction of PrevOccupAI-HAR, a new publicly available smartphone-based human activity recognition dataset specifically targeting office environments;
- Design of a dual acquisition protocol comprising both a controlled laboratory dataset and long-duration real-world office recordings, enabling the study of generalization from controlled to unconstrained conditions;
- Provision of a detailed and reproducible data acquisition, annotation, and pre-processing pipeline tailored to office-based activities;
- Establishment of baseline performance benchmarks using classical machine learning models (KNN, SVM, and RF) for the recognition of sitting, standing, and walking activities;
- Empirical analysis of the performance degradation observed when deploying models trained under controlled conditions to real-world office scenarios, highlighting key challenges for practical HAR deployment.
The remainder of this paper is organized as follows. Section 2 reviews related work on sensor-based human activity recognition and existing datasets. Section 3 describes the proposed dataset, acquisition protocols, pre-processing steps, and baseline machine learning models. Section 4 presents the experimental results, which are discussed in Section 5, followed by concluding remarks in Section 6.
2. Related Work
HAR is a complex task influenced by several factors, including the diversity and number of activities under study; the duration of these activities; intersubject variability, since individuals may perform the same activity differently; and intrasubject variability over time. These factors can impact HAR frameworks, often limiting their generalizability [18]. In the literature, there is often a distinction between basic and complex activities. Basic activities typically involve low-variability movements that can consist of clear, repetitive patterns, making them easier to distinguish. In contrast, complex activities usually consist of compound actions that may include combinations of basic activities, interactions with objects, or sequences of movements, resulting in much higher variability [19,20,21,22,23,24].
Table 1 summarizes representative sensor-based HAR datasets, highlighting differences in activity scope, acquisition conditions, sensor configurations, dataset duration, and key limitations relevant to real-world office environments. Some of the most commonly used datasets for HAR focus on ADLs. Examples include the UCI-HAR [13], WISDM [14], MHEALTH [15,25], PAMAP2 [16], and HARTH [17] datasets. The UCI-HAR dataset contains data from 30 subjects performing six basic activities: standing, sitting, walking, lying down, and ascending/ descending stairs. Each activity was recorded for 30 s using a smartphone placed at the waist, which collected accelerometer (ACC) and gyroscope (GYR) data. WISDM includes a similar set of activities, except lying down. Data was collected from 29 participants using a smartphone positioned on the leg, recording ACC data for a total of 25 min per subject. The MHEALTH dataset also includes these basic activities, with additional movements such as bending forward at the waist, crouching, and front arm raises, each lasting one minute. Data was collected from ten subjects using multiple wearable sensors, capturing ACC, GYR, and magnetometer (MAG) data. For PAMAP2, nine subjects were recruited to perform 12 activities, including lying down, sitting, standing, walking, running, cycling, nordic walking, ironing, vacuuming, rope jumping, and ascending/descending stairs. Data was acquired for a total of 60 min per subject using three IMUs attached to the chest, the wrist of the dominant arm, and the ankle of the dominant leg. Finally, the HARTH dataset was collected from 22 adults using two triaxial ACCs on the right thigh and lower back, with additional video recordings for annotation. It includes twelve labeled activities: sitting, standing, lying, walking, running, stairs (ascending/descending), shuffling (standing with leg movement), cycling (sitting/standing), and transport (sitting/standing). Recordings were conducted in a controlled session of one to two hours per participant and a free-living session of approximately one hour per participant.
Table 1.
Comparison between existing HAR datasets and the proposed PrevOccupAI-HAR dataset.
Other datasets, such as SKODA [26] and REALDISP [27], focus on more complex activities. SKODA involves ten activities performed by eight subjects on a car assembly line, with an Inertial Measurement Unit (IMU) placed on the back of their hands. REALDISP features 33 fitness exercises performed by 17 subjects, with data collected using nine IMUs placed on both arms, both legs, and the back.
Despite the wide range of publicly available HAR datasets, from basic activities to complex, multi-component tasks, none specifically captures the activity characteristic of office work. While Kim et al. [28] proposed a dataset for HAR in office environments, it is limited to a conference-room setting and relies solely on ambient sensors, leaving a gap in datasets that capture unrestricted office work in realistic settings. Such data is essential for developing context-aware occupational health assessment systems for office workers. Furthermore, current datasets are collected in controlled environments and used for the training and testing of HAR models, offering no validation of their performance in unrestricted, real-world settings. Therefore, there is a need for datasets that specifically capture tasks of office work and include unrestricted, real-world activities. This work introduces the PrevOccupAI-HAR dataset, which consists of two sub-datasets: one capturing activities of office work in a controlled environment and a second containing full-workday recordings of unrestricted tasks of office work.
3. Materials and Methods
The following sections describe the proposed approach for smartphone-based human activity recognition in office environments, including a description of the two acquired and labeled datasets. This is followed by an explanation of the applied signal pre-processing and feature extraction pipelines. Finally, three machine learning models—namely, KNN, SVM, and RF—are trained on the first dataset and subsequently deployed and evaluated on the second. The dataset can be downloaded by requesting access via prevoccupai-har@dfki.de, and the utilized Python 3.12 code base is publicly available at https://github.com/p-probst/PrevOccupAI_HAR_JA (accessed on 10 February 2026).
3.1. Datasets
With the purpose of performing HAR in office environments, two datasets were acquired: (1) a dataset acquired under controlled conditions for ML model development and (2) a dataset acquired in a real-world setting for model evaluation.
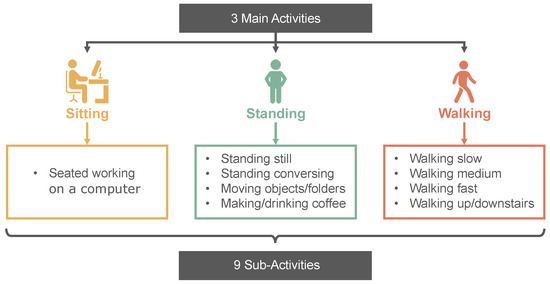
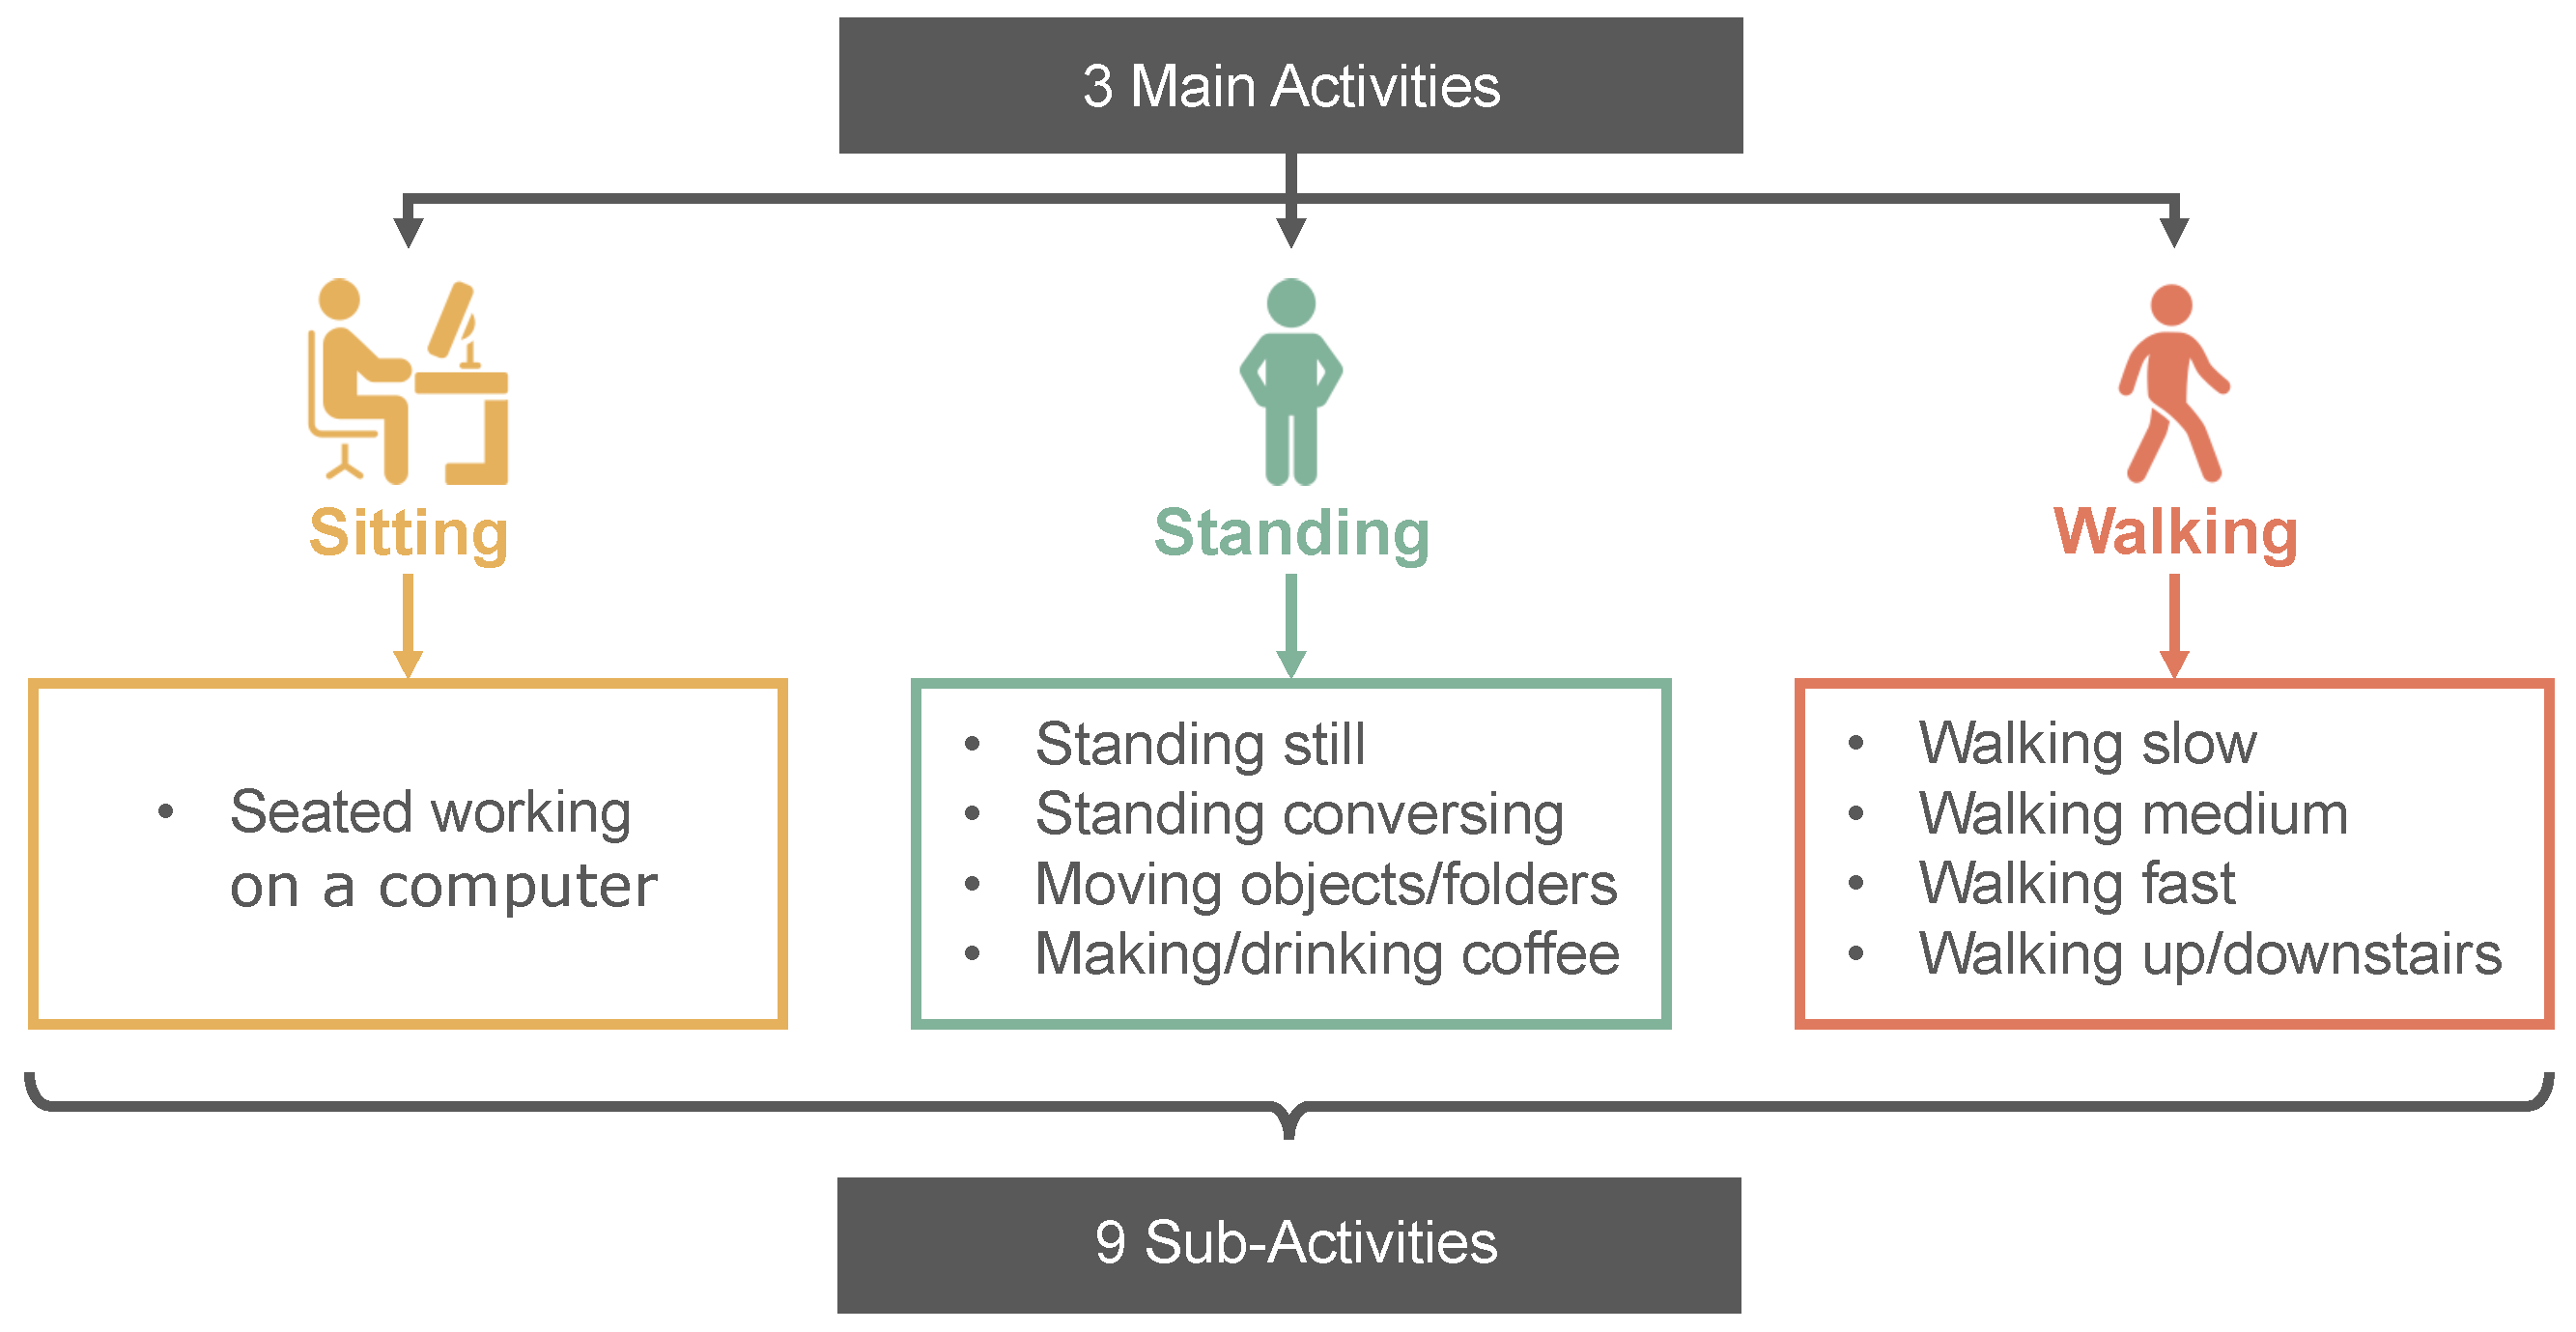
The MD dataset contains data from 20 healthy subjects, comprising 14 women and six men, aged between 19 and 54 years (27.0 ± 8.7 years). The dataset was acquired on the premises of the NOVA School of Science and Technology—specifically, at the LIBPhys Biosignals lab and in the surrounding area. The dataset contains nine sub-activities that can be associated with three main activities. This structure was chosen based on hierarchical task analysis [29], an ergonomic technique that decomposes complex tasks into main activities and their corresponding sub-activities. Following this approach, workers in office settings typically engage in activities associated with sitting, standing, and walking. The corresponding sub-activities were chosen based on common tasks executed in daily office work. For activities associated to standing, four sub-activities were chosen—namely, standing still; standing while conversing (i.e., talking with a colleague); making/drinking coffee or tea; and moving objects/folders inside a tall cabinet with objects placed at different levels, ensuring that subjects had to reach up and down. Walking data were collected at different speeds. Subjects walked at slow, medium (i.e., preferred walking pace), and fast paces. Walking up and down stairs was also recorded. Finally, for sitting, standard computer work was chosen. The resulting hierarchical structure is presented in Figure 1.
Figure 1.
Hierarchical task description of recorded activities within the MD dataset.
The ME dataset comprises 13 healthy subjects (eight women and five men) aged between 18 and 34 years (24.2 ± 3.7 years). Some of these subjects participated in the data collection for the MD dataset. For this dataset, subjects carried out their daily work tasks for six hours.
The subject details for both datasets, comprising subject ID, sex, age, and dataset participation, are described in Table 2.
Table 2.
Subject descriptions for the model development and model evaluation datasets.
3.2. Sensor Setup
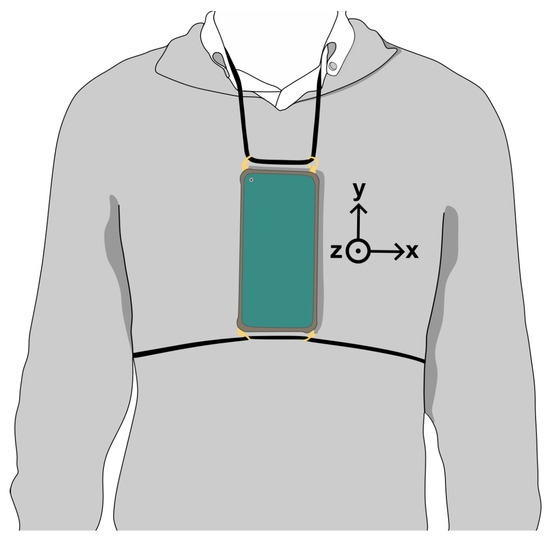
For both datasets, data was acquired using a Xiaomi Redmi Note 9 smartphone (Beijing, China) that was strapped to the subject’s chest, as shown in Figure 2. This placement follows the sensor placement setup utilized in the PrevOccupAI project [30]. The purpose of this placement is two-fold: (1) it allows for tracking of human activities, and (2) when the subject is seated, trunk movement can be collected, effectively allowing for characterization of seated postures throughout the workday. This placement can also be utilized as a proxy for the development of sensorized garments.
Figure 2.
Placement of smartphone for data acquisition. The phone’s axes are indicated.
The utilized smartphone runs on the Android operating system and was used to acquire triaxial ACC, GYR, and MAG data, as well as rotation vector (ROT) data. Data collection was carried out using the PrevOccupAI application (v1.0) [31], which allows for acquisition of data from internal smartphone sensors. ACC, GYR, and ROT were acquired at 100 Hz, while MAG was sampled at 50 Hz due to restrictions of the Android OS.
3.3. Acquisition Protocol
3.3.1. Model Development Dataset
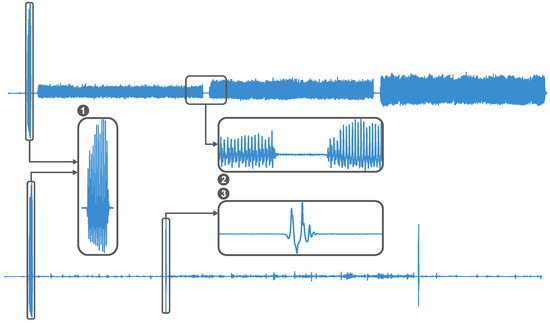
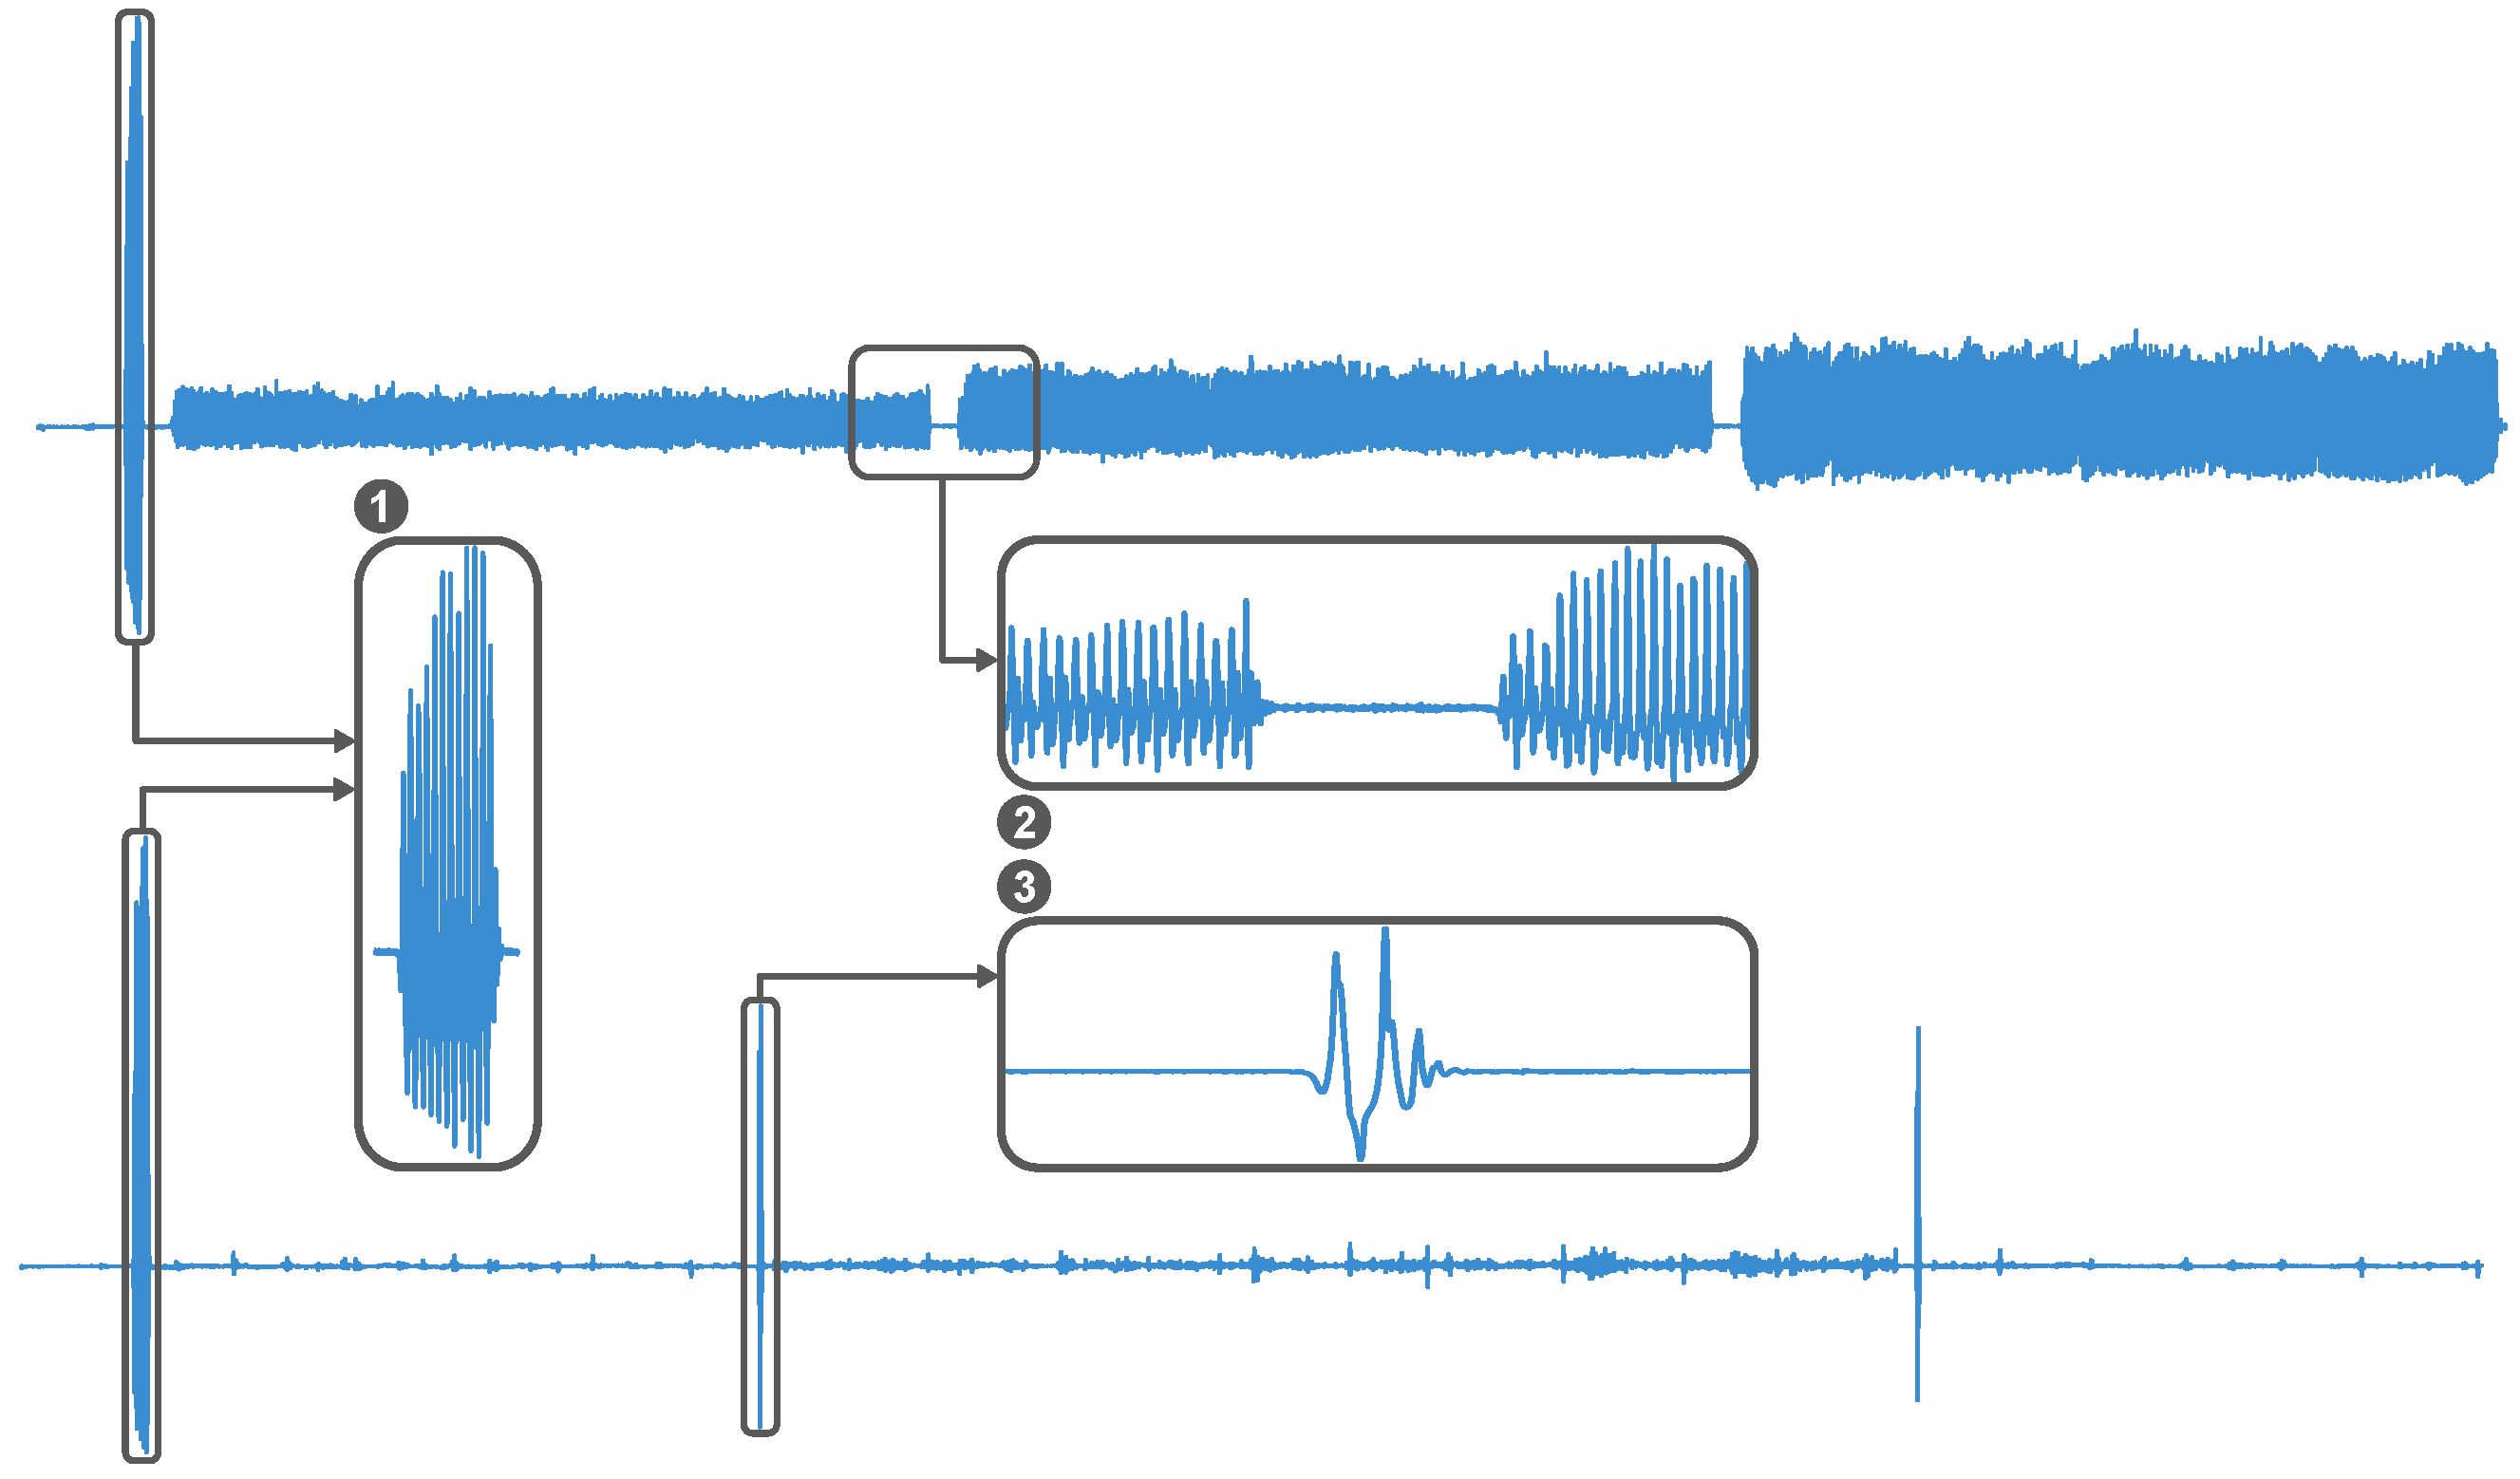
Following HTA, a total of 15 min, 30 min, and 20 min were acquired for sub-activities associated with sitting, standing, and walking, respectively. Similar sub-activities were grouped together to form five separate sessions. Each session included clearly defined sections in which the subject was instructed to perform a specific sub-activity. At the beginning of each recording session, each subject performed roughly ten jumps for synchronization purposes. To facilitate the segmentation of the sub-activities performed in the same recording, short pauses were introduced in between. These pauses were ten-seconds stops (no movement) for activities associated with walking, and ten-seconds stops with a jump in the middle for activities performed while standing. The described segmentation patterns are shown in Figure 3 for walking and standing-related acquisition. The sitting acquisition was performed continuously.
Figure 3.
Segmentation patterns within a walking (top) and standing (bottom) recording: (1) synchronization jumps; (2) ten-second stop; (3) ten-second stop with jump in the middle.
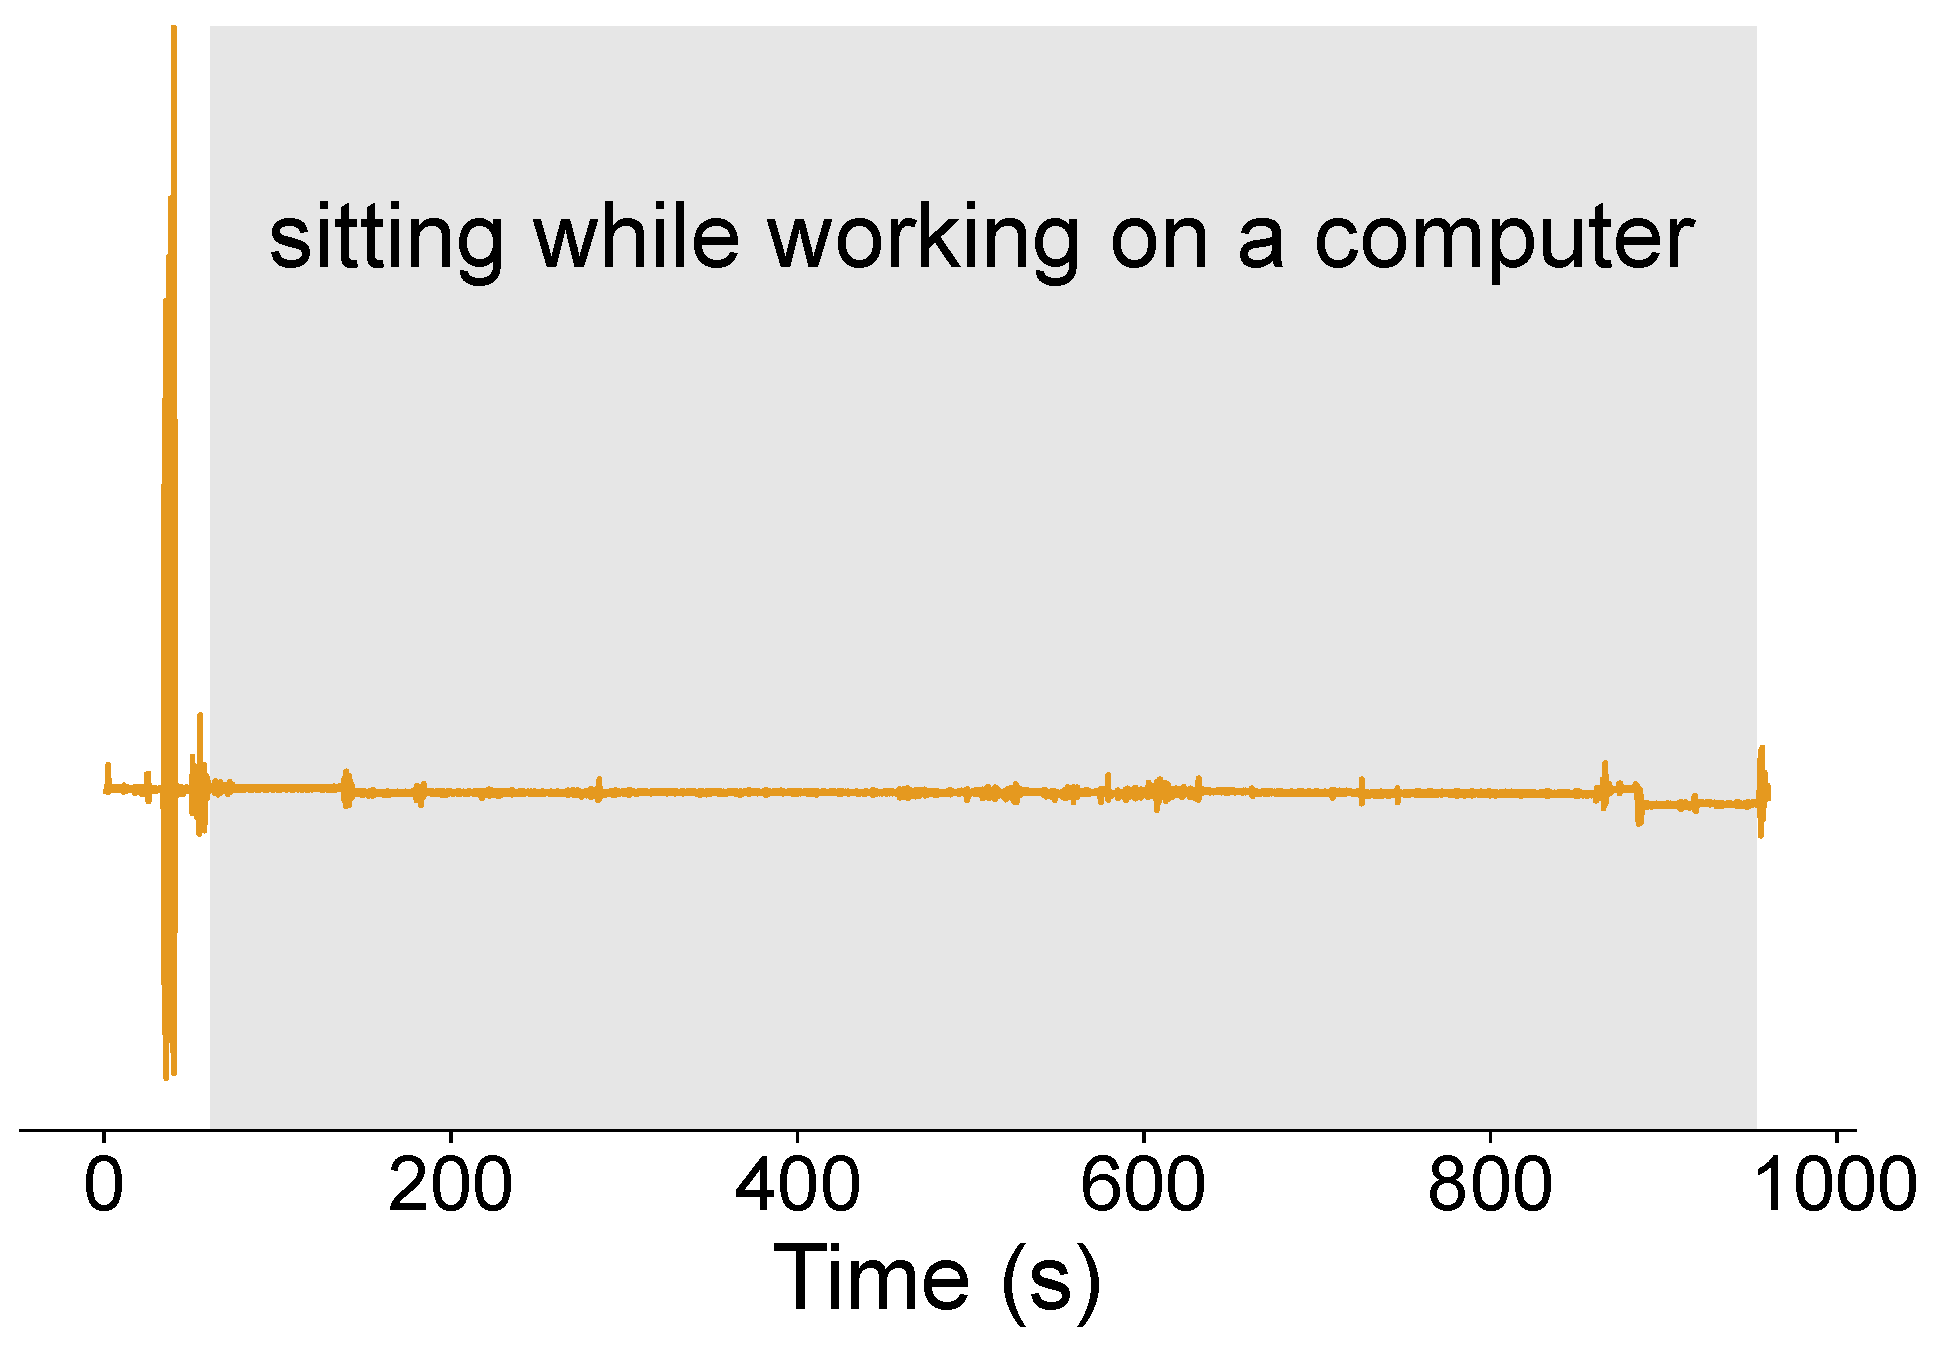
The first session involved subjects walking at their personal slow, medium, and fast paces. The recordings were performed on even and stable ground. Each walking speed was acquired for five minutes, totaling 15 min. The second session comprised walking up and down stairs alternately for four segments (two stairs up and two stairs down) of one minute and 15 s, totaling five minutes. Some subjects—namely, P002, P004, and P007—performed eight segments (four walking up stairs and four walking down stairs) of around 35 s due to the acquisition taking place on a shorter staircase. The third session included two standing tasks involving a cabinet, each lasting seven minutes and 30 s (for a total of 15 min). The first task simulated the preparation and drinking of coffee or tea, while during the second task, subjects were asked to organize items like folders, papers, and boxes, among others, within the cabinet. The fourth recording consisted of standing still and standing while conversing for seven minutes and 30 s each, totaling 15 min. The standing-still task was divided into two segments for the subjects’ comfort. Subjects were instructed to stand as if they were waiting for an elevator or a colleague or in front of a conference room. Finally, the fifth session comprised sitting while working on a computer for 15 min. Figures depicting each of the described sessions are presented in Appendix A, Figure A1, Figure A2 and Figure A3.
3.3.2. Dataset for Model Evaluation in a Real-World Office Setting
No specific instructions were given to the subjects during data acquisition for the model evaluation dataset, as the purpose was to acquire data in a real-world office environment. Participants were encouraged to carry out their typical daily work tasks while labeling the three main activities: sitting, standing, and walking.
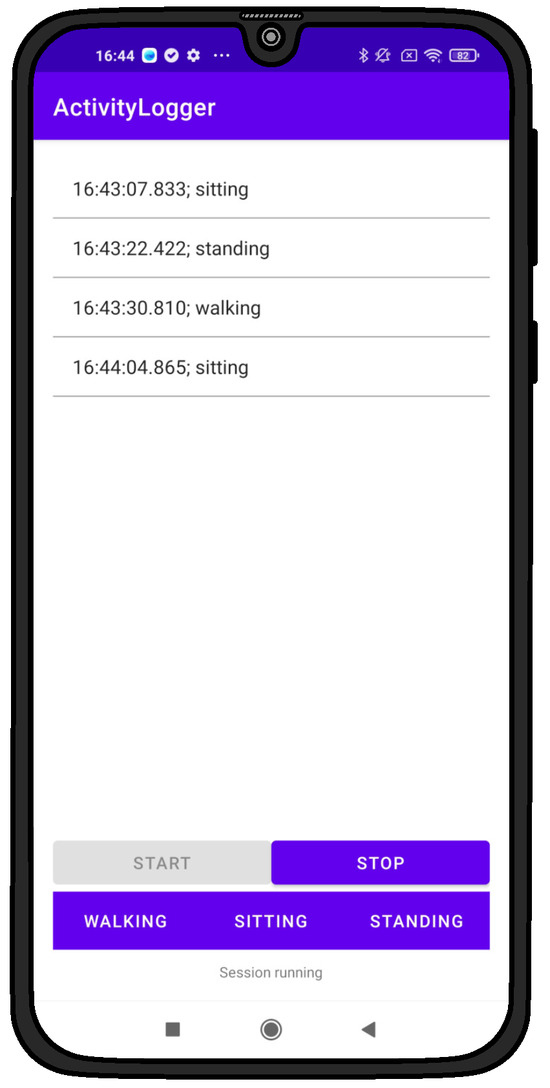
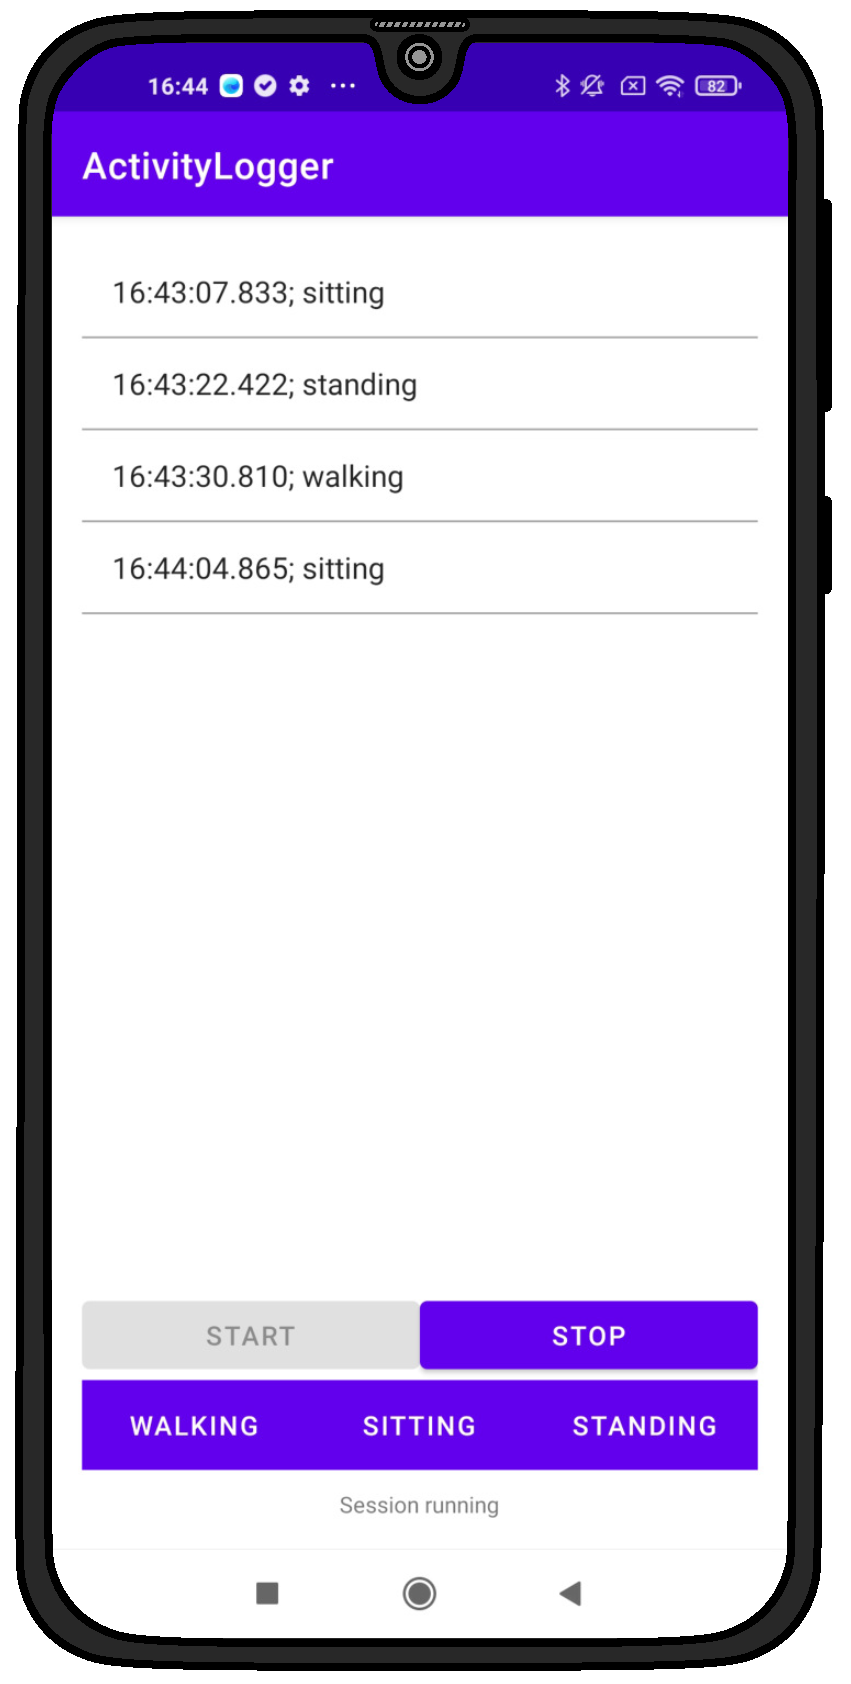
To facilitate the process of annotating/labeling the performed activities throughout the workday, an android application was implemented, as shown in Figure 4. This application allows for logging of the start of an activity. Given that the goal of the proposed models is to classify the main activity (sitting, standing, or walking), regardless of the sub-activity, the application provides three buttons to indicate which activity is currently being carried out. Once the button has been pressed, the application logs the activity, together with the timestamp, into a semicolon-separated TXT-file. The log is also presented in the app and updated in real-time. To provide a high resolution, the timestamp records the hour, minute, second, and millisecond of the button press in the format of “HH:MM:SS.ms”. Subjects were instructed to press the corresponding activity button once they initiated an activity.
Figure 4.
App for logging performed activities during acquisition of the ME dataset.
Accounting for delays introduced by participant reaction times during manual labeling, as well as potential omissions or mislabeling events, all generated label files were systematically reviewed and corrected by two independent experts. The correction process involved visual inspection of the activity labels in conjunction with the corresponding sensor signals, with particular emphasis on the y-axis of the accelerometer (ACC) data. Label timestamps were adjusted to align with the estimated onset of each activity. The independently revised label sets were subsequently jointly reviewed by both experts and merged through consensus to produce the final corrected annotation files.
3.4. Data Pre-Processing
3.4.1. Signal Alignment and Resampling
The Android operating system is not optimized for continuous data acquisition, resulting in some inconsistencies during the data collection process, including the fact that the sensors do not start and stop data collection synchronously and that data is not acquired at a fixed sampling rate. To obtain equidistantly and synchronously acquired sensor data, the signals were first cropped to the same length based on the timestamps of the latest starting and earliest stopping sensor and subsequently padded using same padding if necessary. Once the sensors had been aligned in time, the data of each sensor were re-sampled to 100 Hz using cubic-spline interpolation for the inertial sensors (ACC, GYR, and MAG) and spherical linear interpolation (SLERP) for the rotation vector data to ensure uniform representation of the input data across sensor modalities. This choice was made to preserve the native temporal resolution of the ACC, GYR, and ROT sensors while enabling consistent temporal alignment and windowing across all channels.
3.4.2. Task Segmentation for the Model Development Dataset
Since multiple sub-activities were performed in the same recording for the MD dataset, the corresponding tasks needed to be segmented to ensure that each segment only contained data from a single sub-activity. Given the introduction of different segmentation patterns for activities related to walking and standing, two segmentation algorithms based on the ACC y-axis were implemented. Before applying the segmentation pipeline, the synchronization jumps at the beginning of each recording were removed. The signal was then pre-processed using the pre-processing scheme described in Ref. [13], with some additional steps. This scheme consists of a median filter with a window size of and a 3rd-order Butterworth low-pass filter with a cutoff frequency of 20 Hz. The signal is then normalized by its maximum value, followed by the removal of the gravitational component through subtraction of the low-pass-filtered ( Hz) signal.
To extract the sub-activities associated with walking, an onset-based task segmentation approach was implemented. After pre-processing, the signal is rectified and smoothed using a root-mean-square filter () to obtain the signal’s envelope. The signal is then binarized, setting values with an amplitude above the threshold of (experimentally found) to one and those below the threshold to zero. Finally, the first-order discrete difference is calculated to detect the start and stop points of each walking sub-activity. Resulting segments that are shorter than s are discarded to remove falsely detected instances. The signals are then cropped using these indices.
A peak-based approach was used to segment the standing sub-activities. This consisted of detecting the jumps performed in between sub-activities using the findpeaks function from SciPy [32] with a peak height and a peak distance of s (two minutes). Since the jump occurs in the middle of the ten-second stop, the peak is approximately centered. Therefore, the start and end of each sub-activity are set to five seconds before and after the peak, respectively. The signals are then cropped using these indices. The peak height and minimum peak distance parameters were empirically optimized for the proposed segmentation strategy. Specifically, their values were selected through iterative testing and visual inspection of representative signals to ensure a reliable separation of activity segments while avoiding over-segmentation or missed transitions.
For some of the subjects, the above-mentioned parameters had to be adapted to obtain a valid segmentation. The used parameters and the corresponding subjects are presented in Table A1. After segmentation of each sub-activity, the resulting file was labeled accordingly. The utilized naming convention was “{activity}_{sub-activity}” (e.g., “walking_medium”) and “{activity}_{sub-activity}_{repetition}” for activities with multiple repetitions, as well as walking up/down stairs and standing still (e.g., “stairs_up_1”).
3.4.3. Signal Pre-Processing
After segmentation of the sub-activities, each signal was pre-processed. For pre-processing of the inertial sensor data (ACC, GYR, and MAG) the approach described in Ref. [13] was followed, with the additional steps for the ACC as described in Section 3.4.2. For the ROT data, first non-unit quaternions are removed from the data. These can occur due to inaccuracies in Android sensor readings. The cleaned series is then smoothed using SLERP with a smoothing factor of 0.3 (experimentally found), as described in Ref. [33] and following the implementation offered by The Mathworks Inc [34]. Using SLERP for smoothing quaternion series is equal to applying a single-pole low-pass filter, where the alpha parameter corresponds to the smoothing factor.
3.5. Feature Extraction
After pre-processing the signals, the data was windowed using a window size of s and an overlap of 50 percent. For each sensor axis, 15 features were extracted per window. Feature extraction was performed using the Time Series Feature Extraction Library (TSFEL) [35]. The TSFEL allows for the extraction of features from three domains—namely, the spectral, statistical, and temporal domains. The extracted features with their corresponding domains are presented in Table 3.
Table 3.
Extracted features, along with their mathematical definitions and physical interpretations [35].
Additionally, quaternion-based features were extracted for the rotation vector data. For each window, the geodesic distance between all quaternions was calculated, and from this, the mean distance, standard deviation, and total distance (sum of geodesic distances) were calculated. Thus, a total of 197 features (15 features per sensor axis plus the three quaternion-based features) were extracted for each window.
3.6. Model Development
The objective of this study is not to propose novel classification architectures but, rather, to establish a clear and reproducible baseline for the evaluation of the proposed dataset. For this reason, we focus on widely adopted traditional machine learning classifiers—namely KNN, SVM, and RF. These models are commonly used in the HAR literature due to their interpretability, relatively low computational cost, and well-understood behavior across different dataset sizes [13,17,21]. Therefore, in this work, KNN, SVM, and RF are employed as baseline benchmarks, enabling fair comparisons and providing a reference point for future studies that may explore more advanced modeling approaches. The objective of these models is to classify the three main activities (sitting, standing, and walking), regardless of the specific sub-activity being performed. The features for the RF model were passed without scaling, while for the KNN and SVM models, a standard scaler was utilized.
3.6.1. Data Balancing and Train–Test Split
Given that the MD dataset described in Section 3.3.1, exhibits an imbalanced distribution across the three main activity classes (sitting, standing, and walking), a class-balancing procedure was applied prior to model training. Class imbalance can bias the learning process of distance-based and ensemble-based classifiers such as KNN and RF by favoring majority classes and degrading minority-class performance. To mitigate this effect and ensure a fair comparison across activity classes, the dataset was balanced through a deterministic sub-sampling procedure applied at the level of the sub-activities. The corresponding algorithm for this process is shown in Algorithm 1.
| Algorithm 1: Balancing of Main Activity Classes |
Input: Subject-by-sub-activity instance matrix Output: Number of instances to sample per sub-activity for Sit, Stand, and Walk Compute the minimum number of instances per sub-activity across all subjects: Determine the minimum available instances among walking sub-activities: Determine the minimum available instances among standing sub-activities: Compute total feasible instances per main class: Select the limiting total number of instances: Compute instances per sub-activity: Assign return
|
After balancing, the data were divided into training and testing sets using a predefined, subject-independent split. All samples from a given subject were assigned exclusively to either the training or testing set, thereby preventing data leakage across splits. Furthermore, none of the subjects included in the ME dataset were present in the training set of the MD dataset, ensuring that the ME dataset represents a completely unseen population when deploying the trained models in the unrestricted real-world scenario. Specifically, subjects ‘P001’, ‘P002’, ‘P005’, ‘P012’, and ’P015’ were reserved for the testing set of the MD dataset. This split corresponds to a 70/30 train–test split, comprising 7756 training instances and 3324 testing instances.
3.6.2. Feature Selection
To reduce the dimensionality of the feature vector, a model-agnostic feature selection pipeline was implemented. This pipeline consists of removing (1) low-variance features with and (2) features exhibiting a pairwise Pearson’s correlation coefficient of and (3) selecting the k best features based on the ANOVA F value between each feature and the main class labels. To evaluate model performance across different feature-set sizes, different values for k were tested—namely .
3.6.3. Hyperparameter Tuning
Hyperparameter tuning was performed via grid search for each of the three ML models and for each of the k best feature sets using a GroupKFold with , ensuring that samples from the same subject were never distributed across the training and validation folds [38]. Model accuracy was utilized as the optimization criterion. The hyperparameters and corresponding values tested for the KNN, SVM, and RF models are shown in Table 4. The feature set that resulted in the highest accuracy, along with the corresponding best hyperparameters, was then used to train the models on the training set and evaluate them on the test set using accuracy, precision, recall, and F1 score as evaluation metrics.
Table 4.
Hyperparameter search space used for grid search.
3.7. Model Evaluation
The trained models were evaluated on the ME dataset to validate their performance in real-world office settings. The same pre-processing pipeline, windowing, and feature extraction pipeline as for the MD dataset were applied to the entire six-hour signal. The models were evaluated subject-wise based on accuracy, precision, recall, and F1 score. Their formal definitions are provided in Appendix C. Subsequently, the mean, standard deviation, and an approximate 95% confidence interval (CI) were calculated over all subjects for the respective metrics. The approximate CI was calculated as
where p is the mean of the respective metric over all subjects and is the number of subjects in the ME dataset.
4. Results
4.1. Model Development Dataset
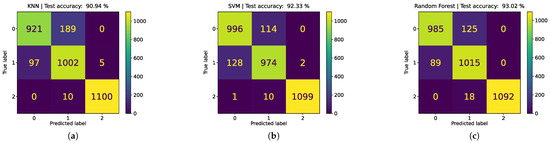
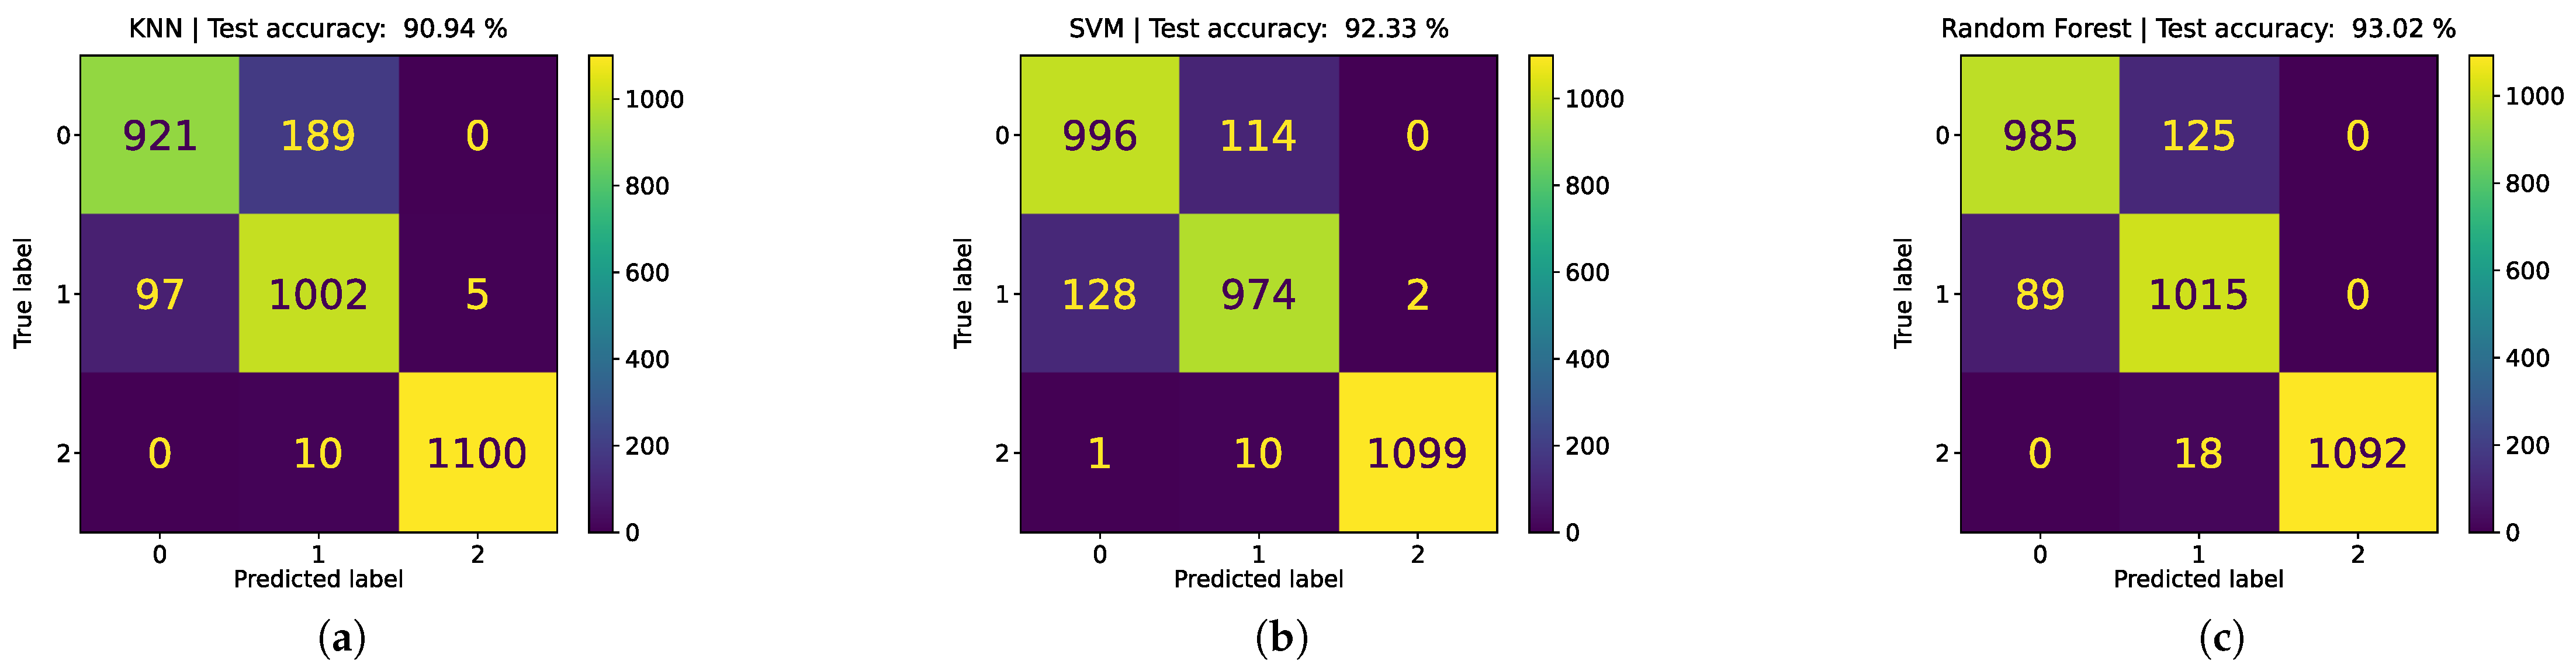
Table 5 shows the best model configurations for KNN, SVM, and RF, along with their corresponding training and testing metrics. Table A2 presents the optimized feature set for each model. Training accuracy is high among all models, with all of them reaching values above 90%. The RF model reaches a training accuracy of 100%. The RF model achieved the highest test accuracy, at 93.02% using 25 features, followed by the SVM model, with 92.33% (−0.69%) using 25 features, and the KNN model, with 90.94% (−2.08%) using 30 features. Figure 5 shows the confusion matrices for the three models. All models struggled most with distinguishing sitting from standing, with the KNN having the most confusion. Confusion with regards to the walking class is the lowest, with RF exhibiting the most misclassified instances.
Table 5.
Optimal configurations and performance metrics for KNN, SVM, and RF models.
Figure 5.
Obtained confusion matrices for the MD dataset. 0: sitting; 1: standing; 2: walking. (a) KNN; (b) SVM; (c) RF.
4.2. Model Evaluation Dataset
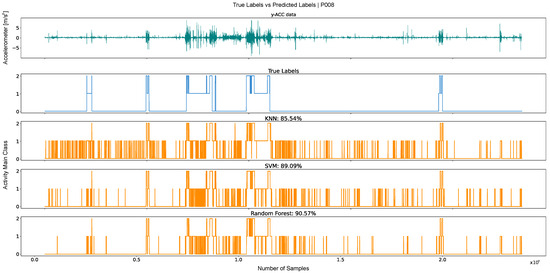
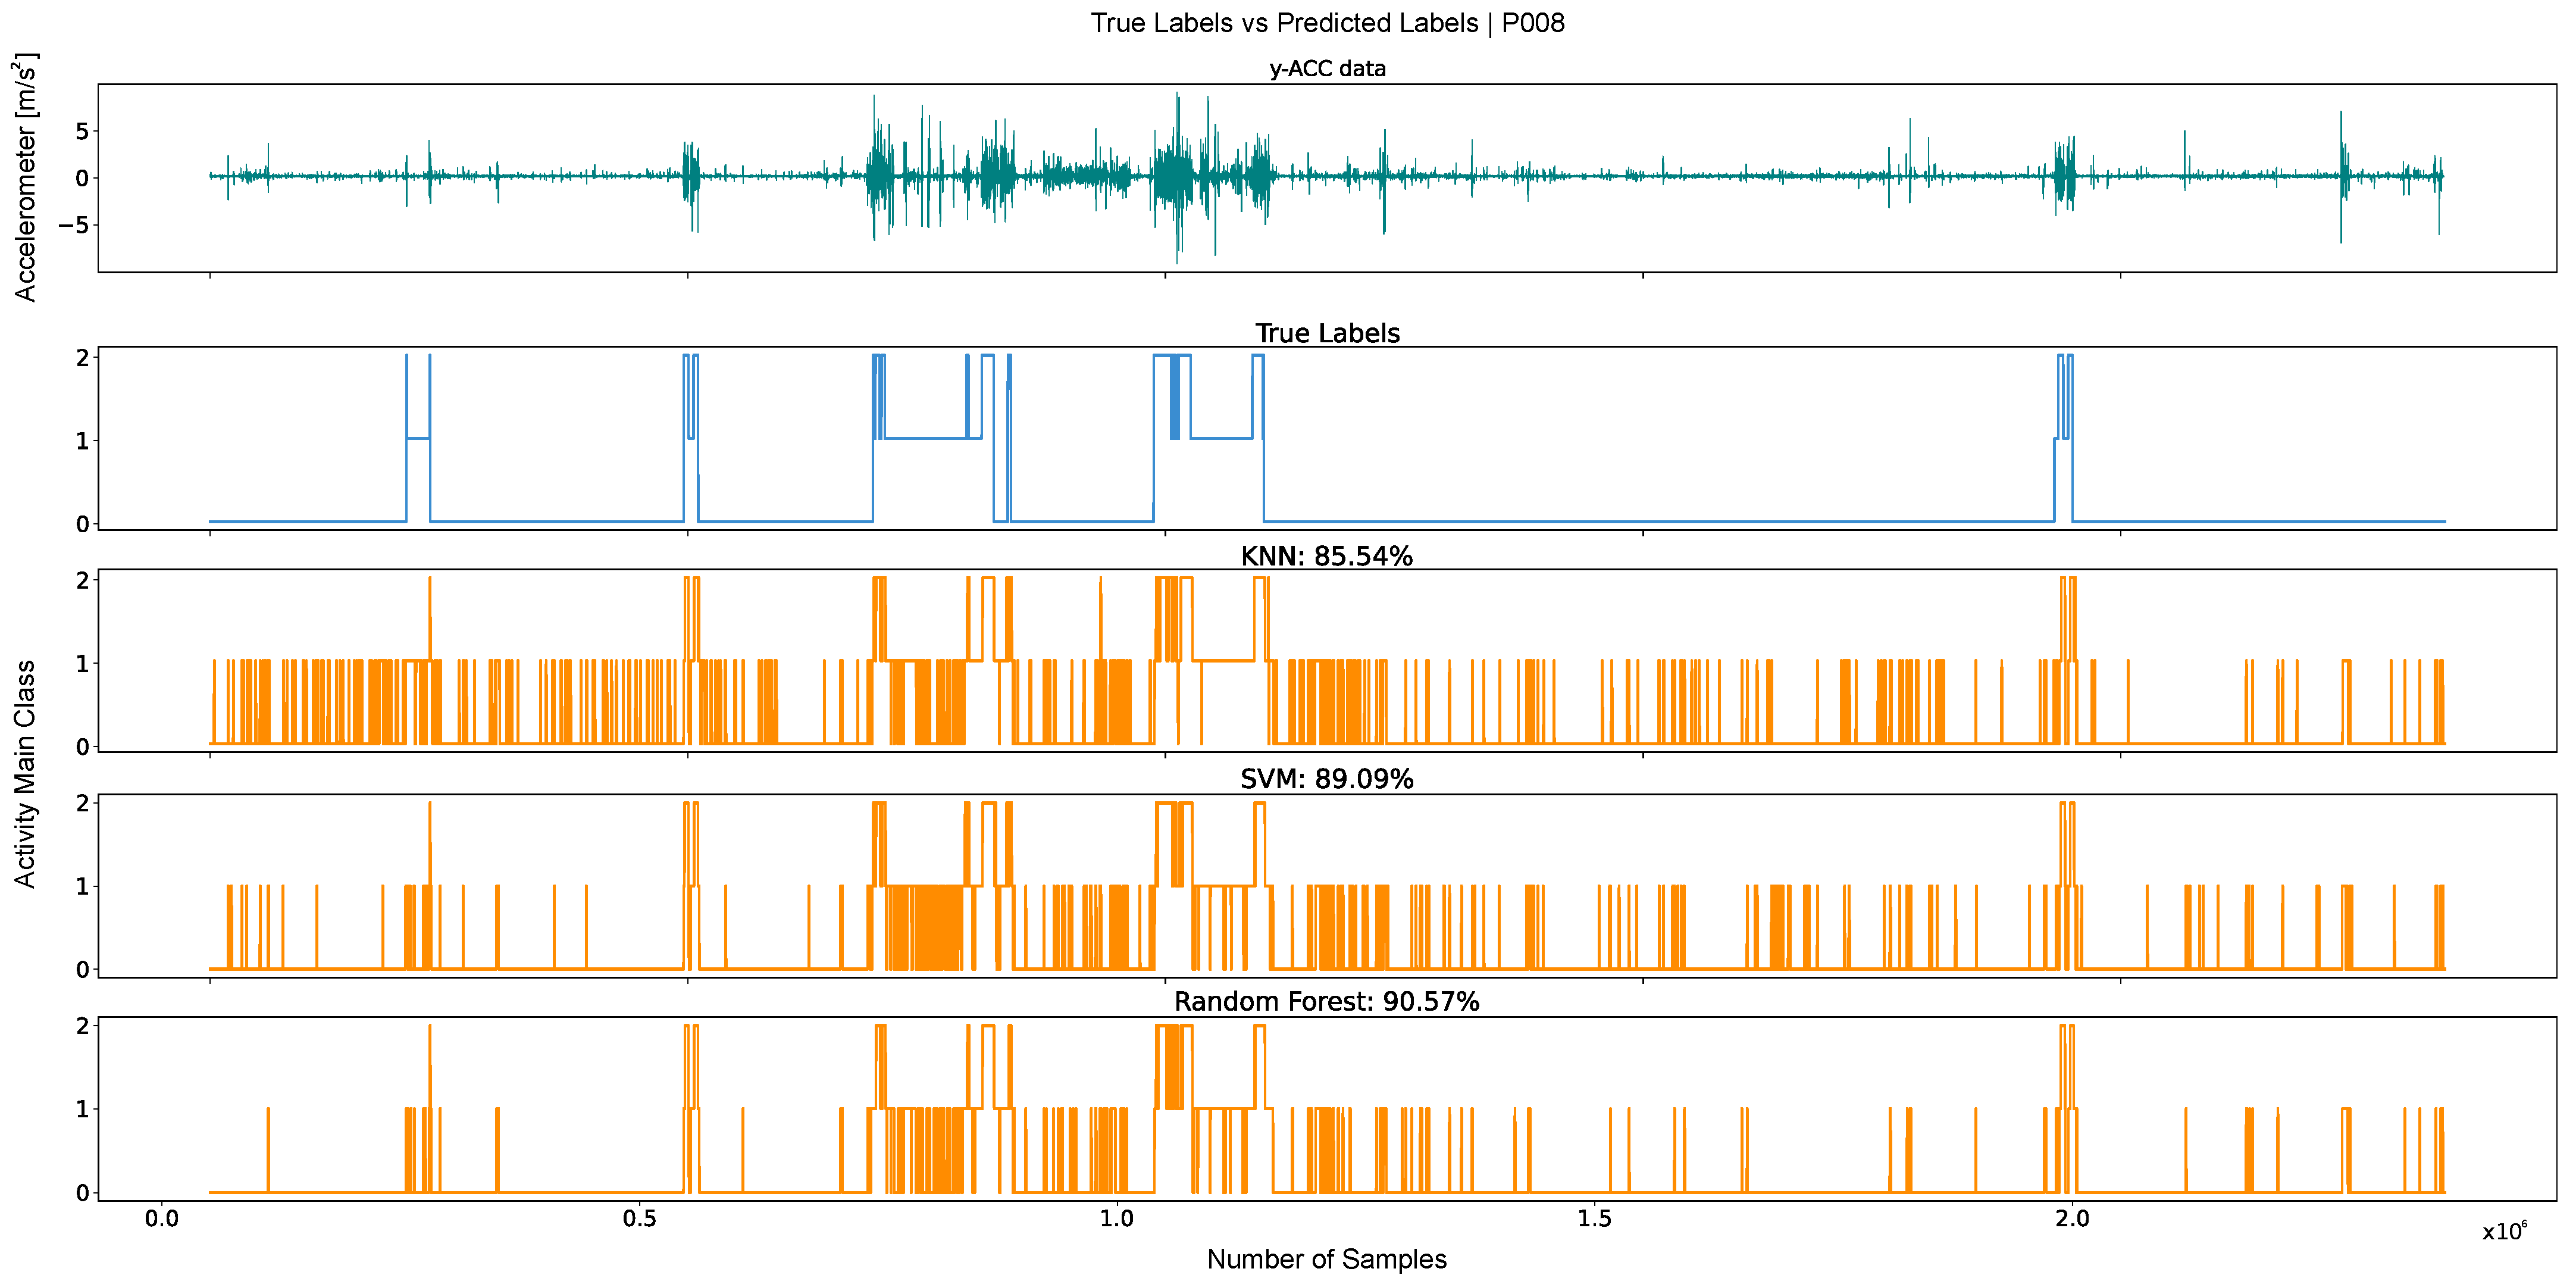
The models achieving the highest performance on the development dataset were subsequently deployed on the ME dataset to evaluate their performance in real-world settings. Subject-specific results, as well as the overall mean and standard deviation, are shown in Table 6. In this dataset, all three models decreased in accuracy, with the KNN model exhibiting the largest drop (−21.62%), followed by the RF (−14.21%) and SVM (−12.90%) models. Given this, the SVM model achieved the highest accuracy of 79.43%, followed by RF, with 77.81%, and KNN, with 69.32%. The standard deviations for the KNN, SVM, and RF models were 10.21%, 5.84%, and 7.50%, respectively. To better understand model behavior when classifying real-world six-hour recordings, plots were generated for each subject, displaying the true labels over time alongside the predictions from the three models. Figure 6 shows this plot for the subject with the highest overall accuracy (P008). As shown, the classifiers frequently introduced brief misclassifications between sitting and standing, resulting in a jittery output. This behavior can be observed among all subjects in the ME dataset.
Table 6.
Classification results per subject using KNN, SVM, and RF on the real-world dataset.
Figure 6.
Model predictions for the entire ME dataset recording of Subject P008. 0: sitting; 1: standing; 2: walking.
5. Discussion
In contrast to laboratory-recorded HAR datasets that enable fine-grained activity or movement analysis under controlled conditions, the proposed real-world dataset is intentionally designed to support low-granularity activity recognition, focusing on sitting, standing, and walking in everyday office environments. This choice reflects the challenges of unconstrained data acquisition, where reliable annotation of detailed sub-activities or limb-level movements is difficult to ensure. The use of a single smartphone as the sensing device further constrains the range of motion that can be captured. However, this configuration was deliberately adopted to prioritize ease of use, unobtrusiveness, and accessibility, given the widespread availability of smartphones in occupational settings. While this setup limits the assessment of fine-grained kinematics, including elementary upper-limb movements occurring within standing sub-activities, and temporal activity structure, it enables scalable data collection in realistic work environments and supports the study of model generalization beyond laboratory conditions.
The performance patterns observed in both datasets provide indirect evidence for the quality and reliability of the collected data and labeling process. The high performance on the MD dataset indicates that the controlled acquisition and the corresponding labels resulting from the segmentation process are sufficiently informative for discriminating among the main activity classes. Similarly, although some performance degradation can be observed on the ME dataset, the models’ ability to correctly identify the majority of activities suggests that the real-world recordings were accurately labeled and reflect the variability of office work tasks. These observations support the validity of the dataset for office-based HAR.
As shown in Table 5, all three classification models demonstrate good performance on the MD dataset. Based on the metrics for the training and testing sets, there is no indication of substantial overfitting. Moreover, the similarity across the four evaluation metrics indicates that the models do not favor any particular class, which is expected, given that this dataset was previously balanced. From the confusion matrices in Figure 5, it can be concluded that misclassifications mostly occur between the sitting and standing classes. These activities involve minimal movement, particularly sitting and standing still, and are therefore harder to distinguish from each other compared to more dynamic activities like walking. With the smartphone positioned on the chest, the accelerometer signals for sitting and standing can be very similar, leading to overlapping feature representations. Some walking instances were also misclassified as standing and vice versa, particularly in the KNN and RF models. This is likely due to standing activities that involve trunk movement, such as conversing or reaching into a tall cabinet, which, in some instances, can exhibit cyclic patterns in the sensor data that can resemble walking. When compared with previous HAR studies employing classical machine learning approaches, the performance trends observed in this work are broadly consistent with the literature. Prior studies using KNN, SVM, or RF classifiers typically report high recognition accuracy under controlled laboratory conditions, particularly for basic activities such as sitting, standing, and walking [13,14,17]. However, direct numerical comparisons across studies are inherently limited due to differences in dataset characteristics, sensor configurations, activity definitions, and evaluation protocols.
Regarding the results of the KNN, SVM, and RF models on the real-world (ME) dataset, there was an overall decrease in performance, as depicted in Table 6. These results show that, although models often achieve high performance on balanced and lab-collected datasets, such as the MD dataset, their ability to identify activities decreases considerably when applied to real-world, full-day recordings. In real-world settings where subjects are not restricted in their activities and recordings are long in duration, intra- and inter-subject variability increases, which can lead to confusion in the models. In this dataset, KNN remains the worst-performing model. SVM and RF perform similarly, with the SVM model being marginally better. However, when evaluating the results on a subject basis, RF sometimes surpasses the SVM model. Several factors may explain this shift. The SVM model may achieve better generalization than the RF model, resulting in slightly higher results in real-world conditions. Additionally, the features that were informative for the RF model on the MD dataset may not have the same relevance in the ME dataset. Analysis of the relatively high SDs indicates that the models perform better on some subjects—likely those with more static behaviors and lower variability in their movements. Finally, traditional ML metrics can be insufficient for evaluating models in HAR, as illustrated by the jittery plots in Figure 6. Although Subject P008 shows high overall accuracy, the models fail to correctly identify continuous segments of the same activity, particularly sitting and standing. This issue arises not only because these activities are commonly confused, as shown in the confusion matrices, but also because the KNN, SVM, and RF models do not take into account the temporal dimension of the signals.
For future work, models that account for the temporal structure of the signals, such as Long Short-Term Memory (LSTM) networks, should be considered for HAR, particularly when aiming to apply these models in real-world scenarios like office environments. Additionally, post-processing methods could be explored to refine and correct the models’ predictions.
6. Conclusions
This article introduces PrevOccupAI-HAR, a new publicly available dataset for smartphone-based HAR in office environments. The dataset consists of a dataset for model development collected under controlled conditions, comprising the data of 20 subjects performing nine sub-activities that can be associated with three main activities: sitting, standing, and walking. Additionally, a dataset for model evaluation was collected in a real-world office setting in which 13 subjects were recorded for six hours while performing their daily office work. Three ML models—namely RF, SVM, and KNN—were trained on the model development dataset with the objective of classifying the three main activities, regardless of the sub-activity. The models were subsequently deployed and evaluated on the real-world dataset. Test accuracies on the model development dataset reached 90.94%, 92.33%, and 93.02% for the KNN, SVM, and RF models, respectively. When deploying the models on the real-world dataset, obtained mean accuracies were 69.32% (−21.62%) for KNN, 79.43% (−12.90%) for SVM, and 78.81% (−14.21%) for RF. Inspection of the sequential output of the models on the real-world dataset revealed that all models frequently introduce brief misclassifications, mostly between sitting and standing classes, resulting in a jittery output. The main focus of future work should be to improve model performance, making the models more accurate and consistent in their predictions over time. This could be tackled by either employing models that account for the temporal structure of the data, such as LSTM models, or developing post-processing algorithms to improve model output.
Author Contributions
Conceptualization, P.P. and S.S.; methodology, P.P., S.S. and P.K.; software, P.P. and S.S.; validation, P.P., S.S. and P.K.; formal analysis, P.P., S.S., G.B. and P.K.; investigation, P.P., S.S., G.B. and P.K.; resources, P.P. and P.K.; data curation, P.P., S.S., G.B. and P.K.; writing—original draft preparation, P.P. and S.S.; writing—review and editing, P.P., S.S., G.B., P.K., R.V. and H.G.; visualization, P.P., S.S. and G.B.; supervision, P.P., R.V. and H.G.; project administration, P.P., R.V. and H.G.; funding acquisition, P.P., R.V. and H.G. All authors have read and agreed to the published version of the manuscript.
Funding
The research was partly supported by the Science and Technology Foundation (FCT) under the PrevOccupAI+ project (2024.07630.IACDC). P. Probst was supported by doctoral grant RT/BD/152843/2021 financed by the Portuguese Foundation for Science and Technology (FCT) and with funds from the State Budget under the MIT Portugal Program.
Institutional Review Board Statement
All participants were asked to sign an informed consent after receiving a thorough explanation of the purpose of the study and the acquisition protocol. Ethic Committee Name: CENOVAFCT; Approval Code: CE_FCT_005-2022-A25; Approval Date: 16.04.2025.
Informed Consent Statement
All participants were asked to sign an informed consent after receiving a thorough explanation of the purpose of the study and the acquisition protocol.
Data Availability Statement
The dataset can be downloaded by requesting access via prevoccupai-har@dfki.de, and the utilized Python 3.12 code base is publicly available at https://github.com/p-probst/PrevOccupAI_HAR_JA (accessed on 10 February 2026).
Acknowledgments
This study was conducted within the scope of the PrevOccupAI+ project (Prevention of Occupational Disorders in Public Administration based on Artificial Intelligence PLUS), a follow-up to the PrevOccupAI project, which aims to characterize daily working activities, working conditions, and potential risk factors associated with the occupational environment on an individual organizational levels within the Public Administration. The project was carried out in cooperation with the Camâra Municipal de Lisboa (Municipality of Lisbon).
Conflicts of Interest
Author Philipp Koch was employed by the company German Research Center for Artificial Intelligence (DFKI). The remaining authors declare that the research was conducted in the absence of any commercial or financial relationships that could be construed as a potential conflict of interest.
Abbreviations
The following abbreviations are frequently used in this manuscript:
| WRMDs | Work-related musculoskeletal disorders |
| ML | Machine learning |
| HAR | Human activity recognition |
| ADL | Activity of daily living |
| MD | Model development |
| ME | Model evaluation |
| KNN | k-Nearest Neighbor |
| SVM | Support Vector Machine |
| RF | Random Forest |
| ACC | Accelerometer |
| GYR | Gyroscope |
| MAG | Magnetometer |
| ROT | Rotation Vector |
| SLERP | Spherical linear interpolation |
Appendix A
Figure A1.
Recording sessions for activities related to walking. (a) Session 1: walking at three different paces. (b) Session 2: walking up and down stairs.
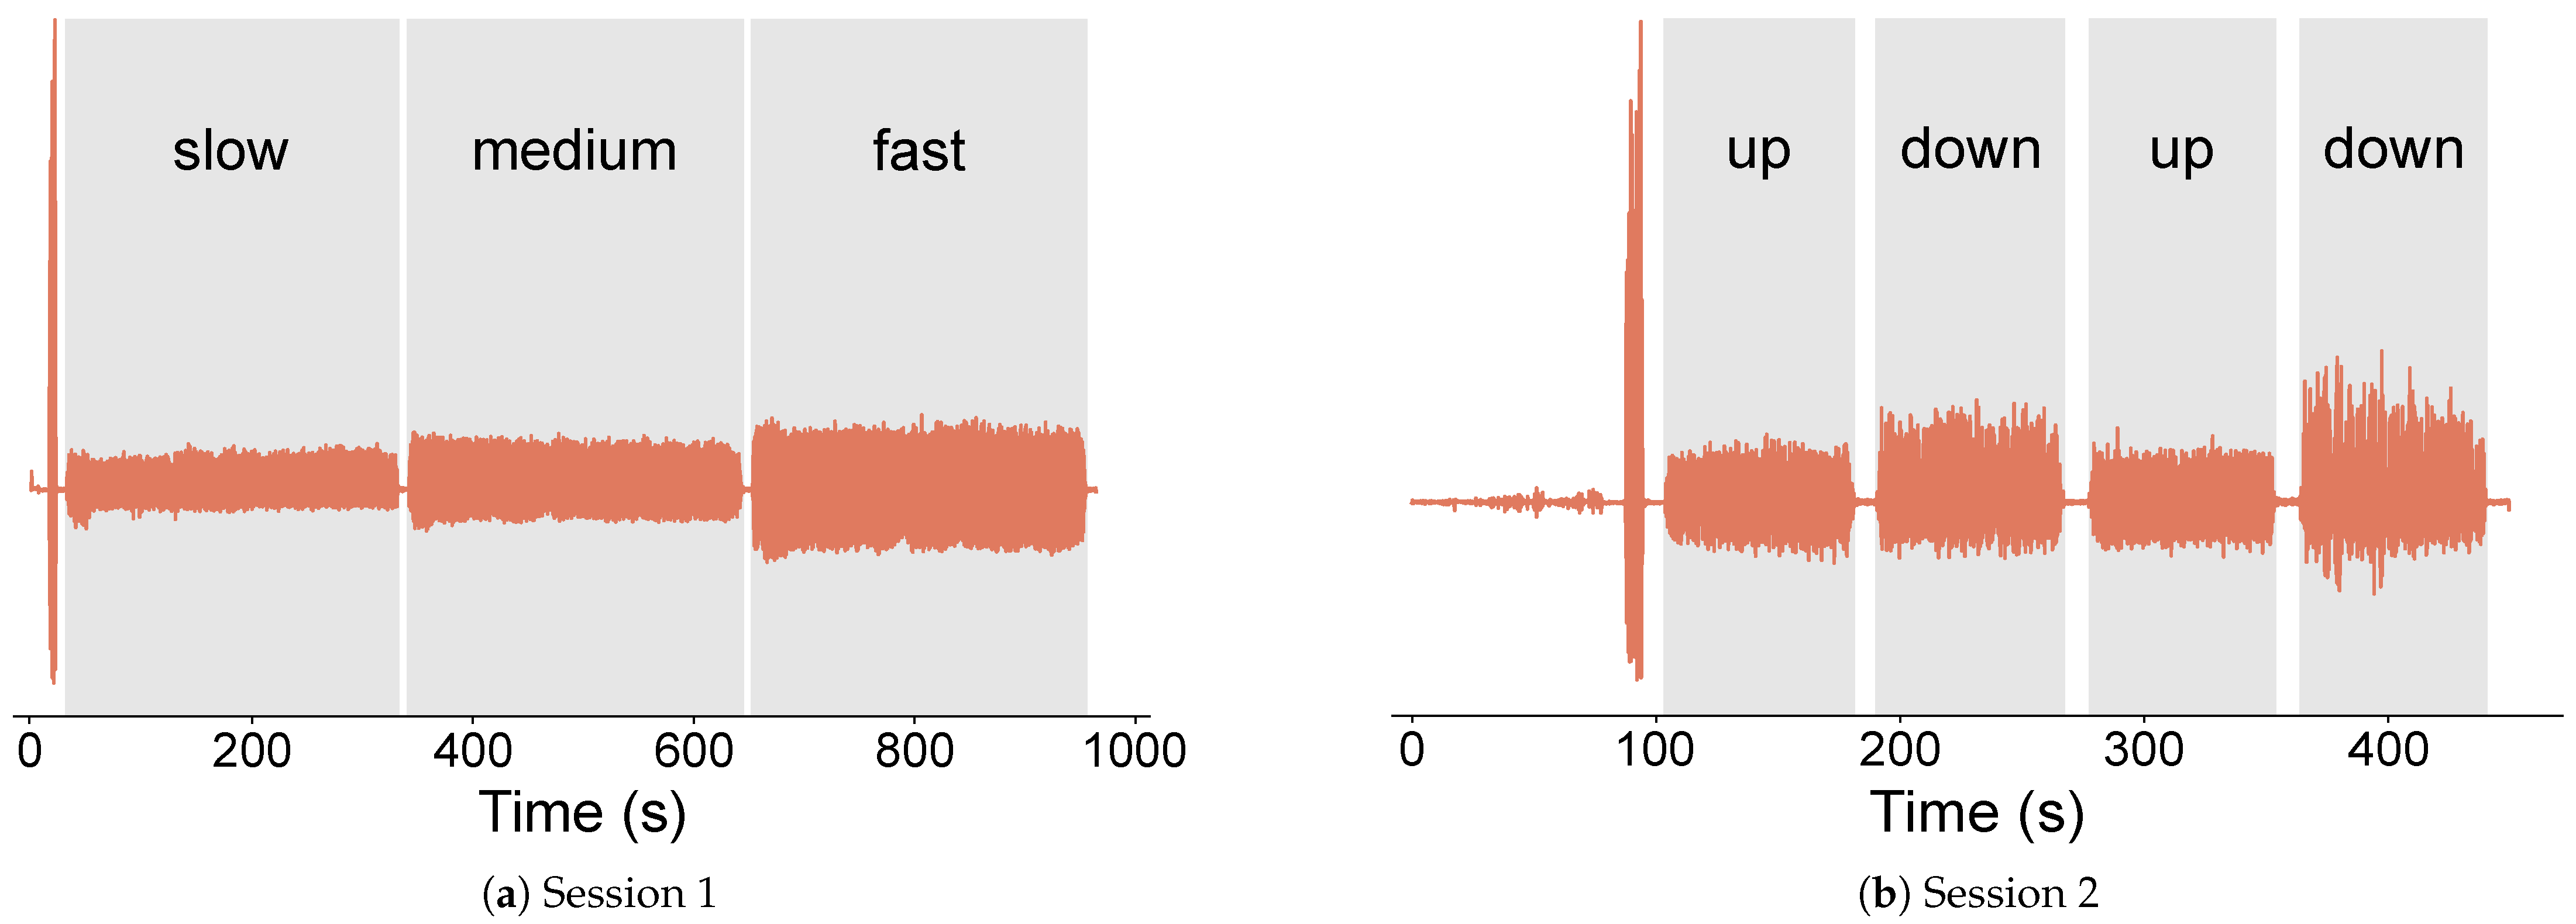
Figure A2.
Recording sessions for activities related to standing. (a) Session 3: preparing coffee and moving objects in a cabinet. (b) Session 4: standing still and standing while conversing.
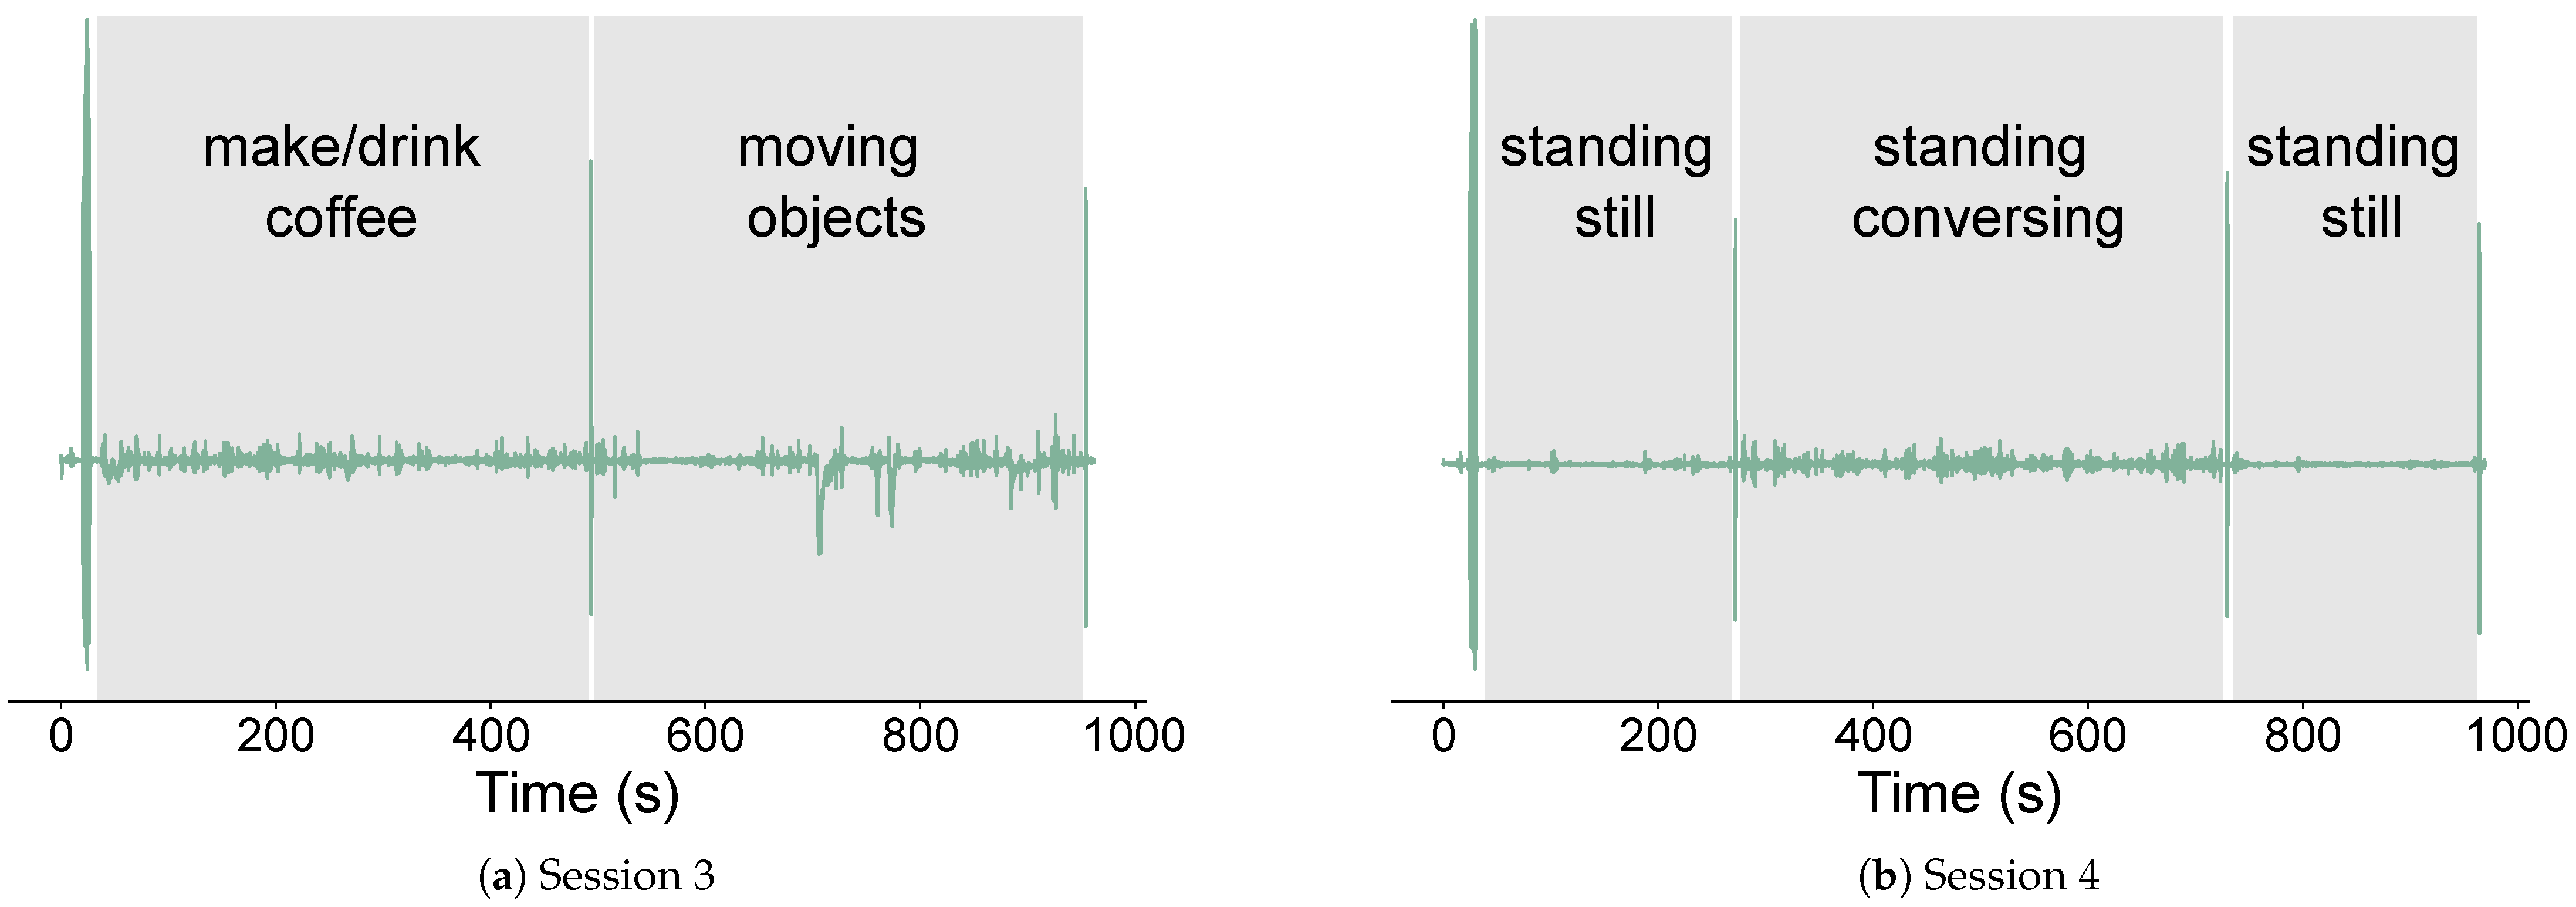
Figure A3.
Session 5: sitting while working on a computer.
Appendix B. Task Segmentation Parameters
Table A1.
Chosen parameters for activity segmentation within the MD dataset.
Appendix C. Evaluation Metrics
The performance of the classification models was assessed using accuracy, precision, recall, and F1 score, which are defined as follows. Let , , , and denote the number of true positives, true negatives, false positives, and false negatives, respectively.
Appendix D. Model Features for the Optimized Models
Table A2.
Optimized feature sets obtained from the MD dataset for each model.
References
- Eurostat. Sit at Work? You Are One of 39%. 2019. Available online: https://ec.europa.eu/eurostat/web/products-eurostat-news/-/ddn-20190305-1 (accessed on 12 December 2025).
- Peereboom, K.; de Langen, N.; Bortkiewicz, A.; Copsey, S. Prolonged Static Sitting at Work: Health Effects and Good Practice Advice. Executive Summary; Technical Report; European Agency for Safety and Health at Work (EU-OSHA): Luxembourg, 2021; Available online: https://osha.europa.eu/sites/default/files/Sitting_at_work_%20summary_EN.pdf (accessed on 12 December 2025).
- Owen, N.; Healy, G.N.; Dempsey, P.C.; Salmon, J.; Timperio, A.; Clark, B.K.; Goode, A.D.; Koorts, H.; Ridgers, N.D.; Hadgraft, N.T.; et al. Sedentary behavior and public health: Integrating the evidence and identifying potential solutions. Annu. Rev. Public Health 2020, 41, 265–287. [Google Scholar] [CrossRef] [Scilit] [PubMed]
- Bakker, A.B.; De Vries, J.D. Job Demands–Resources theory and self-regulation: New explanations and remedies for job burnout. Anxiety Stress Coping 2021, 34, 1–21. [Google Scholar] [CrossRef] [Scilit]
- European Agency for Safety and Health at Work (EU-OSHA). Estimating the Cost of Work-Related Accidents and Ill-Health; Technical Report; European Agency for Safety and Health at Work (EU-OSHA): Luxembourg; Publications Office of the European Union: Luxembourg, 2019; Available online: https://op.europa.eu/en/publication-detail/-/publication/2d75613d-1878-11e9-8d04-01aa75ed71a1/language-en (accessed on 12 December 2025).
- Punnett, L.; Wegman, D.H. Work-related musculoskeletal disorders: The epidemiologic evidence and the debate. J. Electromyogr. Kinesiol. 2004, 14, 13–23. [Google Scholar] [CrossRef] [Scilit]
- European Agency for Safety and Health at Work (EU-OSHA). Work-Related Musculoskeletal Disorders; Technical Report; European Agency for Safety and Health at Work (EU-OSHA): Luxembourg; Publications Office of the European Union: Luxembourg, 2020; Available online: https://op.europa.eu/en/publication-detail/-/publication/5819be4f-0393-11eb-a511-01aa75ed71a1/language-en (accessed on 12 December 2025).
- Langella, F.; Christensen, S.W.M.; Palsson, T.S.; Høgh, M.; Gagni, N.; Bellosta-López, P.; Christiansen, D.H.; Delle Chiaie, M.; Domenéch-García, V.; Johnston, V.; et al. Development of the Prevent for Work questionnaire (P4Wq) for assessment of musculoskeletal risk in the workplace: Part 1—Literature review and domains selection. BMJ Open 2021, 11, e043800. [Google Scholar] [CrossRef] [Scilit]
- De-La-Hoz-Franco, E.; Ariza-Colpas, P.; Quero, J.M.; Espinilla, M. Sensor-based datasets for human activity recognition—A systematic review of literature. IEEE Access 2018, 6, 59192–59210. [Google Scholar] [CrossRef] [Scilit]
- Altun, K.; Barshan, B.; Tunçel, O. Comparative study on classifying human activities with miniature inertial and magnetic sensors. Pattern Recognit. 2010, 43, 3605–3620. [Google Scholar] [CrossRef] [Scilit]
- Gomaa, W.; Khamis, M.A. A perspective on human activity recognition from inertial motion data. Neural Comput. Appl. 2023, 35, 20463–20568. [Google Scholar] [CrossRef] [Scilit]
- Saleem, G.; Bajwa, U.I.; Raza, R.H. Toward human activity recognition: A survey. Neural Comput. Appl. 2023, 35, 4145–4182. [Google Scholar] [CrossRef] [Scilit]
- Anguita, D.; Ghio, A.; Oneto, L.; Parra, X.; Reyes-Ortiz, J.L. A Public Domain Dataset for Human Activity Recognition Using Smartphones. In Proceedings of the ESANN 2013 European Symposium on Artificial Neural Networks, Computational Intelligence and Machine Learning, Bruges, Belgium, 24–26 April 2013. [Google Scholar]
- Kwapisz, J.R.; Weiss, G.M.; Moore, S.A. Activity recognition using cell phone accelerometers. SIGKDD Explor. Newsl. 2011, 12, 74–82. [Google Scholar] [CrossRef] [Scilit]
- Banos, O.; Garcia, R.; Holgado-Terriza, J.A.; Damas, M.; Pomares, H.; Rojas, I.; Saez, A.; Villalonga, C. mHealthDroid: A Novel Framework for Agile Development of Mobile Health Applications. In Ambient Assisted Living and Daily Activities; Springer International Publishing: Berlin/Heidelberg, Germany, 2014; pp. 91–98. [Google Scholar] [CrossRef] [Scilit]
- Reiss, A.; Stricker, D. Introducing a New Benchmarked Dataset for Activity Monitoring. In Proceedings of the 2012 16th International Symposium on Wearable Computers; IEEE: New York, NY, USA, 2012; pp. 108–109. [Google Scholar] [CrossRef] [Scilit]
- Logacjov, A.; Bach, K.; Kongsvold, A.; Bårdstu, H.B.; Mork, P.J. HARTH: A Human Activity Recognition Dataset for Machine Learning. Sensors 2021, 21, 7853. [Google Scholar] [CrossRef] [Scilit]
- Wang, A.; Zhao, S.; Zheng, C.; Chen, H.; Liu, L.; Chen, G. HierHAR: Sensor-Based Data-Driven Hierarchical Human Activity Recognition. IEEE Sens. J. 2021, 21, 3353–3365. [Google Scholar] [CrossRef] [Scilit]
- Dentamaro, V.; Gattulli, V.; Impedovo, D.; Manca, F. Human activity recognition with smartphone-integrated sensors: A survey. Expert Syst. Appl. 2024, 246, 123143. [Google Scholar] [CrossRef] [Scilit]
- Ige, A.O.; Mohd Noor, M.H. A survey on unsupervised learning for wearable sensor-based activity recognition. Appl. Soft Comput. 2022, 127, 109363. [Google Scholar] [CrossRef] [Scilit]
- Nguyen, D.A.; Le-Khac, N.A. Sok: Behind the accuracy of complex human activity recognition using deep learning. In Proceedings of the 2024 International Joint Conference on Neural Networks (IJCNN); IEEE: New York, NY, USA, 2024; pp. 1–8. [Google Scholar] [CrossRef] [Scilit]
- Lara, O.D.; Labrador, M.A. A Survey on Human Activity Recognition using Wearable Sensors. IEEE Commun. Surv. Tutor. 2013, 15, 1192–1209. [Google Scholar] [CrossRef] [Scilit]
- Omolaja, A.; Otebolaku, A.; Alfoudi, A. Context-Aware Complex Human Activity Recognition Using Hybrid Deep Learning Models. Appl. Sci. 2022, 12, 9305. [Google Scholar] [CrossRef] [Scilit]
- Kaur, H.; Rani, V.; Kumar, M. Human activity recognition: A comprehensive review. Expert Syst. 2024, 41, 13680. [Google Scholar] [CrossRef] [Scilit]
- Banos, O.; Villalonga, C.; Garcia, R.; Saez, A.; Damas, M.; Holgado-Terriza, J.; Lee, S.; Pomares, H.; Rojas, I. Design, implementation and validation of a novel open framework for agile development of mobile health applications. BioMedical Eng. OnLine 2015, 14, 1–20. [Google Scholar] [CrossRef] [Scilit] [PubMed]
- Stiefmeier, T.; Roggen, D.; Ogris, G.; Lukowicz, P.; Tröster, G. Wearable Activity Tracking in Car Manufacturing. IEEE Pervasive Comput. 2008, 7, 42–50. [Google Scholar] [CrossRef] [Scilit]
- Baños, O.; Damas, M.; Pomares, H.; Rojas, I.; Tóth, M.A.; Amft, O. A benchmark dataset to evaluate sensor displacement in activity recognition. In Proceedings of the 2012 ACM Conference on Ubiquitous Computing; Association for Computing Machinery: New York, NY, USA, 2012; pp. 1026–1035. [Google Scholar] [CrossRef] [Scilit]
- Kim, H.; Kim, G.; Lee, T.; Kim, K.; Lee, D. A dataset of ambient sensors in a meeting room for activity recognition. Sci. Data 2024, 11, 516. [Google Scholar] [CrossRef] [Scilit]
- Stanton, N.A. Hierarchical task analysis: Developments, applications, and extensions. Appl. Ergon. 2006, 37, 55–79. [Google Scholar] [CrossRef] [Scilit]
- Oliosi, E.; Probst, P.; Rodrigues, J.; Silva, L.; Zagalo, D.; Cepeda, C.; Gamboa, H. Week-long Multimodal Data Acquisition of Occupational Risk Factors in Public Administration Workers. In Proceedings of the 2023 19th International Conference on Intelligent Environments; IEEE: New York, NY, USA, 2023. [Google Scholar] [CrossRef] [Scilit]
- Silva, S.; Cepeda, C.; Rodrigues, J.; Probst, P.; Gamboa, H. Assessing Occupational Health with a Cross-platform Application based on Self-reports and Biosignals. In Proceedings of the 15th International Joint Conference on Biomedical Engineering Systems and Technologies (BIOSTEC 2022)—Volume 5: HEALTHINF; SCITEPRESS—Science and Technology Publications, Lda: Setúbal, Portugal, 2022; pp. 549–556. [Google Scholar] [CrossRef] [Scilit]
- Virtanen, P.; Gommers, R.; Oliphant, T.E.; Haberland, M.; Reddy, T.; Cournapeau, D.; Burovski, E.; Peterson, P.; Weckesser, W.; Bright, J.; et al. SciPy 1.0: Fundamental Algorithms for Scientific Computing in Python. Nat. Methods 2020, 17, 261–272. [Google Scholar] [CrossRef] [Scilit]
- Shoemake, K. Animating rotation with quaternion curves. In Proceedings of the 12th Annual Conference on Computer Graphics and Interactive Techniques; Association for Computing Machinery: New York, NY, USA, 1985; pp. 245–254. [Google Scholar]
- The MathWorks, Inc. Lowpass Filter Orientation Using Quaternion SLERP; The MathWorks, Inc.: Natick, MA, USA, 2025. [Google Scholar]
- Barandas, M.; Folgado, D.; Fernandes, L.; Santos, S.; Abreu, M.; Bota, P.; Liu, H.; Schultz, T.; Gamboa, H. TSFEL: Time Series Feature Extraction Library. SoftwareX 2020, 11, 100456. [Google Scholar] [CrossRef] [Scilit]
- Fernandes, L.; Barandas, M.; Gamboa, H. Learning Human Behaviour Patterns by Trajectory and Activity Features. In Proceedings of the 13th International Joint Conference on Biomedical Engineering Systems and Technologies (BIOSTEC 2020)—Volume 5: HEALTHINF; SCITEPRESS—Science and Technology Publications, Lda: Setúbal, Portugal, 2020; pp. 220–227. [Google Scholar] [CrossRef] [Scilit]
- Henriksson, U. Power Spectrum and Bandwidth; Tech. Rep.; Linköping University: Linköping, Sweden, 2003. [Google Scholar]
- Bragança, H.; Colonna, J.G.; Oliveira, H.A.; Souto, E. How validation methodology influences human activity recognition mobile systems. Sensors 2022, 22, 2360. [Google Scholar] [CrossRef] [Scilit] [PubMed]

Disclaimer/Publisher’s Note: The statements, opinions and data contained in all publications are solely those of the individual author(s) and contributor(s) and not of MDPI and/or the editor(s). MDPI and/or the editor(s) disclaim responsibility for any injury to people or property resulting from any ideas, methods, instructions or products referred to in the content. |
© 2026 by the authors. Licensee MDPI, Basel, Switzerland. This article is an open access article distributed under the terms and conditions of the Creative Commons Attribution (CC BY) license.