


Abstract
To address the characteristics of persistent attack propagation, heterogeneous associations, and temporal evolution of attack behaviors in dynamic networks, this paper proposes AC-ODE, a dynamic network attack prediction model based on attack-context graph neural ordinary differential equations, which jointly predicts host node risk and attack propagation along links. Specifically, a relation-aware historical state encoding module is first designed to extract multidimensional and comprehensive cybersecurity context from multi-frame temporal graph snapshots. An attack-context-conditioned continuous propagation module is then constructed to model the continuous evolution of latent states on discretely observed graphs, while using attack context to modulate propagation intensity. Finally, a historical–future state gated fusion mechanism is introduced to enable joint node–edge prediction. Compared with existing methods based on discrete snapshot modeling, AC-ODE more accurately characterizes risk variation trends as network attacks transition from activation to attenuation. Experimental results on three public datasets—LANL, the DARPA Operationally Transparent Cyber (OpTC) dataset, and CICIDS2017—show that AC-ODE outperforms multiple baseline methods in terms of both AP and Hits@10, achieving an edge-level AP of 0.974 on OpTC, which corresponds to a 73.8% relative improvement over the second-best method. Ablation studies and temporal evolution analyses further demonstrate that the core modules play an important role in improving prediction accuracy and capturing the temporal evolution patterns of network attacks.
1. Introduction
With the rapid development of enterprise networks, the Internet of Things (IoT), and cloud–edge collaborative infrastructures, cyberattacks have evolved from isolated anomalous events into multi-stage propagation processes spanning hosts, services, and links. Following the initial compromise, attackers typically conduct lateral movement within internal networks and carry out multiple rounds of sustained penetration, gradually expanding their control scope. Consequently, approaches that rely solely on real-time anomaly detection are unable to capture the temporal dependencies across attack stages, making it difficult to identify subsequent propagation risks [1,2]. Among such threats, advanced persistent threats (APTs) are particularly representative. APT attacks are typically characterized by targeted objectives, long-term stealthy persistence, low-frequency concealment, and strategic adaptivity. Attackers dynamically adjust their lateral movement paths according to target network assets and vulnerabilities, rendering attack evolution highly time-varying and uncertain [3,4]. Existing studies have shown that the key to APT prediction lies in predicting subsequent behaviors based on the current attack stage. However, owing to the strategic adaptivity with which attackers dynamically adjust penetration paths, conventional prediction models struggle to identify previously unseen APTs, and accurate prediction of cyberattacks remains a major challenge [5]. Traditional passive detection methods largely rely on post hoc alerts and attack tracing, making it difficult to capture potential risks at an early stage. Meanwhile, static attack graphs and discrete-state modeling methods are inadequate for characterizing the continuously time-varying evolution patterns and link-level propagation processes of cyberattacks. Therefore, conducting attack situation awareness and threat evolution prediction in dynamic network environments, so as to predict attack progression and subsequent risks in advance and establish proactive defense mechanisms, is of considerable theoretical and practical significance.
Graph neural networks (GNNs) provide a more suitable structural modeling paradigm for this problem. Existing studies have shown that graph representation learning methods can explicitly model topological relationships among network entities and exhibit stronger expressive power for complex structural patterns in tasks such as intrusion detection and anomalous traffic identification [6]. For example, Anomal-E improves network intrusion anomaly detection through a self-supervised graph representation learning framework [7], while TS-IDS introduces a traffic-aware self-supervised learning mechanism to enhance model adaptability in IoT scenarios [8]. Nevertheless, most existing graph-based methods are still built on static network graphs or short-term discrete snapshots and focus primarily on anomaly identification at the current time step, while failing to characterize how network risks progressively propagate from historical states to future time points.
Compared with discrete temporal iterative schemes, neural ordinary differential equations model the continuous evolution of latent states, enabling better handling of irregularly observed data and a smoother characterization of state transitions. Neural ODE [9] established a general paradigm for the continuous evolution of latent states. Xhonneux et al. [10] proposed continuous graph neural networks, extending the continuous dynamic modeling capability of neural ordinary differential equations to graph representation learning and enabling continuous temporal evolution modeling of graph nodes. Huang et al. [11] further proposed a continuous spatiotemporal graph neural differential equation model for dynamic graph link prediction. These studies have laid the foundation for continuous dynamic graph modeling; however, they remain insufficient in exploiting attack context and risk propagation semantics in cybersecurity scenarios.
From the perspective of cyber offense–defense mechanisms, network threats manifest along two dimensions: anomalous node states and anomalous propagation relationships. Accordingly, dynamic network threat detection requires the simultaneous modeling of node-level risk prediction and edge-level attack propagation prediction.
The main contributions of this paper are summarized as follows:
- We develop a joint prediction model for dynamic network attack prediction that simultaneously performs node-level risk evolution prediction and edge-level attack propagation prediction, covering both inter-host attack propagation links and intra-host behavior relations. The proposed model effectively addresses the limitation of conventional methods in coupling network topology with the evolution of attack propagation paths, and provides a standardized modeling framework for joint APT analysis in dynamic network environments.
- We design a relation-aware historical state encoding module that extracts historically informed feature representations with security semantics from multi-frame temporal graph snapshots, thereby effectively compensating for the insufficient characterization of temporal risk evolution patterns in existing static-graph and short-term discrete-snapshot methods.
- We construct an attack-context-conditioned continuous propagation module to model continuous threat evolution patterns under historical states, thereby addressing the limitation of existing continuous-time graph models in insufficiently exploiting attack context and risk propagation semantics.
2. Related Work
2.1. Dynamic Graph-Based Network Attack Prediction
Contemporary cyberattacks have evolved from isolated intrusions into multi-stage lateral penetration behaviors, and security prediction has accordingly shifted from static anomaly detection toward dynamic temporal prediction [12]. Early temporal prediction models did not incorporate network topology into the modeling of attack propagation patterns and were therefore inadequate for characterizing cross-node risk diffusion processes. Graph neural networks (GNNs) enable efficient modeling of network topological structures, and their representational advantages in capturing entity interaction patterns have been validated in intrusion detection tasks [6]. Static graph encoders such as GraphSAGE [13], GCN [14], and GAT [15], when combined with recurrent units such as GRU [16], iteratively update node representations through temporal modules and constitute one of the mainstream baselines for modeling discrete dynamic graphs in network intrusion detection [6]. EvolveGCN [17] iteratively updates the graph convolutional weight parameters of each layer through recurrent units such as GRU and LSTM, thereby modeling graph structural evolution through parameter dynamics. Jiang et al. [18] proposed TFLAG, a bias-aware temporal provenance graph joint learning architecture, which improves detection accuracy in APT scenarios characterized by covert and subtle temporal perturbations. Guan et al. investigated topology-based node-level membership inference attacks, designing feature processing and attack training strategies that integrate information from target nodes and their neighborhoods. Their study focuses on the privacy of training data in graph models, complementing the present work on host risk and attack-related relation prediction for future time windows [19]. However, these dynamic graph-based network attack prediction methods still rely on fixed-window discrete snapshot modeling and suffer from two major limitations. First, the continuously evolving attack propagation process is discretized into independent time steps, making it difficult to accurately characterize the transition dynamics of lateral attack penetration; consequently, prediction in progressive stealthy attack scenarios, such as port scanning and slow penetration, exhibits evident lag and performance fluctuation. Second, these methods mainly focus on node-level anomaly detection and provide insufficient modeling of the edge-level evolution patterns of attack links, thereby failing to meet the requirements of attack path prediction.
2.2. Graph Neural Differential Equations and Continuous Dynamic Graph Modeling
Unlike iterative modeling based on discrete snapshots, continuous-time modeling provides a smoother characterization of gradual state evolution and is therefore highly consistent with the physical nature of lateral attack diffusion in networks. Neural ODE [9] established a general modeling paradigm for the continuous evolution of latent states, laying the foundation for continuous dynamic system modeling. CGNN [10] developed an ODE-driven continuous graph modeling approach, extending discrete graph neural networks into continuous dynamic systems and theoretically alleviating the oversmoothing issue of discrete GNNs. CTGNDE [11], a continuous-time graph neural differential equation model, and demonstrated on real-world network link prediction tasks the performance advantage of continuous temporal modeling over discrete dynamic graph methods. Overall, existing graph ODE methods predominantly adopt homogeneous propagation dynamics and do not incorporate the semantics of cyberattack scenarios. As a result, they are unable to distinguish propagation differences across heterogeneous communication links and struggle to accurately characterize the continuous evolution patterns of attack propagation.
2.3. Joint Node–Edge Temporal Graph Representation Learning
The dynamic evolution of cyberattacks simultaneously manifests as anomalous node states and malicious propagation behaviors over communication links; this process can therefore be modeled as a coupled node–edge evolution system [6]. TGAT [20] and DyRep [21] achieve node representation learning or link prediction based on continuous-time dynamic graphs. However, both adopt independent single-task modeling during training and do not establish a collaborative optimization mechanism for node-level risk prediction and link propagation prediction, making them insufficient for supporting dynamic representation and evolutionary prediction of attack behaviors over network links. Studies in graph learning have shown that multitask joint modeling of node classification and link prediction can mutually improve the performance of both tasks [22]. Nevertheless, most existing methods are still developed within static or discrete-snapshot temporal frameworks and lack a dual-task collaborative optimization mechanism for continuously evolving temporal graphs, making them unable to realize dynamic prediction of full attack-chain evolution.
In summary, the existing literature suffers from three core limitations. First, discrete snapshot-based modeling paradigms are inadequate for accurately characterizing the continuous diffusion process of lateral attack penetration, resulting in significant prediction lag in progressive stealthy attack scenarios. Second, existing graph neural differential equation models employ homogeneous propagation dynamics and lack attack-scenario semantics, leading to insufficient capability to distinguish the propagation behaviors of heterogeneous communication links. Third, there is a lack of node–edge collaborative optimization mechanisms under continuous temporal frameworks, which prevents dynamic prediction of full attack-chain evolution. To address these limitations, we propose AC-ODE.
3. Method
3.1. Problem Definition
Let the dynamic graph of a network attack scenario be represented as a sequence of graph snapshots segmented by time windows:
The node set is defined as
where denotes the set of internal host nodes and denotes the set of service nodes. is the directed edge set at time , and denote the feature matrices of nodes and edges, and denotes the edge-type set.
Let the historical observation window of length be defined as
This paper considers two prediction tasks for network attacks at time :
Node-level risk prediction: determine whether each node is a high-risk node at time ;
Edge-level attack propagation prediction: determine whether each candidate edge at time corresponds to an attack propagation link.
The model learns the mapping
where denotes the predicted risk probabilities of host nodes, and denotes the predicted probabilities of attack propagation over the candidate edge set .
The dynamic evolution of cyberattack risk states is further formulated as a continuous-time derivative process, whose evolution law is described by an ordinary differential equation:
where denotes the continuous-time latent state trajectory of nodes over , with corresponding to the historical endpoint , and corresponding to the prediction time , denotes the attack-context propagation function parameterized. which serves as the core ODE module of the proposed AC-ODE model.
The model is trained by minimizing the joint classification loss for node-level risk prediction and edge-level attack propagation prediction. The overall optimization objective is formulated as
where and denote the binary cross-entropy losses for node-level risk prediction and edge-level attack propagation prediction, respectively; are task-balancing coefficients; and represents the set of all trainable model parameters. Their detailed definitions will be provided in the subsequent sections.
3.2. Overall Framework
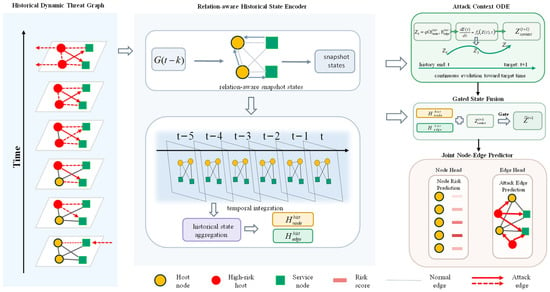
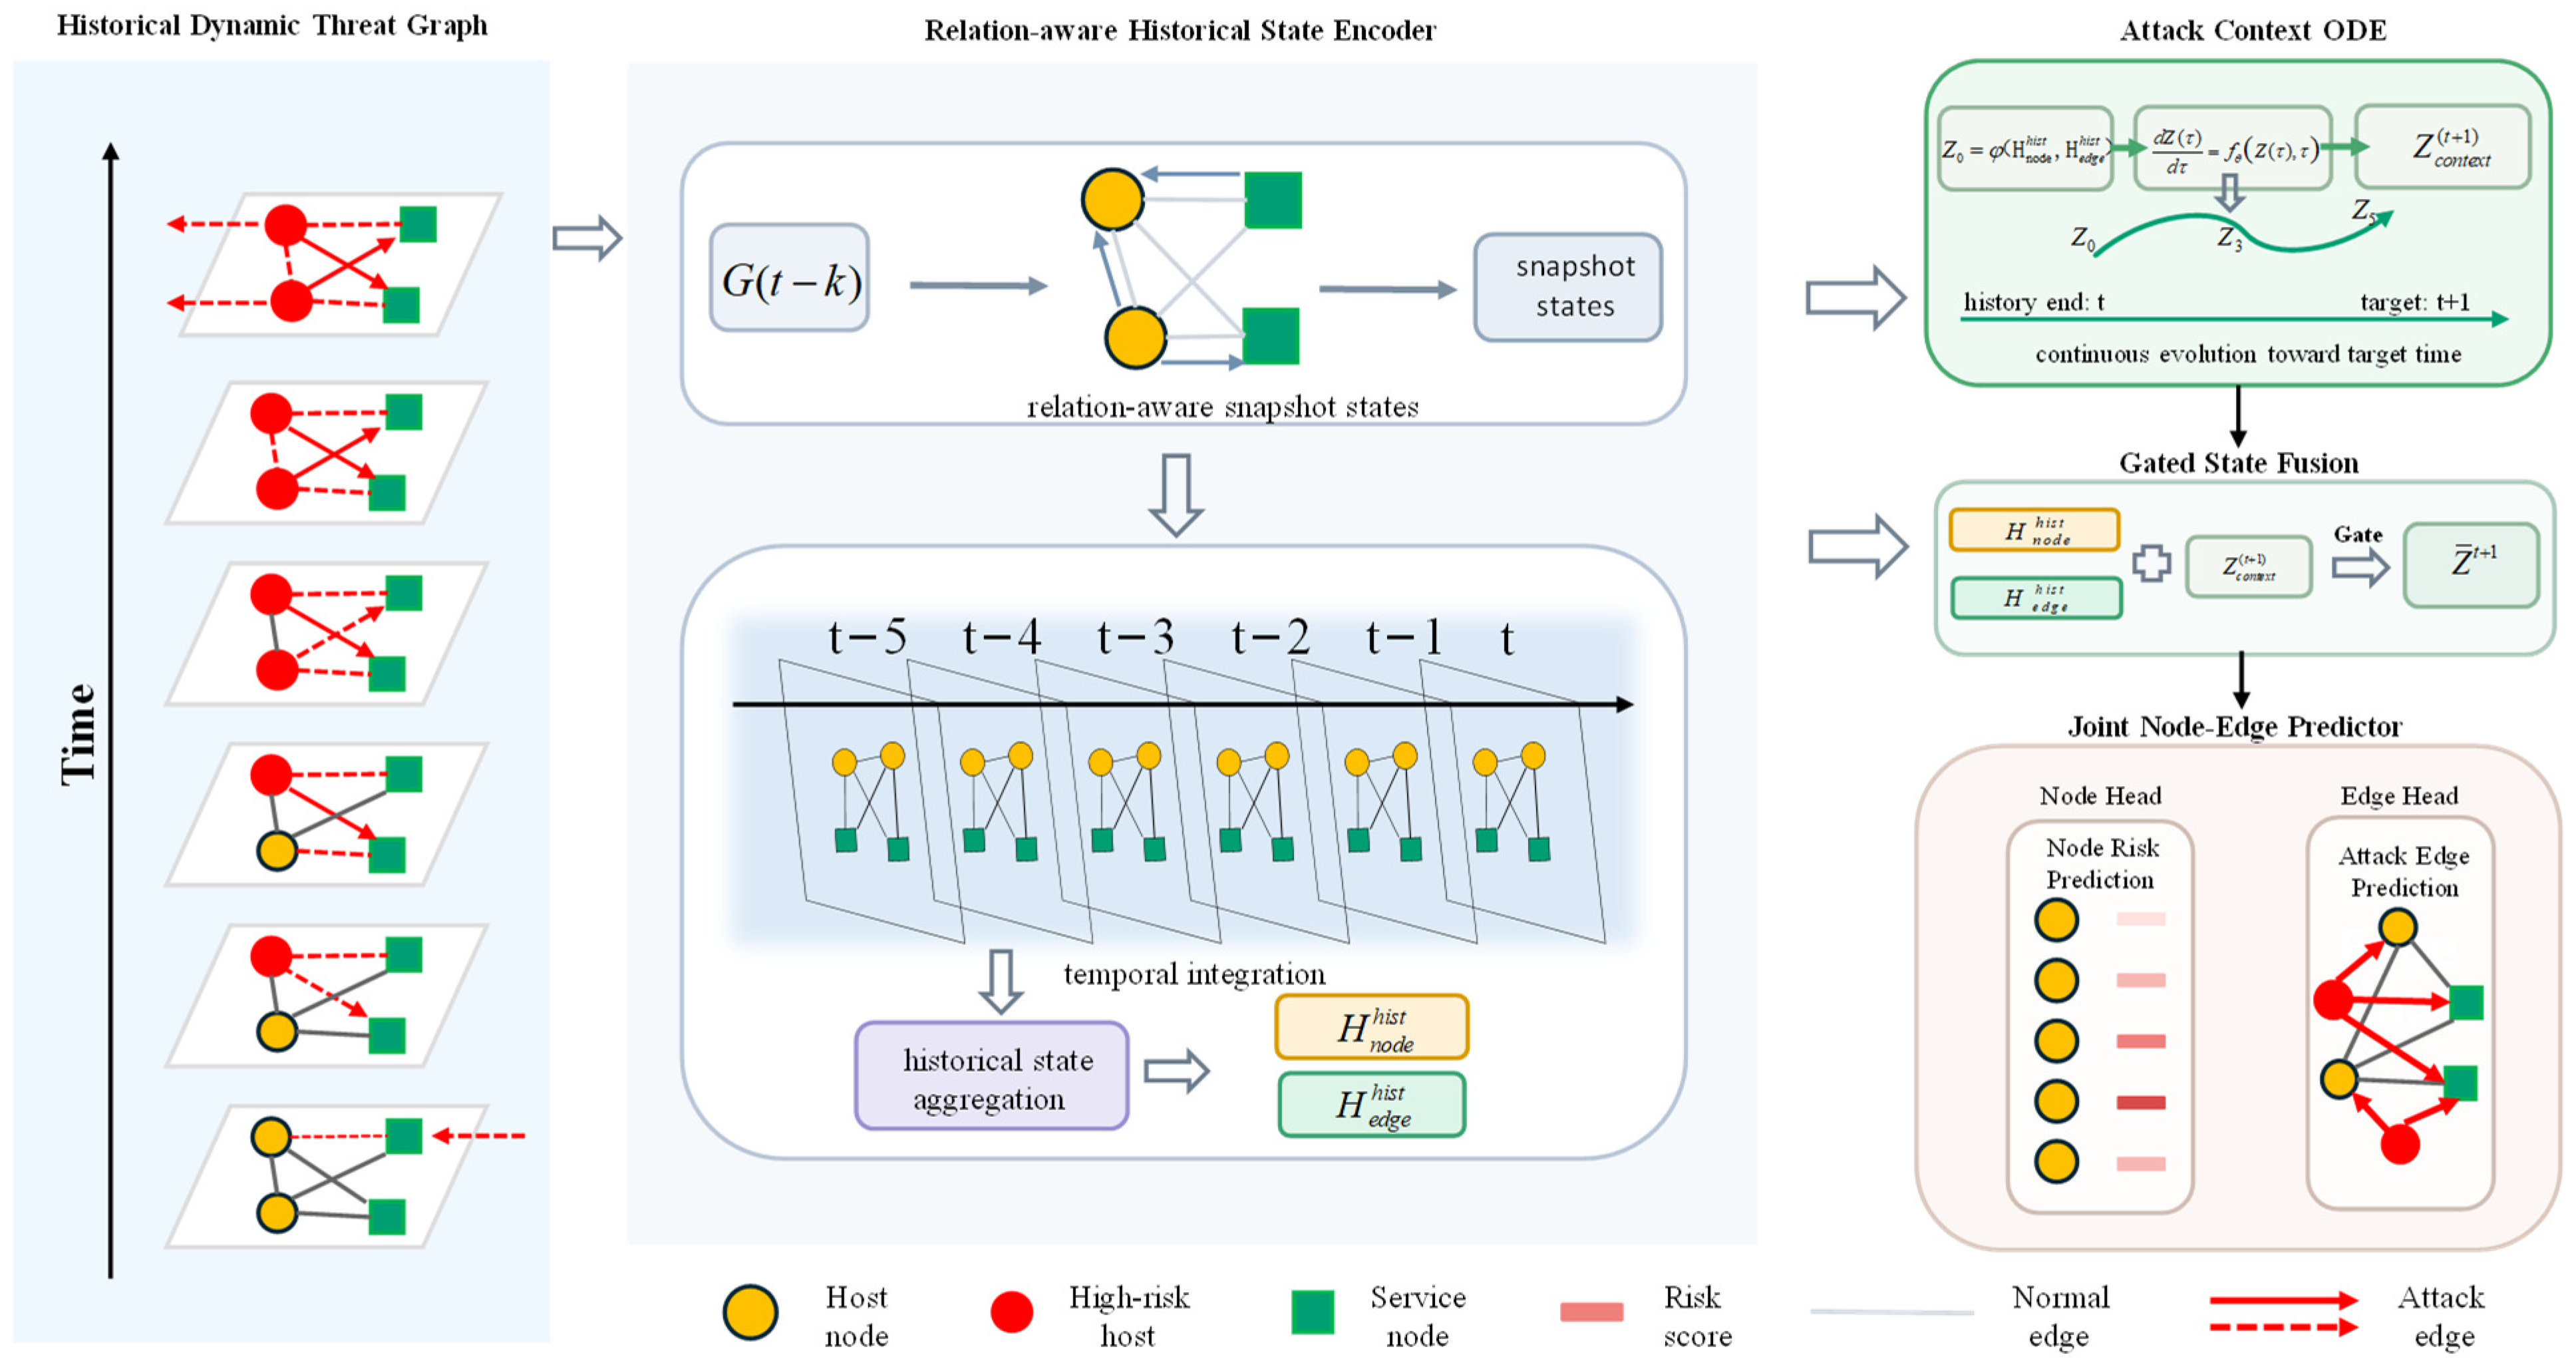
As illustrated in Figure 1, AC-ODE consists of four components: a relation-aware historical state encoding module, an attack-context-conditioned continuous propagation module, a historical–future state gated fusion module, and a joint node–edge prediction module. These modules sequentially perform historical information extraction, continuous evolution modeling, feature fusion representation, and joint prediction output. The core functions of each module are summarized as follows:
Figure 1.
Overall framework of AC-ODE. The model consists of four components: the relation-aware historical state encoding module, the attack-context-conditioned continuous propagation module, the historical–future state gated fusion module, and the joint node–edge prediction module.
- Relation-aware historical state encoding module: This module integrates edge attributes and edge-type semantics to perform relation-aware graph encoding over multiple snapshots within the historical window. It further aggregates historical information through causal temporal attention, temporal decay, and a dual-gated selective forgetting mechanism, thereby producing the current historical security state.
- Attack-context-conditioned continuous propagation module: Taking the historical security state as the initial condition, this module performs ODE-based evolution of latent states on discretely observed graphs, using edge-level attack context to modulate risk propagation intensity and message content
- Historical–future state gated fusion module: This module adaptively fuses the historical security state with the propagation trends reflected in future latent states, and outputs the final node representations.
- Joint node–edge prediction module: Based on the final predictive states, this module simultaneously performs node-level risk prediction and edge-level attack propagation prediction.
The overall framework pipeline can be formulated as follows:
where denotes the historical security state, denotes the future latent state, and denotes the final predictive state after fusion. denotes the set of prediction-head parameters.
3.3. Relation-Aware Historical State Encoding Module
3.3.1. Relation-Aware Graph Encoding for a Single Snapshot
For each historical snapshot at time given the node feature matrix , a linear projection is first applied to map the node features into the hidden space:
where is a trainable parameter matrix, and denotes the hidden dimension.
By incorporating edge attributes and edge-type embeddings, a relation-aware message is constructed for each edge :
where denotes the message MLP implemented in the model, and are the source-node and target-node features at layer , denotes the edge attribute, and denotes the edge-type embedding.
An attention mechanism is then used to weight the importance of neighboring nodes:
where denotes the set of source nodes pointing to node . Accordingly, the node state at the next layer is updated as:
where denotes the self-linear transformation matrix, and denotes layer normalization.
Compared with GCN or graph attention mechanisms that aggregate only neighboring node features, the proposed method encodes node attributes, edge attributes, and relation types into node representations in a unified manner, making it more suitable for cybersecurity scenarios in which different communication relations carry distinct risk semantics.
3.3.2. Causal Temporal Attention and Temporal Decay
After obtaining the historical node representation sequence , causal temporal attention is employed to aggregate them.
For each node , with its node representation at the current window endpoint , , serving as the reference, we construct
where are trainable parameter matrices. Here, denotes the query vector used to retrieve historical information semantically relevant to the current state; denotes the key vector at historical time , serving as the index for semantic matching; and denotes the value vector.
A learnable temporal decay term is further introduced so that more recent information receives larger weights:
where denotes the raw attention score of the historical state at time , and is a learnable decay coefficient. After the softplus transformation, it remains positive and controls the attenuation rate of historical information. This design is inspired by the decay attention mechanism in time-series modeling [23] while being adapted to cybersecurity scenarios: recent behaviors are more critical for the current node risk state, whereas distant historical information is retained as background context.
The historical value vectors are then aggregated to obtain the historical contextual feature of node :
A dual-gated selective forgetting mechanism is designed to filter irrelevant historical noise:
where denotes the node security state at time ; the reset gate controls the retention of historical information, while the update gate adaptively balances the fused candidate state and the original feature at the current time step. Here, denotes element-wise multiplication. The final output is the historical security state matrix .
3.4. Attack-Context-Conditioned Continuous Propagation Module
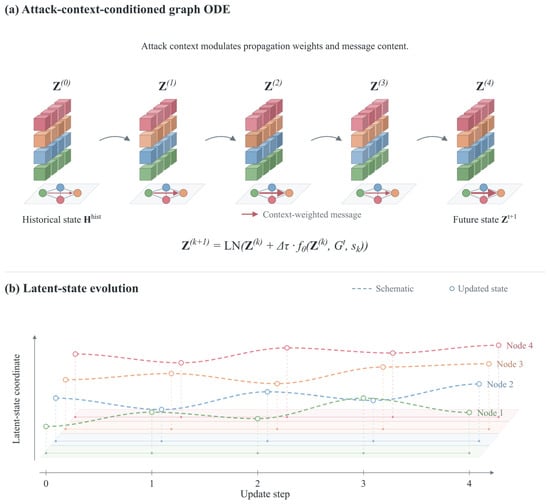
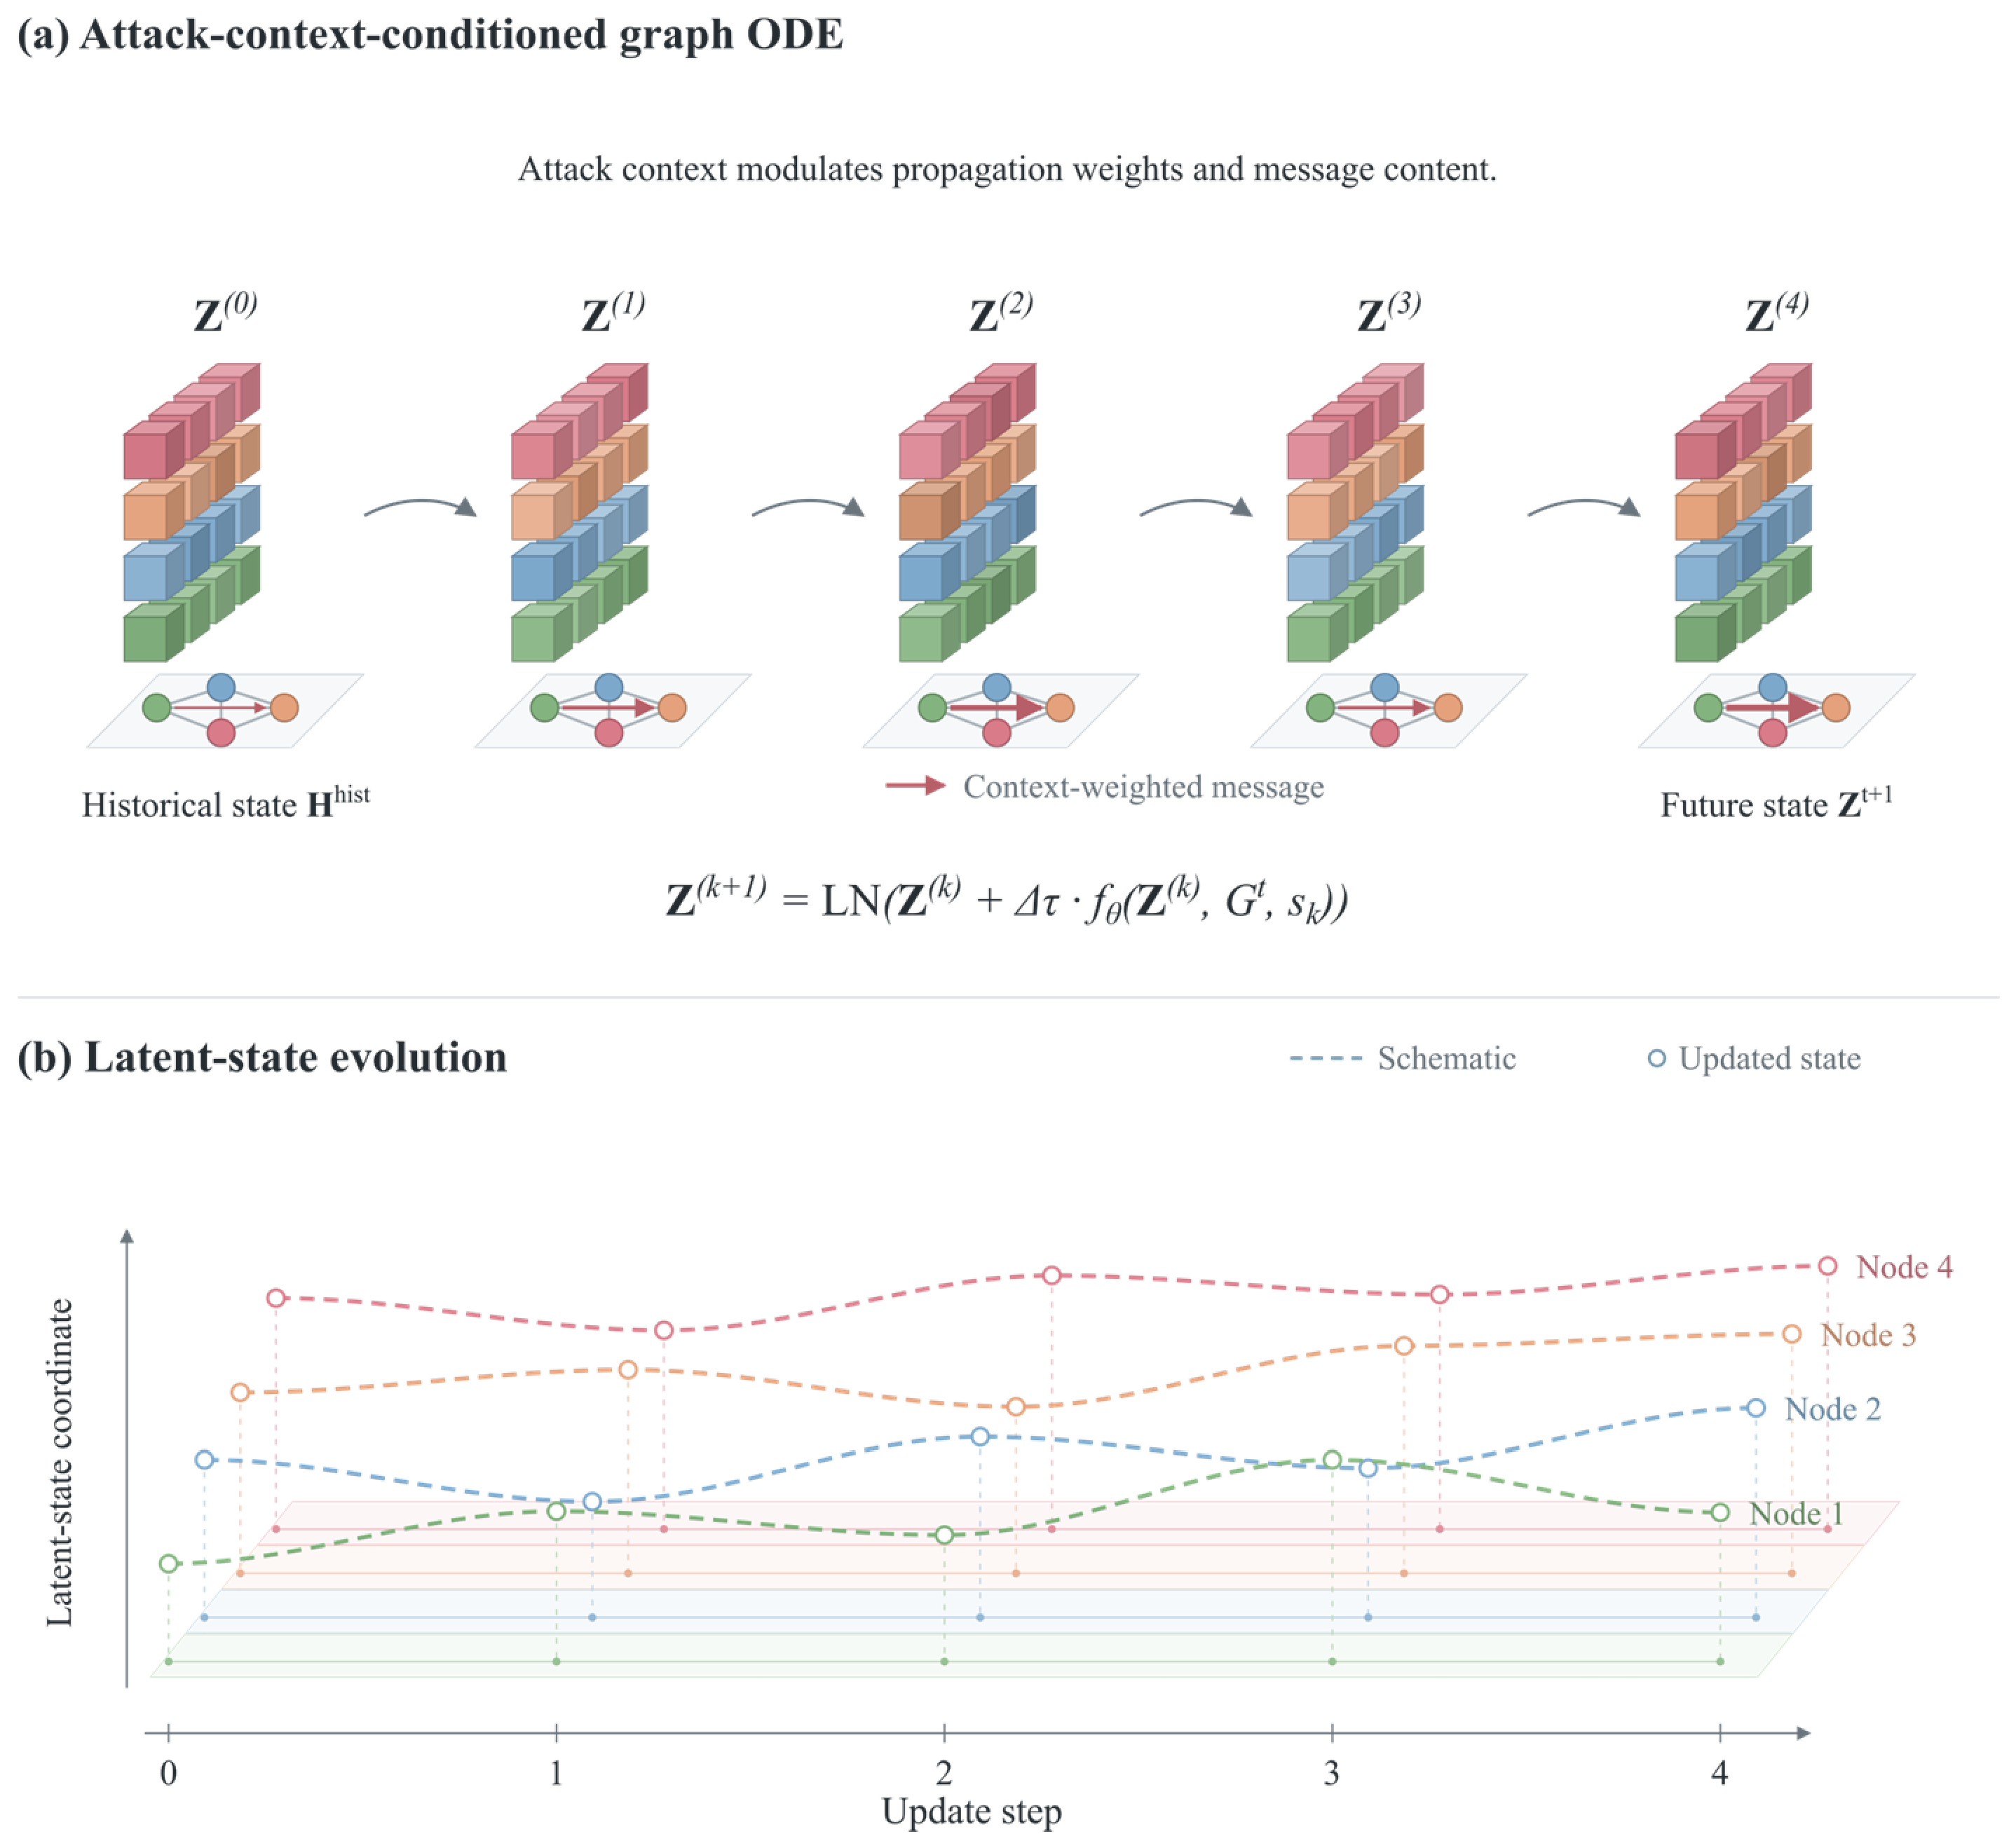
As illustrated in Figure 2, attack context modulates propagation weights and message content, and the model evolves the historical security state into a future latent state through multiple update steps. The curves below schematically illustrate changes in a latent-state coordinate of different nodes across update steps.
Figure 2.
Mechanism of attack-context-conditioned latent-state evolution. (a) Context-conditioned state updates based on a discretely observed graph. (b) Schematic changes in a latent-state coordinate of different nodes across update steps.
3.4.1. Continuous Propagation Dynamics Modeling
Let denote the initial historical security state. The latent-state evolution process for risk prediction is modeled as follows:
where denotes the latent node-state trajectory over continuous time with corresponding to the historical endpoint and corresponding to the target time .
To incorporate edge-level attack context, for each edge , a context representation with multi-source information fusion is constructed as:
where denotes the continuous-time embedding, and is the context mapping MLP. This context representation jointly encodes node states, edge attributes, interaction features, state differences, relation types, and temporal evolution stages.
Based on the attack context, a time-varying propagation weight is then obtained as
This weight dynamically reflects the propagation capability of different edges at different time points and adaptively modulates the propagation intensity.
The derivative of the node state is determined by the node’s own state and the aggregated messages:
where denotes the message generation function, and denotes the state update function.
3.4.2. Numerical Integration for Solving the Future Latent State
The above ODE is approximately solved using fixed-step Euler-style updates. Let denote the number of propagation steps, the integration step size, and the iteration index. The default settings are , .
The normalized time input at each iteration is defined as follows:
Here, is used to construct the time embedding and indicates the evolution stage of the current propagation step. It differs from the integration step size which scales the state increment. When , , thereby avoiding division by zero.
Taking the historical security state as the initial condition, the state update is formulated as follows:
The graph structure and edge attributes remain fixed during propagation, and no information from the target window is introduced. The dynamics network parameters are shared across all steps. Layer normalization is applied after each state update to regulate the numerical scale of the latent states.
After completing all iterations, the future latent state at the target time is obtained as
3.5. Historical–Future State Gated Fusion
When prediction is performed solely based on the future latent states obtained through continuous evolution, the persistent attack features extracted by historical encoding may be gradually diluted due to smoothing effects. To simultaneously capture attack evolution trends and preserve the historical security state, an adaptive gated fusion mechanism is designed:
where denotes a learnable gate projection network, and is a dimension-wise gating vector that enables differentiated historical–future fusion strategies across different semantic feature dimensions.
The final predictive state after gated weighted fusion is given by
When takes larger values, the model places greater emphasis on the future latent state obtained via continuous evolution; when takes smaller values, the model tends to preserve more of the historical security state.
3.6. Joint Node–Edge Prediction and Optimization
3.6.1. Joint Prediction Heads
Based on the fused final state , separate prediction heads are constructed for nodes and edges.
For the node prediction head,
where denotes the node prediction network, and denotes the set of valid nodes in graph at time .
For the edge prediction head:
for each candidate edge , the input feature is constructed by concatenating the source-node representation, the target-node representation, their difference, their element-wise interaction feature, and the edge-type embedding:
where denotes the predicted probability that edge denotes the set of valid candidate edges at time .
3.6.2. Joint Optimization Objective
The binary cross-entropy losses for the node task and the edge task are respectively defined as:
where denotes the ground-truth label of node, denotes the ground-truth label of candidate edge, and are task-balancing coefficients.
The joint objective loss function is formulated as:
This design enables the node task to learn node risk states, while the edge task learns propagation relationships. By sharing the historical encoding and continuous propagation representations, the two tasks achieve collaborative optimization.
4. Experiments
4.1. Experimental Setup
Experiments are conducted on three public datasets—LANL, OpTC, and CICIDS2017—which cover three types of dynamic graph scenarios: inter-host authentication relations in a real enterprise internal network, intra-host behavior relations, and traffic-level communication relations.
4.1.1. Datasets and Graph Construction
LANL [24] is a real enterprise internal-network security event dataset released by Los Alamos National Laboratory, offering strong applicability to real-world scenarios. We use data containing 17,666 host nodes and more than one billion inter-host authentication events, of which 749 are real red-team attack events. In terms of graph modeling, a single computer host is treated as a node, and one authentication interaction directed from a source host to a destination host constitutes an edge; a fixed 1800 s splitting window is adopted to generate a sequence of dynamic graph snapshots, where each snapshot characterizes the authentication interaction states among all hosts within that window. On the LANL dataset, the node-level task is to predict the hosts that may be attacked in the next window, and the edge-level task is to predict the risk propagation links in the next window.
OpTC is the Operationally Transparent Cyber dataset released by DARPA. We select the audit logs from 23 to 25 September 2019, which contain 99 host nodes and approximately 420 million audit events, of which 114,880 events are precisely matched with red-team labels. A two-level graph is adopted for OpTC: the global graph takes hosts as nodes and host-to-host communication interactions as edges, representing the overall network communication topology; the local behavior graph takes the 31 behavior types (object:action) of each host as nodes and consecutive intra-host behavior transitions as edges, characterizing the evolution trajectory of intra-host behaviors. A fixed 900 s splitting window is adopted to generate a sequence of dynamic graph snapshots. Since the vast majority of events in this dataset are intra-host behaviors, the experiments on this dataset focus on the edge-level task, i.e., predicting whether attack behaviors occur within the target window and identifying their specific types.
CICIDS2017 [25] is a public traffic-level benchmark dataset for intrusion detection. We use the traffic data of two days, Wednesday and Friday-PortScan, which contain host nodes and 14 types of service nodes, and comprise 692,703 and 286,467 network flows, respectively. In the constructed graph, two types of edges are defined, namely host-to-host communication relations and host-to-service access behaviors; a fixed 300 s splitting window is adopted to generate a sequence of dynamic graph snapshots. This dataset is used to validate the effectiveness of our method in generic traffic-level scenarios and serves as the second dataset for the ablation study.
4.1.2. Attack Labels and Feature Generation
Attack label construction. Attack labels for LANL are generated by matching and mapping official red-team records to authentication log events. OpTC uses matching rules based on event identifier consistency and timestamps, whereas CICIDS2017 uses the original network flow annotations. A host or interaction relation is labeled as positive if a corresponding attack event occurs within the target window; otherwise, it is labeled as negative.
Input feature construction. Raw events are aggregated by time window, host, and relation to form node and edge attributes. LANL features include authentication counts, historical red-team match counts, successful and failed authentication counts, numbers of interacting hosts and users, inbound and outbound authentication counts, and edge-level attack ratios. CICIDS2017 features include flow counts, historical attack and benign flow counts, packet counts, byte counts, durations, numbers of interaction counterparts, and inbound and outbound flow statistics. OpTC features include host activity, behavior and communication statistics, together with local behavior transition graphs within each window. Within each dataset, all methods use consistent input information, while the specific encoding scheme is determined by the model architecture.
Each prediction sample uses only historical features preceding the target window. Target-window labels are not used to construct the inputs.
4.1.3. Sampling, Data Splitting Strategies, and Evaluation Metrics
The sampling and data splitting strategies follow common practice in existing studies. Negative relations are defined as candidate relations that are not labeled as attack-related in the target window. During training, all positive relations are retained, and negative relations are randomly sampled from the non-positive candidate set to construct the training samples. The positive-to-negative sampling ratios are 1:10 for LANL and 1:5 for CICIDS2017. For windows without positive relations, at most 1024 negative relations are sampled. During validation and testing, LANL uses predefined candidate sets comprising positive relations, historically observed relations, and other negative candidates. CICIDS2017 uses all directed relations between hosts and all host–service combinations within each scenario. OpTC does not perform relation-level negative sampling; instead, all 3069 host–behavior combinations formed by 99 hosts and 31 behavior types are used for training and evaluation. Within each dataset, all models use identical evaluation candidate sets.
All three datasets are split into training, validation, and test sets in chronological order. Because attack samples are extremely sparse in LANL, windows containing attack events are selected for testing to focus on attack periods and ensure meaningful evaluation of positive and negative samples. The training set covers a longer continuous time interval to learn normal behavior patterns and capture the limited attack patterns. The resulting training, validation, and test sets contain 752, 55, and 66 samples, respectively. For CICIDS2017, the split boundaries are determined using approximately 60%/20%/20% of the total time windows within each scenario. The training, validation, and test sets contain 18, 6, and 6 samples for Friday-PortScan and 80, 29, and 29 samples for Wednesday, respectively. OpTC uses approximately 70%/15%/15% of the total time windows, yielding 128, 29, and 29 samples, respectively. These ratios apply to time windows, while the final numbers of prediction samples also depend on the history length. Each sample uses the preceding six windows to predict the next window, and the target-time intervals of the training, validation, and test sets do not overlap.
AP, AUC, and Hits@10 are adopted as evaluation metrics. AP better reflects the detection quality of sparse attack events under severe class imbalance; AUC reflects the overall discriminative capability of a model for positive and negative samples; Hits@10 is defined as the proportion of samples whose top-10 candidates, ranked by predicted probability within the candidate set, contain at least one true attack sample. Since the candidate-set construction rules differ across datasets, we compare the differences among methods only within the same dataset.
4.1.4. Baseline Methods
The comparison baselines were selected from representative dynamic graph methods, covering discrete temporal graph neural networks, dynamic graph parameter evolution models, dynamic graph self-attention methods, and graph neural differential equation-based approaches.
GraphSAGE-GRU, GCN-GRU, and GAT-GRU are discrete temporal baselines composed of static graph encoders and recurrent temporal units, and are used to model the recursive evolution of network topology and node features.
EvolveGCN models the temporal evolution of dynamic graphs through iterative updates of graph convolution parameters.
DySAT [23] jointly learns dynamic graph representations by integrating structural attention and temporal attention.
Graph ODE serves as the standard graph ODE baseline. It defines continuous-time dynamics through graph message passing and employs numerical integration to solve the temporal evolution of node states.
The evaluation metrics include the area under the ROC curve (AUC) and average precision (AP). AUC reflects the overall detection capability of a model, but may overestimate performance under class-imbalanced conditions. In contrast, AP places greater emphasis on the recognition precision of positive attack samples, making it more suitable for scenarios where attack samples are relatively sparse and class imbalance is pronounced. All experimental results are reported in the form of mean ± standard deviation.
4.1.5. Implementation Details
All models are implemented in PyTorch 2.8.0 and trained with the AdamW optimizer, using a learning rate of 1 × 10⁻³, a weight decay of 1 × 10⁻⁵, a hidden dimension of 64, and a dropout rate of 0.2, with a maximum of 100 training epochs. Each configuration is independently run with 10 random seeds, and the average results are reported. The history length is set to six windows for LANL, OpTC, and CICIDS2017. The number of ODE integration steps is fixed at four, with an integration step size of 0.25; the effects of different settings of these two parameters are analyzed in the subsequent experiments. The data are split strictly in chronological order, and the optimal epoch is selected according to the AP-based composite score on the validation set.
4.2. Experimental Results and Analysis
4.2.1. Node-Level Task Results
As shown in Table 1, AC-ODE achieves the best results in terms of both AP and Hits@10 on the two datasets. On the LANL dataset, AC-ODE attains an AP of 0.288, considerably higher than that of the second-best method, Graph ODE, together with a Hits@10 of 0.643; its AUC reaches 0.899, exceeding the second-best method by 8.4 percentage points. On the Friday-PortScan and Wednesday scenarios of CICIDS2017, AC-ODE achieves AP values of 0.784 and 0.883 and Hits@10 values of 0.768 and 0.896, respectively, outperforming the baseline models. In contrast, the node-level AP of GAT-GRU and EvolveGCN degrades markedly on CICIDS2017, indicating that methods relying solely on attention-based feature aggregation or on parameter-iterative updating struggle to effectively characterize the accumulation and decay of node risk along the continuous time dimension. TGAT performs relatively well on the Wednesday scenario but achieves an AP of only 0.506 on Friday-PortScan, exhibiting considerable cross-scenario fluctuation. AC-ODE remains optimal across the two markedly different scenarios, indicating that the synergy of the relation-aware historical state encoding, the attack-context-conditioned continuous propagation, and the historical–future state gated fusion modules can continuously and stably extract risk evolution features.
Table 1.
Performance comparison of different methods on node-level risk prediction, reporting AP, AUC, and Hits@10 for LANL and the two CICIDS2017 scenarios.
4.2.2. Edge-Level Task Results
Table 2 reports the experimental results of edge-level attack behavior prediction. AC-ODE achieves the best AP on all three datasets and outperforms the other baselines in terms of Hits@10, except in one scenario where it ties with GAT-GRU. On the OpTC dataset, AC-ODE attains AP, AUC, and Hits@10 of 0.974, 0.998, and 0.932, respectively, all of which are the best among all methods, with the AP exceeding that of the second-best method by 73.8%. The task on this dataset is edge-level attack identification, which aims to determine whether attack behaviors occur within the target time window and to precisely distinguish their attack types. All models use consistent input information, candidate sets, and training and evaluation settings, as detailed in Section 4.1. Notably, GAT-GRU achieves an AP of 0.0022 and an AUC of 0.489, indicating limited ability to distinguish attack behaviors under the current settings. The superior performance of AC-ODE on this task indicates that the attack-context-conditioned continuous propagation mechanism can accurately characterize attack evolution at the intra-host behavior level. On the LANL dataset, where the samples are extremely imbalanced, the absolute AP values of all methods are generally small; AC-ODE attains an AP of 0.039, the best among all methods, and a Hits@10 of 0.571, 33.1% higher than that of the second-best method. On the Wednesday scenario of CICIDS2017, AC-ODE achieves an AP of 0.789 and an AUC of 0.998, both the best among all methods, and its Hits@10 reaches 0.847, tying with GAT-GRU; however, the AP of GAT-GRU in the same scenario is only 0.069, indicating that its hits are not supported by ranking quality. On the Friday-PortScan scenario, the AP of AC-ODE reaches 0.438, comparable to the best baseline (0.437), while its Hits@10 reaches 0.720, outperforming the other methods. These results indicate that in scenarios where port-scan traffic closely resembles normal service traffic, the advantage of AC-ODE is mainly reflected in top-K alert hits, which matches the practical requirement of reviewing only a limited number of high-priority alerts in security operations.
Table 2.
Performance comparison of different methods on edge-level attack behavior prediction. Edges in LANL, OpTC, and CICIDS2017 represent host authentication relations, host–behavior relations, and host communication and host–service relations, respectively. Each dataset uses its own candidate sets, and results are compared within the same dataset.
4.2.3. Analysis of Experimental Results
We further analyze the experimental results to explain the observed performance differences across models.
AC-ODE achieves strong performance across multiple network attack scenarios, demonstrating favorable scenario adaptability and generalization capability. In network scenarios characterized by sparse attack samples and imbalanced type distributions, AC-ODE yields clear improvements in AP over the baseline methods, indicating that it can more accurately capture positive attack samples and true propagation links. Prior studies have shown that, compared with AUC, which emphasizes the global ranking capability of a model, AP more faithfully reflects the practical detection level of a small number of critical attack events in network attack detection tasks with class imbalance [26]. Therefore, the advantage of the proposed method in terms of AP demonstrates that it is better suited to real-world network attack prediction tasks.
Node-level risk prediction relies more heavily on the joint extraction of cumulative historical behaviors and recent contextual risk features [18,27]. For stealthy attacks such as port scanning, the structural difference between malicious behaviors and normal traffic within a single snapshot is not pronounced, making it difficult to accurately determine risk states using only current-time features [28]. Therefore, in the node-level risk prediction task, the relation-aware historical state encoding module plays a more important role. In real network attack scenarios, risk diffusion does not occur strictly at fixed discrete time points; instead, it evolves continuously with changes in host interactions, service requests, and network connection states [29,30]. Studies on continuous-time dynamic graphs and neural differential equations have shown that continuous dynamical models possess natural advantages for irregular event streams, asynchronous interactions, and progressive state evolution. Edge-level tasks require not only the identification of high-risk nodes but also the further characterization of the complete process by which risk propagates along network links, which places higher demands on the dynamic temporal interactions among source nodes, target nodes, and edge semantics [31], indicating that the attack-context-conditioned continuous propagation module plays an important role in edge-level tasks. Moreover, jointly optimizing node–edge risk prediction in a unified representation space can strengthen the model’s ability to characterize the evolution patterns of complex attack chains.
4.3. Ablation Study
To validate the contribution of each component of AC-ODE to the model performance, we conduct ablation experiments on two datasets, LANL and CICIDS2017. All variants use the same data splits, candidate sets, and evaluation metrics, with all other configurations remaining unchanged except for the corresponding ablation setting. Results are reported for both node-level risk prediction and edge-level attack propagation prediction.
4.3.1. Ablation Variants
The following seven ablation variants are constructed:
w/o History Encoder: The relation-aware historical state encoding module is removed. The history window is truncated to the last time window, so that multi-frame temporal modeling over the historical snapshots is no longer performed and the current historical security state is generated only from the snapshot of the last window. The attack-context-conditioned continuous propagation module and the historical–future state gated fusion module are retained.
w/o ODE: The multi-step numerical integration in the attack-context-conditioned continuous propagation module is simplified to single-step message passing. The relation-aware historical state encoding module and the historical–future state gated fusion module are retained. After a single-step update, the historical security state is still processed through gated fusion and the joint prediction heads to generate predictions.
w/o Fusion Gate: The historical–future state gated fusion module is removed, while the above two modules are retained. Instead of adaptively fusing the historical accumulated state and the future latent state through a gate vector, the two are fused with equal weights (0.5 each) and then fed into the prediction heads.
w/o Attack Context: The context construction network in the attack-context-conditioned continuous propagation module is removed, and the context vector is set to zero. All other modules and input features are retained.
Discrete GNN: A GNN baseline using discrete residual message passing is constructed, with the same hidden dimension, number of trainable parameters, and number of propagation steps as the full model. Parameters are shared across steps, the time input is fixed at zero, and the state increment is not scaled by the integration step size. Layer normalization is applied at each step, while all other modules remain unchanged.
Node-only: The complete AC-ODE architecture is retained, but training uses only the node prediction loss, without computing the edge prediction loss. The node loss coefficient remains the same as in joint training. This variant is evaluated only on node prediction.
Edge-only: The complete AC-ODE architecture is retained, but training uses only the edge prediction loss, without computing the node prediction loss. The edge loss coefficient remains the same as in joint training. This variant is evaluated only on edge prediction.
Ours: The complete AC-ODE model is used.
4.3.2. Ablation Results
As shown in Table 3 and Table 4, removing any one of the three modules leads to a noticeable decline in predictive performance. This indicates that the three core modules provide strong complementary gains in network attack prediction and each plays an indispensable role in the overall model.
Table 3.
Ablation and controlled comparison results on LANL, reporting AP, AUC, and Hits@10 for the node and edge tasks. Discrete GNN matches the full model in parameter count and number of propagation steps; “—” indicates that the corresponding task is not evaluated for a single-task variant.
Table 4.
Ablation and controlled comparison results on CICIDS2017. Node AP and edge AP are reported separately for Friday-PortScan and Wednesday. Discrete GNN is a discrete baseline matched in parameter count and number of propagation steps; “—” indicates that the corresponding task is not evaluated.
Effect of w/o History Encoder
When the history window is truncated to the last time window and only the snapshot of that window is used to generate the current historical security state, the performance metrics of the model decrease on both datasets. This indicates that this variant loses the cumulative characteristics of attack behaviors accumulated within the history window and is therefore less capable of capturing stealthy attack behaviors. In contrast, the relation-aware historical state encoding together with the dual-gated selective forgetting mechanism can integrate more stable historical attack context, effectively mine the characteristic patterns of network attacks, and provide high-quality initial representations for subsequent evolution modeling.
Effect of w/o ODE
After the multi-step integration in the attack-context-conditioned continuous propagation module is reduced to single-step message passing, the most pronounced degradation occurs on the edge-level risk prediction task of the LANL dataset, where the edge-level Hits@10 drops sharply by 45.7% relative to the full model. On the Wednesday scenario of the CICIDS2017 dataset, the node-level and edge-level AP decrease by 12.1% and 6.3%, respectively, both being the largest drops in this scenario. This indicates that, in the edge-level risk prediction task, multi-step latent-state evolution helps extract risk representations for next-window prediction compared with a single-step update. The reason is that nodes interact and change continuously during attack propagation; once the propagation degenerates into a single discrete step, the model can only rely on historical representations at discrete time steps and is therefore unable to anticipate cross-node penetration paths or characterize the dynamic trajectory of gradual attack diffusion, resulting in a substantial drop in prediction precision.
Effect of the w/o Fusion Gate
When the gated fusion is replaced by equal-weight fusion of the historical state and the future latent state, the metrics of both the node-level and edge-level prediction tasks decrease to varying degrees on the two datasets. Because cyberattacks exhibit long-term cumulative characteristics, equal-weight fusion cannot adaptively retain the persistent attack behaviors accumulated within the history window and instead dilutes them with the future latent state, thereby weakening the ability to identify long-term high-risk nodes and propagation links. In contrast, the gated fusion mechanism adaptively balances historical risk cues and future propagation trends, thereby further improving the stability of risk prediction.
Effect of w/o Attack Context
After the context vector is set to zero while all other modules and input features remain unchanged, node AP and edge AP decrease to 0.121 and 0.024 on LANL, 0.555 and 0.324 on Friday-PortScan, and 0.703 and 0.609 on Wednesday, respectively. This variant still uses the same historical attack information. The results indicate that context construction and its modulation of propagation weights and message content further improve model performance.
Effect of Discrete GNN
Under the same hidden dimension, number of trainable parameters, and number of propagation steps, the discrete GNN achieves node AP and edge AP of 0.134 and 0.030 on LANL, 0.570 and 0.345 on Friday-PortScan, and 0.659 and 0.376 on Wednesday, respectively, all lower than those of the full model. This indicates that, under the same parameter count and number of propagation steps, the context-conditioned ODE-style updates in AC-ODE achieve better predictive performance.
Effect of Node-Only
When training uses only the node prediction loss, node AP reaches 0.188, 0.585, and 0.710 on LANL, Friday-PortScan, and Wednesday, respectively, all lower than the corresponding joint-training results of 0.288, 0.784, and 0.883. This indicates that edge-task supervision provides complementary constraints for node prediction through shared representations, improving host risk identification.
Effect of Edge-Only
When training uses only the edge prediction loss, edge AP reaches 0.032, 0.307, and 0.282 on LANL, Friday-PortScan, and Wednesday, respectively, all lower than the corresponding joint-training results of 0.039, 0.438, and 0.789. These results demonstrate the contribution of node-task supervision to improving edge-level prediction performance.
Overall, the ablation experiments on two representative datasets validate the necessity and effectiveness of the core modules of AC-ODE: the absence of any single module leads to a significant degradation in dynamic network threat prediction capability. The interaction among the relation-aware historical state encoding, the attack-context-conditioned continuous propagation, and the historical–future state gated fusion modules enables AC-ODE to achieve superior performance in the joint prediction of node risk evolution and attack propagation paths.
4.4. Analysis of Temporal Characteristics
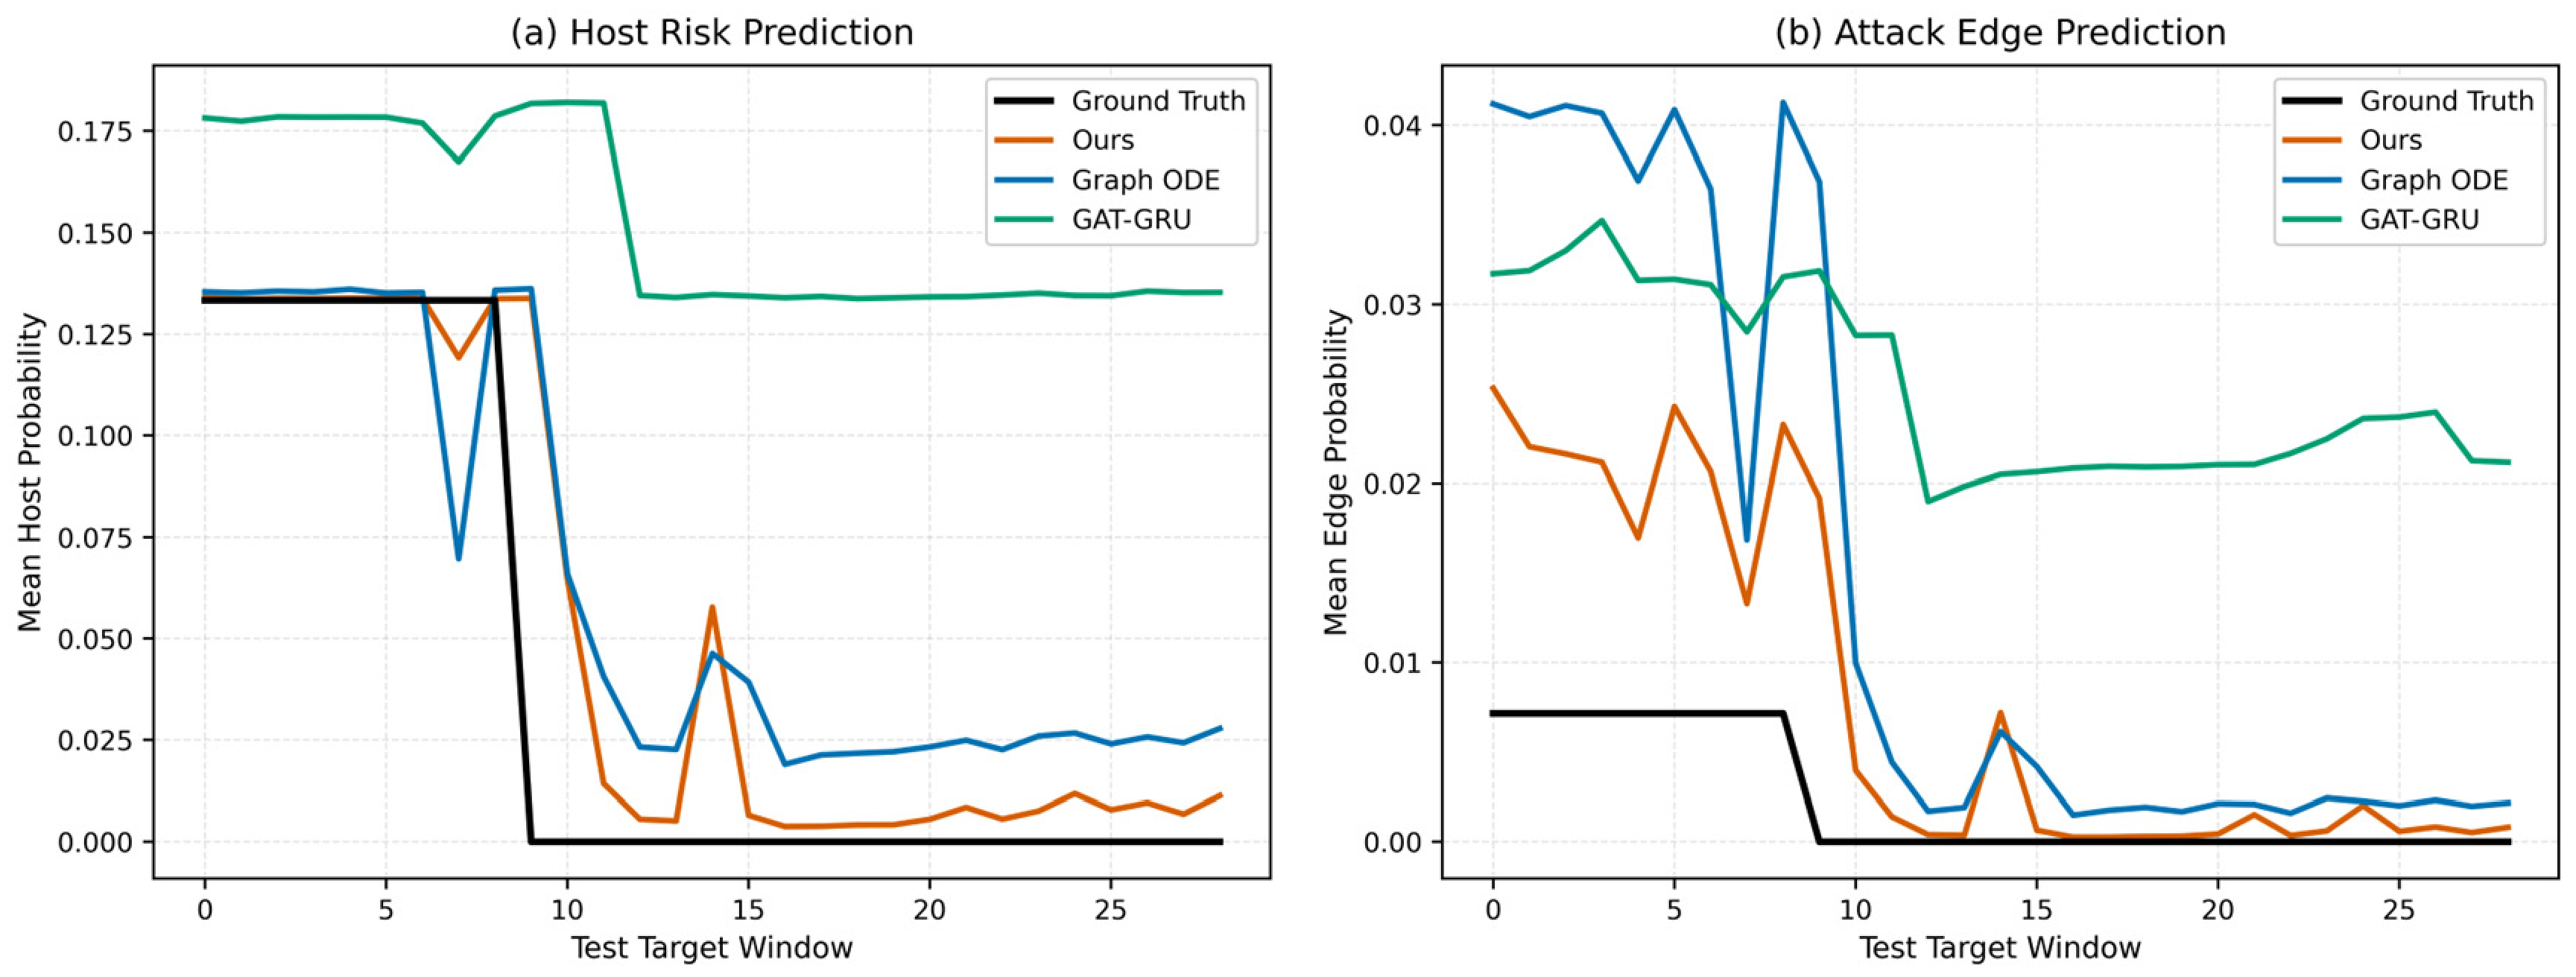
We further analyze the ability of different models to characterize the attack evolution process. On the LANL test set, a continuous attack time window is selected, and the average predicted probabilities of host-level risk prediction and edge-level attack propagation prediction are computed. The predictions of AC-ODE, Graph ODE, and GAT-GRU are then visually compared with the ground-truth temporal sequence of attack events, as shown in Figure 3.
Figure 3.
Comparison of the prediction probability evolution of different models over consecutive target windows. (a) Host risk prediction; (b) Attack Edge prediction.
As can be observed from the host risk prediction results in Figure 3a, the ground-truth attack risk remains relatively stable during the earlier windows and then rapidly declines to nearly zero after the ninth target test window. AC-ODE accurately tracks this risk variation trend: its prediction curve decreases sharply in synchronization with the attack dissipation stage and remains within the same low-risk interval as the ground-truth curve in subsequent windows, indicating that the model can precisely capture the dynamic risk transition from an active state to a quiescent state. Graph ODE exhibits an overall downward trend; however, it oscillates severely around the risk turning point, and its predicted probabilities in subsequent windows are noticeably higher than the ground-truth values, indicating that its characterization of the risk transition process is insufficiently smooth. The prediction curve of GAT-GRU remains consistently above the ground-truth attack curve and fails to respond promptly to changes in the attack state, indicating that relying solely on discrete-time modeling retains outdated historical attack states, resulting in evident lag and a substantial reduction in the sensitivity of risk prediction.
From the attack-edge prediction results in Figure 3b, the performance differences among the models are even more pronounced. The ground-truth attack curve remains stable in the earlier windows and then quickly drops to nearly zero after the ninth target test window. In this process, AC-ODE achieves rapid prediction convergence and closely aligns with the ground-truth curve shortly after the attack subsides, while maintaining low fluctuation in subsequent windows. Graph ODE again shows an overall downward trend, but pronounced oscillations appear in the risk transition interval, indicating that although graph ODEs are capable of continuous evolution modeling, they cannot clearly distinguish the heterogeneous risk intensities of different links during attack propagation. The edge-level prediction curve of GAT-GRU deviates considerably from the ground-truth curve and fails to characterize the subsiding process of propagation links, indicating that, compared with node-level risk prediction, edge-level attack propagation prediction relies more heavily on continuous temporal modeling and edge semantic modulation.
The above observations indicate that AC-ODE not only outperforms all baselines in terms of the evaluation metrics but also more accurately reflects trends in attack-state changes. Its performance advantages mainly stem from three aspects. First, the relation-aware historical state encoding module extracts stable attack context from historical windows and reduces temporal noise. Second, the attack-context-conditioned continuous propagation module models the temporal dynamics of network risk and smoothly describes changes in attack propagation intensity. Third, the historical–future state gated fusion mechanism jointly accounts for persistent historical features and future propagation trend information, thereby maintaining both the stability and accuracy of the model.
4.5. Hyperparameter Sensitivity Analysis
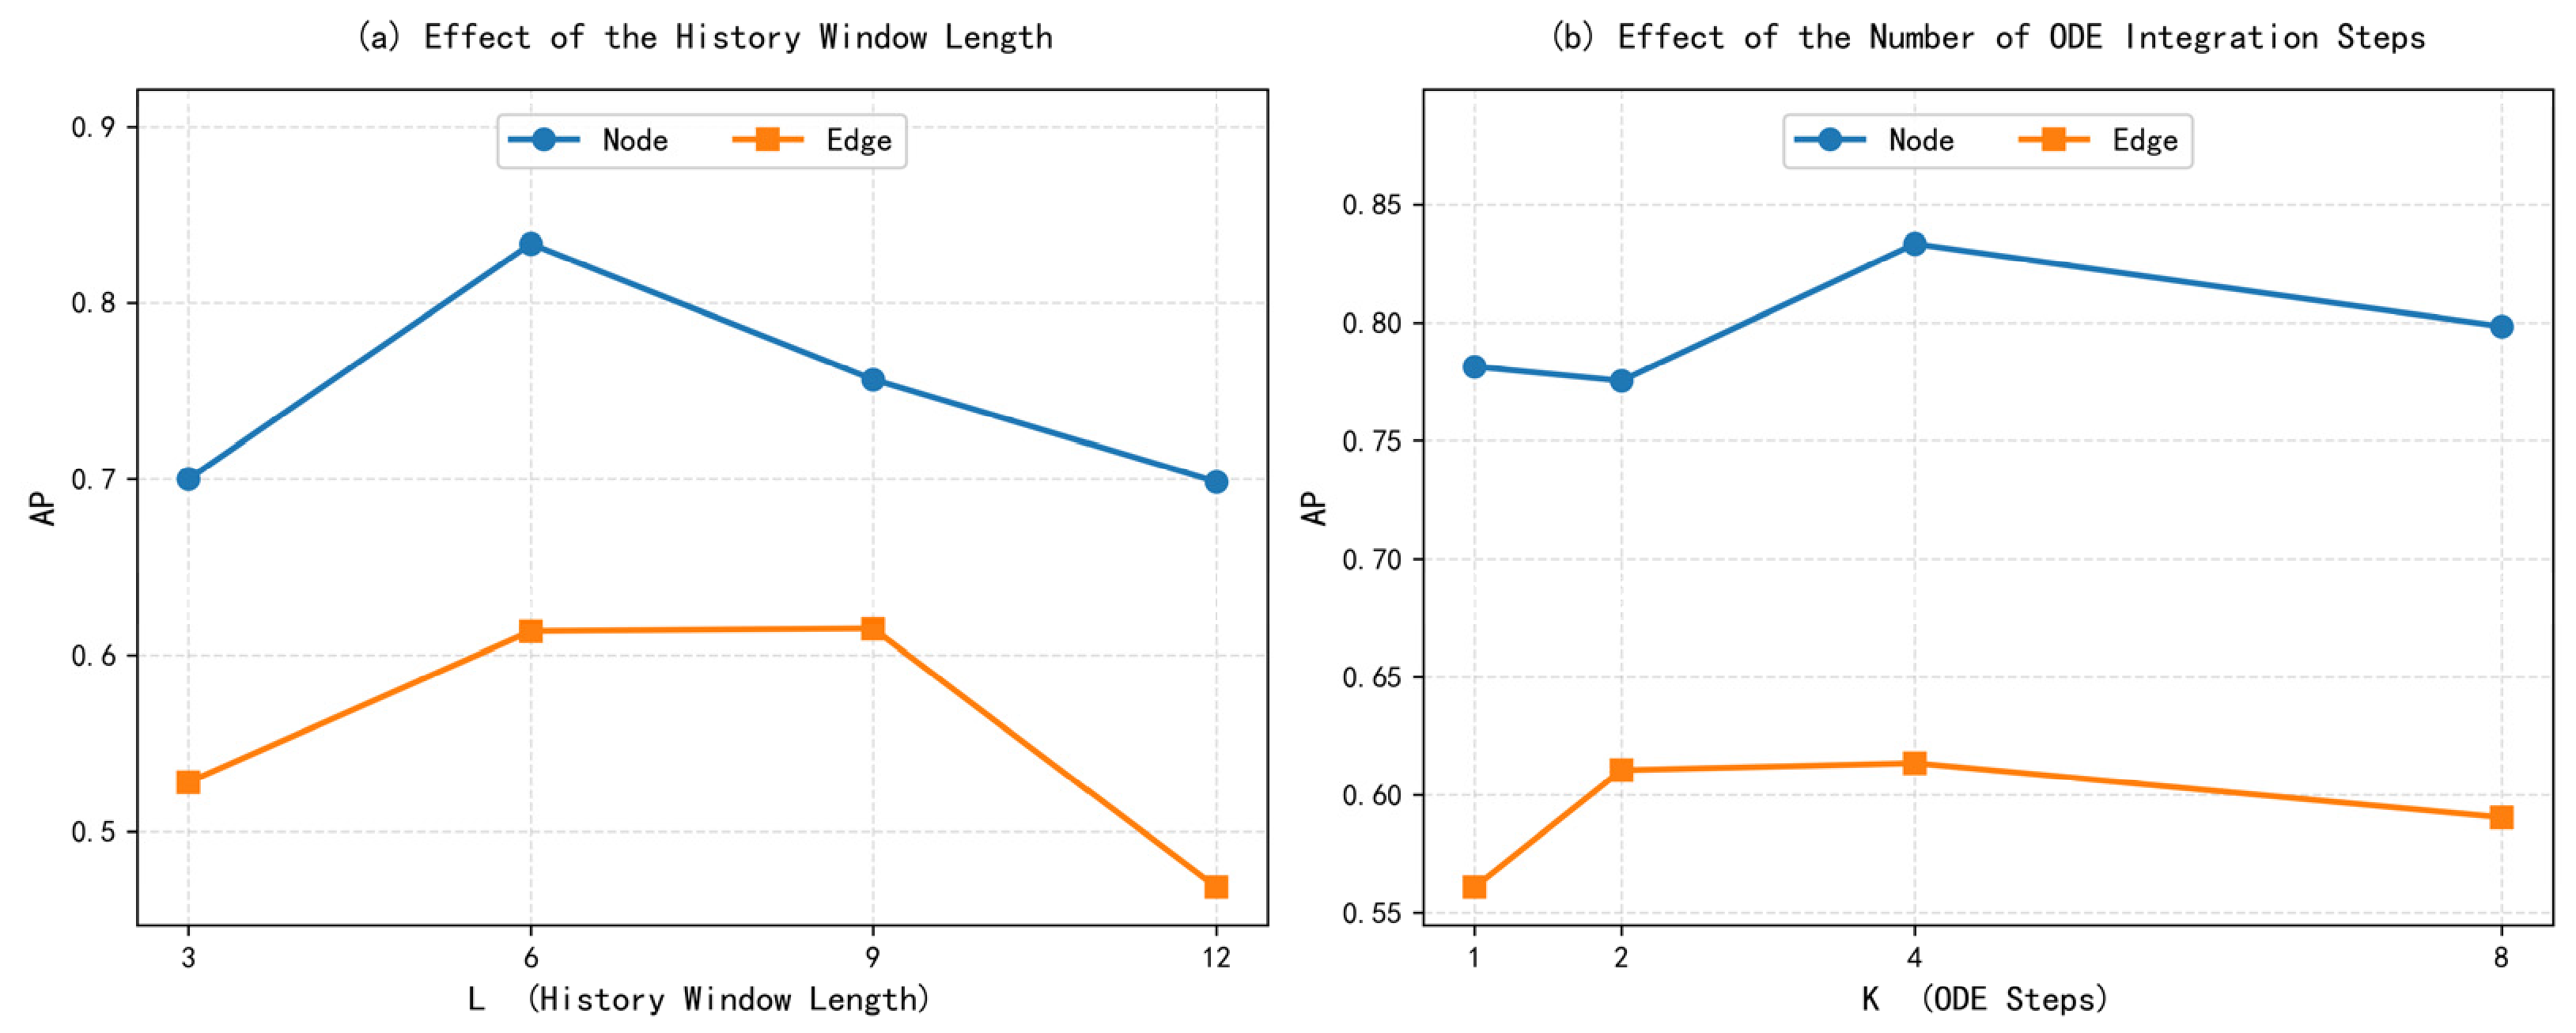
The history window length controls the range of historical context available to the model, while the number of ODE propagation steps determines the accuracy of the discrete approximation to the feature propagation process. The specific time input and step-size settings are described in Section 3.4.2. These two parameters correspond to the historical state encoding module and the attack-context-conditioned continuous propagation module, respectively. We conduct parameter sensitivity experiments on the Friday-PortScan and Wednesday scenarios of CICIDS2017, using the mean AP over the two scenarios as the evaluation criterion. With fixed, ; with , . The integration step size is set to , ensuring that the normalized integration interval has a length of 1 across all settings. All other settings are kept at their default values. The results on the node-level and edge-level tasks are shown in Figure 3.
As shown in Figure 4, the prediction performance generally increases first and then decreases with the history window length. When , the node-level and edge-level AP are only 0.700 and 0.527, respectively, indicating that the available historical temporal information is insufficient to form a complete attack context. When increases to 6, the performance improves markedly, with the node-level AP reaching 0.830 and the edge-level AP reaching 0.613, indicating that an appropriate history window length provides effective information support for risk evolution modeling. When , the AP of both tasks decreases noticeably, to 0.698 and 0.465, respectively. This phenomenon indicates that an excessively long history window introduces a large amount of remote behavioral information unrelated to the current attack stage, dilutes the effective attack signal, and weakens the correlation between the historical state and the attack behavior in the target window; the causal temporal attention and learnable temporal decay mechanisms introduced in this paper effectively filter out such remote and irrelevant information.
Figure 4.
Effect of the history window length and the number of ODE steps on AP. (a) History window length L; (b) the number of ODE integration steps K.
As shown in Figure 4, the influence of the number of ODE integration steps on prediction performance is even more pronounced. When , the attack-context-conditioned continuous propagation degenerates into single-step discrete propagation, and the node-level and edge-level AP are 0.782 and 0.563, respectively, which are the lowest results in this group of experiments. When , the edge-level AP increases markedly to 0.611, indicating that single-step propagation is insufficient to characterize the evolution of risk over continuous time. When , the AP of both tasks reaches the optimum. When , the performance slightly decreases to 0.798 and 0.592. This indicates that, under the current settings, further increasing the number of integration steps does not improve performance. These results demonstrate that the attack-context-conditioned continuous propagation module makes a clear contribution to the prediction performance, and that the improvement is not obtained by stacking network depth or increasing the number of parameters. Combining the two groups of results, the default setting of and achieves a favorable balance between prediction accuracy and computational cost.
4.6. Generalization Performance Analysis
To evaluate the generalization capability of the model, we conduct cross-host generalization experiments on LANL and cross-attack-scenario generalization experiments on CICIDS2017. The compared methods include AC-ODE, w/o Attack Context, GCN-GRU, and Graph ODE.
4.6.1. Cross-Host Performance Analysis
The original chronological splits and graph construction rules are retained, and host masking is used to construct an unseen-host evaluation setting. The features of a randomly selected 20% of hosts are set to zero, and their associated historical interaction edges are removed. Training uses only the remaining hosts and their mutual relations. Hosts masked during training are referred to as unseen hosts. During testing, the complete set of candidate hosts and their interaction edges is restored, and performance is evaluated only on unseen hosts and candidate edges with at least one unseen-host endpoint. The host selection rule remains consistent across all compared models and random seeds.
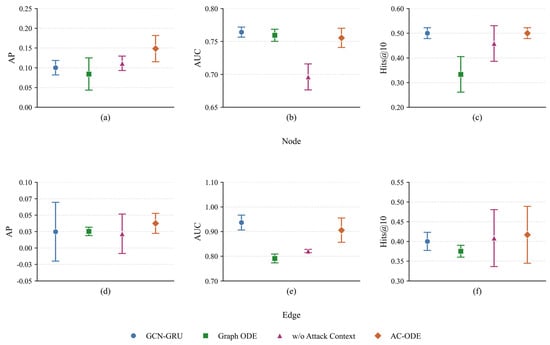
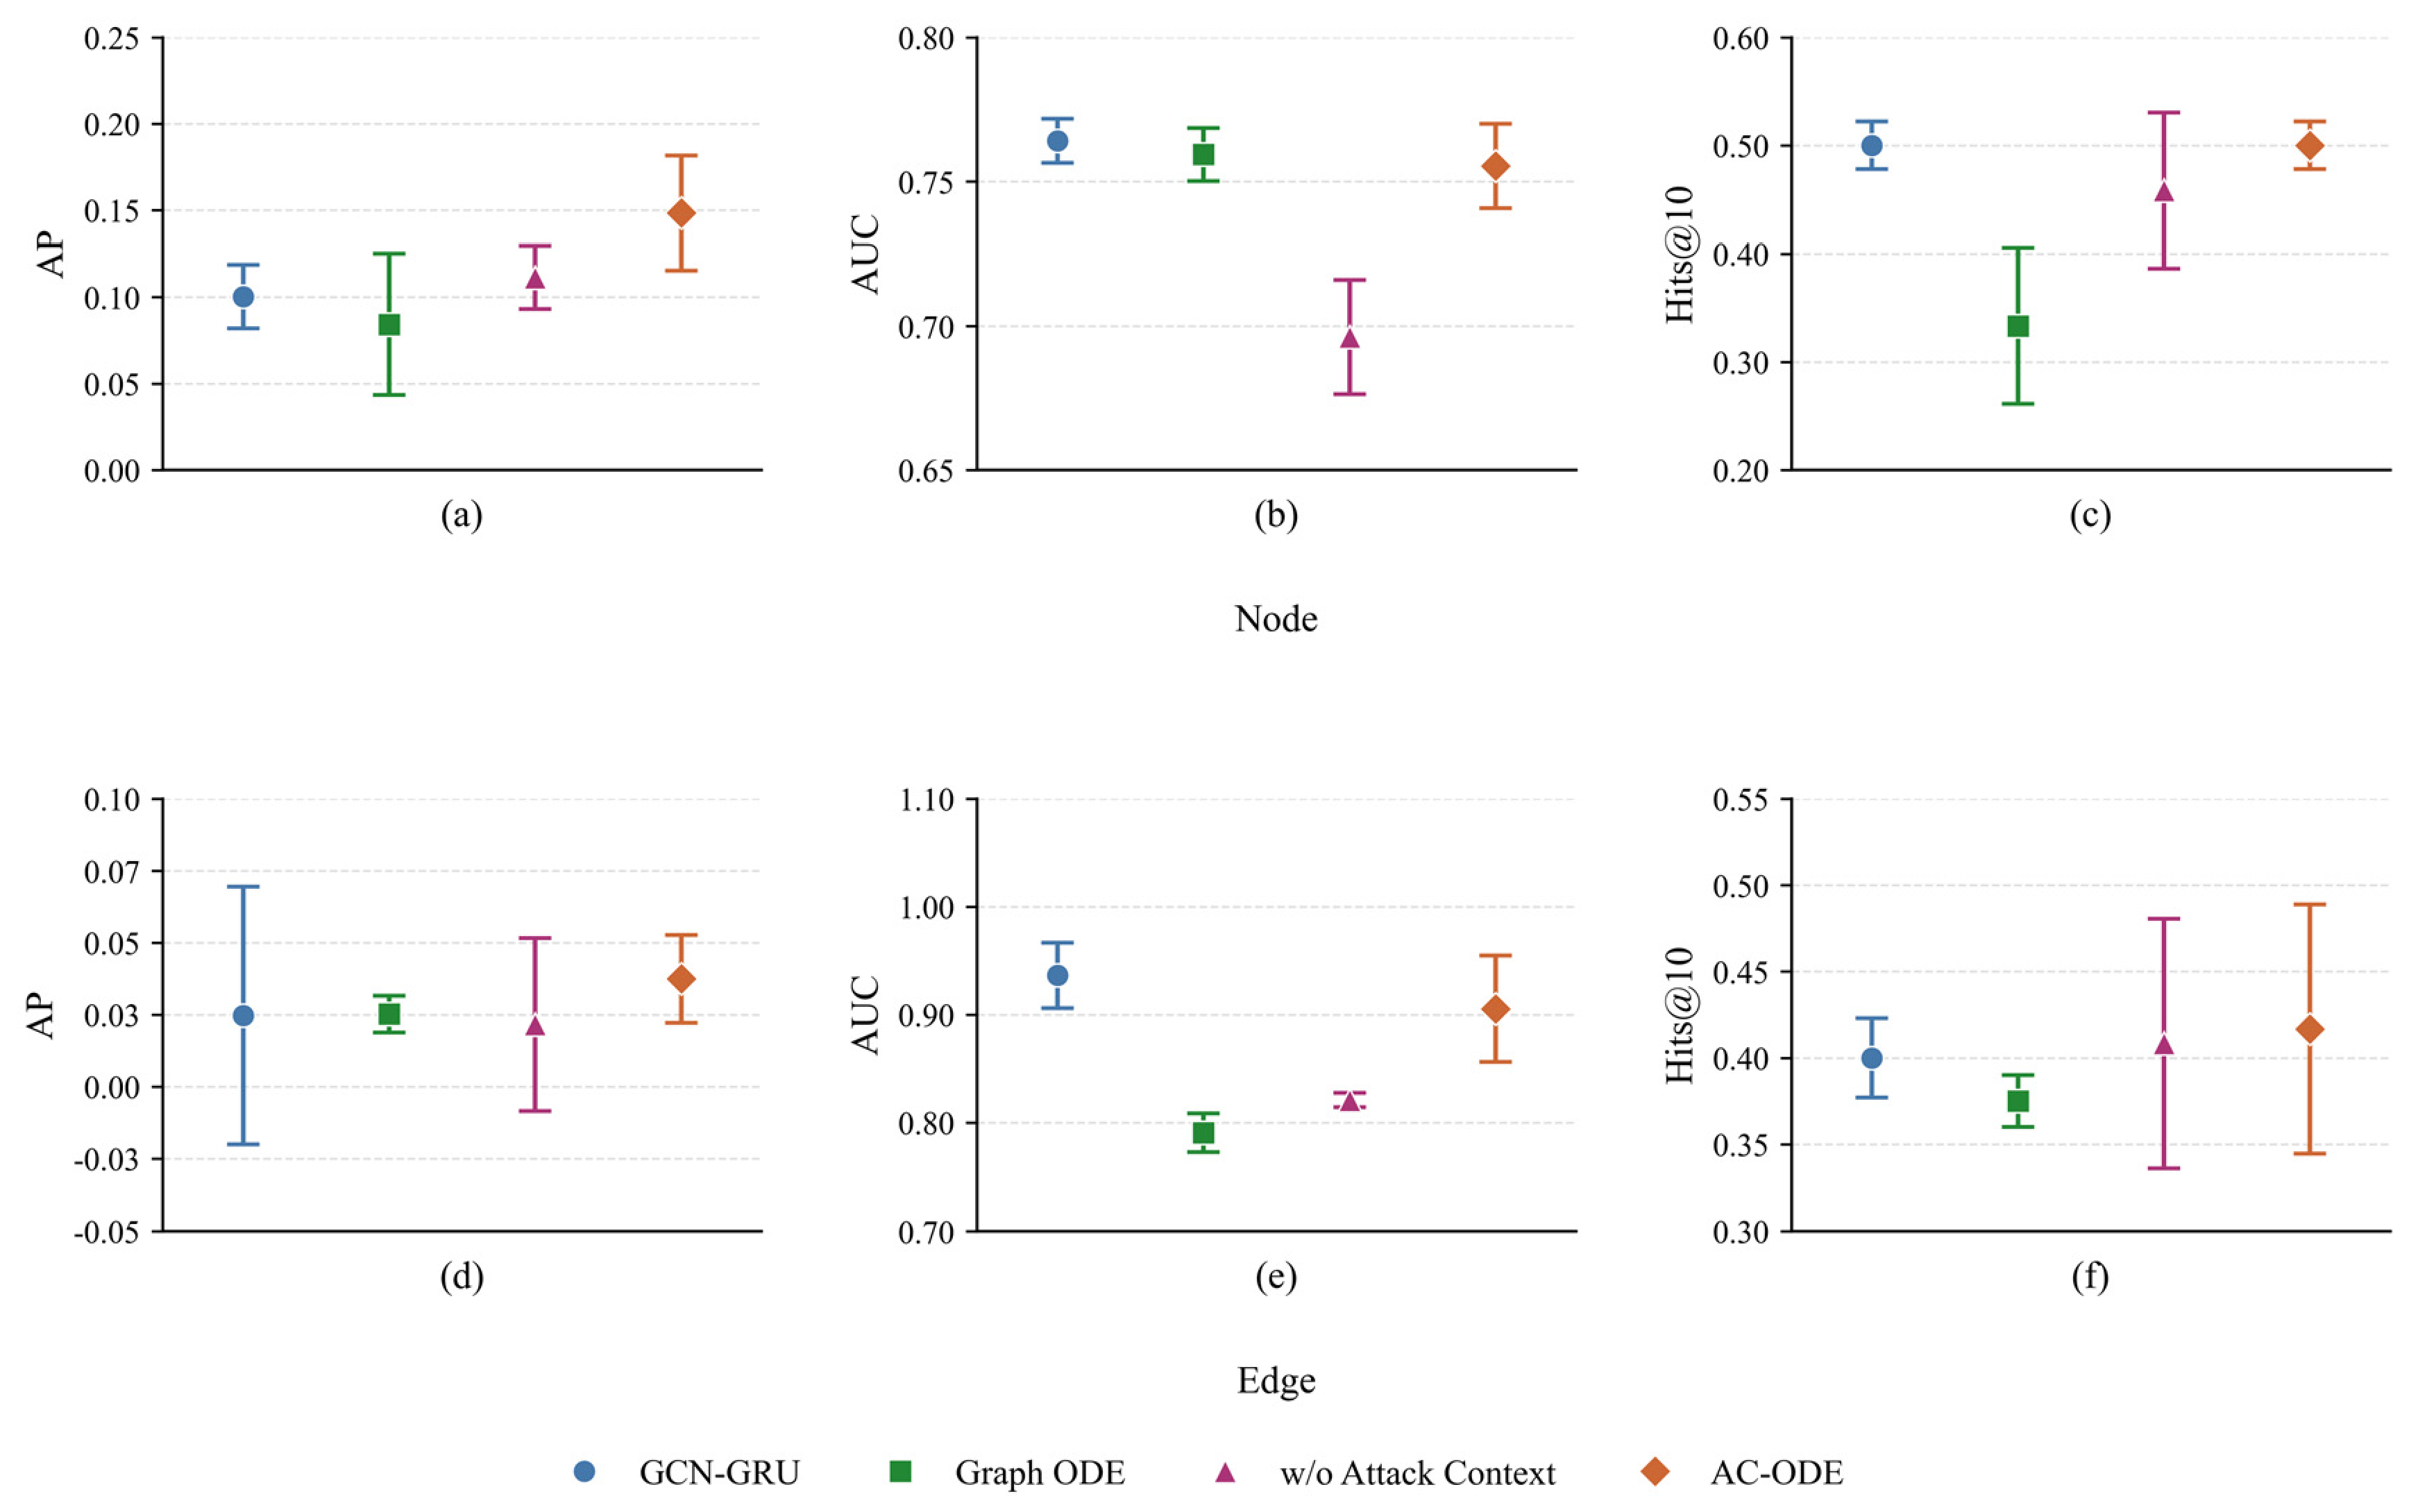
As shown in Figure 5, AC-ODE achieves average node AP and edge AP of 0.149 and 0.037, respectively, obtaining the highest values among the four methods on both metrics. Compared with w/o Attack Context, the two AP values improve by 33.4% and 73.5%, respectively, demonstrating that the attack context mechanism still provides effective risk discrimination under unseen-host conditions.
Figure 5.
Cross-host experimental results under host masking on LANL. (a) Node AP; (b) Node AUC; (c) Node Hits@10; (d) Edge AP; (e) Edge AUC; and (f) Edge Hits@10. Markers indicate mean values, and error bars represent ±1 standard deviation.
4.6.2. Cross-Scenario Performance Analysis
Wednesday in CICIDS2017 is selected as the source scenario and Friday-PortScan as the target scenario to construct a cross-attack-scenario generalization task. Following chronological order, the first 80% of the source scenario is used for training and the remaining 20% for validation, while the available prediction samples from the target scenario are used for final testing.
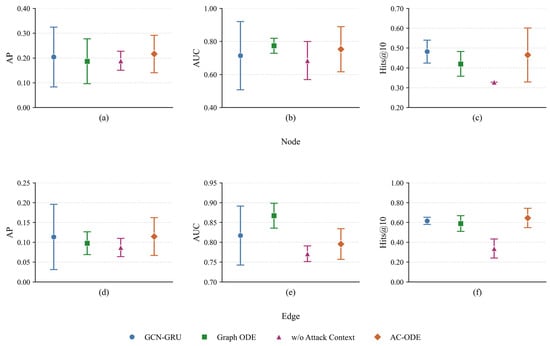
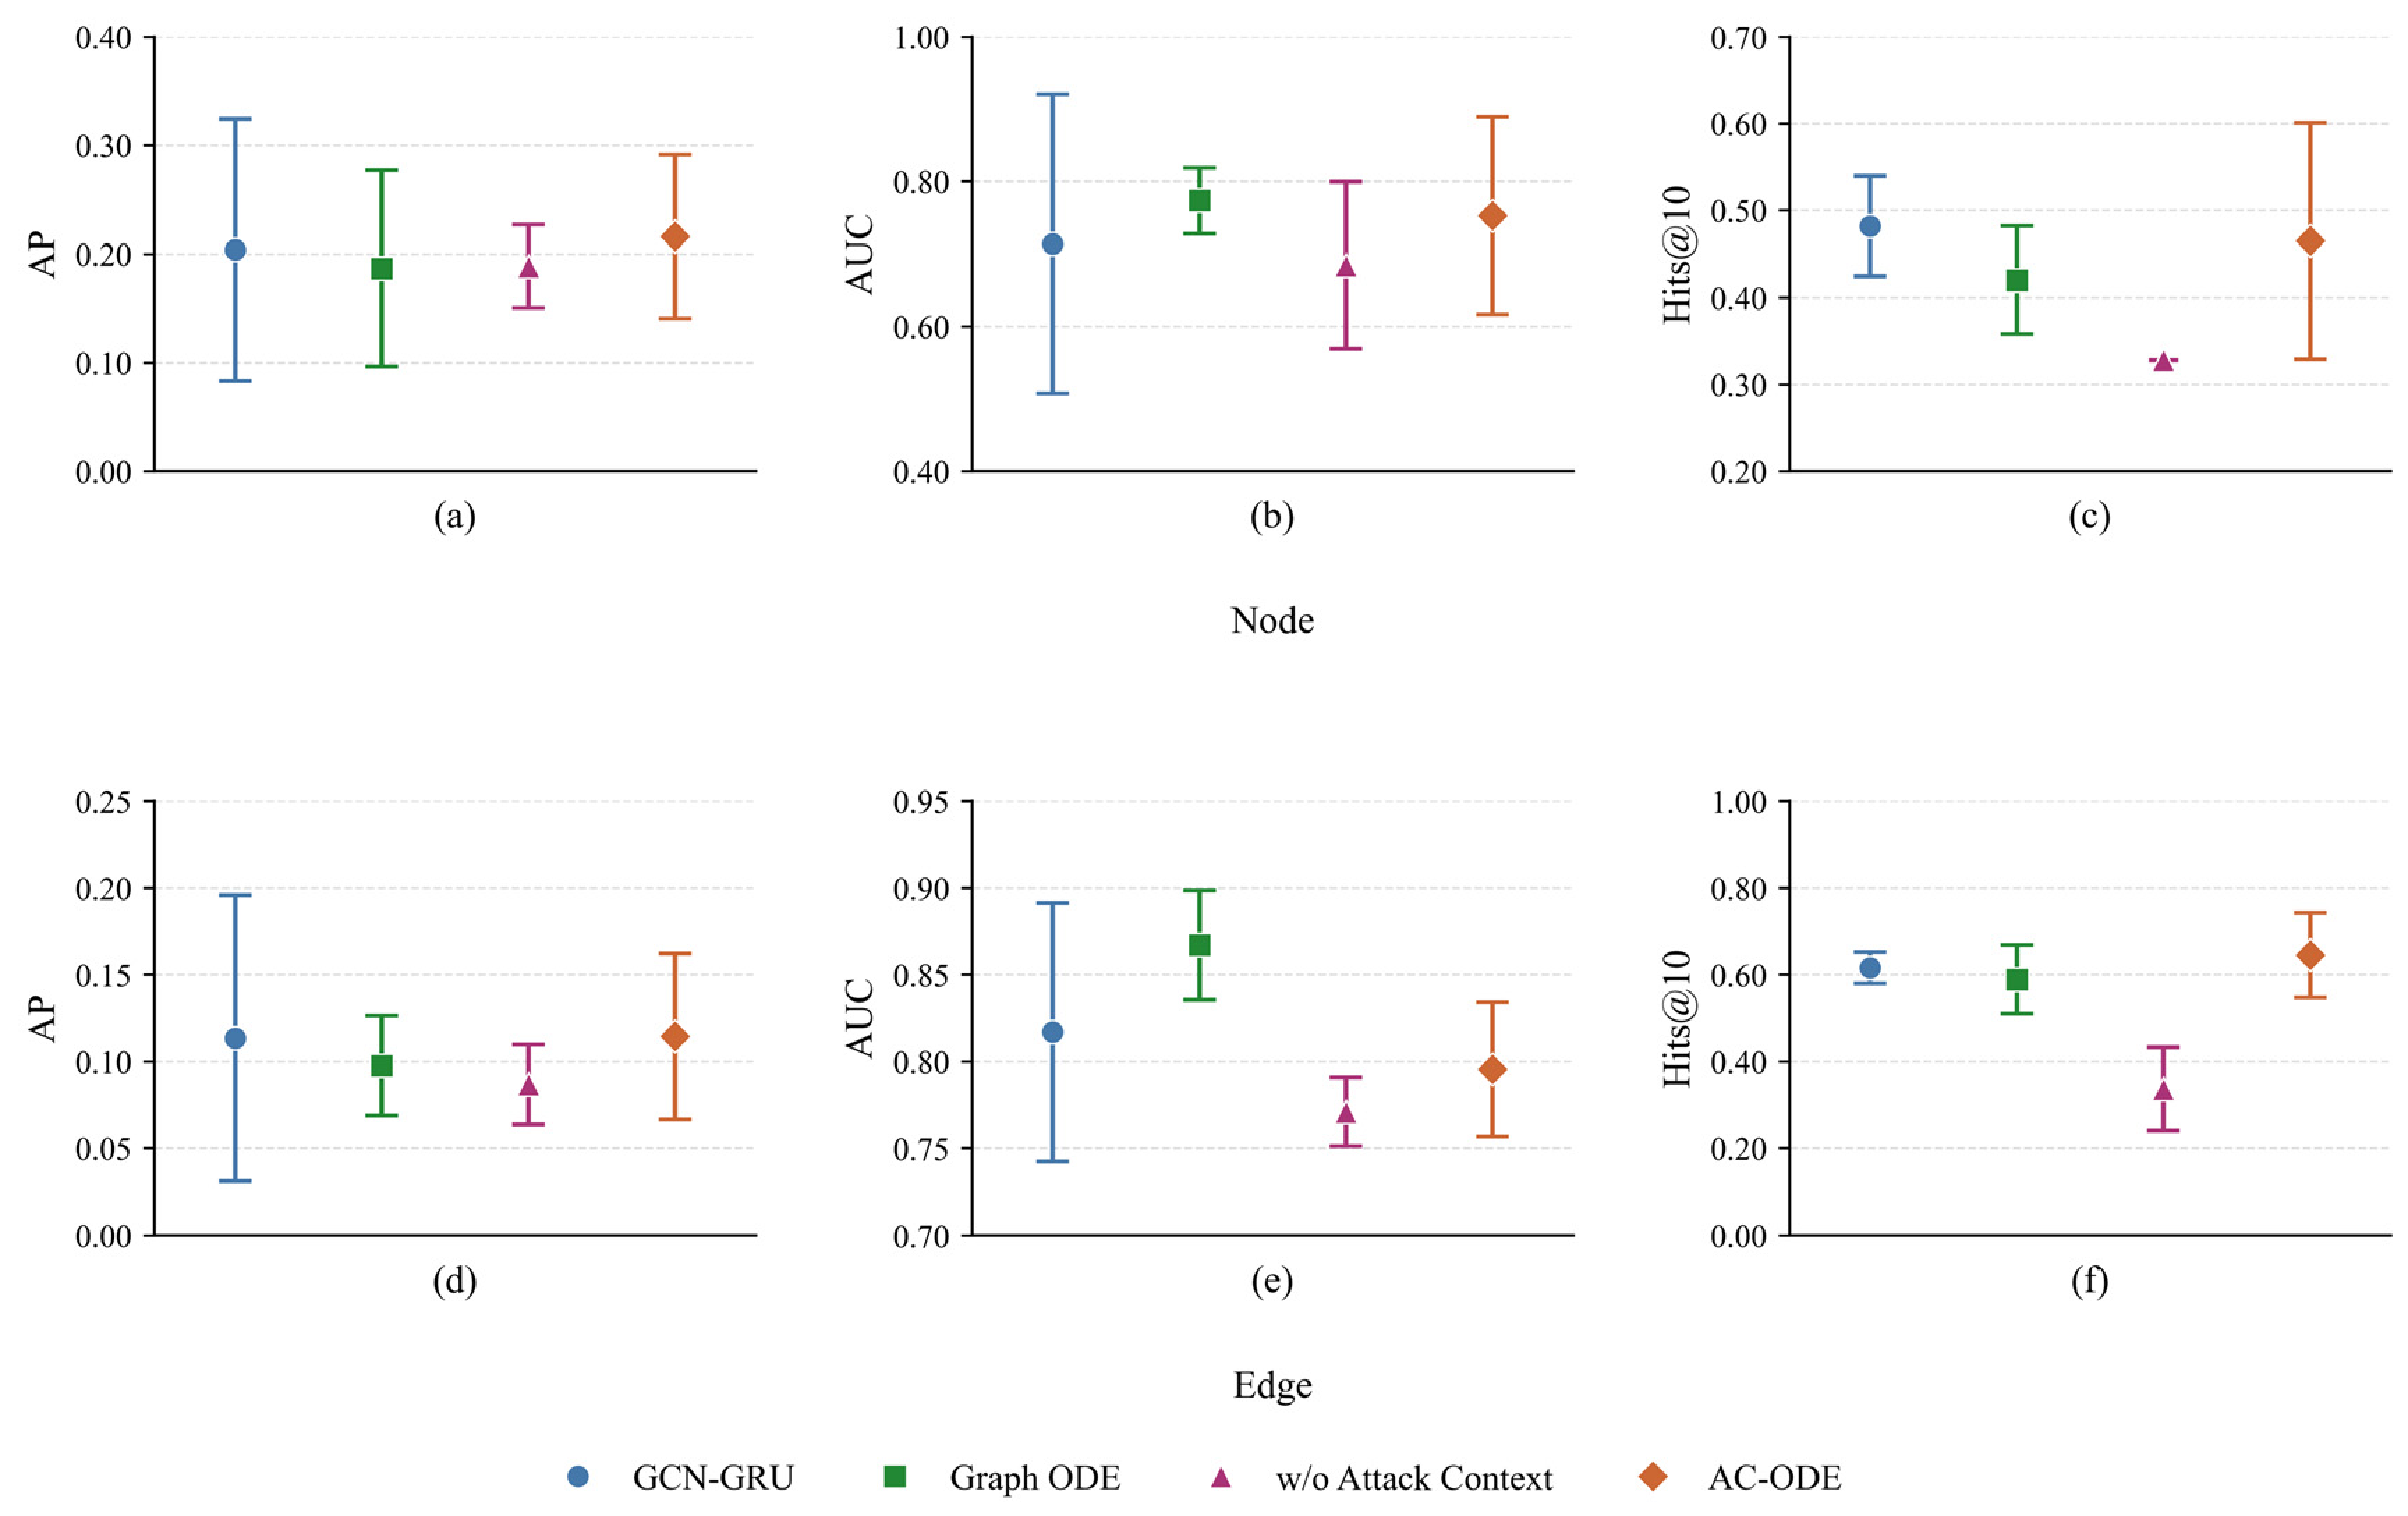
As shown in Figure 6, AC-ODE achieves average node AP and edge AP of 0.216 and 0.114, respectively. Both average AP values exceed those of GCN-GRU and represent relative improvements of 14.6% and 31.9%, respectively, over the variant without attack context, yielding the best performance among all compared methods. These results indicate that AC-ODE retains predictive performance gains under cross-scenario conditions.
Figure 6.
Cross-scenario experimental results on CICIDS2017. (a) Node AP; (b) Node AUC; (c) Node Hits@10; (d) Edge AP; (e) Edge AUC; and (f) Edge Hits@10. Markers indicate mean values, and error bars represent ±1 standard deviation.
4.6.3. Applicability Boundaries and Expected Failure Modes
The cross-host and cross-scenario generalization experiments delineate the applicability boundaries of the model. Although AC-ODE outperforms the compared baselines in both experimental settings, its overall performance remains below that observed in the main experiments. Specifically, node AP decreases more noticeably under cross-host conditions, while both node AP and edge AP decrease substantially under cross-scenario conditions. These results indicate that the model still depends on host behavior patterns and scenario-specific statistical characteristics learned during training.
When previously unseen attacks or host behaviors deviate from the training distribution, the risk propagation weights generated by the context mechanism may not align with attack risk in the target window. Substantial changes in graph topology may also introduce noisy information into historical message aggregation. Furthermore, the retention of historical states through gated fusion may delay responses to changes in risk. These mechanisms provide possible explanations for the observed performance degradation. Future work will further investigate the specific factors affecting model performance.
4.7. Computational Efficiency Analysis
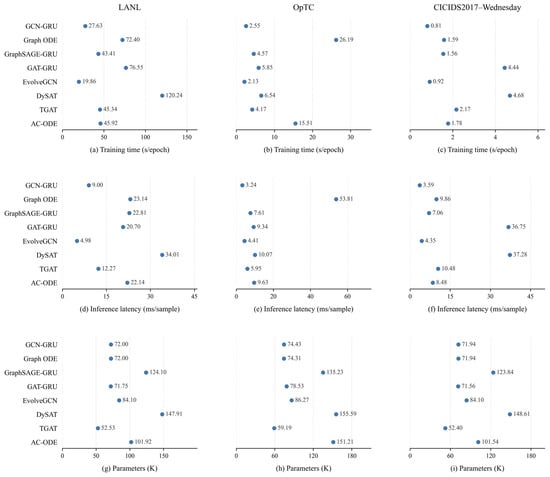
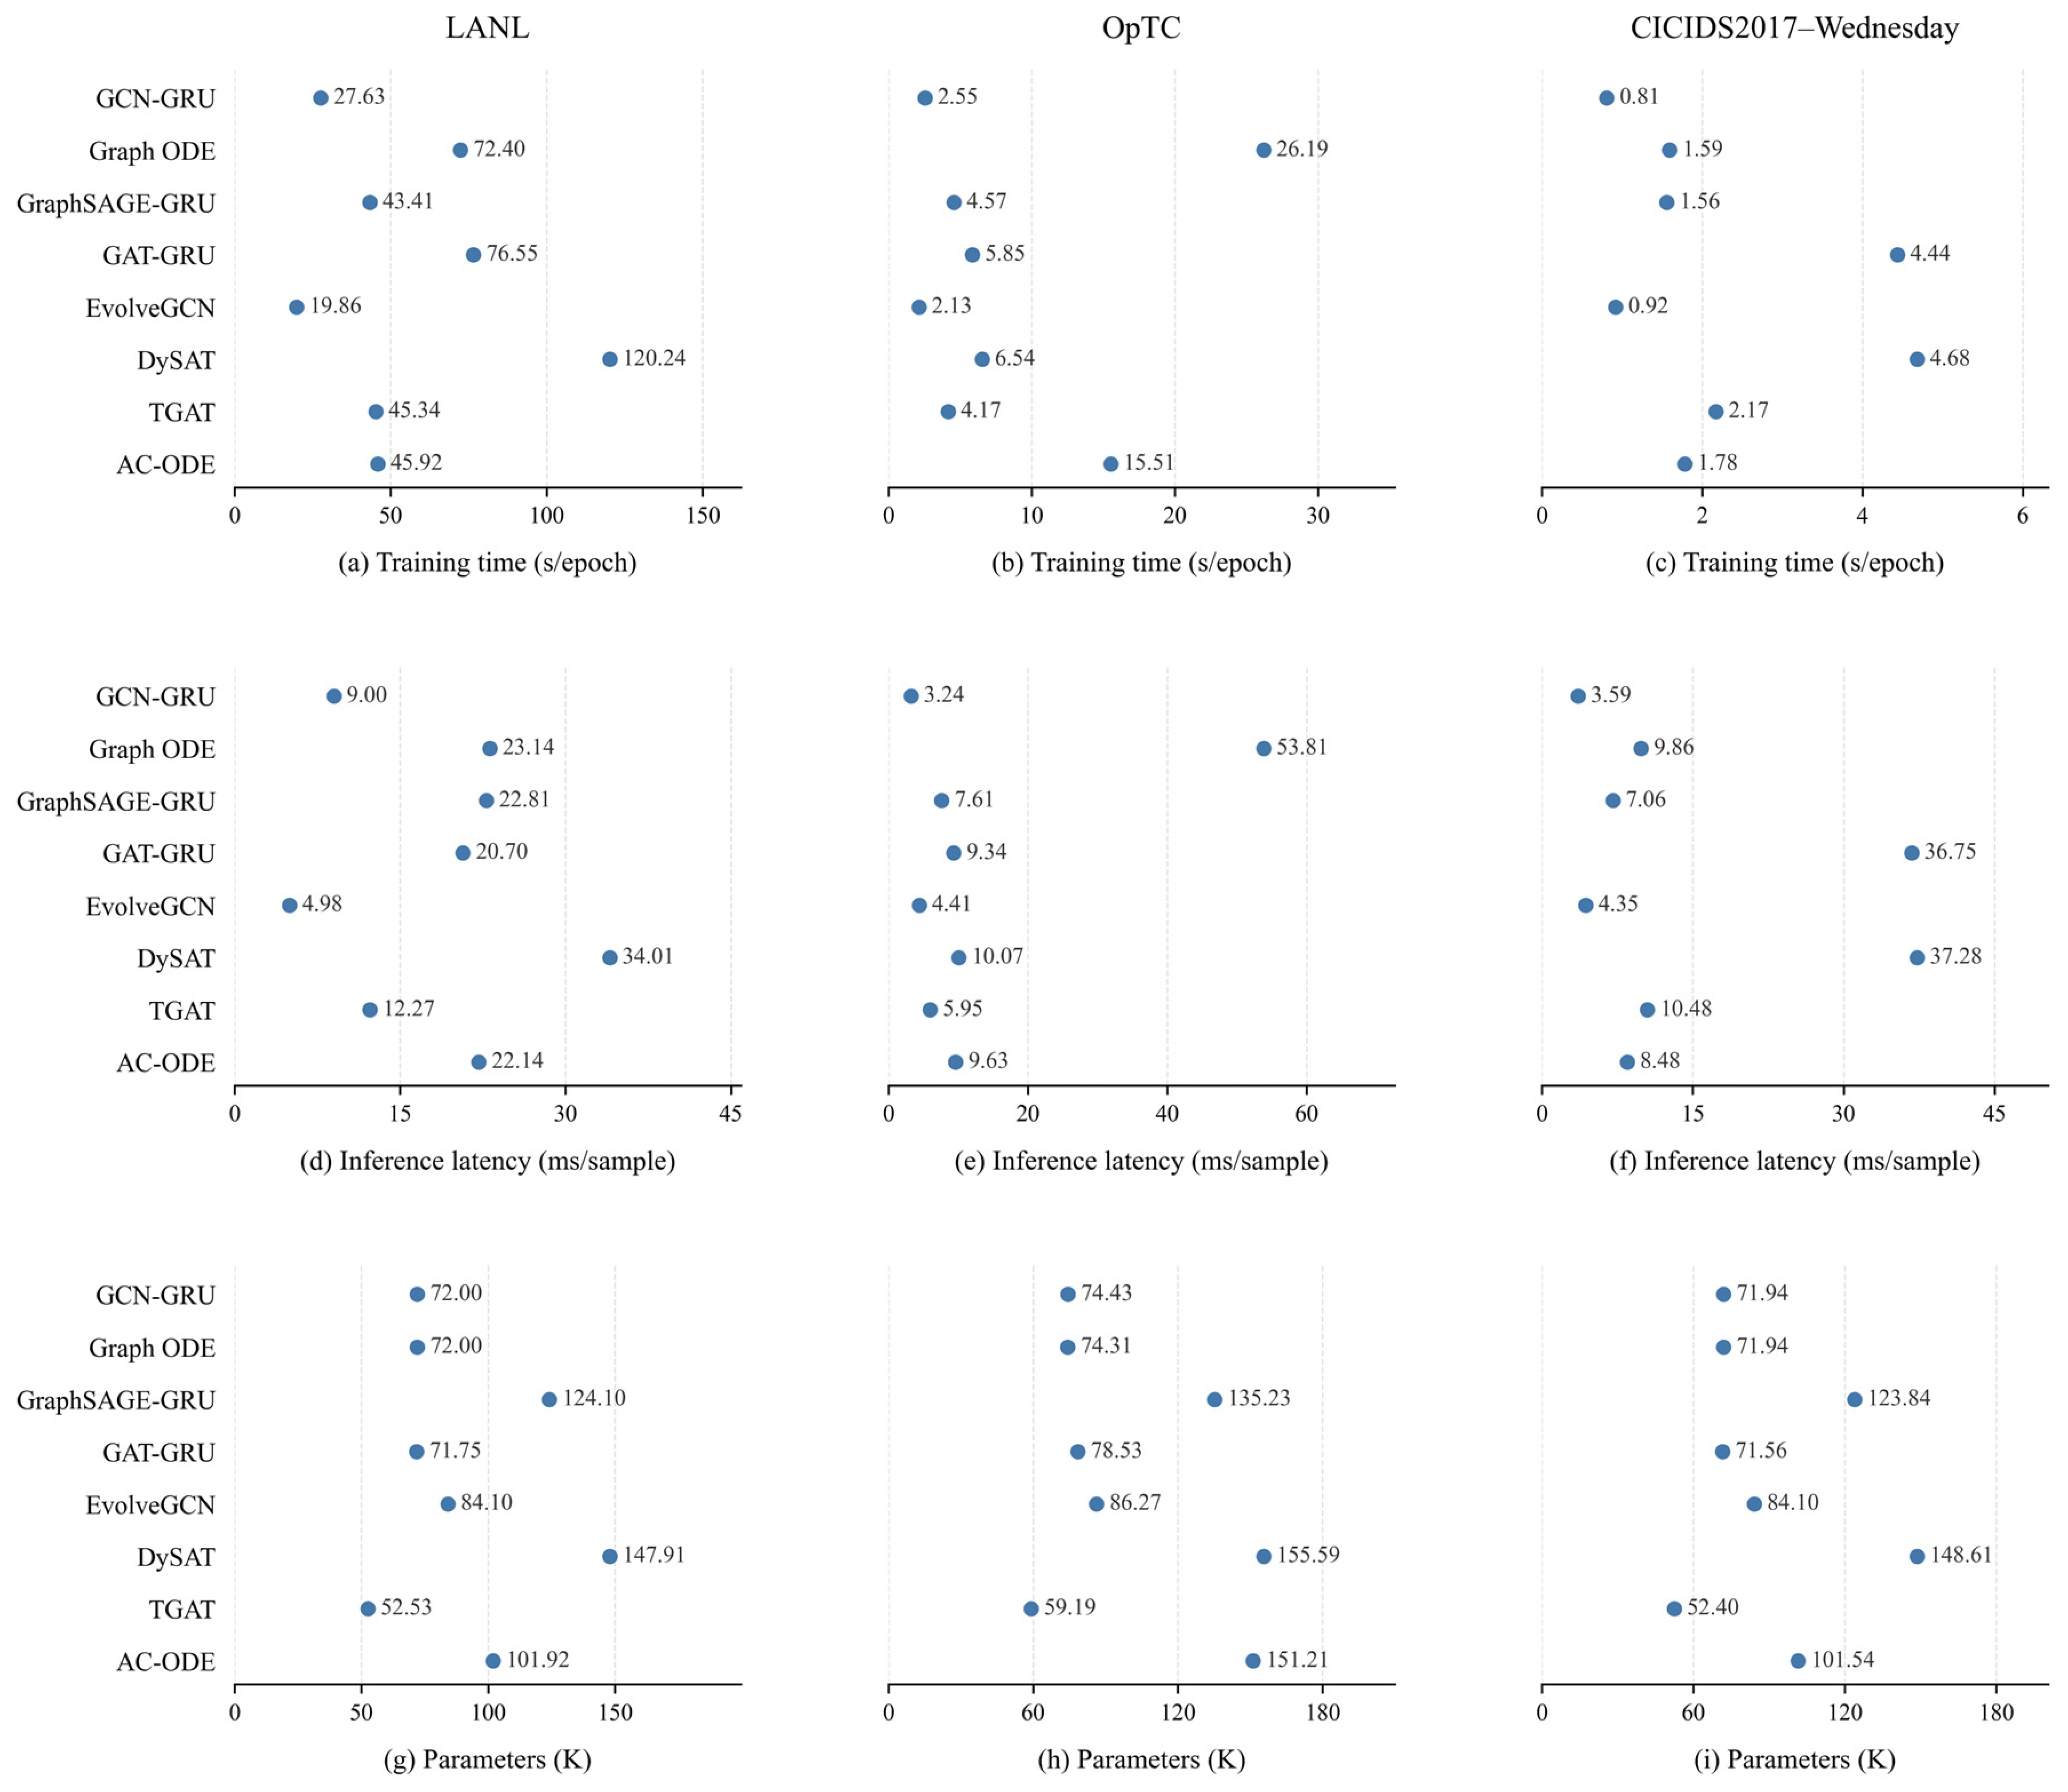
To evaluate the computational overhead of AC-ODE, we measure training time, inference latency, GPU memory usage, and model parameter count on LANL, OpTC, and the Wednesday scenario of CICIDS2017. All measurements are conducted on an RTX 3080 Ti GPU with a batch size of 1 and FP32 precision. Training time is averaged over three complete epochs after model warm-up, covering batch preparation, data transfer, forward computation, backpropagation, and parameter updates, while excluding validation and model saving. Inference latency is measured after loading the best model and performing warm-up, counting only the model forward pass with the inputs already loaded onto the GPU. GPU memory usage is reported as the peak allocated memory during training and inference, and parameter counts are expressed in K.
As shown in Figure 7, AC-ODE has approximately 101.92 K, 151.21 K, and 101.54 K parameters on LANL, OpTC, and Wednesday, respectively. Its average inference latencies are 22.14 ms, 9.63 ms, and 8.48 ms, respectively, all lower than those of Graph ODE. In terms of training efficiency, AC-ODE requires 45.92 s and 15.51 s per epoch on LANL and OpTC, respectively, substantially lower than the corresponding 72.40 s and 26.19 s of Graph ODE. On Wednesday, its training time is 1.78 s per epoch, close to the 1.59 s of Graph ODE.
Figure 7.
Training time, inference latency, and parameter count of different models. The three columns correspond to LANL, OpTC, and CICIDS2017–Wednesday, respectively, while the three rows report training time per epoch, inference latency per sample, and model parameter count.
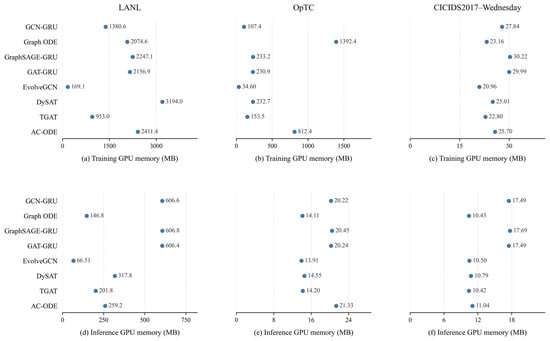
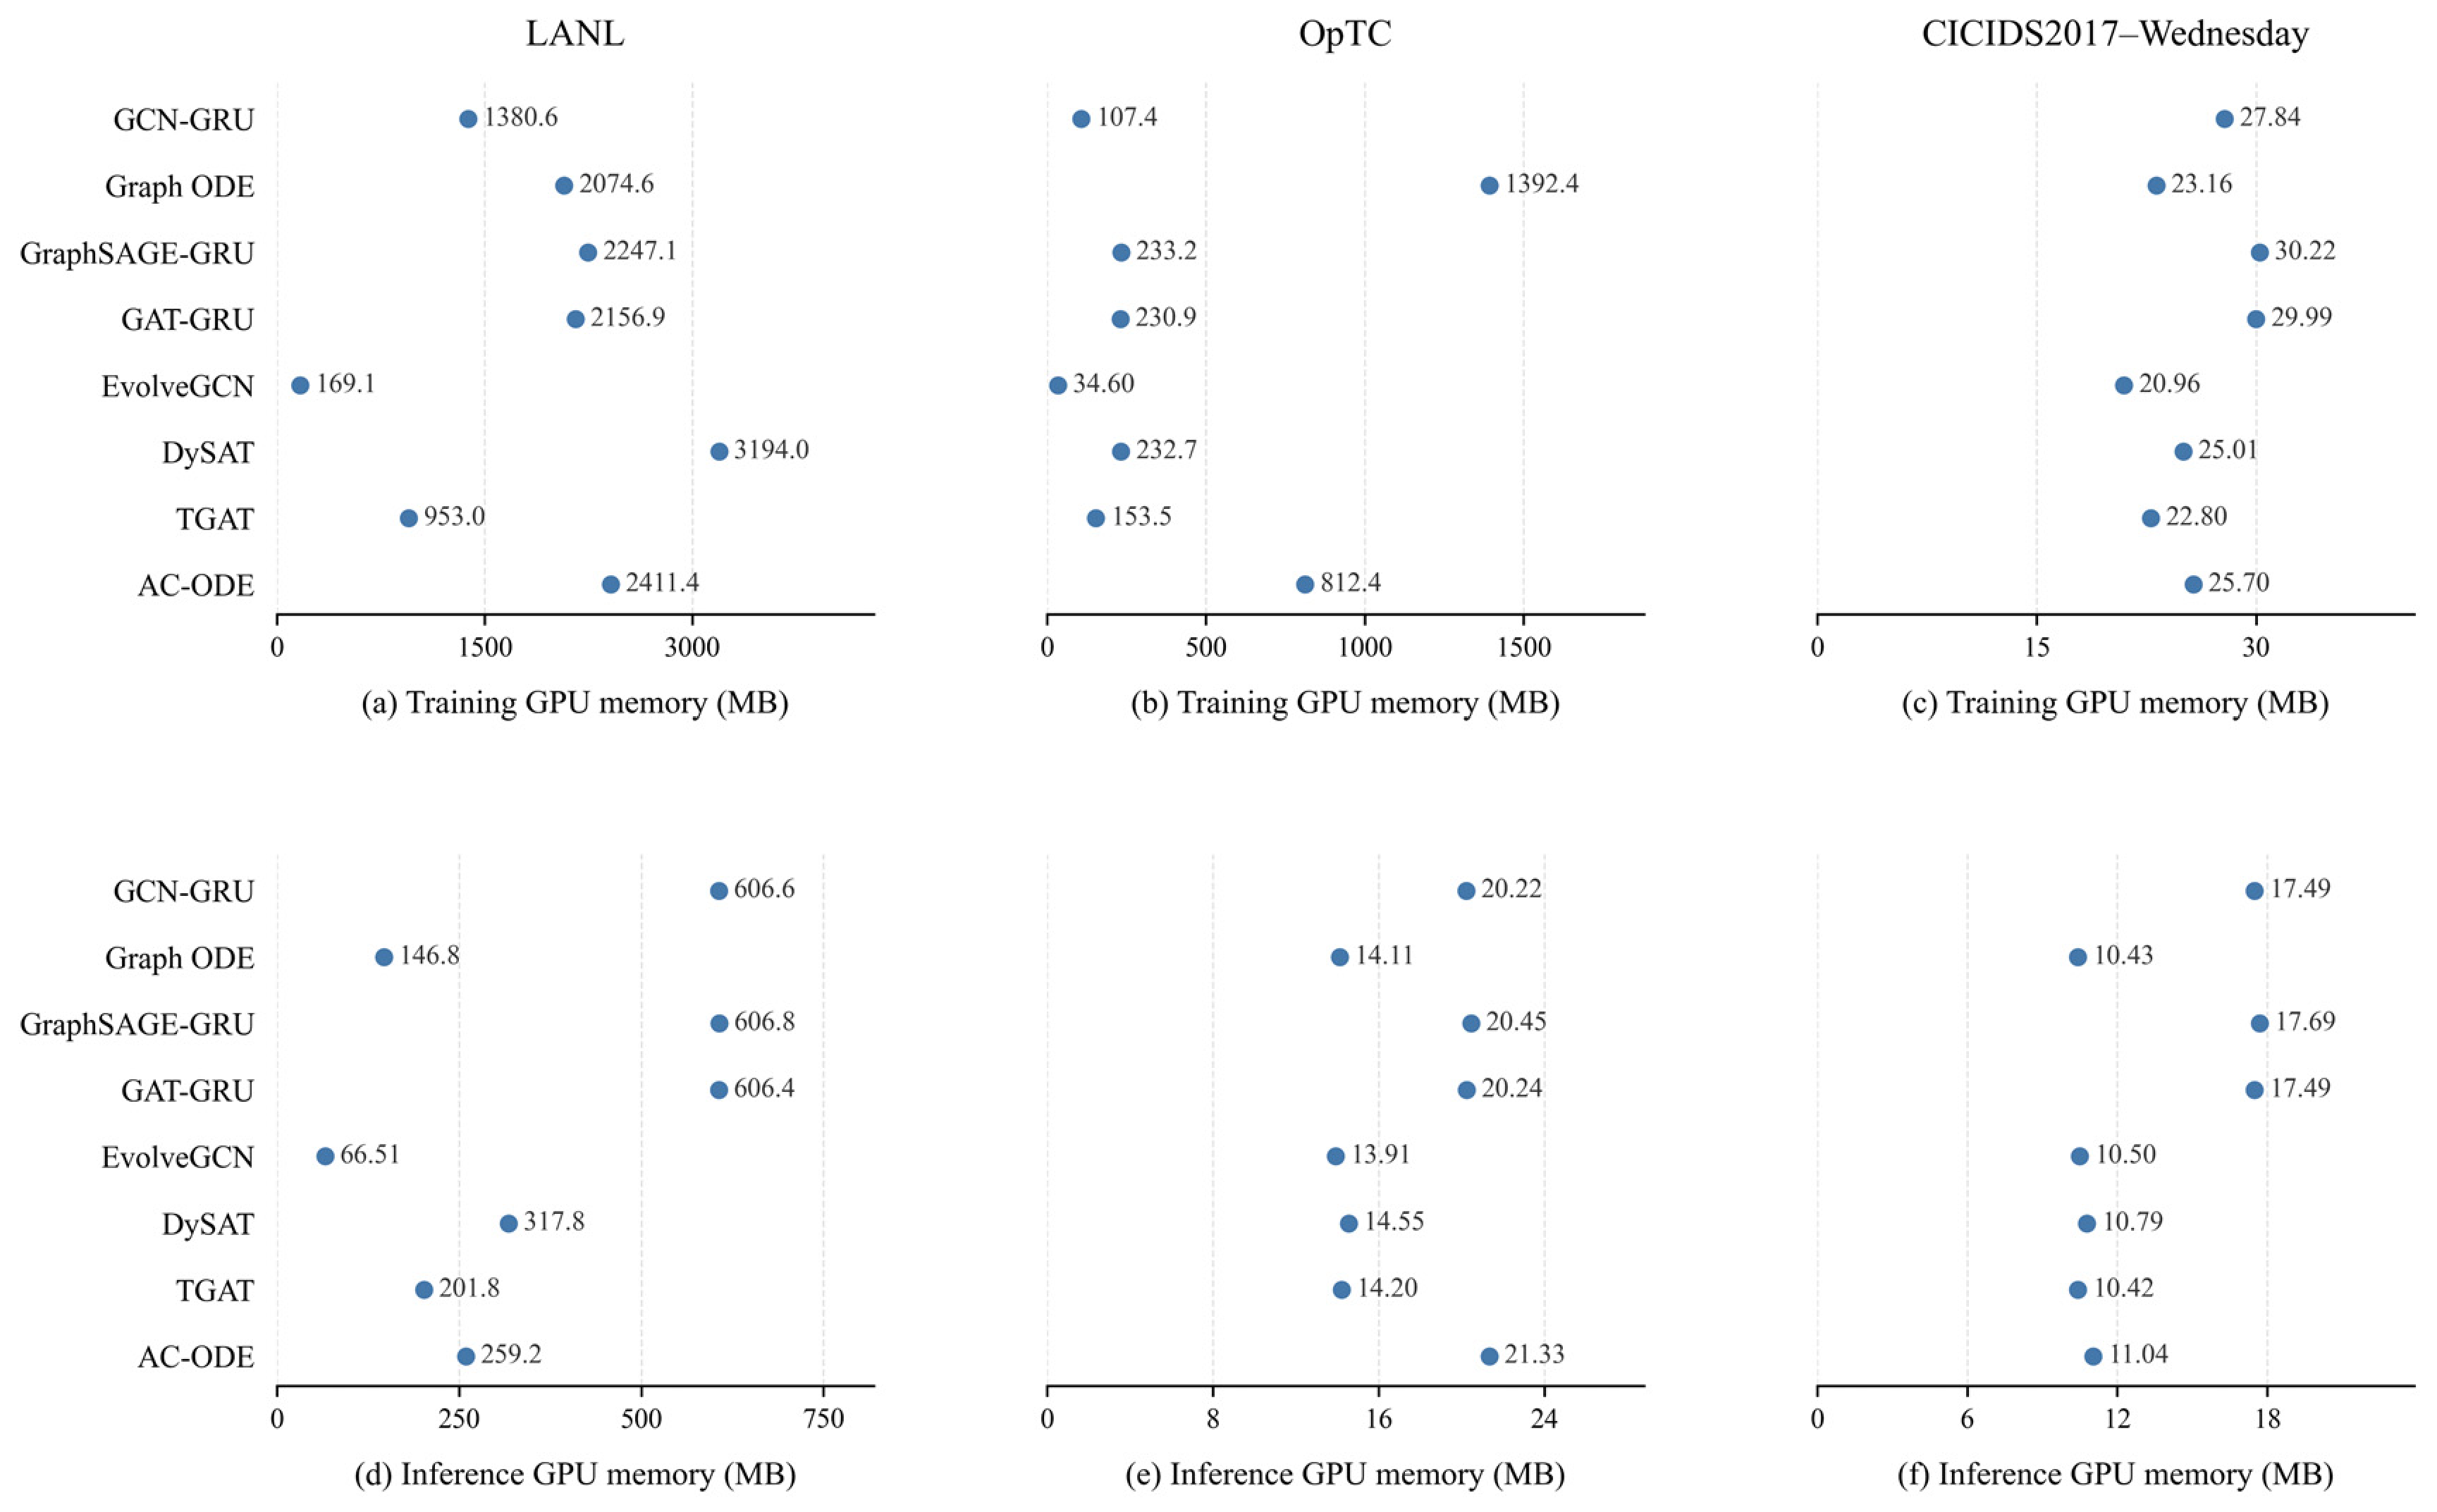
As shown in Figure 8, the peak training GPU memory usage of AC-ODE is 2411.4 MB, 812.4 MB, and 25.7 MB on LANL, OpTC, and Wednesday, respectively, while its peak inference GPU memory usage is 259.2 MB, 21.33 MB, and 11.04 MB. Compared with the baselines, AC-ODE uses less inference memory than GCN-GRU, GraphSAGE-GRU, and GAT-GRU on LANL, and less training memory than Graph ODE on OpTC. On Wednesday, its training and inference memory usage is comparable to that of several baselines. Together with the main experimental results, these findings indicate that AC-ODE achieves better average predictive performance while maintaining millisecond-level model inference latency per sample, providing a favorable balance between predictive performance and computational overhead.
Figure 8.
Training and inference GPU memory usage of different models. The three columns correspond to LANL, OpTC, and CICIDS2017–Wednesday, respectively. The upper and lower rows report peak allocated GPU memory during training and inference, respectively.
5. Conclusions
- To address dynamic network threat prediction, this paper proposes AC-ODE, an attack-context-conditioned ordinary differential equation model that provides a unified framework for node-level risk prediction and edge-level attack propagation prediction. By extracting historical temporal security context through relation-aware historical state encoding, modeling the continuous evolution of latent states on discretely observed graphs using attack-context-conditioned neural ordinary differential equations to characterize changes in attack risk, and introducing a historical–future state gated fusion mechanism, the proposed model improves the stability of prediction under temporal variations in attack behaviors.
- Experimental results on three public datasets—LANL, the DARPA Operationally Transparent Cyber (OpTC) dataset, and CICIDS2017—demonstrate that AC-ODE outperforms multiple baseline methods on both node-level risk prediction and edge-level attack behavior prediction, achieving an edge-level AP of 0.974 on OpTC, a 73.8% improvement over the second-best method; moreover, it exhibits more stable trend fitting during the attack transition and attenuation stages.
- The proposed method provides an effective continuous-time modeling paradigm for threat prediction in dynamic networks. Future work will further improve the modeling of multi-class heterogeneous relations, enhance the model’s cross-scenario generalization capability, and optimize prediction efficiency in large-scale internal network environments, thereby promoting the application of AC-ODE in real-time cybersecurity early-warning systems.
Author Contributions
Conceptualization, C.Z. and W.J.; methodology, C.Z. and W.J.; software, C.Z.; validation, C.Z.; formal analysis, C.Z.; investigation, C.Z.; resources, W.J.; data curation, C.Z.; writing—original draft preparation, C.Z.; writing—review and editing, W.J.; visualization, C.Z.; supervision, W.J.; project administration, W.J. All authors have read and agreed to the published version of the manuscript.
Funding
This research received no external funding.
Data Availability Statement
The datasets analyzed in this study are publicly available from their original sources: LANL at https://csr.lanl.gov/data/cyber1/ (accessed on 2 November 2026); the DARPA OpTC dataset at https://github.com/FiveDirections/OpTC-data (accessed on 2 November 2026); and CICIDS2017 at https://www.unb.ca/cic/datasets/ids-2017.html (accessed on 2 November 2026).
Conflicts of Interest
The authors declare no conflicts of interest.
References
- Gan, C.; Lin, J.; Huang, D.-W.; Zhu, Q.; Tian, L. Advanced Persistent Threats and Their Defense Methods in Industrial Internet of Things: A Survey. Mathematics 2023, 11, 3115. [Google Scholar] [CrossRef] [Scilit]
- Hutchins, E.M.; Cloppert, M.J.; Amin, R.M. Intelligence-Driven Computer Network Defense Informed by Analysis of Adversary Campaigns and Intrusion Kill Chains. Lead. Issues Inf. Warf. Secur. Res. 2011, 1, 80. [Google Scholar]
- Alshamrani, A.; Myneni, S.; Chowdhary, A.; Huang, D. A Survey on Advanced Persistent Threats: Techniques, Solutions, Challenges, and Research Opportunities. IEEE Commun. Surv. Tutor. 2019, 21, 1851–1877. [Google Scholar] [CrossRef] [Scilit]
- Che Mat, N.I.; Jamil, N.; Yusoff, Y.; Mat Kiah, M.L. A Systematic Literature Review on Advanced Persistent Threat Behaviors and Its Detection Strategy. J. Cybersecur. 2024, 10, tyad023. [Google Scholar] [CrossRef] [Scilit]
- Dehghan, M.; Sadeghiyan, B.; Khosravian, E.; Moghaddam, A.S.; Nooshi, F. ProAPT: Projection of APT Threats with Deep Reinforcement Learning. arXiv 2022. [Google Scholar] [CrossRef] [Scilit]
- Zhong, M.; Lin, M.; Zhang, C.; Xu, Z. A Survey on Graph Neural Networks for Intrusion Detection Systems: Methods, Trends and Challenges. Comput. Secur. 2024, 141, 103821. [Google Scholar] [CrossRef] [Scilit]
- Caville, E.; Lo, W.W.; Layeghy, S.; Portmann, M. Anomal-E: A Self-Supervised Network Intrusion Detection System Based on Graph Neural Networks. Knowl.-Based Syst. 2022, 258, 110030. [Google Scholar] [CrossRef] [Scilit]
- Nguyen, H.; Kashef, R. TS-IDS: Traffic-Aware Self-Supervised Learning for IoT Network Intrusion Detection. Knowl.-Based Syst. 2023, 279, 110966. [Google Scholar] [CrossRef] [Scilit]
- Chen, R.T.Q.; Rubanova, Y.; Bettencourt, J.; Duvenaud, D.K. Neural Ordinary Differential Equations. In Proceedings of the Advances in Neural Information Processing Systems; Curran Associates, Inc.: Red Hook, NY, USA, 2018; Volume 31. [Google Scholar]
- Xhonneux, L.-P.; Qu, M.; Tang, J. Continuous Graph Neural Networks. In Proceedings of the 37th International Conference on Machine Learning; PMLR: London, UK, 2020; pp. 10432–10441. [Google Scholar]
- Huang, L.; Pang, B.; Yang, Q.; Feng, X.; Wei, W. Link Prediction by Continuous Spatiotemporal Representation via Neural Differential Equations. Knowl.-Based Syst. 2024, 292, 111619. [Google Scholar] [CrossRef] [Scilit]
- Landauer, M.; Skopik, F.; Stojanović, B.; Flatscher, A.; Ullrich, T. A Review of Time-Series Analysis for Cyber Security Analytics: From Intrusion Detection to Attack Prediction. Int. J. Inf. Secur. 2024, 24, 3. [Google Scholar] [CrossRef] [Scilit]
- Hamilton, W.L.; Ying, R.; Leskovec, J. Inductive Representation Learning on Large Graphs. arXiv 2017. [Google Scholar] [CrossRef] [Scilit]
- Kipf, T.N.; Welling, M. Semi-Supervised Classification with Graph Convolutional Networks. arXiv 2017. [Google Scholar] [CrossRef] [Scilit]
- Veličković, P.; Cucurull, G.; Casanova, A.; Romero, A.; Liò, P.; Bengio, Y. Graph Attention Networks. arXiv 2018. [Google Scholar] [CrossRef] [Scilit]
- Cho, K.; van Merrienboer, B.; Gulcehre, C.; Bahdanau, D.; Bougares, F.; Schwenk, H.; Bengio, Y. Learning Phrase Representations Using RNN Encoder-Decoder for Statistical Machine Translation. arXiv 2014. [Google Scholar] [CrossRef] [Scilit]
- Pareja, A.; Domeniconi, G.; Chen, J.; Ma, T.; Suzumura, T.; Kanezashi, H.; Kaler, T.; Schardl, T.; Leiserson, C. EvolveGCN: Evolving Graph Convolutional Networks for Dynamic Graphs. AAAI 2020, 34, 5363–5370. [Google Scholar] [CrossRef] [Scilit]
- Jiang, W.; Chai, T.; Liu, H.; Wang, K.; Zhang, H. TFLAG:Towards Practical APT Detection via Deviation-Aware Learning on Temporal Provenance Graph. arXiv 2025. [Google Scholar] [CrossRef] [Scilit]
- Guan, F.; Zhu, T.; Zhou, W.; Yu, P.S. Topology-Based Node-Level Membership Inference Attacks on Graph Neural Networks. IEEE Trans. Big Data 2025, 11, 2809–2826. [Google Scholar] [CrossRef] [Scilit]
- Xu, D.; Ruan, C.; Korpeoglu, E.; Kumar, S.; Achan, K. Inductive Representation Learning on Temporal Graphs. arXiv 2020. [Google Scholar] [CrossRef] [Scilit]
- Trivedi, R.; Farajtabar, M.; Biswal, P.; Zha, H. Dyrep: Learning Representations over Dynamic Graphs. arXiv 2019. [Google Scholar] [CrossRef] [Scilit]
- Wu, Z.; Zhan, M.; Zhang, H.; Luo, Q.; Tang, K. MTGCN: A Multi-Task Approach for Node Classification and Link Prediction in Graph Data. Inf. Process. Manag. 2022, 59, 102902. [Google Scholar] [CrossRef] [Scilit]
- Sankar, A.; Wu, Y.; Gou, L.; Zhang, W.; Yang, H. Dynamic Graph Representation Learning via Self-Attention Networks. arXiv 2019. [Google Scholar] [CrossRef] [Scilit]
- Kent, A.D. Cyber Security Data Sources for Dynamic Network Research. In Security Science and Technology; WORLD SCIENTIFIC (EUROPE): London, UK, 2016; Volume 1, pp. 37–65. ISBN 978-1-78634-074-0. [Google Scholar]
- Sharafaldin, I.; Habibi Lashkari, A.; Ghorbani, A.A. Toward Generating a New Intrusion Detection Dataset and Intrusion Traffic Characterization. In Proceedings of the 4th International Conference on Information Systems Security and Privacy; SCITEPRESS—Science and Technology Publications: Funchal, Portugal, 2018; pp. 108–116. [Google Scholar]
- Saito, T.; Rehmsmeier, M. The Precision-Recall Plot Is More Informative than the ROC Plot When Evaluating Binary Classifiers on Imbalanced Datasets. PLoS ONE 2015, 10, e0118432. [Google Scholar] [CrossRef] [Scilit] [PubMed]
- Goyal, A.; Liu, J.; Bates, A.; Wang, G. ORCHID: Streaming Threat Detection over Versioned Provenance Graphs. arXiv 2024. [Google Scholar] [CrossRef] [Scilit]
- Ring, M.; Landes, D.; Hotho, A. Detection of Slow Port Scans in Flow-Based Network Traffic. PLoS ONE 2018, 13, e0204507. [Google Scholar] [CrossRef] [Scilit] [PubMed]
- King, I.J.; Huang, H.H. Euler: Detecting Network Lateral Movement via Scalable Temporal Link Prediction. ACM Trans. Priv. Secur. 2023, 26, 1–36. [Google Scholar] [CrossRef] [Scilit]
- Liu, J.; Shao, Y.; Zhang, S.; Shan, F.; Li, J. UGEA-LMD: A Continuous-Time Dynamic Graph Representation Enhancement Framework for Lateral Movement Detection. Comput. Mater. Contin. 2026, 86, 1–20. [Google Scholar] [CrossRef] [Scilit]
- Terranova, F.; Lahmadi, A.; Chrisment, I. Leveraging Deep Reinforcement Learning for Cyber-Attack Paths Prediction: Formulation, Generalization, and Evaluation. In Proceedings of the 27th International Symposium on Research in Attacks, Intrusions and Defenses; ACM: Padua, Italy, 2024; pp. 1–16. [Google Scholar]

Disclaimer/Publisher’s Note: The statements, opinions and data contained in all publications are solely those of the individual author(s) and contributor(s) and not of MDPI and/or the editor(s). MDPI and/or the editor(s) disclaim responsibility for any injury to people or property resulting from any ideas, methods, instructions or products referred to in the content. |
© 2026 by the authors. Licensee MDPI, Basel, Switzerland. This article is an open access article distributed under the terms and conditions of the Creative Commons Attribution (CC BY) license.