


Abstract
To address the modeling and stability analysis of large-scale renewable energy plants, this paper proposes a K-means-based multi-device clustering and equivalent-model simplification method. A plant comprising 1000 MW wind turbines, a 250 MW/1000 MWh energy storage system, and ±384 Mvar static var generators is represented by five equivalent units connected in parallel. A total terminal-impedance model of the parallel equivalent-unit system is then developed, and its impedance intersections with the grid-side impedance are analyzed to assess the grid-connected stability of the renewable energy plant. Time-domain simulation results validate the accuracy of both the theoretical model and the stability assessment.
1. Introduction
Unlike synchronous generators, power-electronic converters inherently provide neither inertia nor damping. Their wideband control dynamics interact with the grid impedance and may readily excite oscillations from sub-synchronous to super-synchronous frequencies, thereby constraining the grid integration and power transmission of renewable energy. Grid-following (GFL) converters synchronize with the grid through a phase-locked loop (PLL) and operate as controlled current sources; under weak-grid conditions, they are susceptible to instability caused by PLL interactions. Grid-forming (GFM) converters actively establish voltage and phase references through control schemes such as virtual synchronous generator control. Although they provide strong support for weak grids, they may also exhibit low-frequency oscillations in strong grids [1,2]. When GFL and GFM devices operate in parallel, system stability is neither determined by any single device nor guaranteed by each device independently complying with grid-connection standards; devices that are stable in isolation may still render the aggregated system unstable [3,4].
Accordingly, for renewable energy plants containing multiple types and large numbers of converters, a key challenge is to develop an equivalent model that captures broadband small-signal dynamics while remaining tractable for engineering-scale computation, and to use the model to assess system stability and oscillation risks.
Existing small-signal analysis methods can be broadly classified into two categories. Eigenvalue analysis based on linearized state-space models expresses the differential equations of individual control loops in the form of ΔẊ = AΔX, determines stability from the signs of the real parts of the eigenvalues, and relates system parameters to oscillatory modes through participation factors. Ref. [1] derives the stability boundary of a single-converter system from root loci as the short-circuit ratio (SCR) varies, showing that GFL converters are better suited to strong grids, whereas GFM converters are better suited to weak grids. Refs. [3,5] establish 29th- and 33rd-order models, respectively, and quantify how parameters such as PLL bandwidth and virtual inertia can deteriorate system stability. This approach provides precise physical interpretation and can identify the correspondence between specific control parameters and oscillatory modes. However, the model order increases rapidly with the number of devices—a two-device system already reaches an order of 33—and the method relies on white-box models and internal parameters for all devices, which limits its applicability to practical engineering systems.
The second category applies the Nyquist criterion to port-impedance models. In this approach, each device is represented by the impedance matrix at its terminal, and the stability of the device-grid interconnection is assessed by applying the Nyquist criterion to the impedance-ratio matrix [6,7]. Ref. [2] proposes a modular three-port admittance framework and determines the optimal GFM capacity share. Ref. [4] analyzes interaction stability using decomposed impedances in conjunction with a passivity criterion. Ref. [8] uses harmonic linearization to develop sequence-impedance models of GFL and GFM converters that account for positive-/negative-sequence frequency coupling. In Ref. [9], multiple parallel GFL and GFM converters are reduced to a single sequence-impedance matrix at the collector station terminal through impedance summation and admittance inversion, allowing stability to be determined from only two loci for an arbitrary capacity mix. This class of methods does not require access to internal device parameters and is therefore suitable for black-box modeling. When the number of modules or the interconnection topology changes, the system model can be readily reconstructed, making the approach particularly suitable for practical systems containing multiple types of heterogeneous power sources.
Plant-level equivalencing for engineering-scale simulation is an established means of avoiding the rapid growth in model size associated with detailed models. Its basic principle is to reduce an entire plant to a limited number of equivalent units and an appropriately aggregated collector network. Ref. [10] proposes a sequence-impedance equivalencing method for wind farms that accounts for frequency coupling and the collector network. Starting from four simulation requirements—power-angle stability, frequency stability, voltage stability, and multiband power-electronic oscillations—Ref. [11] summarizes the requirements of equivalent models and presents a unified model structure. To trace equivalencing errors in electromechanical-transient studies, Ref. [12] proposes a near/far clustering and aggregation method based on the impedance magnitude between each generating unit and the point of common coupling. For electromagnetic-transient studies, Ref. [13] investigates the effect of active power on frequency-domain impedance and provides a criterion for selecting the number of equivalent units. Ref. [14] clusters wind turbines with similar operating points using K-means clustering and introduces an improved max–min distance method to reduce sensitivity to outliers and initial cluster centers. Refs. [15,16] show that units located closer to the point of common coupling have a greater influence on sub-synchronous resonance and that the equivalent impedance of N identical units connected in parallel is approximately 1/N of the impedance of a single unit. Ref. [17] divides the units into two clusters according to crowbar activation status and corrects the controller reference values of the equivalent units, achieving accuracy comparable to that of a multi-machine equivalent while substantially reducing computation time. Ref. [18] indicates that units should be clustered according to their physical layout and that the collector network should be aggregated according to the equal-power-loss principle.
Nevertheless, the existing studies have two main limitations. First, they are confined to a single type of GFL renewable generation equipment. Refs. [11,12,13,14] all consider either a pure wind farm or a photovoltaic power plant; no previous study has addressed a hybrid plant containing heterogeneous devices such as renewable generators, GFL and grid-forming energy storage systems, and static var generators (SVGs). Second, equivalent modeling and stability assessment are treated separately. The accuracy of an equivalent model is evaluated in terms of time-domain responses and the magnitude and phase errors of its impedance, without being directly linked to a stability criterion, and the stability of the equivalent system is not subsequently assessed.
To address these limitations, this paper investigates equivalent modeling and oscillation-risk assessment for a large-scale renewable energy plant with multiple heterogeneous converter-interfaced devices, using the China Resources Santanghu Wind Power and Energy Storage Project in Xinjiang, China, as a case study. First, a renewable energy plant equivalencing method based on K-means clustering is proposed. The method maximally simplifies the plant model while preserving its external control-dynamic characteristics and the differences in critical electrical distances. Second, a unified sequence-impedance representation is established for four types of heterogeneous equivalent units: a GFL doubly fed induction generator (GFL-DFIG), a GFL energy storage system (GFL-ESS), a grid-forming energy storage system (GFM-ESS), and a GFL-SVG. A composite sequence-impedance model of the entire plant is then derived according to the port admittance aggregation rule and validated against time-domain frequency-sweep results over the frequency range of 0.1–1000 Hz. Finally, the Nyquist criterion is used to quantitatively determine the magnitude crossover frequencies between the plant and grid impedances and the corresponding phase stability margins, and the results are verified by time-domain simulations.
2. Cluster-Based Equivalencing and Impedance Modeling of the Renewable Energy Plant
2.1. Renewable Energy Plant Equivalencing Method Based on K-Means Clustering
The China Resources Santanghu Wind Power and Energy Storage Project comprises multiple device types, has a large installed capacity, and features significant differences among collector-network topologies. Directly developing a detailed model of the plant for simulation would therefore entail an enormous workload. Accordingly, this section proposes a plant-level equivalencing method for engineering practice, which serves as the basis for impedance-based stability analysis and the development of the time-domain simulation model.
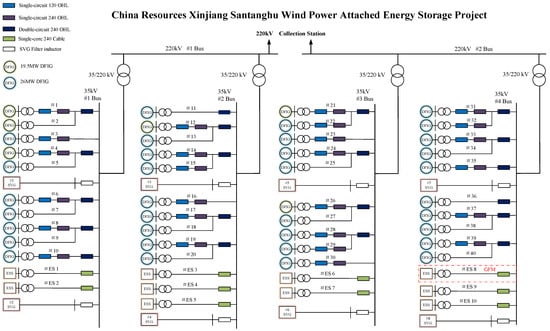
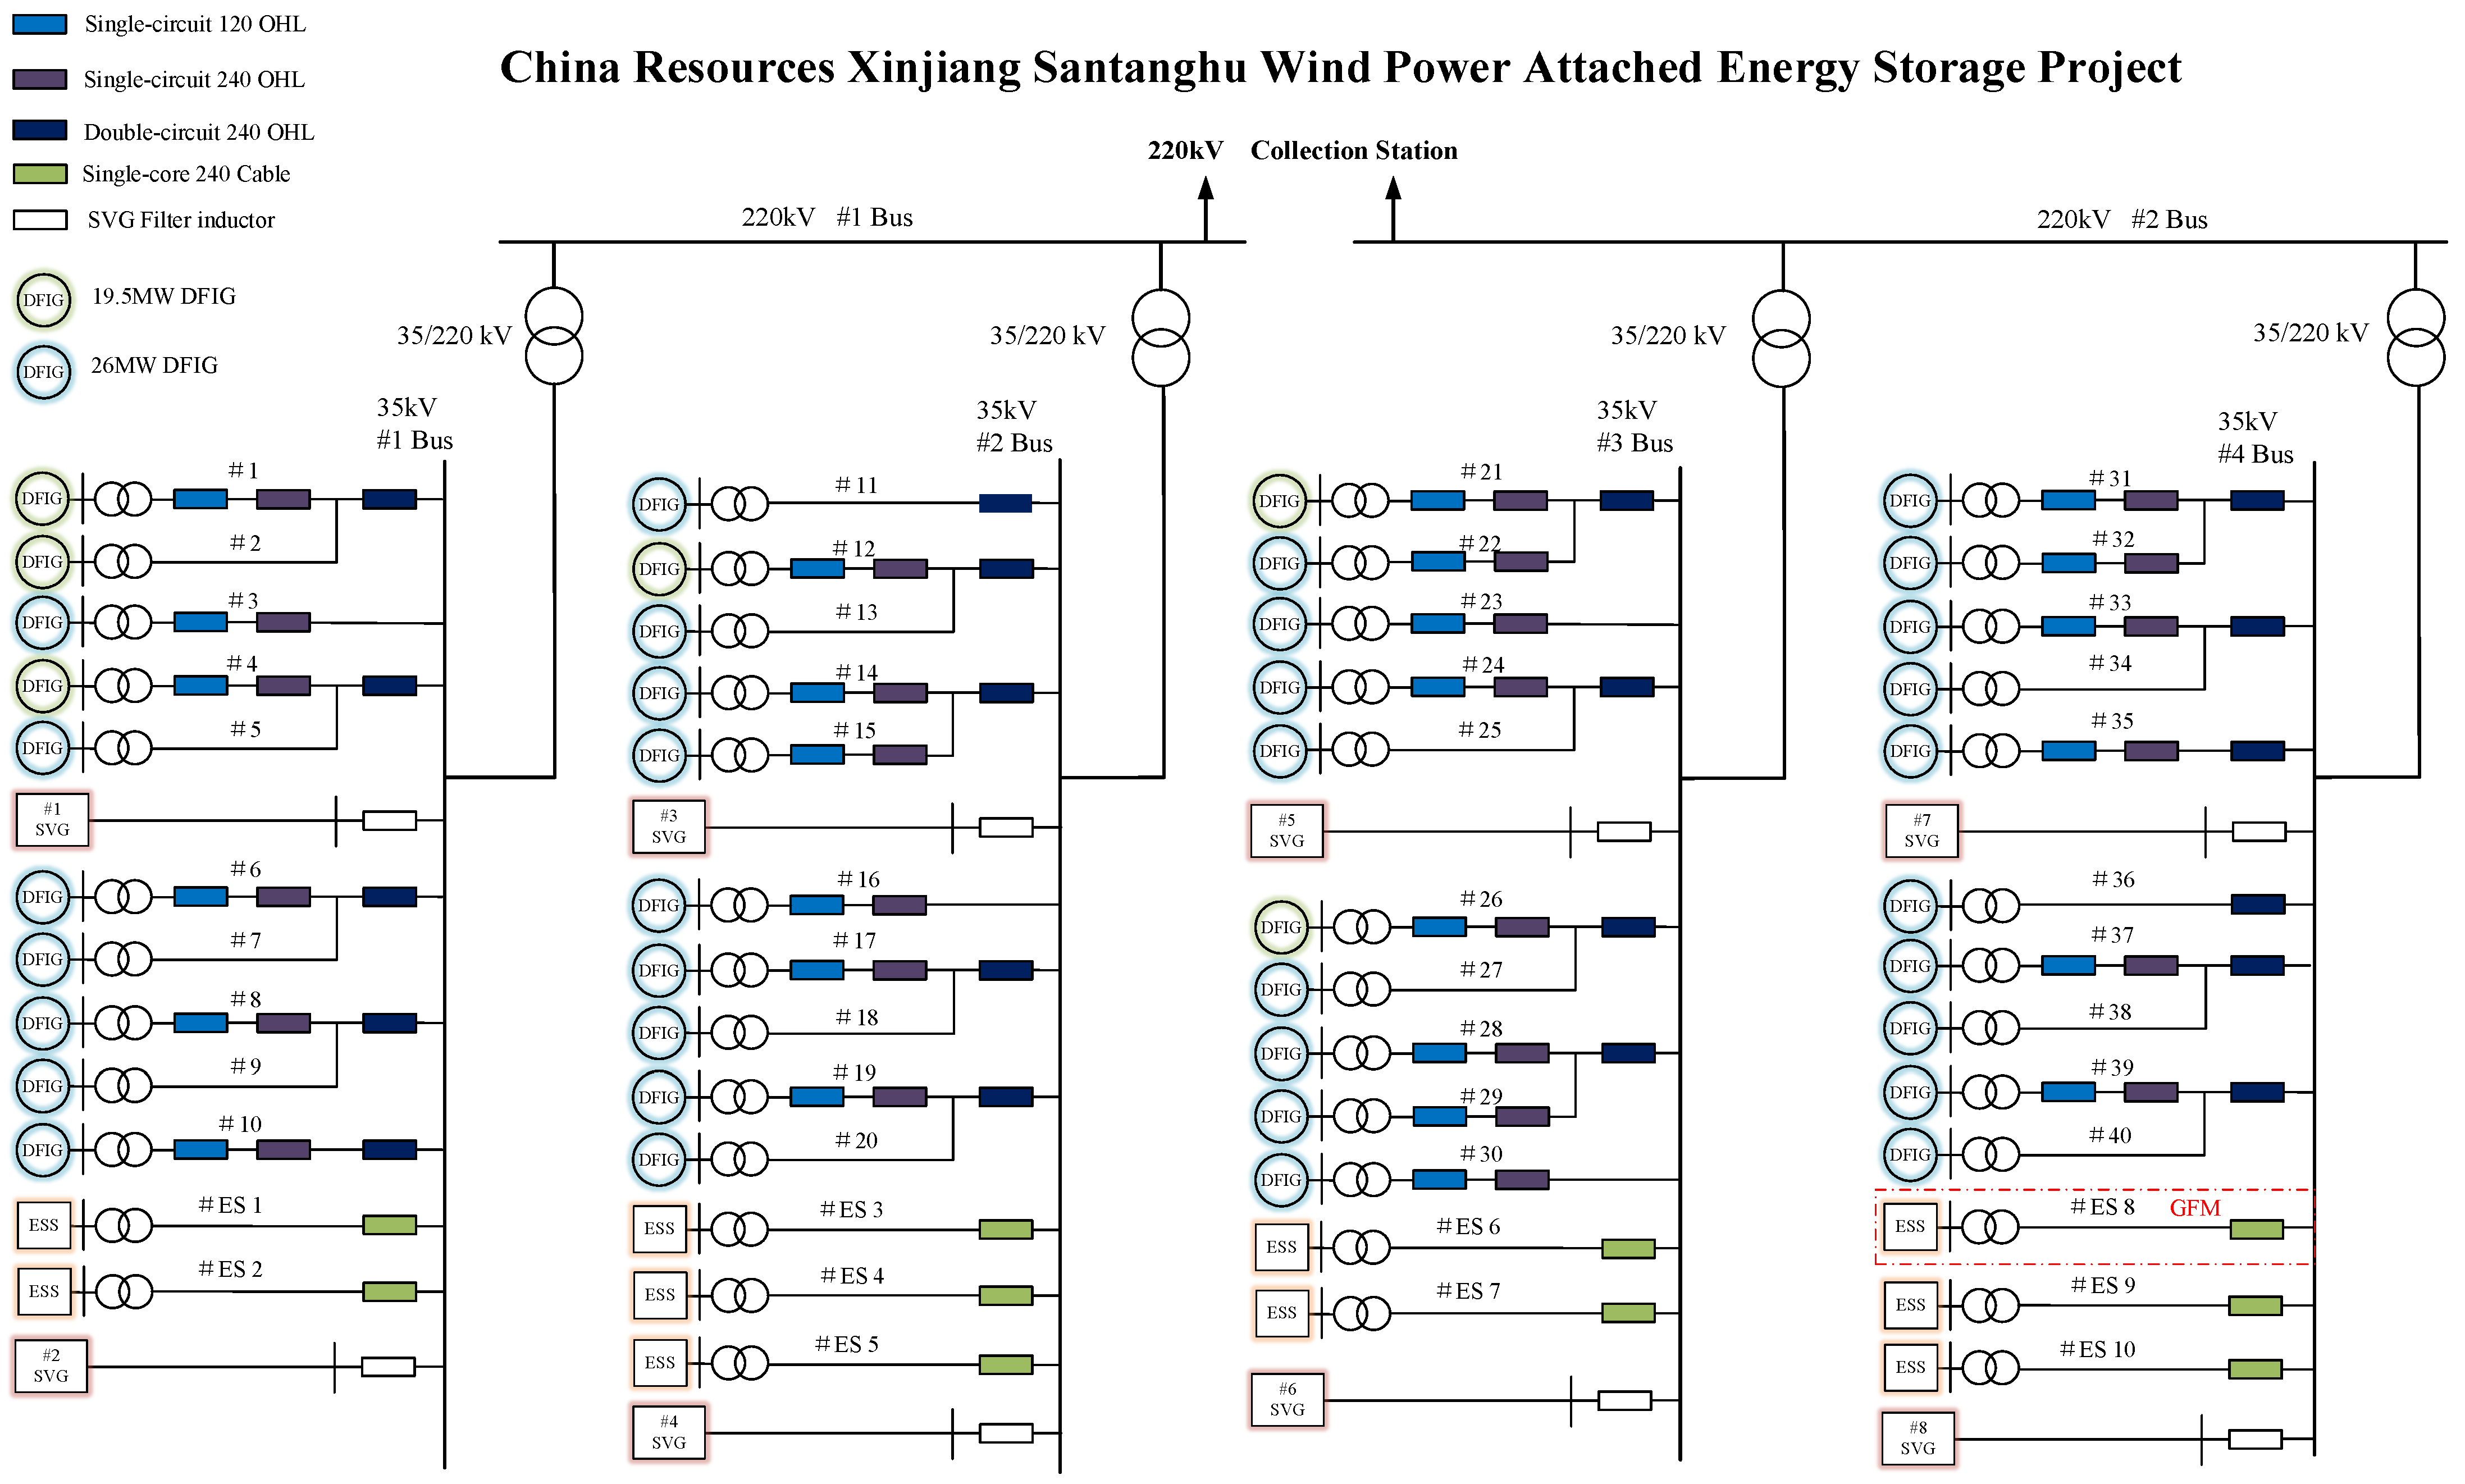
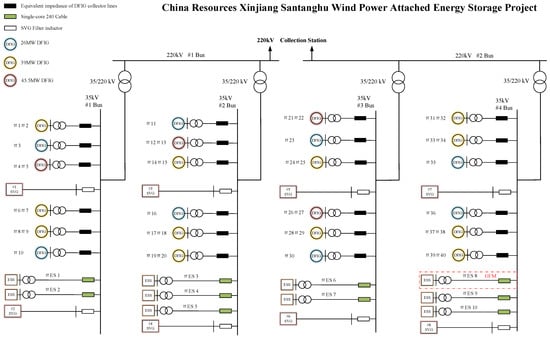
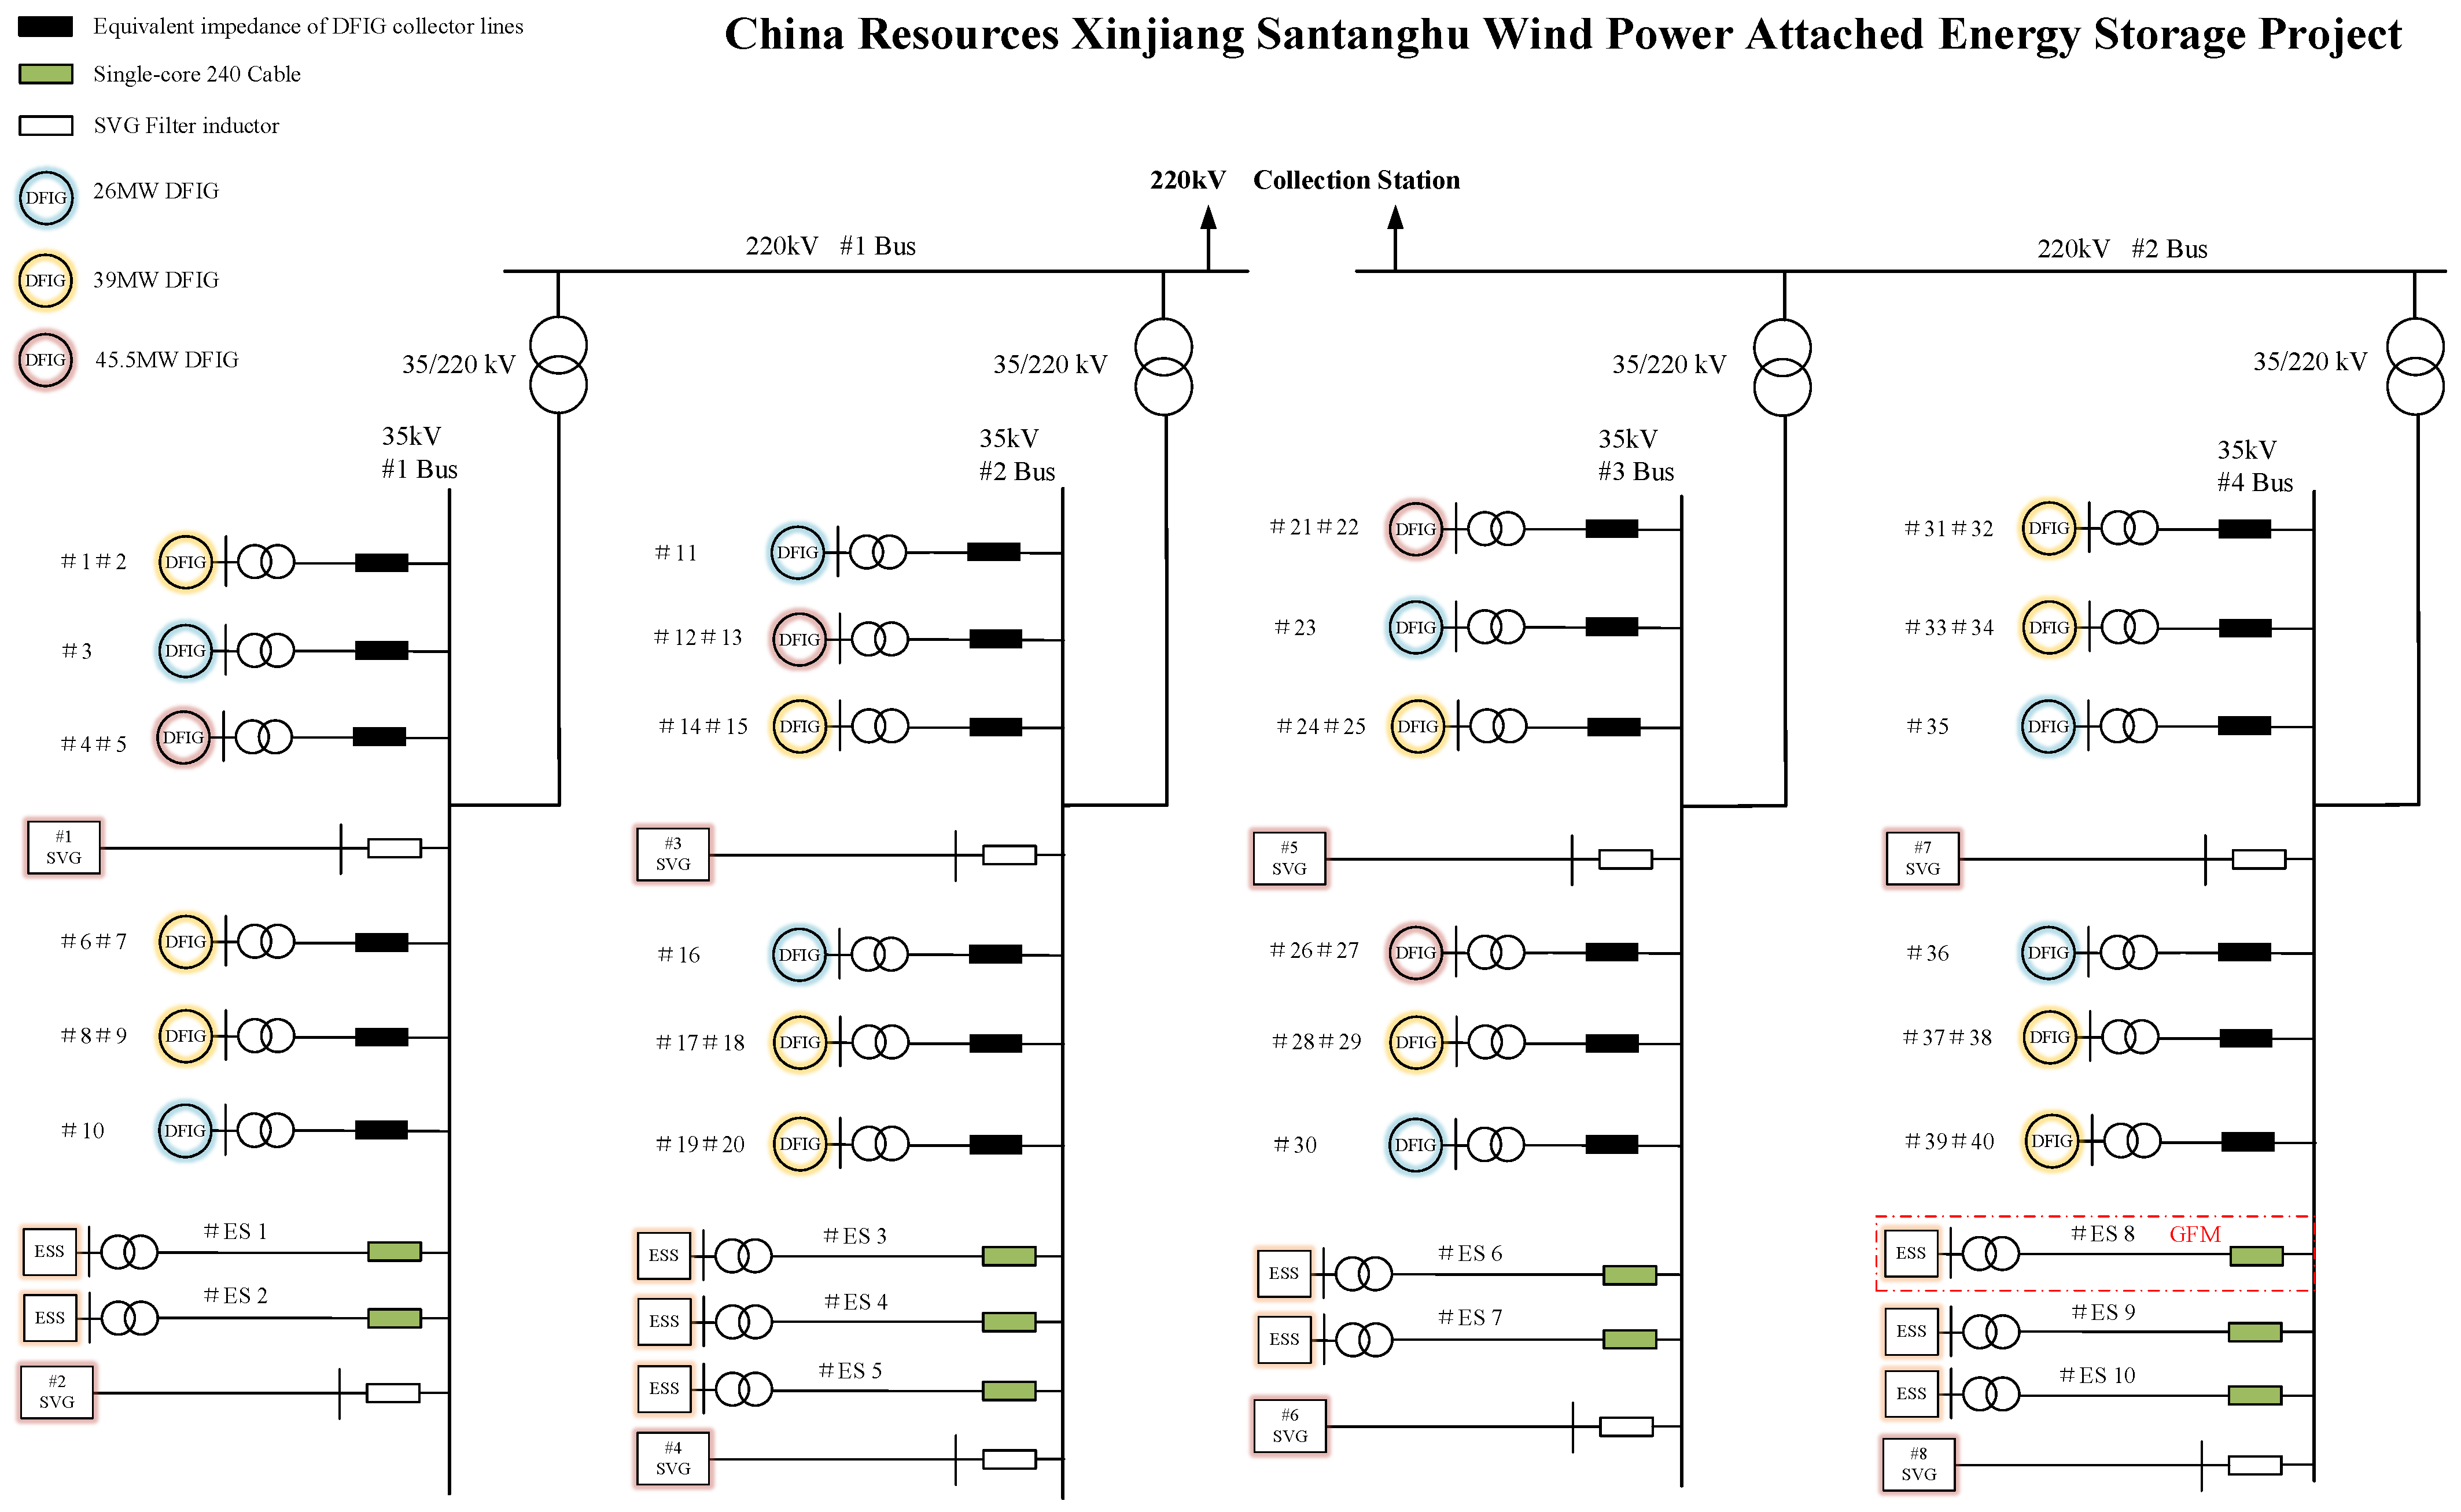
The China Resources Santanghu Wind Power and Energy Storage Project is located in Barkol Kazakh Autonomous County, Hami, Xinjiang, China. As shown in Figure 1, the plant has two voltage levels, 35 and 220 kV, and four main transformers. The wind farm has an installed capacity of 1000 MW and is connected to the plant through 40 wind-power collector lines. Each collector line connects three or four 6.5-MW doubly fed induction generator (DFIG) wind turbines, totaling 154 units, all of which employ GFL control. The energy storage system has a rated capacity of 250 MW/1000 MWh. Each of its ten collector lines has a capacity of 25 MW/100 MWh. The 25 MW/100 MWh energy storage unit connected through collector line #ES8 employs grid-forming control, whereas the remaining nine collector lines, with a combined capacity of 225 MW/900 MWh, employ GFL control. The GFM energy storage system on collector line #ES 8 comprises eight 3 MW/12 MWh energy-storage units and one 1 MW/4 MWh energy-storage unit. The GFL energy storage systems on collector lines #ES 1–#ES 7 and #ES 9–#ES 10 each comprise ten 2.5 MW/10 MWh energy-storage units. The plant also includes eight GFL-SVG units, each rated at ±48 Mvar. The SVG synchronizes with the grid voltage via a phase-locked loop (PLL) and employs voltage-oriented vector control in the dq reference frame. The outer voltage or reactive-power control loop generates the q-axis current reference, while the outer DC-link voltage control loop generates the d-axis current reference. The inner current loop achieves decoupled tracking of the current references and rapidly regulates the reactive current, thereby providing voltage regulation and voltage support during faults.
Figure 1.
Single-line diagram of the China Resources Santanghu Wind Power and Energy Storage Project.
Geographically, the energy storage systems and SVGs are concentrated adjacent to the 220 kV collector station. Differences in the lengths and impedances of their collector lines can therefore be neglected. The electrical locations of the 25 MW/100 MWh GFM energy storage system, the 225 MW/900 MWh GFL energy storage system, and the eight ±48 Mvar SVG units can be regarded as approximately identical. By contrast, the wind turbines are geographically dispersed, and the lengths of different wind-power collector lines may differ by tens of kilometers. Their spatial distribution in terms of electrical distance therefore cannot be neglected.
The variation and distribution of wind speed directly determine the steady-state output power of each wind turbine and should, in theory, serve as a clustering indicator for wind-farm grouping. However, due to its randomness and real-time variability, wind speed is difficult to introduce into the modeling and stability analysis of the plant as an effective variable. Meanwhile, to reasonably reduce the computational complexity of the aggregation equivalence, the wind-speed differences are not considered in this paper; that is, all wind turbines are assumed to experience the same wind speed and operate at the same power level, and all energy-storage units and SVG units are assumed to share the power commands equally.
Ref. [11] analyzes four key factors affecting the equivalence accuracy of the plant model: the power distribution, the impedance distribution of the pad-mounted transformers and collector lines, the active- and reactive-power control, and the auxiliary SVG equipment. Ref. [12] points out that, when the impedance-distribution characteristic dominates the electrical behavior of a renewable energy plant, the units in the plant can be equivalenced into two machines classified as electrically near and far clusters. Based on wind-farm examples containing tens to hundreds of wind turbines, Refs. [12,13] have quantitatively calculated the error accuracy of the two-machine equivalent model and verified that it can reflect the dynamic characteristics under small- and large-disturbance conditions with reasonable accuracy.
Based on the research conclusions of Refs. [11,12,13], in this study, the individual wind-power collector lines are divided into electrically near and far clusters and then aggregated within each cluster to form equivalent units. Feature vectors are constructed from four electrical parameters—resistance, reactance, susceptance, and wind-turbine capacity, and K-means clustering is then applied.
Each cluster is aggregated according to the principles of preserving both rated capacity and output power:
where Sn is the rated capacity of the nth generating unit; Seqm is the rated capacity of the mth equivalent unit; N is the number of wind turbines in the wind farm; and M is the number of equivalent units.
In addition, based on the equal-power-loss principle, the impedances of the wind-farm collector network are calculated and assigned to the respective equivalent units as their series terminal impedances:
where Ieqm is the steady-state current of the mth equivalent unit; Reqm + jXeqm is the series terminal impedance of the mth equivalent unit; Ilk is the steady-state current of the kth wind turbine on the lth collector line; Rlk + jXlk is the impedance of the collector-line section corresponding to the kth wind turbine on the lth collector line; L is the total number of collector lines; and Kl is the total number of wind turbines on the lth collector line. Using (2), the impedances of multiple collector lines can be reduced to the terminal impedances of one or more equivalent units.
For the collector-line susceptance, when n individual generating units are aggregated, the equivalent line-to-ground susceptance of their collector lines is calculated as
where Bi is the line-to-ground susceptance of the ith collector line and Beq is the collector-line susceptance of the equivalent unit.
The wind-turbine step-up transformer parameters are aggregated as follows:
where rTi, xTi, GTi, and BTi are the short-circuit resistance, leakage reactance, core-excitation conductance, and core-excitation susceptance of the step-up transformer associated with the ith device, respectively; and rTeq, xTeq, GTeq, and BTeq are the corresponding parameters of the equivalent transformer for the aggregated unit.
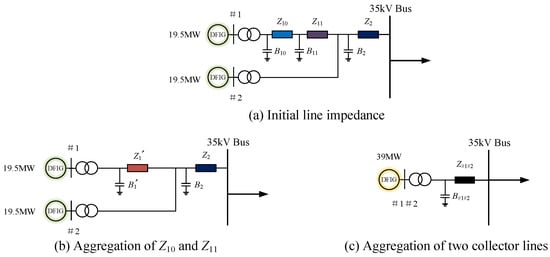
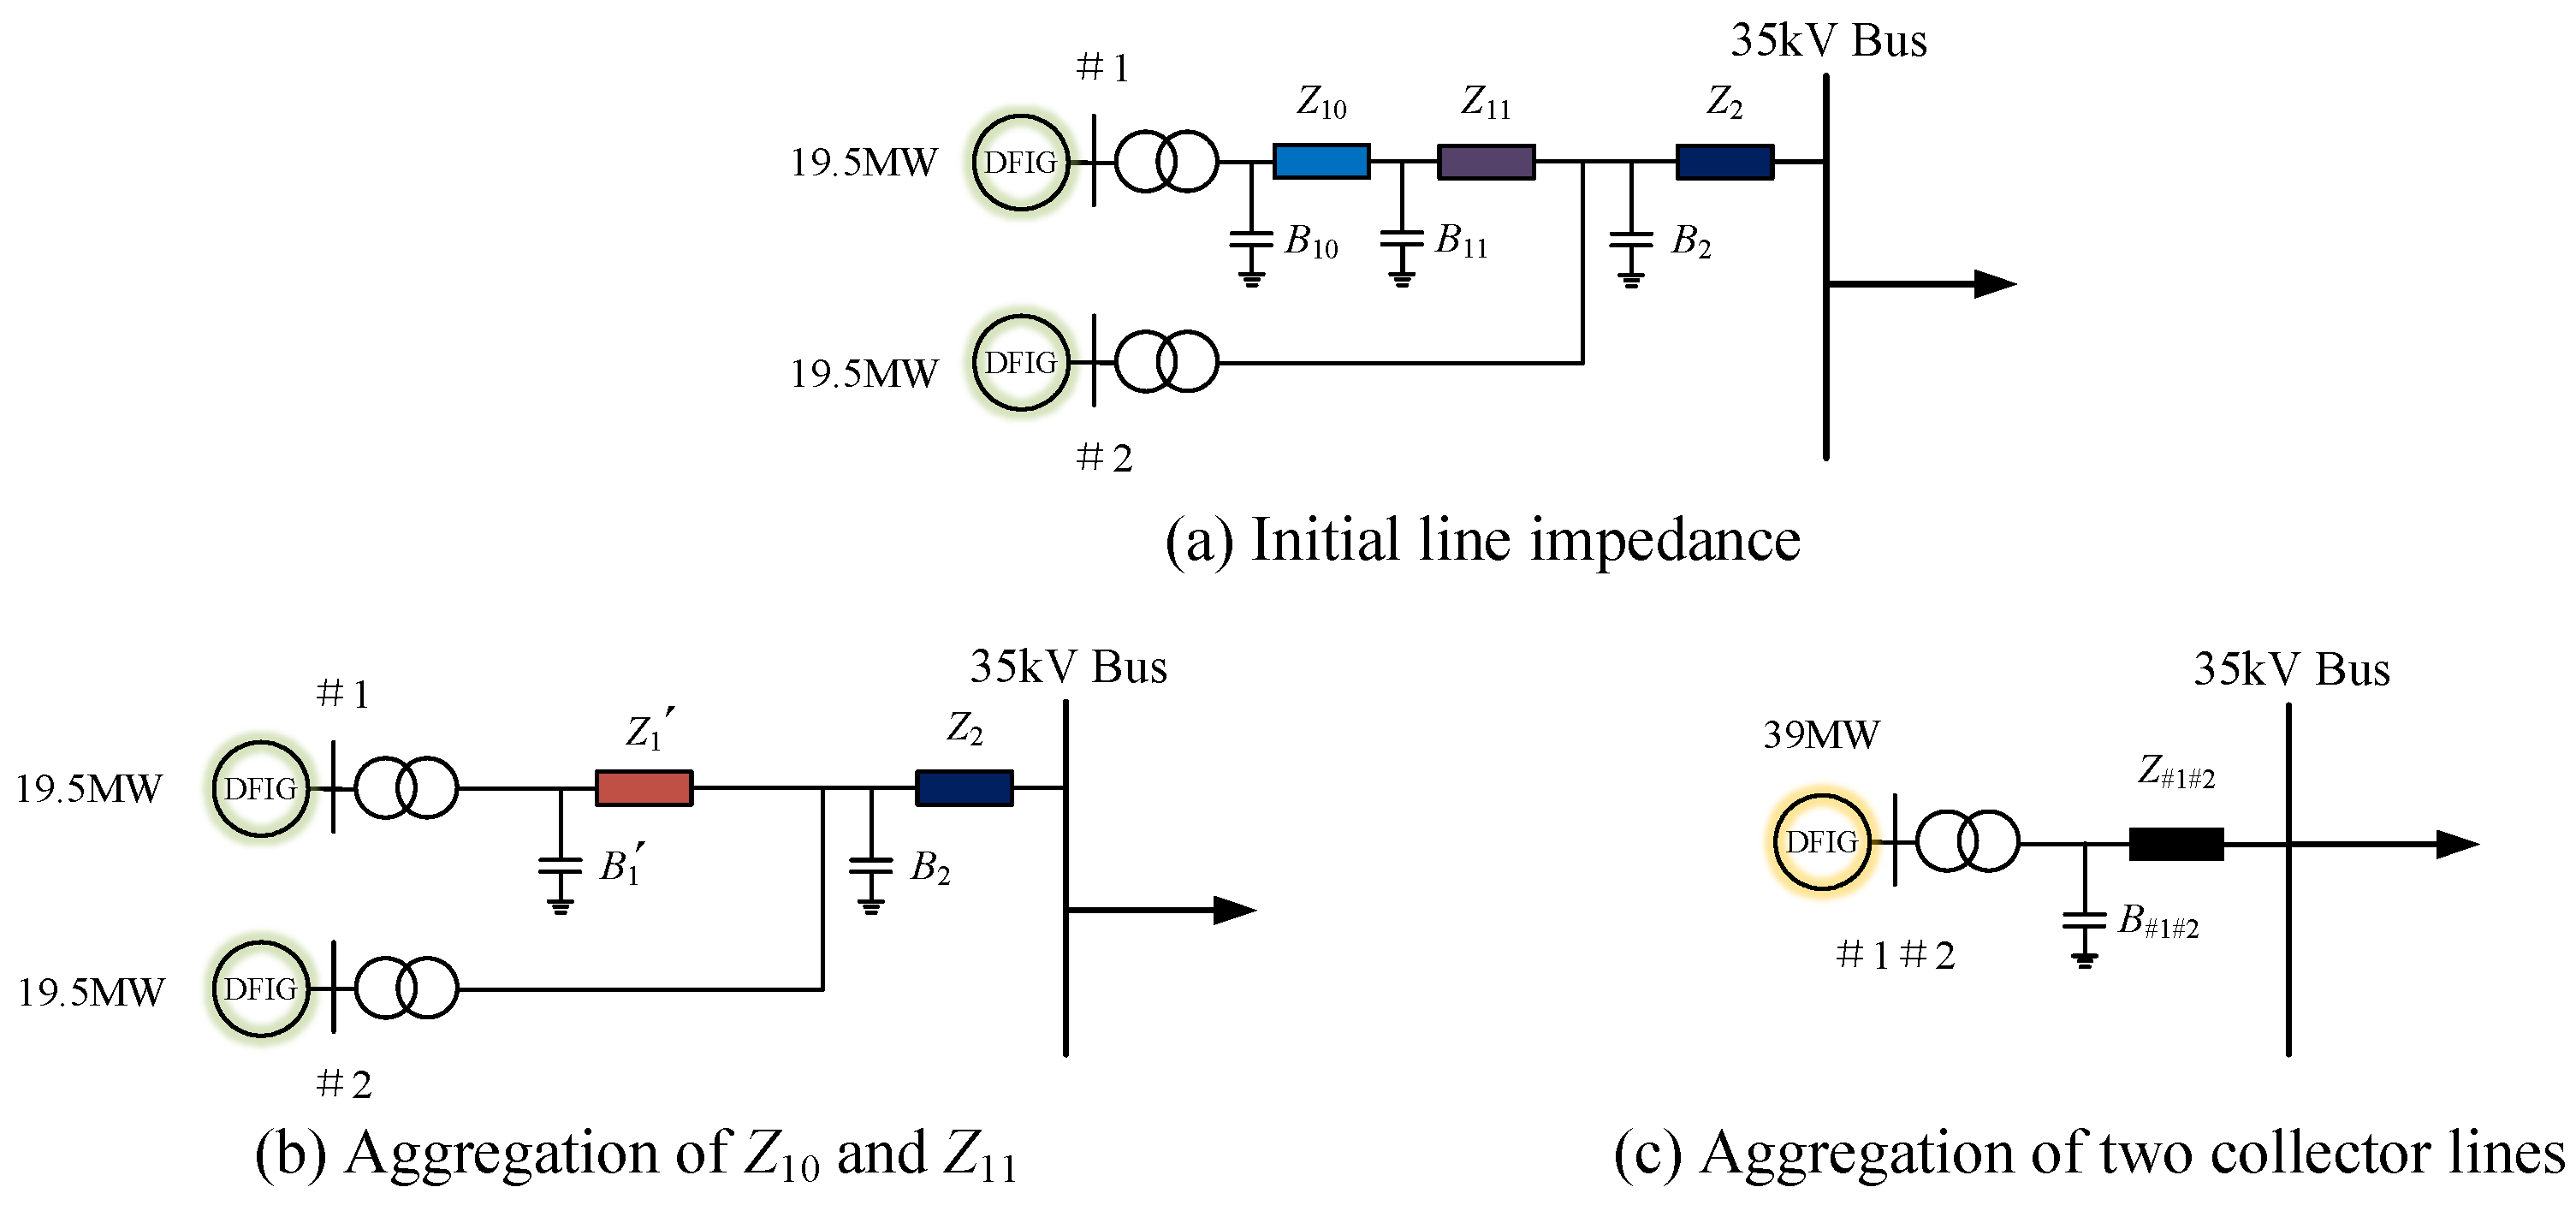
As shown in Figure 1, two or three wind-power collector lines may share a section of the double-circuit 240 mm2 overhead line before connecting to the 35 kV bus. To facilitate the subsequent K-means-based clustering of electrically near and far wind-turbine units, using collector lines #1 and #2 as an example, the two wind-power collector lines shown in Figure 2a are pre-aggregated. In the first step, the impedances and admittances of the two types of overhead lines corresponding to collector line #1 are summed separately:
Figure 2.
Schematic diagram of the pre-aggregation procedure.
In the second step, based on the equal-power-loss principle expressed in Equation (2) and referring to the equivalent-impedance calculation formula for trunk lines given in Ref. [12], the line impedances and Z2 are aggregated into Z#1#2. The line-to-ground susceptances and the wind-turbine capacities of the two collector lines are directly summed, yielding the equivalent topology of collector lines #1 and #2 shown in Figure 2c.
Using the above pre-aggregation method, the wind-farm collector system shown in Figure 1 can be simplified to a topology comprising 22 DFIG equivalent units of different capacities, each connected to the grid through one collector line, as shown in Figure 3.
Figure 3.
Simplified schematic diagram of the China Resources Santanghu Wind Power and Energy Storage Project after pre-aggregation.
Four key parameters that characterize the electrical properties of each collector line are selected as the feature vector: collector-line resistance, reactance, susceptance, and wind-turbine capacity. K-means clustering is used to divide the 22 collector lines into two clusters, such that the feature vector characteristics within each cluster are similar while the characteristics of the two clusters remain distinct. Feature vectors under different clustering solutions are evaluated iteratively, and the optimal clustering solution that minimizes the within-cluster differences of the two clusters is selected to ensure aggregation accuracy. The clustering results are listed in Table 1. The construction of the clustering objective function and the step-by-step implementation procedure of the K-means algorithm adopted in this paper have been given in Refs. [19,20,21,22] and are therefore not repeated here.
Table 1.
K-means clustering results for the wind turbines.
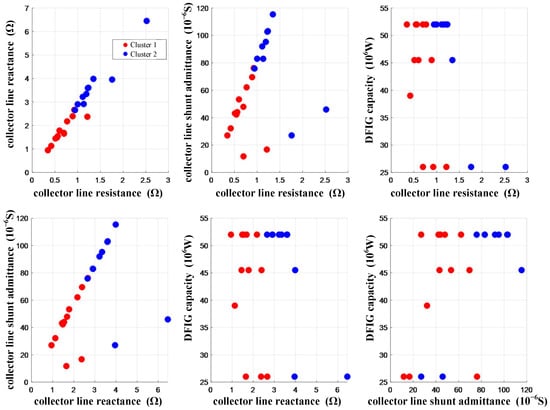
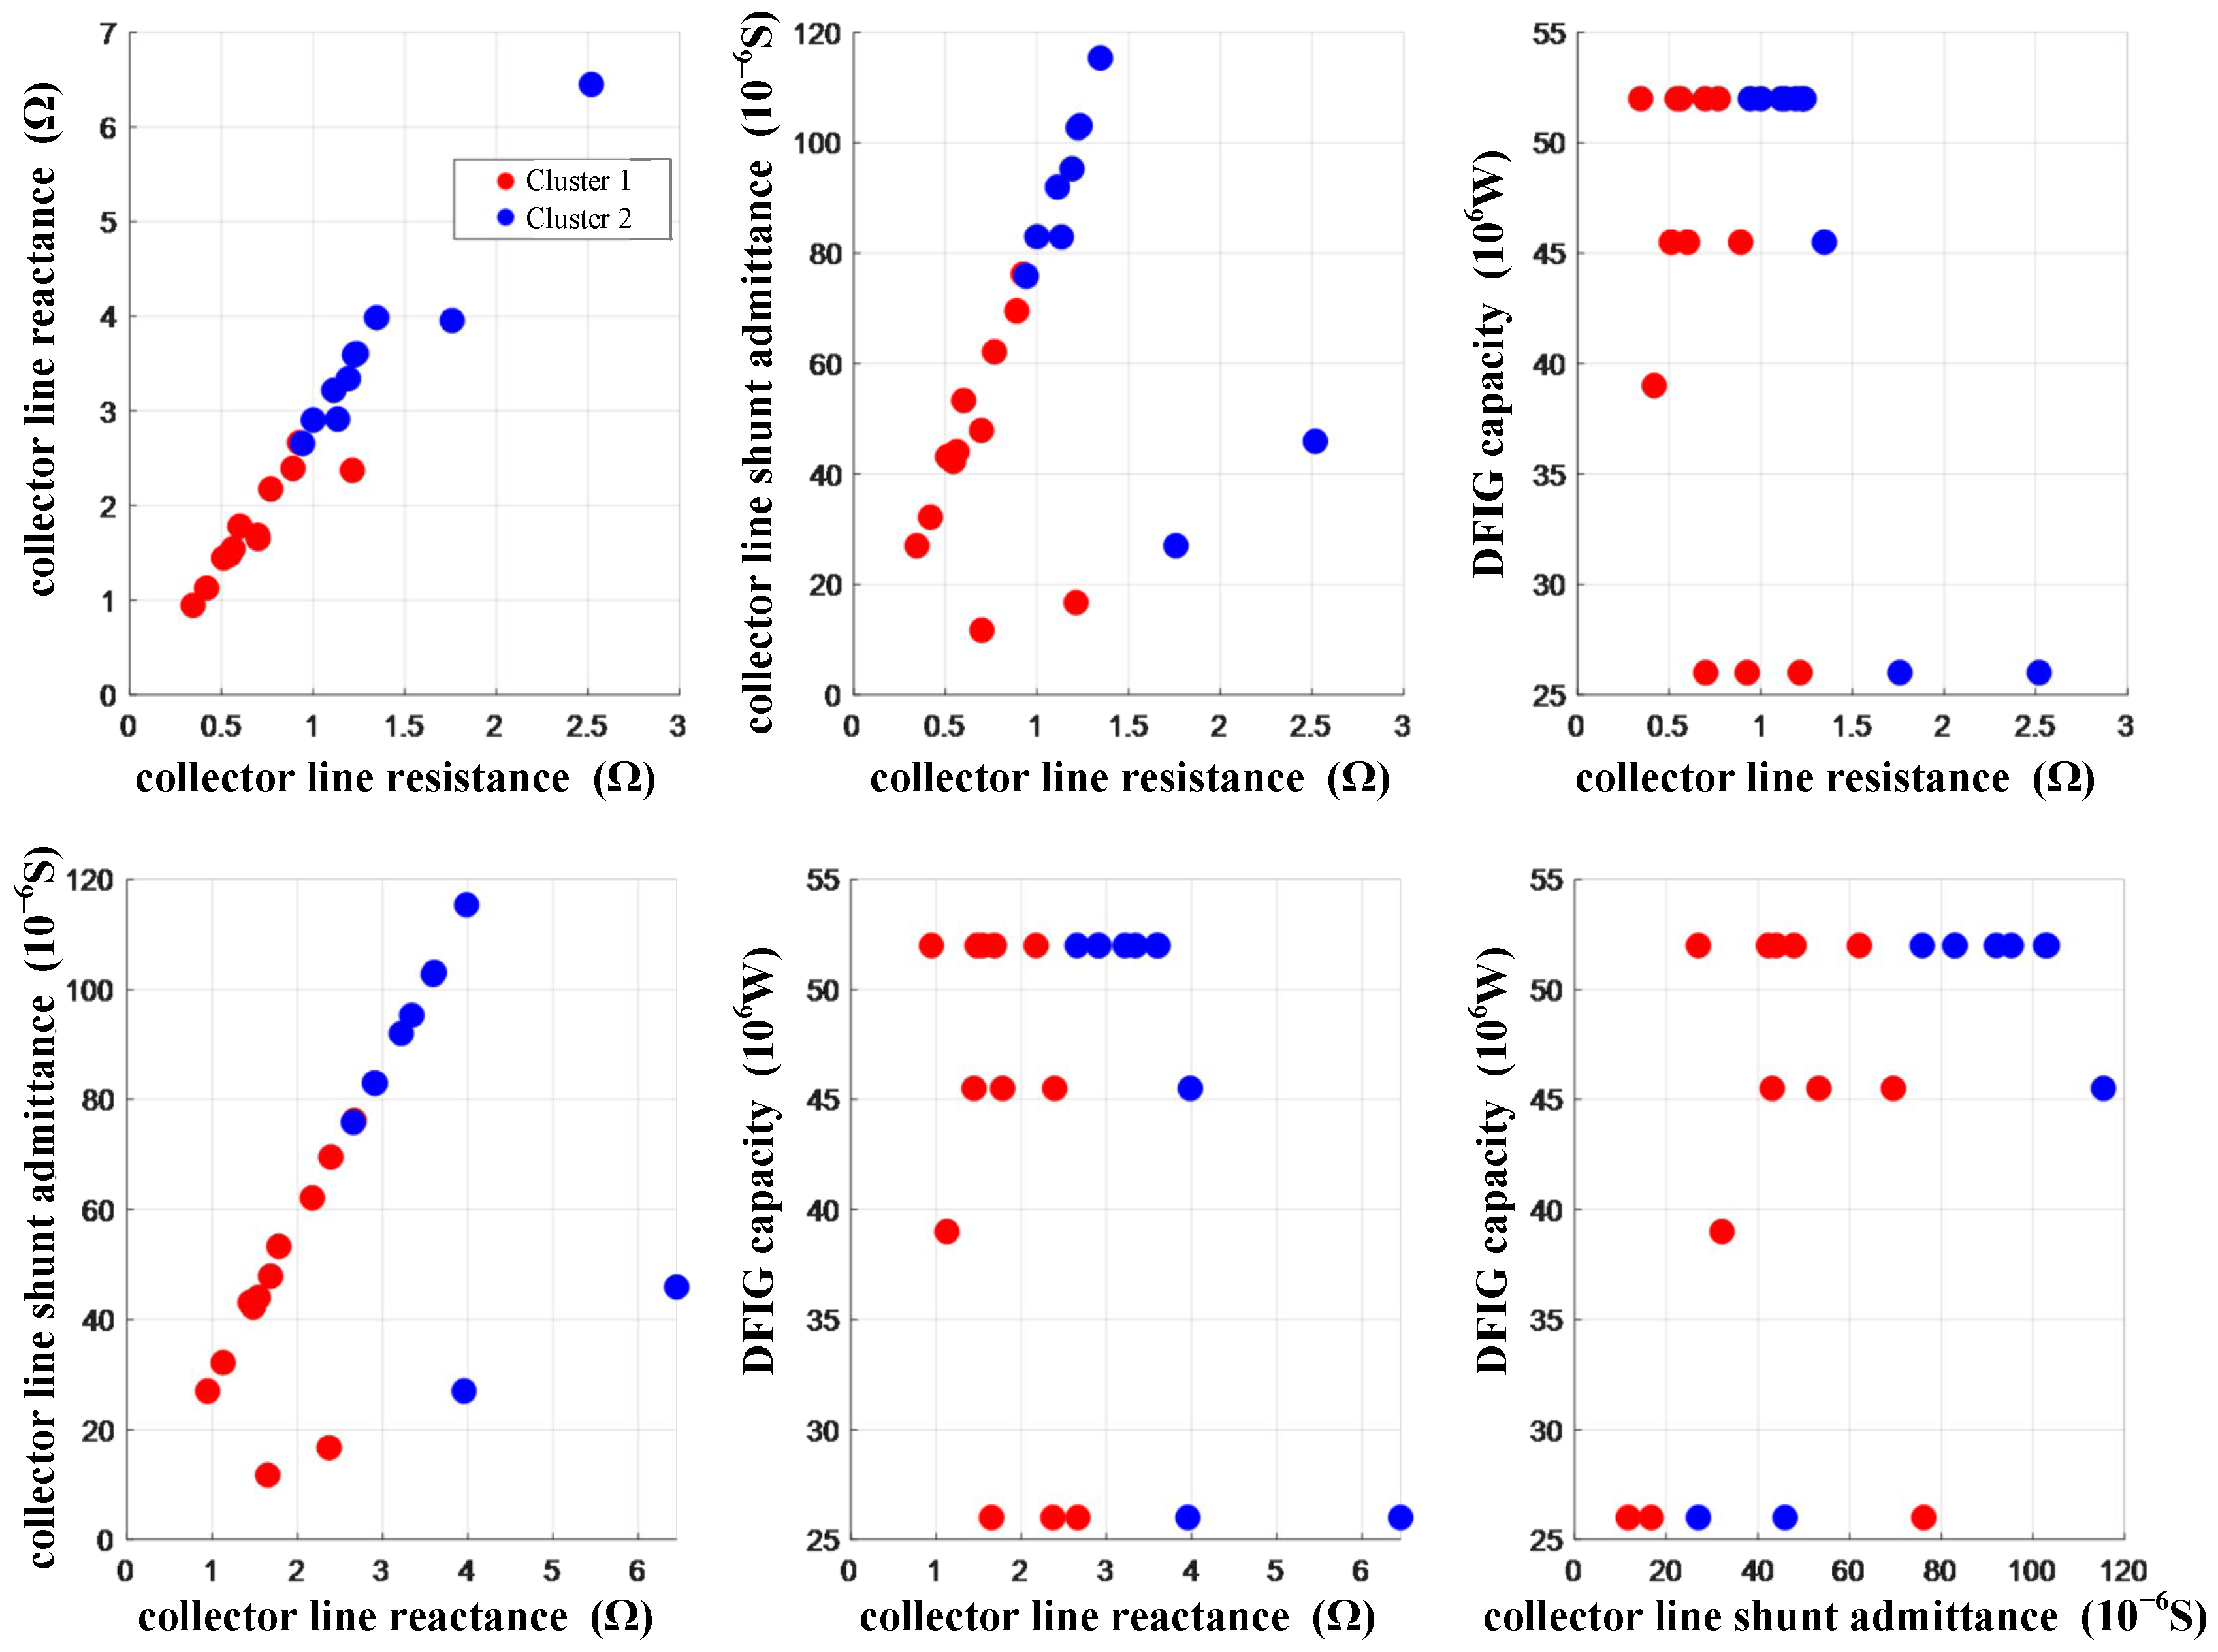
Figure 4 presents the clustering results as six pairwise scatter plots obtained from the four-dimensional feature data comprising collector-line resistance, reactance, susceptance, and wind-turbine capacity. These plots provide an intuitive representation of the cluster distributions across different feature combinations. Cluster 1 in red and Cluster 2 in blue exhibit clear aggregation patterns and regional separation across all feature combinations, demonstrating the rationality of the clustering results.
Figure 4.
Two-dimensional scatter plots of the feature distributions.
In Figure 3, the connection topologies of the wind power, energy storage, and SVGs on the four 35 kV buses corresponding to the four 35/220 kV main transformers are identical, and all of them are radially connected, allowing direct aggregation. That is, following the calculation principles of Equations (1), (3) and (4), the capacities of devices of the same type are summed, the line-to-ground susceptances are summed, and the impedances are combined in parallel.
Based on the K-means clustering results shown in Table 1, the wind-power collector lines are aggregated into two clusters. The GFL energy storage, GFM energy storage, and eight ±48-Mvar SVGs are each aggregated into one equivalent unit. The energy-storage pad-mounted transformers and the four main transformers are scaled according to Equation (4), yielding the equivalent parameters of short-circuit resistance, leakage reactance, core-excitation conductance, and core-excitation susceptance. The equivalent units and key aggregated parameters of the entire renewable energy plant are listed in Table 2, while the aggregated parameters of the main transformer are given in Table 3.
Table 2.
Equivalent Units and Key Aggregated Parameters of the China Resources Santanghu Renewable Energy Plant.
Table 3.
Aggregated main-transformer parameters referred to the low-voltage side.
The electrical parameters of the wind-turbine pad-mounted transformers and collector lines, the energy-storage pad-mounted transformers and collector lines, and the main transformers, as well as the control parameters of the equivalent units can be funded in Appendix A.
2.2. Equivalent System Modeling of the Renewable Energy Plant
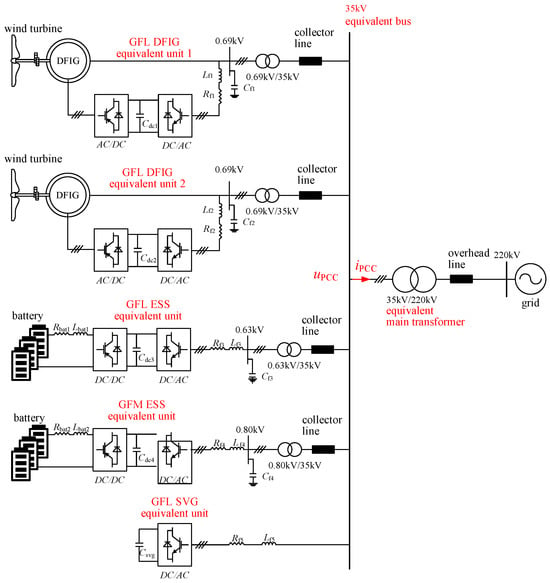
The equivalent system of the renewable energy plant is shown in Figure 5. The DFIG equivalent units 1 and 2 are connected through 0.69/35 kV step-up transformers. The GFL-ESS and GFM-ESS equivalent units are connected through 0.63/35 kV and 0.8/35 kV step-up transformers, respectively. All three types of equivalent units are connected to the 35 kV bus through collector lines. The SVG equivalent unit is directly connected to the 35 kV bus through a smoothing reactor.
Figure 5.
Topology of the equivalent parallel system of the Santanghu renewable energy plant.
The variables in Figure 5 are defined as follows. Cdci (i = 1, 2, 3, 4) denotes the dc-link capacitor of the back-to-back converter. Rfi and Lfi (i = 1, 2, 3, 4) denote the damping resistance and inductance, respectively, of the line-side reactor. Cfi (i = 1, 2, 3, 4) denotes the filter capacitor. Rbati and Lbati (i = 1, 2) denote the equivalent resistance and inductance of the battery-side reactor of the energy storage system. Csvg denotes the dc side capacitor of the SVG. Lf5 and Rf5 denote the inductance and resistance of the smoothing reactor, respectively. uPCC is the voltage at the equivalent point of common coupling (PCC), and iPCC is the total current at the equivalent PCC.
The sequence impedance models in this paper are developed using harmonic linearization [19,20,21,22,23]. Positive and negative-sequence small-signal harmonic perturbations are superimposed on the steady-state operating point, and the response components at the perturbation frequencies are extracted through frequency-domain mapping. The resulting models are independent of the reference frame and are therefore convenient for multi-device aggregation. Analytical sequence impedance models for the four device types—the GFL-DFIG, GFL-ESS, GFM-ESS, and GFL-SVG—have been presented in Refs. [23,24,25,26,27,28,29,30], respectively. The intermediate procedures for control-loop modeling, linearization, and coordinate transformation are consistent with those references and are not repeated here.
In (8), Ze_p_X and Ze_n_X denote the overall positive and negative-sequence impedances of equivalent unit X as viewed from the 35 kV bus, including the corresponding step-up transformer and collector-line impedances. X represents DFIG1, DFIG2, GFL-ESS, GFM-ESS, or SVG in Figure 5.
where kT_X is the transformation ratio of the step-up transformer associated with equivalent unit X; RTL_X and LTL_X are the leakage resistance and inductance of the transformer on its low-voltage side; RTH_X and LTH_X are the short-circuit resistance and inductance on its high voltage side; and Rline_X and Lline_X are the collector-line parameters associated with the equivalent unit. For the SVG, which has no step-up transformer and is directly connected to the 35 kV bus, kT_SVG = 1 and RTL_SVG = LTL_SVG = RTH_SVG = LTH_SVG = 0.
To further investigate the overall terminal characteristics of the renewable energy plant under small-signal perturbations, the total impedance at the 35 kV terminal of the parallel system, including the dynamic characteristics of the five equivalent units described above, is defined as follows:
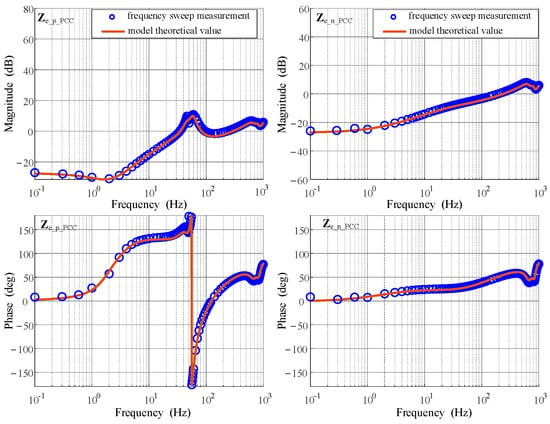
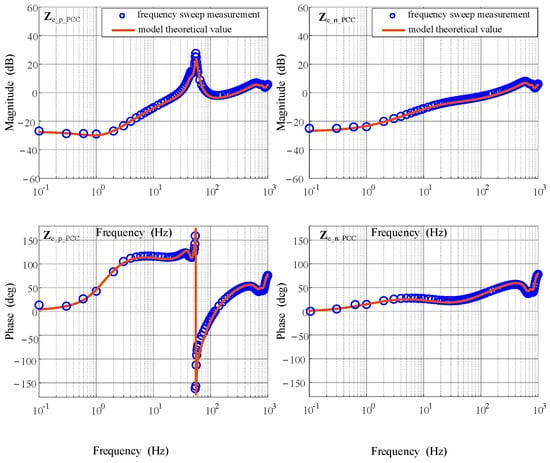
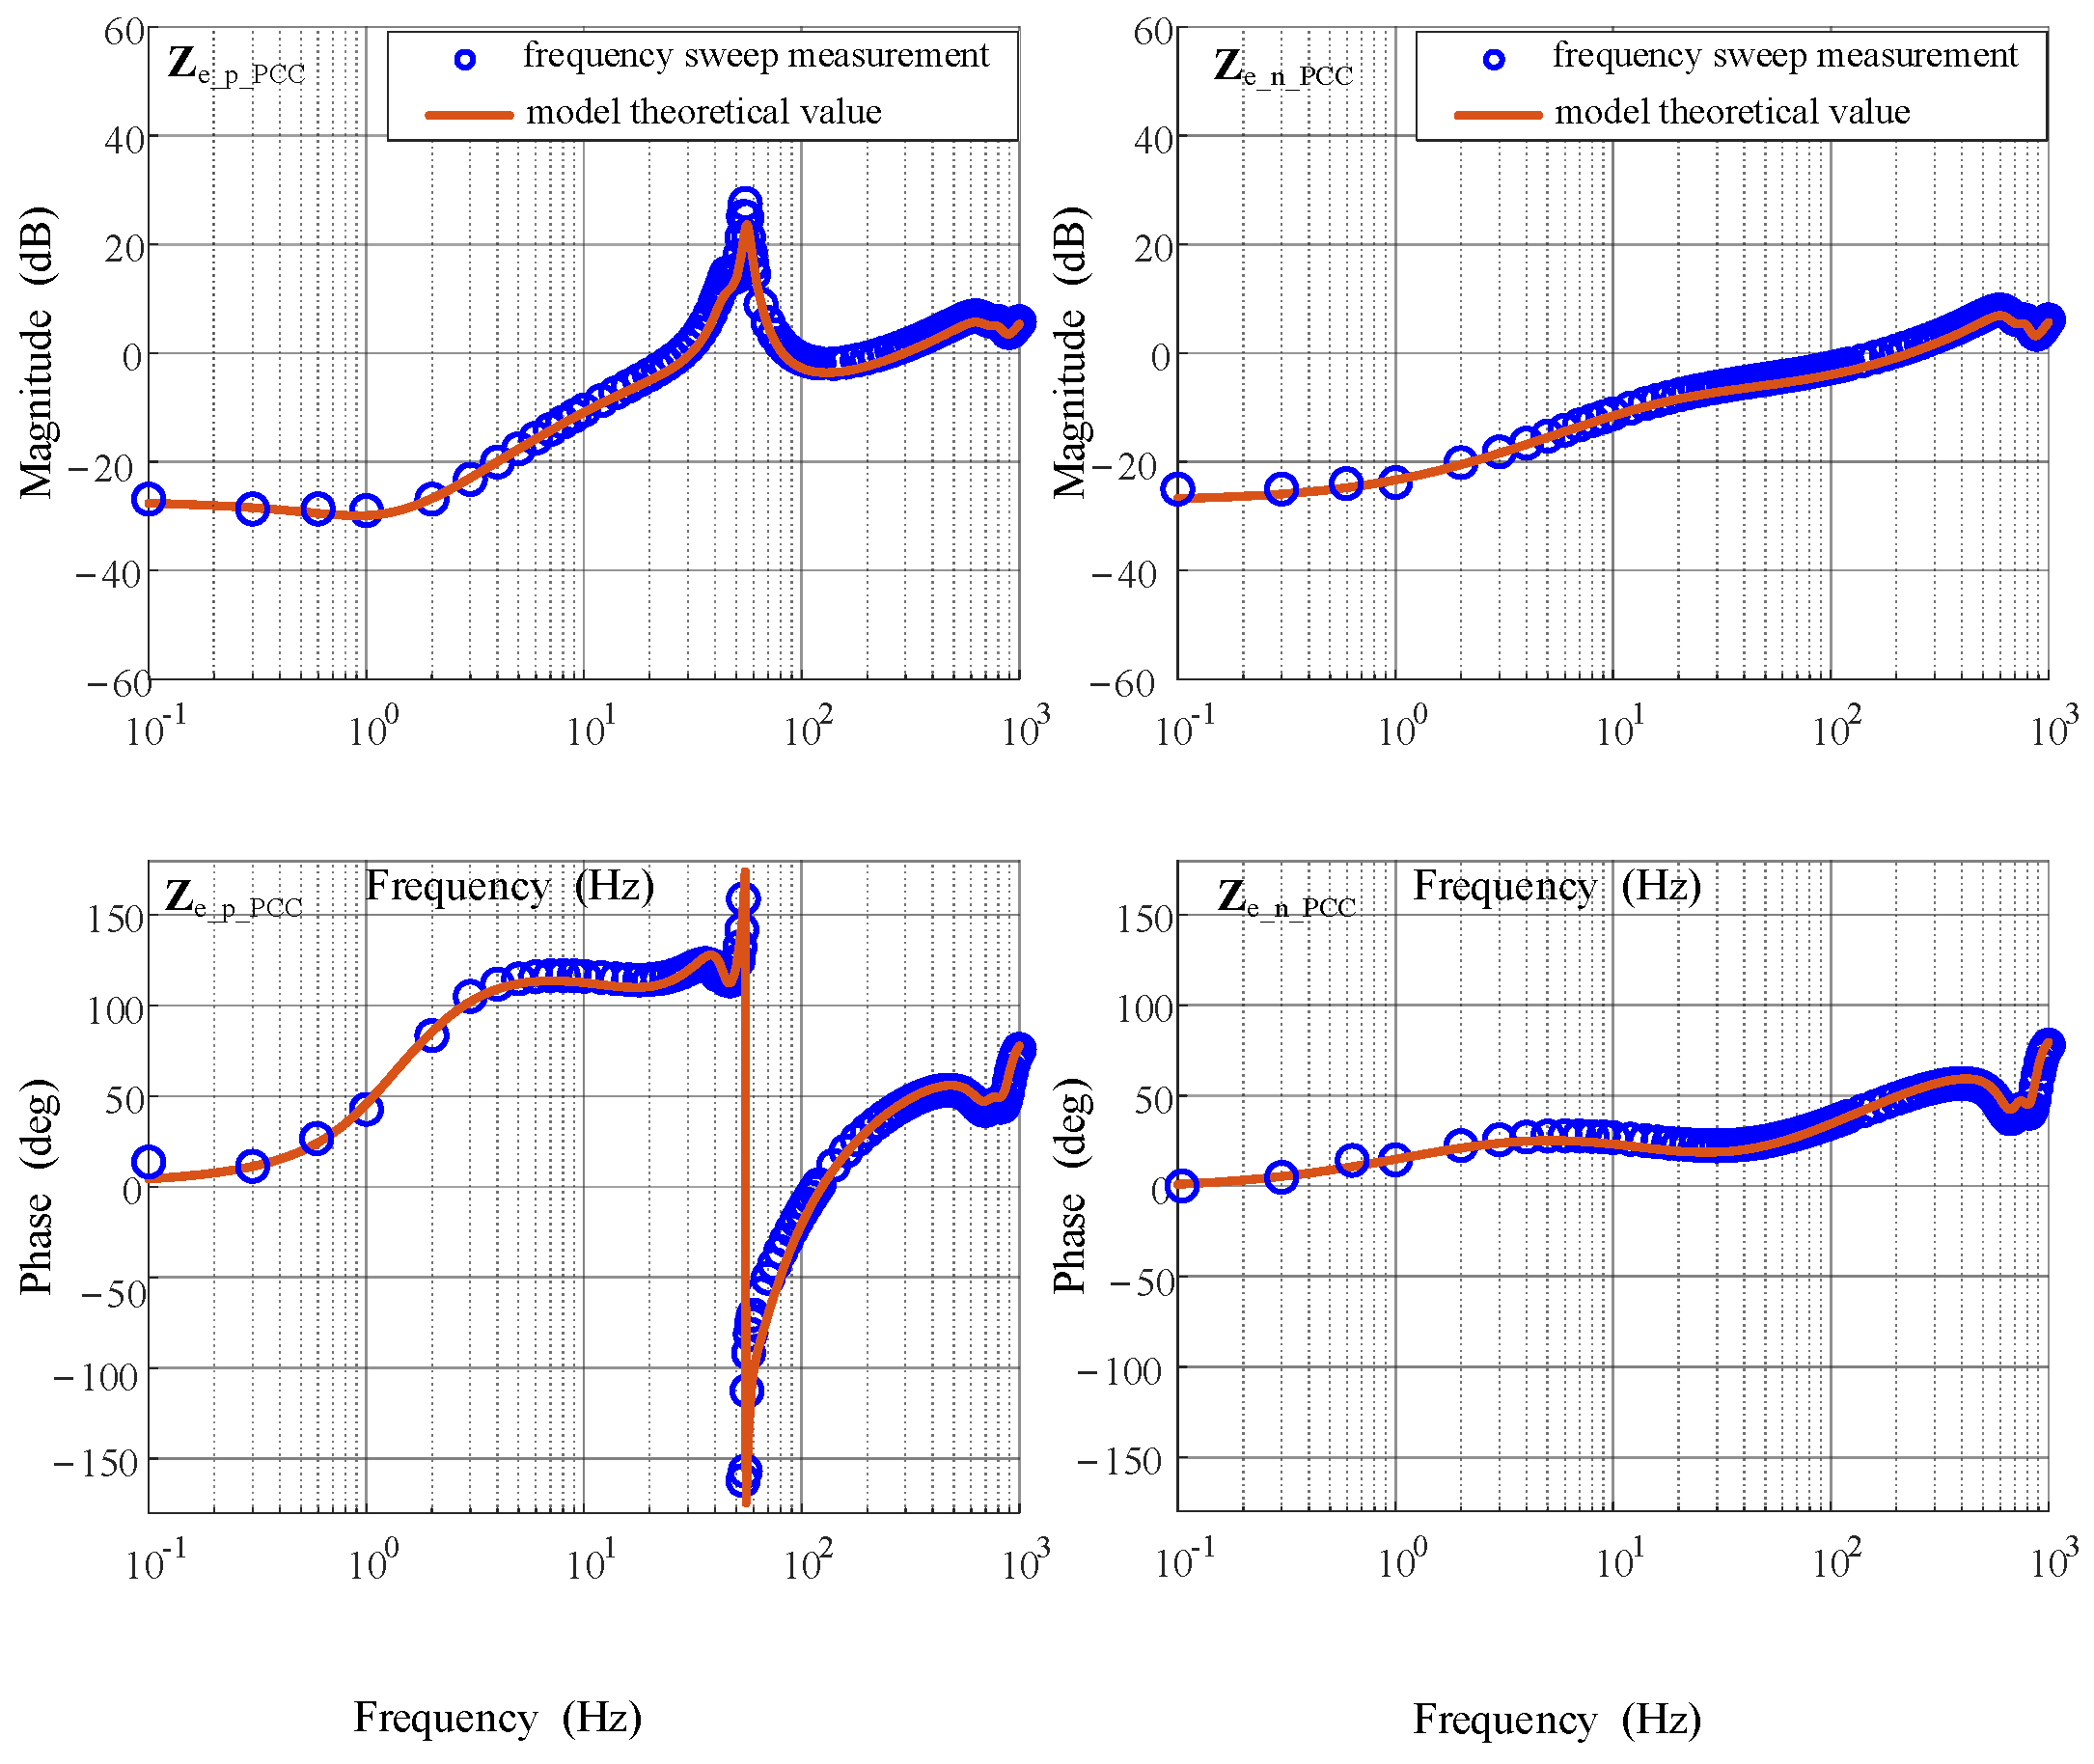
Positive- and negative-sequence small-signal perturbations are then injected at the 35 kV bus shown in Figure 5. The theoretical curves of the overall plant impedance model in (9) are compared with the time-domain simulation frequency-sweep results to verify the accuracy of the plant-level impedance modeling. Figure 6 and Figure 7 compare the theoretical curves and time-domain frequency-sweep results of Ze_p_PCC and Ze_n_PCC under two typical operating conditions: high wind-power output with energy-storage charging, and low wind-power output with energy-storage discharging. The theoretical plant-level impedance curves agree closely with the simulation frequency-sweep results over the entire frequency range, demonstrating that the proposed model accurately captures the dynamic characteristics of the overall renewable energy plant.
Figure 6.
Comparison of the theoretical plant impedance model and frequency-sweep results under high wind-power output and energy-storage charging.
Figure 7.
Comparison of the theoretical plant impedance model and frequency-sweep results under low wind-power output and energy-storage discharging.
3. Grid-Connected Stability Analysis of the Renewable Energy Plant
The dynamic characteristics of the grid-connected renewable energy plant represented by sequence impedances exhibit multi-input multi-output (MIMO) coupling according to Refs. [6,7]; the generalized Nyquist criterion should be used to assess the system stability. The return-ratio matrix L can be defined as the product of the equivalent output impedance on the plant side and the input admittance on the grid side:
L is also a 2 × 2 square matrix; its characteristic function has two components, producing two characteristic loci in the complex plane. The generalized Nyquist criterion can be stated as follows: the system is stable if and only if the two characteristic loci of the return-ratio matrix L do not encircle the point (−1 + j0) in the complex plane.
However, the characteristic function of the return-ratio matrix L is of high order; computing the characteristic loci is very complicated and lacks clear physical meaning, making it difficult to identify the stability margin. The results reported in Refs. [31,32,33,34,35] show that, when the operating conditions of the system satisfy the following requirements:
- (1)
- the active power of the system is much greater than the reactive power, i.e., the system operates at near-unity power factor;
- (2)
- the output impedance of the converter itself is much larger than the line impedance within the specific frequency range of interest;
- (3)
- the main-diagonal elements Zpp(s) and Znn(s) of the converter impedance matrix are much larger than Zpn(s) and Znp(s).
The grid-side impedance contains only passive elements, such as transformers and lines, and is itself a diagonally dominant matrix. The product of these two impedances, i.e., the return-ratio matrix L, can then be approximated as a diagonal matrix whose eigenvalues are equal to its two main-diagonal elements. The MIMO generalized Nyquist criterion can thus be simplified to two independent SISO Nyquist criteria for the positive- and negative-sequence channels, respectively.
According to the time-domain simulation results shown in Section 4, under the two typical operating conditions of the plant studied in this paper—high wind-power output with energy-storage charging and low wind-power output with energy-storage discharging—the active power is much greater than the reactive power, and the plant can be regarded as operating at near-unity power factor.
According to Figure 6 and Figure 7, within the frequency range below 100 Hz, the magnitude of the converter output impedance dominated by its own control is much larger than the passive line impedance. The converter output impedance can thus be approximated as a diagonal matrix; by neglecting the positive/negative-sequence coupling terms, the generalized Nyquist criterion is simplified to two independent SISO Nyquist criteria for the positive- and negative-sequence channels.
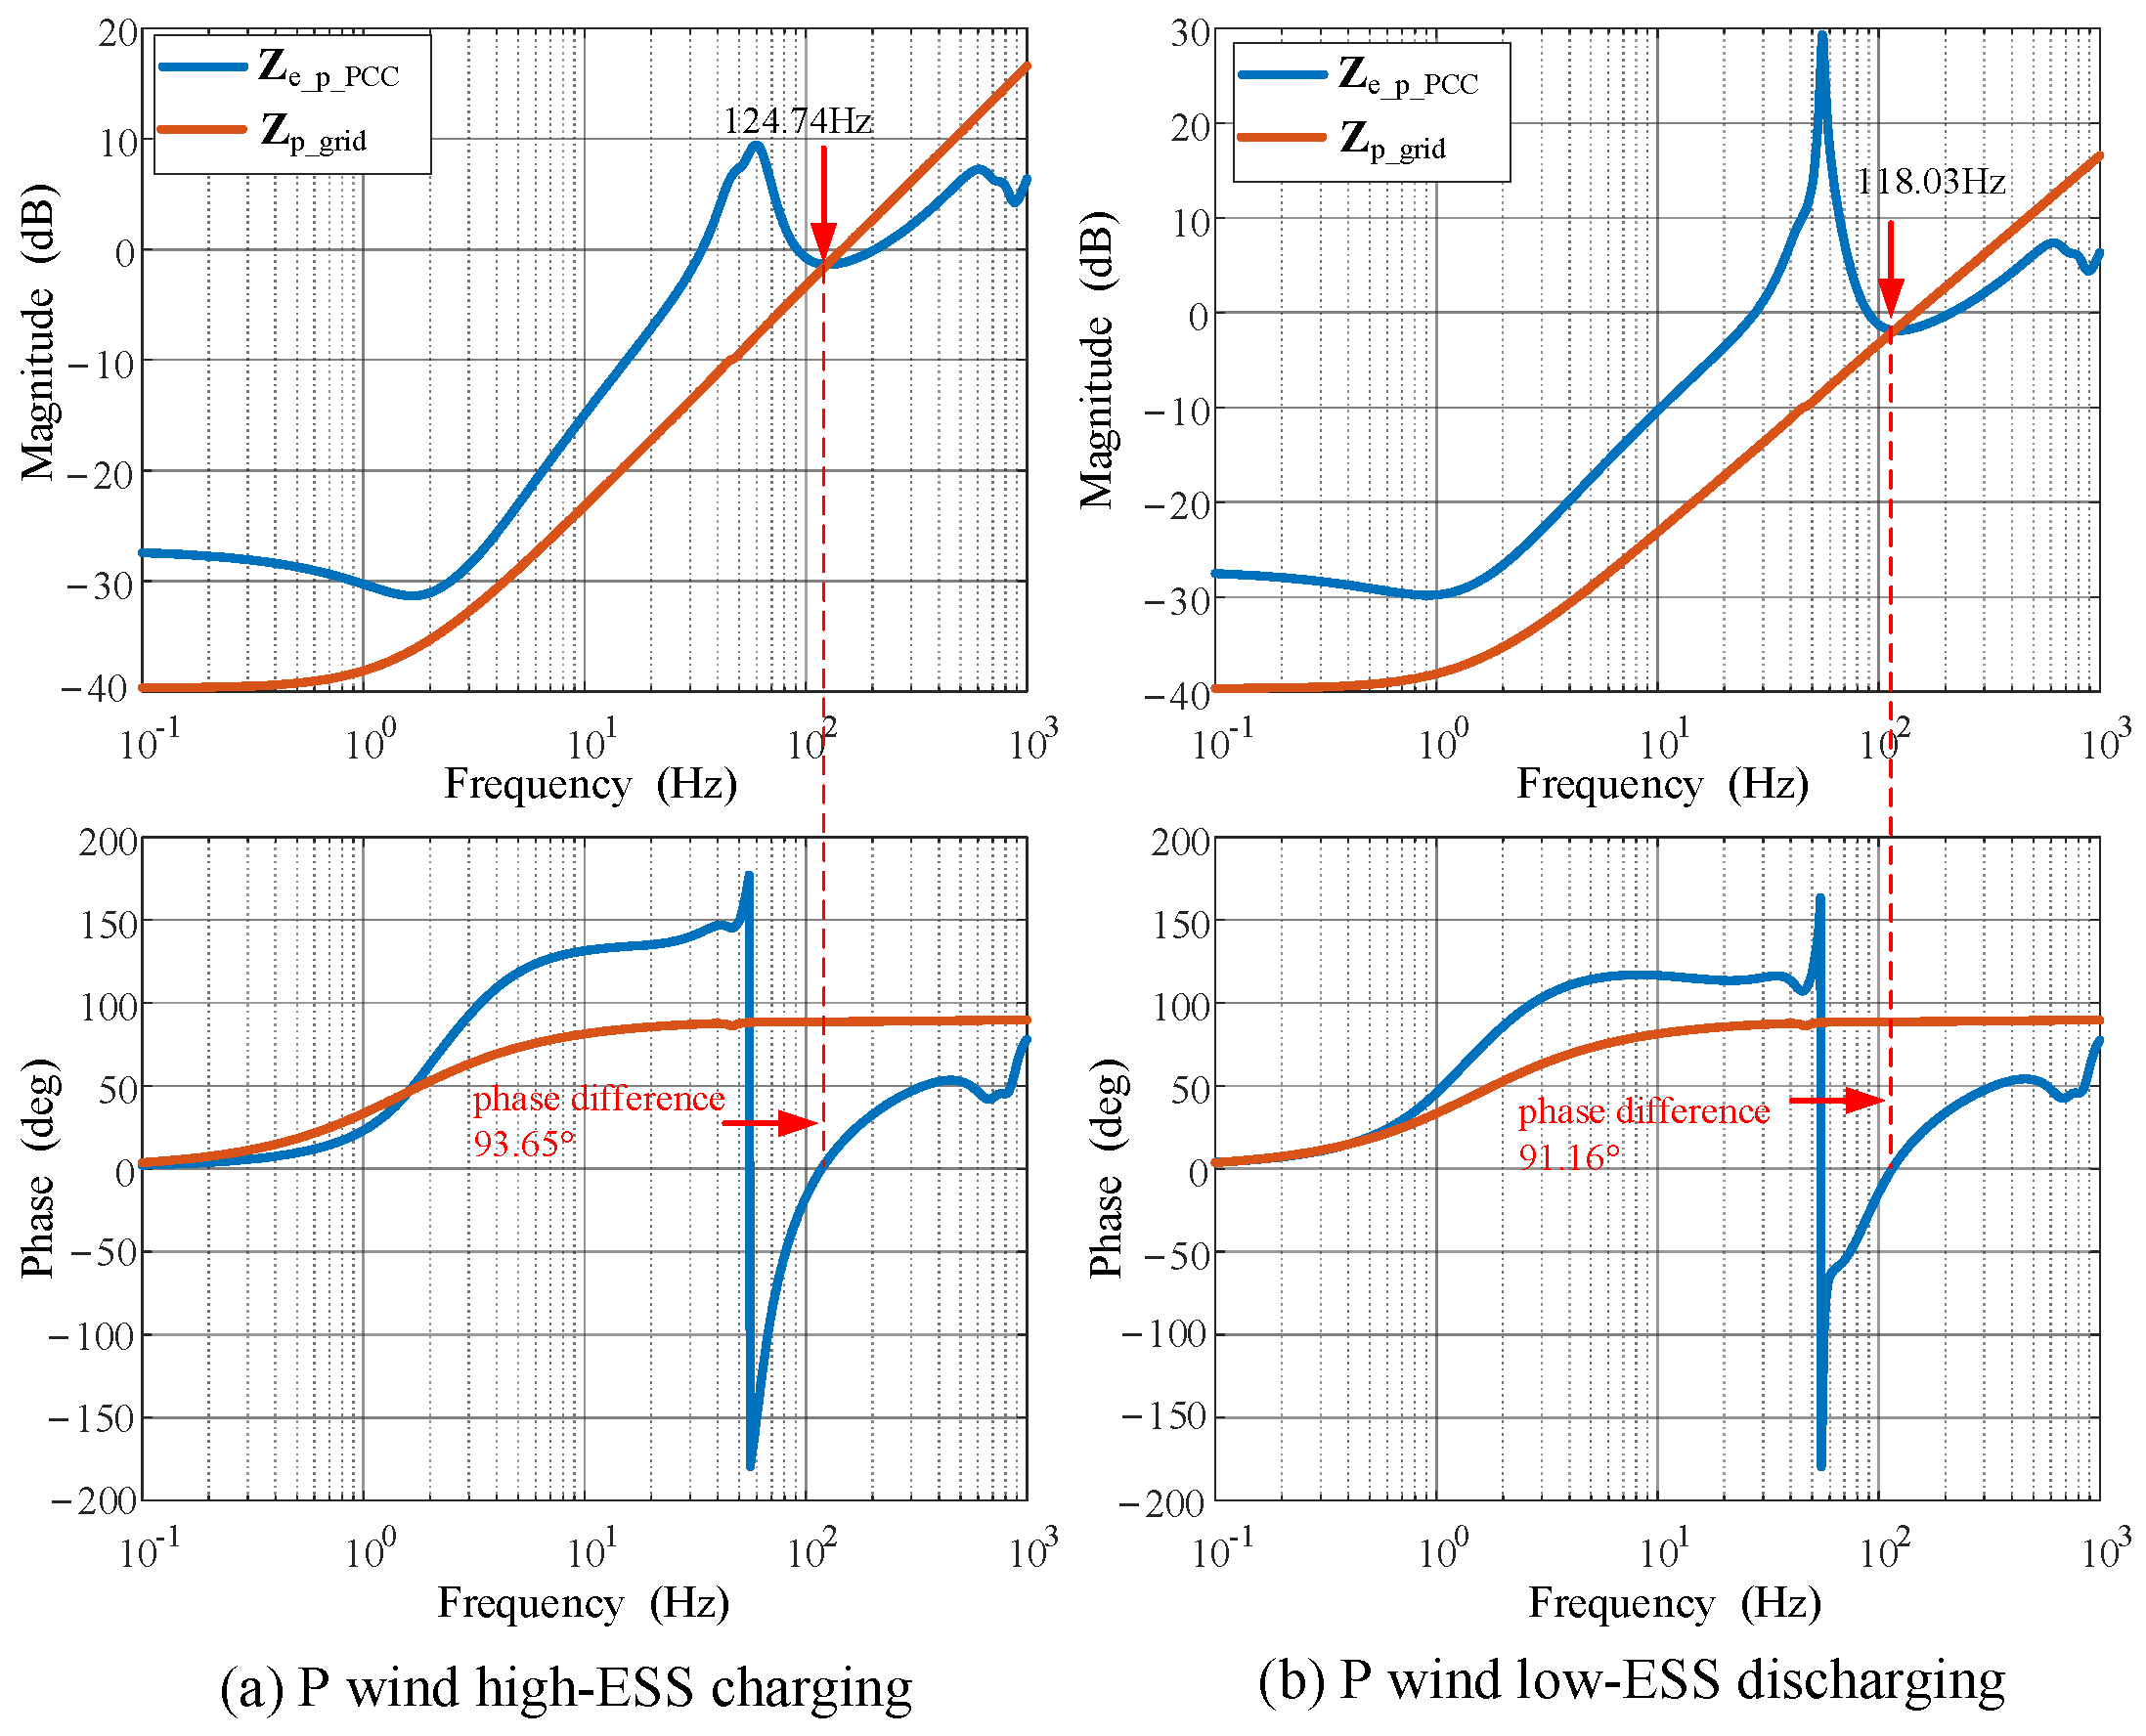
The impedance characteristics in Figure 6 and Figure 7 show that the overall positive-sequence impedance of the plant is inductive in the low- and medium-frequency ranges and becomes capacitive in the super-synchronous frequency range. The capacitive plant output impedance may intersect with the inductive grid-side impedance, which is the sum of the equivalent main-transformer impedance and the overhead-line impedance, thereby creating an oscillation risk under certain operating conditions. By contrast, the negative-sequence impedance of the plant remains inductive over the entire frequency range and cannot intersect with the grid impedance. Therefore, the small-signal stability of this plant can be characterized independently by the positive-sequence impedance channel, and its oscillation risk can be quantitatively assessed using the single-input single-output (SISO) Nyquist criterion based on the positive-sequence impedance Ze_p_PCC.
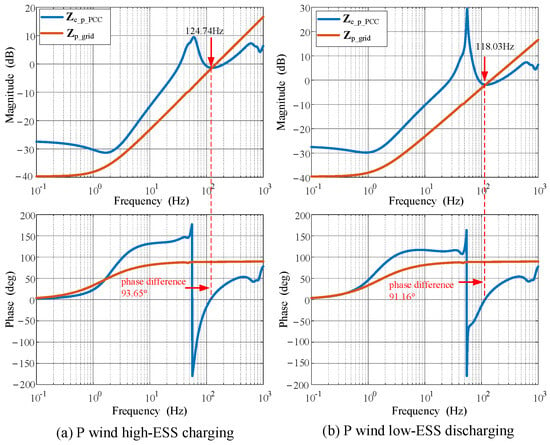
Figure 8 shows the plant and grid impedance characteristics under the two typical operating conditions. The red curves indicate that the grid-side impedance Zp_grid is resistive-inductive over the entire frequency range. As shown in Figure 8a, under high wind-power output and energy-storage charging, the magnitude curves of Ze_p_PCC and Zp_grid have only one intersection at 124.74 Hz, where the phase difference is 93.65° and the phase margin is 86.35°. As shown in Figure 8b, under low wind power output and energy-storage discharging, the impedance-magnitude crossover frequency of Ze_p_PCC and Zpgrid is 118.03 Hz, at which the phase difference is 91.16° and the phase margin is 88.84°. Therefore, small-signal instability does not occur under either of the two typical operating conditions.
Figure 8.
Impedance characteristics of the plant and the grid under typical operating conditions.
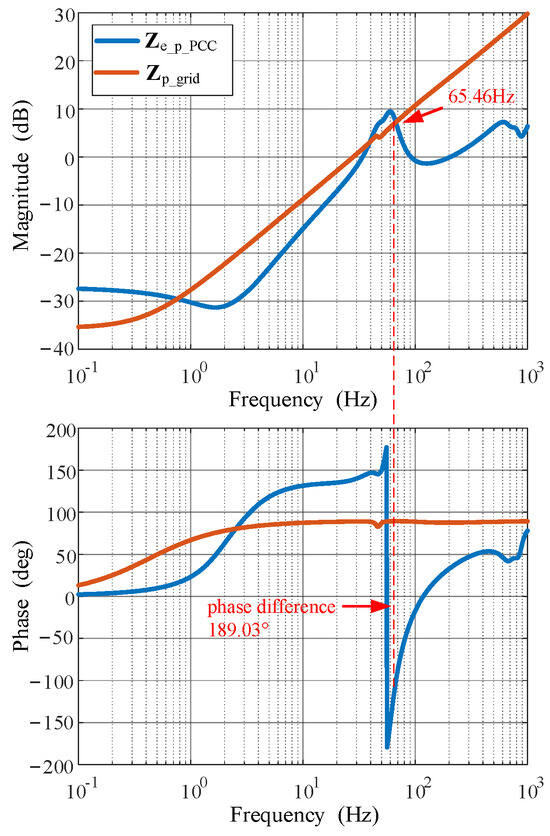
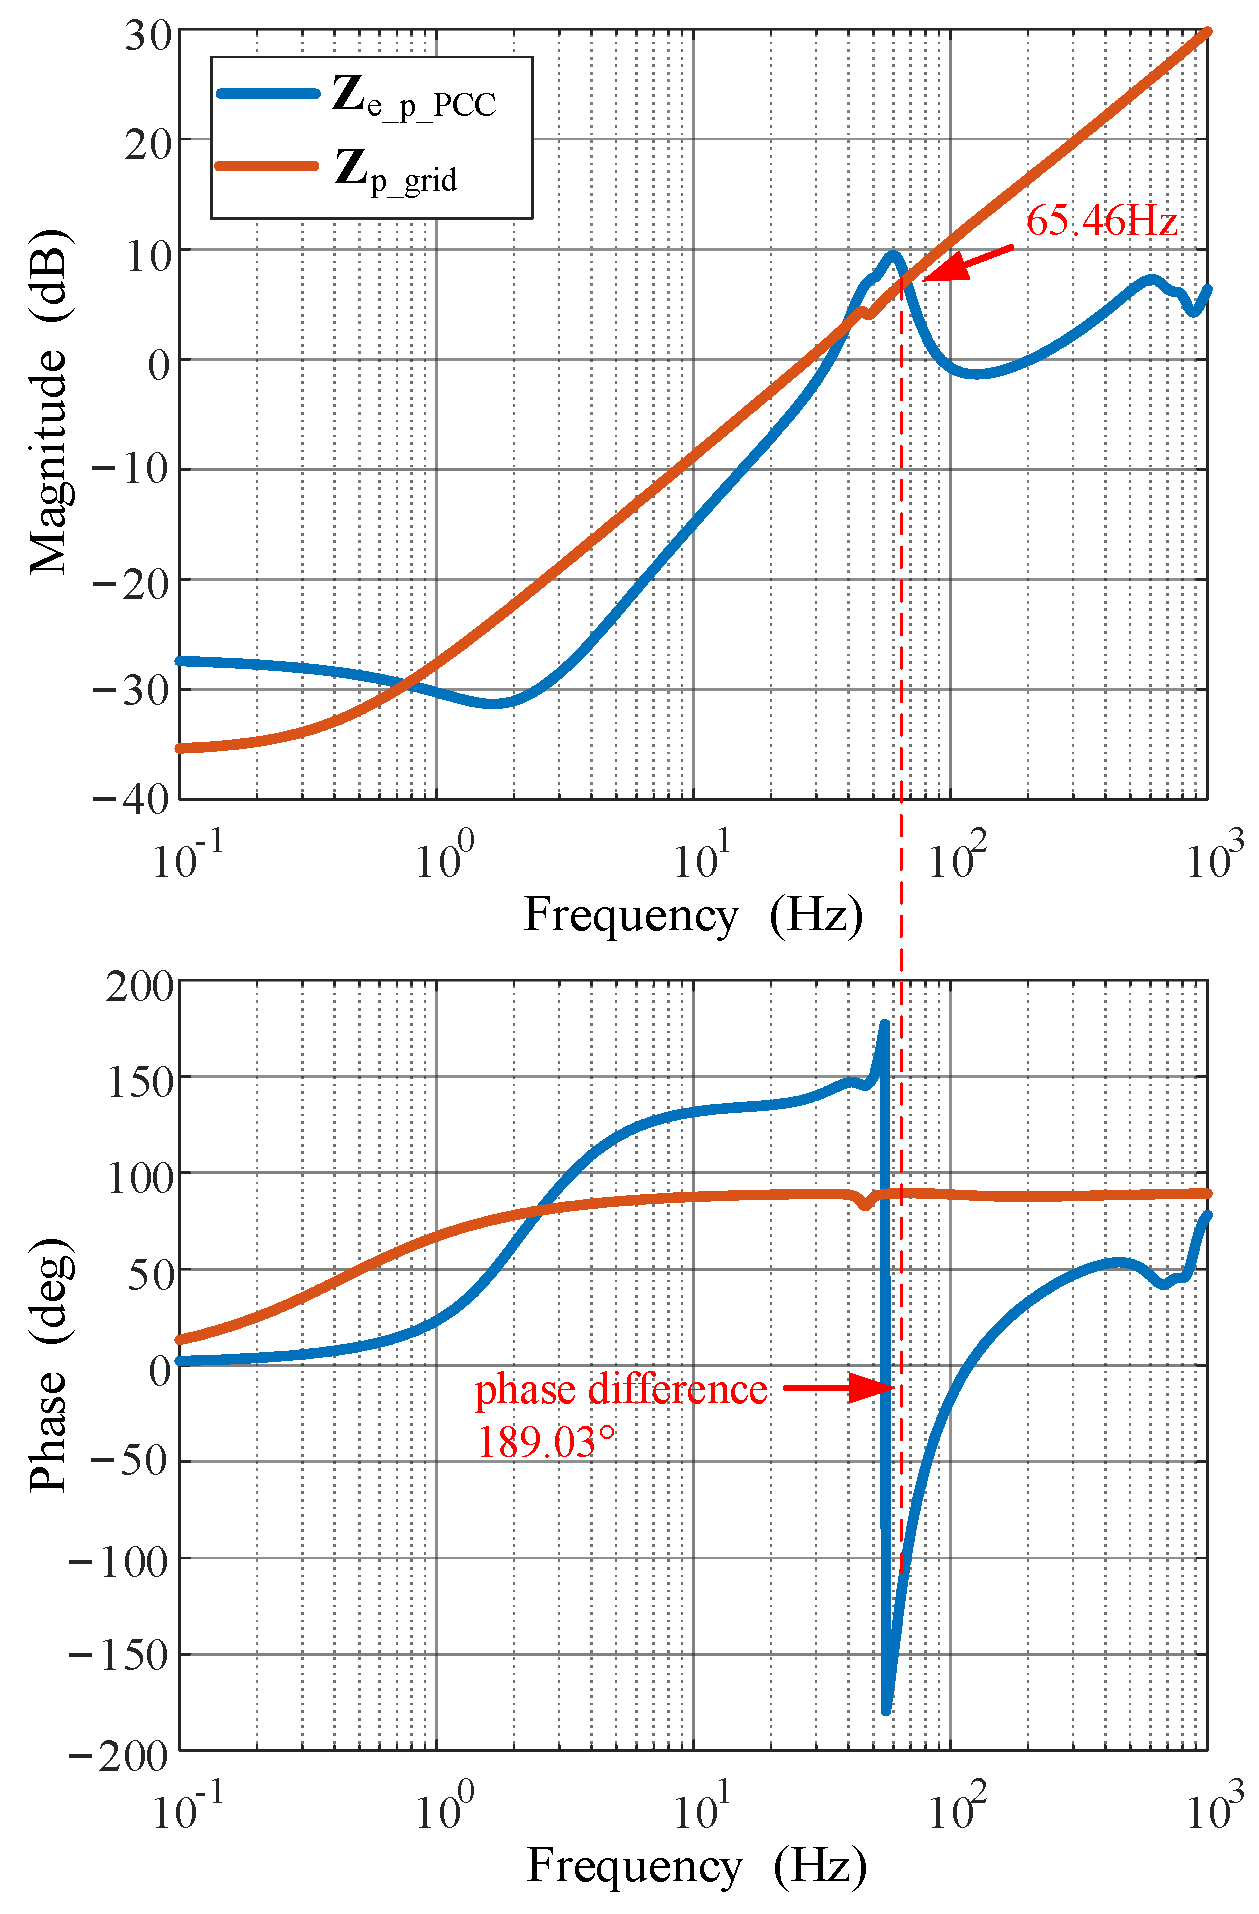
Under the operating condition of high wind power output and energy-storage charging, the grid-side impedance is increased by extending the 220 kV overhead transmission line after the system has reached steady-state operation, without changing any controller parameters. The initial SCR at 35 kV PCC is 2.68, corresponding to connection to a medium-strength grid. After the 220 kV transmission line is extended, its terminal equivalent SCR decreases to 1.43. Figure 9 shows the impedance characteristics after the SCR reduction. At this point, the phase margin between Ze_p_PCC and the Zp_grid at 65.46 Hz is −9.03°, indicating system instability.
Figure 9.
Oscillation impedance characteristics of the plant and the grid under low SCR.
4. Time-Domain Simulation Validation
A time-domain simulation model is developed in MATLAB/Simulink 2024a. The model comprises two GFL-DFIG equivalent units, one GFL-ESS equivalent unit, one GFM-ESS equivalent unit, and one GFL-SVG equivalent unit. The dynamic response and oscillation characteristics of the renewable energy plant are analyzed under different operating conditions.
4.1. Analysis of the Dynamic Response Characteristics of the Renewable Energy Plant
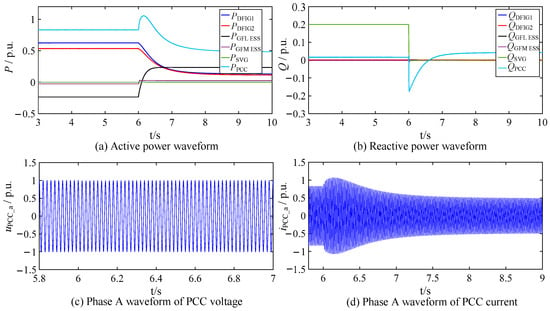
At the beginning of the simulation, a relatively high wind speed is specified, and the wind turbines operate at high output. Both the GFL and GFM energy-storage systems operate in charging mode, while the SVG supplies 192 Mvar of reactive power (base apparent power: SB = 960 MVA). At t = 6 s, the wind speed is reduced substantially, causing the wind turbines to switch to low-output operation. The energy-storage systems then discharge, and the SVG ceases providing reactive-power compensation to the renewable energy plant.
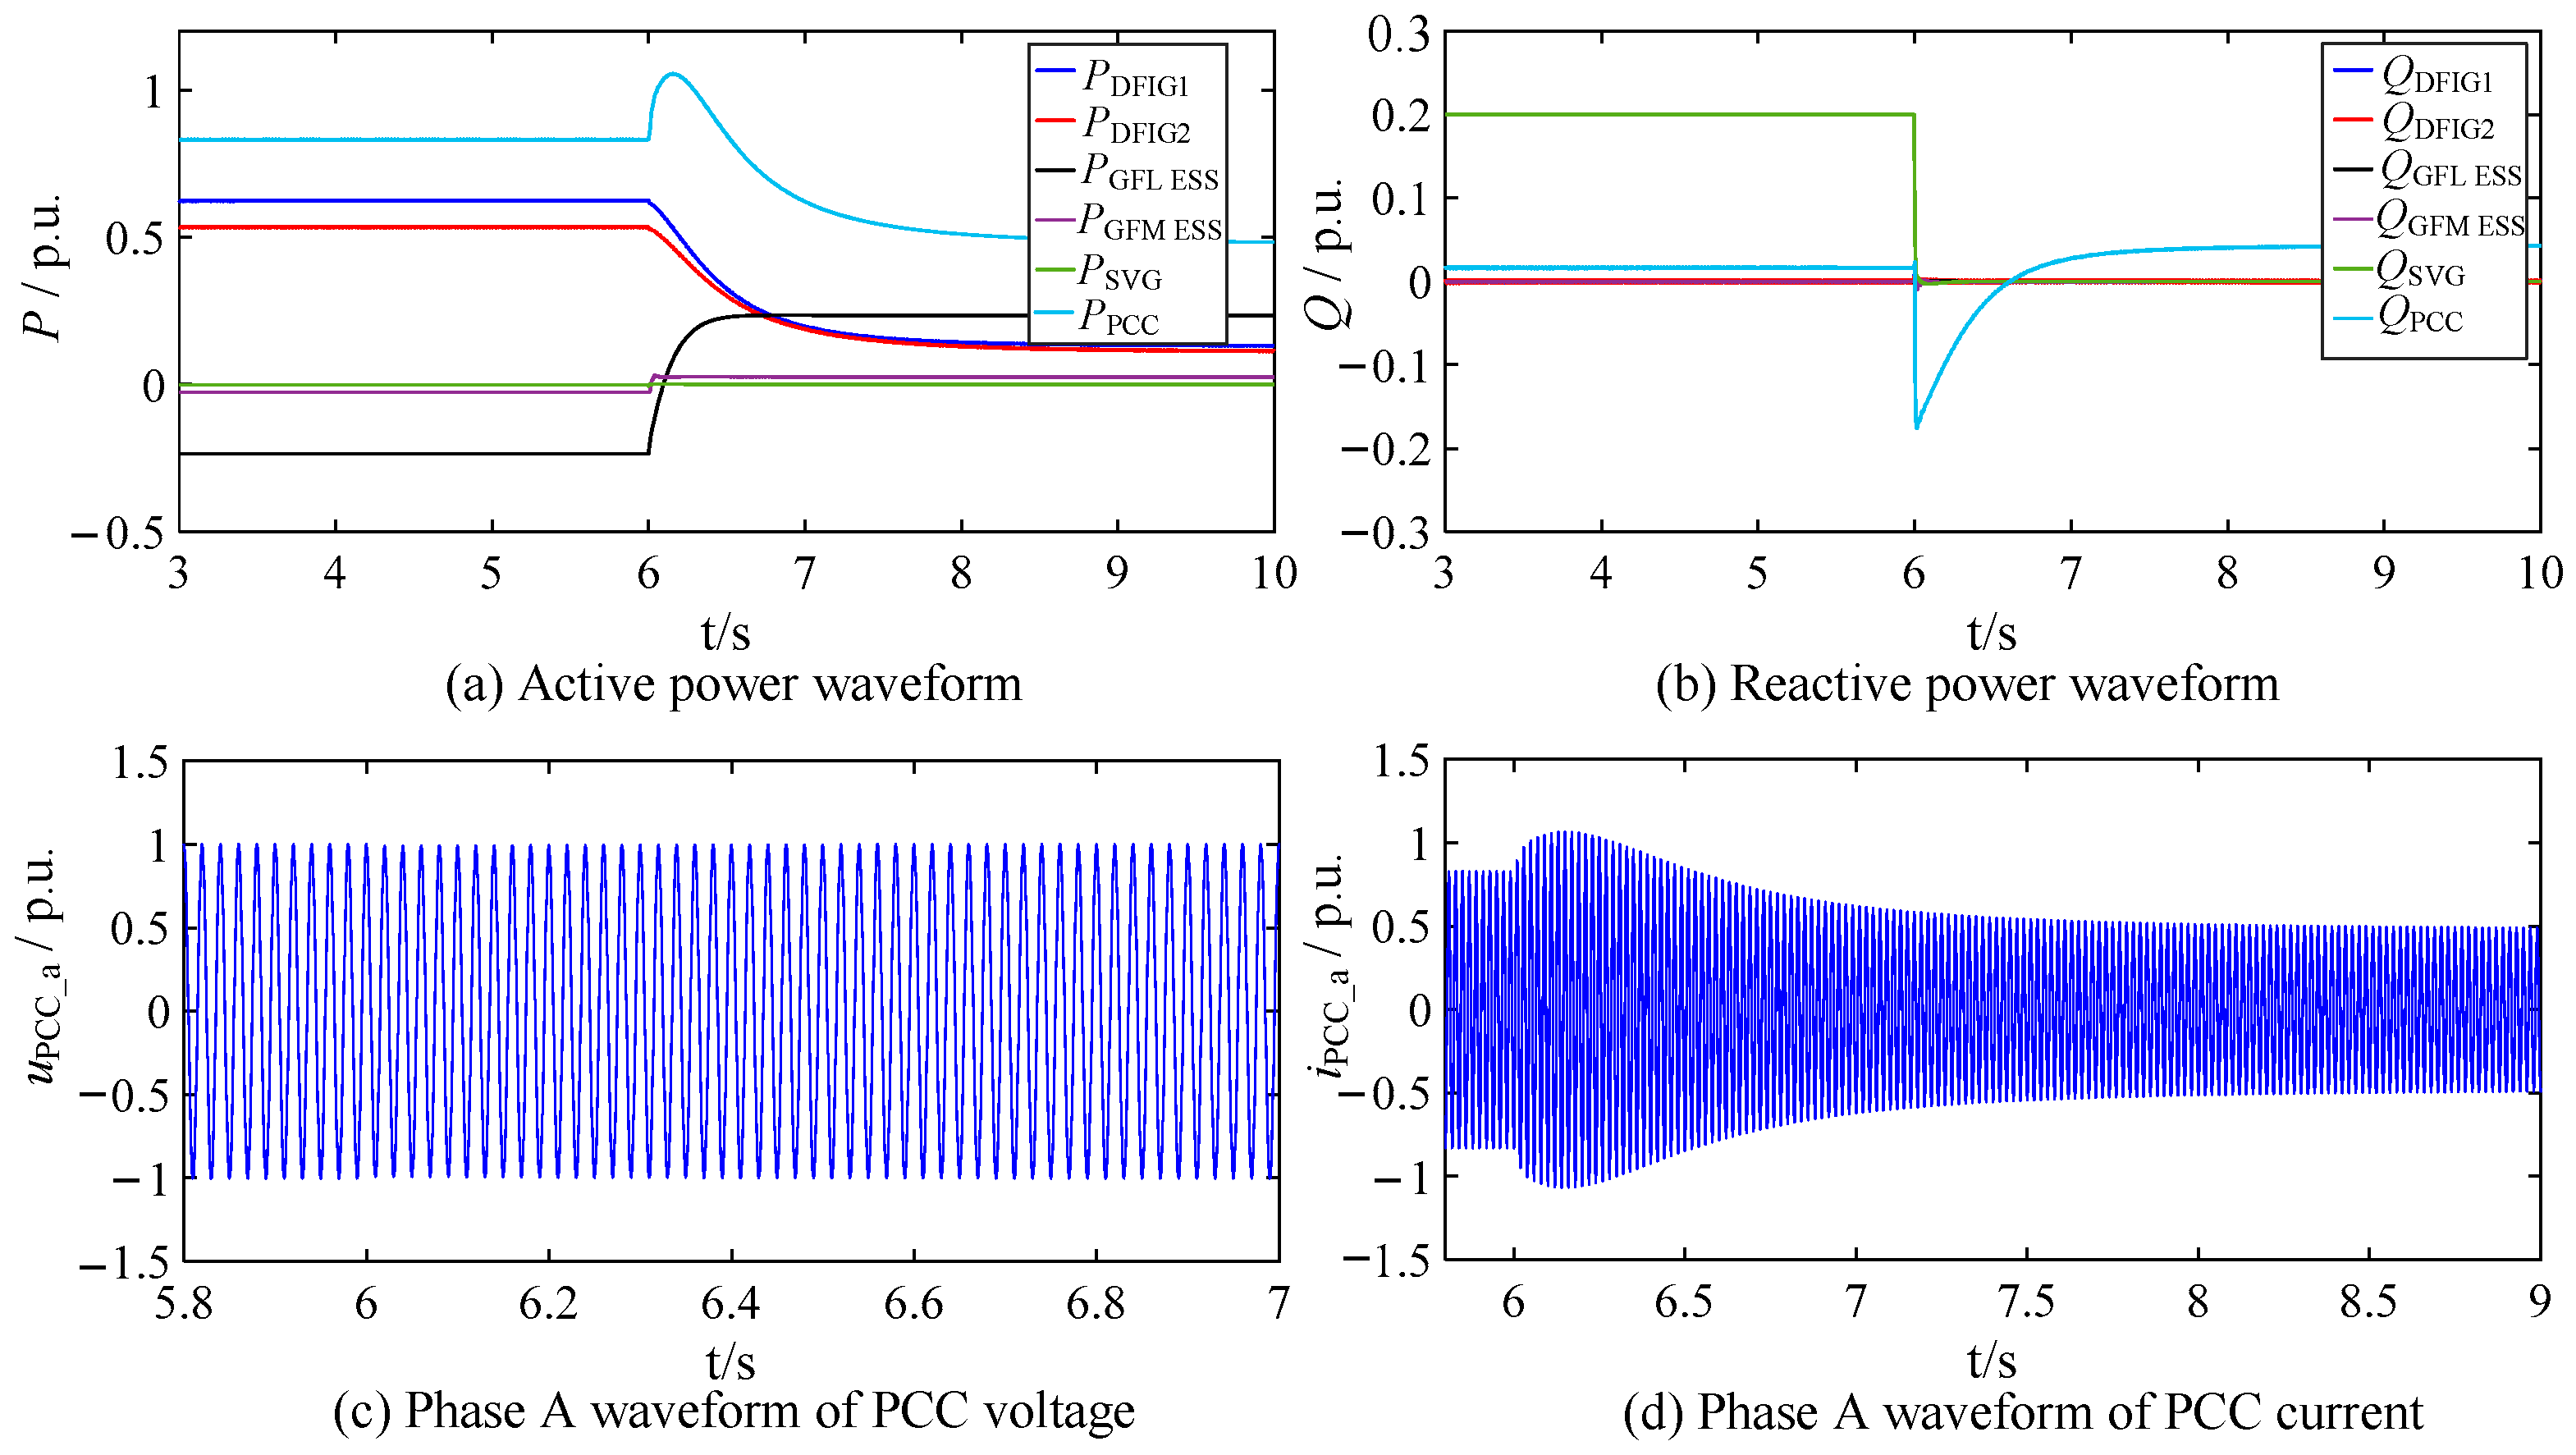
The simulation results are shown in Figure 10. Before t = 6 s, the wind farm operates at full output, the energy-storage systems are charging, and the overall system remains stable. At t = 6 s, the wind speed decreases, reducing the wind-farm output and causing the energy-storage systems to switch to discharging mode. After a transient process, the plant reaches a new steady-state operating point without oscillation. The total active-power output of the plant decreases, its internal reactive-power demand is reduced, and the reactive-power command of the SVG is switched to zero. Further examination of the PCC voltage uPCCa and current iPCCa shows that the PCC voltage fluctuates only slightly during the transient, while the PCC current reaches a new steady state after approximately 2 s. These results are consistent with the impedance characteristics and stability conclusions presented in Figure 8.
Figure 10.
Simulated dynamic response of the renewable energy plant under typical operating conditions.
4.2. Analysis of the Oscillation Characteristics of the Renewable Energy Plant
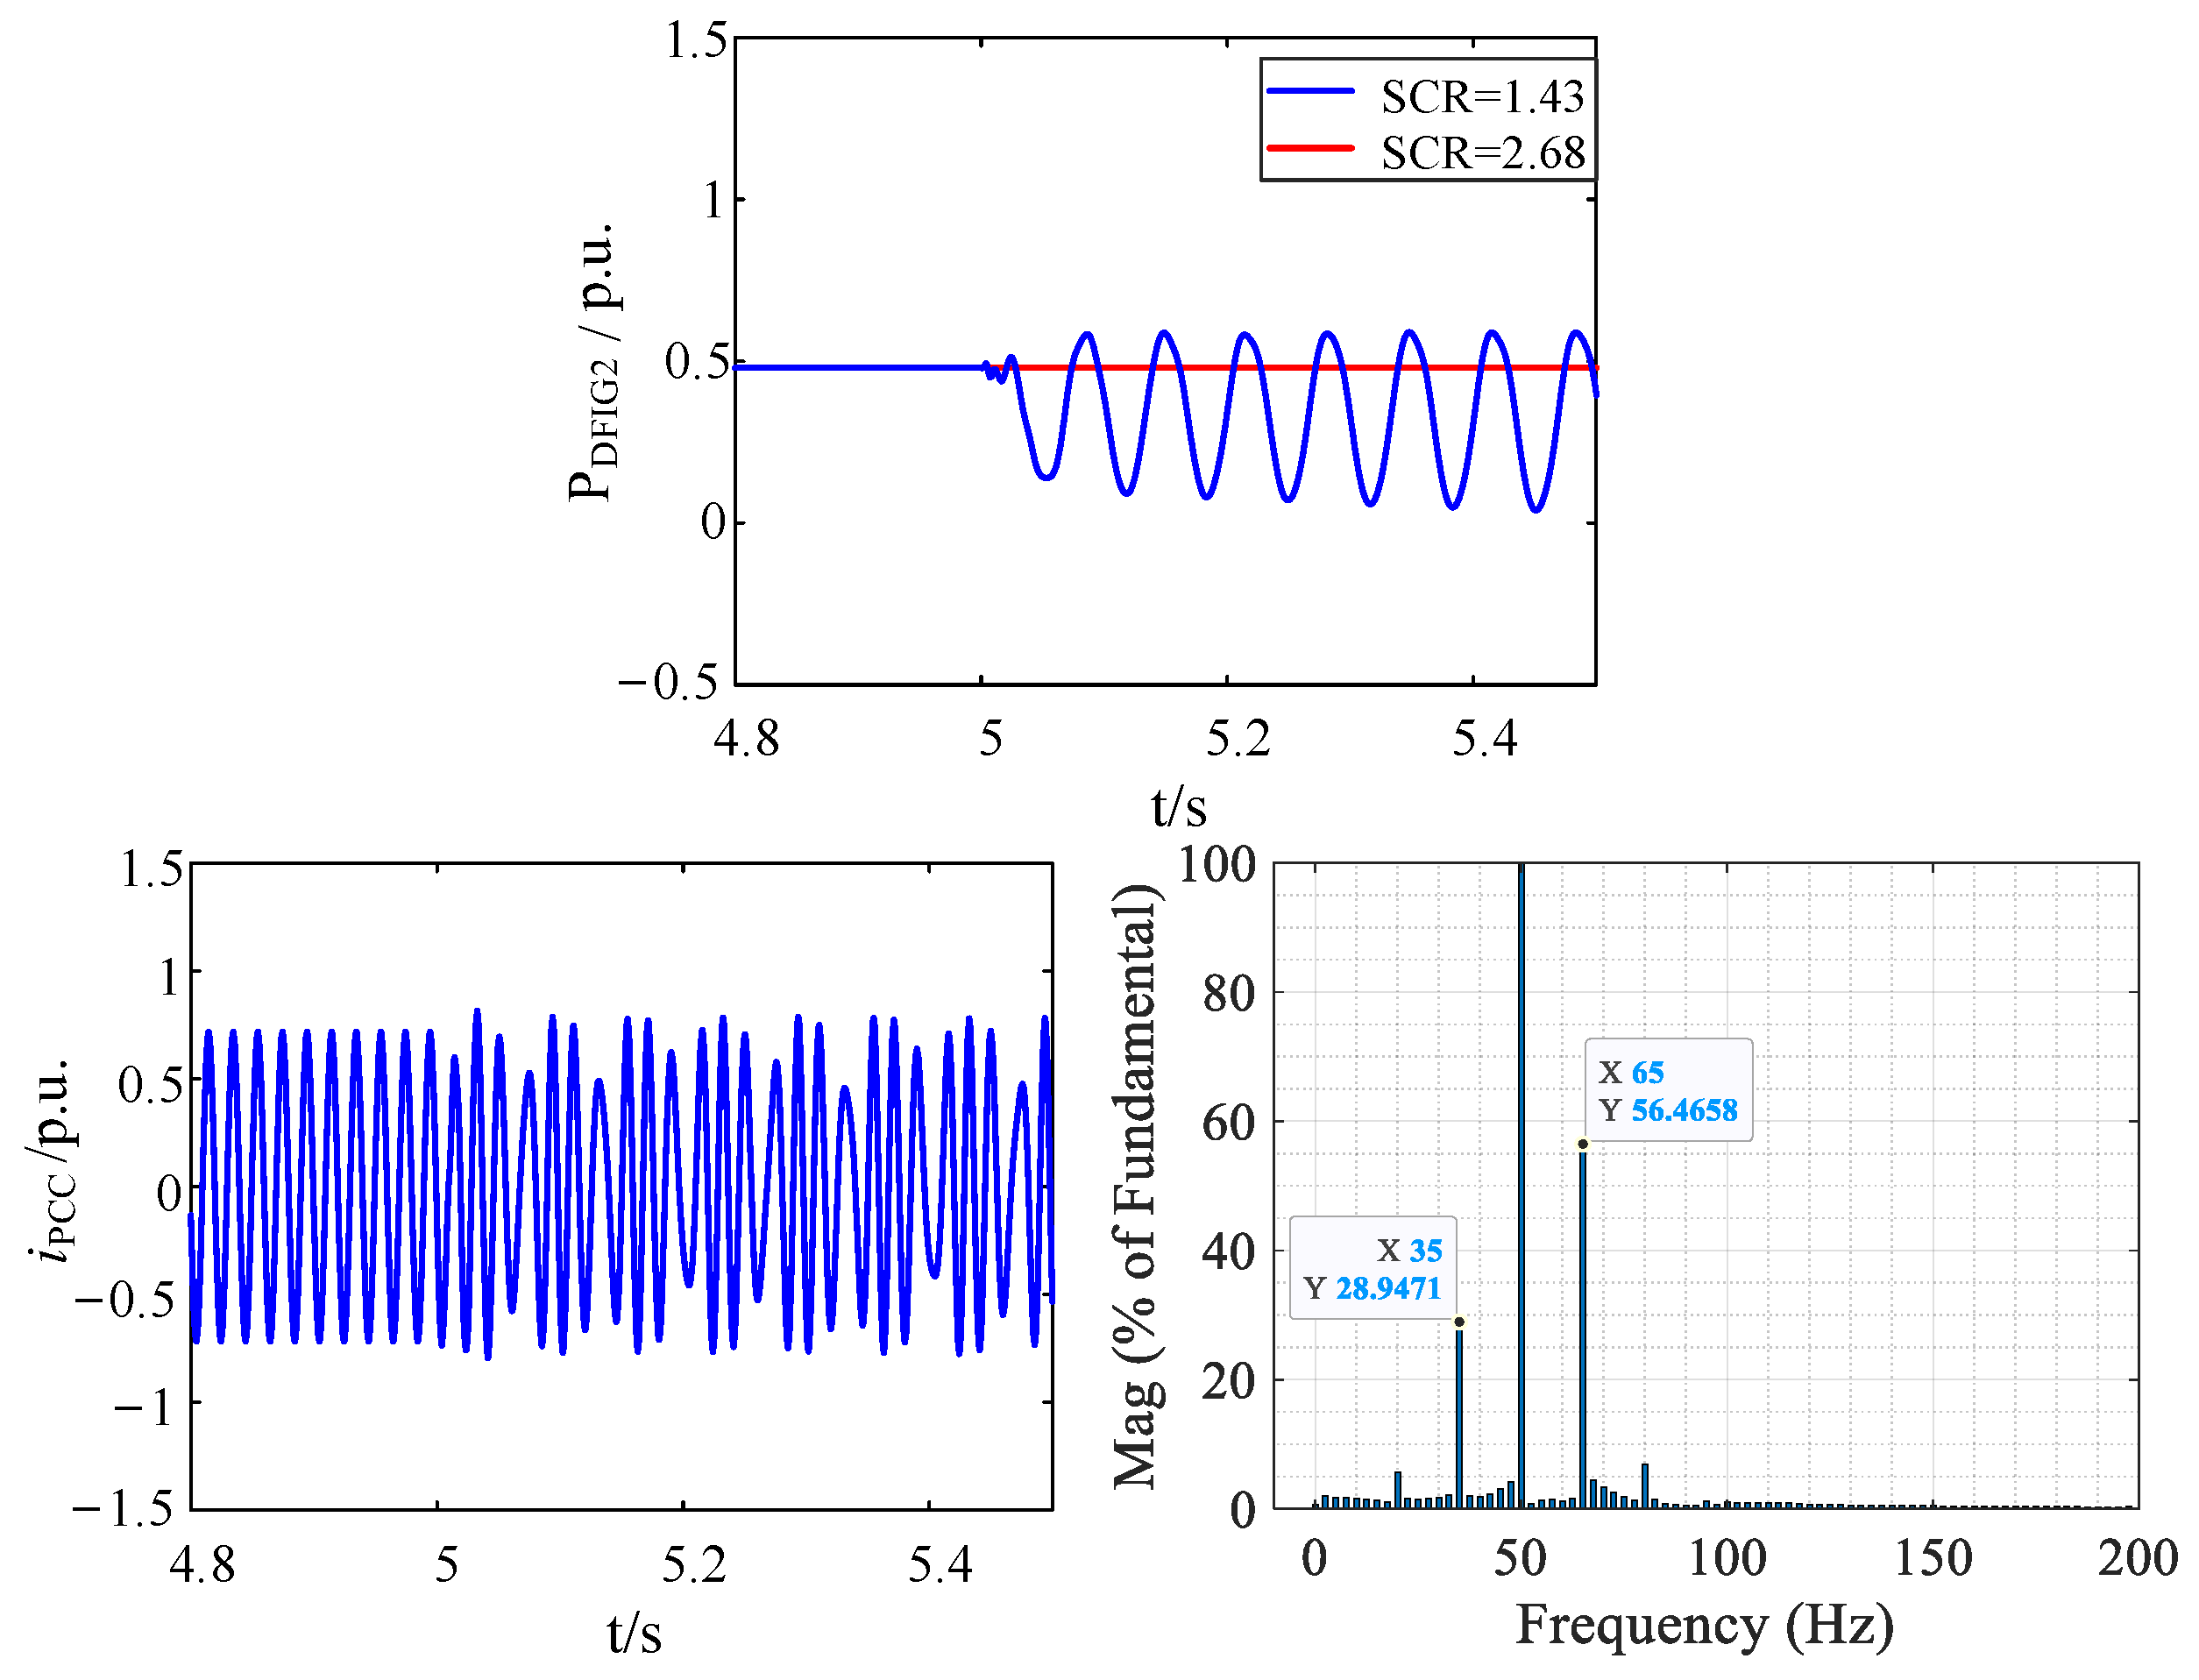
Under the operating condition of high wind power output and energy-storage charging, the plant is first allowed to reach steady-state operation. At t = 5 s, the 220 kV transmission line length is changed to increase the grid impedance. The initial SCR at 35 kV is 2.68 and decreases to 1.43 after t = 5 s. A small disturbance is then injected into DFIG equivalent unit 2 in the simulation to determine whether the system develops an oscillation.
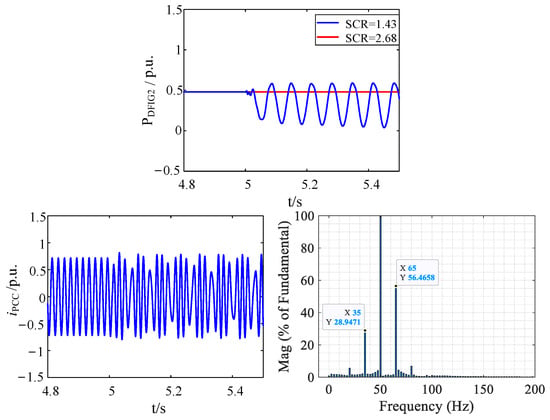
The active-power output of DFIG equivalent unit 2, the PCC current waveform, and the corresponding fast Fourier transform (FFT) results under different SCRs are shown in Figure 11. When the SCR is 2.68, the system remains stable after the small disturbance and no oscillation occurs. When the SCR decreases to 1.43, the active power and PCC current exhibit periodic oscillations. The FFT results show pronounced harmonic components in the PCC current at 65 and 35 Hz, with 65 Hz being the dominant oscillation frequency. This result is consistent with the theoretical analysis in Figure 9, in which the plant impedance Ze_p_PCC intersects the grid impedance Zp_grid at 65.46 Hz and the corresponding stability margin is negative.
Figure 11.
Simulated oscillation characteristics of the renewable energy plant under low SCR.
5. Conclusions
This paper proposes a K-means-based clustering and equivalent-model simplification method for the China Resources Santanghu project in Xinjiang. The plant is represented by a parallel system of five equivalent units: a near-end DFIG cluster, a far-end DFIG cluster, a GFL-ESS, a GFM-ESS, and an SVG. A total terminal-impedance model is then developed for the parallel equivalent-unit system to characterize the grid-connected dynamic behavior of the renewable energy plant. The theoretical total impedance models agree closely with the time-domain simulation frequency-sweep results, validating the accuracy and feasibility of the proposed clustering-based equivalent-model simplification method. Finally, the intersections between the total terminal impedance and the grid-side impedance are analyzed using the Nyquist criterion to determine the grid-connected stability of the renewable energy plant, and the conclusions are verified using time-domain simulations.
Finally, it is worth noting that the proposed approach is not limited to the plant studied in this work. The K-means-based clustering method, the parameter scaling based on the principles of equal capacity and equal power loss, and the whole-plant model established from the impedance models of the individual equivalent units have fully considered the influence of different topologies and device configurations. The method is therefore generally applicable and transferable to other hybrid renewable energy plants integrating diverse device types, providing a useful reference for the equivalent modeling and stability analysis of large-scale hybrid plants. Future work will further validate the method on hybrid plants with other topology and device combinations.
Author Contributions
Conceptualization, S.W. and J.W.; methodology, S.W.; software, L.C.; validation, S.W. and Y.S.; resources, Y.S.; data curation, L.C.; writing—original draft preparation, S.W.; writing—review and editing, S.W. and L.C.; supervision, J.W.; project administration, S.W. and Y.S.; funding acquisition, S.W. All authors have read and agreed to the published version of the manuscript.
Funding
This research was funded by Research and Demonstration Application Project of China Resources Power Holdings Co., Ltd. (Project No: CRP-R&D-LX-2023-025).
Data Availability Statement
The data that support the findings of this study are available from the corresponding author, S.W., upon reasonable request and subject to confidentiality agreements.
Conflicts of Interest
Author Shike Wang and Yabing Sun were employed by the company China Resources Power Technology Research Institute Co., Ltd. The authors declare that this study received funding from Research and Demonstration Application Project of China Resources Power Holdings Co., Ltd. the funder were not involved in this study design, collection, analysis, interpretation of data, the writing of this article or the decision to submit it for publication.
Appendix A
Appendix A provides the electrical parameters of the wind-turbine pad-mounted transformers and collector lines, the energy-storage pad-mounted transformers and collector lines, and the main transformers, as well as the control parameters of the equivalent units applied in the modeling and simulation.
- Wind turbines
Table A1.
Parameters of the pad-mounted transformer of a single wind turbine.
Table A2.
Parameters of 40 wind-power collector lines.
Table A3.
Parameters of overhead lines of wind-power collector lines.
- 2.
- Energy storage
The energy storage systems are connected to the 35 kV bus through buried cables of type ZC-YJY23-26/35-1 × 240; the impedance parameters are as follows:
Table A4.
Parameters of buried cables of energy storage systems.
Table A5.
The lengths of the energy storage systems collector lines.
Table A6.
Parameters of the pad-mounted transformer of a 2.5 MW/10 MWh GFL energy-storage unit.
Table A7.
Parameters of the pad-mounted transformer of a 3 MW/12 MWh GFM energy-storage unit.
Table A8.
Parameters of the pad-mounted transformer of a 1 MW/4 MWh GFM energy-storage unit.
- 3.
- Main transformers
Table A9.
Parameters of thefour main transformers.
- 4.
- Control parameters
According to Refs. [10,11,12,13,14,15,16,17,18], if the control loops of an individual device are designed based on the per-unit values of the control feedback quantities (voltage, current, and power), the control parameters remain unchanged after multiple devices of the same model are aggregated. However, in most theoretical studies and engineering practice, the voltage, current, and power loops of converters generally adopt PI controllers with parameters designed in physical units. After multiple devices are aggregated, the equivalent capacity and the physical values of the current and power of the equivalent unit are multiplied, and the impedance parameters of the equivalent output transformer change completely. The new control parameters of the equivalent unit therefore need to be redesigned according to reasonable ranges of control bandwidth and damping ratio, and there is no quantifiable equivalence relation with the single-unit control parameters.
The control parameters of the five equivalent units are given in the following table:
Table A10.
Control parameters of the five equivalent units.
References
- Gao, X.; Zhou, D.; Anvari-Moghaddam, A.; Blaabjerg, F. Stability Analysis of Grid-Following and Grid-Forming Converters Based on State-Space Modelling. IEEE Trans. Ind. Appl. 2024, 60, 4910–4920. [Google Scholar] [CrossRef] [Scilit]
- Liu, N.; Wang, H.; Sun, L.; Zhou, W.; Song, J.; Zhou, D.; Wang, W.; Chen, Z. Modular Impedance Modeling and Stability Analysis of Hybrid AC/DC Power Systems with Grid-Forming and Grid-Following Converters. IEEE Access 2024, 12, 4063–4077. [Google Scholar] [CrossRef] [Scilit]
- Li, X.; Chen, C.; Gan, L.; Bai, C.; He, T. Small-Signal Stability Analysis of Parallel Grid-Connected System with Grid-Forming Converter and Grid-Following Converter. In Proceedings of the 2024 IEEE China International Youth Conference on Electrical Engineering (CIYCEE), Wuhan, China, 6–8 November 2024; pp. 1–6. [Google Scholar]
- Chi, S.; Zhang, R.; Chen, A.; Cheng, C.; Sun, S.; Yu, P.; Cheng, Y. Interaction Stability Analysis and Oscillation Suppression Method of Hybrid Grid-Forming and Grid-Following Inverters System with Varying Power Levels. IEEE Trans. Ind. Electron. 2026, 73, 755–766. [Google Scholar] [CrossRef] [Scilit]
- Li, X.; Chen, C.; Wei, T.; He, T.; Zhong, Y.; Bai, C. Stability Analysis and Enhancement for the Grid-Connected System Comprising Grid-Forming and Grid-Following Converters. IEEE J. Emerg. Sel. Top. Power Electron. 2026, 14, 5098–5109. [Google Scholar]
- MacFarlane, A.G.J.; Postlethwaite, I. The Generalized Nyquist Stability Criterion and Multivariable Root Loci. Int. J. Control 1977, 25, 81–127. [Google Scholar] [CrossRef] [Scilit]
- Belkhayat, M. Stability Criterion for AC Power Systems with Regulated Loads. Ph.D. Dissertation, Purdue University, West Lafayette, IN, USA, 1997. [Google Scholar]
- Wang, H.; Lin, X.; Cao, T.; Hu, Y.; Fan, C. Impedance Modeling and Stability Analysis of Grid-Following and Grid-Forming Inverters Considering Frequency Coupling. In Proceedings of the 2025 4th Asian Conference on Frontiers of Power and Energy (ACFPE), Chengdu, China, 24–26 October 2025; pp. 554–559. [Google Scholar]
- Wang, J.; Hu, X.; Li, J.; Wang, Y. Stability Analysis of Multi-Parallel Hybrid Grid-Following/Grid-Forming Converter Systems. In Proceedings of the 2026 9th International Conference on Electrical Engineering and Green Energy (CEEGE), Yangzhou, China, 8–10 May 2026; pp. 511–516. [Google Scholar]
- Wang, H.; He, G.; Liu, C.; Wang, C.; Li, Y.; Wang, H. Equivalent Method for Sequence Impedance Model of Wind Farms Considering Frequency Coupling and Collecting Network. Autom. Electr. Power Syst. 2019, 43, 87–92. (In Chinese) [Google Scholar]
- Sun, H.; Li, J.; Li, W.; Guo, J.; Guo, Q.; He, J. Research on Model Structures and Modeling Methods of Renewable Energy Station for Large-Scale Power System Simulation (I): Model Structure. Proc. CSEE 2023, 43, 1378–1388. (In Chinese) [Google Scholar]
- Sun, H.; Li, J.; Li, W.; Guo, J.; An, N.; Zhang, Y. Research on Model Structures and Modeling Methods of Renewable Energy Station for Large-Scale Power System Simulation (II): Electromechanical Transient Model. Proc. CSEE 2023, 43, 2190–2201. (In Chinese) [Google Scholar]
- Zhou, P.; Sun, H.; Xiang, Z.; Guo, J.; Liu, M.; Zhang, J. Research on Model Structures and Modeling Methods of Renewable Energy Station for Large-Scale Power System Simulation (III): Electromagnetic Transient Model. Proc. CSEE 2023, 43, 2990–2999. (In Chinese) [Google Scholar]
- Lin, L.; Pan, X.; Zhang, L.; Zhao, S. The K-means Clustering Algorithm for Wind Farm Based on Immune-Outlier Data and Immune-Sensitive Initial Center. Proc. CSEE 2016, 36, 5461–5468. (In Chinese) [Google Scholar]
- Zhu, X.; Pan, Z. Impedance-Model-Based SSR Study Considering DFIGs at Different Locations. In Proceedings of the 2017 20th International Conference on Electrical Machines and Systems (ICEMS), Sydney, Australia, 11–14 August 2017; pp. 1–5. [Google Scholar]
- Jiang, H.; You, J.; Liu, H.; Ning, W.; Wu, L. Impedance Characteristics of DFIGs Considering the Impacts of DFIG Numbers and Locations and Its Application on SSR Analysis. In Proceedings of the 2017 IEEE Power & Energy Society General Meeting (PESGM), Chicago, IL, USA, 16–20 July 2017; pp. 1–8. [Google Scholar]
- Chao, P.; Li, W.; Liang, X.; Xu, S.; Shuai, Y. An Analytical Two-Machine Equivalent Method of DFIG-Based Wind Power Plants Considering Complete FRT Processes. IEEE Trans. Power Syst. 2021, 36, 3657–3667. [Google Scholar] [CrossRef] [Scilit]
- Guo, C.; Gan, F.; Du, D.; Guo, Y.; Cheng, H. Applicability Evaluation of Wind Farm Impedance Models Using Different Aggregation Methods for High Frequency Oscillation Analysis. IEEE Trans. Power Deliv. 2024, 39, 2231–2242. [Google Scholar] [CrossRef] [Scilit]
- Mehrjoo, M.; Jafari Jozani, M.; Pawlak, M.; Bagen, B. A Multilevel Modeling Approach Towards Wind Farm Aggregated Power Curve. IEEE Trans. Sustain. Energy 2021, 12, 2230–2237. [Google Scholar] [CrossRef] [Scilit]
- Ikotun, A.M.; Ezugwu, A.E.; Abualigah, L.; Abuhaija, B.; Jia, H. K-means Clustering Algorithms: A Comprehensive Review, Variants Analysis, and Advances in the Era of Big Data. Inf. Sci. 2023, 622, 178–210. [Google Scholar] [CrossRef] [Scilit]
- Miraftabzadeh, S.M.; Colombo, C.G.; Longo, M.; Foiadelli, F. K-Means and Alternative Clustering Methods in Modern Power Systems. IEEE Access 2023, 11, 119596–119633. [Google Scholar] [CrossRef] [Scilit]
- Arthur, D.; Vassilvitskii, S. k-means++: The Advantages of Careful Seeding. In Proceedings of the 18th Annual ACM-SIAM Symposium on Discrete Algorithms (SODA), New Orleans, LA, USA, 7–9 January 2007; pp. 1027–1035. [Google Scholar]
- Vieto, I.; Sun, J. Sequence Impedance Modeling and Analysis of Type-III Wind Turbines. IEEE Trans. Energy Convers. 2018, 33, 537–545. [Google Scholar] [CrossRef] [Scilit]
- Li, F.; Wen, S.; Zhang, Y.; Ma, M.; Zhang, X. Simplified Method of Sequence Impedance Modeling for Doubly-Fed Induction Generator. J. Power Supply 2021, 19, 10–18. (In Chinese) [Google Scholar]
- Zhang, X.; Qiu, W.; Fang, R.; Zhu, L.; Xu, D. Impedance Modeling and Sub-Synchronous Resonance Mitigation Strategy of DFIG-Based Wind Turbine in Static Reference Frame. Autom. Electr. Power Syst. 2019, 43, 41–48. (In Chinese) [Google Scholar]
- Wang, Y.; Chen, X.; Chen, J.; Gong, C. Analysis of Positive-Sequence and Negative-Sequence Impedance Modeling of Three-Phase LCL-Type Grid-Connected Inverters Based on Harmonic Linearization. Proc. CSEE 2016, 36, 5890–5898. (In Chinese) [Google Scholar]
- Cespedes, M.; Sun, J. Impedance Modeling and Analysis of Grid-Connected Voltage-Source Converters. IEEE Trans. Power Electron. 2014, 29, 1254–1261. [Google Scholar] [CrossRef] [Scilit]
- Wu, W.; Chen, Y.; Zhou, L.; Luo, A.; Zhou, X.; Huang, X.; Yang, L.; Xie, Z. Sequence Impedance Modeling and Stability Analysis of Virtual Synchronous Generator Connected to Weak Grid. Proc. CSEE 2019, 39, 1560–1571. (In Chinese) [Google Scholar]
- Liu, X.; Guo, Z.; Jia, J.; Wang, L. Stability Analysis and Virtual Impedance Design of Virtual Synchronous Machine Based on Sequence Impedance. Trans. China Electrotech. Soc. 2023, 38, 4130–4146. (In Chinese) [Google Scholar]
- Zhang, Y.; Sun, L.; Chen, X.; Chen, J.; Gong, C.; He, G.; Wang, H.; Li, G. Sequence Impedance Network Model and Stability Analysis of Direct-Drive Wind Farm Integrated with Static Var Generator. Proc. CSEE 2020, 40, 2877–2890. (In Chinese) [Google Scholar]
- Bakhshizadeh, M.K.; Wang, X.; Blaabjerg, F.; Hjerrild, J.; Kocewiak, L.; Bak, C.L.; Hesselbaek, B. Couplings in Phase Domain Impedance Modeling of Grid-Connected Converters. IEEE Trans. Power Electron. 2016, 31, 6792–6796. [Google Scholar] [CrossRef] [Scilit]
- Zhang, D.; Chen, X.; Zhang, Y.; Chen, J.; Wang, H.; He, G.; Guo, X. Stability Analysis and Oscillation Participation Risk Assessment Method of Wind Farm Based on Active-Node Sequence Impedance Model. Proc. CSEE 2023, 43, 3832–3843. (In Chinese) [Google Scholar]
- Liu, H.; Xie, X.; Zhang, C.; Li, Y.; Liu, H.; Hu, Y. Quantitative SSR Analysis of Series-Compensated DFIG-Based Wind Farms Using Aggregated RLC Circuit Model. IEEE Trans. Power Syst. 2017, 32, 474–483. [Google Scholar] [CrossRef] [Scilit]
- Zhang, H.; Harnefors, L.; Wang, X.; Gong, H.; Hasler, J.-P. Stability Analysis of Grid-Connected Voltage-Source Converters Using SISO Modeling. IEEE Trans. Power Electron. 2019, 34, 8104–8117. [Google Scholar] [CrossRef] [Scilit]
- Yu, J.; Wang, S.; Liu, Z.; Li, J.; Liu, J.; Shang, J. Accurate Small-Signal Terminal Characteristic Model and SISO Stability Analysis Approach for Parallel Grid-Forming Inverters in Islanded Microgrids. IEEE Trans. Power Electron. 2023, 38, 6597–6612. [Google Scholar] [CrossRef] [Scilit]

Disclaimer/Publisher’s Note: The statements, opinions and data contained in all publications are solely those of the individual author(s) and contributor(s) and not of MDPI and/or the editor(s). MDPI and/or the editor(s) disclaim responsibility for any injury to people or property resulting from any ideas, methods, instructions or products referred to in the content. |
© 2026 by the authors. Licensee MDPI, Basel, Switzerland. This article is an open access article distributed under the terms and conditions of the Creative Commons Attribution (CC BY) license.