


Abstract
Accurate retinal vessel segmentation is an important component of automated retinal image analysis, supporting remote assessment and connected healthcare applications. However, detecting small retinal blood vessels while limiting false positives remains challenging. This study proposes a hybrid retinal vessel segmentation method that combines optic disc exclusion with a genetic algorithm-optimized Gaussian matched filter (GMF). The method localizes and masks the optic disc and uses a genetic algorithm to optimize three GMF parameters, with the area under the receiver operating characteristic curve (AUC) as the fitness function. Filtering, thresholding, and morphological operations are then applied to generate the final vessel segmentation. The proposed method was evaluated using two public retinal image databases, DRIVE and STARE. On DRIVE, the method achieved an average AUC of 0.9659 and a mean accuracy (MA) of 0.9444, while on STARE it achieved an average AUC of 0.9625 and an MA of 0.9530. The results demonstrate competitive overall retinal vessel segmentation performance, while the proposed optimization specifically targets the response to small retinal vessels. The method therefore shows potential as an image-analysis component for connected retinal screening systems. However, practical IoMT deployment requires further evaluation of computational efficiency, data protection, and resilience to image manipulation.
1. Introduction
Biomedical image processing is widely used in the medical sector, such as in disease diagnosis which enables health care providers to diagnose diseases at early stages [1]. This technology is essential for examining medical images from various sources, including X-rays, MRI, CT scans, and retinal imaging, to derive valuable insights that support clinical decision-making [2]. One of the challenging problems that is often studied in the digital image processing field and in modern ophthalmology is the human retina [3].
The human retina is the multilayered sensory tissue of the posterior eyeball that contains millions of photosensitive cells, rods, and cones, that are able to convert the incoming light into nerve impulse, which enables the retina to form a reversed and inverted image from the entering light to the eye [4,5]. The retina’s extreme sensitivity means that any change in its tissues can indicate a disease. Many causes of blindness are linked to pathological alterations in the blood vessels of the retina. A prime example is diabetic retinopathy, where the vessels exhibit specific changes like abnormal narrowing, widening, or the formation of new, weak vessels, and irregular borders often called beading [6,7,8].
Making accurate measurements of blood vessels is crucial for partially diagnosing eye diseases, which has made the automatic and accurate analysis of retinal images an essential practice in ophthalmic diagnostics. Automated vessel detection, however, faces several challenges. These include specific anatomical structures within the image, such as the optic disc and retinal boundary, as well as variable vessel widths, low contrast relative to the background, and various other pathologies [9]. Despite these obstacles, matching filter algorithms, such as the GMF, have proven their effectiveness by generating a robust response to narrow vessels while minimizing the response for the background, these algorithms can accurately map the retinal vascular network, as demonstrated in previous studies.
Enhancing the matched filter’s response is of critical importance, as it serves as the foundation for a wide range of vessel detection techniques [10]. The matched filter’s performance is controlled by several parameters, with specific values suggested by Chaudhuri [11]. Many blood vessel detection algorithms utilize the matched filter, yet a limited number of studies have focused on improving its efficacy [12,13,14,15].
The research gap lies in the limited efforts to enhance the effectiveness of the matched filter for blood vessel detection, particularly in improving the detection of small retinal blood vessels. While previous studies have explored parameter optimization, existing approaches have notable limitations. The optimization in [12] was constrained by a basic program with a restricted search space, limiting its ability to find optimal parameters. Meanwhile, ref. [13] employed genetic algorithms for parameter optimization but primarily focused on enhancing the detection of large blood vessels, overlooking the accurate identification of smaller vessels. Our research proposes a solution to this gap by employing genetic algorithms to optimize the matched filter’s parameters. The proposed method is designed to enhance the detection of both small and large retinal blood vessels while reducing false vessel detections through genetic optimization of the matched-filter parameters and optic disc exclusion. The novelty of the proposed OMFGA does not lie in the use of a genetic algorithm alone, since GA-based optimization of matched-filter parameters has previously been investigated [13]. Rather, the proposed method extends this approach by optimizing GMF parameter sets using image segments containing small retinal blood vessels and combining these optimized filters with an existing large-vessel filter. In addition, optic-disc localization and exclusion are incorporated to reduce false vessel responses in this region. Therefore, OMFGA integrates small-vessel-oriented GA optimization, combined small- and large-vessel matched filtering, and optic-disc exclusion within a single retinal vessel segmentation framework.
This study presents a novel technique for improving the detection of retinal blood vessels. The proposed approach aims to enhance accuracy for both large and small vessels while simultaneously reducing the rate of false detections. This is achieved by employing Genetic Algorithms to optimize the matched filter’s parameters. This optimization process relies on a fitness function that uses the Area Under the ROC Curve (AUC), which evaluates the detected vessel image against a hand-labeled reference image to ensure high performance.
In the following sections, we begin by reviewing related research. Next, Section 3 provides an overview of the Matched Filter and Genetic Algorithms used in our approach. We then introduce the proposed technique, the Optimized Matched Filter based on Genetic Algorithm, in Section 4. Following the analysis and discussion of our results in Section 5, the final section of this paper offers a conclusion.
2. Review of Related Research
Numerous studies have focused on enhancing the detection of blood vessels [12,13,15,16,17,18,19]. Previous researchers have found that blood vessel measurements are important indicators of retinopathy and related conditions, but more detailed studies on specific measurements for retinopathy are still required. Identifying blood vessels in digital retinal images depends greatly on edge detection. Standard operators like Sobel, Canny, and Prewitt [20] are often not the best choice for this task. These techniques are most effective when edges are sharp and well-defined. In contrast, retinal vessels are usually thin and have low contrast with the surrounding background, meaning they rarely have the sharp edges required for accurate detection. Consequently, there is a need for a specialized edge detection technique that can address these specific challenges. Many edge detection techniques have been developed by researchers to detect blood vessels including matched filter in [11], morphology edge detection in [21], wavelet transform in [22,23] and ridge-based vessel segmentation in [24,25]. Among the previously mentioned edge detection techniques the matched filter shows superiority in reference to performance measures [25].
The matched filter [11] is a highly prevalent technique for detecting blood vessels in retinal images and has been implemented in a variety of systems [26,27]. Consequently, it is vital to enhance its performance. In [12], an enhanced version of the GMF algorithm was introduced for retinal blood vessel detection. The GMF parameters were adjusted using an exhaustive search optimization program. However, the new parameters for the GMF may not be optimal due to the limited search space of this straightforward optimization approach. Conversely, the authors in [13] optimized the matched filter parameters using genetic algorithms. While this approach improved the matched filter’s performance, it primarily concentrated on enhancing the detection rate of large blood vessels, neglecting smaller ones. More recently, Tan et al. [15] proposed a deep matched filtering framework for retinal vessel segmentation, using a deep-learning architecture to enhance vessel representation and evaluate segmentation across multiple vessel-structure and region-based metrics.
Recent studies have increasingly explored deep-learning architectures for retinal vessel segmentation. Chen et al. [28] proposed PCAT-UNet, which combines convolutional operations with Transformer components to capture local and global vessel features and was evaluated on the DRIVE, STARE, and CHASE_DB1 datasets. The method achieved AUC values of 0.9872 and 0.9953 on DRIVE and STARE, respectively [28]. Cao et al. [29] proposed MFA-UNet to improve the segmentation of complex vascular structures, particularly microvessels, by incorporating multi-scale feature fusion, self-attention, deep supervision, and separate consideration of macrovascular and microvascular structures [29]. The method achieved accuracies of 0.9571 and 0.9640 on DRIVE and STARE, respectively [29]. Su et al. [30] conducted an empirical study of deep neural network design for retinal vessel segmentation, considering data processing, network architecture, attention mechanisms, and regularization strategies [30]. Their resulting framework was evaluated on DRIVE, STARE, and CHASE_DB1 and achieved AUC values of 0.98279 and 0.98862 on DRIVE and STARE, respectively [30]. Yue et al. [31] proposed an unsupervised domain-adaptation method based on a teacher–student network and a full-resolution refined model to address performance degradation caused by differences in data distributions across retinal datasets [31]. Their cross-dataset experiments achieved accuracies of 0.9633 for STARE-to-DRIVE adaptation and 0.9687 for DRIVE-to-STARE adaptation [31]. More recently, Yao et al. [32] proposed RetinalVasNet, a deep-learning framework designed for robust retinal microvasculature detection and evaluated it on multiple retinal image datasets, including DRIVE, STARE, and CHASE_DB1 [32]. These studies demonstrate the increasing use of deep-learning architectures to model complex retinal vascular structures, particularly fine and microvascular structures [28,29,30,31,32]. In contrast, the proposed OMFGA follows a model-based approach that does not require deep neural network training; instead, it uses genetic optimization of Gaussian matched-filter parameters, combines filters targeting different vessel scales, and incorporates optic-disc exclusion.
Recent computational biomedical studies have also demonstrated the increasing use of advanced representation-learning and feature-fusion strategies for complex prediction tasks. Transformer- and graph-based models have been applied to molecular interaction prediction, while multimodal foundation models have been developed to integrate transcriptomic and proteomic information for biomedical analysis [33,34,35]. Although these approaches address different biomedical tasks from retinal vessel segmentation, they illustrate the broader development of computational methods for learning complex patterns from heterogeneous biomedical data.
A segmentation method depending on the pixel and its neighbors in gray image of retina is proposed [36]. The technique segmented the retinal blood vessels by investigating the relationships among individual pixels. An effective segmentation algorithm by using line detectors with multiple masks is presented [37]. The proposed method focused on lines response extraction and the combination of these lines to detect the blood vessels. A line-tracking algorithm for identifying blood vessels in the green band of retinal color images was proposed in [38]. The algorithm was based on threshold method without masking and in the histogram the retinal image where pixels were plotted according to their frequency in the image.
Removing the optic disc from retinal images during blood vessel detection is crucial to avoid interference and enhance accuracy. The optic disc, a bright and circular area, poses a challenge for detection algorithms. Its structure is like large blood vessels, which can cause confusion and lead to false positives. Its high intensity and large size may also overshadow smaller vessels, resulting in incomplete detection. Additionally, its appearance can resemble other retinal abnormalities, further complicating disease diagnosis. By excluding the optic disc, vessel detection algorithms can more effectively focus on identifying true vessels, improving both precision and reliability. Therefore, optic disc removal is considered a necessary step in the process.
Several detection methods have been introduced in the literature to remove the optic disc. Mahfouz & Fahmy (2010) presented an algorithm that localizes the optic disc by breaking the traditional 2-D localization problem down into two distinct 1-D localization problems [39]. Likewise, Siva Sundhara Raja & Vasuki (2015) introduced an algorithm that automatically enhances the accuracy of retinal blood vessel segmentation by eliminating the optic disc region [40]. They utilized a nonlinear anisotropic filter in conjunction with a Binary Morphological Mask, which processes the retinal image’s green channel for noise removal. Other researchers have also focused on this problem. Reddy & Rao (2016) presented a technique for removing the optic disc from retinal images by utilizing a Region of Interest (ROI), leveraging the green channel’s high contrast for detection [41]. As an extension of previous work, Khaing & Aimmanee (2017) introduced an extended feature projection (EFP) method. It aimed to improve the accuracy of optic disc localization by integrating it with an active contour technique to ensure precise boundary detection [42].
3. Matched Filter and Genetic Algorithms
In this work, we propose a new technique that is based on two methods: the GMF and the genetic algorithm. Both methods are used together to improve small blood vessel detection in the retinal images. The GMF algorithm is used to detect the small blood vessels in the retinal images, and the Genetic algorithm (GA) is used to generate new sets of GMF parameters. In the following discussion, we give a brief description of both methods.
3.1. GMF Model
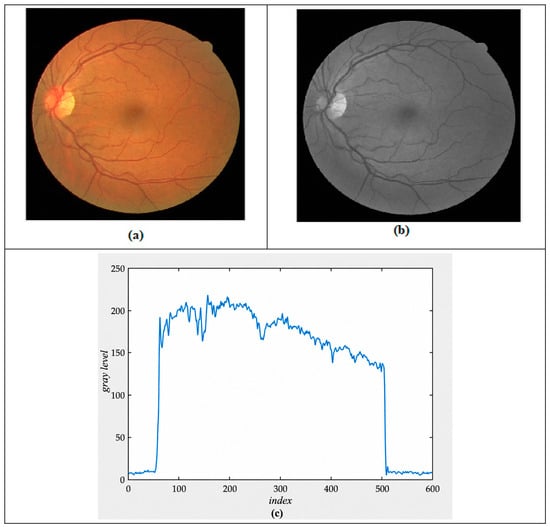
The effectiveness of a GMF in blood vessel detection stems from the fact that a retinal blood vessel’s gray level profile can be accurately represented by a Gaussian-shaped curve [11]. The cross-section profile at row 200 of the retinal image is shown in Figure 1. Further details on the matched filter are available in references [11,12], with a concise overview presented below.
Figure 1.
(a) The original color retinal image, (b) the green band of the retinal image shown in (a), and (c) the cross-sectional profile at row 200 of the retinal image shown in (b).
The GMF kernel as given in [11] may be expressed by Equation (1):
L denotes the length of a blood vessel segment with a shared orientation. σ represents the spread of the intensity profile. A negative sign on Equation (1) is used because the blood vessels are darker than the background. This means the shape of the blood vessel’s cross-section will be the inverse of a Gaussian curve.
Thus, the kernel needs to be rotated to align with every possible vessel direction, with the highest response from the filter bank being recorded. Researchers have found that rotating by 15° over 180° is sufficient for vessel detection with an acceptable degree of accuracy [8,11]. This specific rotation results in a filter bank composed of 12 kernels. To obtain the GMF via different rotations a neighborhood N is defined in Equation (2):
A Gaussian curve has infinitely long tails, so they must be truncated. In the original GMF formulation, the truncation point is defined as T = 3σ. In the proposed genetic algorithm optimization, L, σ, and T were treated as independent parameters to be optimized. We use T as the cutoff position for the Gaussian curve tails. Let pi be a pixel that is part of the neighborhood N, represented by the coordinates (u, v). This pixel is defined by Equation (3).
The i kernel corresponding weights (for θ = 15°, i = 1 to 12) are defined by Equation (4):
Chaudhuri (1989) performed empirical measurements for the values of L, σ, and T, and determined that the optimal parameter values, which yielded the highest response, were L = 9, σ = 2 and T = 6 [11]. The authors did not present the methodology used to find the optimal values for L, σ and T. Al-Rawi and Karajeh (2007) optimized the parameters L, σ, and T using a genetic algorithm and found that the parameter values producing the maximum response were L = 13.4086, σ = 0.5745 and T = 6.2866 [13]. These values provided good results for detecting large blood vessels, but small blood vessels remained difficult to detect, and the optic disc could still negatively affect the blood vessel detection results. The matched filter parameters from [13] were used in this study to identify large blood vessels. A genetic algorithm was then used to optimize the {L, σ, T} parameter set {L, σ, T} parameter set and obtain new parameters for small blood vessel detection. The thresholding process is used to locate and eliminate the optic disc to further improve the segmentation results.
3.2. Genetic Algorithms
The genetic algorithm depends on a set of individuals which are represented by chromosomes as digits, called population. Each individual is considered as input data of the problem, which is calculated as fitness value by using an objective function. Genetic algorithms are a method for producing high-quality solutions to optimization and search problems, using operators inspired by biological processes [13].
Almost all genetic algorithms share these basic, common components, which are listed below:
- An objective function is utilized to assess the performance of each individual within the population during optimization.
- A fitness value is a measure of an individual’s quality, where a higher value indicates a better solution to the problem than a lower one.
- Population diversity: It influences the performance of the genetic algorithm. A generation with high diversity among individuals allows the algorithm to search a broader region of the solution space compared to one with low diversity.
- Population size: This refers to the total number of individuals in the population. A larger population size improves the probability of discovering an optimal solution.
- Encoding: Encoding is the process of representing potential solutions to a problem in a format that a genetic algorithm can manipulate. It is one of the fundamental steps that enable a genetic algorithm to function. Binary encoding is the most commonly used method.
- Elitism: Elitism is a technique used to ensure that the best-performing chromosomes are preserved and carried over to the next generation without modification.
- Selection: This operator is important for maintaining population diversity; the selection operator chooses pairs of chromosomes. Chromosomes with higher fitness values are more likely to be selected to produce offspring.
- Crossover: This operator swaps parts of the selected chromosomes to create two offspring.
- Mutation: It alters individual values in the new chromosomes.
This section describes how genetic algorithms are employed to determine the optimal parameters for the matched filter.
4. Proposed Method: Optimized Match Filter Based on Genetic Algorithm
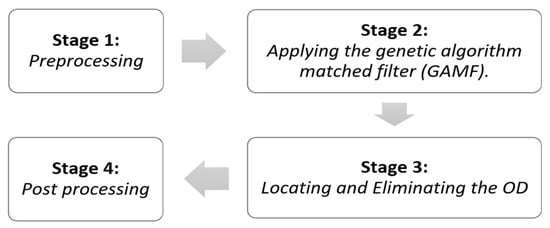
The Optimized Matched Filter based on a Genetic Algorithm (OMFGA) is designed to detect small blood vessels in retinal images and to locate and eliminate the optic disc (OD). The proposed OMFGA technique consists of four main stages: (1) Preprocessing, (2) Applying the Genetic Algorithm Matched Filter (GAMF), (3) Locating and Eliminating the OD, and (4) Post-processing. Figure 2 illustrates the four stages in a block diagram.
Figure 2.
OMFGA Block Diagram for Small Blood Vessel Detection in Retinal Images.
4.1. Preprocessing—Stage 1
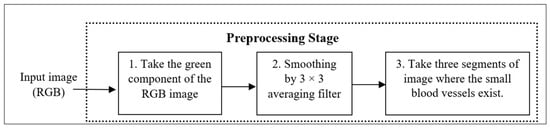
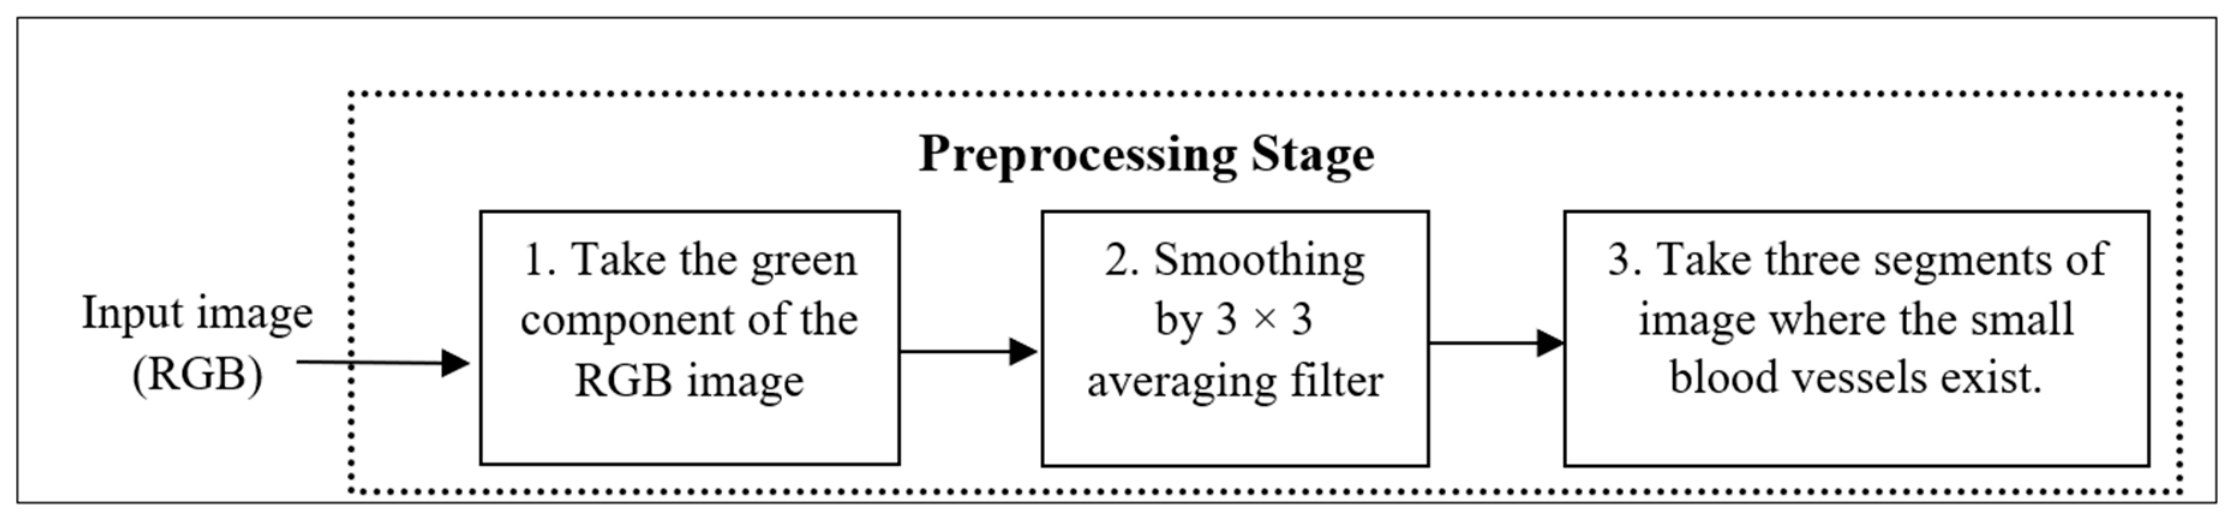
The original image may contain noise that can lead to false detections and increase the false-positive rate. The preprocessing stage is necessary before applying a genetic algorithm employed to determine the best parameters of GMF. The preprocessing stage comprises three steps as shown in the block diagram in Figure 3. These steps are performed on the input retinal image before passing it to the next stages.
Figure 3.
Block diagram of preprocessing stage for OMFGA method.
To detect blood vessels from an RGB retinal image, we start by isolating the green band since it offers a sharp contrast. The next step involves smoothing the image with a 3 × 3 averaging filter to minimize noise. The process concludes with the extraction of three segments with small blood vessels, which are then used as input for the GAMF stage. Five genetic algorithm optimization runs were conducted using selected image segments containing small retinal blood vessels from the first DRIVE training image. Each optimization run generated one optimized set of GMF parameters. Thus, five new GMF parameter sets were obtained and designated as Filters 1–5. A sixth parameter set (Filter 6) was adopted from Al-Rawi and Karajeh [13] for the detection of larger retinal blood vessels.
4.2. The Genetic Algorithm Match Filter (GAMF)—Stage 2
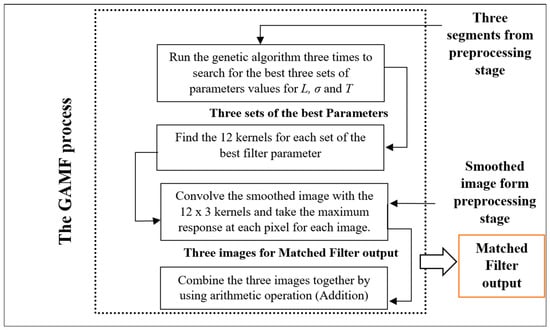
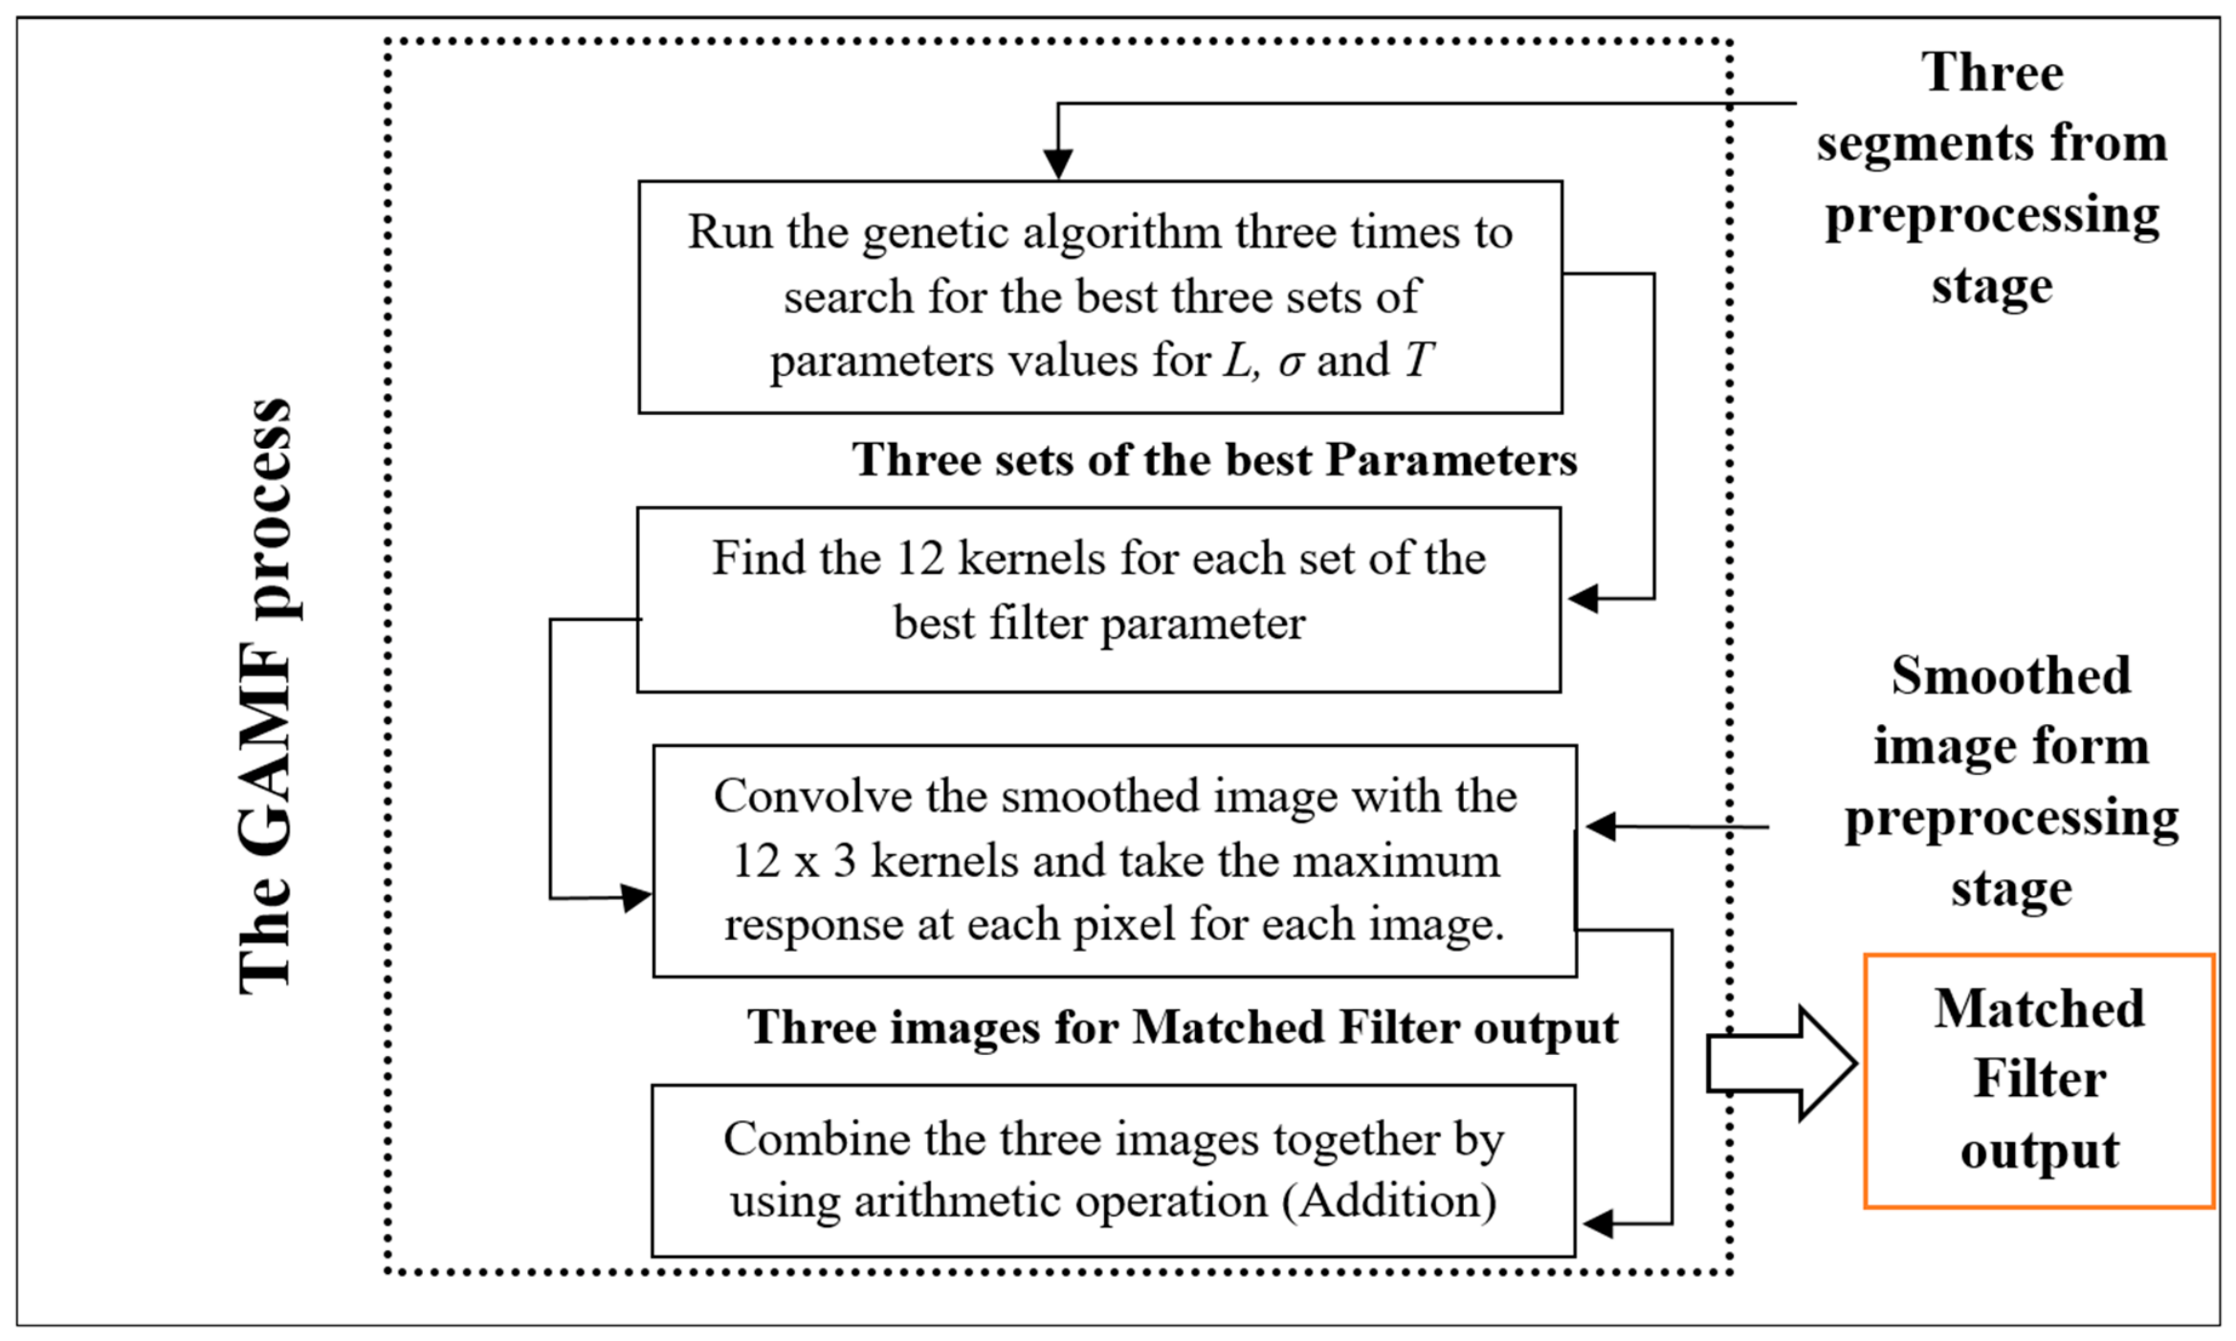
In this stage, the three selected segments containing small retinal blood vessels at different positions in the image are used as inputs to the Genetic Algorithm Matched Filter (GAMF). Five genetic algorithm optimization runs were conducted using these selected segments, with each optimization run generating one optimized set of GMF parameters. Consequently, five optimized parameter sets were obtained and designated as Filters 1–5. The process consists of two primary stages. In the first stage, a genetic algorithm is executed to determine the optimal set of parameters for the matched filter. In the second stage, the parameters derived from the genetic algorithm are used to build the matched-filter kernels to detect small blood vessels in the retinal images. Figure 4 shows the block diagram of the GAMF method.
Figure 4.
Block diagram of GAMF method.
The matched algorithm has three parameters: L, which defines the length of a vessel segment with a uniform orientation; σ, which is the intensity spreading factor; and T, which specifies the cutoff value for the Gaussian curve’s trails. The genetic algorithm takes the range of these parameters to initialize the population, with each individual represented by the values of L, σ, and T. Five genetic algorithm optimization runs were conducted using the selected retinal image segments. The search ranges were set to L = [0, 10], σ = [−5, 15], and T = [−5, 10]. The initial population was randomly generated within these predefined ranges.
These ranges correspond to the numerical bounds used in the original GA implementation. Since σ appears as σ2 in the Gaussian matched-filter equation, negative values generated during optimization are mathematically equivalent to their positive magnitudes and do not represent a negative physical spread. In contrast, T represents the Gaussian truncation distance and is physically interpreted as a non-negative parameter. Although the initial numerical search interval permitted negative candidate values, all parameter sets retained in the final OMFGA configuration (Filters 3, 4, and 6) have positive values of both σ and T. The effect of restricting the GA search to explicitly non-negative values of σ and T was not evaluated in the present study and remains a consideration for future implementation.
4.2.1. Genetic Algorithm Operators
The genetic algorithm needs to determine the values of its operators. These operators are implemented in the following processes and functions:
- Encoding: Real-value encoding is used for the input data L, σ and T, which are represented as a chromosome in the genetic algorithm.
- Fitness Function: The genetic algorithm employs the area under the ROC curve as its fitness function. This enables the algorithm to identify and select the most effective set of GMF parameters {L, σ, T}. As a result, the fittest individual, which represents the highest area under the ROC, is selected from the final population and represented by the values of L, σ and T in one experiment. The AUC ranges from 0 to 1, where a value of 1 indicates perfect discrimination between vessel and non-vessel pixels. The area under the ROC curve is calculated as follows:
- Starting with an input image, f, a matched filter is applied. This filter is set with three independent parameters, {L, σ, T}, which are supplied by the input individual for the fitness function. The application of this filter results in a gray-level output image, denoted as fLσT. To create multiple binary images, one for each threshold, the image fLσT is binarized using normalized intensity thresholds ranging from 0 to 1 in increments of 0.05.
- The area under the receiver operating characteristic curve (AUC) was used as the fitness function for the genetic algorithm. For each candidate set of GMF parameters, the resulting vessel-detection image was compared with the corresponding hand-labeled reference image, and the AUC was calculated to evaluate the candidate solution. Mean accuracy (MA) was used as an additional evaluation measure when comparing the resulting filter configurations.
- The procedure then continues with the following steps:
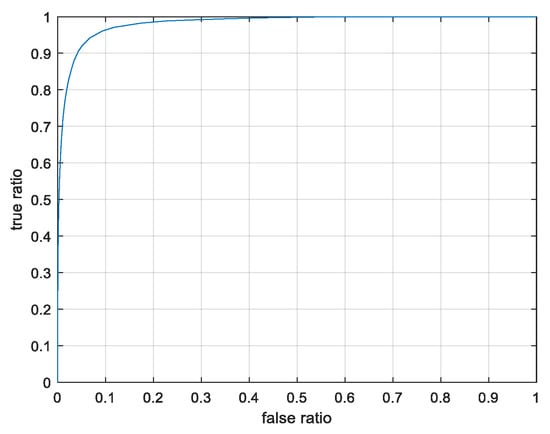
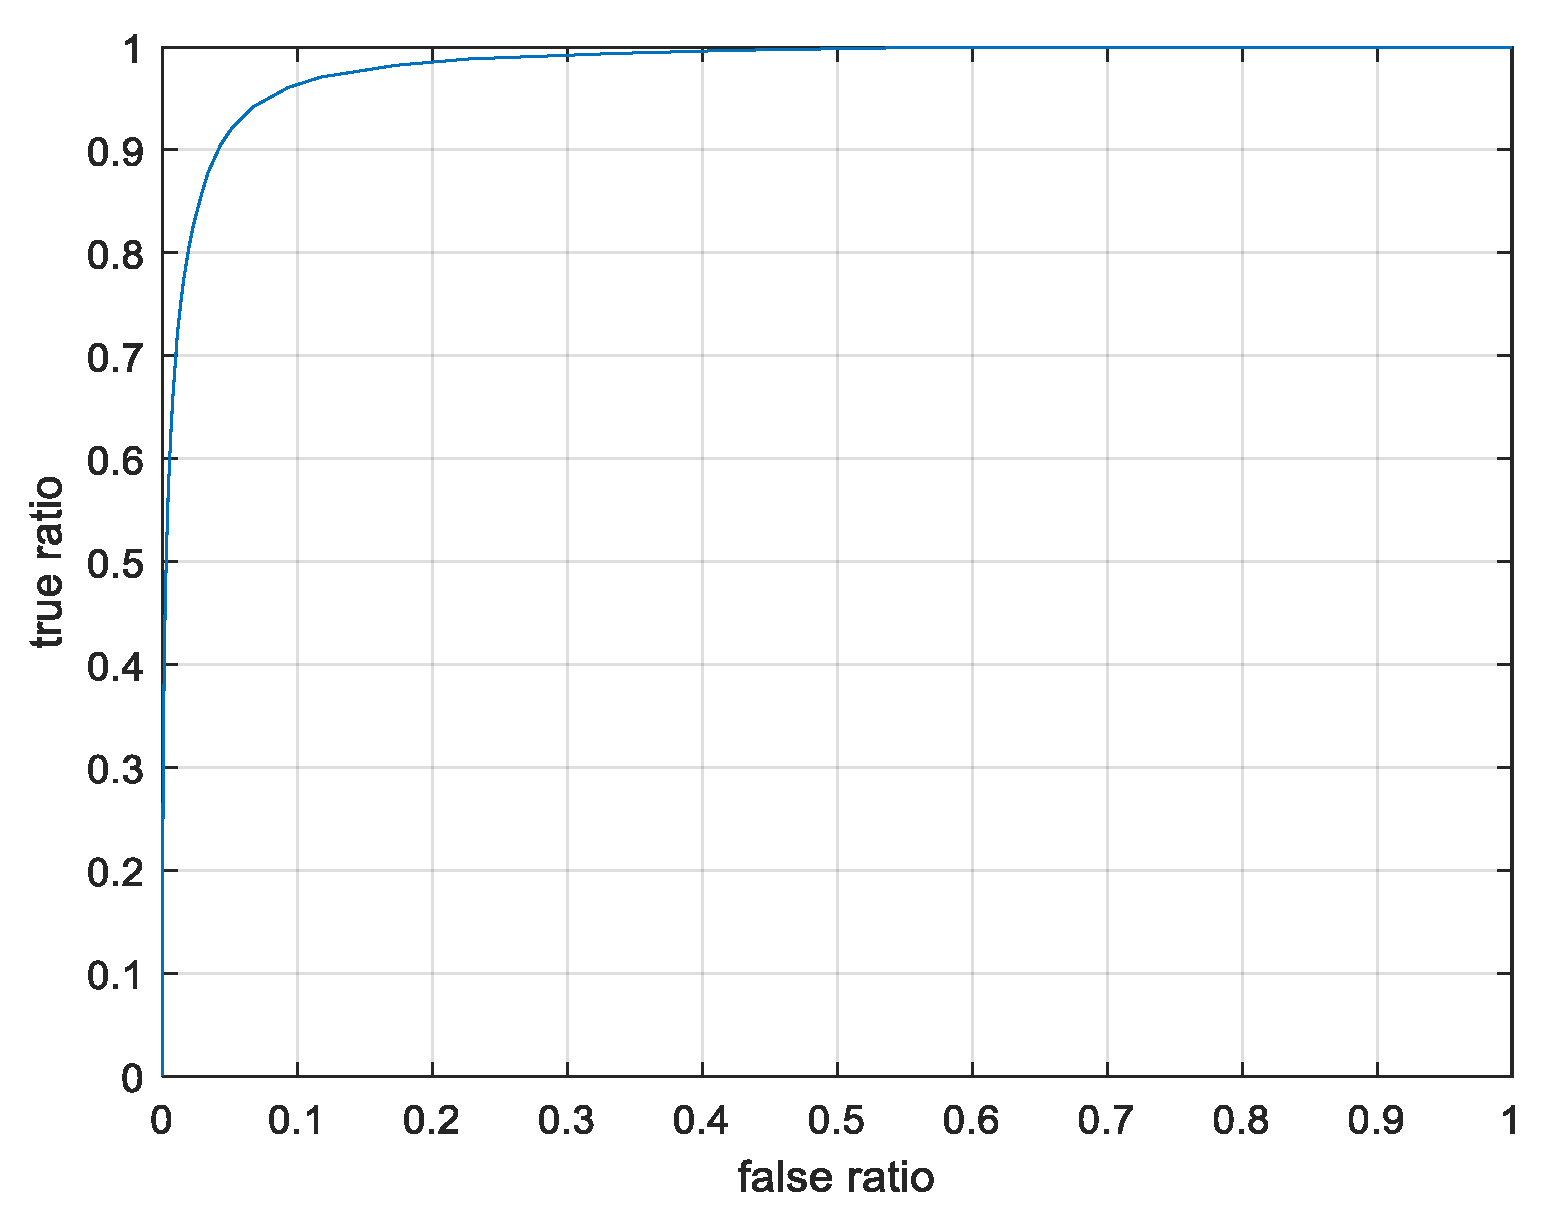
- Each binary image is compared to a manually labeled retinal image, h, created by an expert observer for evaluation purposes, as outlined in [25]. This comparison generates “true pixels” (those identified as vessels in both the binary image and h) and “false pixels” (those identified as vessels in the binary image but not in h). The true ratio is obtained by dividing the true pixel count by the total vessel pixels in h, while the false ratio is found by dividing the false pixel count by the total number of non-vessel pixels in h.
- The ROC curve is then plotted by charting the true ratio against the false ratio. The area under this curve is subsequently computed to serve as the fitness value.
- Crossover function: Uniform Crossover is used as a crossover function to get the largest number of possible outcomes from the crossover.
- Selection function: The Rank Selection method was used for optimizing the GMF because it is less affected by highly fit chromosomes, as selection is based on relative fitness rather than absolute fitness.
- Mutation: The mutation occurs by adding or subtracting small values randomly to the selected positions.
- Other Genetic Algorithm Parameters: The genetic operators have predetermined fractions that are tailored to the specific problem requirements. The proportions used for optimizing the GMF parameters are based on the guidelines in [13]:
- Population size: Set at (30), a moderate size, as each individual requires intensive calculations to determine the fitness value.
- Elite count: With an elite count of one, preserving the individual with the highest area under the ROC curve for the next evolutionary step survive to the next generation.
- Crossover fraction: Set at 0.7, resulting in 21 individuals produced by crossover in a population of 30, with one elite individual preserved separately.
- Mutation fraction: The remaining members of the population, apart from crossover and elite members, are created by mutation.
In each generation, the individual with the highest fitness score from the preceding generation is preserved in the next generation through elitism. The new generation consists of 21 crossover individuals (calculated as 30 × 0.7 = 21), one elite, and the remaining 8 individuals are produced through mutation.
4.2.2. Stopping Criteria
In this stage, selected image segments containing small retinal blood vessels from the first DRIVE training image were used as inputs to the Genetic Algorithm Matched Filter (GAMF). Five genetic algorithm optimization runs were conducted to determine optimized GMF parameters. Each optimization run generated one set of GMF parameters, resulting in five new parameter sets designated as Filters 1–5. The genetic algorithm optimized the GMF parameters based on the AUC fitness function. The resulting parameter sets were then used to construct the matched filter kernels for retinal vessel detection.
4.2.3. The Implementation of GMF
After the execution of the genetic algorithm and the determination of the GMF parameter sets, the GMF filtering process is performed as follows:
- Each selected set of GMF parameters is used to construct a filter bank consisting of 12 kernels corresponding to the predefined orientations.
- Apply them on the smoothed images as follows:
- The corresponding responses from 12 kernels are compared and the maximum value at each pixel is retained.
- Each kernel is then used to convolve the smoothed image. The convolution process is performed by moving the kernel from one point to another point in image, where at each point, the response of the kernel is calculated by using a linear spatial filtering [20].
- A linear spatial filter performs a sum-of-products operation among the pixels of an image f and a filter kernel k. The process of linearly filtering an M × N image f with an m × n kernel k is mathematically expressed in Equation (5).
- The outputs of the three selected filters (Filters 3, 4, and 6) are combined by arithmetic addition to produce the final filtered image.
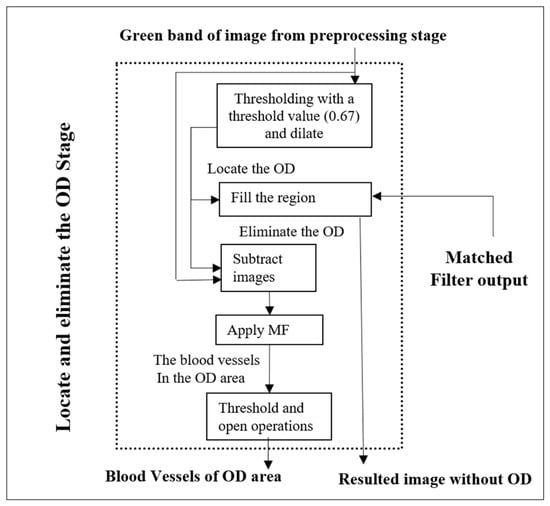
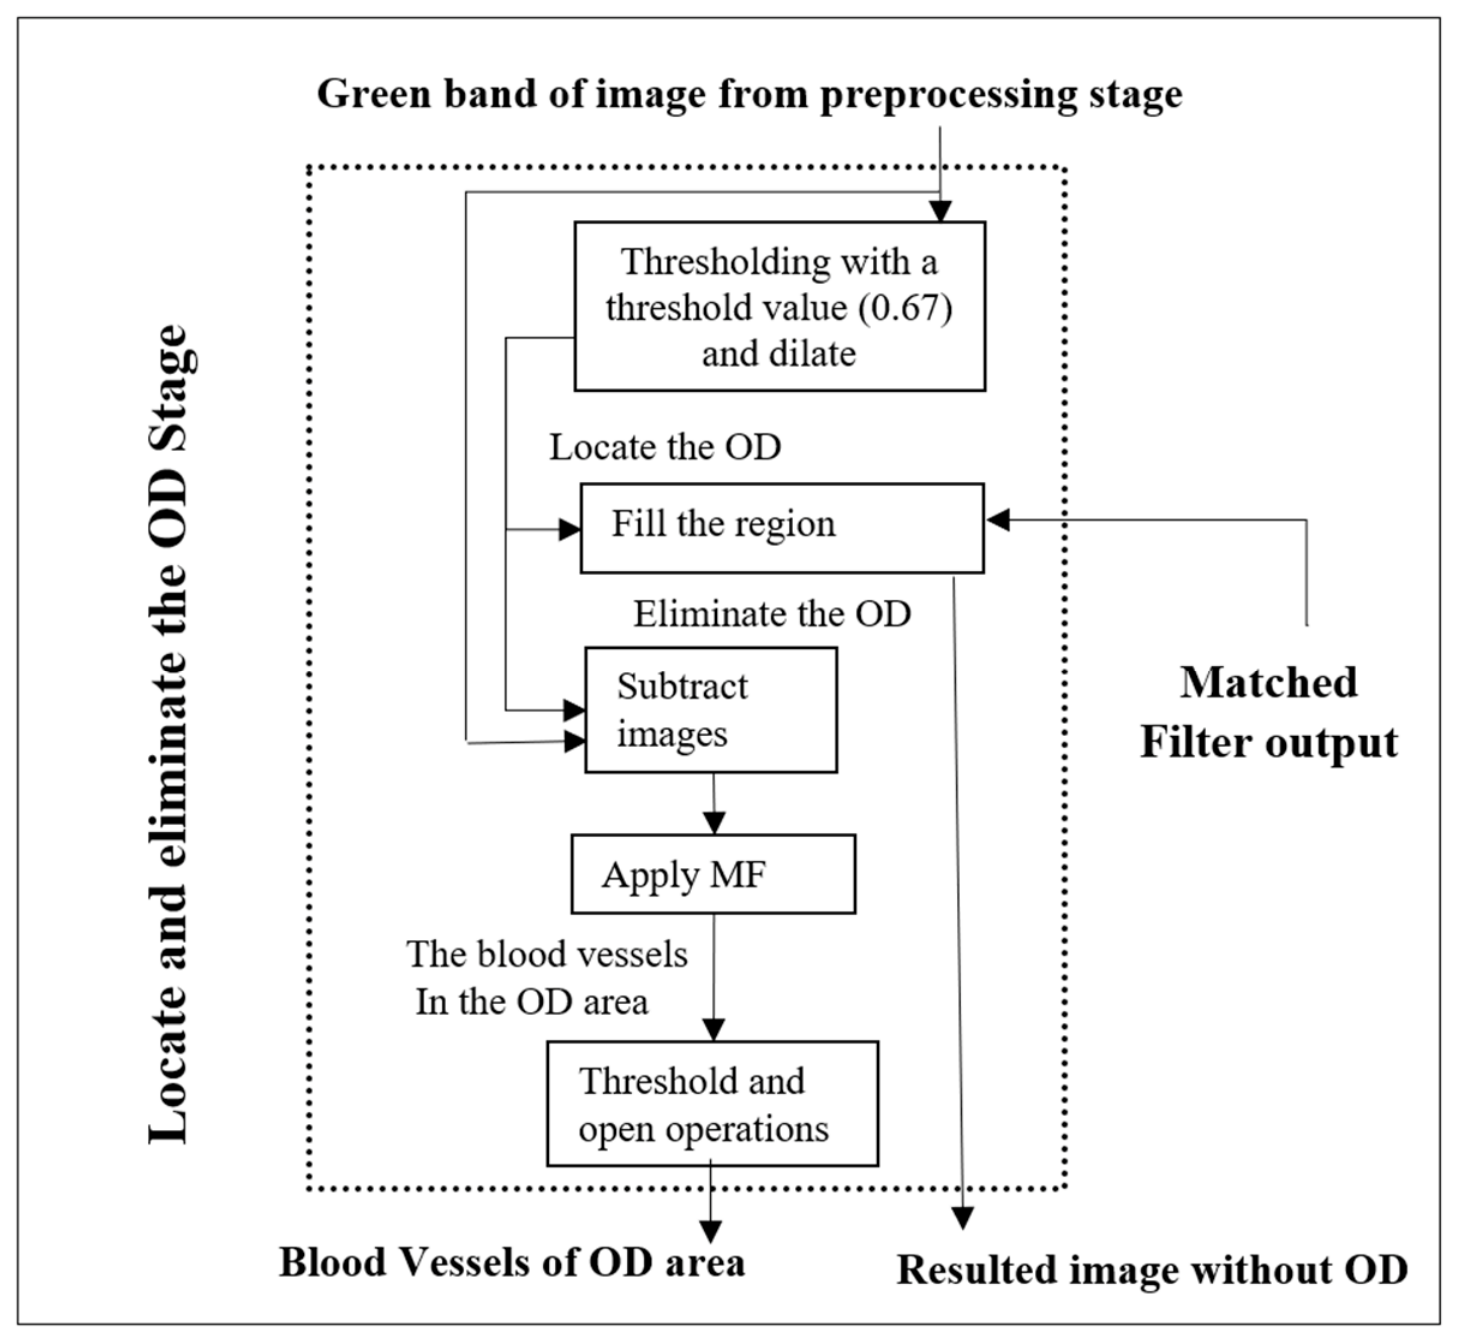
4.3. Locating and Eliminating the OD—Stage 3
After applying the three selected filters (Filters 3, 4, and 6), the optic-disc localization and elimination stage is performed. The block diagram of this stage is shown in Figure 5.
Figure 5.
Block diagram of locating and eliminating the OD Stage for OMFGA.
As shown in the figure, this stage consists of five main processes, as follows:
Process 1. Thresholding the retinal image using 0.67 as the threshold value. This value was determined using the first image from the DRIVE training set by evaluating threshold values from 0 to 1 with a step size of 0.01 and selecting the value that provided suitable separation of the bright optic-disc region from the surrounding retinal structures. The threshold value of 0.67 was then fixed and applied to all evaluation images without further adjustment to identify the position of the optic disc. The optic disc location appears as white space in the thresholded image (g), see Equation (6). The thresholding process on image f will convert it into to the binary image g with a size of (x × y) and T is a threshold value [20], as defined in Equation (6).
Process 2. A morphological operation is applied on the thresholded image (g), the dilation process is used with a Disc as structure element b to expand the optic disc space in the thresholded image (g). The dilation operation of g by b, denoted g⊕ b in Equation (7).
where Dg and Db are the domains of g and b, respectively.
Process 3. Filling the region of the optic disc’s location in the retinal image by using the threshold image g as a mask for the resulting image of the GAMF process to eliminate the optic disc.
Process 4. Using the subtraction operation between thresholded image g and the green band image of retina to produce an image that contains the blood vessels found in the optic disc area. The resulting image from applying the GMF on this area is defined as foptic.
Process 5. Apply thresholding to the foptic image and then apply a morphological operation (Open) to produce a binary image which contains the blood vessels of the optic disc region.
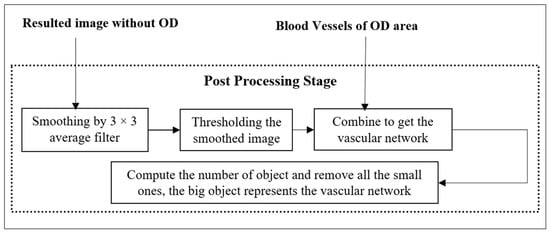
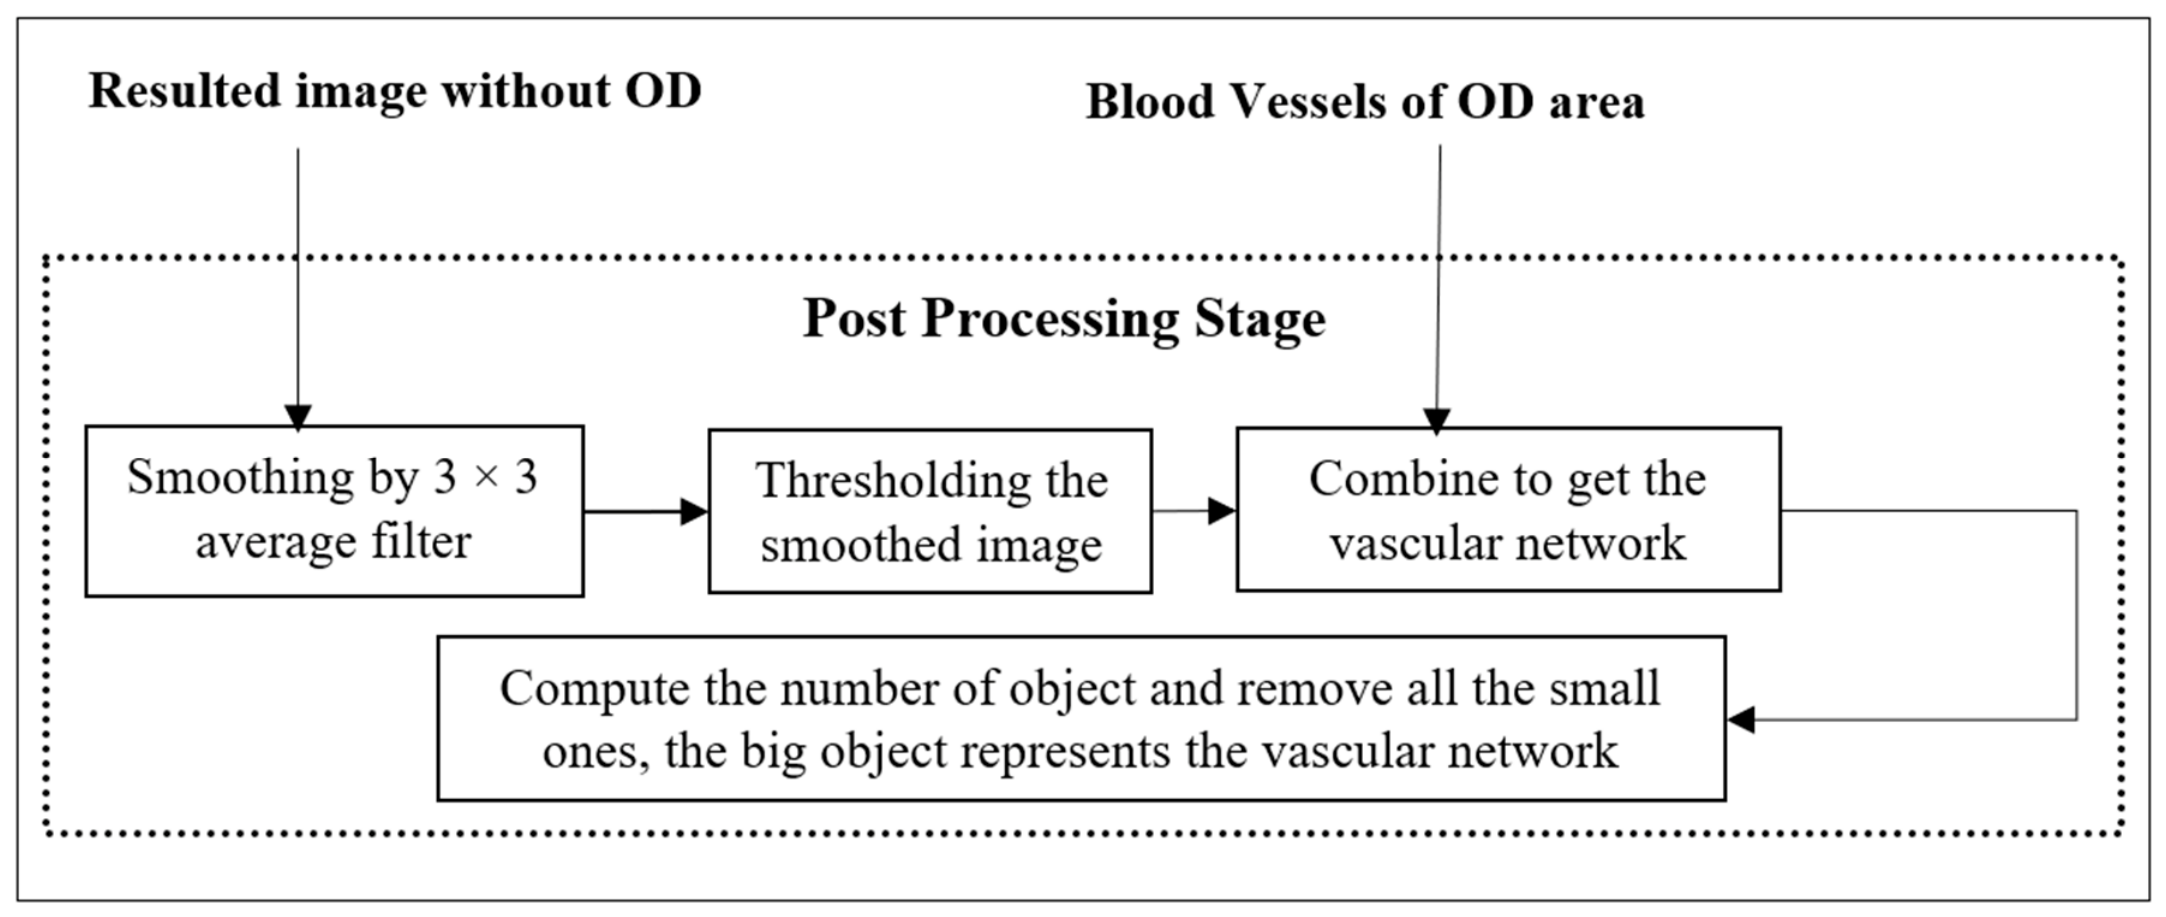
4.4. Post-Processing—Stage 4
The post-processing stage is the final stage, and it consists of three main processes. First, the resulting image from the optic-disc elimination stage is smoothed using a 3 × 3 average filter. The post-processing stage applies a fixed threshold value of 0.17. During method development, candidate threshold values were systematically evaluated using the first DRIVE training image, and 0.17 was selected based on the resulting vessel segmentation performance. This threshold was then fixed and applied unchanged to all 20 DRIVE test images without image-specific threshold adjustment. The ground-truth annotations of the test images were used only for performance evaluation and were not used for threshold selection. After that, the algorithm combines the thresholded image with the output image by locating and eliminating the Optic Disc Stage. Finally, the number of connected objects is computed in the final image, and all small objects, which appear as noise, are removed. The post-processing stage for OMFGA is depicted in the block diagram in Figure 6.
Figure 6.
Block diagram of the post-processing stage of the OMFGA method.
5. Analysis and Discussion
5.1. Materials
A set of retinal images from the DRIVE (Digital Retinal Images for Vessels Extraction) database was used to test the proposed method [25]. This database contains 40 digital images, which are split into two groups of 20 images each—a training set and a test set. Accompanying these images are corresponding masks and hand labels, which were provided by an experienced pathologist. Sourced from a diabetic retinopathy screening program in The Netherlands, the DRIVE images are colored RGB, captured by a Canon CR5 non-mydriatic 3CCD camera (Canon Inc., Tokyo, Japan), and have a size of 565 × 584 pixels [43].
In all experiments, the green band is used as it provides a strong contrast with blood vessels, as previously suggested [11,25,27]. Table 1 shows the area under the ROC and MA values for the first image for its three bands: Red, Green, and Blue; as shown from the table, the best band to detect the blood vessels of retina was the green band. The first image from the DRIVE training set was used as input for the genetic optimization process to determine the filter parameters, while the 20 images in the test set were used for evaluation of the area under the ROC and MA. Five genetic algorithm optimization runs were conducted using selected small-vessel segments from the first DRIVE training image.
Table 1.
The area under the ROC and MA in the red, green, and blue bands of the First Image.
The Structured Analysis of the Retina (STARE) database was also used to evaluate the proposed method [7]. A total of 20 images from the STARE database were used for evaluation. The selected GMF parameter sets (Filters 3, 4, and 6), obtained through the genetic optimization procedure using the first DRIVE training image, were applied to the 20 STARE images without any further genetic optimization, filter selection, or parameter adjustment. The same preprocessing, vessel detection, optic disc elimination, and post-processing procedures were applied to the STARE images. The performance was evaluated using the AUC and mean accuracy (MA).
5.2. Testing Metrics
Two metrics, the Area Under the ROC and MA, are utilized to evaluate the performance of the matched filter with its new parameter sets. After utilizing a matched filter with these parameters, and then thresholding to produce multiple binary images, each corresponding to a distinct threshold. The Threshold values that were used in these experiments were between 0 and 1 and by step value = 0.001. The MA and the area under the ROC are determined for each resulting image by comparing it to the hand-labeled image in order to calculate the true and false blood vessel ratios. During the genetic optimization process, the AUC fitness was evaluated using the predefined threshold values from 0 to 1 with a step size of 0.05. This threshold sampling was used only for computational evaluation of candidate parameter sets during optimization.
The ROC is calculated as follows:
- Each binary image is compared to a manually labeled retinal image, h, created by an expert observer for evaluation purposes. This comparison generates “true pixels” (those identified as vessels in both the binary image and h) and “false pixels” (those identified as vessels in the binary image but not in h). We determine the true ratio by taking the count of true pixels and dividing it by the total vessel pixels in h. Similarly, the false ratio is obtained by dividing the number of false pixels by the total count of non-vessel pixels in h.
- The ROC curve is then plotted by showing how the false ratio varies with the true ratio, and the area under this curve is calculated to determine the fitness value, see Figure 7.Figure 7. The area under the ROC.
The MA for a single image is determined by calculating its accuracy at a particular threshold. This is accomplished by dividing the sum of correctly identified vessel and non-vessel pixels by the total pixel count within the Field of View (FOV)—the circular region of the retinal image. To identify the best result, the matched filter output is subjected to up to 1000 thresholds, which produces a variety of vessel images. The accuracy for a single image is determined by dividing the sum of correctly identified vessel and non-vessel pixels by the total pixel count within the Field of View (FOV)—the circular region of the retinal image. During method development, a threshold value of 0.17 was selected using the first DRIVE training image. This threshold was then fixed and applied unchanged to all 20 DRIVE test images without image-specific threshold adjustment. The ground-truth annotations of the test images were used only to calculate the resulting accuracy and were not used for threshold selection. The mean accuracy (MA) was calculated by averaging the accuracy values obtained for the 20 DRIVE test images. For the STARE database, the proposed GMF parameter sets obtained through the DRIVE optimization procedure were applied without further genetic optimization.
5.3. Procedure
The OMFGA with the proposed parameter sets obtained through genetic optimization on the first DRIVE training image was subsequently applied to the 20 images in the DRIVE test set without further parameter optimization. The test images were not used during the genetic optimization process. For the final evaluation, the fixed combination of Filters 3, 4, and 6, selected using the first DRIVE training image, was applied to each of the 20 DRIVE test images. Two candidate three-filter combinations, namely Filters 1, 2, and 5 and Filters 3, 4, and 6, were compared using the first DRIVE training image based on the ROC area and MA. The combination of Filters 3, 4, and 6 achieved the better performance and was therefore selected and fixed as the final filter combination before evaluation on the 20 DRIVE test images. The set of GMF parameters from [13] was used in our method together with the new GMF parameter sets obtained through the OMFGA optimization procedure. For the STARE database, the GMF parameter sets obtained through the genetic optimization procedure on the DRIVE database were applied directly without further genetic optimization.
The proposed method was implemented using MATLAB R2022b. The genetic algorithm optimization, matched filtering, thresholding, and morphological image-processing operations were implemented within the MATLAB environment.
5.4. Experimental Results and Analysis
We examined six filters in the OMFGA framework, as shown in Table 2. Filters 1–5 were obtained through the genetic optimization procedure, while Filter 6 was adopted from [13]. Table 3 shows the area under the ROC for the 20 DRIVE test images using Filters 1–6 individually, as well as the two filter combinations (Filters 1, 2, and 5 and Filters 3, 4, and 6). Across the 20 DRIVE test images, the final combination of Filters 3, 4, and 6 achieved a mean AUC of 0.9659 ± 0.0086 (SD), with a 95% confidence interval of 0.9618–0.9699. In comparison, the combination of Filters 1, 2, and 5 achieved a mean AUC of 0.9644 ± 0.0089, with a 95% confidence interval of 0.9602–0.9685. A paired t-test across the 20 DRIVE test images showed that the AUC difference between the two filter combinations was statistically significant (t(19) = 13.92, p < 0.001).
Table 2.
GMF PARAMETER SETS USED IN THE OMFGA.
Table 3.
The area under the ROC for 20 images in the DRIVE database by using green band.
On the first DRIVE training image used for genetic optimization, the two candidate filter combinations were compared using the ROC area and MA. The combination of Filters 3, 4, and 6 achieved higher values than the combination of Filters 1, 2, and 5. Therefore, Filters 3, 4, and 6 were selected using the training image and fixed before evaluation on the 20 DRIVE test images and the 20 STARE images. No filter selection or parameter optimization was performed using the test images. Filters 3 and 4 were optimized using image segments containing small retinal blood vessels, while Filter 6 from [13] was included for large-vessel detection.
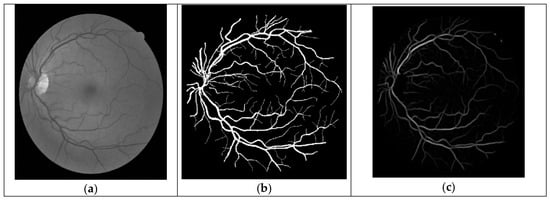
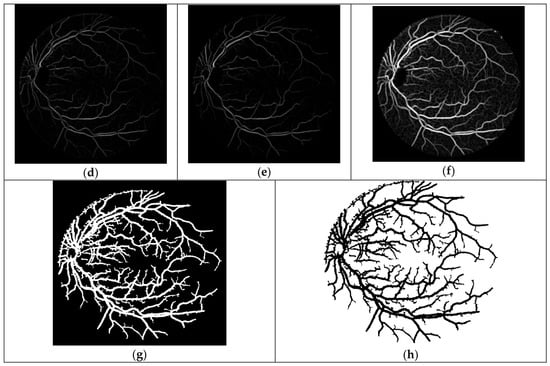
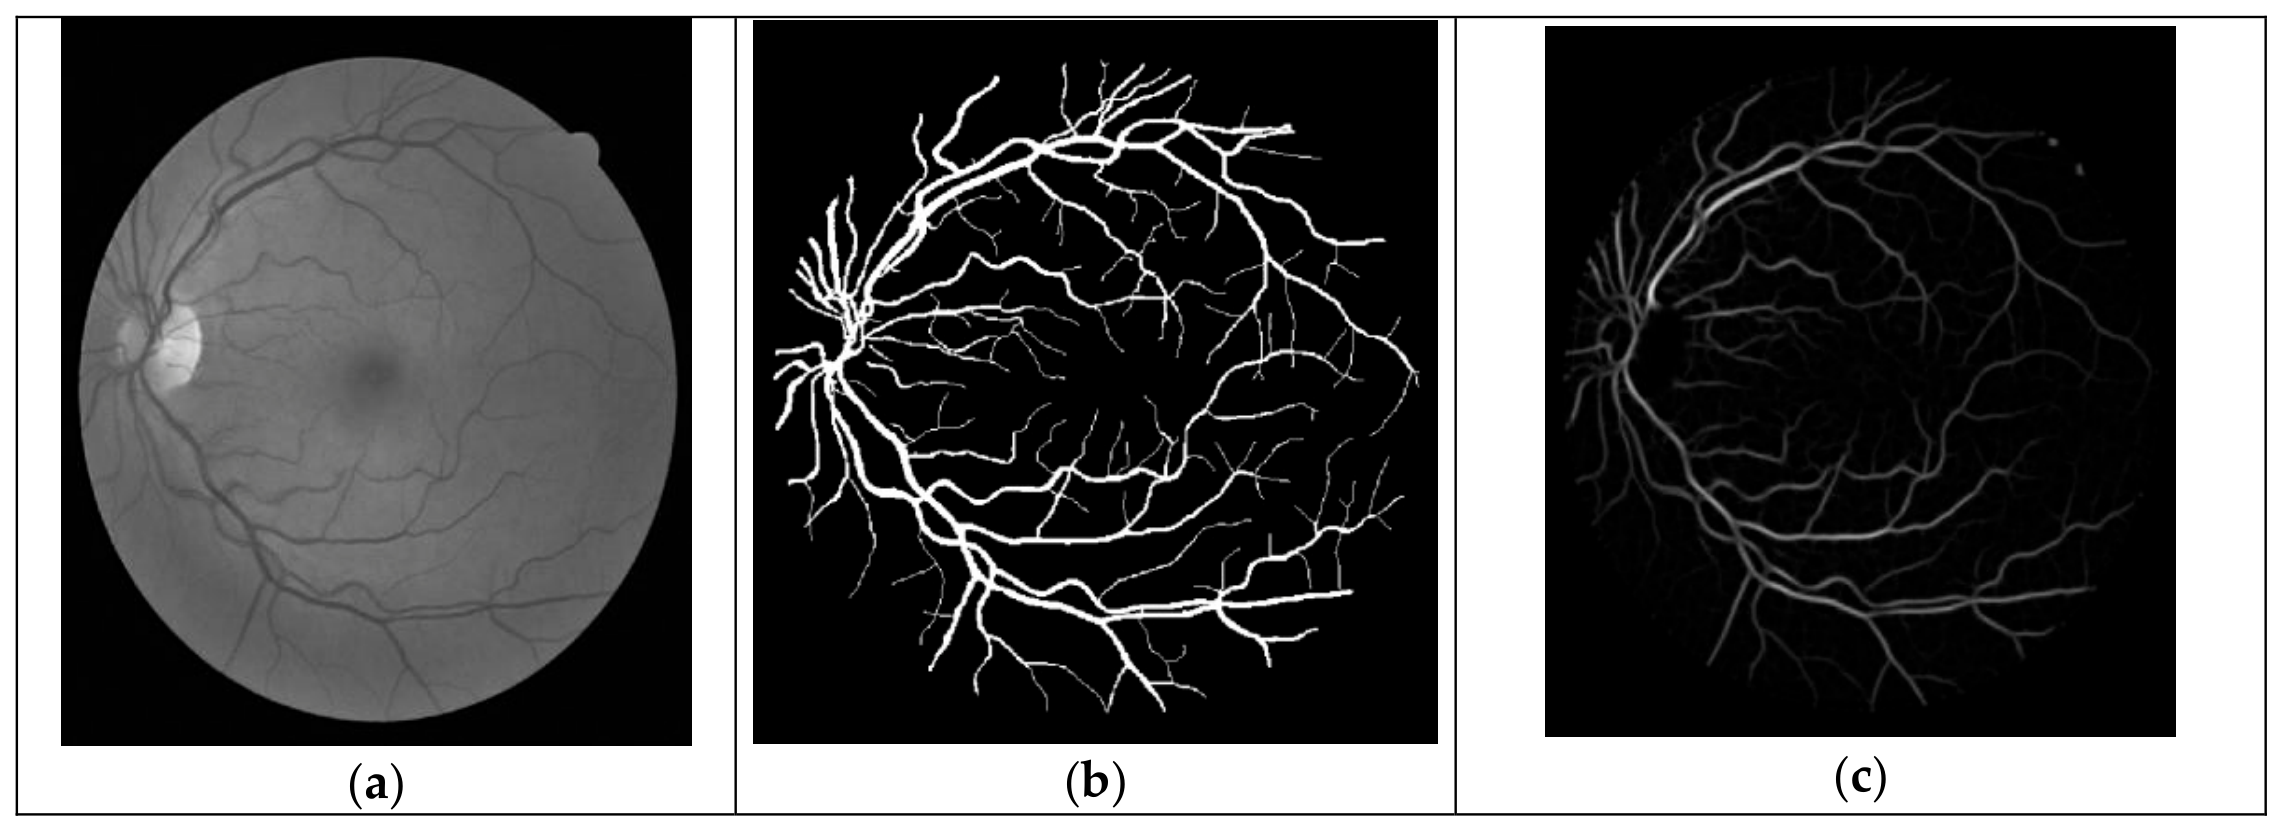
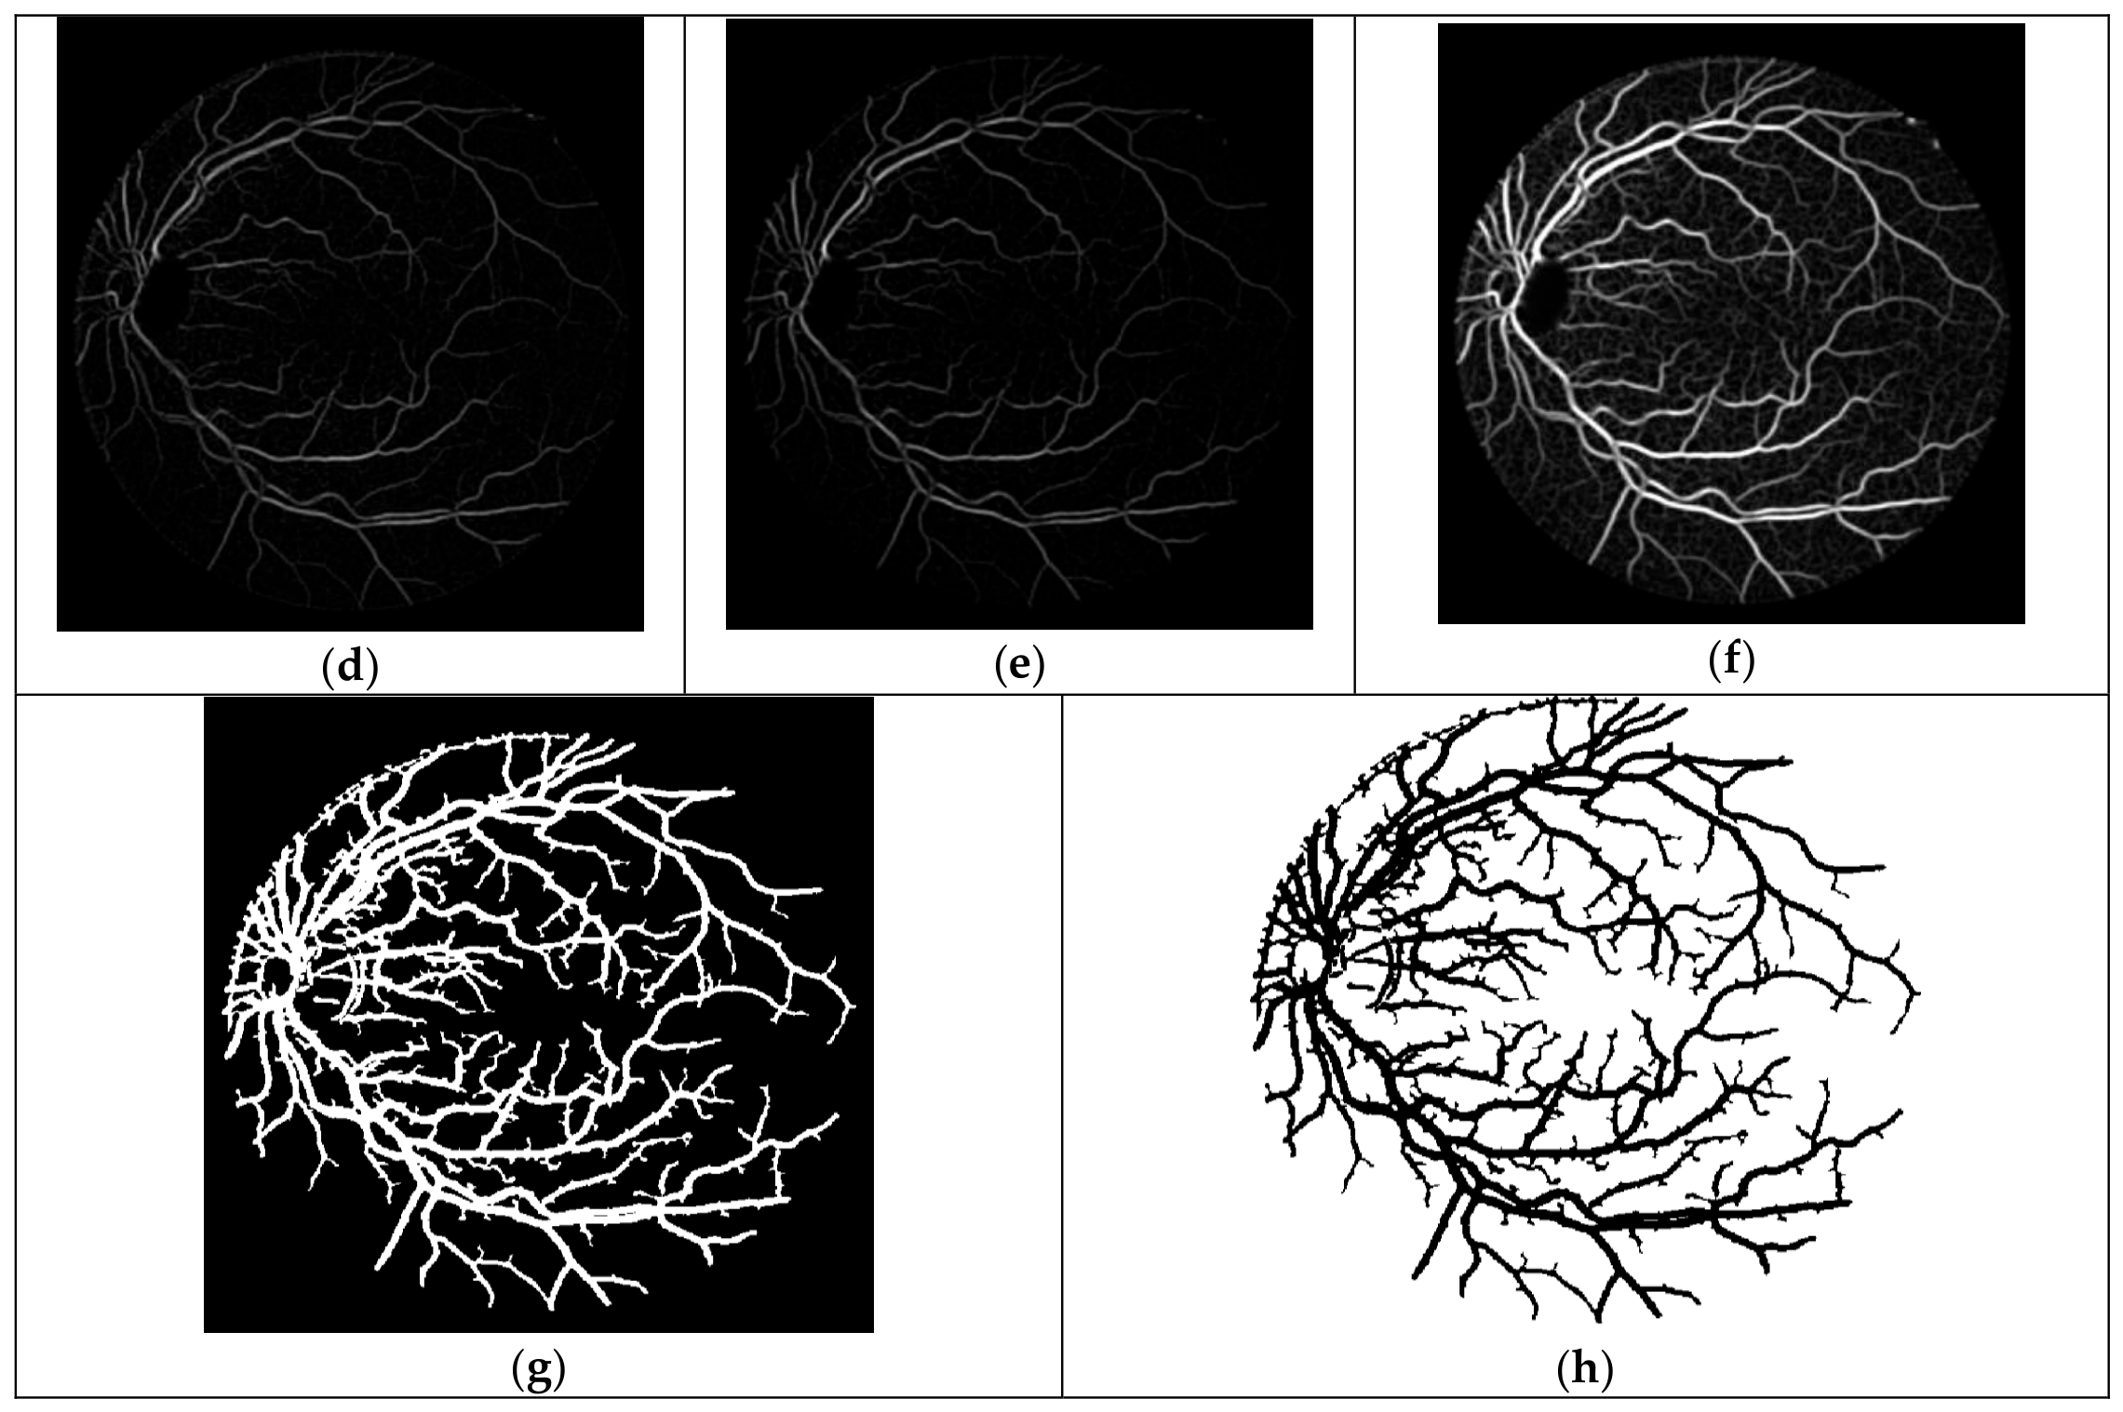
The main steps of the proposed method for retinal vessel segmentation using the DRIVE database are illustrated in Figure 8. The input image is (a) the green band image, which is used due to its optimal contrast for highlighting blood vessels. Figure 8b shows the hand-labeled image, which is used as the ground truth for assessing performance. The core of the method involves applying three GMF filters (Filters 3, 4, and 6), with their individual results shown in (c), (d), and (e), respectively. These filtered images are subsequently combined in (f). The optic-disc elimination procedure is then applied to reduce false vessel responses in the optic-disc region, followed by post-processing and thresholding to obtain (g), the final binary vessel segmentation. Finally, (h) the complement of this image is provided to visualize the inverse of the segmentation. Overall, the figure effectively visualizes the progression from a raw image to a refined, segmented output ready for analysis.
Figure 8.
Results for the first retinal image in the DRIVE database: (a) green-band image, (b) hand-labeled image, (c) result of Filter 3, (d) result of Filter 4, (e) result of Filter 6, (f) combined result of (c–e), (g) thresholded image after optic-disc elimination, and (h) complement of (g).
The proposed optimization procedure was designed with the aim of improving the response to small retinal vessels by using small-vessel image segments during GA optimization. However, the AUC and MA reported in this study are image-level segmentation measures and do not separately quantify performance according to vessel width. Therefore, the results demonstrate the overall segmentation performance of the proposed method, while the specific improvement in small-vessel detection is supported qualitatively by the segmentation outputs rather than by a dedicated vessel-size-specific metric. The performance of several retinal image analysis methods is compared in Table 4 and Table 5, which show the average area under the ROC curve and the average MA. The results from the DRIVE and Structured Analysis of the Retina (STARE) databases demonstrate the performance of the proposed OMFGA method across the two evaluated datasets. On the DRIVE database, the proposed method achieved an average AUC of 0.9659 and a mean accuracy (MA) of 0.9444. These results are compared with those reported for the methods included in Table 4. This AUC value indicates a strong ability to distinguish between vessel and non-vessel pixels. Using the GMF parameter sets obtained through genetic optimization on the first DRIVE training image, without further genetic optimization or parameter adjustment, the proposed method achieved an average AUC of 0.9625 and an MA of 0.9530 on the 20 STARE images. These results demonstrate competitive performance across the DRIVE and STARE databases compared with the methods included in the respective comparison tables.
Table 4.
The average of the area under ROC and MA for different methods by using DRIVE database.
Table 5.
Average area under the ROC and MA for different methods using the STARE database.
The results reported in Table 5 are presented as reported in the corresponding studies; differences in dataset subsets, preprocessing procedures, and evaluation protocols should therefore be considered when comparing the reported values.
Recent retinal vessel segmentation studies have increasingly adopted deep-learning architectures [28,29,30,31,32]. These approaches employ architectures such as convolution–Transformer networks, multi-scale feature fusion and attention mechanisms, and deep neural networks specifically designed to capture complex and fine vascular structures [28,29,30,31,32]. In comparison, the proposed OMFGA follows a model-based approach and does not require the training of a deep neural network. Instead, it optimizes Gaussian matched-filter parameters using a genetic algorithm and combines filters targeting different vessel scales with optic-disc exclusion. Although several recent deep-learning methods report higher AUC values, direct numerical comparison should be interpreted with caution because of differences in preprocessing, training strategies, dataset partitions, and evaluation protocols. The main distinction of OMFGA is therefore its use of an interpretable matched-filter optimization framework rather than a data-intensive deep-learning architecture.
Recent retinal vessel segmentation studies have increasingly adopted deep-learning architectures to learn hierarchical vessel representations directly from retinal images. These methods can achieve strong segmentation performance, particularly when sufficient annotated data and computational resources are available. In contrast, the proposed OMFGA is a model-based approach that does not require neural-network training. It optimizes the parameters of the GMF using a genetic algorithm and combines filters targeting different vessel scales with optic-disc exclusion. Therefore, the proposed method provides a comparatively interpretable segmentation process in which the effects of the matched-filter parameters and individual processing stages can be directly examined. However, numerical comparisons across studies should be interpreted cautiously because differences in preprocessing, dataset partitions, ground-truth annotations, and evaluation protocols can affect the reported performance.
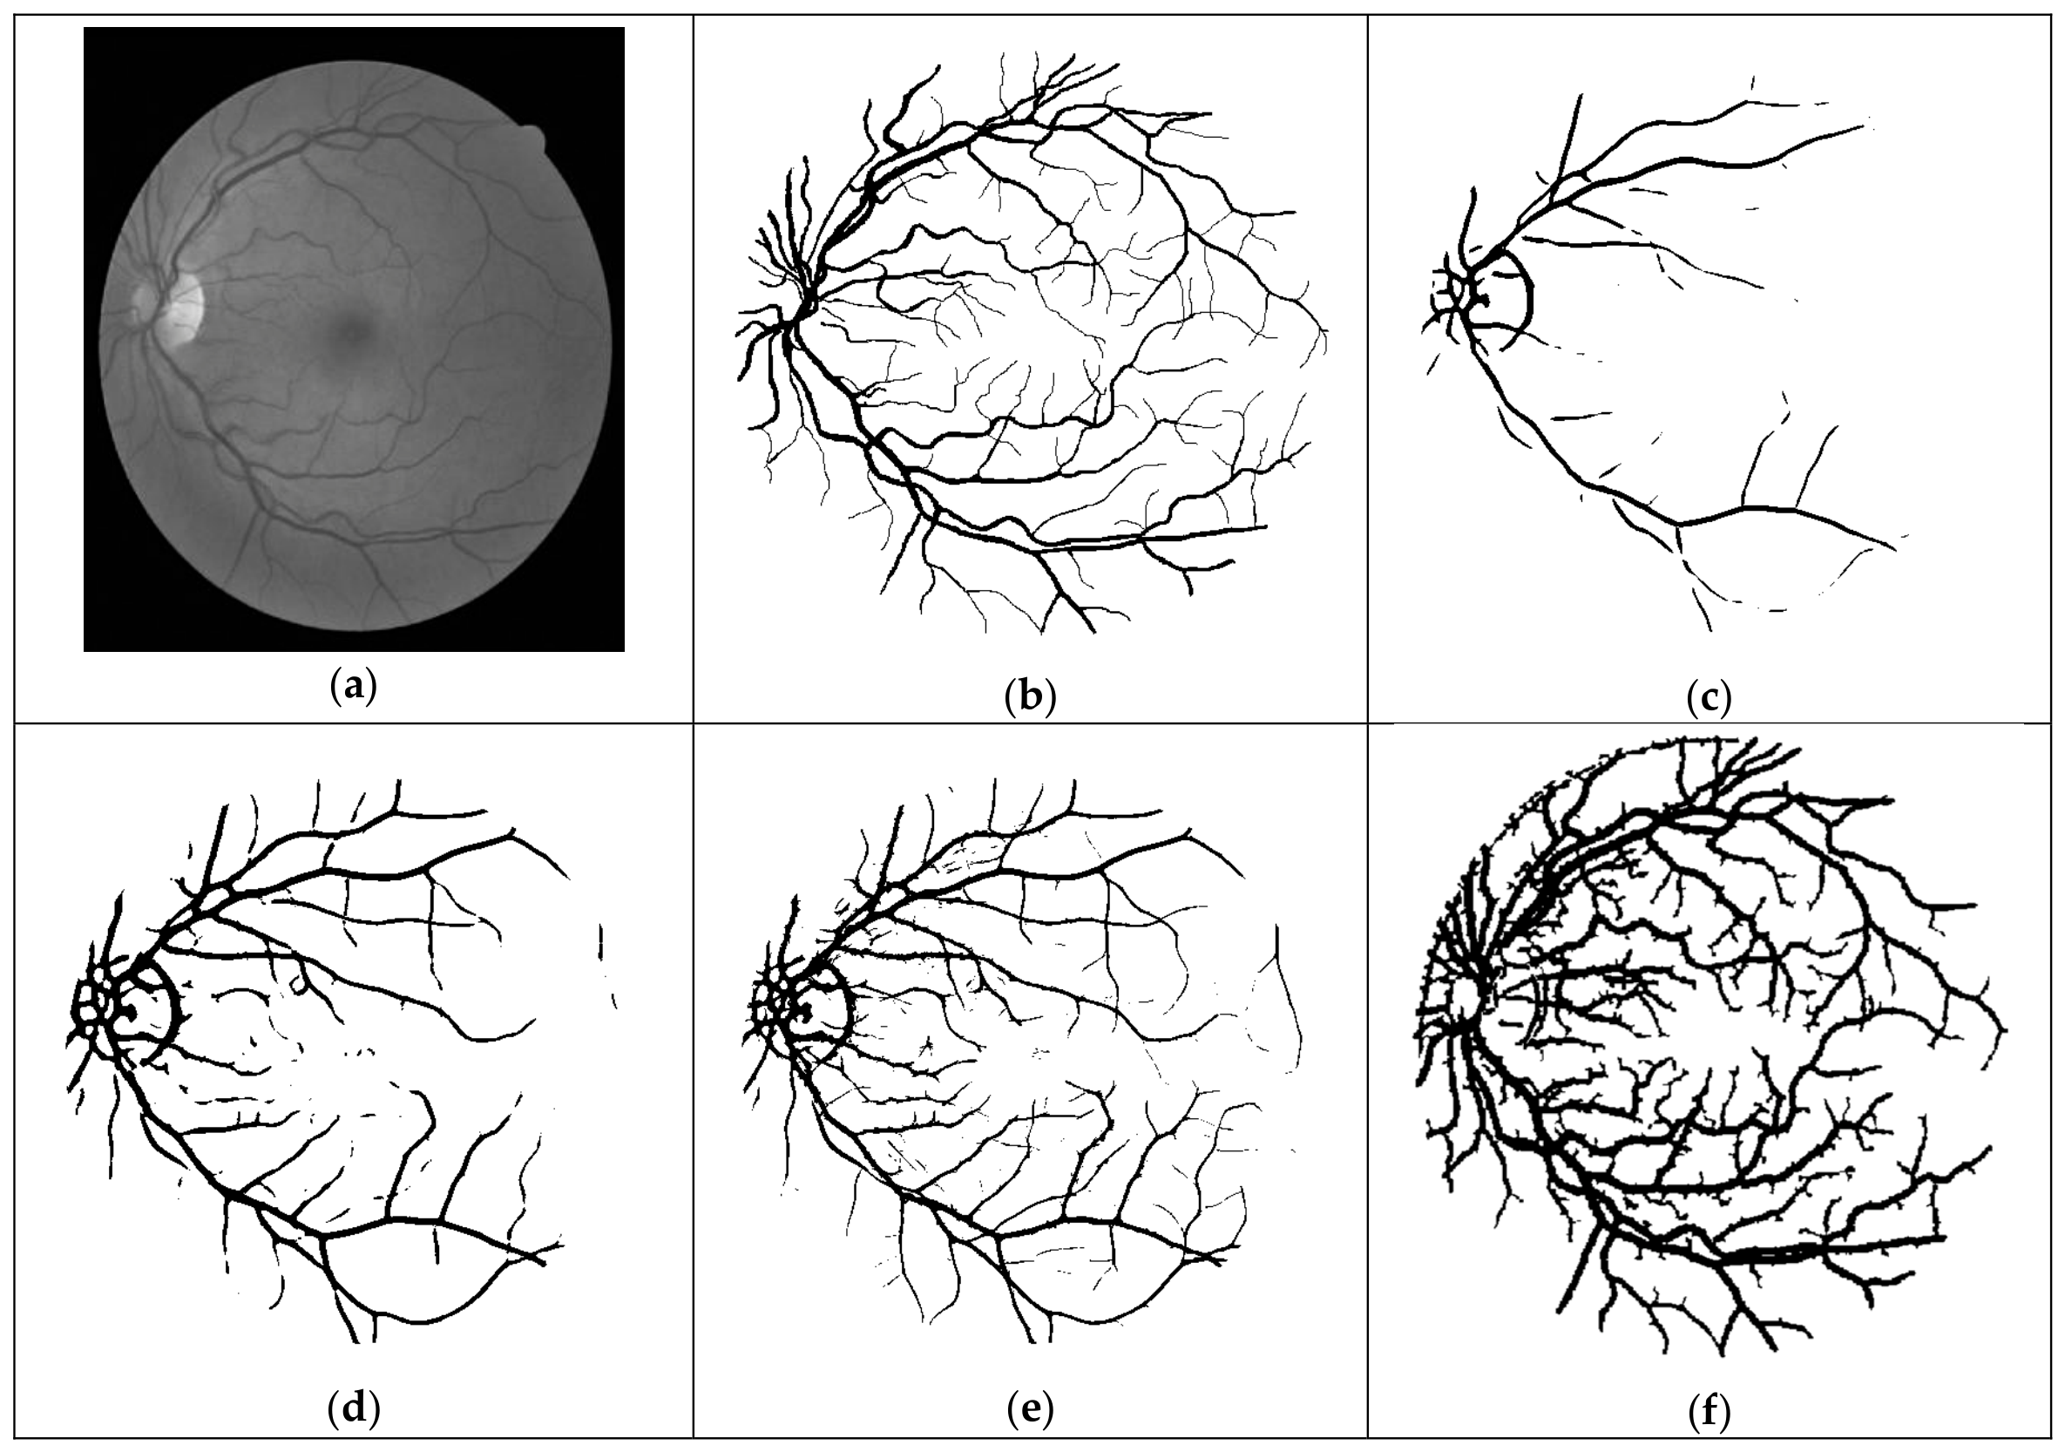
Figure 9 presents the segmentation results for the first image in the DRIVE dataset using the GMF [11], OGMF [12], GAMF [13], and proposed OMFGA methods. The segmentation results for all four methods were generated using our own implementations of the corresponding algorithms. The green-band image and the corresponding hand-labeled image are shown in Figure 9a,b, respectively, while Figure 9c–f presents the segmentation results obtained using the four methods. All segmentation results in Figure 9c–f were generated using our own implementations and were not reproduced from previously published papers. The results for GMF [11] and OGMF [12] were obtained by entering their corresponding parameters into our matched-filter program, while the [13] and proposed OMFGA results were generated using our implemented algorithms. This comparison provides a visual assessment of the vessel structures detected by each method, including small and larger blood vessels. In the proposed OMFGA method, the optimization focuses on small-vessel detection, while the filter from [13] is used to detect larger vessels. The visual results complement the numerical evaluation presented in Table 4 and Table 5.
Figure 9.
Segmentation results for the first image in the DRIVE dataset: (a) green-band image, (b) hand-labeled image, (c) GMF, (d) OGMF, (e) GAMF, and (f) the proposed OMFGA method.
5.5. Implications for Internet of Medical Things (IoMT)
The suggested segmentation approach for retinal vessels has potential as an image processing tool in IoMT-enabled retinal screening systems. In such a system, retinal images captured by IoT-connected ophthalmic imaging devices could be sent to a processing center where the algorithm could be used to identify retinal vessels as part of an automated retinal image screening and analysis system. The resulting retinal vessel segmentation could prove valuable for downstream image screening and clinical decision support applications.
That said, this study evaluated the performance of the segmentation algorithm on publicly available retinal image databases rather than implementing or testing it in an IoMT system. As such, further research would be needed to determine its suitability for actual implementation in an IoMT system, including assessment of its computational complexity and communication needs, as well as privacy, security, interoperability, and resilience to image tampering concerns.
6. Conclusions
This research presents a novel method that enhances the GMF system with the aim of improving the detection of retinal blood vessels, particularly small ones, in medical imaging. The proposed approach uses a genetic algorithm to generate five new GMF parameter sets, optimized using the ROC area as the fitness function. Based on the training-stage evaluation, two of these filters were selected and combined with a third filter from a prior GMF study to form the final system.
This integration achieved an MA of 0.9444 and an average ROC area of 0.9659 on the DRIVE test set. The first two parameter sets were optimized using image segments containing small retinal vessels, while the third parameter set, adopted from [13], was included for large-vessel detection. This integration achieved an MA of 0.9444 and an average ROC area of 0.9659 on the DRIVE test set. The combined use of the proposed filters is designed to enhance the detection of small blood vessels while maintaining the detection of larger vessels. Additionally, the study incorporated a process for localizing and eliminating the optic disc (OD) to reduce false vessel responses in the optic-disc region. However, some false vessel responses persisted, slightly reducing the overall accuracy.
In conclusion, this research presents a method for retinal vessel segmentation that combines genetic algorithm-based GMF optimization with optic disc elimination. The combined use of a genetic algorithm for GMF optimization and a targeted OD elimination process not only addresses the challenge of small-vessel detection but also demonstrates competitive performance in the evaluated datasets. While residual false positives remain, the proposed method provides a basis for further research in automated retinal image analysis and its potential integration into connected retinal screening systems.
However, practical deployment in IoMT environments requires further consideration of computational efficiency, privacy, and security. In the proposed approach, GA optimization is performed during method development, while the selected optimized filter parameters are subsequently fixed and applied to new retinal images without repeating the optimization process, which may reduce the computational requirements during subsequent image analysis. Nevertheless, execution time, memory requirements, and performance on resource-constrained edge or mobile devices were not evaluated in this study and should be investigated before practical deployment. Furthermore, retinal images and the information derived from them constitute sensitive medical data, requiring secure transmission, appropriate access control, and data-protection mechanisms when exchanged between connected devices and healthcare systems. Image integrity is also important because unauthorized manipulation or corruption of retinal images could affect vessel segmentation results. Future work should therefore evaluate the computational performance of OMFGA in actual IoMT environments and investigate appropriate privacy, security, and image-integrity mechanisms for its integration into connected retinal screening systems.
Although the selected filter configuration was evaluated on both DRIVE and STARE without further optimization, the GA optimization was based on vessel segments from a single DRIVE training image. Future work should evaluate the stability of the optimized parameters across multiple training images, different vessel-segment selections, and independent GA runs with different random seeds. Future work should also include a systematic ablation study to quantify the individual contributions of GA optimization, multi-filter fusion, and optic-disc exclusion to the overall segmentation performance.
Author Contributions
Conceptualization, M.A.-k. and H.K.; methodology, M.A.-k. and H.K.; software, M.A.-k.; validation, M.A.-k., H.K., T.A.-K. and L.R.; formal analysis, M.A.-k. and H.K.; investigation, M.A.-k.; writing—original draft preparation, M.A.-k.; writing—review and editing, H.K., T.A.-K., L.R. and M.M.; supervision, H.K. and M.M.; project administration, H.K. and M.M. All authors have read and agreed to the published version of the manuscript.
Funding
This research received no external funding.
Institutional Review Board Statement
This study used publicly available retinal image datasets (DRIVE and STARE) and did not involve the collection of new human-subject data. Therefore, ethical approval was not required for this study.
Informed Consent Statement
Not applicable. This study involved the secondary analysis of publicly available retinal image datasets and did not involve direct participation of human subjects or the collection of new patient data.
Data Availability Statement
The retinal image datasets used in this study, DRIVE and STARE, are publicly available through their respective dataset repositories. The data used in this study were obtained from these publicly available sources. No new human-subject data were collected for this research.
Acknowledgments
During the preparation of this manuscript, the authors used ChatGPT (GPT-5, OpenAI) for English language proofreading. The authors subsequently reviewed and edited the content and take full responsibility for the final content of the published article.
Conflicts of Interest
The authors declare no conflicts of interest.
References
- Jiang, M.; Fang, H.; Tian, H. Latest advancements and trends in biomedical polymers for disease prevention, diagnosis, treatment, and clinical application. J. Control. Release 2025, 380, 138–174. [Google Scholar] [CrossRef] [Scilit] [PubMed]
- Gharaibeh, N.; Al-Hazaimeh, O.M.; Al-Naami, B.; Nahar, K.M.O. An effective image processing method for detection of diabetic retinopathy diseases from retinal fundus images. Int. J. Signal Imaging Syst. Eng. 2018, 11, 206–216. [Google Scholar] [CrossRef] [Scilit]
- Mittal, K.; Rajam, V.M.A. Computerized retinal image analysis—A survey. Multimed. Tools Appl. 2020, 79, 22389–22421. [Google Scholar] [CrossRef] [Scilit]
- Dhal, P.; Azad, C. A novel approach for blood vessel segmentation with exudate detection in diabetic retinopathy. In Proceedings of the 2020 International Conference on Artificial Intelligence and Signal Processing AISP 2020, Amaravati, India, 10–12 January 2020. [Google Scholar] [CrossRef] [Scilit]
- Jin, J.; Liu, Q.; Li, C. The Metabolic Underpinnings of Retinal Health and Disease: A Focus on Photoreceptor Cells. Health Metab. 2025, 2, 6. [Google Scholar] [CrossRef] [Scilit]
- Zhou, L.; Rzeszotarski, M.S.; Chokreff, J.M. The Detection and Quantification of Retinopathy Using Digital Angiograms. IEEE Trans. Med. Imaging 1994, 13, 619–626. [Google Scholar] [CrossRef] [Scilit] [PubMed]
- Hoover, A.; Kouznetsova, V.; Goldbaum, M. Locating Blood Vessel in Retinal Images by Piecewise Threshold Probing of a Matched Filter Response. Int. J. Adv. Eng. Res. Dev. 2017, 4, 931–935. [Google Scholar] [CrossRef] [Scilit]
- Banumathi, A.; Devi, R.K.; Raju; Kumar, V.A. Performance analysis of matched filter techniques for automated detection of blood vessels in retinal images. In Proceedings of the TENCON 2003. Conference on Convergent Technologies for Asia-Pacific Region, Bangalore, India, 15–17 October 2003; Volume 3, pp. 543–546. [Google Scholar] [CrossRef] [Scilit]
- Akram, M.U.; Atzaz, A.; Aneeque, S.F.; Khan, S.A. Blood vessel enhancement and segmentation using wavelet transform. In Proceedings of the 2009 International Conference on Digital Image Processing ICDIP 2009, Bangkok, Thailand, 7–9 March 2009; pp. 34–38. [Google Scholar] [CrossRef] [Scilit]
- Su, B.X.Y.; Hong, B.; Liu, S.; Guo, Y.; Ni, K. Near-infrared image-based vascular network extraction using enhanced matched filtering. Opt. Laser Technol. 2025, 192, 113596. [Google Scholar] [CrossRef] [Scilit]
- Chaudhuri, S.; Chatterjee, S.; Katz, N.; Nelson, M.; Goldbaum, M. Detection of blood vessels in retinal images using two-dimensional matched filters. IEEE Trans. Med. Imaging 1989, 8, 263–269. [Google Scholar] [CrossRef] [Scilit] [PubMed]
- Al-Rawi, M.; Qutaishat, M.; Arrar, M. An improved matched filter for blood vessel detection of digital retinal images. Comput. Biol. Med. 2007, 37, 262–267. [Google Scholar] [CrossRef] [Scilit] [PubMed]
- Al-Rawi, M.; Karajeh, H. Genetic algorithm matched filter optimization for automated detection of blood vessels from digital retinal images. Comput. Methods Programs Biomed. 2007, 87, 248–253. [Google Scholar] [CrossRef] [Scilit] [PubMed]
- Cinsdikici, M.G.; Aydin, D. Detection of blood vessels in ophthalmoscope images using MF/ant (matched filter/ant colony) algorithm. Comput. Methods Programs Biomed. 2009, 96, 85–95. [Google Scholar] [CrossRef] [Scilit] [PubMed]
- Tan, Y.; Yang, K.F.; Zhao, S.X.; Wang, J.; Liu, L.; Li, Y.J. Deep matched filtering for retinal vessel segmentation. Knowl.-Based Syst. 2024, 283, 111185. [Google Scholar] [CrossRef] [Scilit]
- Leandro, J.J.G.; Cesar, R.M.; Jelinek, H.F. Blood vessels segmentation in retina: Preliminary assessment of the mathematical morphology and of the wavelet transform techniques. Braz. Symp. Comput. Graph. Image Process. 2001, 2001, 84–90. [Google Scholar] [CrossRef] [Scilit]
- Zhang, B.; Zhang, L.; Zhang, L.; Karray, F. Retinal vessel extraction by matched filter with first-order derivative of Gaussian. Comput. Biol. Med. 2010, 40, 438–445. [Google Scholar] [CrossRef] [Scilit] [PubMed]
- Srivastava, R.; Duan, L.; Wong, D.W.K.; Liu, J.; Wong, T.Y. Detecting retinal microaneurysms and hemorrhages with robustness to the presence of blood vessels. Comput. Methods Programs Biomed. 2017, 138, 83–91. [Google Scholar] [CrossRef] [Scilit] [PubMed]
- Orujov, F.; Maskeliūnas, R.; Damaševičius, R.; Wei, W. Fuzzy based image edge detection algorithm for blood vessel detection in retinal images. Appl. Soft Comput. J. 2020, 94, 106452. [Google Scholar] [CrossRef] [Scilit]
- Gonzalez, R.C.; Woods, R.E. Digital Image Processing, Global Edition; Pearson Education: Hoboken, NJ, USA, 2018; pp. 19–44. [Google Scholar]
- Zana, F.; Klein, J.C. Segmentation of vessel-like patterns using mathematical morphology and curvature evaluation. IEEE Trans. Image Process. 2001, 10, 1010–1019. [Google Scholar] [CrossRef] [Scilit] [PubMed]
- Upadhyay, K.; Agrawal, M.; Vashist, P. Unsupervised multiscale retinal blood vessel segmentation using fundus images. IET Image Process. 2020, 14, 2616–2625. [Google Scholar] [CrossRef] [Scilit]
- Bankhead, P.; Scholfield, C.N.; McGeown, J.G.; Curtis, T.M. Fast retinal vessel detection and measurement using wavelets and edge location refinement. PLoS ONE 2012, 7, e32435. [Google Scholar] [CrossRef] [Scilit] [PubMed]
- Dizdaro, B.; Ataer-Cansizoglu, E.; Kalpathy-Cramer, J.; Keck, K.; Chiang, M.F.; Erdogmus, D. Level sets for retinal vasculature segmentation using seeds from ridges and edges from phase maps. In Proceedings of the IEEE International Workshop on Machine Learning for Signal Processing MLSP, Santander, Spain, 23–26 September 2012. [Google Scholar] [CrossRef] [Scilit] [PubMed]
- Staal, J.; Abràmoff, M.D.; Niemeijer, M.; Viergever, M.A.; Van Ginneken, B. Ridge-based vessel segmentation in color images of the retina. IEEE Trans. Med. Imaging 2004, 23, 501–509. [Google Scholar] [CrossRef] [Scilit] [PubMed]
- Chutatape, O.; Zheng, L.; Krishnan, S.M. Retinal Blood Vessel Detection and Tracking by Matched Gaussian and Kalman Filters; IEEE: Piscataway, NJ, USA, 2002; pp. 3144–3149. [Google Scholar] [CrossRef] [Scilit]
- Gang, L.; Chutatape, O.; Krishnan, S.M. Detection and measurement of retinal vessels in fundus images using amplitude modified second-order Gaussian filter. IEEE Trans. Biomed. Eng. 2002, 49, 168–172. [Google Scholar] [CrossRef] [Scilit] [PubMed]
- Chen, D.; Yang, W.; Wang, L.; Tan, S.; Lin, J.; Bu, W. PCAT-UNet: UNet-like network fused convolution and transformer for retinal vessel segmentation. PLoS ONE 2022, 17, e0262689. [Google Scholar] [CrossRef] [Scilit] [PubMed]
- Cao, J.; Chen, J.; Gu, Y.; Liu, J. MFA-UNet: A vessel segmentation method based on multi-scale feature fusion and attention module. Front. Neurosci. 2023, 17, 1249331. [Google Scholar] [CrossRef] [Scilit] [PubMed]
- Su, Y.; Cheng, J.; Cao, G.; Liu, H. How to design a deep neural network for retinal vessel segmentation: An empirical study. Biomed. Signal Process. Control 2022, 77, 103761. [Google Scholar] [CrossRef] [Scilit]
- Yue, K.; Zhan, L.; Wang, Z. Unsupervised domain adaptation teacher–student network for retinal vessel segmentation via full-resolution refined model. Sci. Rep. 2025, 15, 2038. [Google Scholar] [CrossRef] [Scilit] [PubMed]
- Yao, Z.; Xing, C.; Zhu, G.; Xie, W.; Wang, Z.; Zhang, G. RetinalVasNet: A deep learning approach for robust retinal microvasculature detection. Front. Mol. Biosci. 2025, 12, 1562608. [Google Scholar] [CrossRef] [Scilit] [PubMed]
- Wei, M.M.; Wang, L.; Zhao, B.W.; Su, X.R.; You, Z.H.; Huang, D.S. Integrating Transformer and Graph Attention Network for circRNA-miRNA Interaction Prediction. IEEE J. Biomed. Health Inform. 2025, 29, 6105–6113. [Google Scholar] [CrossRef] [Scilit] [PubMed]
- Wei, M.; Wang, L.; Su, X.; Zhao, B.; Wang, X.; Li, Y.; You, Z. Transformer-driven graph fusion model for circRNA-miRNA interaction prediction. Pattern Recognit. 2027, 182, 114724. [Google Scholar] [CrossRef] [Scilit]
- Ji, B.; Hu, T.; Wang, J.; Liu, M.; Xu, L.; Zhang, Q.; Zhong, S.; Qiao, L.; Zhang, Y.; Peng, S.; et al. CAPTAIN: A multimodal foundation model pretrained on co-assayed single-cell RNA and protein. Nat. Commun. 2026, 17, 6161. [Google Scholar] [CrossRef] [Scilit] [PubMed]
- Hossain, N.I.; Reza, S. Blood vessel detection from fundus image using Markov random field based image segmentation. In Proceedings of the 4th International Conference on Advances in Electrical Engineering ICAEE 2017, Dhaka, Bangladesh, 28–30 September 2017; Volume 2018, pp. 123–127. [Google Scholar] [CrossRef] [Scilit]
- Biswal, B.; Pooja, T.; Subrahmanyam, N.B. Robust retinal blood vessel segmentation using line detectors with multiple masks. IET Image Process. 2018, 12, 389–399. [Google Scholar] [CrossRef] [Scilit]
- Vanmathi, C.; Vincent, D.R.; Manivannan, S.S.; Anushaa, J. Detection of Blood Vessels in Retinal Images using Line Tracking Algorithm. In Proceedings of the 2019 2nd International Conference on Intelligent Computing, Instrumentation and Control Technologies ICICICT 2019, Kannur, India, 5–6 July 2019; pp. 967–974. [Google Scholar] [CrossRef] [Scilit]
- Mahfouz, A.E.; Fahmy, A.S. Fast localization of the optic disc using projection of image features. IEEE Trans. Image Process. 2010, 19, 3285–3289. [Google Scholar] [CrossRef] [Scilit] [PubMed]
- Raja, D.S.S.; Vasuki, S. Automatic detection of blood vessels in retinal images for diabetic retinopathy diagnosis. Comput. Math. Methods Med. 2015, 2015, 419279. [Google Scholar] [CrossRef] [Scilit] [PubMed]
- Reddy, G.N.; Rao, K.D.G. Microaneurysm identification using cross sectional profile analysis with optic disc removal. In Proceedings of the International Conference on Communication and Electronics Systems ICCES 2016, Coimbatore, India, 21–22 October 2016. [Google Scholar] [CrossRef] [Scilit]
- Khaing, T.T.; Aimmanee, P. Optic disk segmentation in retinal images using active contour model based on extended feature projection. In Proceedings of the 2017 8th International Conference of Information and Communication Technology for Embedded Systems (IC-ICTES) 2017—Proceedings, Chonburi, Thailand, 7–9 May 2017. [Google Scholar] [CrossRef] [Scilit]
- Krestanova, A.; Kubicek, J.; Penhaker, M. Recent techniques and trends for retinal blood vessel extraction and tortuosity evaluation: A comprehensive review. IEEE Access 2020, 8, 197787–197816. [Google Scholar] [CrossRef] [Scilit]
- Fan, Z.; Lu, J.; Wei, C.; Huang, H.; Cai, X.; Chen, X. A Hierarchical Image Matting Model for Blood Vessel Segmentation in Fundus Images. IEEE Trans. Image Process. 2019, 28, 2367–2377. [Google Scholar] [CrossRef] [Scilit] [PubMed]
- Fraz, M.M.; Basit, A.; Barman, S.A. Application of morphological bit planes in retinal blood vessel extraction. J. Digit. Imaging 2013, 26, 274–286. [Google Scholar] [CrossRef] [Scilit] [PubMed]
- Khan, M.A.U.; Khan, T.M.; Aziz, K.I.; Ahmad, S.S.; Mir, N.; Elbakush, E. The Use of Fourier Phase Symmetry for Thin Vessel Detection in Retinal Fundus Images. In Proceedings of the 2019 19th IEEE International Symposium on Signal Processing and Information Technology ISSPIT 2019, Ajman, United Arab Emirates, 10–12 December 2019. [Google Scholar] [CrossRef] [Scilit]
- Martinez-Perez, M.E.; Hughes, A.D.; Thom, S.A.; Bharath, A.A.; Parker, K.H. Segmentation of blood vessels from red-free and fluorescein retinal images. Med. Image Anal. 2007, 11, 47–61. [Google Scholar] [CrossRef] [Scilit] [PubMed]
- Mapayi, T.; Viriri, S.; Tapamo, J.R. Adaptive thresholding technique for retinal vessel segmentation based on glcm-energy information. Comput. Math. Methods Med. 2015, 2015, 597475. [Google Scholar] [CrossRef] [Scilit] [PubMed]
- Marín, D.; Aquino, A.; Gegúndez-Arias, M.E.; Bravo, J.M. A new supervised method for blood vessel segmentation in retinal images by using gray-level and moment invariants-based features. IEEE Trans. Med. Imaging 2011, 30, 146–158. [Google Scholar] [CrossRef] [Scilit] [PubMed]
- You, X.; Peng, Q.; Yuan, Y.; Cheung, Y.M.; Lei, J. Segmentation of retinal blood vessels using the radial projection and semi-supervised approach. Pattern Recognit. 2011, 44, 2314–2324. [Google Scholar] [CrossRef] [Scilit]
- Zhao, Y.; Liu, Y.; Wu, X.; Harding, S.P.; Zheng, Y. Retinal vessel segmentation: An efficient graph cut approach with Retinex and local phase. PLoS ONE 2015, 10, e0122332. [Google Scholar] [CrossRef] [Scilit] [PubMed][Green Version]
- Abdallah, M.B.; Malek, J.; Azar, A.T.; Montesinos, P.; Belmabrouk, H.; Monreal, J.E.; Krissian, K. Automatic extraction of blood vessels in the retinal vascular tree using multiscale medialness. Int. J. Biomed. Imaging 2015, 2015, 519024. [Google Scholar] [CrossRef] [Scilit] [PubMed]
- Mendonça, A.M.; Campilho, A. Segmentation of retinal blood vessels by combining the detection of centerlines and morphological reconstruction. IEEE Trans. Med. Imaging 2006, 25, 1200–1213. [Google Scholar] [CrossRef] [Scilit] [PubMed]

Disclaimer/Publisher’s Note: The statements, opinions and data contained in all publications are solely those of the individual author(s) and contributor(s) and not of MDPI and/or the editor(s). MDPI and/or the editor(s) disclaim responsibility for any injury to people or property resulting from any ideas, methods, instructions or products referred to in the content. |
© 2026 by the authors. Licensee MDPI, Basel, Switzerland. This article is an open access article distributed under the terms and conditions of the Creative Commons Attribution (CC BY) license.