


Abstract
Federated learning lets multiple parties train a shared model without pooling their data, but a client with far less data than the others can end up poorly served even when the group’s average accuracy looks fine. We ask whether the choice of pretrained backbone affects this under LoRA fine-tuning, and whether per-word perplexity on the target text is associated with which backbone helps the worst-off client before federated training starts. We ran 313 experiments across three text-classification datasets and three similarly sized backbones (RoBERTa, BERTweet, PubMedBERT), each compared against a task-specific baseline on identical data splits. Lower-perplexity backbones were associated with larger gains for the worst-performing client (rank correlation across nine dataset–backbone pairs; block-permutation , the smallest value this design can produce). This is an exploratory finding: a backbone held out of the analysis was directionally consistent with it, but that is one prospective check, not a validation. The same ordering predicts mean-client accuracy equally well, so the correlation does not isolate a worst-client-specific effect; a cross-client dispersion measure is also associated with perplexity, but no result in this family survives multiplicity correction. Ditto, at the settings and skew we tested, recovered only 4–12% of the gap between training alone and full federation; other personalization methods were not tested. Removing aggregation erased the benefit, and a client’s update was close to orthogonal to the group’s update, which is inconsistent with one proposed explanation as we operationalized it. Practically, per-word perplexity on a sample of task text is a provisional shortlisting signal for backbone choice. We release our code, predictions, and full results for others to test.
1. Introduction
Consider a hospital with two hundred labeled records that joins a federation of ten hospitals. The other nine hold tens of thousands each. After training, the shared model reports good average accuracy. Whether it works for the small hospital is a separate question, and it is the question this paper is about.
Average accuracy across clients hides this case by construction. A federation of ten clients can report 90% average accuracy while one client sits at 30%, and the client left behind is often the one the federation was built to serve. Small hospitals, minority-language schools and community clinics join federations precisely because they cannot train alone. Reporting only the mean tells them nothing about what they will receive.
Pretrained models are now the default starting point for federated text classification, and there is good reason to expect them to help. Nguyen et al. [1] showed that starting from pretrained weights narrows the gap between IID and non-IID federated training, and that client updates from pretrained weights are better aligned with one another than updates from random initialization. Their comparison is pretrained against random, measured-on-average accuracy.
Two questions remain open. A practitioner does not choose between a pretrained model and a random one. They choose among several pretrained models, and nothing in the literature says which to pick. Nor does average accuracy answer the question the small hospital is asking. We take up both.
We ran 313 controled experiments. Three text datasets are crossed with three pretrained backbones, and the backbones are matched in capacity so that model size does not vary with pretraining domain: all three are twelve-layer encoders of 110 to 125 million parameters, each pretrained from scratch on a different corpus (tokenizer and training recipe also differ). Every cell uses five random partitions. Every foundation model is compared against a task-specific convolutional baseline trained on the identical partition, which makes each comparison paired and removes the partition draw as a source of noise.
We measure the client that does worst, not the average. Our primary metric scores each client’s model on the full global test set, restricted to that client’s classes, so that a model that has learned nothing cannot score well under extreme skew (Section 3.4).
We froze a protocol (Appendix C) before the reported grid was run and record every departure from it in a deviation log released with the code. Here “pre-registered” means fixed in this frozen protocol, not in an external registry. Section 6 separates pre-registered analyses, protocol amendments and exploratory findings.
1.1. What We Find
Across nine backbone–dataset cells, per-word perplexity on the task text orders the backbones by their worst-client benefit (Section 4.1). The same ordering holds for mean-client benefit, so we test a dispersion measure separately (Section 4.1.2). Ditto [2] recovers little of the gap between local training and federation at our most extreme skew (Section 4.2), and the benefit is lost without aggregation (Section 4.3). The smallest client’s adapter update is close to orthogonal to the aggregate, not opposed to it. The perplexity findings are exploratory; the single out-of-sample check is described in Section 4.1.1.
1.2. Contributions and Scope
- A provisional backbone-selection heuristic for federated PEFT that requires no federated training, supported by one prospective held-out check—useful because backbone choice among similarly-sized pretrained models is otherwise made by convention or availability, and a full federated run is too expensive to use as the selection method itself.
- Evidence, across three domain-matched cells, that Ditto forfeits most of federation’s worst-client benefit when clients are data-poor, with the regularization strength swept over two orders of magnitude—useful because it identifies a data-volume limit that a practitioner cannot fix by tuning this method harder.
- Direct measurement of adapter-space geometry and of a no-aggregation control, which together are inconsistent with two standing explanations for worst-client behavior under extreme skew—necessary because an unmeasured mechanism risks directing future mitigation work at the wrong target, as our own inverse-weighted-aggregation result in the conference precursor to this work illustrates.
- A separate, dispersion-based measure (reduction in the cross-client Gini coefficient) that is also associated with perplexity and is separable from the worst-client/mean-client confound in Contribution 1; it is exploratory and does not survive multiplicity correction.
- A frozen protocol with a logged deviation record, including a pre-registered prediction that failed, and a public release of the code, the run manifest and all per-round results—necessary for the claims in this paper specifically to be checkable rather than taken on trust.
2. Related Work
2.1. Federated Learning Under Heterogeneous Data
FedAvg [3] set the standard protocol and is still the default baseline. Its weakness is well-documented: when clients hold different label distributions, local models drift apart between rounds and the average of those models is worse than any of them would suggest. FedProx adds a proximal term that keeps each local model near the global one [4]. SCAFFOLD tracks control variates and subtracts the estimated drift [5]. Both are evaluated on how quickly and how high average accuracy converges.
Label skew is usually simulated with a Dirichlet partition [6], and we follow that convention. A recent survey catalogues the many forms non-IID data can take and the metrics used to report them [7]. It notes that per-client evaluation is still uncommon, which is the gap our primary metric is designed to close.
2.2. Parameter-Efficient Fine-Tuning in Federated Settings
LoRA [8] has become the default way to perform parameter-efficient fine-tuning (PEFT) on a large model with few trainable parameters, and it fits federated learning well because only the low-rank factors need to be sent. Aggregating those factors is harder than it looks. Averaging A and B separately is not the same as averaging their product, so the server’s update does not match what the clients computed.
Several methods attack this problem from different angles. FFA-LoRA freezes the randomly initialized A matrices and aggregates only B, which makes aggregation linear again and halves communication [9]. FedSA-LoRA trains both factors locally but shares only A, keeping B on the client [10]. FLoRA stacks the clients’ modules instead of averaging them, which also handles clients that use different ranks [11]. Other work targets heterogeneous client resources [12,13] or federated instruction tuning at scale [14]. A recent survey covers the area in full [15].
These methods differ in how they aggregate, and they are compared on average accuracy and on communication cost. None is evaluated with worst-client outcomes as the primary criterion, and none varies which pretrained backbone sits underneath the adapters—the frozen backbone is treated as given throughout this literature. That omission matters specifically for the extreme-skew, cross-silo settings this paper targets: if backbone choice affects the worst-off client as much as our results suggest, then an aggregation-level fix evaluated only on average accuracy could look successful while still leaving a data-poor participant behind. We are asking a question one level up: given that some pretrained backbone will be used, which one? And what does that choice do to the client that does worst?
2.3. Pretrained Models and Fairness in Federated Learning
Nguyen et al. [1] give the clearest account of why pretraining helps, comparing pretrained with random initialization on average accuracy (Section 1). The literature offers no guidance on choosing among pretrained backbones of the same size, such as RoBERTa, BERTweet and PubMedBERT, for a federated deployment; whether that choice matters for the worst client, or can be settled cheaply, is open.
Two families of methods address unequal outcomes across clients. The first changes the objective. Agnostic federated learning optimizes for the worst mixture of client distributions [16], and q-FedAvg reweights clients by their loss so that accuracy is spread more evenly [17]. The second gives each client its own model. Per-FedAvg uses a meta-learning formulation [18], pFedMe uses Moreau envelopes [19], and Ditto trains a personal model regularized toward the global one [2]. pFedLoRA carries the same idea into adapter space [20].
Ditto is the closest of these to our setting and the strongest reported baseline for worst-case client utility, so we take it as the method to beat. Neither Ditto nor q-FedAvg, however, has been evaluated at the extreme skew levels () this paper studies, where a client’s local shard falls to single-digit or low-double-digit examples; it is therefore untested whether their guarantees, derived under an implicit assumption of trainable local data, hold when there is almost nothing to personalize on—a gap our results in Section 4.2 show is not incidental, since Ditto recovers only 4–12% of the local-to-federated gap in exactly this regime. Because federation is specifically attractive to participants who cannot train alone, a personalization method whose guarantees are untested at the exact data volumes such participants hold is not a safe default for the cross-silo healthcare and education settings this special issue targets—which is why we treat Ditto’s behavior under extreme skew as a question needing direct measurement rather than an assumption. Recent surveys map the wider fairness landscape [21] and a benchmark has been proposed for client-level fairness in particular [22].
One assumption runs through all of this work. These methods were introduced and tested in settings where every client has enough data to train on, so the question of what personalization does to a client with twenty examples has not been asked. Our results suggest the assumption is doing real work.
2.4. Positioning of This Work
Table 1 places our study against the closest work. Three gaps remain open, and we address each.
Table 1.
Position of this work. ✓ = addressed, P = partial, ✕ = not addressed.
No study varies in which pretrained backbone is used, at matched capacity, with the worst client as the primary outcome. Fairness-aware methods have not been evaluated at the level of skew where the smallest client holds tens of examples. The mechanism usually offered for worst-client failure, interference between the minority update and the aggregate, has been inferred from outcomes rather than measured in adapter space.
An earlier conference version of this study looked at one backbone on two datasets with a single random partition, and reported the opposite pattern: DistilBERT + LoRA increased the worst-client gap relative to TextCNN under extreme skew [23]. The present work extends it to a nine-cell backbone-by-dataset grid, five partitions per cell, a per-client metric that does not degenerate under extreme skew (Section 3.4), and matched local computation. Each of these changes independently moves the result in the direction reported here; we do not attempt to apportion credit among them, since the design was not set up to isolate their separate contributions.
3. Materials and Methods
3.1. Proposed Backbone-Selection Heuristic
The central proposal of this paper is a backbone-selection heuristic, which we treat as provisional. It is stated here in general terms before any dataset- or backbone-specific validation detail.
Input 1.
A set of candidate backbones of comparable capacity, each with its own tokenizer and masked language model ; an unlabeled sample of task text; a masking rate ; and a number of passes P.
Definition 1.
For a text x, let be its non-special tokens under and its number of whitespace-delimited words. In each pass , we draw a mask set by including each position independently with probability r. Writing for with the positions in M masked, the mean masked-token loss of backbone b is
and its subword fertility is . The per-word perplexity is
Converting from per-token to per-word units through is what makes S comparable across backbones whose tokenizers cut the same text into different numbers of pieces. The heuristic returns the candidates ordered by ascending (Algorithm 1) and favors the lowest-scoring one; we use it to shortlist candidates, not as a validated decision rule.
| Algorithm 1 Backbone selection by per-word masked-language-model perplexity. |
|
The heuristic needs no federated training, no labels, and no client data beyond a text sample; it costs masked-language-model forward passes per candidate, batched. The values of r, P and used in our validation are given in Section 3.5. Two limits apply in general. It orders candidates within a task and does not predict the size of the gain, since headroom is a property of the task; and it is relative, identifying the better-fitting candidate among those compared, not whether any of them fits well enough to deploy. Section 5.1 reports the evidence from our validation grid, which is one prospective held-out check.
3.2. Experimental Validation Setup
The remainder of this section describes the experimental design used to evaluate the heuristic above against measured worst-client outcomes; it is the evaluation methodology, not part of the heuristic itself, which is fully specified in Section 3.1.
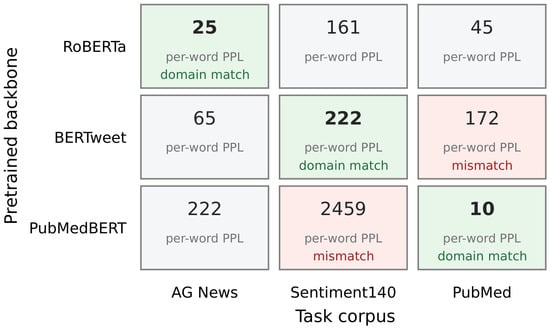
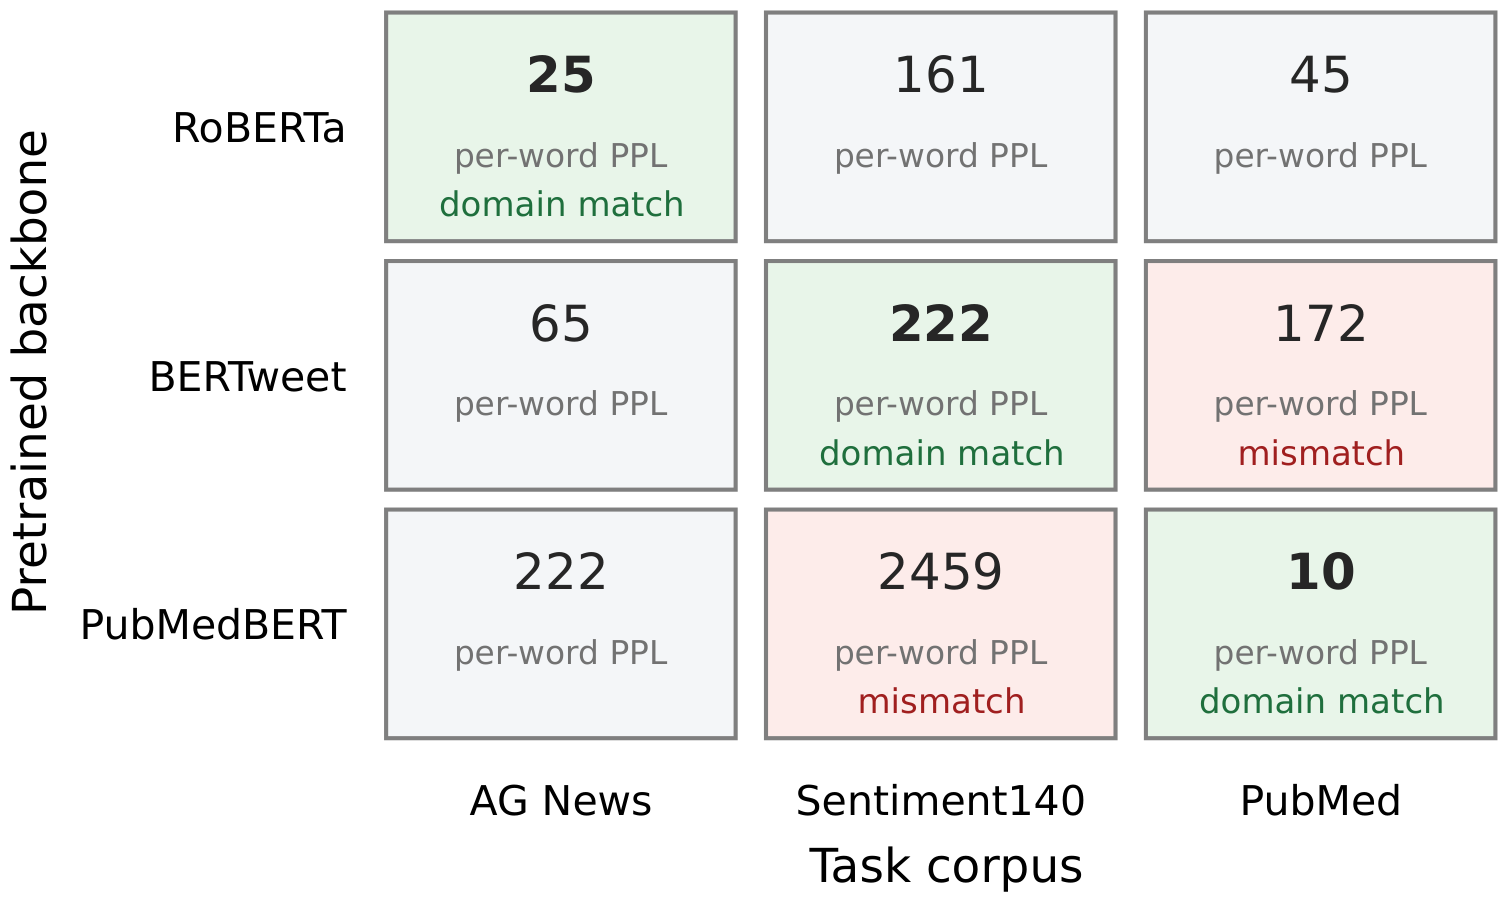
The study crosses three text datasets with three pretrained backbones, giving nine cells. Figure 1 shows the grid.
Figure 1.
The backbone-by-dataset grid. Each cell gives the per-word masked-LM perplexity of that backbone on that corpus. Green marks a domain match, red the two strongest mismatches.
The backbones are matched in capacity on purpose. All three are twelve-layer encoders of 110 to 125 M parameters, and each was pretrained from scratch on a different corpus. If we had compared a small general-domain model against a large domain-specific one, any difference we found could be attributed to size rather than to pretraining domain. Matching capacity removes that explanation; it does not, however, control for the backbones’ differing tokenizer vocabularies or training recipes, which remain uncontroled confounds we report rather than resolve (Section 6). Table 2 lists the three.
Table 2.
The three backbones. All are base-scale twelve-layer encoders trained from scratch (110–125 M parameters), so capacity is approximately matched; pretraining corpus, tokenizer vocabulary and training recipe all differ.
Three cells pair a backbone with the corpus closest to its own pretraining domain. We call these the domain-matched cells. Two cells pair a backbone with the corpus furthest from it, BERTweet on biomedical abstracts and PubMedBERT on tweets. The remaining four fall in between. Predictions for every cell were written down before the reported grid was run, as described in Section 3.5.
Each cell is compared against a task-specific baseline, TextCNN [27], with 2.7 M parameters. We use the same tokenizer for the baseline across all three datasets so that tokenization does not vary with the cell.
We use three English classification corpora that differ in domain and in the number of classes. AG News is news topic classification with four classes [28]. Sentiment140 is binary tweet sentiment [29]. PubMed 20 k RCT is five-way sentence-role classification drawn from the abstracts of randomized controled trials [30].
We subsample every dataset to 20,000 training examples with a fixed seed. The three corpora differ in size by two orders of magnitude, so without subsampling, dataset size would vary together with domain and a difference between cells could not be attributed to either one. Section 4.4 reports a control at the full 120,000 examples for one cell. Sequences are truncated at 128 tokens throughout.
Clients are formed with a label–Dirichlet partition [6] at concentration , with clients. Smaller concentrates each class on fewer clients. At , the smallest client typically holds around twenty training examples while the largest holds several thousand.
Partition indices are generated once per (dataset, , seed) and written to disk, so a foundation model and its TextCNN baseline see identical clients holding identical examples. This makes each comparison paired and removes the partition draw as a source of variance, which matters: on one cell, the worst-client score varies by more than 0.25 across partition draws, larger than most of the effects we report.
Each client’s shard is split 80/10/10 into training, validation and test data, stratified by label. For PubMed, the split is made at the level of the abstract, because sentences from one abstract share topic and vocabulary and a sentence-level split would place near-duplicates on both sides (our 20,000-sentence subsample spans 11,177 abstracts).
3.3. Models, Adaptation, and Federated Protocol
Each backbone is used with its own tokenizer and kept frozen. We insert LoRA adapters [8] at the query and value projections of every attention sublayer, with rank , scaling and dropout 0.1. A linear classification head is trained alongside the adapters. Only the adapters and the head are trained and communicated.
We implement LoRA directly rather than through a library, for two reasons. The effective weight update can then be extracted exactly for the geometry measurements in Section 4.3, and the FFA-LoRA variant, which freezes A, becomes a single flag rather than a separate code path.
Table 3 gives the configuration. Rounds are uniform across so that convergence budget does not vary with the condition. Local epochs are equal for both model classes, which removes a confound present in much of the literature: a foundation model given five local epochs against a baseline given one is not a controled comparison. Section 4.4 reports a stronger version of the same control, in which the number of local gradient steps rather than epochs is equalized.
Table 3.
Federated configuration. All conditions share these settings unless a control states otherwise.
We compare five aggregation strategies. FedAvg [3] is the default. FedProx [4] adds a proximal term with . FFA-LoRA [9] freezes the A matrices and aggregates only B. Ditto [2] trains a personal model per client, regularized toward the global model with strength , which we sweep over . Local-only training removes aggregation entirely and serves as the lower anchor: it tells us what each client could achieve alone.
3.4. Metrics and Evaluation
We use worst-client performanceand max–min utility interchangeably in what follows; both are narrower than algorithmic fairness in general, and we make no broader fairness claim. We use benefit for the paired change in the minimum statistic (which can be a different client under different models; Section 6) and for cross-client spread. Reporting the worst client requires a per-client score, and the obvious choices break down under extreme skew. We use three.
- P1, client-local macro-F1: macro-F1 on the client’s own held-out split. This is the utility the client experiences on data like its own.
- P2, global balanced accuracy: balanced accuracy of the client’s model on the global test set.
- P3, client-class macro-F1: macro-F1 restricted to the classes the client holds, but computed over the whole global test set. This is our primary endpoint.
The distinction between P1 and P3 decides what the paper measures. A client that holds a single class, which is common at , has a held-out split containing only that class, so a model that predicts that class for every input scores precision 1 and recall 1 on it (macro-F1 ): under, P1 a model that has learned nothing is indistinguishable from one that has learned everything. P3 removes the degeneracy. The constant predictor still achieves recall 1 on its class but produces a false positive on every example from the other classes, so precision falls to roughly and macro-F1 falls with it; a model must be competent on the client’s classes and restrained on the others to score well.
We log all three metrics at every evaluated round, so a reader can recompute any table under either endpoint. Where P1 and P3 disagree, we report both and say so, as in Section 4.2. Across clients, we report the minimum, the tenth percentile, mean, harmonic mean and standard deviation. The minimum over ten clients is a noisy order statistic, so the tenth percentile is reported for the primary grid in Table A2.
3.5. Perplexity Measurement: Validation-Grid Implementation
Section 3.1 states the selection heuristic in general terms; here, we give the exact parameters used to evaluate it against the federated grid. For every (backbone, dataset) pair, we sample 1500 texts from the training corpus, mask 15% of tokens at random, and average the masked-language-model loss over three passes [31]—the concrete instantiation of Algorithm 1 in Section 3.1. We also record subword fertility, the mean number of subword tokens per whitespace word, and vocabulary coverage [32], both used in the per-word conversion of Equation (2). All perplexities in this paper are per-word.
We pre-registered a derived quantity rather than the raw score. The protocol specified a two-way centered alignment score, which subtracts the backbone mean and the dataset mean and keeps the interaction. That score, its per-cell values and a signed prediction for every cell were computed and saved on 29 July 2026, before the reported grid was run according to the deviation log (Appendix C). Section 4.1.1 reports what happened to it.
3.6. Statistical Analysis and Reproducibility
The analysis plan was written and tested on pilot data before the grid was run, which keeps the choice of test independent of the results it is applied to.
Effects are paired differences taken per seed and tested with a paired t-test. We report exact p-values rather than thresholds, Cliff’s next to every test as a distribution-free effect size, and 95% bootstrap confidence intervals over seeds with 10,000 resamples. Where a table contains several comparisons, we apply Holm–Bonferroni correction within that table.
Five seeds is a deliberate choice with a known cost. The two-sided Wilcoxon signed-rank test cannot reach at , since its smallest attainable p-value is . We therefore use the paired t-test as the primary test and do not report a nonparametric companion at this sample size. Rank correlations across cells are Spearman coefficients, and we note the critical value at the relevant n wherever one is reported. Because each backbone and each dataset appears in three of the nine cells, the cells are not exchangeable; we therefore also test each rank correlation by recomputing it under all joint relabelings of backbone and dataset identity and report the two-sided proportion of relabelings at least as extreme. Its smallest attainable value is .
Departures from the frozen protocol are listed in Appendix C.
The full study is 313 completed runs on a single Tesla T4, with no failures. Each run is a row in a manifest keyed by a hash of its configuration, and results are appended to a single log as one record per client per evaluated round. We release the code, the manifest, the committed alignment table, the deviation log and the complete result log.
Conflict Rate, Formally
The adapter-conflict measure reported in Section 4.3 is defined per client k at each round as , where is client k’s pre-aggregation local update and is the post-aggregation change to the global model, both computed over the flattened LoRA parameter vector (all adapter matrices concatenated, not per layer). The conflict rate reported in Figure 5 is this indicator averaged over the last ten rounds and over clients.
4. Results
Every effect reported below is a paired difference in worst-client macro-F1 between the PEFT model and the TextCNN baseline. At a given seed, the two models train on the same Dirichlet partition, so the difference is taken per seed and tested paired. A positive value means the pretrained backbone helped the client that did worst. Unless stated otherwise, the metric is P3, the Dirichlet concentration is , and each cell rests on five partitions.
4.1. Perplexity Is Associated with Worst-Client Benefit
Table 4 lists all ten cells. Within each dataset, we sort the backbones by per-word masked-LM perplexity on that dataset’s text. The benefit falls as perplexity rises, and it does so in every dataset.
Table 4.
All ten cells at , grouped by dataset and sorted by per-word perplexity within each group. Every dataset is monotone. DistilBERT was held out of the analysis; its interval was recorded in the deviation log before its runs executed. Holm–Bonferroni correction is applied across the ten comparisons in this table.
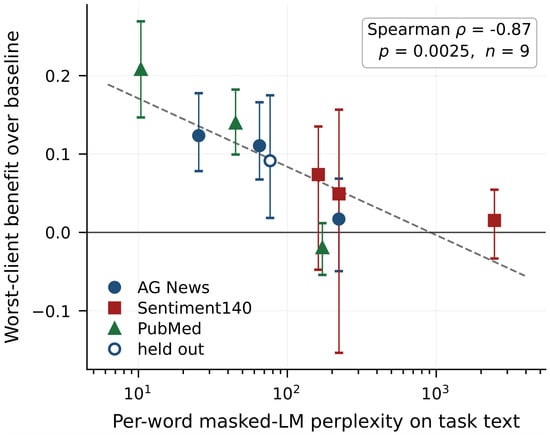
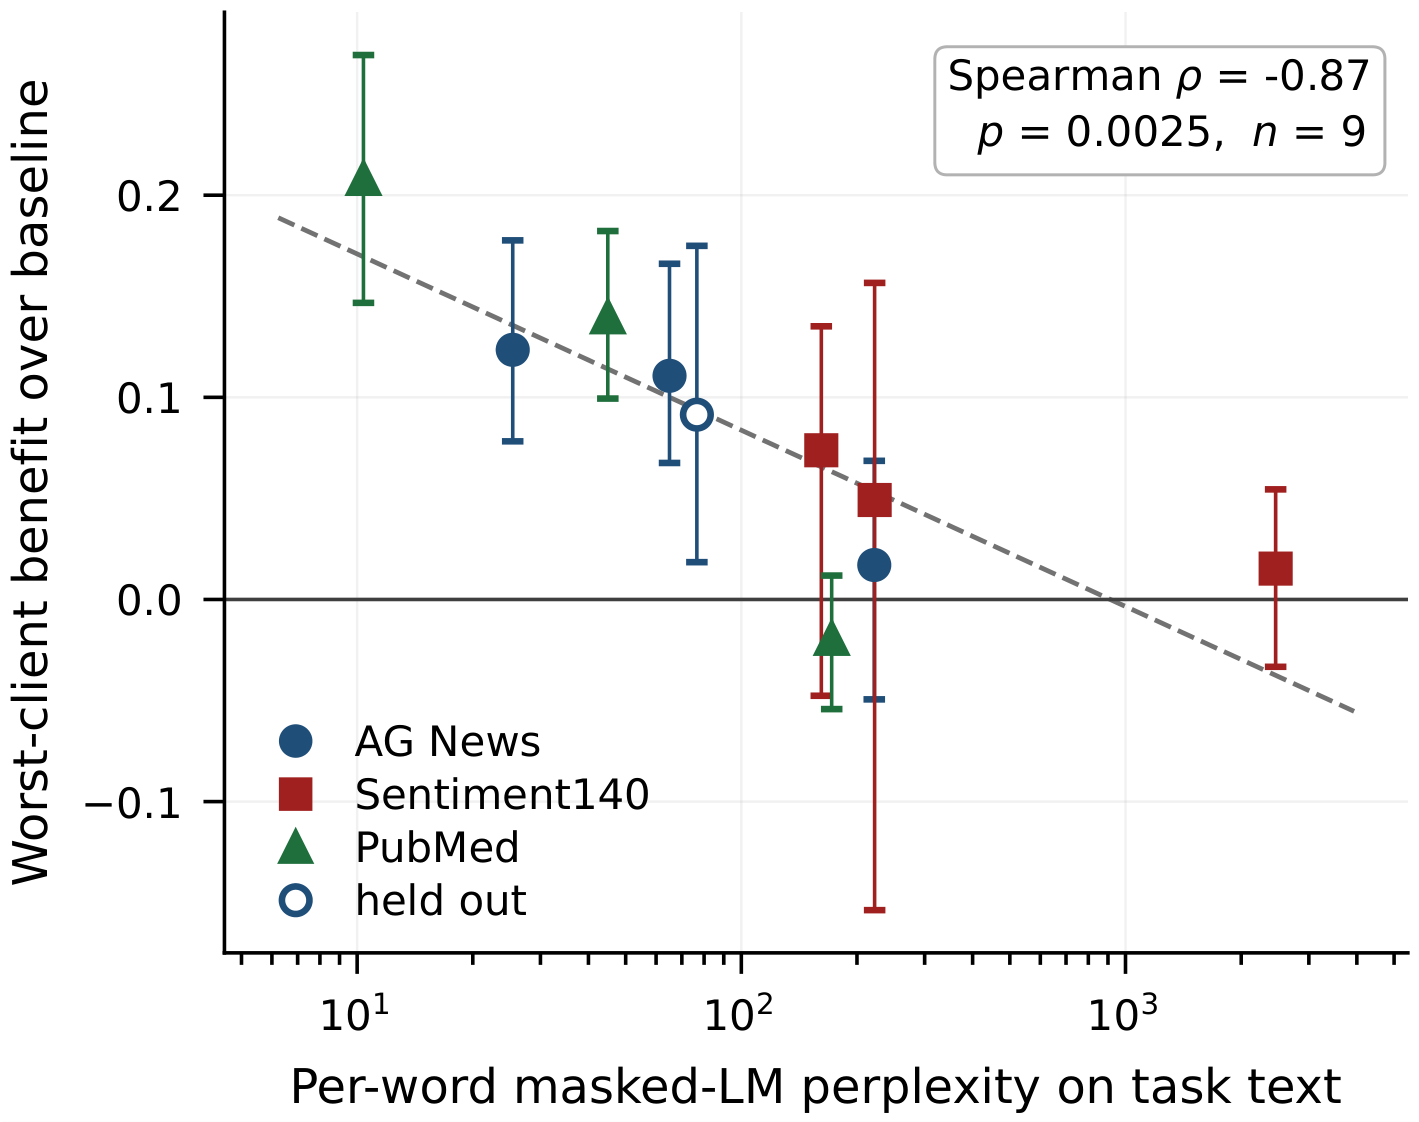
Figure 2 plots the same numbers. Across the nine grid cells, the rank correlation between log per-word perplexity and worst-client benefit is (), treating the nine cells as independent draws. Because each of the three backbones and three datasets contributes to three cells each, we also report a block-permutation test that treats backbone and dataset identity as the true exchangeable units: recomputing the correlation under all joint relabelings of backbone and dataset identity, the observed is the single most extreme value among all 36, giving a two-sided block-permutation . We treat this as the inferential test for this correlation and the naive value above as descriptive. With three backbones and three datasets, the smallest attainable value is , so this p-value is at the floor of what the design can show.
Figure 2.
Per-word masked-language-model perplexity against worst-client benefit. Each point is one backbone–dataset pair averaged over five partitions; bars are 95% bootstrap intervals and marker shape denotes the dataset. The open marker is DistilBERT, held out of the analysis, whose interval was recorded in the deviation log before its runs executed.
Scored instead with the literature-standard pseudo-log-likelihood [31]; every non-special token masked individually) on the same 1500-text samples, the within-dataset backbone ranking is identical in all three datasets (Table A6); the correlation with worst-client benefit is (block-permutation ), and the two scores correlate at .
Two cells survive Holm correction within the table. PubMed × PubMedBERT gives (, Holm-adjusted ) and PubMed × RoBERTa gives (, Holm-adjusted ). For PubMed × PubMedBERT, Cliff’s is : the foundation model beat the baseline on every one of the five partitions, with no overlap between the two sets of scores.
Nine of the ten effects are positive. The exception is PubMed × BERTweet at , whose bootstrap interval contains zero. We did not find a cell in which a pretrained backbone clearly harmed the worst client.
The size of the benefit varies with how much room the baseline leaves. On PubMed, the baseline reaches and the best backbone adds . On Sentiment140, the baseline already reaches on a binary task, and the largest gain there is . Perplexity orders the backbones within a task. It does not by itself say how large the gain will be.
4.1.1. The Predictor We Pre-Registered, and the One That Replaced It
We pre-registered a different predictor. Our protocol specified a two-way centered alignment score, which removes backbone quality and corpus difficulty as main effects and keeps only the interaction between them. The threshold was a Spearman correlation of at least at . We measured with . The threshold was not met.
Inspecting the cells showed why. The centered score marks PubMed × RoBERTa as a poor match, because RoBERTa fits news text better than it fits biomedical abstracts. In absolute terms, though, RoBERTa’s per-word perplexity on PubMed is , the second lowest value anywhere in our grid. That cell produced a benefit of , the second largest we measured. Centering had removed the variable that carries the signal.
We then examined the uncentered per-word perplexity, which ordered the cells correctly in all three datasets. This analysis was exploratory, so we treated it as a hypothesis rather than a result. We chose a backbone that had not been run and was not used to build the relationship, DistilBERT on AG News. Its per-word perplexity is , which sits between BERTweet at and PubMedBERT at . We recorded a predicted interval of in the deviation log, and only then ran the five partitions. The measured effect was .
DistilBERT is drawn as an open marker in Figure 2. Adding it gives a four-point ordering on AG News that is monotone in perplexity: , , , at perplexities of , , and . We report the failed pre-registration and the out-of-sample test together because neither is interpretable without the other. To be explicit: the perplexity relationship itself was found by inspecting these same nine cells, and is exploratory. The single held-out test on DistilBERT is a prospective test for that one point (the deviation log records its interval before the runs); it is not a replication of the heuristic.
4.1.2. Perplexity Orders Mean-Client Benefit Equally Well—And a Dispersion Measure That Does Not
Ranking the nine cells by mean-client benefit instead of worst-client benefit gives the identical rank order ( between the two effects). Regressing worst-client effect on mean-client effect and correlating the residual with log perplexity gives (): no worst-client-specific signal survives once general model quality is accounted for (naive ). This correlation alone cannot distinguish perplexity predicting worst-client benefit from perplexity predicting overall model quality, of which the worst client’s score is one consequence.
We tested a genuinely separable quantity: reduction in cross-client dispersion (the mean-minus-minimum gap and the Gini coefficient of client-class macro-F1 across the ten clients) relative to TextCNN, as distinct from the level-based effects above. This is also associated with perplexity: for gap reduction and for Gini reduction (Table A7). We recomputed all four correlations (worst-client, mean-client, gap reduction, Gini reduction) with the same 36-relabeling block-permutation test. Each gives : the observed labeling is the most extreme of the 36 in every case, which is the smallest value this design can produce. Because that floor is , any Holm correction across two or more of these tests cannot fall below ; across the four-metric family, the adjusted value is for every metric, including the worst-client correlation. We therefore do not claim that any of these associations survives multiplicity correction. The one available held-out check, DistilBERT on AG News, is directionally consistent, most cleanly for the Gini measure (RoBERTa , BERTweet , DistilBERT , PubMedBERT ). All four results are exploratory and were found after the grid was run.
4.2. Ditto Forfeits Most of the Benefit
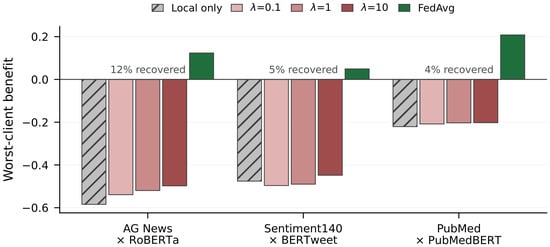
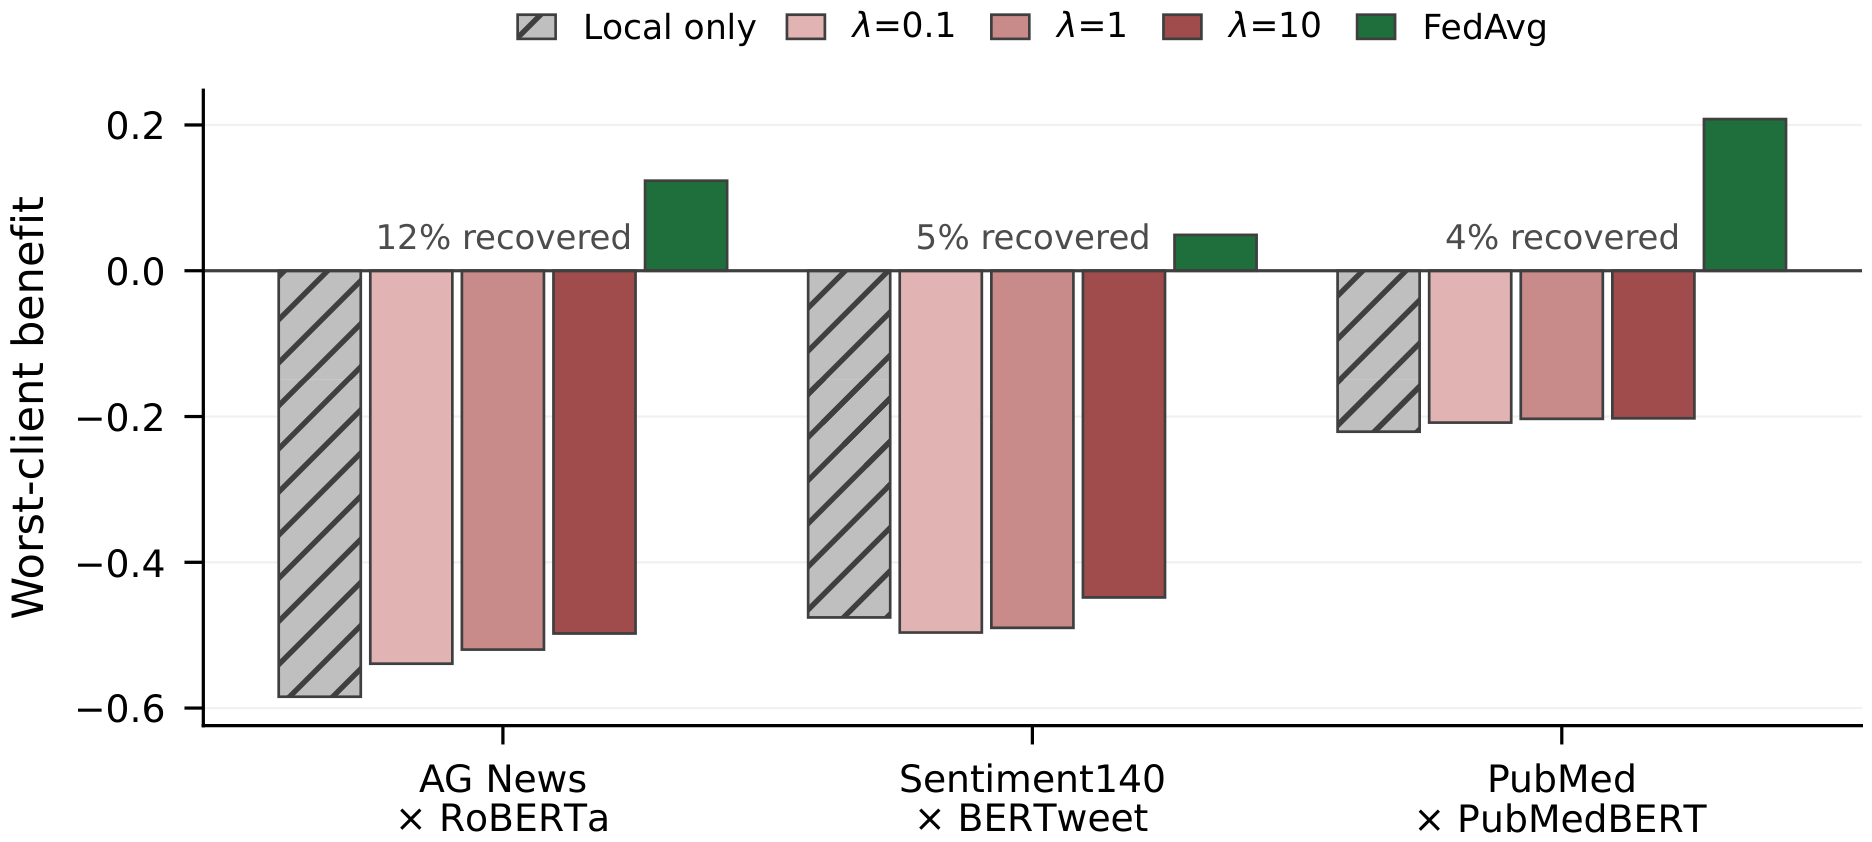
Ditto is designed to improve worst-case client utility. In our setting, it did not close the gap. Table 5 and Figure 3 show what happened in the three domain-matched cells.
Table 5.
Ditto across a hundredfold range of the regularization strength , worst-client effect on P3. Every value sits close to the local-only bound. The final column is the fraction of the local-to-federated gap recovered at the best .
Figure 3.
Ditto across a hundredfold range of the regularization strength , anchored by purely local training and by FedAvg. Every Ditto setting sits close to the local-only bound.
At its default setting, Ditto reaches on AG News, on Sentiment140 and on PubMed. Purely local training, with no aggregation at all, reaches , and in the same cells. Ditto lands within a few hundredths of the local-only bound every time.
We swept the regularization strength over two orders of magnitude, . Larger pulls each personal model harder toward the global one, and it does help, but by very little. On AG News, the benefit moves from to across a hundredfold change. Expressed as a fraction of the distance between local training and FedAvg, the best setting of recovers 12% on AG News, 5% on Sentiment140 and 4% on PubMed.
As grows without bound, the personal model converges to the global one; what the sweep measures is the rate. A hundredfold increase in buys between and across the three cells, while the gap left to close is between and .
One explanation is client data volume, which the sweep measures directly. At , the smallest client holds roughly twenty training examples. A personal model fitted on twenty examples is a poor model, and regularizing it toward a good one does not fix that. We cannot fully separate this explanation from others our design does not isolate, including the specific PEFT configuration and the interaction between local personalization and the global training objective; data volume is the factor our sweep directly measures, not the only one that could contribute.
4.2.1. The Result Depends on the Metric
On P3, the recovered fractions are 12%, 5% and 4%; on P1, which scores each client on its own held-out split, they are 0%, and . The direction is not stable, and even under the metric that should favor a personalized model, Ditto does not consistently beat local training. We report the P3 result because it measures global competence, and give the P1 numbers alongside it.
4.2.2. Other Algorithms Behave Differently
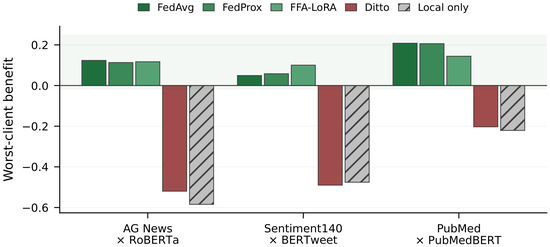
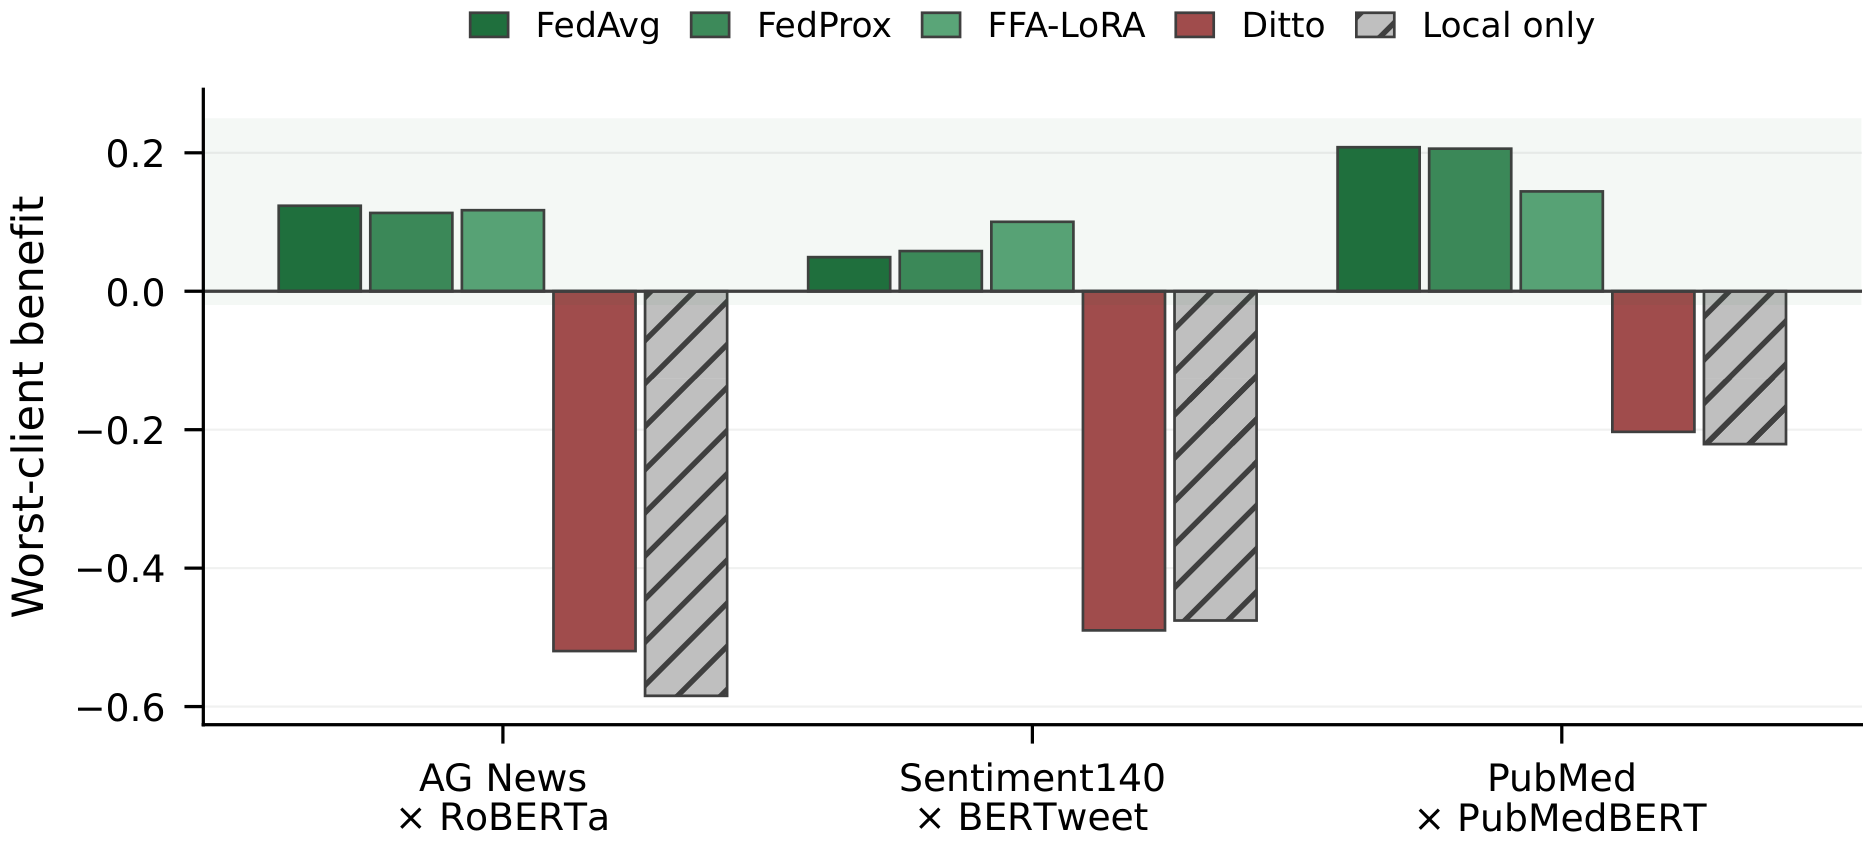
Figure 4 compares five methods in the same three cells. FedAvg, FedProx and FFA-LoRA cluster together and all stay positive: on PubMed, they give , and . Ditto and local-only fall well below zero. Only one personalization method was run, so we draw no general line between methods that keep every client on the shared model and methods that do not: at the tested values and skew, Ditto behaved close to the local-only bound, and whether pFedMe, pFedLoRA or other adapter-personalization methods do the same is unknown.
Figure 4.
Worst-client benefit by aggregation algorithm. The three non-personalized methods cluster above zero; the personalized method collapses onto the local-only bound.
4.3. Aggregation Carries the Benefit
If a pretrained backbone benefits the worst client because its frozen features already separate that client’s classes, then removing aggregation should not destroy the effect. We tested this directly with the local-only condition, in which each client trains alone on its own shard.
The effect is large and negative in all five cells we ran: , , , and . Cliff’s is in every one of them. Table A5 gives the cell identity for each value. Without aggregation, the baseline beat the pretrained model on every single partition. Whatever the backbone contributes, it does not reach the worst client unless the clients train together.
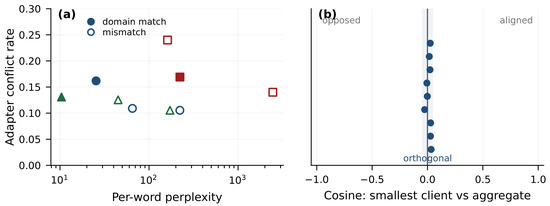
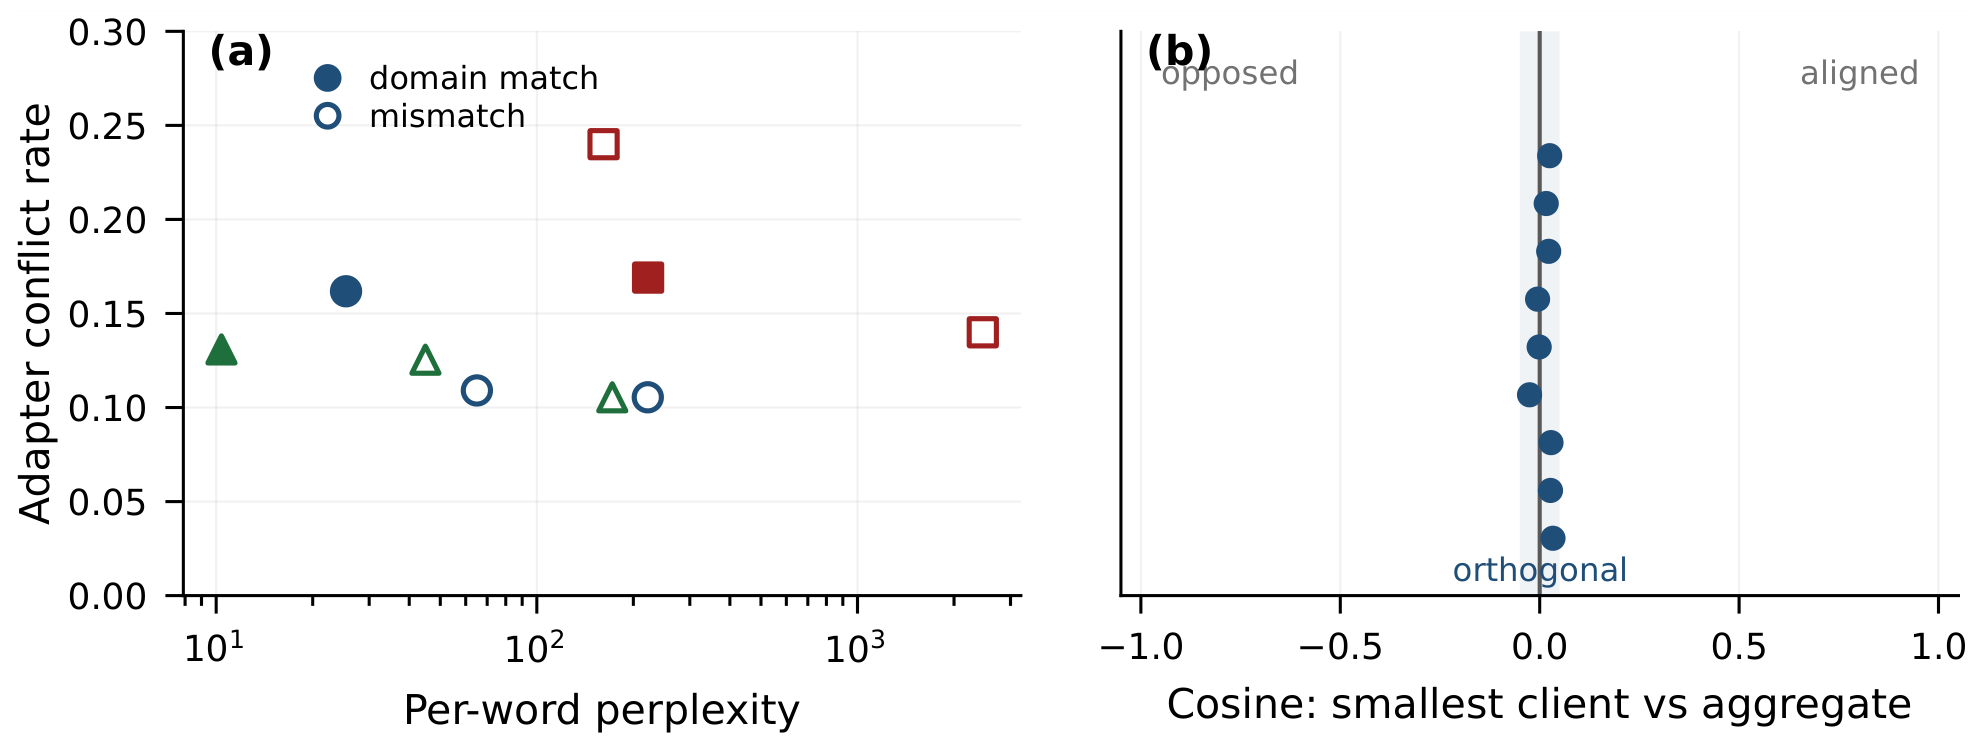
We also measured the geometry of the adapter updates, because our earlier conference version [23] proposed that the worst client suffers when its update conflicts with the aggregate. Figure 5 shows what we found. The cosine between the smallest client’s update and the aggregate update averages over all cells, with a range from to . The two are close to orthogonal. They are not opposed. Conflict rates point the same way. Averaged over the last ten rounds, the domain-matched cells show a conflict rate of and the mismatched cells . An interference account predicts the opposite ordering, since conflict should be worst where the backbone fits the task least. We observed no such trend.
Figure 5.
Adapter-space geometry. (a) Conflict rate shows no trend with domain match. (b) The cosine between the smallest client’s update and the aggregate is near zero in every cell, so the two are close to orthogonal rather than opposed.
Taken together, these two measurements find no evidence for the directional-conflict mechanism examined here.
4.4. Controls and Additional Analyses
4.4.1. Matched Local Computation
Under the main-grid (matched-epoch) condition, the two model classes already receive byte-identical per-client step counts (Table A10; for AG News seed 0, from 1 to 263 steps across the ten clients). Counts differ across clients, not between model classes, because client sizes differ roughly 290:1 at .
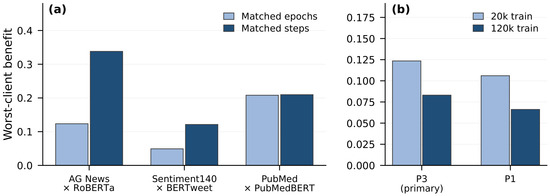
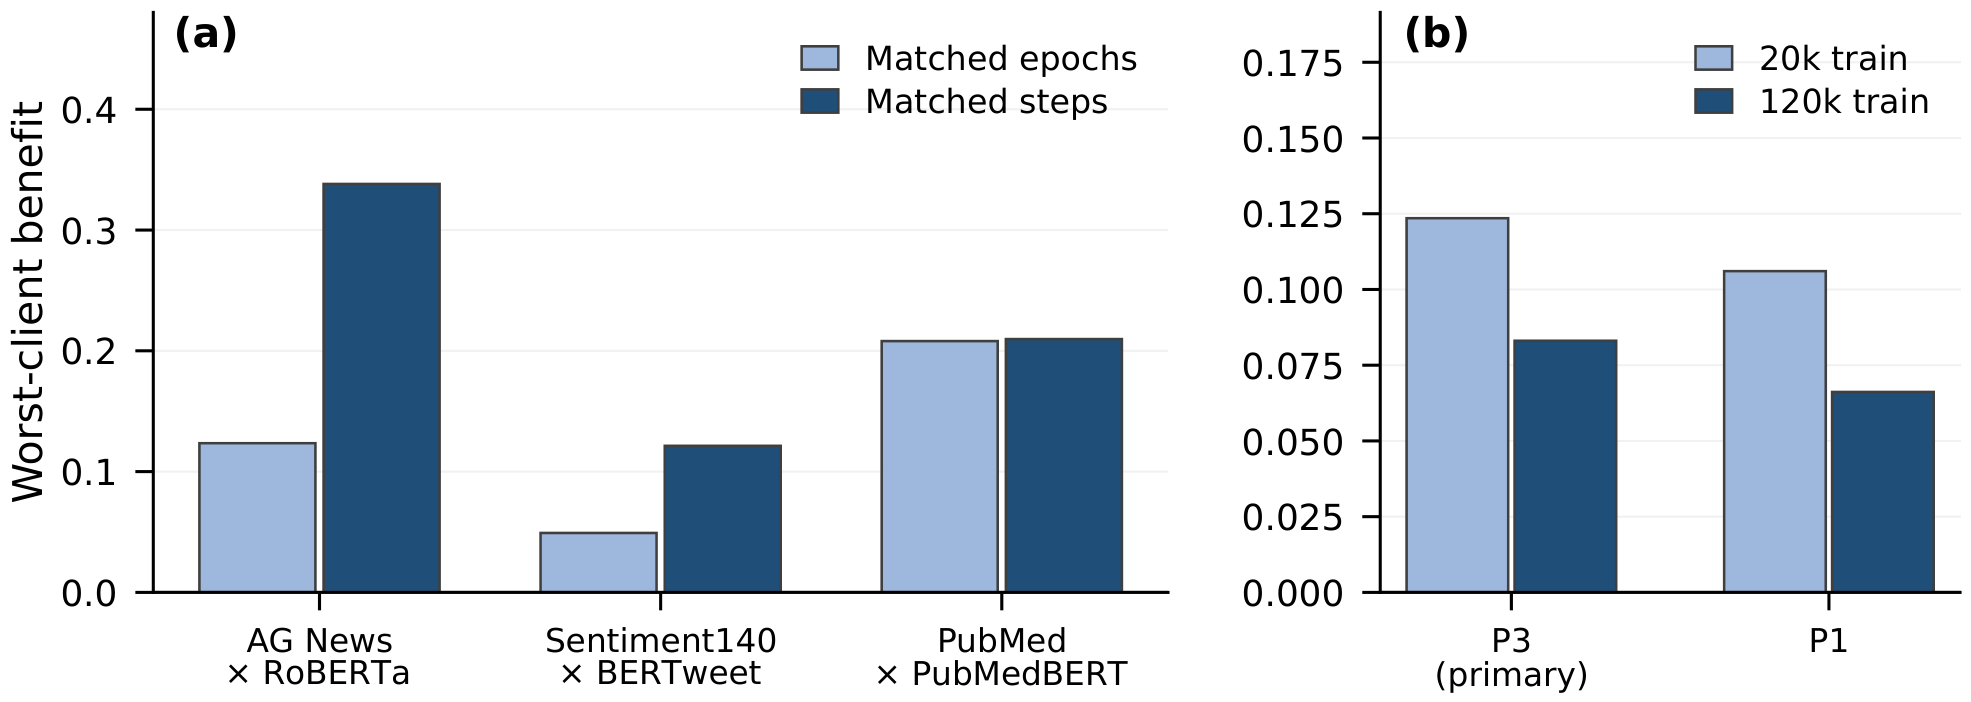
We additionally reran the three domain-matched cells with the number of local gradient steps capped at a fixed target of 60 per round for every client, giving the baseline its own matched-step runs so that the comparison stayed paired. This control only binds on the two largest clients (Table A10: 111 and 263 steps capped down to 60 each, reducing total per-round steps across all ten clients from 504 to 250), and tests whether majority-client local over-optimization was driving the reported effect. Figure 6a shows the outcome. The benefit grows or holds in every cell: against on AG News, against on Sentiment140, and against on PubMed. Under this control on majority-client compute, the advantage is larger, not smaller. Sentiment140, the weakest cell under matched epochs, more than doubles.
Figure 6.
Controls. (a) Under matched local gradient steps, the benefit grows or holds in every cell. (b) With six times more training data per client, the benefit falls to about two thirds of its size on both metrics.
4.4.2. Dataset Scale
Our main-grid subsamples every dataset to 20,000 training examples so that corpus size does not vary with domain. To check that the effect is not an artifact of that choice, we repeated AG News × RoBERTa with the full 120,000 examples. The benefit fell from to on P3 and from to on P1, about two thirds of its original size on both metrics.
The effect survives but shrinks, consistent with a benefit that is largest when the smallest client is most starved of data.
4.4.3. Heterogeneity
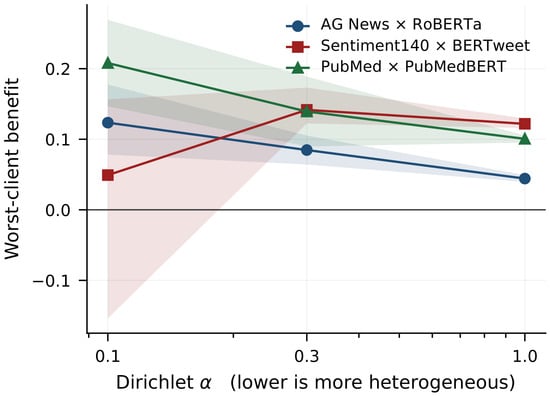
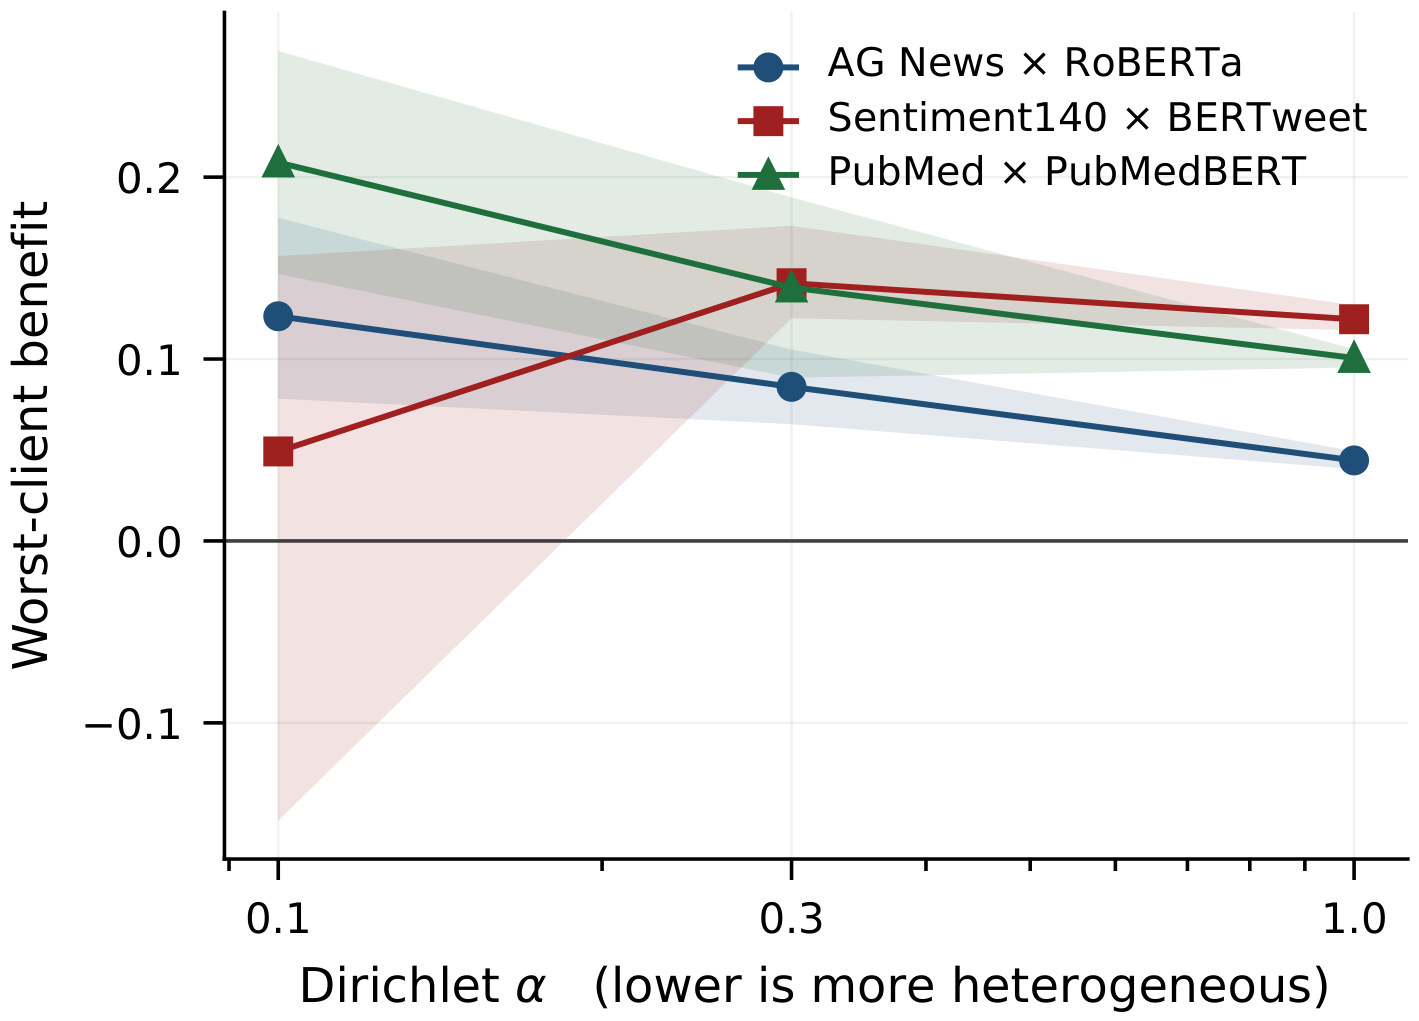
Figure 7 shows the benefit across . AG News moves from to and PubMed from to as falls from to ; Sentiment140 does not follow the pattern ( at , at ). It is a binary task whose baseline already scores , and we suspect limited headroom, which we have not tested.
Figure 7.
Worst-client benefit against the Dirichlet concentration for the three domain-matched cells. Bands are 95% bootstrap intervals over five partitions.
We also checked one cell at instead of , keeping total training examples fixed so each client holds proportionally less data (AG News × RoBERTa, five seeds). The effect grows sharply: against at (). TextCNN’s worst client fails outright, scoring zero worst-client P3 on two of five seeds, while RoBERTa holds between 0.79 and 0.84 across all five. We read this as consistent with the rest of our results: the benefit is largest when the smallest client is most starved of data, and starves it further still.
5. Discussion
5.1. A Practical Selection Heuristic
Section 3.1 states the selection heuristic formally, independent of any specific validation. Here, we report the specific evidence for it obtained in our grid, and illustrate its two general limits numerically.
In our grid, the heuristic recovered the correct ordering of worst-client benefit in every dataset, and it placed a fourth, held-out backbone correctly on a prediction recorded in advance—one out-of-sample check, not a replication (Section 4.1.1). Scoring one backbone took 42.5 s (0.71 min) on the full 1500-text AG News sample on a single Tesla T4 GPU; the heuristic needs no federated training, no labels and no access to client data beyond a text sample.
The two general limits stated in Section 3.1 appear in the results: the gain varies with baseline headroom (Section 4.1), and perplexity identifies the better-fitting candidate, not whether any candidate is good enough to deploy.
The heuristic as described draws its text sample from a pooled corpus, which may be unavailable in privacy-sensitive deployments such as the hospital example above. We therefore scored the three backbones on a single minority client’s own text: with the main protocol’s partitioning (, , seed 0) on AG News, the smallest client holds 36 examples, and scoring only those 36 texts gives the same backbone ranking as the pooled 1500-text sample (RoBERTa < BERTweet < PubMedBERT locally, versus // pooled). This is one illustrative case—one partition, one seed—not a systematic validation; a broader check across seeds and cells is left to future work.
5.2. Ditto Under Extreme Skew
At the tested settings, Ditto stayed close to the local-only bound (Section 4.2). We do not read this as a defect in the method: Ditto trains a personal model and pulls it toward the global one, as designed.
One hypothesis is that personalization needs a client with enough data to personalize on, which is what the sweep measures directly. Beyond that, the comparison supports only a narrow statement: at the tested and one extreme-skew level, Ditto stayed close to the local-only bound on three domain-matched cells, while FedAvg, FedProx and FFA-LoRA stayed positive. Whether pFedMe, pFedLoRA or other adapter-space personalization methods behave like Ditto is unknown, and we draw no general line between methods that keep clients on the shared model and methods that do not.
FFA-LoRA freezes the randomly initialized A matrices and aggregates only B, which removes the A/B-averaging bias of naive FedAvg-style LoRA aggregation (Section 2). It retains a positive worst-client benefit in the three domain-matched cells (Table A3), but it was run on one backbone per dataset, so our data cannot show whether the perplexity ordering of backbones persists under it. Methods that correct the aggregation bias in other ways, such as the server-side residual correction of LoRA-FAIR [33] and the expert allocation of FedLEASE [34], were not evaluated.
The explanation offered for worst-client failure in our earlier conference version [23] is interference: the minority client’s update conflicts with the aggregate and is overwritten. We measured this directly rather than inferring it from outcomes, and it does not support that account. The cosine between the smallest client’s update and the aggregate averages across all cells. The geometry measured in Section 4.3 shows no such conflict. Conflict rates are slightly higher in the well-matched cells than in the mismatched ones, which is the reverse of what interference predicts.
This is compatible with Nguyen et al.’s [1] account of why pretraining helps FedAvg on average (better-aligned client updates), but the smallest client’s update is close to orthogonal to the aggregate, not more aligned with it, so the worst-client benefit here does not appear to operate through that channel. To our knowledge, this distinction between average-case and worst-case benefit has not been reported before.
What remains consistent with both measurements is a weaker and less tidy account. Aggregation supplies the worst client with information it cannot obtain locally, and the backbone governs how efficiently that information can be absorbed. We did not establish this, and we do not claim it. We report it as the hypothesis our evidence leaves standing, and note what would test it: an intervention that varies how much of the aggregate reaches the smallest client, holding the backbone fixed.
6. Limitations and Open Questions
6.1. Number of Clients
The main grid uses ten cross-silo clients. The single check (AG News × RoBERTa) is a floor-limited stress test: TextCNN’s worst client scores exactly on two of five seeds (Section 4.4), so the reported supports only the direction (the effect does not shrink), not its size. Cross-device federations with hundreds or thousands of participants are untested.
6.2. One Adaptation Method
We use LoRA at rank 8 on the query and value projections. Ranks 4 and 16 appear in the appendix at five seeds and give somewhat larger effects than rank 8 ( and against ), consistent in sign and order of magnitude; other PEFT families are untested. FFA-LoRA and the other aggregation algorithms were run on one backbone per dataset, and LoRA-FAIR and FedLEASE were not evaluated.
6.3. Five Seeds
Five partitions per cell is enough for paired comparisons with bootstrap intervals, and it is not enough for a nonparametric test to reach conventional significance. Individual cells with small effects are consequently underpowered: five of our ten cells have bootstrap intervals that contain zero, and six have an unadjusted paired t-test p above . The conclusions we draw rest on the pattern across cells rather than on any single one. The same non-independence affects the rank correlation in Section 4.1: because each of the three backbones and three datasets contributes to three points each, the naive p-value there should be read as descriptive; the block-permutation test reported alongside it is the inferential test for that correlation. Its smallest attainable value is , so it cannot support multiplicity-corrected claims (Section 4.1.2); resolving this needs more backbones and datasets.
6.4. Scope: Model Scale, Language, and Heterogeneity Form
All three grid backbones are base-scale encoders of 110 to 125 M parameters, tested only on English single-label classification under Dirichlet label skew. Decoder-only models, instruction-tuned models, models above one billion parameters, generation and sequence-labeling tasks, multilingual settings, and feature or quantity skew are all untested; morphology in particular may change how much signal fertility carries. The three backbones also differ in tokenizer vocabulary and training recipe, which this design cannot separate from the pretraining corpus, so the association between perplexity and benefit is not attributed to the pretraining domain alone. Each is a cheap check for anyone with the compute, but none is validated here.
6.5. A Pre-Registered Prediction That Failed
Our pre-registered alignment score did not meet its threshold (, ; Section 4.1.1). The replacement predictor was found by exploratory analysis of the same data and has one out-of-sample check, not a replication, so it remains provisional.
6.6. Mechanism
Our measurements are inconsistent with two proposed explanations, as we operationalized them, and we offer a third that we did not test. That third account should be read as a direction for future work rather than as a finding.
6.7. Perplexity Versus General Model Quality
Section 4.1.2 reports this confound directly (worst-client and mean-client effects are rank-identical, ) and a dispersion-based measure that is also associated with perplexity but does not survive multiplicity correction; we do not restate the numbers here.
6.8. Worst-Client Identity Is Not Stable Across Models
A paired difference of each model’s own worst client can compare different clients within the same partition. Across the 45 (cell, seed) comparisons, the two models agree on which client is worst in of cases (; Table A8); five of the nine disagreements, all on binary Sentiment140, arise because P3 depends only on which classes a client holds, so clients with identical class subsets tie exactly and an arg-min picks one arbitrarily. Recomputing the effect for a fixed reference identity (the class-group that was TextCNN’s worst) gives (), and averaging over the tied group gives the same value. We keep the own-model minimum as primary because it is standard practice and the operationally relevant question, but we do not treat the headline correlation as robust to the fixed-identity convention.
6.9. Confirmatory Versus Exploratory Findings
We separate three classes of result. Pre-registered analyses were fixed in the frozen protocol before the reported grid was run: the alignment-score test of H1, which failed (Section 4.1.1), and the adapter-update geometry measurements specified in the protocol (Section 4.3). Protocol amendments are changes to that protocol which the deviation log dates to 2026-07-29 and records as made before the reported grid was run: the change of primary endpoint from P1 to P3, the choice of grid backbones, and the reduction in scope (rounds, sweep) behind the configuration in Table 3. The training-subsample size of 20,000 appears in Appendix C but has no separate dated log entry. The public repository is a single snapshot committed on 14 August 2026, so these dates are recorded by us and are not independently timestamped, and the result log begins with four unreported pilot records (Appendix C); we therefore do not call any result that depends on P3 or on Table 3 confirmatory. Post-protocol analyses are exploratory: the uncentered perplexity predictor (with its one prospective held-out check on DistilBERT), the block-permutation and standard pseudo-log-likelihood checks, the dispersion result, the worst-client-identity audit and the local-client privacy check. The headline associations in this paper are therefore exploratory or rest on amended settings.
7. Conclusions
We asked which design choices are associated with better outcomes for the worst-off client when a federation fine-tunes a pretrained model with parameter-efficient methods. Across a nine-cell grid of backbones and datasets, with five partitions per cell and a task-specific baseline trained on the identical partition, three answers emerged.
The choice of backbone is associated with worst-client outcomes, and the association can be checked before training starts. Per-word perplexity on the task text ordered the backbones by worst-client benefit in all three datasets (rank correlation across nine cells; block-permutation ), and a held-out fourth backbone fell inside the interval we recorded in advance—one out-of-sample check, not a validated rule. The same ordering holds for mean-client accuracy, so this correlation alone does not isolate a worst-client-specific effect; a dispersion-based measure (the cross-client Gini coefficient) is also associated with perplexity, though no result in this family survives multiplicity correction. Producing the score needs no federated training.
Ditto, at the settings tested here, recovered between 4 and 12 percent of the distance between purely local training and FedAvg, and a hundredfold change in its regularization strength moved that by to . At our most extreme skew, the smallest client holds around twenty examples. We have not evaluated other personalization families under this skew and do not extend the finding to them.
The benefit depends on aggregation: with aggregation removed, the task-specific baseline beat the pretrained model on every partition in every cell we tested. The smallest client’s update is close to orthogonal to the aggregate, not opposed to it, which is inconsistent with a directional-conflict mechanism as we operationalized it.
Beyond these three findings, three design choices were necessary to obtain them and are offered as principles for related studies. First, per-client evaluation must be scored against the shared global test set rather than a client’s own held-out split, since the latter is degenerate under extreme label skew—a constant predictor achieves a perfect score once a client holds a single class (Section 3.4). Second, matching backbone capacity isolates pretraining domain from model size, but not from tokenizer or training-recipe differences, which should be reported as a residual confound rather than assumed away (Section 3.2). Third, a pre-registered analysis plan is only informative if a failed prediction is reported alongside a successful one: our own alignment-score predictor did not meet its pre-registered threshold, and reporting that failure explicitly, rather than silently replacing it, is what makes the subsequent exploratory finding interpretable rather than a post hoc story (Section 4.1.1).
For a practitioner, the recommendation is correspondingly cautious. Measuring per-word perplexity on a sample of your task text is one evidence-based signal for choosing among backbones, though we treat it as provisional rather than settled. We would not rely on Ditto when your smallest participant has very little data; other personalization methods are untested. Report the worst client and the tenth percentile, not only the mean, because the mean cannot distinguish a federation that serves everyone from one that leaves a participant behind.
Our alignment result rests on one out-of-sample test rather than a replication, so we treat the heuristic as provisional. Checking it on larger backbones, on generation tasks and on languages other than English would settle how far it carries. The code, the run manifest, the committed predictions and the full result log are released so that this is straightforward to do.
Author Contributions
Conceptualization, K.N.; methodology, K.N., S.A. and U.S.; software, K.N. and S.A.; validation, M.A. and H.M.; formal analysis, K.N. and U.S.; investigation, S.A. and U.S.; data curation, K.N. and S.A.; writing—original draft preparation, K.N., S.A., U.S. and M.A.; writing—review and editing, H.M. and M.A.; visualization, K.N. and U.S.; resources, H.M. and M.A.; supervision, M.A.; project administration, M.A.; funding acquisition, M.A. All authors have read and agreed to the published version of the manuscript.
Funding
This research received no external funding.
Data Availability Statement
The code, the run manifest, the committed alignment table with its per-cell predictions, the protocol deviation log, and the complete per-round result log are available at https://github.com/KiranNaseer-AI/fedalign, accessed on 28 September 2026
Acknowledgments
The researchers would like to thank the Deanship of Graduate Studies and Scientific Research at Qassim University (https://www.qu.edu.sa) for financial support (QU-APC-2026).
Conflicts of Interest
The authors declare no conflict of interest.
Appendix A. Full Results
Table A1 gives the worst-client effect for all nine grid cells under each of the three per-client metrics defined in Section 3.4. The main text reports P3; the other two are provided so that any comparison can be recomputed under a different endpoint. Under the non-personalized algorithms, every client holds the same global model, so the minimum of P2 across clients equals the global balanced accuracy of that model. P2 therefore measures global competence rather than dispersion, and it varies across clients only under Ditto and local-only training.
Table A1.
Worst-client effect against the TextCNN baseline at under all three per-client metrics. Five partitions per cell, paired differences.
Across the same nine cells, the rank correlation between log per-word perplexity and the paired benefit under P10 is (), consistent with the primary result under the minimum (). Table A2 reports the per-cell values.
Table A2.
Worst-client benefit under the tenth percentile (P10) of client-class macro-F1, same nine grid cells and dataset ordering as Table 4. Paired difference against TextCNN, , five seeds.
Table A3 reports every aggregation algorithm on the three domain-matched cells, and Table A4 gives the effect across the Dirichlet concentration.
Table A3.
Worst-client effect (P3) by aggregation algorithm on the three domain-matched cells, , five partitions each.
Table A4.
Worst-client effect (P3) across the Dirichlet concentration.
Table A5 gives the local-only condition for all five cells tested in Section 4, including the two off-diagonal cells not covered by Table A3.
Table A5.
Worst-client effect (P3) with aggregation removed, all five cells tested. Local-only training against the identical partition, five seeds.
Table A6 compares backbone perplexity under the literature-standard pseudo-log-likelihood method against the random-mask method used in the main text (Section 4.1).
Table A6.
Backbone perplexity under the literature-standard pseudo-log-likelihood method (Salazar et al., 2020 [31]—every non-special token masked individually and scored on its own forward pass) against the random-mask method used in the main text (Section 3.5), same 1500-text samples. Within-dataset ranking is identical under both methods in all three datasets.
Table A7 gives the cross-client dispersion (gap and Gini) reduction results reported in Section 4.1.2.
Table A7.
Reduction in cross-client dispersion relative to TextCNN (max–min gap and Gini coefficient of client-class macro-F1 across the ten clients), the nine grid cells at . Unlike the worst-client and mean-client effects (Table 4), which are rank-identical across cells (), these dispersion measures are also associated with perplexity (gap reduction , Gini reduction ). Each has block-permutation , which does not survive Holm correction across the four-metric family (adjusted ; Section 4.1.2).
Table A8.
Worst-client identity sensitivity, main grid at (45 cell-seed comparisons). “Fixed-identity” recomputes the effect using the class-group that was TextCNN’s worst, rather than each model’s own arg-min; “group-averaged” gives the identical result, confirming the sensitivity is not a tie-breaking artifact.
Appendix B. Ablations and Controls
Table A9 collects the remaining conditions. The number of partitions is given on every row, because they differ. Conditions with fewer than five partitions are directional and support no claim in the main text; we report them so that a reader can see what was run rather than only what was conclusive.
Table A9.
Ablations and controls. Conditions with fewer than five partitions are directional and are not used to support any claim in the main text. The main-grid reference for AG News × RoBERTa is given in the final row; the references for the other two matched-gradient-step cells are the FedAvg values in Table A3.
Two condition types need comment. The matched-gradient-step rows and the full-size row each use their own baseline, trained under the same condition, so the comparison stays paired. Without that, matching compute for the foundation model alone would reintroduce the confound the control exists to remove.
Table A10 gives the exact per-client optimizer step counts under both the matched-epoch and matched-gradient-step conditions for AG News × RoBERTa, seed 0, referenced in Section 4.4.
Table A10.
Per-client optimizer steps per round, AG News × RoBERTa, seed 0, under the matched-epoch main-grid condition versus the matched-gradient-step control (target ). Steps are byte-identical between RoBERTa and TextCNN under matched-epochs at every client (verified directly); the matched-step control caps only the two largest clients, reducing total per-round steps across all ten clients from 504 to 250.
Table A11 reports the client-count check.
Table A11.
Client-count check, paired against the matched-baseline design used throughout this paper.
Appendix C. Protocol Deviations
The protocol was frozen on 29 July 2026; the file-creation times in our project storage are 10:00 UTC for the a priori alignment table and 10:03 UTC for the deviation log. Every departure since is recorded with its date and justification in the deviation log released with the code. The log dates the change of grid backbones, the change of primary endpoint from P1 to P3 and the reduction in scope to 29 July 2026 and records them as made before the reported grid was run. Three limits apply to this record. The public repository is a single snapshot committed on 14 August 2026, so the dates are recorded by us and are not independently timestamped there. We have no independent timestamp for the start of the reported grid. And the result log begins with four records that are not reported: two timing benchmarks (seed 99, 4 rounds) and two TextCNN runs at the superseded 40-round setting, 0.26 compute-hours in total, all excluded by run identifier. The substantive entries are:
- The grid backbones were changed to a matched-capacity set before the reported grid was run, so that pretraining domain would not be confounded with model size. DistilBERT moved to a held-out role.
- The alignment score was changed from a two-way centered quantity to uncentered per-word perplexity after the pre-registered threshold was not met. The out-of-sample prediction described in Section 4.1.1 was recorded in the deviation log before the corresponding runs executed.
- The primary endpoint was changed from P1 to P3 for the reason given in Section 3.4. All three metrics were logged from the first run, so no experiment was repeated because of this change.
- Analysis excludes result records whose run identifier is absent from the final manifest. These are benchmark runs and runs from a superseded configuration. They were excluded by provenance, not by inspection of their values.
- The per-dataset training subsample was set to 20,000 examples for the main grid, rather than the 120,000-example Sentiment140 target in the frozen protocol. The full-scale condition was retained as a single appendix control (Table A9, “120 k training examples”) rather than the main-grid design.
- Communication rounds were set to 30, uniform across . The frozen protocol document specifies 60 rounds; the code default, and the two superseded TextCNN runs above, used 40; every reported run used 30.
- The Dirichlet sweep was reduced from on five cells to on the three domain-matched cells (Table A4), for the same reason.
- Two condition blocks were canceled when measured compute exceeded the available budget: the Phase-2 method candidates (ours_a/b/c) and the 10-seed method-vs-Ditto endpoint. Neither is reported in this paper.
- The baseline and the LoRA rank 4/16 conditions were completed to five seeds after initial submission preparation, closing gaps flagged during internal review. The check shows the backbone effect strengthening at higher client count ( vs at ); rank 4/16 give effects of similar order to rank 8. Full values are in Table A9 and Table A11. No claim in the main text was altered.
- The deviation log records three out-of-sample predictions, each recorded before the corresponding runs. Only the first (the DistilBERT interval) is evaluated in this paper. The second, that the within-dataset perplexity ordering holds under other aggregation algorithms, cannot be evaluated because Ditto, FedProx and FFA-LoRA were run on one backbone per dataset. The third, a larger effect at , cannot be evaluated because no runs were completed.
Appendix D. Computational Details
All experiments ran on a single NVIDIA Tesla T4. A foundation-model run of 30 rounds with ten clients on 20,000 training examples records a mean of 0.55 GPU-h of round time in the result log (53 main-grid runs; range 0.29–0.64, DistilBERT the fastest); the TextCNN baseline records about 0.03. The 313 reported runs record 177 GPU-h in total. The complete study is 313 runs with no failures.
Every run is a row in a manifest keyed by a hash of its full configuration, which makes duplicate work impossible and lets an interrupted session resume from a per-round checkpoint. Results are appended to a single log as one record per evaluated round, never overwritten. We release the code, the manifest, the committed alignment table, the deviation log and the complete result log, together with the scripts that regenerate every table and figure in this paper directly from that log.
References
- Nguyen, J.; Wang, J.; Malik, K.; Sanjabi, M.; Rabbat, M. Where to Begin? On the Impact of Pre-Training and Initialization in Federated Learning. In Proceedings of the International Conference on Learning Representations (ICLR), Kigali, Rwanda, 1–5 May 2023. [Google Scholar]
- Li, T.; Hu, S.; Beirami, A.; Smith, V. Ditto: Fair and Robust Federated Learning Through Personalization. In Proceedings of the 38th International Conference on Machine Learning, virtual, 18–24 July 2021; Volume 139, pp. 6357–6368. [Google Scholar]
- McMahan, B.; Moore, E.; Ramage, D.; Hampson, S.; Agüera Y Arcas, B. Communication-Efficient Learning of Deep Networks from Decentralized Data. In Proceedings of the 20th International Conference on Artificial Intelligence and Statistics (AISTATS), Fort Lauderdale, FL, USA, 20–22 April 2017; pp. 1273–1282. [Google Scholar]
- Li, T.; Sahu, A.K.; Zaheer, M.; Sanjabi, M.; Talwalkar, A.; Smith, V. Federated Optimization in Heterogeneous Networks. Proc. Proc. Mach. Learn. Syst. (MLSys) 2020, 2, 429–450. [Google Scholar]
- Karimireddy, S.P.; Kale, S.; Mohri, M.; Reddi, S.J.; Stich, S.U.; Suresh, A.T. SCAFFOLD: Stochastic Controlled Averaging for Federated Learning. In Proceedings of the 37th International Conference on Machine Learning (ICML), online, 13–18 July 2020; pp. 5132–5143. [Google Scholar]
- Hsu, T.M.H.; Qi, H.; Brown, M. Measuring the Effects of Non-Identical Data Distribution for Federated Visual Classification. arXiv 2019, arXiv:1909.06335. [Google Scholar]
- Jimenez Gutierrez, D.M.; Solans, D.; Heikkilä, M.A.; Vitaletti, A.; Kourtellis, N.; Anagnostopoulos, A.; Chatzigiannakis, I. Non-IID Data in Federated Learning: A Survey with Taxonomy, Metrics, Methods, Frameworks and Future Directions. arXiv 2024, arXiv:2411.12377. [Google Scholar]
- Hu, E.J.; Shen, Y.; Wallis, P.; Allen-Zhu, Z.; Li, Y.; Wang, S.; Wang, L.; Chen, W. LoRA: Low-Rank Adaptation of Large Language Models. In Proceedings of the International Conference on Learning Representations (ICLR), virtual, 25–29 April 2022. [Google Scholar]
- Sun, Y.; Li, Z.; Li, Y.; Ding, B. Improving LoRA in Privacy-preserving Federated Learning. In Proceedings of the International Conference on Learning Representations (ICLR), Vienna, Austria, 7–11 May 2024. [Google Scholar]
- Guo, P.; Zeng, S.; Wang, Y.; Fan, H.; Wang, F.; Qu, L. Selective Aggregation for Low-Rank Adaptation in Federated Learning. In Proceedings of the International Conference on Learning Representations (ICLR), Singapore, 24–28 April 2025. [Google Scholar]
- Wang, Z.; Shen, Z.; He, Y.; Sun, G.; Wang, H.; Lyu, L.; Li, A. FLoRA: Federated Fine-Tuning Large Language Models with Heterogeneous Low-Rank Adaptations. In Proceedings of the Advances in Neural Information Processing Systems 37 (NeurIPS 2024), Vancouver, BC, Canada, 10–15 December 2024; Volume 37, pp. 22513–22533. [Google Scholar]
- Cho, Y.J.; Liu, L.; Xu, Z.; Fahrezi, A.; Joshi, G. Heterogeneous LoRA for Federated Fine-tuning of On-Device Foundation Models. In Proceedings of the 2024 Conference on Empirical Methods in Natural Language Processing (EMNLP), Miami, FL, USA, 12–16 November 2024; pp. 12903–12913. [Google Scholar]
- Bai, J.; Chen, D.; Qian, B.; Yao, L.; Li, Y. Federated Fine-tuning of Large Language Models under Heterogeneous Tasks and Client Resources. In Proceedings of the Advances in Neural Information Processing Systems (NeurIPS), Vancouver, BC, Canada, 10–15 December 2024. [Google Scholar]
- Zhang, J.; Vahidian, S.; Kuo, M.; Li, C.; Zhang, R.; Yu, T.; Wang, G.; Chen, Y. Towards Building the Federated GPT: Federated Instruction Tuning. In Proceedings of the IEEE International Conference on Acoustics, Speech and Signal Processing (ICASSP), Seoul, Republic of Korea, 14–19 April 2024; pp. 6915–6919. [Google Scholar]
- Yang, Y.; Long, G.; Lu, Q.; Zhu, L.; Jiang, J.; Zhang, C. Federated Low-Rank Adaptation for Foundation Models: A Survey. In Proceedings of the Thirty-Fourth International Joint Conference on Artificial Intelligence (IJCAI), Survey Track, Montreal, QC, Canada, 19–22 August 2025; pp. 10779–10787. [Google Scholar]
- Mohri, M.; Sivek, G.; Suresh, A.T. Agnostic Federated Learning. In Proceedings of the 36th International Conference on Machine Learning (ICML 2019), Long Beach, CA, USA, 9–15 June 2019; pp. 4615–4625. [Google Scholar]
- Li, T.; Sanjabi, M.; Beirami, A.; Smith, V. Fair Resource Allocation in Federated Learning. In Proceedings of the International Conference on Learning Representations (ICLR), Addis Ababa, Ethiopia, 26 April–1 May 2020. [Google Scholar]
- Fallah, A.; Mokhtari, A.; Ozdaglar, A. Personalized Federated Learning with Theoretical Guarantees: A Model-Agnostic Meta-Learning Approach. Proc. Adv. Neural Inf. Process. Syst. (NeurIPS) 2020, 33, 3557–3568. [Google Scholar]
- T. Dinh, C.; Tran, N.H.; Nguyen, T.D. Personalized Federated Learning with Moreau Envelopes. In Proceedings of the Advances in Neural Information Processing Systems 33 (NeurIPS 2020), virtual, 6–12 December 2020; Volume 33, pp. 21394–21405. [Google Scholar]
- Yi, L.; Yu, H.; Wang, G.; Liu, X.; Li, X. PFedLoRA: Model-Heterogeneous Personalized Federated Learning with LoRA Tuning. arXiv 2023, arXiv:2310.13283. [Google Scholar]
- Salazar, T.; Araújo, H.; Cano, A.; Abreu, P.H. A Survey on Group Fairness in Federated Learning: Challenges, Taxonomy of Solutions and Directions for Future Research. Artif. Intell. Rev. 2026, 59, 81. [Google Scholar] [CrossRef] [Scilit]
- Heilmann, X.; Corbucci, L.; Cerrato, M. A Benchmark for Client-level Fairness in Federated Learning. In Proceedings of the Fourth European Workshop on Algorithmic Fairness (EWAF’25), Eindhoven, The Netherlands, 30 June–2 July 2025; Volume 294, pp. 434–438. [Google Scholar]
- Naseer, K.; Shoaib, U. When More Parameters Hurt: Foundation Model Priors Amplify Worst-Client Disparity Under Extreme Federated Heterogeneity. arXiv 2026, arXiv:2605.08992. [Google Scholar]
- Liu, Y.; Ott, M.; Goyal, N.; Du, J.; Joshi, M.; Chen, D.; Levy, O.; Lewis, M.; Zettlemoyer, L.; Stoyanov, V. RoBERTa: A Robustly Optimized BERT Pretraining Approach. arXiv 2019, arXiv:1907.11692. [Google Scholar]
- Nguyen, D.Q.; Vu, T.; Nguyen, A.T. BERTweet: A pre-trained language model for English Tweets. In Proceedings of the 2020 Conference on Empirical Methods in Natural Language Processing: System Demonstrations, virtual, 16–20 November 2020; pp. 9–14. [Google Scholar] [CrossRef] [Scilit]
- Gu, Y.; Tinn, R.; Cheng, H.; Lucas, M.; Usuyama, N.; Liu, X.; Naumann, T.; Gao, J.; Poon, H. Domain-Specific Language Model Pretraining for Biomedical Natural Language Processing. ACM Trans. Comput. Healthc. 2021, 3, 1–23. [Google Scholar] [CrossRef] [Scilit]
- Kim, Y. Convolutional Neural Networks for Sentence Classification. In Proceedings of the 2014 Conference on Empirical Methods in Natural Language Processing (EMNLP), Doha, Qatar, 25–29 October 2014; pp. 1746–1751. [Google Scholar]
- Zhang, X.; Zhao, J.; LeCun, Y. Character-level Convolutional Networks for Text Classification. In Proceedings of the 28th International Conference on Advances in Neural Information Processing Systems (NeurIPS 2015), Montreal, QC, Canada, 7–12 December 2015; Volume 28, pp. 649–657. [Google Scholar]
- Go, A.; Bhayani, R.; Huang, L. Twitter Sentiment Classification using Distant Supervision; Technical Report; CS224N Project Report; Stanford University: Stanford, CA, USA, 2009. [Google Scholar]
- Dernoncourt, F.; Lee, J.Y. PubMed 200k RCT: A Dataset for Sequential Sentence Classification in Medical Abstracts. In Proceedings of the Eighth International Joint Conference on Natural Language Processing (IJCNLP), Taipei, Taiwan, 27 November–1 December 2017; pp. 308–313. [Google Scholar]
- Salazar, J.; Liang, D.; Nguyen, T.Q.; Kirchhoff, K. Masked Language Model Scoring. In Proceedings of the 58th Annual Meeting of the Association for Computational Linguistics (ACL), Taipei, Taiwan, 27 November–1 December 2020; pp. 2699–2712. [Google Scholar]
- Rust, P.; Pfeiffer, J.; Vulić, I.; Ruder, S.; Gurevych, I. How Good is Your Tokenizer? On the Monolingual Performance of Multilingual Language Models. In Proceedings of the 59th Annual Meeting of the Association for Computational Linguistics (ACL), virtual, 1–6 August 2021; pp. 3118–3135. [Google Scholar]
- Bian, J.; Wang, L.; Zhang, L.; Xu, J. LoRA-FAIR: Federated LoRA Fine-Tuning with Aggregation and Initialization Refinement. In Proceedings of the IEEE/CVF International Conference on Computer Vision (ICCV), Honolulu, HI, USA, 19–20 October 2025; pp. 3737–3746. [Google Scholar]
- Wang, L.; Bian, J.; Zhang, L.; Xu, J. Adaptive LoRA Experts Allocation and Selection for Federated Fine-Tuning. In Proceedings of the Advances in Neural Information Processing Systems 38 Main Conference (NeurIPS 2025), San Diego, CA, USA, 2–7 December 2025; Volume 38. [Google Scholar]

Disclaimer/Publisher’s Note: The statements, opinions and data contained in all publications are solely those of the individual author(s) and contributor(s) and not of MDPI and/or the editor(s). MDPI and/or the editor(s) disclaim responsibility for any injury to people or property resulting from any ideas, methods, instructions or products referred to in the content. |
© 2026 by the authors. Licensee MDPI, Basel, Switzerland. This article is an open access article distributed under the terms and conditions of the Creative Commons Attribution (CC BY) license.