


Abstract
Fine motor function of the hands underpins a wide range of daily and occupational activities, and providing technology that supports such activities simply in everyday life is an important application of wearable computing. With the aim of improving manual dexterity, this study explored the potential of a method that delivers low-pulse-rate repetitive tactile stimulation from a wrist-worn device immediately before a task requiring manual dexterity. After 32 participants completed an unstimulated pegboard task twice, ON/OFF pulse stimulation at either 3 pulses/10 s or 11 pulses/10 s was delivered for two minutes, followed immediately by an unstimulated pegboard task. Among all participants, the post-stimulation shortening in completion time did not significantly exceed the shortening associated with pre-intervention task repetition, and no intervention effect specific to tactile stimulation was confirmed. In contrast, in an exploratory subgroup analysis of 12 participants for whom no shortening in completion time was observed across the two pre-intervention task repetitions, a shortening in completion time was observed after stimulation. However, because no sham-stimulation control condition was included, the change in this subgroup cannot be causally attributed to tactile stimulation. This study provides a hypothesis-generating observation in a small sample and preliminary information for considering short wrist tactile pulses as a candidate for a low-burden pre-task intervention. In the future, this study will contribute to the design of wearable computers that support manual work briefly using wrist-worn devices suitable for everyday use.
1. Introduction
Manual dexterity underpins a wide range of daily and occupational activities. In this paper, manual dexterity refers to the ability to perform fine, coordinated movements of the fingers under precise neuromuscular control. For example, actions such as pinching an object, placing a component, writing, and operating a device are all supported by manual dexterity. Manual dexterity is an important assessment target not only for activities of daily living and work efficiency but also in rehabilitation, occupational therapy, occupational medicine, and neuropsychology [1,2,3]. Therefore, technology that supports the execution of manual tasks is an important application of wearable computing.
Repetitive sensory stimulation has been investigated as a means of improving sensorimotor functions, including manual dexterity. For example, repetitive tactile stimulation applied to the fingers affects performance on manual dexterity tasks and corticospinal excitability (the responsiveness of the output pathway for voluntary movement) [4]. Repetitive electrical stimulation applied to the fingers likewise affects performance on manual dexterity tasks [5,6]. These studies have shown that somatosensory stimulation, such as tactile stimulation, can alter the state of the sensorimotor system and thereby influence subsequent motor execution.
While these studies provide important evidence that sensory stimulation can influence motor function, the effectiveness and feasibility of simple, low-burden interventions delivered by information devices available in everyday life have received little examination. This may be because much of the existing research has focused on elucidating mechanisms rather than on means usable in everyday life. For example, some studies have investigated effects on manual dexterity using a dedicated device capable of applying stimulation using 24 pins to the finger pad as a 20-min pre-task intervention [4], or have presented subthreshold vibratory noise stimulation, set to each individual’s sensory threshold, to the wrist [7,8]. However, these approaches retain design challenges in terms of the dedicated stimulation apparatus, the long intervention time, the possibility that the stimulation site interferes with the task, and the need to measure each individual’s sensory threshold and adjust the stimulation intensity.
In contrast, wearable devices have recently become widely adopted as a means of presenting notifications and feedback, and tactile stimulation at the wrist in particular has been used as a means of intervening without substantially disrupting the user’s ongoing activity. In the contexts of Human–Computer Interaction (HCI) and wearable computing, it has been shown that low-burden interventions that require neither explicit operation nor strong attention can influence users’ behavior, affect, cognition, and experience. Examples include manipulating subjective elapsed time [9], reducing anxiety and improving performance on cognitive tasks [10], enhancing attention [11], and regulating heart-rate rhythm [12]. These studies indicate that tactile stimulation at the wrist is not merely a means of notification but is promising as an intervention that changes users’ perception and behavior.
In this study we exploratorily examine how short, repetitive tactile stimulation presented from a wrist-worn device affects the completion time of a subsequent manual dexterity task. We implemented a prototype system and evaluated it with a pegboard task involving 32 participants. In the evaluation, we also examine whether the effect is modulated by the stimulation rate condition. In addition, beyond examining the effect across all participants, we supplementarily examine the effect in the subgroup of participants who showed little improvement from task repetition. This subgroup analysis is supplementary and exploratory, and the results of this study are not interpreted as confirmation of the causal efficacy of tactile stimulation.
2. Related Work
2.1. Effects of Tactile Stimulation of the Fingers or Wrist on Manual Dexterity
The effects of finger stimulation on manual dexterity have been investigated. Kojima et al. delivered 20 min of mechanical tactile stimulation using a dedicated device with 24 pins on the pad of the index finger and subsequently evaluated corticospinal excitability and pegboard task completion time [4]. In that study, increased corticospinal excitability and shorter pegboard task completion times were observed after stimulation in which pin arrays were sequentially moved laterally, whereas no significant change in pegboard task completion time was observed for a pattern that simultaneously stimulated the entire finger pad. These results indicate that mechanical tactile stimulation of the finger pad may be associated with subsequent manual motor performance and that the effects may differ according to the stimulation pattern.
The effects of tactile stimulation of the wrist have also been investigated. Subthreshold vibratory noise delivered to the wrist during task performance improved performance on a manual dexterity task [7,8]. In these studies, stimulation intensity was set to 60% of the sensory threshold. In a study of children with developmental coordination disorder, manual dexterity performance during stimulation was higher than that at baseline and after stimulation was discontinued, whereas no improvement was confirmed after stimulation ceased [8]. Although this method indicates that wrist vibration may be associated with manual dexterity, it requires measurement of each participant’s perceptual threshold, and stimulation is delivered during task performance. Macerollo et al. delivered 30 s of high-frequency peripheral vibration to the wrist and improved performance on motor tasks, including a pegboard task [13]. This study also showed, using EEG, a reduction in 15–30 Hz beta-band activity over the contralateral sensorimotor cortex.
The effects of repetitive electrical or sensory stimulation of the fingers on tactile function and manual dexterity have also been examined. Repetitive electrical stimulation of the fingers improved performance on a pegboard task [5]. Kowalewski et al. also reported improved tactile spatial resolution and manual dexterity after repetitive sensory stimulation of the fingers [6]. These studies provide precedents indicating that peripheral sensory input that does not directly require active motor training may affect sensorimotor function.
Rehabilitation-oriented research has used TheraBracelet, which delivers subthreshold random-frequency vibration to the paretic wrist, during hand-use task practice in 12 individuals with chronic stroke and improved their performance [14]. In a secondary analysis of the TheraBracelet trial, Pennington et al. examined six individuals with stroke in each of the active-stimulation and control groups and reported that improvement in the active-stimulation group was more pronounced for grasping movements in the Box and Block Test [15]. Seo et al. also reported a case in which a child with hemiplegic cerebral palsy used TheraBracelet during daily activities and therapy and examined the feasibility and safety of long-term wear [16]. Seim et al. conducted iterative prototype evaluations of a wearable vibrotactile stimulation device for users with upper-limb hemiparesis and spasticity with eight individuals with stroke, and reported a design that considered donning actions and wearability [17]. The same research group subsequently reported reduced spasticity measures in individuals with chronic stroke [18]. Awaji et al. reported an intervention using a wearable device that synchronously presented hand-contact timing as vibration and changes in upper-limb function in one individual with stroke [19]. These studies were conducted in rehabilitation-related contexts and differ from the present study’s brief pre-task stimulation of healthy participants in their purposes, participants, stimulation, or intended use.
Other studies have examined the relationship between tactile input and manual motor or sensorimotor activity. Du et al. combined vibration feedback with movements using a pneumatic hand rehabilitation device and evaluated sensorimotor-related brain activity using functional near-infrared spectroscopy [20]. In addition, a systematic review and meta-analysis of electrotactile feedback for the hand and arm summarized advantages related to device miniaturization and wearability, while also identifying issues related to repeated calibration, sample size, and methodology [21].
These studies indicate that peripheral tactile input to the fingers or wrist may be associated with manual dexterity and sensorimotor function. However, they use dedicated finger-pad stimulation devices, repetitive electrical stimulation of the fingers, subthreshold noise requiring participant-specific perceptual-threshold calibration, or high-frequency continuous vibration. Their stimulation sites, stimulation formats, need for calibration, timing of presentation, and device configurations therefore differ from those of the present study. The present study does not claim superiority over these existing methods or the same physiological mechanism. Rather, it is positioned as an examination of brief, low-pulse-rate stimulation that can be readily delivered by a simple wrist-worn device. Table 1 summarizes the differences between the present study and related work. This comparison is not intended to demonstrate that the proposed method is superior to other methods.
Table 1.
Comparison of sensory stimulation intervention studies concerning manual dexterity or upper-limb motor function cited in this paper and the present study. Mechanical vibration frequency, actuator resonance, noise-filter cutoff, electrical-pulse frequency, and ON/OFF pulse repetition rate denote different quantities and are not directly comparable. The mechanical vibration frequency was not measured for DexPulse.
2.2. Low-Burden User Support Through Wrist-Worn Tactile Stimulation
Presentations from information devices may influence users’ cognition, affect, or behavior even when users are not explicitly aware of them. HCI research has therefore emphasized the importance of understanding such effects and incorporating them into interface design when appropriate [22,23]. Among such approaches, wrist-worn tactile stimulation has been investigated as a low-burden intervention that can be presented while users are engaged in other tasks because it does not cover the fingers or palm and is less likely to occupy visual or auditory channels.
Tactile stimulation delivered by wrist-worn devices similar to that used in the present study has been used as a low-burden intervention that can affect user states without requiring explicit effort or occupying visual or auditory channels. Its target domains include cognition, affect, attention, and time perception.
Choi et al.’s ambienBeat is a system that presents heartbeat-like tactile patterns from a wrist-worn device to support regulation of users’ heart rhythms [12]. Costa et al.’s BoostMeUp presents simulated heartbeat-related tactile feedback from a smartwatch and examined its effects on cognitive task performance through affect regulation [10]. These studies are examples of tactile interventions delivered from the wrist in parallel with a primary task without requiring additional active operation by users. Shirai et al. varied the number, duration, and interval of repeated tactile stimuli delivered from a wrist-worn device and examined their relationship with subjective elapsed time [9,24]. This work demonstrated a configuration in which low-pulse-rate, clearly perceptible ON/OFF stimulation is delivered from a compact wrist-worn device; however, it evaluated subjective elapsed time rather than manual dexterity or motor performance.
Whitmore et al. investigated the effects of rhythmic tactile stimulation delivered from a wrist-worn device on attention-task performance and user experience [11]. In addition to changes in attention-task performance associated with tactile stimulation from the wrist, the study found tactile stimulation to be usable and socially acceptable among the sensory modalities compared. Its field study using a smartwatch also examined feasibility in real-world settings. This study indicates the potential for using wrist-worn tactile stimulation for everyday support; however, it concerns attention and does not demonstrate effects on manual dexterity.
Kim et al. proposed a framework that views tactile presentation not merely as a notification or signal but from the perspective of tactile experience, that is, how users feel, interpret, and evaluate it [25]. This perspective indicates the need to design wrist-worn interventions by considering not only the effectiveness of tactile stimulation but also wearability, perceptibility, comfort, and contexts of use. Tactile presentation that can be applied to wearable devices has recently been studied with respect to presentation location, signal design, device form factor, and feedback during task performance. Wersényi compared the perceptual accuracy of vibration at multiple body locations and identified the utility of the wrist and a signal duration exceeding 500 ms [26]. Terenti et al. investigated how presentation location at the finger, wrist, and forearm affects user experience with virtual and physical displays [27,28], and also examined vibration feedback during touch interactions using smartwatches, rings, and armbands [29]. Palmer et al. compared haptic mappings that relocate virtual contact forces to the wrist [30], whereas Moon et al. evaluated the effects of a haptic glove on user experience and task performance in a VR task [31]. Although these studies provide design knowledge concerning tactile feedback during task performance, they have not sufficiently examined the effects of brief pre-task wrist stimulation on subsequent manual dexterity.
The above studies indicate that wrist-worn tactile stimulation may be used as a low-burden intervention targeting heart rate, affect, cognition, subjective time, and attention. However, these HCI studies do not evaluate manual dexterity, and the effects of brief, low-pulse-rate, clearly perceptible intermittent tactile stimulation delivered before a task from a simple wrist-worn device on subsequent manual dexterity have not been sufficiently investigated.
3. Method
In this study, there are mainly two reasons for adopting a wrist-worn form as the device for presenting tactile stimulation. First is implementability. Wrist-worn devices such as smartwatches and wristbands are already widely used and are a socially accepted form factor. By using the vibration actuators built into these devices, users can leverage their existing hardware as is, and the stimulation does not cover the fingers or palm, so it does not interfere with daily life or work. Second, intervention at the wrist keeps other motor and sensory organs—such as the fingers, palm, eyes, and ears—free. Indeed, tactile stimulation from the wrist has been widely used in studies that assume an environment where the user is engaged in real-world tasks (manipulation of cognitive performance [10] and manipulation of subjective elapsed time [9]). Furthermore, prior work has shown that, when delivering rhythmic vibratory stimulation from the wrist, vibration at the wrist is the most socially acceptable among multiple modalities such as sound and light [11]. These findings indicate that tactile presentation at the wrist is an effective modality for low-burden supportive interventions in everyday life, and it is well suited to the aim of this study.
In this study, we use on/off vibration pulses that can be generated even on simple wrist-worn devices or standard smartwatches. This allows the intervention to be reproduced on existing consumer hardware and, in addition, on inexpensive vibration elements. Moreover, in this study we treat the stimulation as an intervention immediately before the task rather than as feedback during the task. This is because vibrotactile perception at the hand and wrist may be suppressed during active movement, so concurrent stimulation could interfere with the manual task itself, and because applying a short intervention before manual work is also a realistic usage pattern.
3.1. Tactile Stimulation Presentation Device
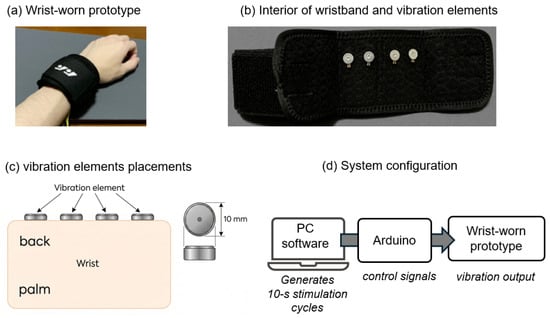
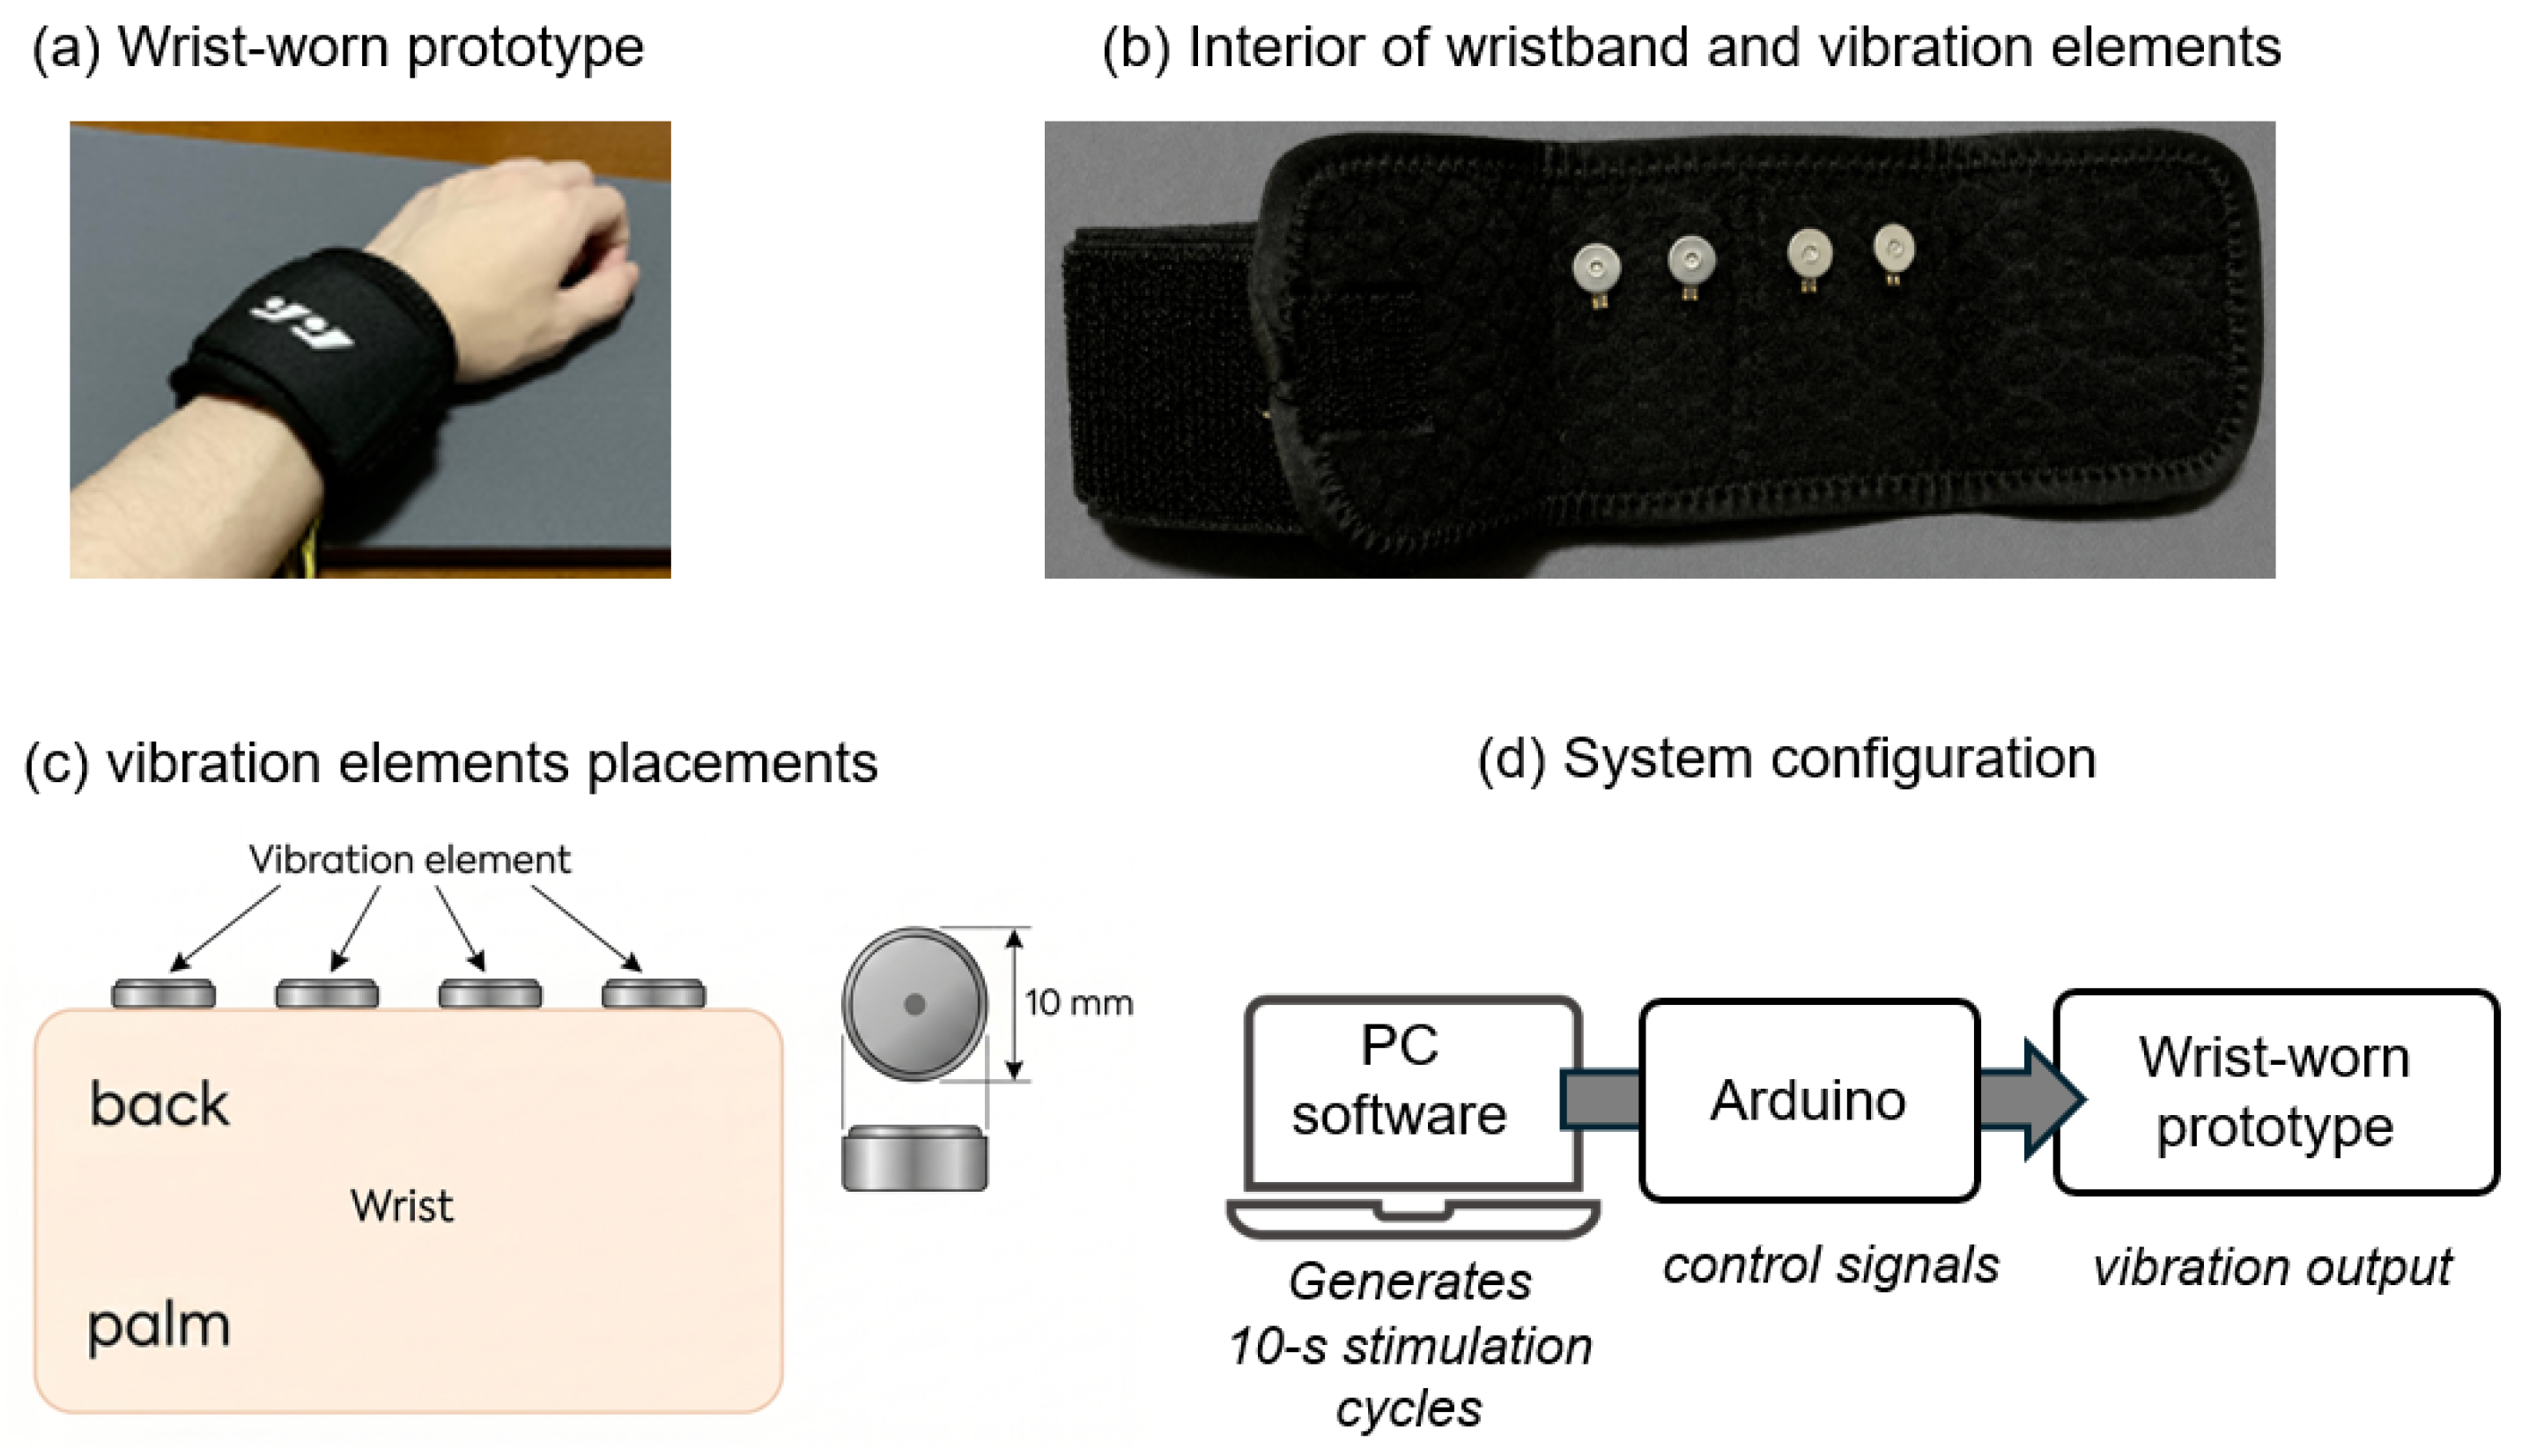
We implemented the tactile-stimulation presentation system as follows. The system presents repeated on/off vibration stimulation. The wrist-worn device that presents the tactile stimulation is shown in Figure 1. The system is intended for wrist-worn form factors such as smartwatches. A disk-shaped brushless vibration motor (LBV10B-009) was used as the actuator for tactile stimulation. A conventional wrist support wrapped around the wrist was used as the wristband. Four vibration actuators were positioned as shown in the figure. The actuators were placed on the dorsal side of the hand in the wrist-worn configuration. The same control command was sent simultaneously to all four motors, and, at each stimulation event, all motors were activated simultaneously according to the same ON/OFF pulse schedule. The actuator has a drive voltage of 2.0–3.0 V, a drive current of 50–75 mA, a diameter of 10 mm, a thickness of 3.3 mm, and a mass of approximately 1.0 g. The entire prototype system consists of the wristband-type device that presents the tactile stimulation, an Arduino, a PC, and software for stimulus presentation. The software was implemented with Arduino and Processing; specifically, the presentation of the tactile stimulation from the Arduino can be controlled through commands in Processing.
Figure 1.
The wrist-worn device for presenting tactile stimulation. (a) Wrist-worn prototype. (b) Interior of the wristband showing the vibration elements. (c) Arrangement of the four vibration elements. (d) System configuration.
3.2. Method for Controlling Stimulus Rate
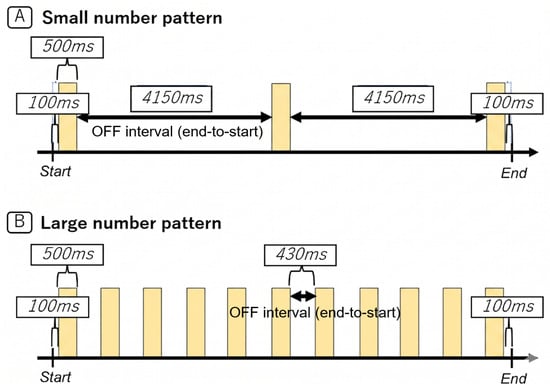
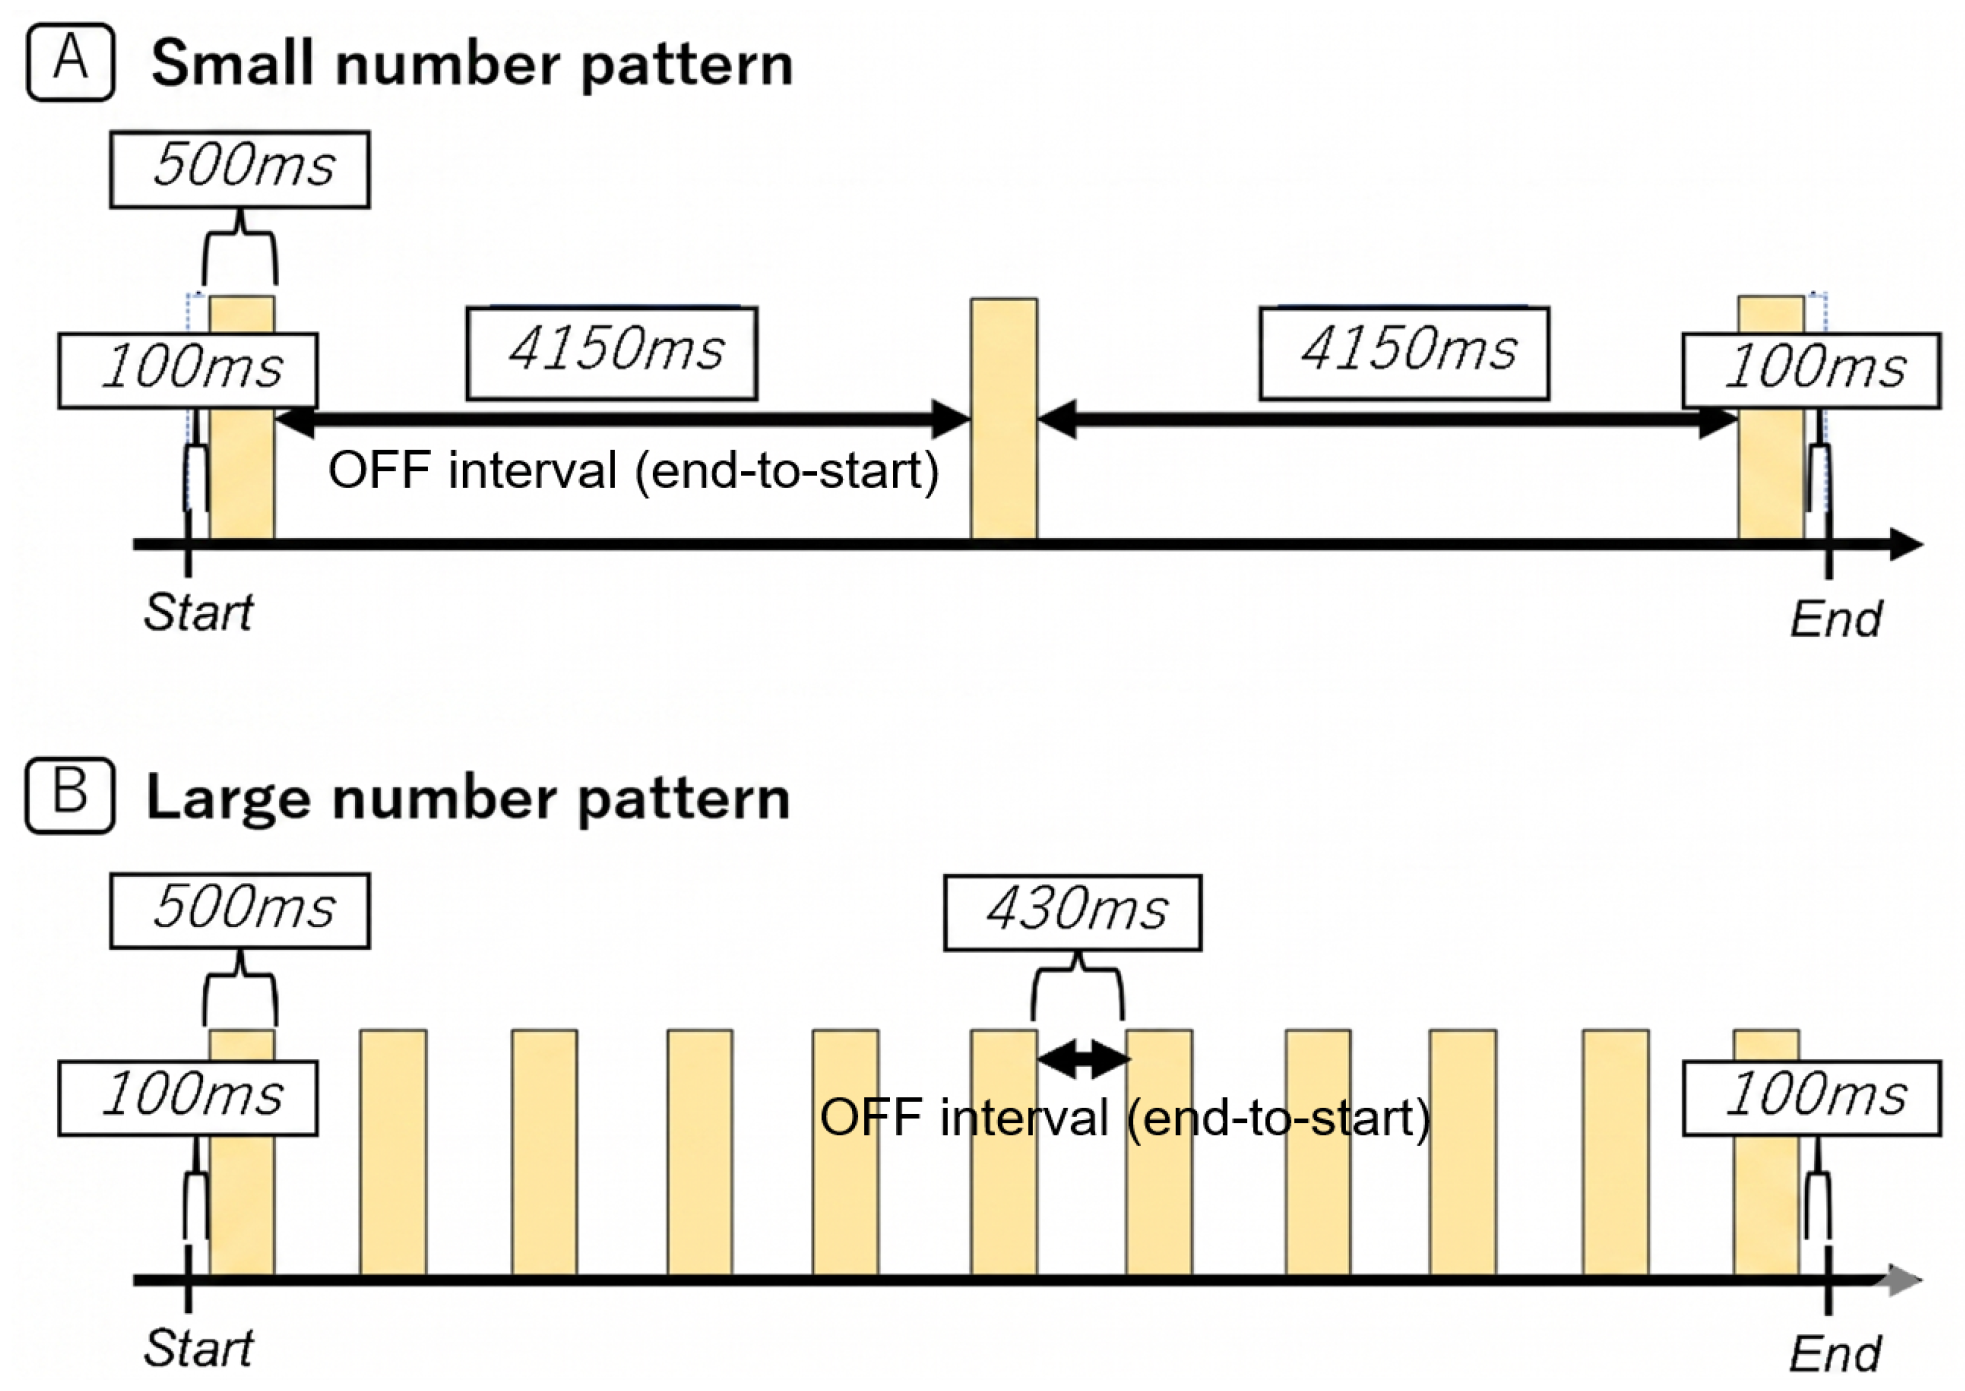
In this study, we compare two stimulation patterns that differ only in the stimulation rate (Figure 2 and Table 2). Both patterns are based on a repeating 10-s cycle. The Small number pattern presents 3 pulses/10 s, while the Large number pattern presents 11 pulses/10 s. The pulse width is fixed at 500 ms. In both patterns, the first pulse begins 100 ms after the start of each cycle and the last pulse ends 100 ms before the end of the cycle; the inter-pulse interval follows from these constraints. The 10-s cycle was repeated continuously throughout the 2-min intervention block in the experiment, for a total of 12 cycles.
Figure 2.
Pulse diagrams for each stimulation-rate condition. (A): 3 pulses/10 s (Small number). (B): 11 pulses/10 s (Large number).
Table 2.
Number of pulses and inter-pulse interval for each stimulation pattern.
We chose the stimulation rate as the manipulated dimension for the following three reasons. (i) The stimulation rate can be easily changed on inexpensive vibration elements or in the firmware of a smartwatch, and may be implementable on wrist-worn devices with suitable actuator-control capabilities. (ii) Our prior work used 11 pulses/10 s as a design upper bound for presenting 500-ms pulses while retaining unstimulated intervals, rather than measuring a universal perceptual maximum [9,24]; we adopted this upper-rate reference and 3 pulses/10 s as a lower-rate contrast. Compared with the continuous 80-Hz mechanical vibration used in prior work [13] and higher-frequency vibrations, the vibration in the present study lies in a low-frequency parameter region that has not been sufficiently examined and consists of intermittent on-off pulses. Here, 3 or 11 pulses/10 s denotes the pulse repetition rate, not the mechanical vibration frequency of the motor. (iii) The 2022 extended study reported estimated durations of 9.63 s and 11.67 s for 10-s intervals with 3 and 11 pulses, respectively (approximately and ) [24]. The stimulation rate may act as a graded peripheral input, and if the stimulation rate were to affect the results, the change in subjective elapsed time could be used as a clue for interpretation.
If an effect of the tactile stimulation arises in this study, two mechanisms can be considered; however, identifying them is not the aim of this study. First is sensorimotor priming (a change in the excitability of the sensorimotor system). Prior work has reported that mechanical tactile stimulation to the fingers modulates corticospinal excitability [4]. Peripheral tactile input may temporarily change the state of the sensorimotor system and thereby affect subsequent motor execution. Second is a change in subjective elapsed time. The stimulation patterns used in this study have been reported to change subjective elapsed time [9,24], which could in turn affect the work pace and completion time.
4. Evaluation
In this experiment, we examine the effect of a tactile-stimulation intervention from a wrist-worn device on a subsequent manual motor task (a pegboard task). Specifically, we evaluated whether presenting tactile stimulation before the task can change the completion time of the subsequent task. This completion time is referred to as motor performance in prior work.
The main aim of this experiment is to test the following hypotheses.
Hypothesis 1.
Tactile stimulation presented from a wrist-worn device before the task affects the completion time of the subsequent pegboard task, and the stimulation-rate condition modulates this effect.
Hypothesis 2.
This effect is more readily detected (the intervention is more effective) in participants for whom task repetition alone did not produce additional shortening of completion time (an improvement effect).
The participants were healthy Japanese adults in their twenties. The sample comprised 32 participants (25 men and 7 women). This study was conducted with the approval of the Research Ethics Review Committee of Ritsumeikan University (approval number: 2023-045), and informed consent was obtained from all participants.
4.1. Task
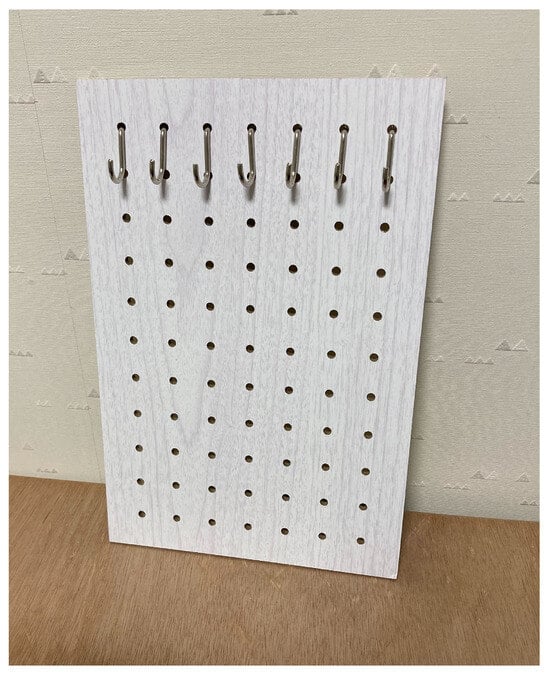
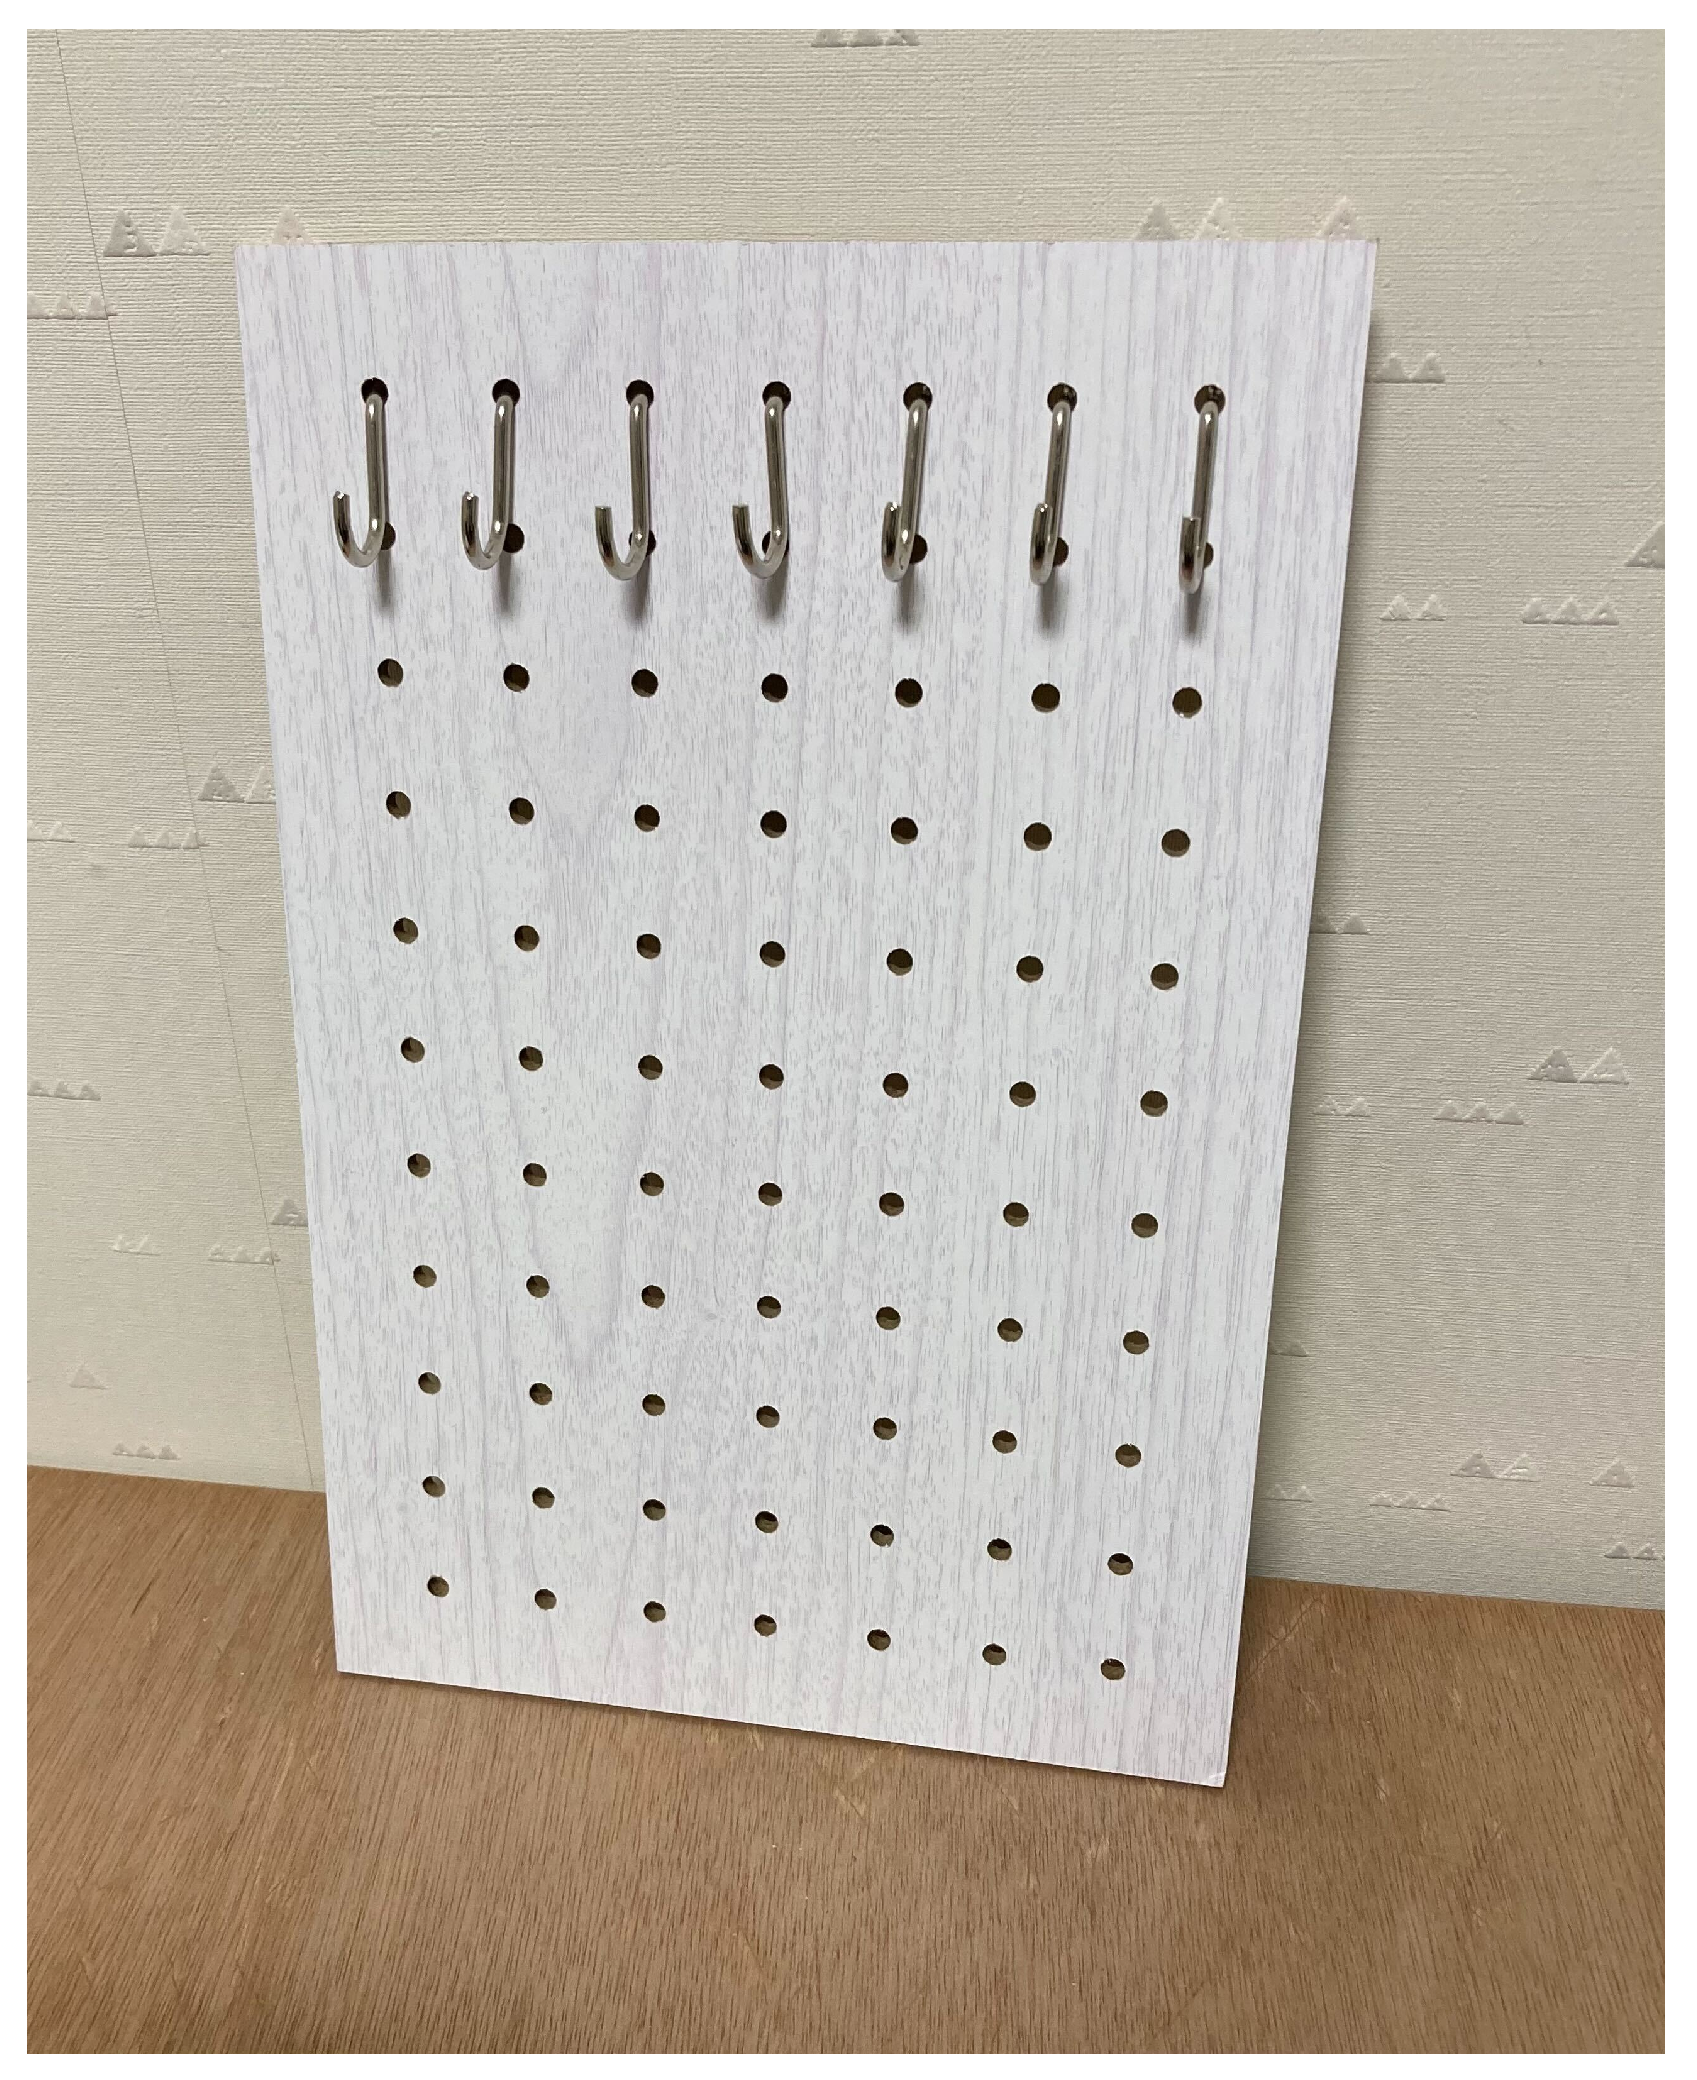
The task was a pegboard task. Manual dexterity is an important measure in activities of daily living, occupational therapy, neurorehabilitation, and human-performance assessment, and pegboard tasks are widely used for its assessment [1,2,3]. Because these tasks involve a sequence of actions—grasping a pin, aligning it, and inserting it into a hole—they reflect elements such as manual dexterity, visuomotor coordination, attention, and motor planning. A pegboard was placed on a desk in front of the seated participant (Figure 3). One set consisted of inserting all seven pins as quickly as possible, and the completion time was measured by the experimenter using a stopwatch and camera footage, from the verbal start cue until the seventh pin was placed.
Figure 3.
The pegboard used in the task.
4.2. Experimental Conditions
The experiment used a 2 × 3 mixed design with the stimulation-rate condition (3 pulses/10 s, 11 pulses/10 s) as a between-participants factor and the measurement time point as a within-participants factor. The measurement time points comprised three levels: the first baseline measurement (T1), the second baseline measurement (T2), and the post-intervention measurement (T3). We included two pre-intervention measurements without stimulation (T1, T2) in order to characterize, for each participant, the natural change in completion time due to repetition alone. With only a single baseline measurement, this change due to repetition cannot be evaluated at the individual level.
4.3. Procedure
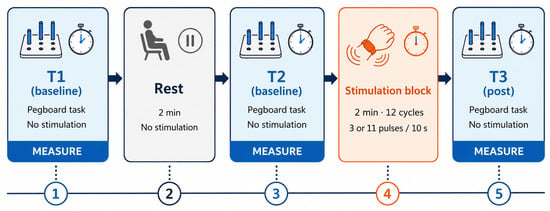
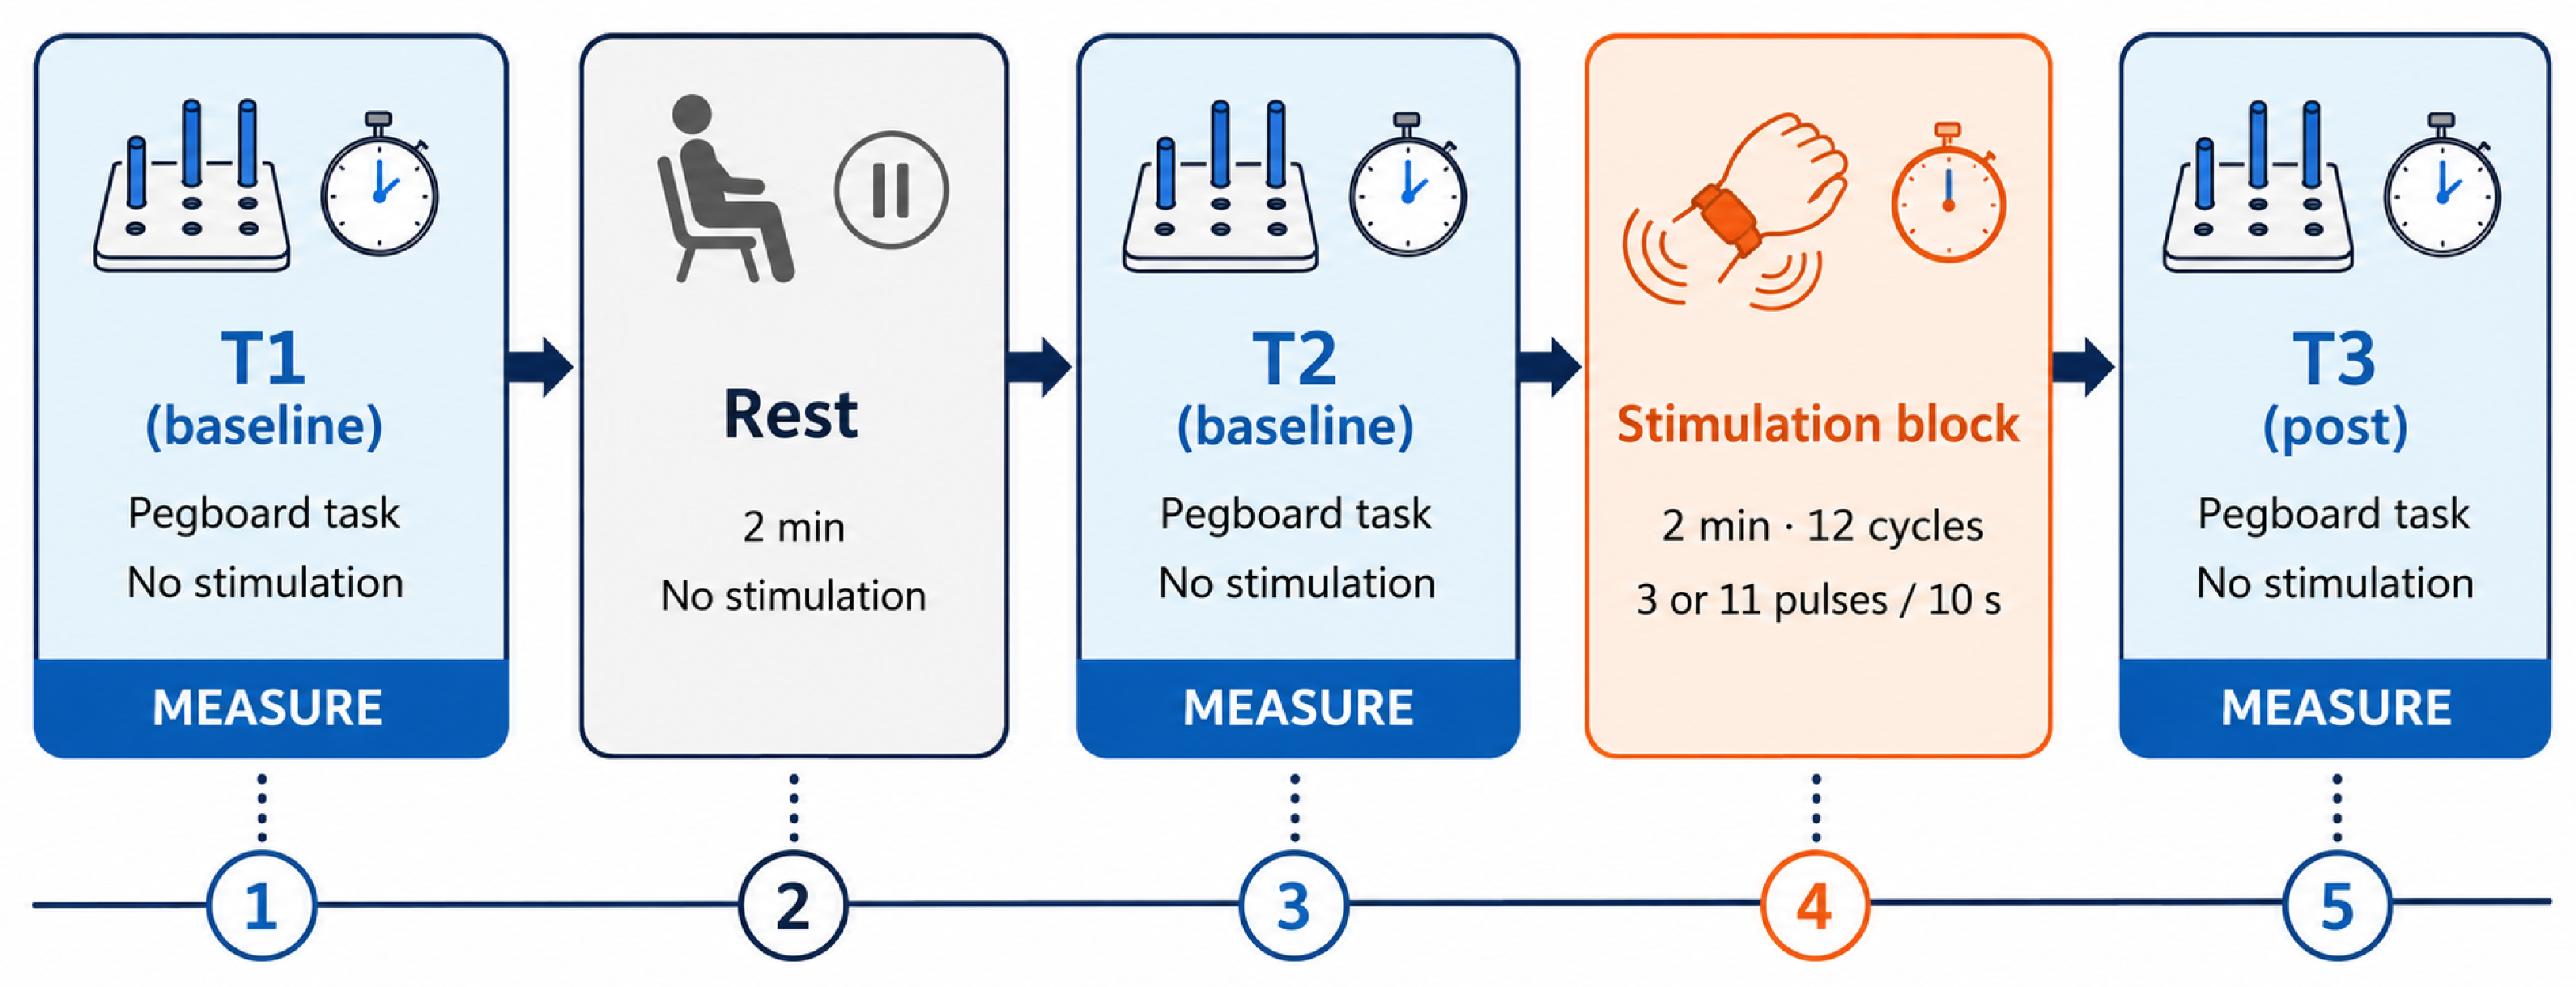
The procedure was as follows (Figure 4).
Figure 4.
Flow of the experimental procedure. The wristband is worn throughout, and stimulation is presented only during the 2-min stimulation-intervention block.
- Familiarization practice: Participants were seated at a desk, fitted with the wrist-worn device, and given oral instructions for the task before completing practice to become familiar with it. For familiarization practice, all participants were asked to complete at least five practice sets. Additional practice sets were completed as needed until participants reached a state in which they could perform the task smoothly. Familiarization practice lasted for up to approximately 10 min.
- T1: First baseline measurement (no stimulation). The participant performed one set of the pegboard task without stimulation, and the completion time was recorded.
- A: 2-min rest. No stimulation was presented.
- T2: Second baseline measurement (no stimulation). The participant performed a second set of the pegboard task without stimulation, and the completion time was recorded.
- A: 2-min stimulation-intervention block. The participant remained seated with the hand resting on the desk, and the assigned stimulation pattern (3 pulses/10 s or 11 pulses/10 s) was presented continuously for 2 min (10 s × 12 cycles). The participant was instructed to wait.
- T3: Post-intervention measurement (no stimulation). Immediately after the stimulation block ended, the participant performed a third set of the pegboard task without stimulation, and the completion time was recorded.
The wristband was worn continuously from the familiarization practice until the end of the T3 measurement. The actuators were inactive during T1, the rest, T2, and T3, and operated only during the 2-min stimulation-intervention block.
5. Results
In this experiment, we measured the pegboard-task completion time at three time points for each participant. Hereafter, the no-stimulation trial performed before the pre-intervention stage is denoted T1, the no-stimulation trial performed immediately before the intervention is denoted T2, and the trial performed after the tactile stimulation is denoted T3. A smaller completion time means faster task execution. For the statistical analysis, we checked the assumptions of the analysis of variance (ANOVA) and the t-test. We checked the normality of the completion times using the Shapiro–Wilk test, and for analyses in which normality was not satisfied, we additionally used nonparametric tests (the Friedman test and the Wilcoxon signed-rank test) to confirm the robustness of the conclusions. As effect sizes, we report partial for the ANOVA and Cohen’s for pairwise comparisons. In addition, we assessed homogeneity of variance between groups using Levene’s test and sphericity for repeated measures using Mauchly’s test, and applied the Greenhouse–Geisser (GG) correction when sphericity was not satisfied.
As additional descriptive analyses, individual change scores were calculated for T1 − T2 and T2 − T3. For the mean change score in the primary exploratory subgroup, a percentile bootstrap 95% confidence interval (CI) based on 20,000 resamples was calculated in addition to the conventional 95% CI. We also conducted leave-one-out recalculations excluding one participant at a time, Pearson and Spearman correlations between T1 completion time and the T2 − T3 change score, and sensitivity analyses using alternative subgroup criteria defined from T1 and T2 only.
The operational criterion for the primary exploratory subgroup was defined, in correspondence with Hypothesis 2, as , using only the pre-intervention T1 and T2 measurements and without reference to post-intervention T3 or the T2 − T3 change score. Because this study was not externally preregistered, we do not position this primary criterion as a formally preregistered confirmatory analysis. In contrast, the sensitivity analyses using alternative subgroup criteria were post hoc exploratory analyses added at revision. None of the additional analyses are treated as confirmatory or causal tests.
5.1. Analysis of All Participants
5.1.1. Descriptive Statistics and the Time Effect
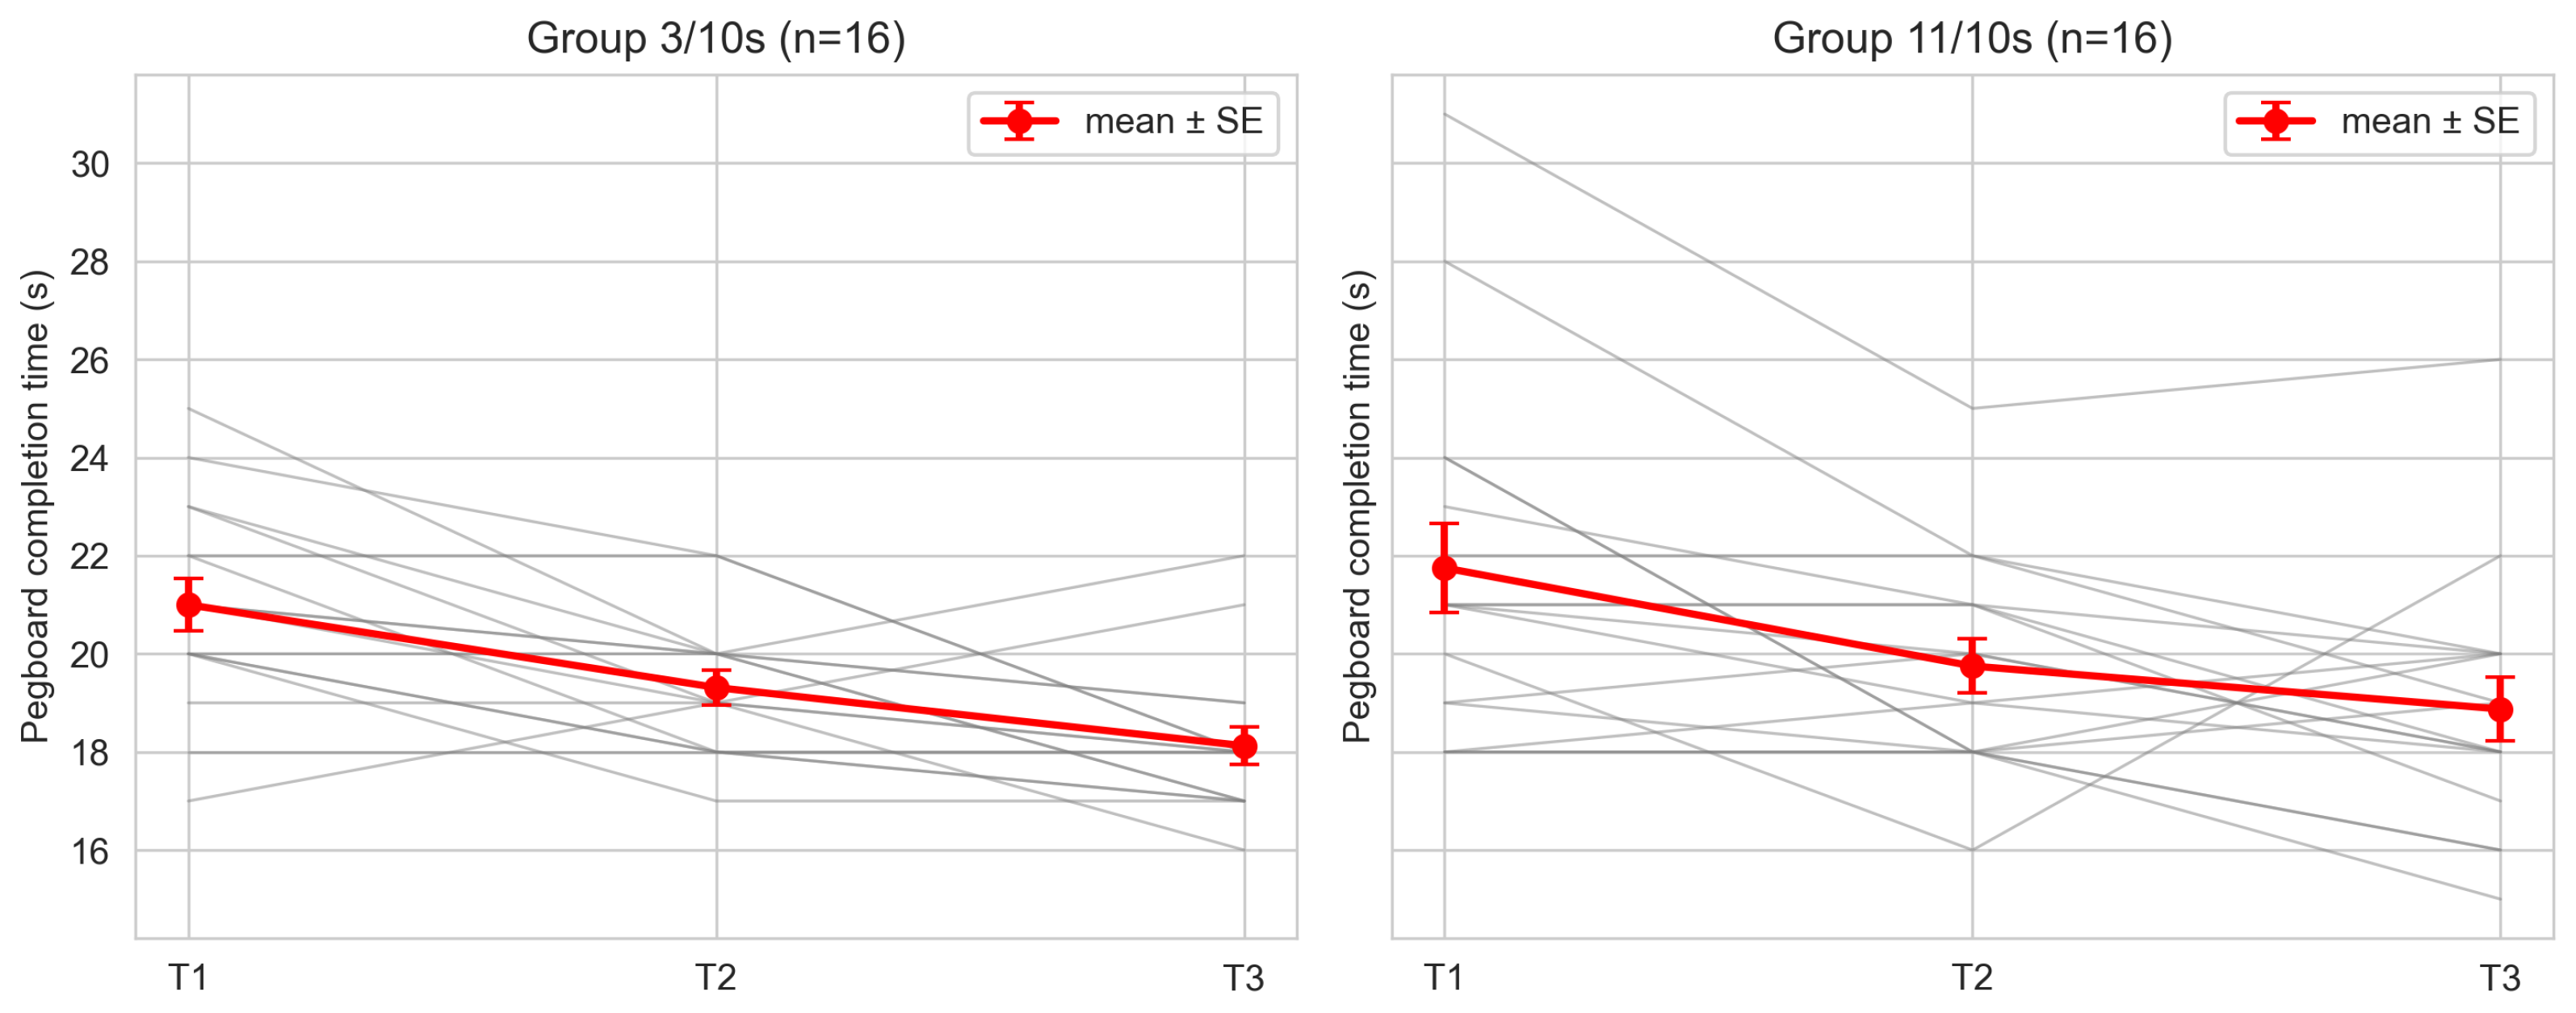
Table 3 shows the completion time at each time point for all 32 participants. For the overall mean, the completion time was 21.38 s at T1 (standard deviation [SD] = 2.96), 19.53 s at T2 (SD = 1.83), and 18.50 s at T3 (SD = 2.16). Figure 5 shows the trajectory of the mean completion time by stimulation condition. Overall, the completion time tended to decrease as the trials progressed.
Table 3.
Completion time (s). CI denotes the 95% confidence interval.
Figure 5.
Completion-time trajectories of individual participants by stimulation condition (thin lines: individuals; thick lines: group mean ± standard error [SE]). Individual trajectories may overlap where participants have identical or similar completion times; the thick mean trajectories and error bars remain distinguishable.
As a check of the assumptions, homogeneity of variance between groups was satisfied at every time point (Levene’s test, T1: ; T2: ; T3: ), and sphericity for the repeated measures was also satisfied (Mauchly’s test, , ). On the other hand, the completion time at each time point deviated from a normal distribution (Shapiro–Wilk test, T1: ; T2: ; T3: ), so the results of the ANOVA were additionally confirmed using nonparametric tests.
For all participants, we conducted a mixed-design ANOVA with time (T1, T2, T3) as a within-participants factor and the stimulation-rate condition (3 pulses/10 s, 11 pulses/10 s) as a between-participants factor. As a result, the main effect of time was significant (, , partial ). This time effect was also confirmed by the nonparametric Friedman test (, ).
To examine the differences between time points, we performed multiple comparisons using paired t-tests with Bonferroni correction. As a result, the completion time decreased by a mean of 1.84 s from T1 to T2 (, Bonferroni-corrected , ), by a mean of 1.03 s from T2 to T3 (, Bonferroni-corrected , ), and by a mean of 2.88 s from T1 to T3 (, Bonferroni-corrected , ). All of these differences were also significant in the Wilcoxon signed-rank test (T1–T2: ; T2–T3: ; T1–T3: ). Therefore, for all participants, the decrease in completion time as the trials progressed was consistently observed in both parametric and nonparametric tests.
5.1.2. Effect of the Stimulation-Rate Condition
In the mixed-design ANOVA, the main effect of the stimulation-rate condition was not significant (, , partial ), and the interaction between time and the stimulation-rate condition was also not significant (, , partial ).
To evaluate the strength of the evidence for the absence of a difference between stimulation-rate conditions, we computed Bayes factors based on the Bayesian Information Criterion (BIC) approximation [32,33]. Here, denotes the ratio of the evidence for the alternative model containing the relevant effect to that for the corresponding null model; thus, values below 1 favor the null model. Because these Bayes factors were derived from the BIC rather than by directly estimating marginal likelihoods, they are treated as approximate, supplementary indices of model comparison and not as evidence of a causal effect. As a result, for the interaction between time and the stimulation-rate condition, and for the main effect of the stimulation-rate condition; in both cases, a model that does not include the interaction or the condition difference was supported (for the main effect of time, the alternative hypothesis was strongly supported, ). By the criteria of Kass & Raftery [32], corresponds to strong evidence for the absence of an interaction. Therefore, within the range examined in this experiment (3 pulses/10 s vs. 11 pulses/10 s, with a 2-min presentation), no difference in pegboard-task completion time was detected between the two stimulation-rate conditions. Table 4 summarizes the results of the mixed-design ANOVA and the Bayes factors.
Table 4.
Results of the mixed-design ANOVA for all participants and Bayes factors (BIC approximation). Values of below 1 favor the corresponding null model.
5.1.3. Comparison with the Practice Effect
For all participants, the completion time decreased at T3, but it should be noted that a significant decrease was also observed from T1 to T2. That is, a substantial decrease in completion time had already occurred before any stimulation was presented.
We therefore directly examined whether the decrease after the tactile stimulation exceeded this decrease due to natural improvement. For each participant, we computed the amount of decrease before the intervention (practice change; T1 − T2, mean 1.84 s) and the amount of decrease after the intervention (post-intervention change; T2 − T3, mean 1.03 s), and compared them using a paired t-test. As a result, the post-intervention change did not significantly exceed the practice change (mean difference s, , ).
This result indicates that the average decrease from T2 to T3 across all participants does not exceed the decrease due to natural practice observed before the stimulation. Therefore, it is difficult to claim an effect specific to the tactile stimulation from the average change across all participants alone.
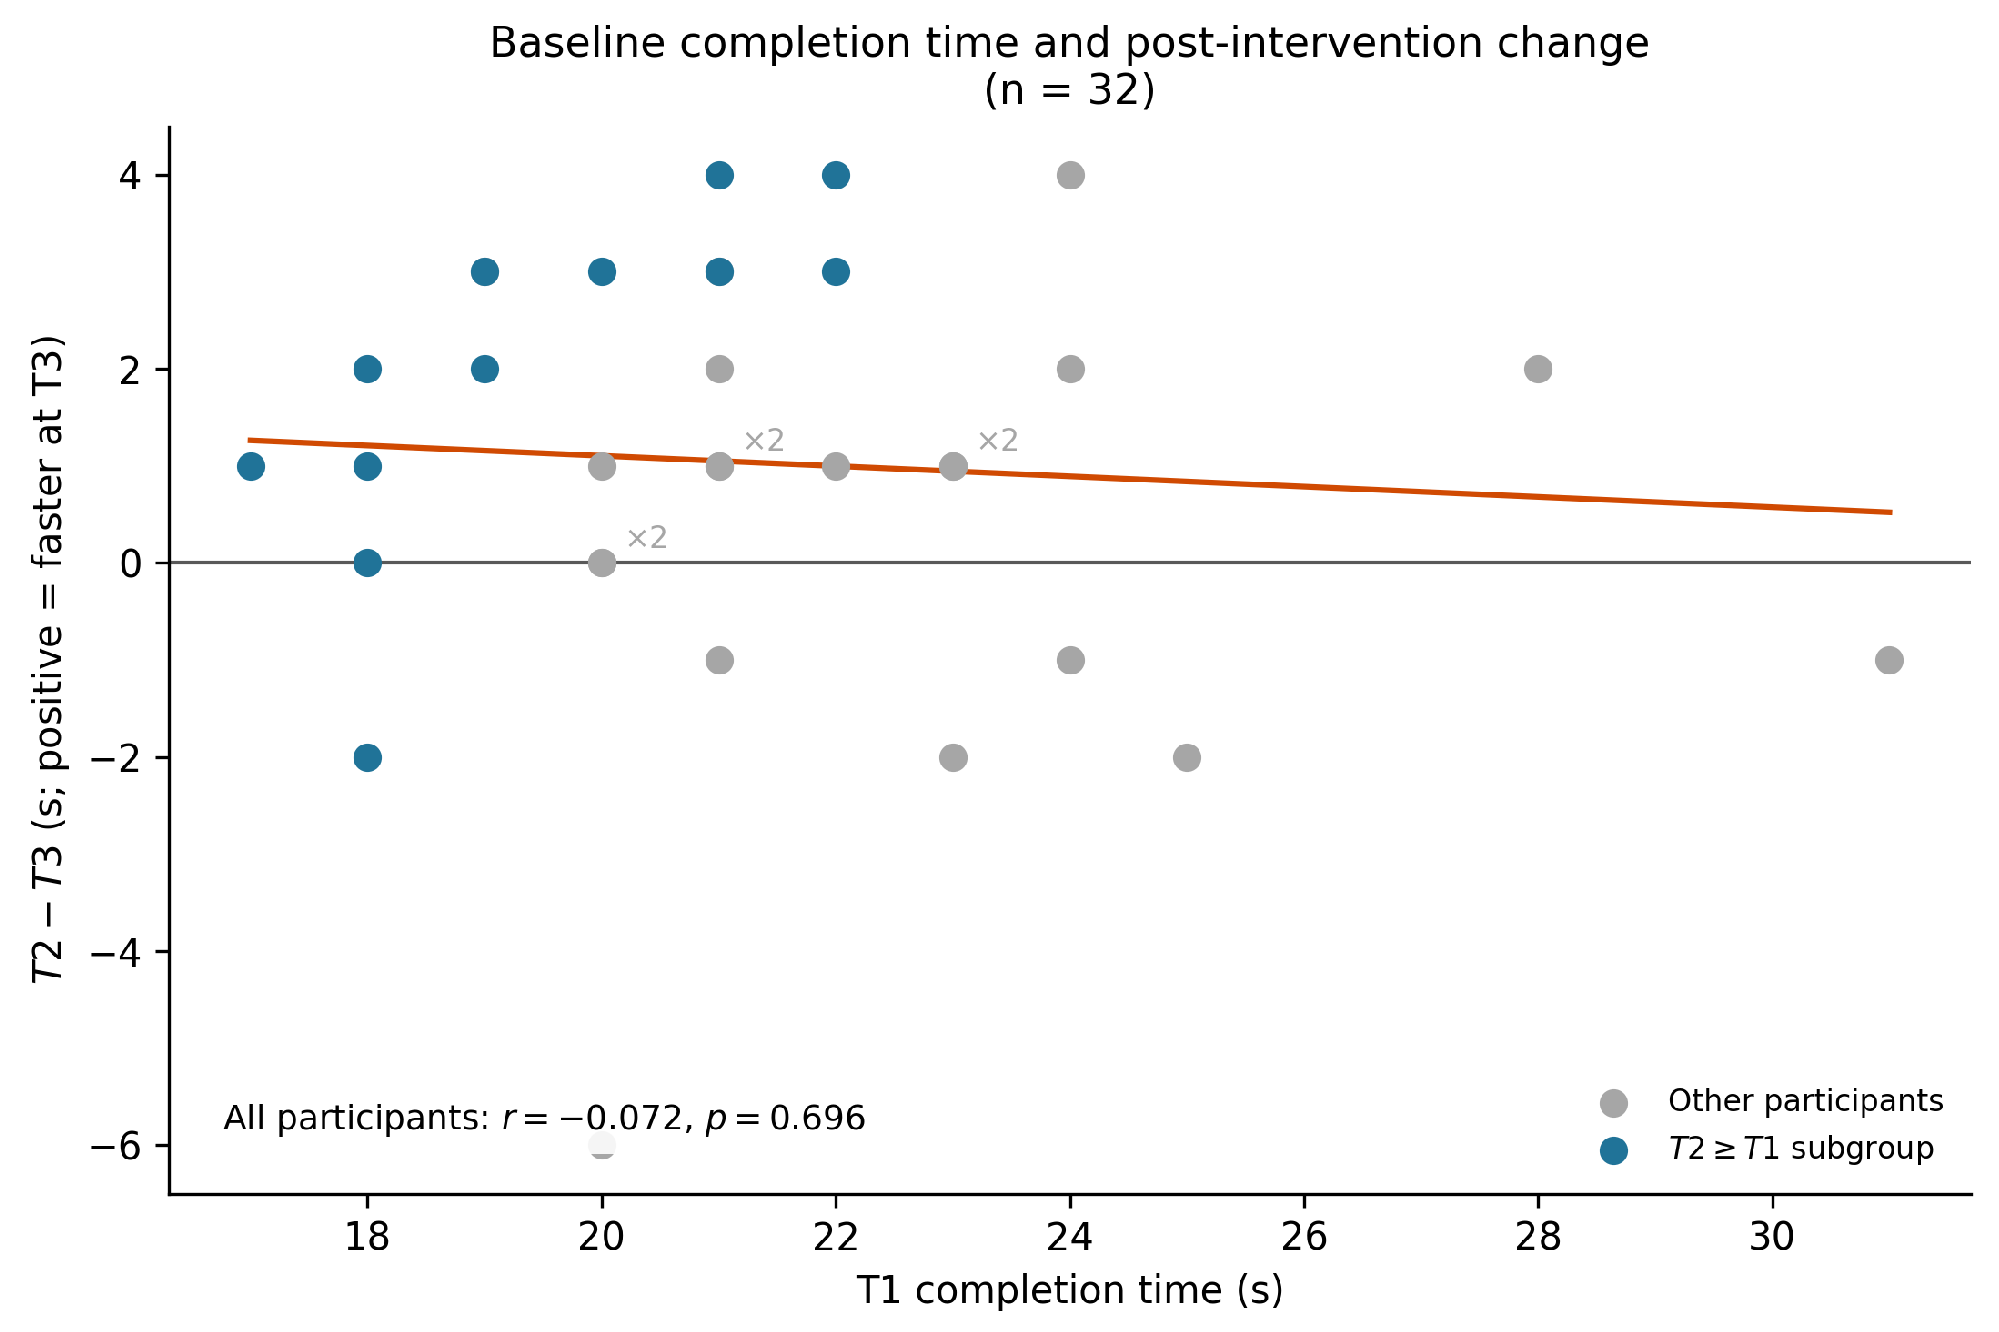
Exploratorily, we examined whether baseline completion time predicted post-intervention change among all participants. As shown in Figure 6, no significant linear or rank correlation was observed between T1 completion time and the T2 − T3 change score (Pearson , ; Spearman , ). Thus, the present data from all participants did not provide evidence that post-intervention shortening can be predicted on the basis of baseline completion time alone. This analysis is exploratory and does not establish a model for predicting individual responsiveness.
Figure 6.
Relationship between baseline completion time (T1) and post-intervention change score (T2 − T3) among all participants (). Positive values on the vertical axis indicate a shorter completion time at T3. The orange line is the least-squares regression line fitted to all 32 participants, and the gray horizontal line indicates zero change. Coincident observations are represented at their original coordinates; labels next to a marker indicate the number of overlapping observations within the corresponding group.
5.2. Subgroup Analysis of Participants with a Small Practice Effect from Task Repetition
We defined participants with —that is, those whose completion time at T2 did not decrease relative to T1—as the exploratory subgroup with a small practice effect from task repetition. This classification did not use the post-intervention T3 performance and was based only on the two pre-intervention trials. Therefore, it does not amount to a post hoc selection of participants who improved after the intervention. Twelve of the 32 participants met this criterion, comprising 5 in the 3 pulses/10 s condition and 7 in the 11 pulses/10 s condition. This criterion describes observations from the two measurements within this session and does not indicate a stable individual characteristic of failing to improve through practice.
The Time Effect
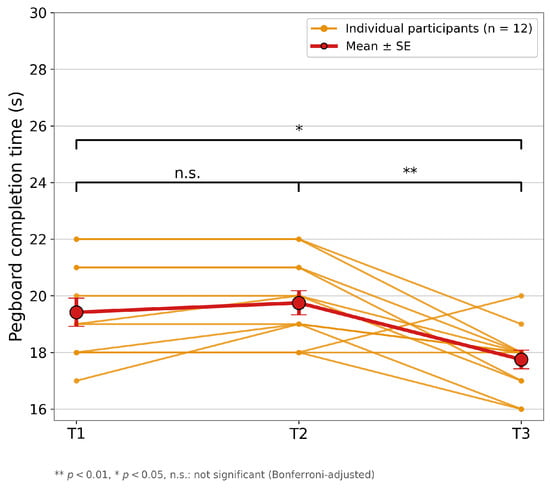
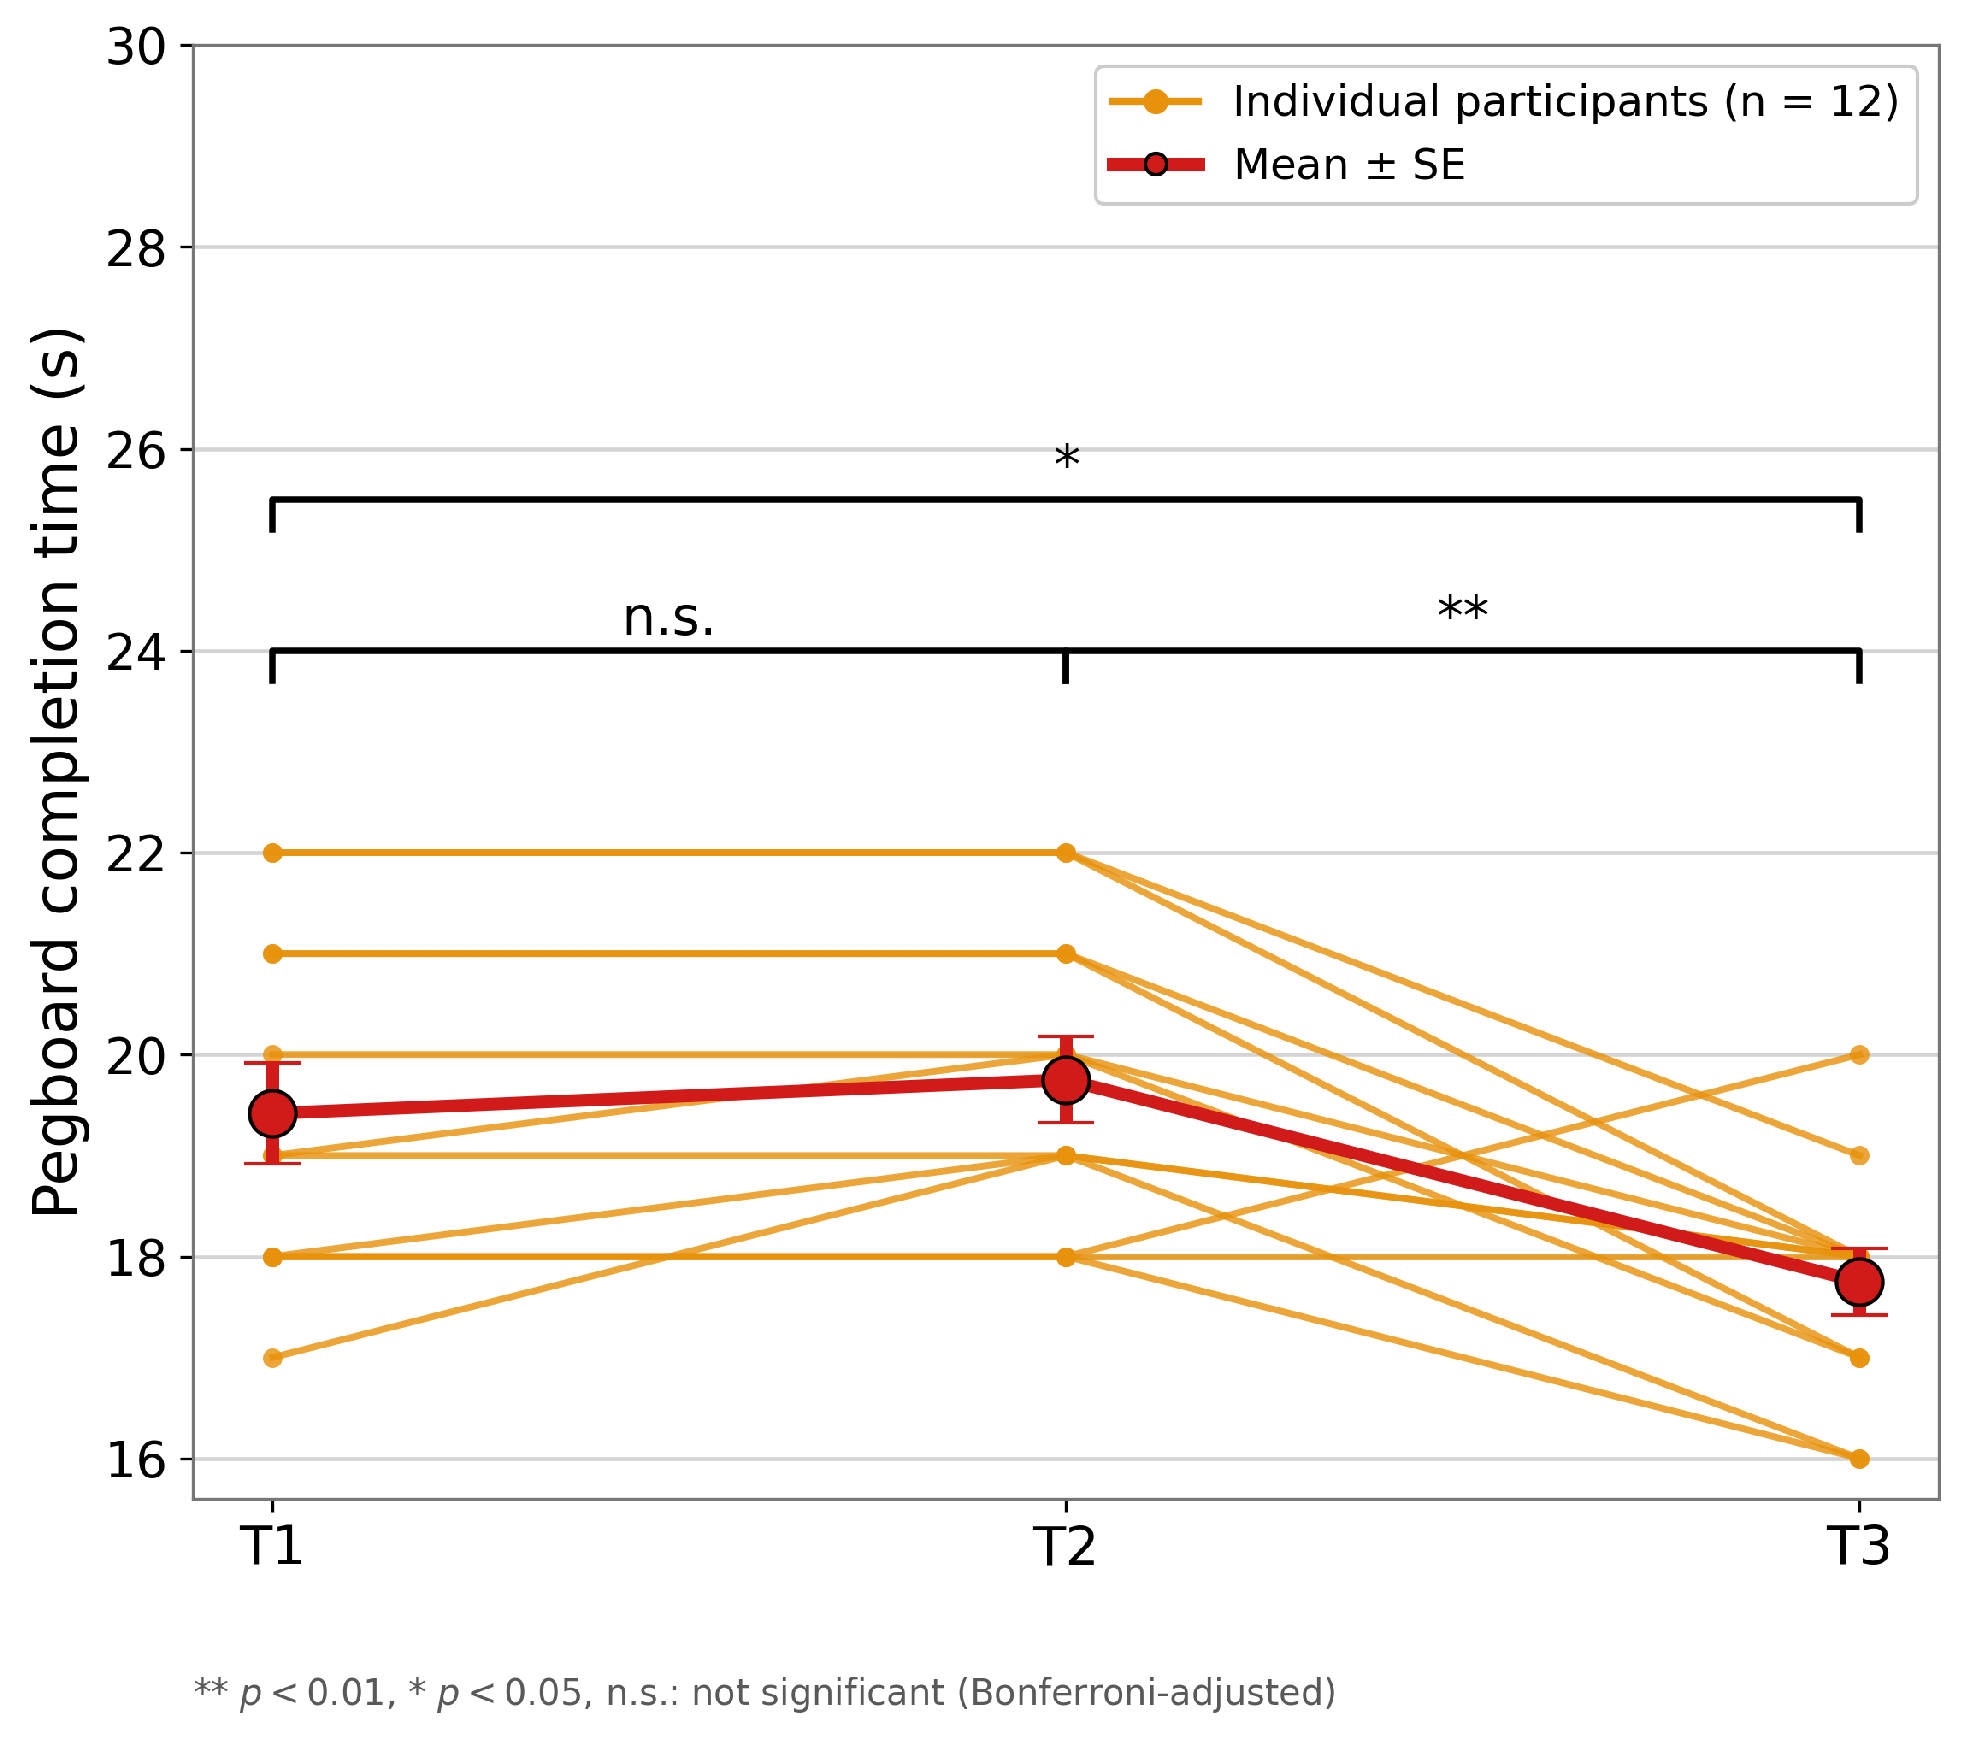
Table 5 shows the completion time at each time point in this subgroup. In the subgroup with a small short-term practice effect, the completion time was 19.42 s (SD = 1.73) at T1, 19.75 s (SD = 1.48) at T2, and 17.75 s (SD = 1.14) at T3. Figure 7 shows the individual trajectories of this subgroup. The completion time at each time point did not deviate from a normal distribution (Shapiro–Wilk test, all ).
Table 5.
Completion time (s) at each time point in the subgroup with a small practice effect ().
Figure 7.
Completion-time trajectories highlighting the subgroup with a small practice effect from task repetition (, defined using only the two pre-intervention trials). Thin orange lines show individual trajectories, which may overlap at identical values; the thick red line and error bars show the mean and standard error. Statistical annotations are placed separately from the trajectories.
For this subgroup, we conducted an ANOVA with time as a within-participants factor and the stimulation-rate condition as a between-participants factor. Because Mauchly’s test indicated a violation of sphericity (, ), we report the effects involving time with the Greenhouse–Geisser correction () applied. As a result, the main effect of time was significant (, , partial ). This time effect was also confirmed by the Friedman test, which does not assume sphericity (, ). On the other hand, the main effect of the stimulation-rate condition was not significant (, , partial ), and the interaction between time and the stimulation-rate condition was also not significant (, , partial ).
Multiple comparisons between time points showed that the change in completion time from T1 to T2 was not significant (mean difference s, , Bonferroni-adjusted , ). This is consistent with the definition of the participant group. In contrast, mean completion time was reduced by 2.00 s from T2 to T3 (, Bonferroni-adjusted , ; Wilcoxon ), and was also reduced by 1.67 s from T1 to T3 (, Bonferroni-adjusted , ; Wilcoxon ).
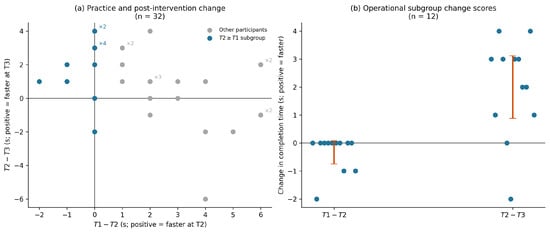
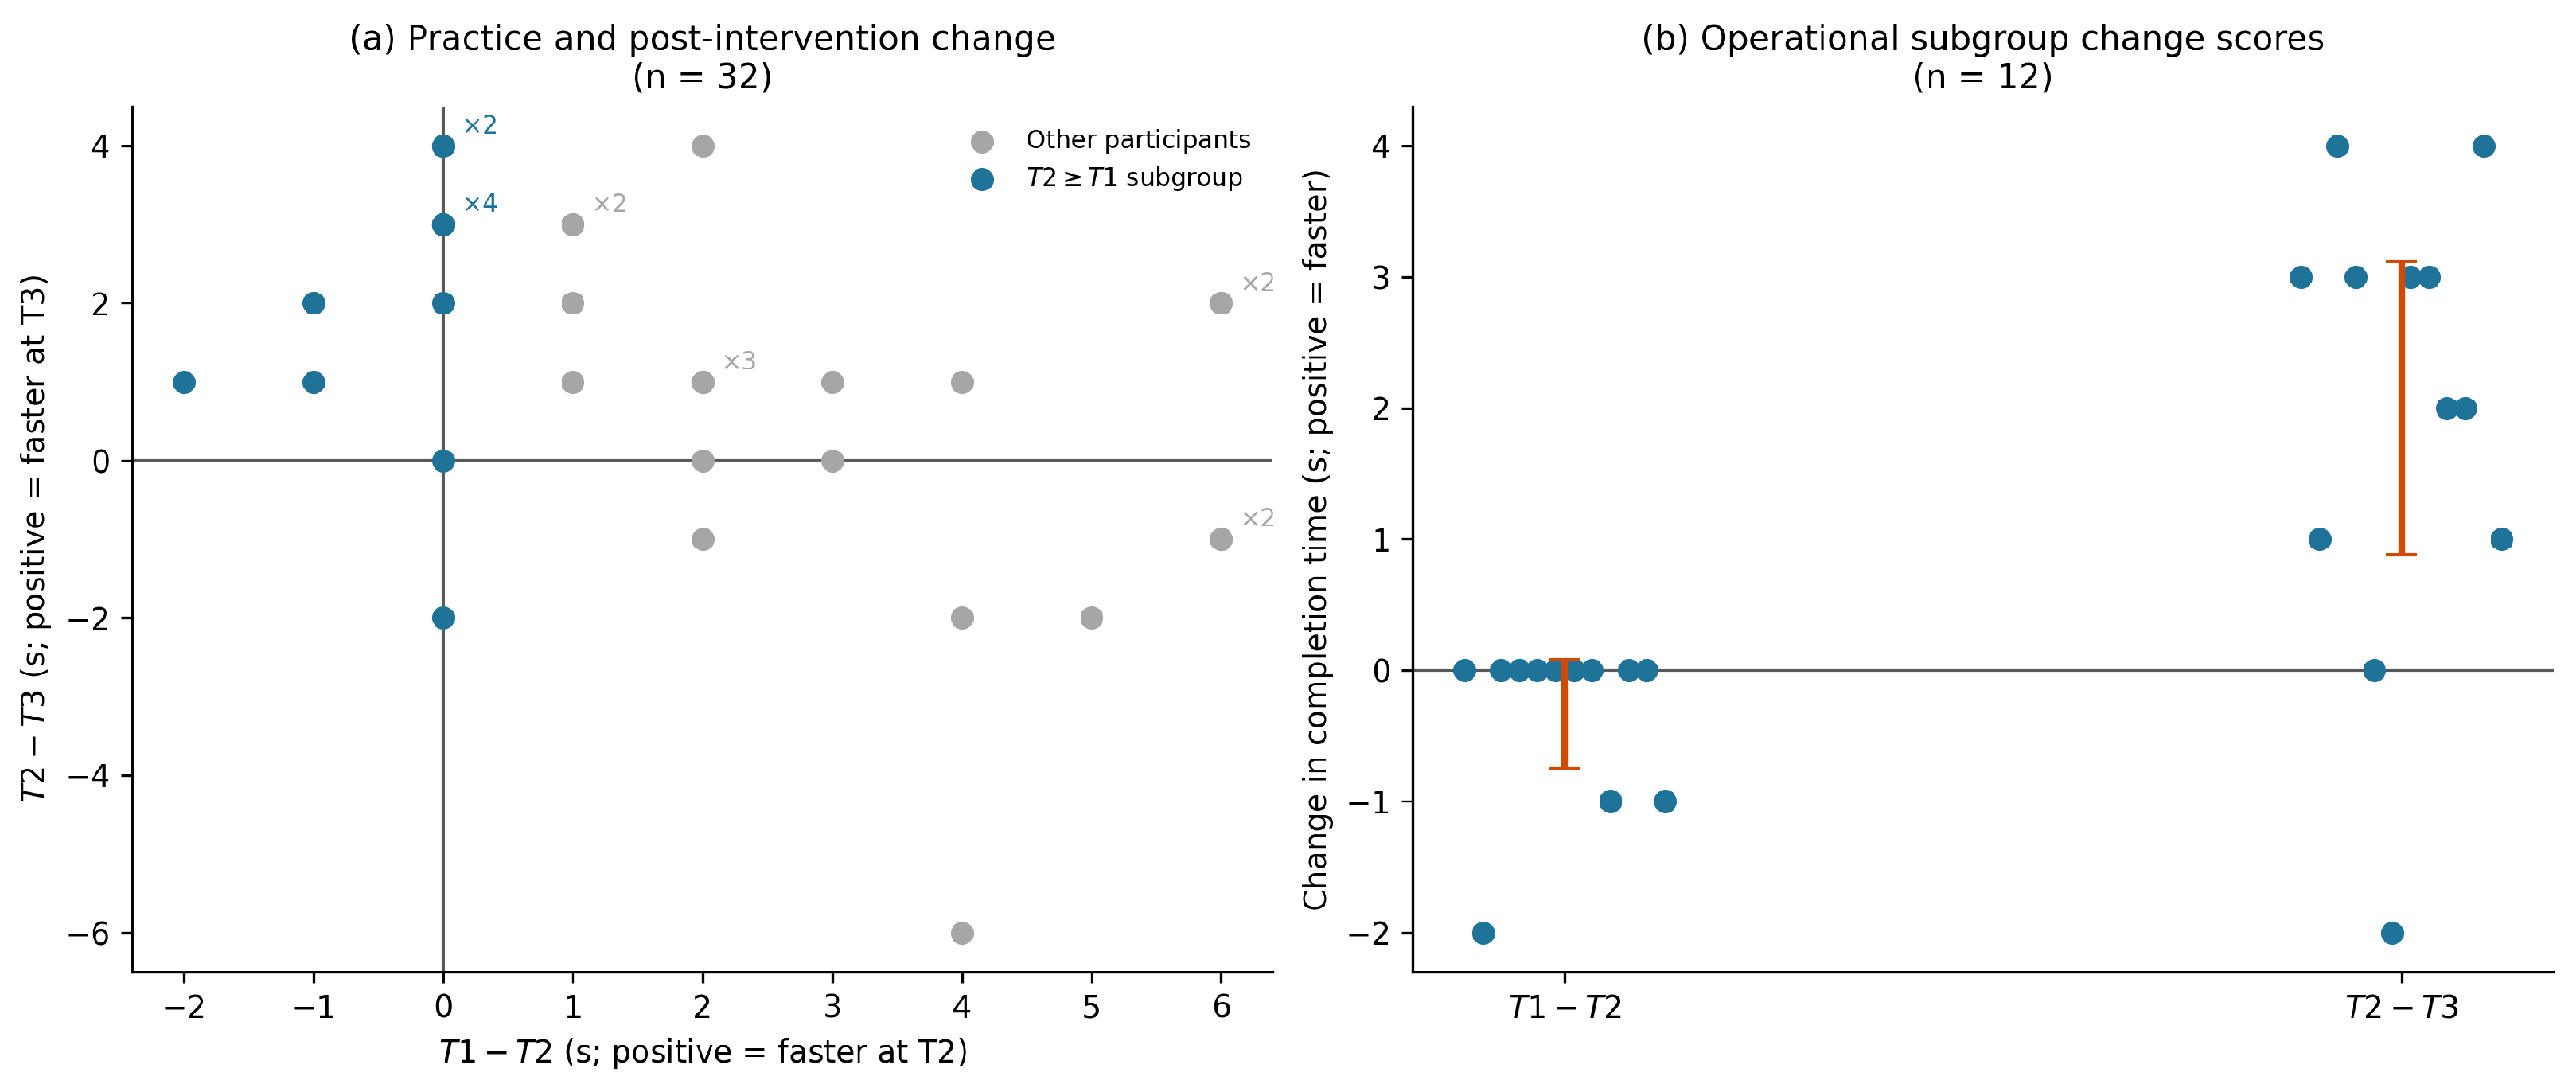
As an additional descriptive analysis, Figure 8 shows individual change scores. Figure 8a shows the correspondence between the pre-intervention change score (T1 − T2) and the post-intervention change score (T2 − T3) among all participants. For both change scores, positive values represent shorter completion times at the later time point. The exploratory subgroup was defined solely by the pre-intervention criterion , without reference to the value at T3. Figure 8b shows T2–T3 change scores in this subgroup. Completion time at T3 was shorter than at T2 in 10 of the 12 participants, unchanged in one participant, and longer in one participant. The mean reduction was 2.00 s; the conventional 95% confidence interval for the mean change score was [0.88, 3.12] s, and the bootstrap 95% confidence interval was [1.00, 2.92] s.
Figure 8.
Individual change-score patterns. (a) Relation between the pre-intervention change score (T1 − T2) and the post-intervention change score (T2 − T3) in all participants (). Positive values indicate shorter completion time at the later time point. The exploratory subgroup was defined using the pre-intervention criterion only; the remaining participants are shown separately in the plot. The solid gray horizontal and vertical lines indicate zero change on the respective axes. Labels next to coincident markers indicate the number of overlapping observations within the corresponding group. (b) Pre-intervention (T1 − T2) and post-intervention (T2 − T3) change scores in this exploratory subgroup (). Points represent individual participants, and the orange error bars indicate the mean and its conventional 95% confidence interval for each change score. Horizontal offsets are used only to separate points in panel (b) and do not change the measured values. The solid gray horizontal line indicates zero change. Positive values indicate shorter completion time at the later time point.
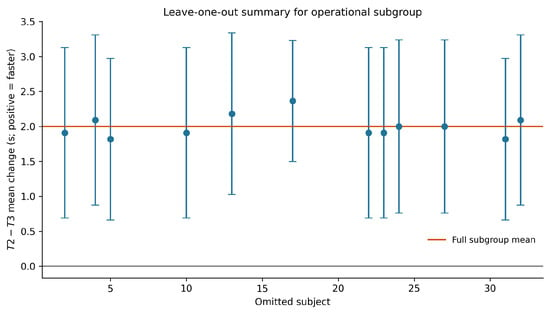
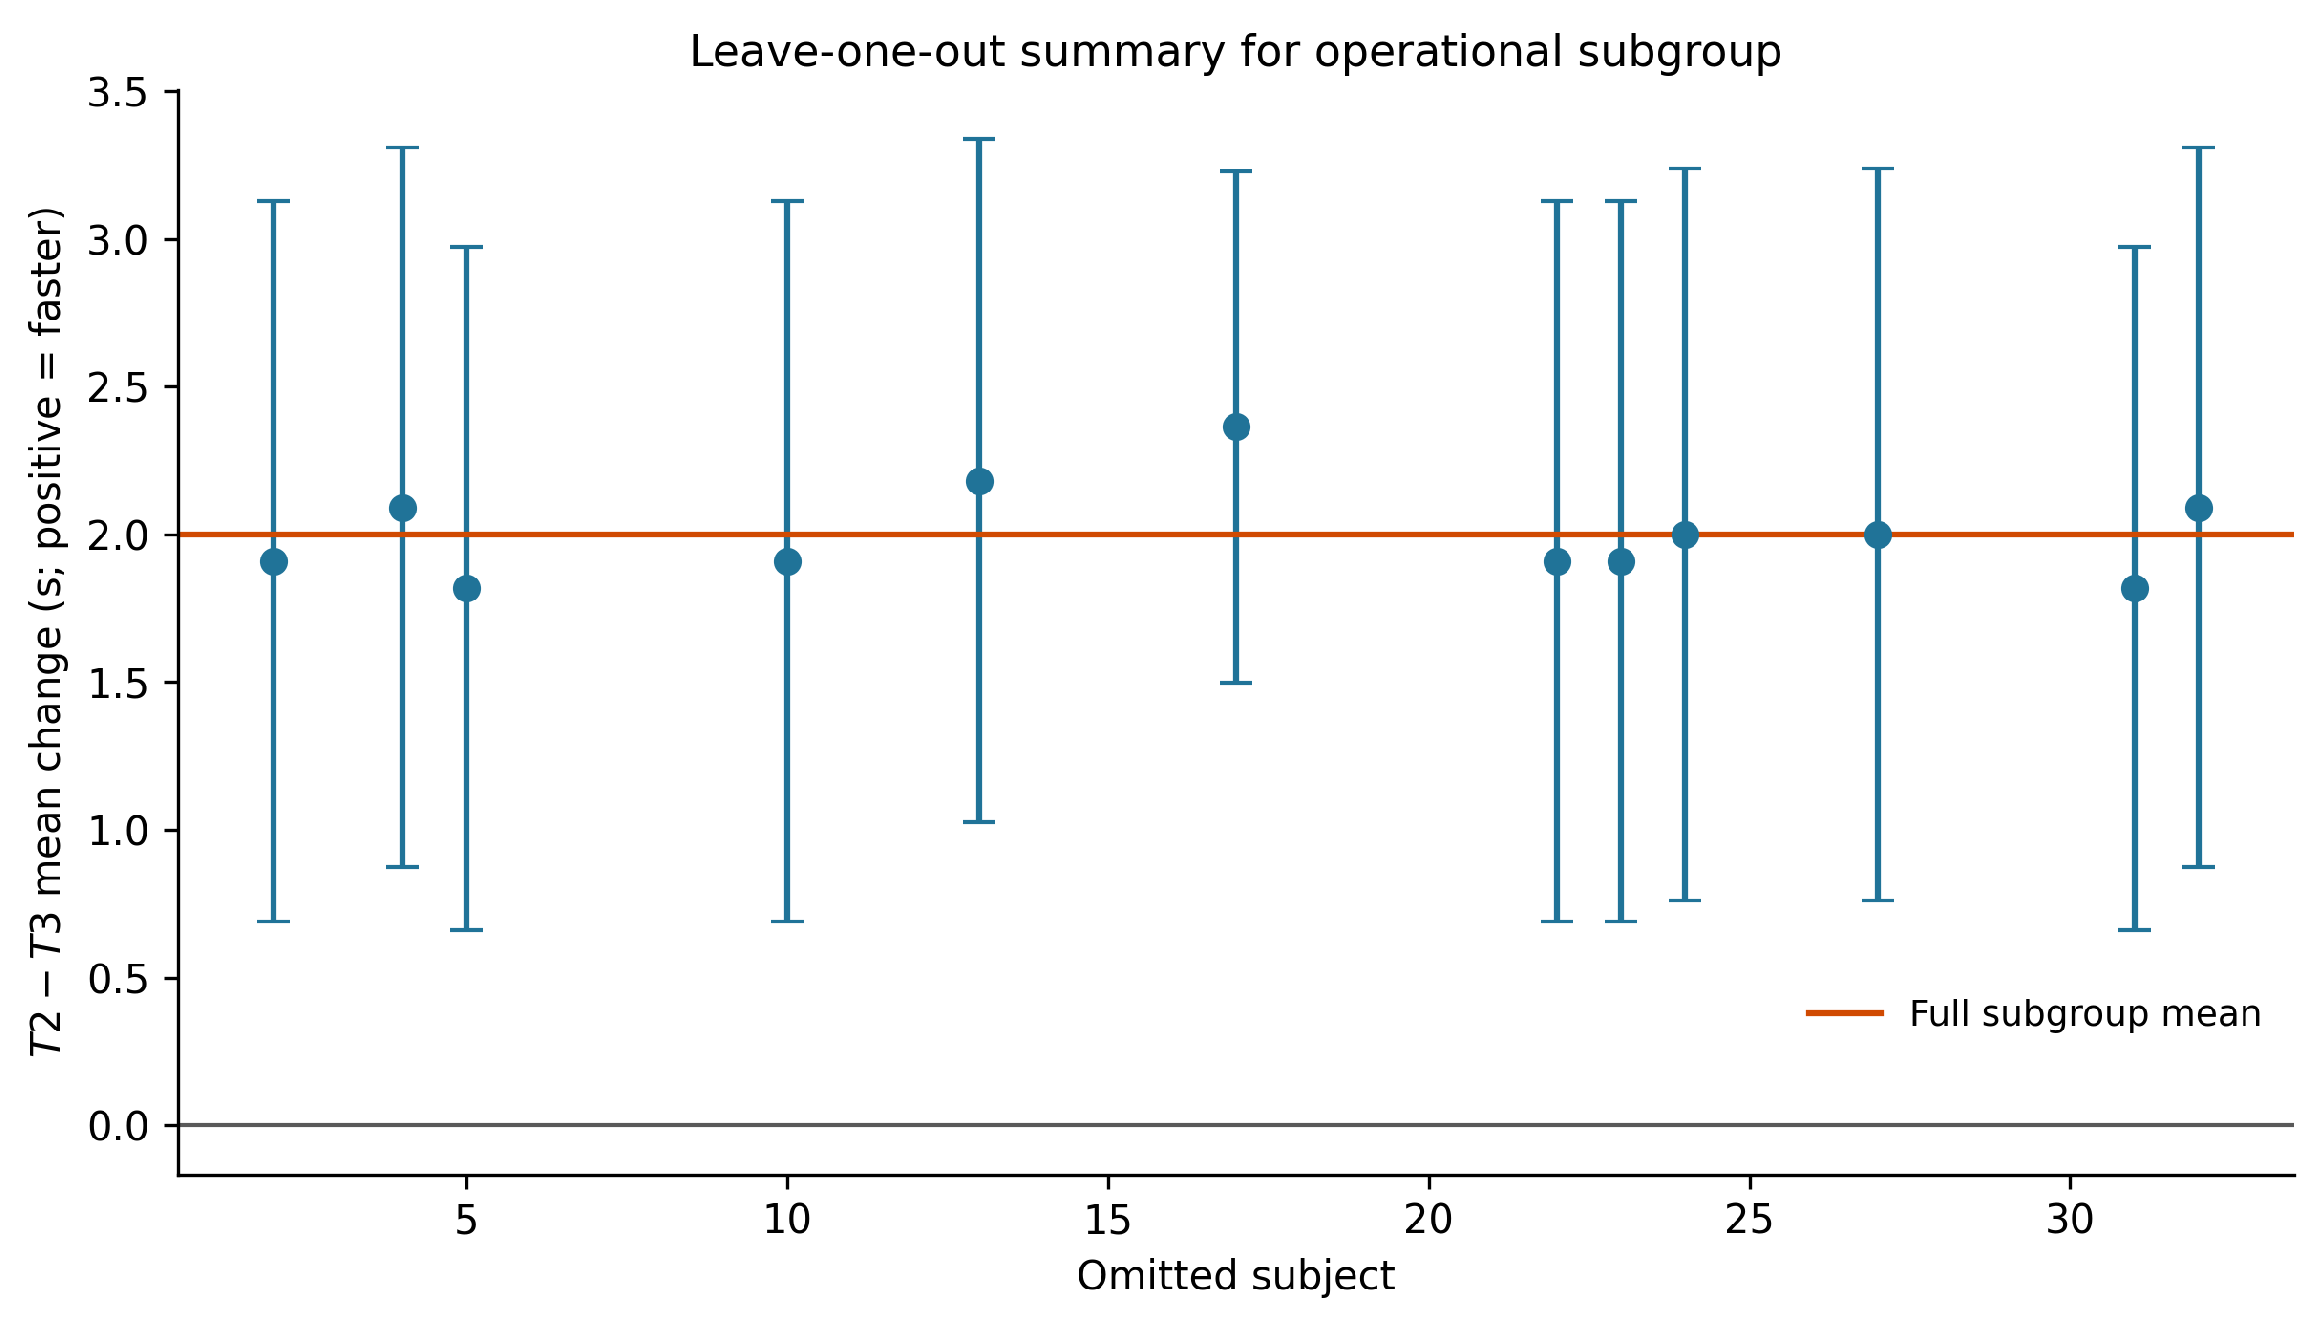
Figure 9 shows exploratory recalculations excluding one participant at a time. Across the 12 recalculations, the mean reductions ranged from 1.82 to 2.36 s, and the lower bounds of the respective conventional 95% confidence intervals ranged from 0.66 to 1.50 s. Thus, the T2–T3 shortening pattern observed in this sample was not dependent on a single extreme value. However, these recalculations are exploratory checks describing dependence on outliers and do not demonstrate a causal effect of tactile stimulation.
Figure 9.
Leave-one-out recalculations of the T2 − T3 reduction in the exploratory subgroup (). Each point represents the mean reduction when one participant is excluded, and error bars indicate conventional 95% confidence intervals. The solid orange horizontal line indicates the mean reduction for all 12 participants (2.00 s).
These individual-level visualizations and recalculations transparently show the distribution of changes observed within the exploratory subgroup. They do not identify a validated responder profile or demonstrate a causal reduction in completion time due to tactile stimulation.
These results indicate that, in the participants who showed no decrease in completion time from pre-intervention repetition alone, the completion time decreased after the tactile stimulation. Furthermore, the completion time at T3 was significantly shorter than at T1. This indicates that the decrease at T3 was not merely a return of the value that had temporarily worsened at T2 to the T1 level, but that the participants reached a performance level shorter than at the first trial. However, the fact that T3 was shorter than T1 cannot be interpreted as completely ruling out the possibility that practice effects and regression to the mean contributed simultaneously.
Note that, prior to this experiment, the participants had undergone practice to become familiar with the task, and they further performed the two trials T1 and T2. This subgroup, whose completion time did not decrease from T1 to T2, consists of participants whose completion time did not decrease even through these repetitions (indeed, in this subgroup the completion time slightly increased from T1 to T2). This analysis is based on the assumption that a substantial practice effect from task repetition was unlikely to have newly emerged at T3; however, it should be noted that delayed practice effects or measurement variability at T3 cannot be completely ruled out.
Table 6 presents exploratory sensitivity analyses using alternative criteria defined only from T1 and T2, without using T3 results. The primary criterion, , is a pre-intervention operational criterion set in correspondence with Hypothesis 2. In contrast, the other alternative criteria are post hoc exploratory analyses added during revision. Although the direction of T2–T3 shortening was generally consistent across multiple criteria, the criterion had a small sample size (), and its conventional 95% confidence interval included zero. Therefore, this table does not demonstrate a confirmatory subgroup effect and should be interpreted as hypothesis-generating results to be tested in future controlled studies.
Table 6.
Exploratory sensitivity analyses using alternative subgroup criteria defined from T1 and T2 only. A positive mean reduction indicates that completion time at T3 was shorter than that at T2.
5.3. Summary of Results
The main results are as follows. First, a decrease in completion time with the progression of trials was observed in all participants. However, a comparable decrease also occurred between the two pre-intervention no-stimulation trials (T1 → T2), and the post-intervention decrease (T2 → T3) did not significantly exceed this practice-based decrease. Therefore, it was difficult to claim an effect specific to the tactile stimulation from the average change across all participants alone. In addition, neither the main effect of the stimulation-rate condition nor its interaction with time point was found, and the Bayes factor strongly supported the model without a condition difference (interaction ). Therefore, within the range of this experiment, we obtained positive evidence for the absence of a condition difference due to the stimulation-rate condition. However, we do not conclude from this supplementary model comparison that the two stimulation-rate conditions are practically equivalent or that stimulation rate has no effect in general.
Second, in the subgroup for which no decrease in completion time was observed between the two pre-intervention trials, a decrease in completion time was observed after the tactile stimulation, and the post-intervention completion time was shorter not only than T2 but also than T1. Because these are participants who did not improve even through the preceding familiarization practice and T1 and T2, it may be difficult to explain this decrease solely by the persistence of a practice effect. However, this subgroup analysis is exploratory, and the absence of a control condition prevents us from distinguishing the contributions of delayed practice effects, expectancy effects, arousal, or regression to the mean.
In summary, although this study could not demonstrate a consistent stimulation effect across all participants, it showed that, in participants with little practice-based improvement, the pegboard-task completion time may decrease. This result is a preliminary finding in an exploratory subgroup and does not confirm the causal efficacy of tactile stimulation for these participants.
6. Discussion
From the results for all participants, a decrease in completion time occurred across the trials, but this decrease cannot be attributed to the tactile stimulation from the analysis of all participants alone. This is because a substantial decrease also occurred between T1 and T2, when no stimulation was presented. In addition, strong evidence was obtained that the stimulation-rate condition examined in this study does not modulate completion time (interaction ). This is not merely a failure to detect a significant difference, but a result that positively supports the absence of a condition difference, and it has implications for both theory and design. Several explanations are possible. The two rates compared (3 pulses/10 s and 11 pulses/10 s) may lie on the same side of the threshold governing the relevant peripheral input, so that there is no graded effect within this range. Second, the relevant mechanism may be insensitive to rate in this region. As a design implication, this suggests that the stimulation rate—a smartwatch parameter that is easy to adjust—may not be an effective lever for pre-task support of fine motor performance within this range of presentation time. However, we do not conclude from this model comparison that the two conditions are practically equivalent or that stimulation rate has no effect.
Participants who did not improve through pre-intervention task repetition decreased their completion time after the tactile stimulation. This subgroup was defined, in accordance with Hypothesis 2, using only the two pre-intervention trials, and was not selected post hoc on the basis of post-intervention performance. The results of this study can be interpreted as follows. First, this subgroup consists of participants whose completion time did not decrease even after the preceding familiarization practice and the two trials T1 and T2, so it is possible that the shortening was not the result of a substantial practice effect from task repetition newly emerging at T3. In addition, the fact that T3 was significantly shorter than not only T2 but also T1 may indicate that it was not merely a return of a temporarily slowed T2 value to the T1 level. However, this finding is interpreted as a preliminary and exploratory observation. Effects related to selection based on T1 and T2, regression to the mean, or delayed practice effects cannot be ruled out.
Because identifying the mechanism of this method is beyond the scope of this study, we limit ourselves to listing candidates. First is sensorimotor priming (a change in the excitability of the sensorimotor system). Prior work has reported that mechanical tactile stimulation to the fingers modulates corticospinal excitability [4]. Separately, somatosensory electrical stimulation has been associated with changes in motor-skill learning and sensorimotor activity and connectivity [34]. These findings motivate sensorimotor priming as a candidate hypothesis, but do not establish the mechanism of the present wrist-pulse protocol. Second is attention or arousal. The tactile stimulation may have raised arousal or attention before the task and affected execution speed independently of the sensorimotor pathway. Regarding changes in subjective elapsed time, because there was no difference between conditions with different numbers of tactile vibrations, we consider that there was no difference in the present setting; however, we do not claim that changes in time perception caused by other methods could make no contribution at all.
7. Limitation
In this study, one pegboard set was administered at each measurement point. Therefore, compared with a design using multiple sets, the possibility cannot be excluded that between-set variability associated with task performance was not sufficiently reduced. On the other hand, each set involved multiple consecutive actions and the score was not calculated from a single action alone. In addition, compared with a design that increases the number of sets, we considered it meaningful to avoid negative factors associated with the increased duration of the experiment, such as fatigue and reduced concentration. This consideration led to the adoption of the present design. Standardized protocols and prior studies provide examples in which one timed pegboard set is administered after familiarization. Accordingly, the results of this study are interpreted as exploratory, and future work will consider studies using multiple sets with an expanded number of participants.
The present study has limitations related to the participant population. The results observed in this study cannot be directly generalized to older adults, people with neurological or motor-function impairments, people with different cultural backgrounds, people with highly skilled manual work experience, or actual occupational manual-work settings. Accordingly, the findings of this study should be interpreted as observations shown on a pegboard task by the participant characteristics represented in this experiment. In the future, generalizability should be examined across diverse participant characteristics and tasks.
The subgroup sample size of 12 is a limitation. This analysis is considered supplementary and exploratory. Although there are examples of prior studies with approximately 12 participants, and the present sample size is therefore not markedly discrepant from prior research, such examples do not completely resolve the uncertainty associated with estimation from a small sample. We consider that the present study provides a minimum level of results; however, it does not establish effectiveness in the general population, stable responder characteristics, or a causal intervention effect. To obtain more confirmatory results, replication through a controlled study in a larger, independent, newly recruited sample, with preregistered subgroup criteria, is necessary.
There is a limitation in excluding the influence of participants’ potential practice effects. The absence of an observed reduction in completion time from T1 to T2 indicates only that no immediate repetition-related reduction was observed between the two consecutive unstimulated timed sets in this session. Because the subgroup was defined as participants satisfying , the absence of participants with a T1–T2 reduction among these 12 participants is itself an observation incorporated into this operational criterion and is not independent proof that the underlying practice effect was truly zero. In this study, participants completed familiarization practice before the measurements, and two unstimulated timed sets were administered before the intervention. However, these two baseline sets alone cannot exclude practice effects that emerge at a later time point, within-participant measurement variability, or natural changes associated with performing the task for a third time. It is not possible to prove from a finite number of measurements that delayed practice effects will not occur at any future time point; the same logical limitation would remain even if the number of sets were increased to 10. Accordingly, this study does not demonstrate that practice effects are absent in the long term or permanently. Comparisons with unstimulated or sham-stimulation control conditions remain a topic for future work.
There is a limitation in that the possibility that the findings reflect regression to the mean (RTM) or measurement variability cannot be completely excluded. We took feasible measures, including familiarization practice before baseline measurement. In addition, because there was no significant difference between T1 and T2, we considered it unlikely that many participants had suddenly become slower than their average level at T2. Nevertheless, the possibility that the findings reflect RTM or measurement variability has not been completely excluded. Future studies need to examine this issue through replication in an independent sample, incorporating repeated baseline measurements and concurrent controls.
There is a limitation in that expectancy effects and novelty-related arousal cannot be completely excluded. We took feasible precautions: participants wore the device during the familiarization phase and during the T1 and T2 phases. Therefore, we considered it unlikely that expectancy effects or novelty-related arousal would not emerge between T1 and T2 but would emerge between T2 and T3. However, this possibility cannot be completely ruled out. Designing a sham condition that delivers vibration while ensuring that it has no effect is also difficult, and such a condition was not implemented. Future studies should address this issue, for example, by recruiting a larger sample and including an appropriate sham condition.
The absence of a sham condition is a limitation of this study. In the context of testing the present hypothesis, it is practically difficult to create a fully sham condition while still delivering vibration. Therefore, observing the change between two sets while participants wore the device but received no vibration was considered the closest approximation to a sham condition in this study. This procedure was implemented during familiarization and in the T1–T2 interval. Assuming that sham-related expectancy or arousal effects would produce changes in performance in the T1–T2 interval, we considered the priority of including an unstimulated sham condition among the participants who remained in the target group to be low for examining the possibility that expectancy or arousal effects might emerge later in the T2–T3 interval. In addition, because the limitation remains that the absence of delayed practice effects cannot be demonstrated regardless of the number of sets, we considered the priority of including an unstimulated sham condition among the participants who remained in the target group to be low for examining the possibility that performance improvement might emerge later in the T2–T3 interval. However, future studies need to include an unstimulated or sham-stimulation control condition corresponding to the T2–T3 interval to rule out the above possibilities as far as possible.
The present study may not have identified the optimal stimulation parameters. The purpose of this study was to explore whether low-pulse-rate, clearly perceptible, intermittent wrist stimulation may be associated with the completion time of a subsequent manual task. From this perspective, the stimulation parameters were set appropriately. Within this framework, 3 pulses/10 s and 11 pulses/10 s were exploratory sampling conditions selected on the basis of a prior wrist-worn tactile-pulse protocol and a perceptible implementation range. They do not establish optimal values for manual dexterity, and demonstrating superiority between these two conditions is not a claim of this study. For example, the two-minute intervention was set as a more practical pre-task intervention than 20 min of stimulation and as a duration longer than that used in a related 30-s study; however, it does not establish the optimal duration. A comprehensive investigation combining multiple parameter dimensions, including stimulation intensity, actuator placement, pulse width, intervention duration, waveform, and number of stimuli, would involve an enormous number of combinations. The present study therefore examined a limited range, and such comprehensive investigation remains a topic for future work. In addition, the same drive settings were used for all participants, and it was confirmed that the vibration could be perceived. However, actual acceleration, intensity at the skin, contact pressure, and band tension were not measured, and we do not claim that the physical stimulation dose was uniform.
The present study is limited in that it did not elucidate the mechanism by which stimulation influences manual dexterity. The current study evaluates behavioral effects rather than elucidating mechanisms of action. In discussing possible mechanisms, we cited sensorimotor priming, based on prior research, as the possibility that peripheral tactile input from the wrist may temporarily alter the state or excitability of the sensorimotor system and influence subsequent motor performance. In addition, we tested two stimulation rates that differed in their effects on perceived elapsed time. Because no difference was observed between the rates, we assumed that the effect observed in this experiment was not due to perceived elapsed time. This point remains an untested candidate mechanism. On the other hand, elucidating neural mechanisms of this kind is, as in prior studies, positioned as a topic for future work in the present research. In the future, physiological sensor-based evaluations will be needed to investigate the mechanisms and the factors that cause some participants to respond whereas others do not.
The system information that can be reported in this study does not claim or guarantee that this prototype is ready to be made into a product, that it can be implemented on all commercially available smartwatches, or that it is equivalent to such devices; this is a limitation. The present study is limited to the same general claim made in typical research papers, namely that it may be feasible as a wrist-worn device. For example, we did not measure the delay from a control command to an actuator until the actual onset of vibration; actual pulse width and control jitter; measured synchronization accuracy between motors; amplitude or acceleration at the skin; contact pressure; actual current; power consumption; battery operating time; the total device weight; acoustics; heat generation; or comfort. In addition, this study did not compare the temporal accuracy of pulses, physical vibration output, power consumption, wearing comfort, or behavioral effects between the prototype and any specific commercially available smartwatch. Future work needs to evaluate the above physical characteristics, electrical characteristics, and comfort for candidate commercially available devices and wristband-type prototypes.
In addition, the stimulation-count conditions (3 pulses/10 s or 11 pulses/10 s) were assigned between participants. Although this was considered an appropriate choice for the present task, differences between stimulation-count conditions may include, in addition to the effects of the stimulation patterns themselves, differences between individual participants, such as baseline speed, perceived vibration, fatigue, and attentional state. Future research should also include designs that compare stimulation-count conditions within participants. The present study provided evidence supporting the absence of a difference in completion time between the 3-pulse/10-s and 11-pulse/10-s conditions examined. However, this does not establish that the two conditions are equivalent in all respects or that stimulation rate has no effect on task performance across other stimulation rates.
For the pegboard task, only completion time was measured, and other measures, such as error rate and movement quality, were not measured; this is a limitation. Because the present study used completion time in accordance with prior research, we consider that a minimum level of investigation was conducted. However, because faster performance does not necessarily indicate improved dexterity, other measures could enable a richer interpretation. In the future, it will be necessary to investigate dexterity using multiple measures by establishing methods and criteria for measures other than speed during task performance, for example, through visual inspection of video recordings.
8. Future Work
From a system perspective, the method could be implemented using only the vibration element of an existing smartwatch. Moreover, because the proposed method can be implemented with inexpensive vibration elements, it could also be implemented as a dedicated low-cost device. It could also be implemented on devices of a different form factor, such as a smartphone (though not worn on the wrist). In addition, a just-in-time intervention could be envisioned in which sensors such as accelerometers and electromyography detect the start of manual work and automatically present stimulation immediately beforehand. Furthermore, combining the method with other low-burden preparatory techniques, such as audiovisual stimulation, could enhance its effect. There is room to explore such directions for system development.
Although this study manipulated a single dimension—the stimulation rate—the design space of tactile stimulation is broader. In the future, a direction toward more effective stimulation design could be pursued through examining the effects of changing the perceived intensity or waveform pattern, examining cumulative effects from longer presentation times or repeated presentation across days, and individual optimization that adjusts the stimulation parameters best suited to each user. The fact that effects have been reported to change with different stimulation patterns [4] suggests that exploring this design space is promising.
As an academic development, it could be examined whether the method can be applied to promote or accelerate the acquisition of manual skills. In addition, how the effect of tactile stimulation interacts with the user’s state—such as fatigue, attention, and stress—is also an important issue to examine. These represent directions for developing the framework of this study from a one-shot pre-task intervention toward a broader context of motor support and learning support.
9. Conclusions
This study exploratorily examined the relationship between short repetitive tactile stimulation delivered by a wrist-worn prototype and subsequent pegboard-task completion time in a single-session experiment involving 32 participants. As an empirical finding, the average change among all participants did not confirm a tactile-stimulation intervention effect that significantly exceeded the practice effect associated with prior task repetition, nor did it confirm a difference between the stimulation-count conditions (3 pulses/10 s and 11 pulses/10 s). In contrast, in an exploratory subgroup of 12 participants defined using an operational criterion based only on the two pre-intervention unstimulated measurements, a completion-time-shortening pattern was observed after real stimulation. However, because no sham-stimulation condition was included, the shortening observed in this subgroup cannot be attributed to a causal effect of tactile stimulation. Accordingly, this study does not establish that DexPulse provides consistent effectiveness across all users or diverse manual tasks. The most limited and exploratory finding of this study is that a completion-time-shortening pattern was observed after real stimulation in 12 participants defined using a criterion based only on the two pre-intervention unstimulated measurements. This finding is a hypothesis-generating observation suggesting a possible relationship between a state in which natural shortening is not observed through a short repetition of the task and change after stimulation. As a design implication, this study indicates that short wrist tactile pulses can be considered as a candidate for a low-burden pre-task intervention. In the future, this study will contribute to the design of wearable computers that support manual work briefly and with low burden using wrist-worn devices suitable for everyday use.
Author Contributions
Conceptualization, K.S., K.F. and K.M.; methodology, K.S. and K.F.; software, K.S.; validation, K.S. and K.F.; formal analysis, K.S. and K.F.; investigation, K.S. and K.F.; resources, K.S. and K.F.; data curation, K.S. and K.F.; writing—original draft preparation, K.S. and K.F.; writing—review and editing, K.S. and K.F.; visualization, K.S. and K.F.; supervision, K.F. and K.M.; project administration, K.F.; funding acquisition, K.F. All authors have read and agreed to the published version of the manuscript.
Funding
This research was supported by JSPS (Japan Society for the Promotion of Science) KAKENHI (grant number JP24K20824).
Institutional Review Board Statement
The study was conducted according to the guidelines of the Declaration of Helsinki. This study was approved by the Ethics Review Committee of Ritsumeikan University (BKC-LSMH-2023-045).
Informed Consent Statement
Informed consent was obtained from all subjects involved in the study.
Data Availability Statement
The participant-level data are not publicly available due to privacy or ethical restrictions.
Conflicts of Interest
The authors declare no conflict of interest.
References
- Wang, Y.-C.; Magasi, S.R.; Bohannon, R.W.; Reuben, D.B.; McCreath, H.E.; Bubela, D.J.; Gershon, R.C.; Rymer, W.Z. Assessing dexterity function: A comparison of two alternatives for the NIH Toolbox. J. Hand Ther. 2011, 24, 313–321. [Google Scholar] [CrossRef] [Scilit] [PubMed]
- Lawson, I.J. Purdue Pegboard Test. Occup. Med. 2019, 69, 376–377. [Google Scholar] [CrossRef] [Scilit]
- Tolle, K.A.; Rahman-Filipiak, A.M.; Hale, A.C.; Kitchen Andren, K.A.; Spencer, R.J. Grooved Pegboard Test as a measure of executive functioning. Appl. Neuropsychol. Adult 2020, 27, 414–420. [Google Scholar] [CrossRef] [Scilit] [PubMed]
- Kojima, S.; Miyaguchi, S.; Sasaki, R.; Tsuiki, S.; Saito, K.; Inukai, Y.; Otsuru, N.; Onishi, H. The effects of mechanical tactile stimulation on corticospinal excitability and motor function depend on pin protrusion patterns. Sci. Rep. 2019, 9, 16677. [Google Scholar] [CrossRef] [Scilit] [PubMed]
- Kalisch, T.; Tegenthoff, M.; Dinse, H.R. Repetitive electric stimulation elicits enduring improvement of sensorimotor performance in seniors. Neural Plast. 2010, 2010, 690531. [Google Scholar] [CrossRef] [Scilit] [PubMed]
- Kowalewski, R.; Kattenstroth, J.C.; Kalisch, T.; Dinse, H.R. Improved acuity and dexterity but unchanged touch and pain thresholds following repetitive sensory stimulation of the fingers. Neural Plast. 2012, 2012, 974504. [Google Scholar] [CrossRef] [Scilit] [PubMed]
- Nobusako, S.; Osumi, M.; Matsuo, A.; Furukawa, E.; Maeda, T.; Shimada, S.; Nakai, A.; Morioka, S. Subthreshold Vibrotactile Noise Stimulation Immediately Improves Manual Dexterity in a Child with Developmental Coordination Disorder: A Single-Case Study. Front. Neurol. 2019, 10, 717. [Google Scholar] [CrossRef] [Scilit] [PubMed]
- Nobusako, S.; Osumi, M.; Matsuo, A.; Furukawa, E.; Maeda, T.; Shimada, S.; Nakai, A.; Morioka, S. Influence of Stochastic Resonance on Manual Dexterity in Children with Developmental Coordination Disorder: A Double-Blind Interventional Study. Front. Neurol. 2021, 12, 626608. [Google Scholar] [CrossRef] [Scilit] [PubMed]
- Shirai, K.; Futami, K.; Murao, K. A Method to Manipulate Subjective Time by Using Tactile Stimuli of Wearable Device. In Proceedings of the 2021 International Symposium on Wearable Computers, Virtual Event, 21–26 September 2021; pp. 63–67. [Google Scholar] [CrossRef] [Scilit]
- Costa, J.; Guimbretière, F.; Jung, M.F.; Choudhury, T. BoostMeUp: Improving Cognitive Performance in the Moment by Unobtrusively Regulating Emotions with a Smartwatch. Proc. ACM Interact. Mob. Wearable Ubiquitous Technol. 2019, 3, 40. [Google Scholar] [CrossRef] [Scilit]
- Whitmore, N.W.; Chan, S.; Zhang, J.; Chwalek, P.; Chin, S.; Maes, P. Improving Attention Using Wearables via Haptic and Multimodal Rhythmic Stimuli. In Proceedings of the CHI Conference on Human Factors in Computing Systems; Association for Computing Machinery (ACM): New York, NY, USA, 2024; Article 80; pp. 1–14. [Google Scholar] [CrossRef] [Scilit]
- Choi, K.Y.; Ishii, H. AmbienBeat: Wrist-worn Mobile Tactile Biofeedback for Heart Rate Rhythmic Regulation. In Proceedings of the Fourteenth International Conference on Tangible, Embedded, and Embodied Interaction, Sydney, Australia, 9–12 February 2020; pp. 17–30. [Google Scholar] [CrossRef] [Scilit]
- Macerollo, A.; Palmer, C.; Foltynie, T.; Korlipara, P.; Limousin, P.; Edwards, M.; Kilner, J.M. High-frequency peripheral vibration decreases completion time on a number of motor tasks. Eur. J. Neurosci. 2018, 48, 1789–1802. [Google Scholar] [CrossRef] [Scilit] [PubMed]
- Seo, N.J.; Woodbury, M.L.; Bonilha, L.; Ramakrishnan, V.; Kautz, S.A.; Downey, R.J.; Dellenbach, B.H.S.; Lauer, A.W.; Roark, C.M.; Landers, L.E.; et al. TheraBracelet stimulation during task-practice therapy to improve upper extremity function after stroke: A pilot randomized controlled study. Phys. Ther. 2019, 99, 319–328. [Google Scholar] [CrossRef] [Scilit] [PubMed]
- Pennington, A.; Ramakrishnan, V.; Scronce, G.; Coupland, K.; Vatinno, A.A.; Seo, N.J. Effect of Using TheraBracelet on Grasping versus Reaching in Poststroke Rehabilitation. OTJR Occup. Ther. J. Res. 2023, 43, 702–709. [Google Scholar] [CrossRef] [Scilit] [PubMed]
- Seo, N.J.; Brinkhoff, M.; Fredendall, S.; Coker-Bolt, P.; McGloon, K.; Humanitzki, E. The Use of TheraBracelet Upper Extremity Vibrotactile Stimulation in a Child with Cerebral Palsy—A Case Report. Electronics 2024, 13, 3147. [Google Scholar] [CrossRef] [Scilit] [PubMed]
- Seim, C.E.; Ritter, B.; Starner, T.E.; Flavin, K.; Lansberg, M.G.; Okamura, A.M. Design of a Wearable Vibrotactile Stimulation Device for Individuals with Upper-Limb Hemiparesis and Spasticity. IEEE Trans. Neural Syst. Rehabil. Eng. 2022, 30, 1277–1287. [Google Scholar] [CrossRef] [Scilit] [PubMed]
- Seim, C.; Chen, B.; Han, C.; Vacek, D.; Lowber, A.; Lansberg, M.; Okamura, A.M. Daily Vibrotactile Stimulation Exhibits Equal or Greater Spasticity Relief Than Botulinum Toxin in Stroke. Arch. Phys. Med. Rehabil. 2023, 104, 1565–1572. [Google Scholar] [CrossRef] [Scilit] [PubMed]
- Awaji, A.; Fuchigami, T.; Ogata, R.; Morioka, S. Effects of Vibration-Based Generation of Timing of Tactile Perception on Upper Limb Function After Stroke: A Case Study. Cureus 2023, 15, e50855. [Google Scholar] [CrossRef] [Scilit] [PubMed]
- Du, Q.; Luo, J.; Cheng, Q.; Wang, Y.; Guo, S. Vibrotactile Enhancement in Hand Rehabilitation Has a Reinforcing Effect on Sensorimotor Brain Activities. Front. Neurosci. 2022, 16, 935827. [Google Scholar] [CrossRef] [Scilit] [PubMed]
- Kourtesis, P.; Argelaguet, F.; Vizcay, S.; Marchal, M.; Pacchierotti, C. Electrotactile Feedback Applications for Hand and Arm Interactions: A Systematic Review, Meta-Analysis, and Future Directions. IEEE Trans. Haptics 2022, 15, 479–496. [Google Scholar] [CrossRef] [Scilit] [PubMed]
- Dingler, T.; Tag, B.; Karapanos, E.; Kise, K.; Dengel, A. Workshop on Detection and Design for Cognitive Biases in People and Computing Systems. In Proceedings of the Extended Abstracts of the 2020 CHI Conference on Human Factors in Computing Systems, Honolulu, HI, USA, 25–30 April 2020; pp. 1–6. [Google Scholar] [CrossRef] [Scilit]
- Adams, A.T.; Costa, J.; Jung, M.F.; Choudhury, T. Mindless computing: Designing technologies to subtly influence behavior. In Proceedings of the 2015 ACM International Joint Conference on Pervasive and Ubiquitous Computing, Osaka, Japan, 7–11 September 2015; pp. 719–730. [Google Scholar] [CrossRef] [Scilit] [PubMed]
- Shirai, K.; Futami, K.; Murao, K. Exploring Tactile Stimuli from a Wrist-Worn Device to Manipulate Subjective Time Based on the Filled-Duration Illusion. Sensors 2022, 22, 7194. [Google Scholar] [CrossRef] [Scilit] [PubMed]
- Kim, E.; Schneider, O. Defining haptic experience: Foundations for understanding, communicating, and evaluating HX. In Proceedings of the 2020 CHI Conference on Human Factors in Computing Systems, Honolulu, HI, USA, 25–30 April 2020; pp. 1–13. [Google Scholar]
- Wersényi, G. Perception Accuracy of a Multi-Channel Tactile Feedback System for Assistive Technology. Sensors 2022, 22, 8962. [Google Scholar] [CrossRef] [Scilit] [PubMed]
- Terenti, M.; Vatavu, R.D. Measuring the User Experience of Vibrotactile Feedback on the Finger, Wrist, and Forearm for Touch Input on Large Displays. In Proceedings of the CHI Conference on Human Factors in Computing Systems Extended Abstracts, New Orleans, LA, USA, 29 April–5 May 2022; pp. 1–7. [Google Scholar] [CrossRef] [Scilit]
- Terenti, M.; Pamparău, C.; Vatavu, R.D. The User Experience of Distal Arm-Level Vibrotactile Feedback for Interactions with Virtual versus Physical Displays. Virtual Real. 2024, 28, 84. [Google Scholar] [CrossRef] [Scilit]
- Terenti, M.; Vatavu, R.D. Wear + Touch: An Exploration of Wearables for Vibrotactile Feedback During Touchscreen Input. Int. J. Hum.-Comput. Interact. 2025, 41, 5973–5991. [Google Scholar] [CrossRef] [Scilit]
- Palmer, J.E.; Sarac, M.; Garza, A.A.; Okamura, A.M. Haptic Feedback Relocation from the Fingertips to the Wrist for Two-Finger Manipulation in Virtual Reality. In Proceedings of the 2022 IEEE/RSJ International Conference on Intelligent Robots and Systems (IROS), Kyoto, Japan, 23–27 October 2022; pp. 628–633. [Google Scholar] [CrossRef] [Scilit]
- Moon, H.S.; Orr, G.; Jeon, M. Hand Tracking with Vibrotactile Feedback Enhanced Presence, Engagement, Usability, and Performance in a Virtual Reality Rhythm Game. Int. J. Hum.-Comput. Interact. 2023, 39, 2840–2851. [Google Scholar] [CrossRef] [Scilit]
- Kass, R.E.; Raftery, A.E. Bayes Factors. J. Am. Stat. Assoc. 1995, 90, 773–795. [Google Scholar] [CrossRef]
- Wagenmakers, E.J.; Marsman, M.; Jamil, T.; Ly, A.; Verhagen, J.; Love, J.; Selker, R.; Gronau, Q.F.; Šmíra, M.; Epskamp, S.; et al. Bayesian inference for psychology. Part I: Theoretical advantages and practical ramifications. Psychon. Bull. Rev. 2018, 25, 35–57. [Google Scholar] [CrossRef] [PubMed]
- Veldman, M.P.; Maurits, N.M.; Zijdewind, I.; Maffiuletti, N.A.; van Middelkoop, S.; Mizelle, J.C.; Hortobágyi, T. Somatosensory electrical stimulation improves skill acquisition, consolidation, and transfer by increasing sensorimotor activity and connectivity. J. Neurophysiol. 2018, 120, 281–290. [Google Scholar] [CrossRef] [Scilit] [PubMed]

Disclaimer/Publisher’s Note: The statements, opinions and data contained in all publications are solely those of the individual author(s) and contributor(s) and not of MDPI and/or the editor(s). MDPI and/or the editor(s) disclaim responsibility for any injury to people or property resulting from any ideas, methods, instructions or products referred to in the content. |
© 2026 by the authors. Licensee MDPI, Basel, Switzerland. This article is an open access article distributed under the terms and conditions of the Creative Commons Attribution (CC BY) license.