


Abstract
Private-key loss can permanently prevent access to blockchain-based assets, motivating recovery mechanisms that avoid retaining an entire key at a single location. Shamir’s Secret Sharing (SSS) distributes a secret across multiple shares, but off-chain shares require a verifiable integrity reference. This paper compares two blockchain anchoring designs under controlled inputs: Per-Share anchoring, which records one hash per share, and Merkle Root Anchoring, which commits the complete share set through a single root. Seven share settings (n = 5, 10, 20, 50, 100, 500, and 1000) were evaluated with k = ⌊n/2⌋ + 1 and 30 paired datasets per setting in a Hardhat local Ethereum environment. The evaluation consisted of 420 main runs, 420 counterbalanced recovery runs, and 510 runs of a paper-guided Pedin baseline. At n = 1000, the mean cumulative anchoring gas decreased from 47,479,746.8 for Per-Share to 46,538.8 for Merkle Root Anchoring, a 99.90% reduction, while the transaction count decreased from 1000 to 1. Merkle Root Anchoring achieved lower mean recovery times across all settings; however, the paired 95% confidence interval excluded zero only at n = 20, 50, 100, and 500. At n = 1000, mean recovery times converged to 459.29 ms for Per-Share and 453.74 ms for Merkle Root Anchoring. These results show that Merkle Root Anchoring substantially improves on-chain scalability, but the resulting savings do not translate proportionally into end-to-end recovery latency because the dominant latency source shifts from repeated blockchain queries to Merkle-proof verification.
1. Introduction
1.1. Background and Motivation
A private key is the principal secret that authorizes transactions and controls access to assets in a blockchain wallet. In a noncustodial setting, the loss or corruption of this key may make the associated assets inaccessible because no centralized recovery authority exists. A recovery design must therefore avoid both a single storage point for the complete key and an unverified reconstruction process. In Shamir’s original (k, n)-threshold scheme, any set of at least k valid shares can reconstruct the secret, whereas fewer than k shares are insufficient for reconstruction [1]. This threshold property has made SSS a recurring component of wallet recovery and distributed key-management research.
The integrity of shares used for reconstruction is a separate design concern. Directly storing every share or verification value on a blockchain provides an auditable reference, but its on-chain cost increases as the share set grows. An alternative is to keep the shares off-chain and anchor only cryptographic verification information. Under this model, the blockchain is not a repository for secret shares; rather, it supplies an immutable reference against which the integrity or inclusion of a retrieved share can be checked.
Two anchoring structures illustrate the resulting trade-off. Per-Share anchoring records the hash of every share as an independent on-chain state update, thereby providing a direct verification value for each share. Merkle Root Anchoring (MRA) aggregates all share hashes into a Merkle tree and stores only the root. An individual share is then checked using its Merkle proof. The first structure requires n state-changing transactions and repeated on-chain lookups, whereas the second requires one anchoring transaction but introduces proof construction and verification during recovery. The research question is therefore not merely whether a Merkle root occupies less on-chain storage, but how these structural differences affect cumulative gas used, the number of state-changing transactions, end-to-end recovery time, and the location of the recovery bottleneck as n increases.
1.2. Related Work
1.2.1. Secret-Sharing-Based Key Recovery
Shamir’s original (k, n) threshold scheme reconstructs a secret from any k valid shares by polynomial interpolation [1]. When applied to private-key management, the scheme can reduce dependence on one device or server and retain recoverability despite the loss of some shares, provided that at least k valid shares remain available.
Li and You applied dual-threshold secret sharing to a consortium blockchain wallet [2]. In their design, peers selected by the consortium maintain shadow shares related to a user’s wallet private key. Distinct thresholds support normal recovery and recovery under peer failure, while biometric key-based verification is used to identify invalid submissions. The scheme also includes procedures for peer membership changes. Its primary emphasis is recoverability, security, and peer management; it does not isolate Per-Share and MRA as the sole experimental variable or compare their cumulative gas and end-to-end recovery behavior over a large share range.
1.2.2. Blockchain-Based Wallet Recovery
Pedin et al. proposed a smart-contract-based social-recovery wallet that combines secret sharing, a Merkle tree, encrypted guardian communication, and biometric protection [3]. Their design creates a Secret Recovery Key that is separate from the normal signing key, divides it among guardians, and stores the corresponding recovery address and Merkle root in a smart contract. Recovery reconstructs the Secret Recovery Key from a threshold of validated shares, and uses it to transfer control to a new signing key. This differs from directly reconstructing the ordinary wallet private key. Among the studies reviewed in this paper, Pedin et al. provide the closest structural precedent for using a fixed-size Merkle commitment in recovery-share verification.
Erinle et al. proposed a shared-custodial wallet in which a client, a wealth manager, and a custody system participate in a 2-of-3 multi-party computation threshold-signature structure [4]. For recovery, key shards are protected by distinct Key Encryption Keys (KEKs), and KEK shares are distributed to recovery agents using verifiable secret sharing. Their architecture also applies share versioning and periodic challenge-response verification. The research problem is multi-party custody and operational recovery rather than a controlled comparison of two anchoring mechanisms.
1.2.3. Blockchain Anchoring for Off-Chain Integrity
If secret shares remain off-chain, a blockchain can preserve only a cryptographic commitment to those shares. During recovery, the system recomputes a verification value from each retrieved share and compares it with the commitment. Pedin et al. implemented this concept by constructing a Merkle tree from recovery shares, storing the root in a smart contract, and giving each guardian an encrypted share, an index, and a proof [3]. Their gas analysis indicated that fixed-size Merkle storage can remain nearly independent of the number of guardians, whereas storing individual hashes produces increasing setup cost.
The structural advantage of fixed-size Merkle storage is not presented here as a new cryptographic discovery. The remaining empirical gap concerns a controlled comparison in which the SSS data, software environment, and recovery threshold are held constant while the performance of two specified anchoring and verification procedures is evaluated. The published Pedin paper focused on the complete social-recovery protocol and did not provide the repeated raw observations required for the same paired statistical analysis used in this paper. Therefore, the external comparison in this paper is restricted to the common Secret-Sharing–Merkle-Tree–Blockchain-Anchoring stage and to scaling behavior rather than absolute gas superiority.
Mercan et al. [5] proposed a blockchain-based IoT forensics framework that uses Merkle trees to aggregate data hashes and reduce blockchain storage costs while preserving data integrity. Although their study focuses on IoT forensic evidence rather than private-key recovery, it demonstrates the applicability of Merkle-based aggregation to cost-efficient blockchain anchoring. In addition, Kuznetsov et al. [6] investigated the scalability of Merkle-tree inclusion verification and proposed an OR-aggregation approach to reduce proof-related overhead. Their work addresses an alternative proof construction technique, whereas the present study evaluates the measured recovery-time overhead of conventional Merkle-proof verification in an SSS-based private-key recovery setting.
1.2.4. Dynamic and Proactive Share Management
Long-lived distributed systems may require shares to be refreshed or redistributed as participants join, leave, or become compromised. Zhang et al. proposed HasDPSS for hierarchical access structures in decentralized storage [7]. HasDPSS combines secret sharing with a dynamic management committee, proactive share refresh, polynomial dimension switching, and a commitment protocol. It evaluates computation and communication overhead under changing committee conditions. Li and You likewise describe replacing obsolete shares after peer changes [2], while Erinle et al. attach versions to helper shares and refresh them when the helper set or protected secret changes [4].
These capabilities are important for deployment but are outside the scope of the present experiment. The evaluated share set and threshold are fixed within each dataset. Guardian enrollment, share refresh, threshold modification, epoch management, update-aware anchoring, and versioned Merkle roots are treated as separate research problems.
1.3. Research Gap and Contributions
Table 1 compares the present study with four related works by research objective and evaluation scope rather than ranking heterogeneous recovery protocols.
Table 1.
Comparison of related studies.
The objective is to quantify the performance and scalability of Per-Share and MRA across n = 5 to n = 1000, including stress tests at n = 500 and n = 1000. The main contributions are as follows:
- A controlled comparison holds the secret, encoded shares, threshold, and execution environment constant while evaluating the performance of two specified anchoring and recovery implementations.
- Seven share settings from n = 5 to n = 1000 are evaluated using 30 paired datasets each; n = 500 and n = 1000 are stress tests, not proposed guardian counts.
- A counterbalanced recovery experiment, paired confidence intervals, and component timing identify the shift from repeated blockchain queries to Merkle-proof verification.
- A paper-guided Pedin Merkle-SHA256 implementation supplies an external scaling reference normalized within each mechanism to account for the unequal on-chain storage scope.
- Main, recovery, and external-baseline data are frozen and verified by SHA-256 digests to preserve experiment-specific provenance.
Compared with our preliminary INTCOM 2026 study [8], which demonstrated the feasibility of comparing Per-Share and MRA, this journal article extends the initial proof of concept into a systematic and reproducible scalability evaluation. The present study expands the evaluation across seven share-count settings up to n = 1000, uses paired datasets and counterbalanced recovery measurements, analyzes recovery-component bottlenecks, and incorporates an external paper-guided scaling baseline. These analyses provide integrated evidence on how reductions in on-chain anchoring costs are related to recovery-side computation and latency. Accordingly, this journal article does not claim to introduce a new cryptographic primitive or anchoring mechanism. Instead, its contribution lies in a controlled empirical comparison that quantifies cumulative gas consumption, transaction counts, and recovery latency for two specified anchoring and verification implementations under matched input data, thresholds, and execution environments. Beyond confirming the known on-chain storage advantages of Merkle-root commitments, the study provides component-level evidence that large reductions in anchoring costs do not necessarily result in proportional improvements in end-to-end recovery performance. This distinction is particularly relevant when evaluating the practical scalability of blockchain-assisted private-key recovery systems.
The remainder of the manuscript is organized as follows. Section 2 defines the system model, implementation, datasets, metrics, statistical procedures, and external baseline. Section 3 reports the anchoring, recovery, component, and baseline results. Section 4 interprets the structural scaling behavior, recovery trade-offs, external validity, and limitations. Section 5 concludes the study.
2. Materials and Methods
2.1. System Model and Evaluation Scope
The evaluated system divides a 32-byte synthetic secret into n SSS shares, retains the encoded shares off-chain, and stores only integrity-verification information on a blockchain. During recovery, the two implementations use different verification scopes. Per-Share checks all n retrieved shares against their corresponding anchored hashes and selects the first k valid shares for reconstruction. In contrast, MRA generates and verifies Merkle proofs for only the first k indexed shares and proceeds with reconstruction if all k shares are valid. The reconstructed secret is then compared with the original synthetic secret.
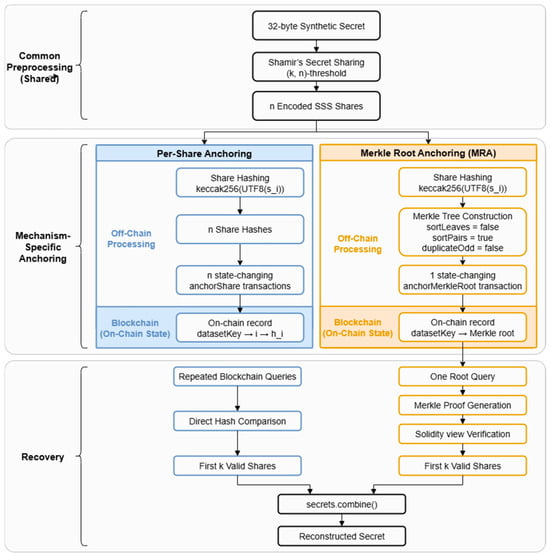
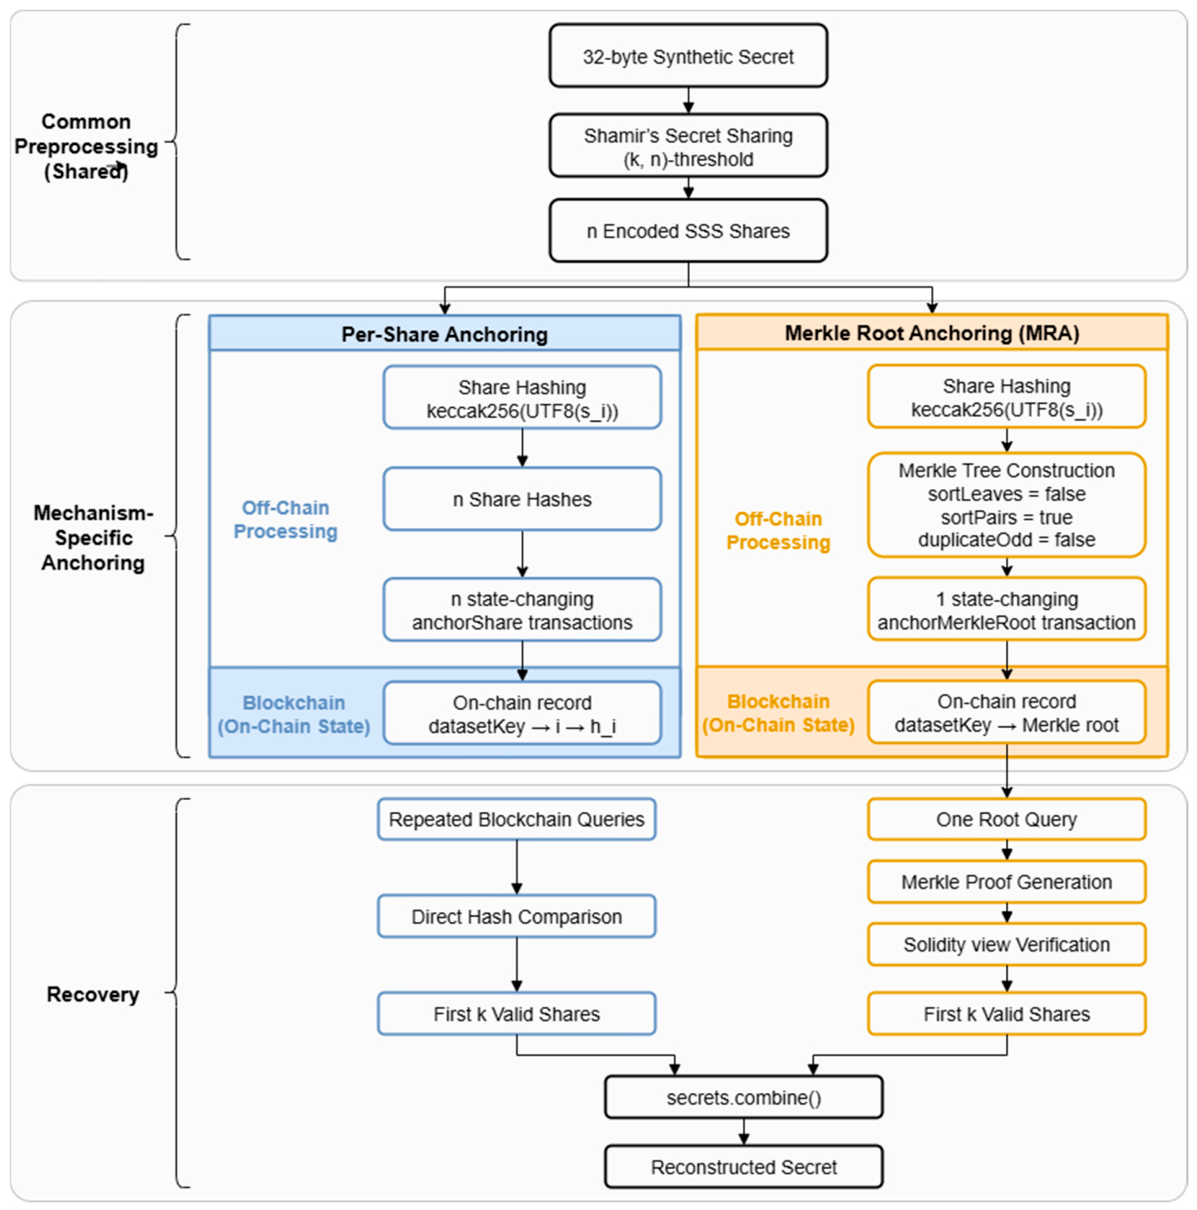
The comparison evaluates two specified anchoring implementations that differ in their on-chain integrity-reference representation and recovery verification procedures. In Per-Share anchoring, every share hash is recorded separately. In MRA, the complete set of share hashes is aggregated into one root, and the inclusion is checked using share-specific proofs. Both mechanisms use the same dataset, threshold, and execution environment, but their recovery verification scopes differ as described above. The evaluation covers the cumulative anchoring gas used, number of state-changing anchoring transactions, end-to-end recovery time, and selected recovery-component times. It does not evaluate guardian or storage-node availability, authentication, access control, encrypted transport, share confidentiality, dynamic guardian enrollment, share refresh, threshold changes, versioned roots, or a comprehensive set of attacks. The scope is therefore limited to a performance and scalability evaluation of the integrity-anchoring layer, rather than a complete wallet-recovery security protocol. Figure 1 summarizes the common preprocessing, anchoring, and recovery flows evaluated for Per-Share and MRA.
Figure 1.
System model and evaluation flow for Per-Share anchoring and Merkle Root Anchoring (MRA). Both mechanisms use the same SSS-generated share set and KECCAK256-based share hashing. Per-Share records individual share hashes through n state-changing transactions, whereas MRA constructs a Merkle tree off-chain and stores one Merkle root on-chain. During recovery, Per-Share verifies all n shares before selecting the first k valid shares, whereas MRA verifies only the first k indexed shares using Merkle proofs before reconstruction. Arrows indicate the direction of the experimental workflow. Blue represents the Per-Share anchoring and recovery path, while orange represents the Merkle Root Anchoring (MRA) path.
Scope clarification: This experiment focuses exclusively on the performance and scalability of the integrity-anchoring layer. It does not evaluate (i) guardian or storage-node availability, (ii) authentication, access control, share confidentiality, or secure communication, (iii) dynamic membership, share refresh, threshold modification, or versioned roots, or (iv) comprehensive adversarial security scenarios. These aspects are outside the scope of the present evaluation and require separate investigation.
2.2. Dataset and Secret-Sharing Configuration
The share counts were n ∈ {5, 10, 20, 50, 100, 500, 1000}. A consistent majority threshold was applied:
k = ⌊n/2⌋ + 1.
The corresponding thresholds were k ∈ {3, 6, 11, 26, 51, 251, 501}, respectively. The n = 500 and n = 1000 settings were introduced to expose the scaling behavior under large share sets; they do not represent the recommended numbers of wallet guardians.
Each dataset used a 32-byte synthetic secret generated by the Node.js cryptographically secure random-number generator (CSPRNG). The 32-byte length was selected to represent the 256-bit secret size commonly used for Ethereum private keys. Synthetic secrets were used to avoid exposing real wallet credentials and to ensure a controlled and reproducible experimental setting. No private key associated with real assets was used. The secret was divided with secrets.js-grempe 2.0.0 using the corresponding (k, n) parameters. The encoded share strings returned by the library, including their field/header information, were retained without reformatting and reused throughout anchoring and recovery.
Thirty independent datasets were generated for each value of n, yielding 210 datasets. Each record preserved a dataset_id, the synthetic secret, the encoded share set, n, and k. After generation, the dataset was loaded by an identifier and supplied to both anchoring mechanisms rather than regenerated. This pairing controls variation attributable to the secret or share content.
2.3. Blockchain Anchoring Mechanisms
Both mechanisms hash the same encoded share string. For share si, the leaf or direct anchor is
hi = keccak256(UTF8(si)).
No raw share is written to the blockchain.
2.3.1. Per-Share Anchoring
The Per-Share anchoring contract associates a dataset key and share index with a bytes32 hash, conceptually represented as
datasetKey → i → hi.
Every hi is recorded through a separate anchorShare transaction. No batch-storage function is used. This configuration represents a sequential Per-Share anchoring baseline rather than an optimized or batched implementation. It was selected to isolate the transaction-count difference between individual hash anchoring and single-root anchoring under the specified contract interfaces. Anchoring one dataset produces exactly n state-changing transactions. During recovery, the application recomputes the hash of each retrieved share, queries the corresponding on-chain value by dataset key and index, and retains the share when the two values match. This procedure repeats the blockchain lookup for the shares being checked. Specifically, the implementation retrieves all n on-chain share hashes and verifies all n corresponding shares before selecting the first k valid shares for SSS reconstruction. The verification loop does not terminate when k valid shares have been found.
2.3.2. Merkle Root Anchoring (MRA)
The MRA implementation uses the same hi values as the leaves. The original share-index order is retained (sortLeaves = false). Child hashes are sorted before computing an internal node (sortPairs = true), and an unmatched node at an odd-sized level is promoted without duplication (duplicateOdd = false). The tree is implemented with merkletreejs 0.6.0.
Only the resulting root is stored:
datasetKey → MerkleRoot.
Consequently, each dataset requires one state-changing anchorMerkleRoot transaction, regardless of n. For recovery, the application calls MerkleTree.getProof(leaf, index) and submits the proof to a Solidity view function. The function reconstructs the path with the same sorted-pair KECCAK256 rule and accepts the share when the calculated root equals the anchored root. Tree construction and proof generation occur off-chain; the proof-verification call does not change contract state. During recovery, the implementation generates Merkle proofs for the first k indexed shares and verifies them through k sequential Solidity view-function calls. It does not examine the remaining n − k shares. If any of the first k shares fails verification, the recovery run is reported as unsuccessful rather than searching for additional valid shares.
2.4. Experimental Environment and Metrics
All principal experiments were conducted in the same Hardhat local Ethereum environment. Software versions and network settings were held constant. Table 2 lists the supplied environmental configuration.
Table 2.
Experimental environment and implementation configuration.
Cumulative anchoring gas used: Contract deployment gas was excluded. Gas was obtained from the gasUsed field of the mined anchoring transaction receipt rather than from estimateGas. The Per-Share cumulative gas is the sum of the n anchorShare receipts for one dataset. MRA gas is the receipt value of one anchorMerkleRoot transaction. JavaScript-side SSS processing, tree construction, and proof generation are not included in this on-chain metric.
Anchoring transaction count: This metric counts state-changing anchoring transactions and excludes deployment. It is n for Per-Share and one for MRA by design. Solidity view calls used during proof verification are not counted as anchoring transactions.
End-to-end recovery time: Time was measured with process.hrtime.bigint(). The interval starts immediately before loading the target dataset and includes dataset loading and validation, retrieval of blockchain anchors, share-integrity or Merkle-proof verification, identification of valid shares and selection of the first k, reconstruction with secrets.combine, and comparison of the recovered secret with the original. CSV/JSONL writes and progress logging occur after the timer stops. Accordingly, the measured recovery time includes n on-chain anchor queries and n share-hash comparisons for Per-Share, whereas MRA performs one Merkle-root query, generates k proofs, and executes k proof-verification view calls. This difference in verification workload is part of the evaluated implementations and must be considered when interpreting their recovery-time measurements.
Recovery-component time: Diagnostic timers measure blockchain queries, integrity verification, Merkle-proof generation, and SSS reconstruction. In Per-Share anchoring, the main components are repeated anchor queries and direct hash comparison. In MRA, the root query, proof generation, and proof verification are measured separately. These intervals are intended to locate dominant costs; they do not form a mutually exclusive partition of every operation. Therefore, their sum may differ from the end-to-end recovery time.
2.5. Experimental Procedure and Statistical Analysis
The main experiment executed both mechanisms once for each of the 210 paired datasets. Seven values of n, 30 datasets per value, and two mechanisms yielded 420 main runs. The frozen main results provided the reported anchoring gas and transaction-count measurements.
Because the original main run used a fixed mechanism order, a separate counterbalanced recovery validation was conducted using the same frozen datasets. Odd-numbered repetitions used PER_SHARE_FIRST, whereas even-numbered repetitions used MERKLE_ROOT_FIRST; each order consequently appeared 15 times at every n. Each mechanism was evaluated after a fresh Hardhat reset and contract deployment, and unrecorded warm-up runs preceded the measurement. The validation added 420 recovery runs. The final recovery-time and component analyses used these counterbalanced observations, whereas gas and transaction results remained those of the main run. Pilot, sanity, and warm-up executions were excluded from the reported totals.
Means and sample standard deviations were calculated from the completed observations using N − 1 in the denominator, where N = 30 denotes the number of repeated observations per condition. Quartiles, when required in the frozen analysis, used linear interpolation. No automatic outlier removal was applied. For a paired dataset j at share count n, the recovery-time difference was defined as
Δ_j(n) = T_Per-Share,j(n) − T_MRA,j(n).
Here, j denotes the paired dataset index, and n denotes the share count. A positive value indicates a shorter MRA recovery time for the same dataset. Each n contained 30 paired observations. The descriptive 95% confidence interval was calculated with Student’s t-distribution:
mean[Δ(n)] ± t0.975,29 × SD[Δ(n)]/√30.
The interval was used as a prespecified descriptive criterion rather than a substitute for a full hypothesis-testing framework. A difference is described as clearly separated at a given n when the interval excludes zero; otherwise, the mean difference is reported without a generalized superiority claim. No p-value-based significance claim was made.
After the experiment, raw data and analysis outputs were frozen. SHA-256 digests and environmental checks were used to confirm that the source data remained unchanged during subsequent analysis. Main, counterbalanced recovery, and Pedin baseline data were frozen separately to preserve their distinct provenance.
2.6. Pedin Paper-Guided External Baseline
The external baseline was constructed from the publicly described setup in Pedin et al. [3]. It reproduces only the Shamir–Merkle-SHA256 setup and anchoring stage that is structurally comparable to this paper, and not the complete social recovery protocol. The baseline is therefore a paper-guided reimplementation rather than an exact reproduction.
Paper-supported elements include a (k, n) Shamir structure, one guardian per share, an SHA-256 Merkle tree whose leaves are share hashes, left/right-ordered parent hashing, padding with the last leaf, a proof and an index for every share, and one setup transaction that stores both a recovery public address and the Merkle root. Unlike the principal MRA mechanism, this baseline does not sort sibling pairs. When necessary, the last leaf was repeated to reach the next power-of-two tree size.
Details absent from the Pedin paper were fixed as explicit experimental assumptions: secrets.js-grempe 2.0.0, UTF-8 share serialization, zero-based proof indices, 30 repetitions per condition, Solidity 0.8.24, optimizer disabled, the Hardhat local environment, a minimal comparison contract, and exclusion of deployment gas. These assumptions were not attributed to the original implementation.
The Paper Grid uses n ∈ {2, 16, 32, 48, 64, 80, 96, 112, 128, 144, 160, 176, 192} with k = ⌊n/2⌋ + 1. Thirty setup transactions for each of 13 settings yielded 390 runs. The Common Grid uses n ∈ {10, 20, 50, 100} with k ∈ {6, 11, 26, 51} and adds 120 baseline runs. Thus, the external baseline contained 510 observations.
The three mechanisms store unequal information: the Pedin baseline stores a recovery address and root, the principal MRA mechanism stores only a root, and Per-Share stores n hashes. Therefore, absolute gas values are not ranked across mechanisms. Common-Grid scaling is normalized within mechanism m to its own mean at n = 10:
Gmnorm(n) = mean[Gm(n)]/mean[Gm(10)].
All 510 observations were retained without automatic outlier removal and frozen separately from the principal experiment.
3. Results
3.1. Experimental Completion and Validation
The main experiment contained 420 runs: 210 paired datasets evaluated once with each mechanism. All 420 runs were completed successfully. The separate counterbalanced recovery validation added 420 successful runs using the same dataset identifiers and balanced the two mechanism orders 15:15 within each share setting. No clear order effect was observed in the supplied analysis. Nevertheless, the counterbalanced results are used throughout Section 3.4 and Section 3.5 because they provide the prespecified robust recovery comparison.
The paper-guided Pedin baseline contained 390 Paper-Grid and 120 Common-Grid setup runs. All 510 were completed successfully. Across the three experimental groups, the paper reports 1350 major evaluation executions: 420 main executions, 420 counterbalanced recovery executions, and 510 external-baseline executions. These groups serve different analytical purposes and are not treated as a homogeneous sample. Pilot, sanity, and unrecorded warm-up runs were excluded.
Every main mechanism completed 30 of 30 recorded runs at each n, including n = 500 and n = 1000 stress-test conditions, with no recorded execution failures. This completion record establishes execution feasibility only in the fixed local environment; it does not establish feasibility on a public Ethereum network.
3.2. Cumulative Anchoring Gas Used
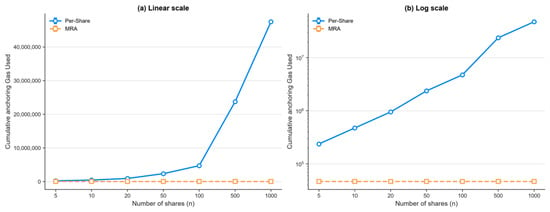
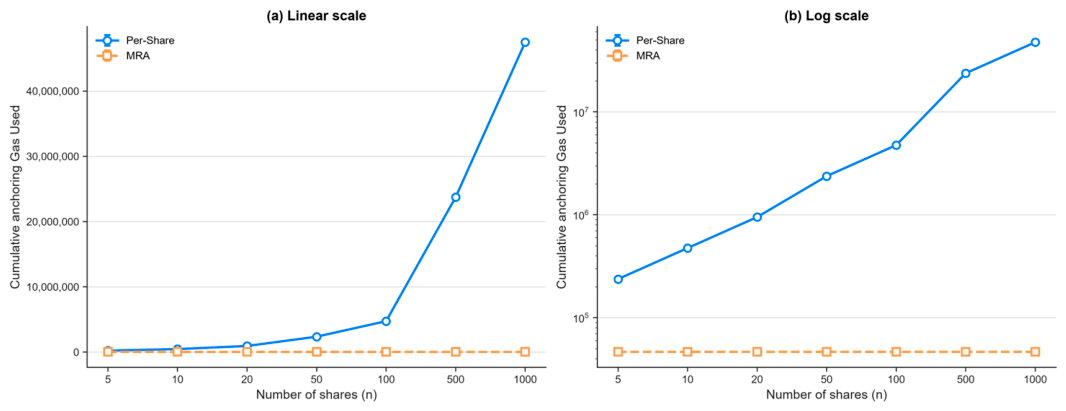
Table 3 lists the sum of mined anchoring-transaction gas for one dataset. Per-Share gas grows almost proportionally to n, whereas MRA gas remains near 46.54 thousand over the complete range. Figure 2 visualizes the absolute Gas Used difference and the corresponding scaling patterns on linear and logarithmic scales.
Table 3.
Cumulative anchoring gas used by share count (30 runs per condition).
Figure 2.
Cumulative anchoring Gas Used for Per-Share and MRA across the evaluated share counts. (a) Linear-scale representation of the absolute Gas Used difference. (b) Log-scale representation of the scaling patterns.
At n = 5, the mean values were 237,340.4 and 46,539.6 gas, corresponding to an 80.39% reduction. At n = 1000, the means were 47,479,746.8 and 46,538.8 gas, corresponding to a 99.90% reduction. Increasing n by a factor of 200, from 5 to 1000, increases Per-Share cumulative gas by approximately the same factor, while the MRA value fluctuates only slightly around 46,540 gas.
The Per-Share result of 47,479,746.8 gas at n = 1000 is the sum of 1000 separate transactions; it is not the gas consumption of a single transaction. Therefore, it must not be compared directly with the configured 30,000,000 block gas limit as though one transaction exceeded that limit.
3.3. Anchoring-Transaction Scalability
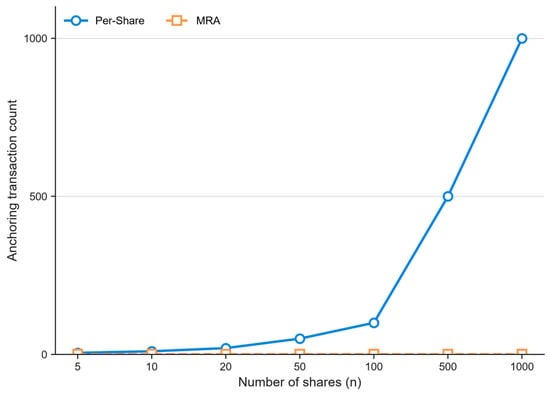
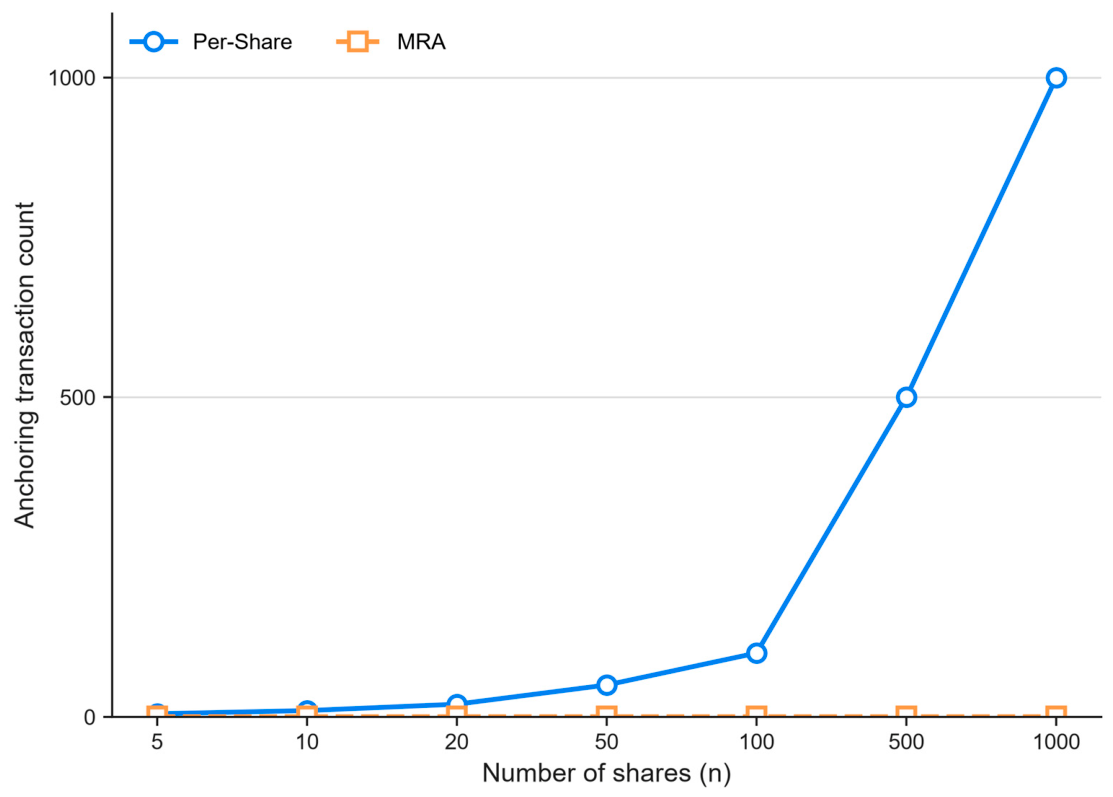
The transaction count follows directly from the contract interfaces. Per-Share submits one state-changing transaction per share, while MRA submits one state-changing transaction per dataset. Table 4 also reports the successful main runs to distinguish the structural count from experimental completion. Figure 3 summarizes the resulting transaction-count scaling across the evaluated share counts.
Table 4.
Anchoring-transaction count and main-run completion.
Figure 3.
Number of state-changing anchoring transactions required by Per-Share and MRA across the evaluated share counts. Per-Share requires n anchoring transactions per dataset, whereas MRA requires one.
The ratio changes from 5:1 at n = 5 to 1000:1 at n = 1000. This is a structural property of the evaluated implementations rather than an estimate derived from repeated timings. Nevertheless, the main experiment confirmed that all specified transactions were successfully processed in the local environment at the two large-n stress tests.
3.4. Counterbalanced Recovery Performance
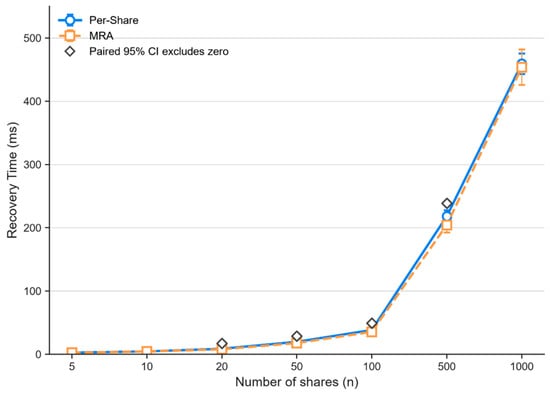
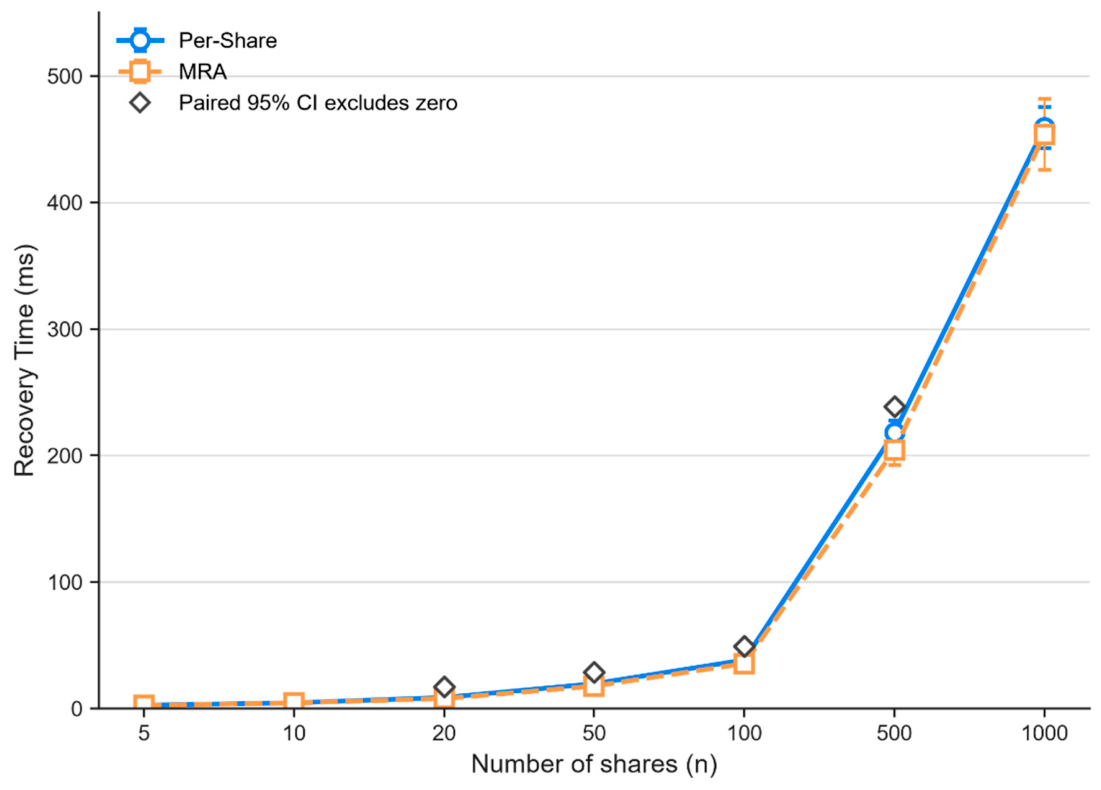
Table 5 lists the counterbalanced end-to-end recovery results. MRA has a lower mean at every n, but the magnitude and uncertainty of the paired difference vary. The 95% confidence interval excludes zero at n = 20, 50, 100, and 500. It includes zero at n = 5, 10, and 1000. Figure 4 shows the counterbalanced recovery means, variability, and paired-confidence-interval criterion across the evaluated share counts.
Table 5.
Counterbalanced end-to-end recovery time.
Figure 4.
Counterbalanced Recovery Time for Per-Share and MRA across the evaluated share counts. Error bars represent sample standard deviations over 30 paired datasets. Hollow diamonds indicate conditions for which the paired 95% confidence interval of the Per-Share–MRA difference excludes zero.
The largest mean difference occurs at n = 500, where MRA is 13.6965 ms lower and the interval is [8.1148, 19.2783] ms. At n = 1000, the mean difference decreases to 5.5520 ms and the interval [−4.2537, 15.3578] includes zero. Thus, the average ordering is consistent, but a clear difference is not supported at every share setting. In particular, the 99.90% reduction in anchoring gas at n = 1000 must not be interpreted as a comparable reduction in end-to-end recovery time.
3.5. Recovery-Component Analysis
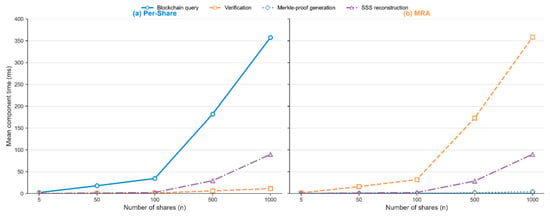
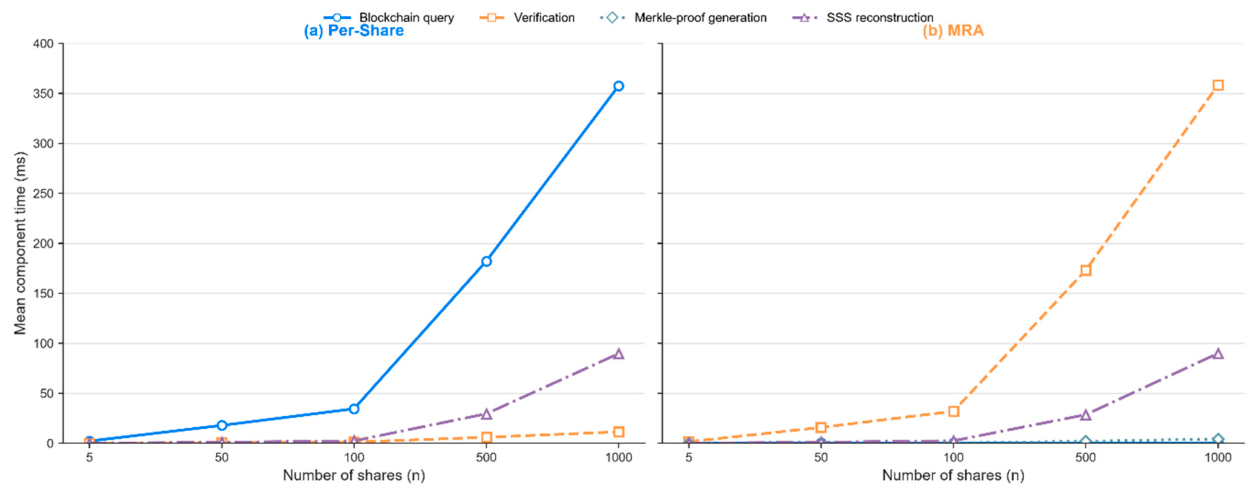
Table 6 lists representative component means from the counterbalanced recovery validation. These diagnostic intervals are not mutually exclusive and need not sum exactly to the total. Figure 5 shows the corresponding component-level timing patterns at representative share counts.
Table 6.
Mean recovery-component time at representative share counts.
Figure 5.
Recovery-component timing at representative share counts. (a) Per-Share anchoring. (b) MRA. Per-Share recovery becomes increasingly dominated by blockchain-query time, whereas MRA becomes dominated by verification time as the number of shares increases. Component measurements are diagnostic and non-additive; therefore, their sum is not required to be equal to the end-to-end Recovery Time.
The Per-Share blockchain-query time increased from 2.202 ms at n = 5 to 357.497 ms at n = 1000. At the largest setting, this component accounts for approximately 77.8% of total Per-Share recovery time. In contrast, the MRA blockchain query remains near 0.4 ms throughout the representative settings because the contract returns one root rather than one hash per share.
The removed query burden is replaced by Merkle verification. The MRA integrity-verification time increases from 1.600 ms at n = 5 to 358.336 ms at n = 1000, approximately 79.0% of its total recovery time at the largest setting. Mean proof-generation time is only 4.325 ms at n = 1000, and the SSS reconstruction is similar between mechanisms (89.679 versus 89.940 ms). These measurements identify the principal change as a shift from repeated blockchain queries to proof verification rather than a difference in SSS reconstruction.
This shift explains why the two total recovery means reconverge at n = 1000. Reducing Per-Share query time from 357.497 ms to a 0.419 ms root query does not remove the work of checking a large share set; the MRA implementation incurs 358.336 ms of verification instead.
3.6. Pedin Paper-Grid Baseline
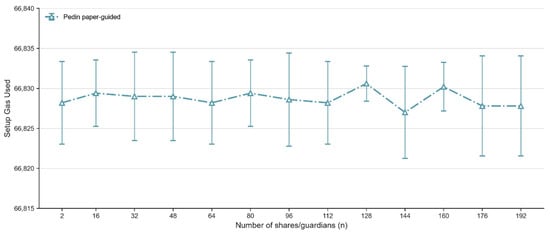
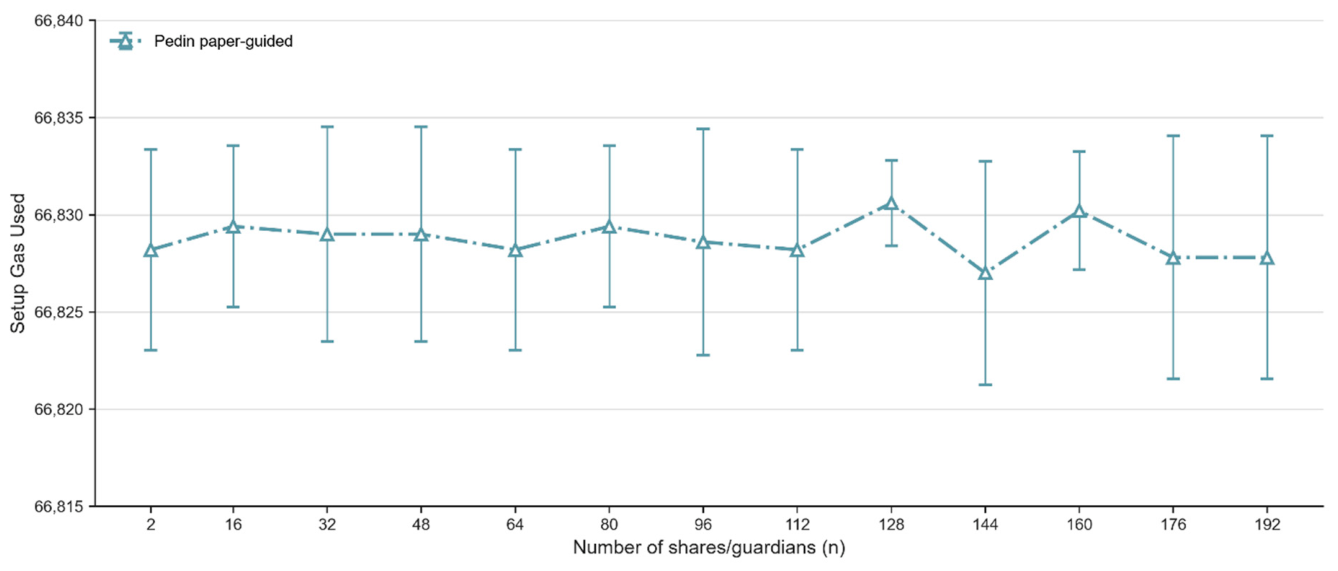
Table 7 reports the 390 Paper-Grid runs of the paper-guided Merkle-SHA256 setup. Each setting completed 30 of 30 runs. Mean setup gas remained between 66,827.0 and 66,830.6 gas, a range of 3.6 gas or approximately 0.0054% relative to the minimum. Figure 6 shows the near-constant mean setup Gas Used and its run-to-run variability over the Paper Grid.
Table 7.
Pedin paper-guided Merkle-SHA256 setup results (30 runs per condition).
Figure 6.
Mean setup Gas Used for the paper-guided Pedin Merkle-SHA256 baseline over the Paper Grid. Error bars represent sample standard deviations across 30 runs. The y-axis is truncated to visualize the small variation in mean setup Gas Used across the evaluated share counts.
The descriptive slope of mean setup gas with respect to guardian count is approximately −0.00279 gas per additional guardian and is effectively flat over the evaluated range. This slope is not presented as a regression-based significance result. It is used only to describe the near-constant setup pattern, which is qualitatively consistent with the fixed-size Merkle setup reported by Pedin et al. [3].
The complete source code, exact execution environment, repeated raw observations, and full storage-layout details of the original Pedin implementation were not available for this paper-guided reimplementation. Accordingly, the result is not an exact reproduction. Moreover, the baseline stores a recovery address in addition to a root, whereas the principal MRA implementation stores only a root. Their absolute gas values are not used for direct efficiency ranking.
3.7. Common-Grid Normalized Gas Scaling
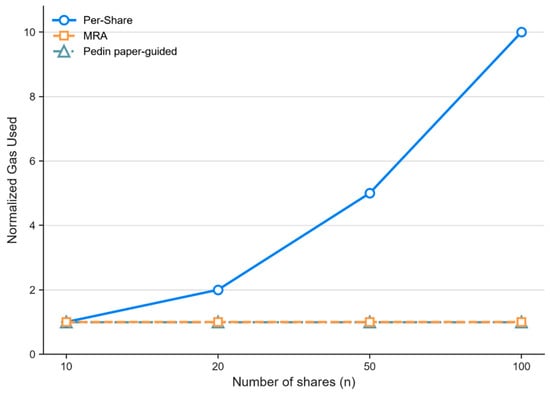
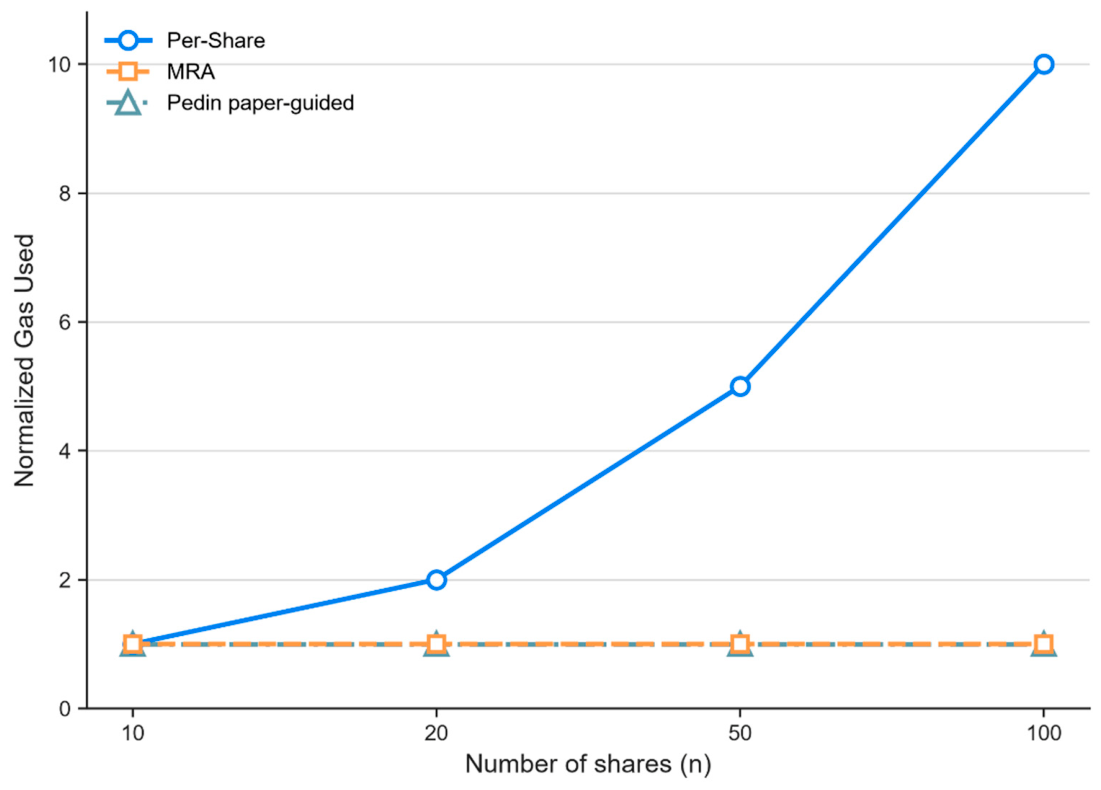
Table 8 compares scaling patterns for n = 10, 20, 50, and 100. Each value is normalized to the mechanism’s own mean at n = 10 to compare relative scaling behavior across share counts. The principal Per-Share and MRA means were reused from the main experiment; only the 120 Pedin Common-Grid runs were additional external baseline executions. Figure 7 shows the resulting within-mechanism normalized scaling behavior on the Common Grid.
Table 8.
Common-Grid gas scaling normalized within each mechanism.
Figure 7.
Common-Grid Gas Used normalized to each mechanism’s own n = 10 mean. MRA and the paper-guided Pedin baseline remain approximately constant as n increases, whereas Per-Share Gas Used increases approximately with the share count. The comparison represents relative scaling behavior and does not imply equivalence of absolute Gas Used or on-chain storage scope.
Both Merkle-based mechanisms remain approximately 1.0 across the Common Grid, while Per-Share increases to approximately 2.0, 5.0, and 10.0 as n doubles, quintuples, and increases tenfold relative to 10. The transaction counts show the same contrast: the Pedin baseline and MRA use one transaction in every Common-Grid condition, while Per-Share uses n transactions. This comparison corroborates a fixed-size on-chain scaling pattern without asserting the equivalence of the stored content or absolute gas efficiency.
3.8. Frozen-Data Integrity and Provenance
The experimental records comprise separate frozen raw files for the three experimental groups. Table 9 lists their row counts and SHA-256 digests. The slash-separated presentation used in the source has been joined into standard continuous hexadecimal strings.
Table 9.
Frozen raw-data provenance.
The row counts sum to the 1350 major evaluation executions reported across the three distinct experimental groups. Spaces divide each displayed digest into 16-character groups for readability, and are not part of the hexadecimal value. Each raw file was preserved separately because the experiments answered different questions. Pilot, sanity, and warm-up observations were excluded from both the table and reported statistical summaries.
The SHA-256 digests reported in Table 9 support integrity verification of the retained experimental records, but do not independently enable reproduction of the experiments. Independent reproduction requires access to the implementation, experimental scripts, configuration files, and input datasets in addition to the reported methodological details.
4. Discussion
4.1. Structural Interpretation of On-Chain Scaling
The gas and transaction results follow from how the two mechanisms represent verification information on-chain. Per-Share connects every share hash to a separate state update. Its cumulative gas and transaction count therefore increase with the number of shares. The MRA performs the aggregation off-chain and writes one fixed-size commitment. Within the evaluated anchoring operation, this design separates n from the number of state-changing transactions and amount of on-chain commitment data written per dataset.
At n = 1000, the reduction from 47,479,746.8 to 46,538.8 cumulative gas, and from 1000 transactions to 1, is not a consequence of optimizing a single equivalent transaction. It results from changing the number and granularity of on-chain state changes. Therefore, the increasing percentage reduction with n is a predictable structural outcome that is confirmed quantitatively by the repeated experiments.
These results should not be restated as the total computational complexities of O(n) and O(1) for the complete systems. The near-linear and near-constant descriptions apply specifically to cumulative gas and state-changing transaction counts in the evaluated anchoring stage. MRA still requires tree construction, proof generation, and verification; those costs occur outside the anchoring gas metric and become visible in recovery timing.
4.2. Recovery Bottleneck Shift and Performance Trade-Off
The counterbalanced recovery results prevent the misleading conclusion that the large on-chain reduction produces a similarly large latency reduction. MRA has lower average recovery time at all seven values of n, but the paired confidence interval excludes zero at only four. The absence of clear separation at n = 5 and n = 10 was consistent with small absolute differences and millisecond-scale variation. More importantly, the interval again includes zero at n = 1000, where both implementations spend substantial time validating a very large share set.
The component measurements explain this reconvergence. Per-Share makes repeated contract queries; at n = 1000, blockchain querying accounts for 357.497 ms, approximately 77.8% of its total recovery time. MRA reduces the root query to 0.419 ms, but its integrity-verification component reaches 358.336 ms, approximately 79.0% of its total. The design shifts the dominant operation from retrieving many independent on-chain values to processing many Merkle paths.
SSS reconstruction is not the principal differentiator because the same k and the same shares are used. At n = 1000, the two SSS reconstruction means differed by only 0.261 ms. Merkle-proof generation was also relatively small at 4.325 ms compared with verification. These results suggest that future work on large-n recovery should evaluate proof-verification optimizations, including batching or parallelization, where applicable. Such optimizations were not evaluated in this paper.
Importantly, the observed verification bottleneck should not be interpreted as an inherent limitation of Merkle-tree verification. In the evaluated implementation, share proofs are processed through Solidity view-function calls, as described in Section 2.3.2. The measured integrity-verification time may therefore reflect a combination of proof-processing costs, contract-call overhead, and the number of shares examined during recovery. The current component-level measurements do not independently isolate these factors. Consequently, the 358.336 ms verification time observed at n = 1000 characterizes the evaluated implementation and execution environment rather than establishing an intrinsic performance limitation of Merkle-based approaches.
An additional implementation-specific factor is the difference in verification scope between the two mechanisms. Per-Share verifies all n shares, whereas MRA verifies only the first k indexed shares. At n = 1000, this corresponds to 1000 Per-Share anchor queries and share-hash comparisons versus 501 Merkle-proof verification calls. Therefore, the measured recovery-time differences reflect both the anchoring mechanisms and their respective verification procedures. The present experiment does not isolate the performance effect of the anchoring representation under an identical number of verified shares.
4.3. Relationship to Pedin et al. And the Paper Contribution
Pedin et al. and this paper both use secret sharing, a Merkle tree, and a blockchain; however, the systems recover different forms of authority [3]. Pedin et al. distributed a separate Secret Recovery Key used to transfer assets to a new signing key. The principal experiment in this paper evaluates the integrity anchoring for SSS shares used in synthetic-secret reconstruction. Therefore, the meaningful intersection is the setup or anchoring stage, not the entire wallet-recovery protocol.
The paper-guided baseline reproduced a subset of the published Pedin design under explicit local assumptions. Its near-constant mean setup gas over n = 2 to n = 192 and approximately constant normalized Common-Grid values agree qualitatively with fixed-size Merkle storage. This agreement demonstrates qualitative consistency with the fixed-size Merkle scaling pattern reported by Pedin et al.; it does not constitute an exact reproduction of their implementation or numerical results. Because the Pedin paper-guided baseline stores both a recovery public address and a Merkle root, whereas the MRA implementation stores only the Merkle root, their absolute Gas Used values are not interpreted as a direct efficiency ranking. Differences in contract structure and hash construction further limit such a comparison.
The contribution is consequently empirical rather than a claim to have invented MRA. It combines (i) the same input-controlled comparison, (ii) 30 paired datasets across seven settings up to a stress test of n = 1000, (iii) counterbalanced recovery ordering, (iv) paired confidence intervals, (v) component-level bottleneck analysis, (vi) a paper-guided external scaling check, and (vii) frozen data provenance. Together, these elements characterize both the strong on-chain advantage and the recovery-side trade-off more precisely than a gas-only comparison.
The additional empirical insight is that the established on-chain cost advantage of Merkle-root commitments should be evaluated separately from end-to-end recovery performance. At n = 1000, MRA reduced cumulative anchoring gas by 99.90%, whereas the mean recovery-time reduction was only 1.21%, with the paired 95% confidence interval including zero. The component-level measurements further show that the dominant measured overhead shifts from repeated blockchain queries in Per-Share anchoring to integrity verification in the evaluated MRA implementation. These findings provide implementation-specific evidence that lower on-chain anchoring costs do not necessarily imply proportionally faster recovery.
4.4. Large-Share Stress Tests and Execution Feasibility
The n = 500 and n = 1000 conditions were intended to test scaling behavior, not to recommend hundreds or thousands of guardians for a wallet. All 30 main runs for each mechanism were completed at both settings in the fixed Hardhat environment. This confirms that the experiment could execute the defined workflows at the selected upper bound.
Successful execution does not imply equivalent scalability. Per-Share at n = 1000 still requires 1000 independent transactions and accumulates 47.48 million gas across them. MRA requires one anchoring transaction, but its recovery-side verification cost increases with the number of checked shares. Therefore, evaluating a large-share setting requires separate consideration of the on-chain commitment cost, transaction-submission burden, and off-chain or view-call verification cost.
The local environment does not capture public-network factors such as RPC latency, transaction inclusion time, network congestion, and variable gas prices. The results characterize the EVM gas used under the specified compiled contracts and controlled local execution environment; they do not establish public-network latency or monetary cost.
4.5. Limitations
First, the main measurements were collected on a Hardhat local Ethereum network. External validation on a public test network would be required to characterize network-dependent recovery and submission latency. Gas price was not an experimental variable, and the gas used must not be converted into monetary savings without an explicit network and price assumption.
Second, the comparison evaluates two specific implementations rather than all possible implementations of Per-Share and Merkle Root Anchoring. The evaluated Per-Share design records each hash through a separate state-changing transaction and does not implement batch storage. A batched Per-Share implementation could reduce the number of transactions and alter cumulative gas consumption, potentially narrowing the observed performance difference. Because such an alternative was not evaluated, the reported 99.90% reduction at n = 1000 should be interpreted as a result of the specified implementations rather than a general performance advantage over optimized Per-Share designs. Alternative Merkle libraries, proof representations, multiproof schemes, and verification strategies were also not evaluated; therefore, the reported recovery-time results apply to the implementation specified in Section 2.3.2.
Furthermore, the recovery procedures use different verification scopes: Per-Share examines all n shares, while MRA examines only the first k indexed shares. This difference limits the extent to which recovery-time differences can be attributed solely to the anchoring mechanism. The evaluated MRA implementation also does not attempt recovery using alternative shares when one of the first k shares fails verification. The experiment therefore does not establish comparative recovery robustness under corrupted or invalid shares.
Third, the majority threshold k = ⌊n/2⌋ + 1 was fixed by the experiment. Other threshold ratios may alter the number of shares checked and reconstructed, especially if an implementation stops as soon as k valid shares are found. The evaluation does not compare threshold policies.
Fourth, the experiment used synthetic 32-byte secrets and the encoded share-string representation returned by a single SSS library. This approach avoids risking real assets and ensures controlled inputs, but it does not constitute end-to-end integration with a production wallet, guardian interface, key-encryption layer, or secure communication channel.
The results are specific to the evaluated 32-byte secret representation and the encoded share format generated by the selected SSS library. Other key formats or secret lengths may change share encoding, preprocessing, and reconstruction costs. Although the structural difference in the number of on-chain anchoring transactions is determined by the anchoring mechanism, the exact gas and recovery-time measurements should not be generalized to other formats without additional evaluation.
Fifth, the evaluation does not measure share availability, unauthorized access, encrypted storage, dynamic membership, share refresh, threshold changes, versioned roots, update-aware anchoring, or broader adversarial scenarios. The anchored values can support integrity checks, but the performance experiment alone does not prove comprehensive security or operational recoverability.
Finally, the Pedin baseline is paper-guided. Unpublished implementation details are fixed as local assumptions, and the on-chain storage scope differs from the principal mechanisms. Its purpose is to compare scaling patterns, not to reproduce the original numerical results or claim an absolute performance advantage.
Table 10 summarizes the principal performance results and practical trade-offs between the two evaluated anchoring mechanisms at n = 1000.
Table 10.
Summary of anchoring performance and recovery trade-offs at n = 1000.
5. Conclusions
This paper compared Per-Share anchoring and Merkle Root Anchoring for the integrity references of off-chain SSS shares. The same synthetic secrets, encoded share sets, majority thresholds, and local Ethereum environment were used for both mechanisms. The share count ranged from 5 to 1000, with 30 paired datasets at every setting. Gas and transaction results were obtained from 420 main runs, recovery results from 420 separate counterbalanced runs, and the external scaling check from 510 paper-guided Pedin runs.
The clearest difference is on-chain scalability. Per-Share cumulative gas and transaction count grow almost proportionally with n, whereas MRA records one fixed-size root in one transaction. At n = 1000, mean cumulative gas decreases from 47,479,746.8 to 46,538.8, and the transaction count decreases from 1000 to 1; both reductions are 99.90%. The Per-Share gas value is an aggregate across 1000 transactions, not the cost of one transaction.
Recovery performance presents a more qualified result. MRA has a lower mean recovery time at every setting, but the paired 95% confidence interval excludes zero only at n = 20, 50, 100, and 500. At n = 1000, the means are 459.2887 and 453.7367 ms, and the interval for their paired difference includes zero. Component analysis shows why: MRA removes repeated blockchain queries but shifts the principal cost to Merkle-proof verification. The large on-chain saving therefore does not imply a comparable end-to-end latency saving.
The Pedin paper-guided baseline exhibits near-constant setup scaling, while normalized Per-Share gas grows approximately with n. The paper contributes a controlled empirical evaluation using repeated paired experiments, counterbalanced recovery measurements, and component-level analysis to quantify the on-chain benefits and recovery trade-offs of the evaluated implementations.
Future work should validate network-dependent behavior on a public test network, evaluate other threshold ratios and batched alternatives, optimize large-share proof verification, integrate secure guardian and wallet workflows, and extend the design to share refresh, dynamic membership, versioned roots, and explicit adversarial scenarios.
Author Contributions
Conceptualization, Y.G.; Methodology, Y.G.; Validation, Y.G.; Writing—review and editing, Y.G. and M.K.; Supervision, M.K.; Project administration, M.K.; Funding acquisition, M.K. All authors have read and agreed to the published version of the manuscript.
Funding
This research received no external funding.
Data Availability Statement
The source code, smart contracts, experimental scripts, configuration files, synthetic datasets, and raw experimental results supporting the findings of this study are publicly available at https://github.com/goyoomin/blockchain-anchoring-sss-recovery (accessed on 14 October 2026).
Conflicts of Interest
The authors declare no conflicts of interest.
References
- Shamir, A. How to Share a Secret. Commun. ACM 1979, 22, 612–613. [Google Scholar] [CrossRef] [Scilit]
- Li, G.; You, L. A Consortium Blockchain Wallet Scheme Based on Dual-Threshold Key Sharing. Symmetry 2021, 13, 1444. [Google Scholar] [CrossRef] [Scilit]
- Pedin, A.B., IV; Siasi, N.; Sameni, M. Smart Contract-Based Social Recovery Wallet Management Scheme for Digital Assets. In Proceedings of the 2023 ACM Southeast Conference (ACMSE 2023), Virtual Event, USA, 12–14 April 2023; Association for Computing Machinery: New York, NY, USA, 2023; pp. 177–181. [Google Scholar] [CrossRef] [Scilit]
- Erinle, Y.; Feng, Y.; Xu, J.; Vadgama, N.; Tasca, P. Shared-Custodial Wallet for Multi-Party Crypto-Asset Management. Future Internet 2025, 17, 7. [Google Scholar] [CrossRef] [Scilit]
- Mercan, S.; Cebe, M.; Tekiner, E.; Akkaya, K.; Chang, M.; Uluagac, A.S. A Cost-efficient IoT Forensics Framework with Blockchain. In Proceedings of the 2020 IEEE International Conference on Blockchain and Cryptocurrency (ICBC), Toronto, ON, Canada, 2–6 May 2020; IEEE: Piscataway, NJ, USA, 2020; pp. 1–5. [Google Scholar] [CrossRef] [Scilit]
- Kuznetsov, O.; Rusnak, A.; Yezhov, A.; Kanonik, D.; Kuznetsova, K.; Domin, O. Efficient and Universal Merkle Tree Inclusion Proofs via OR Aggregation. Cryptography 2024, 8, 28. [Google Scholar] [CrossRef] [Scilit]
- Zhang, Y.; Wang, M.; Guo, Y.; Guo, F. Towards Dynamic and Reliable Private Key Management for Hierarchical Access Structure in Decentralized Storage. In Proceedings of the 32nd ACM International Conference on Information and Knowledge Management (CIKM 2023), Birmingham, UK, 21–25 October 2023; Association for Computing Machinery: New York, NY, USA, 2023; pp. 3371–3380. [Google Scholar] [CrossRef] [Scilit]
- Go, Y.; Kim, M. An Anchoring Mechanism with Shamir’s Secret Sharing for Blockchain Private Key Recovery. In Proceedings of the 21st International Conference on Intelligent Computing (INTCOM 2026), Prague, Czech Republic, 3–6 July 2026; Korean Society for Internet Information: Seoul, Republic of Korea, 2026. [Google Scholar]

Disclaimer/Publisher’s Note: The statements, opinions and data contained in all publications are solely those of the individual author(s) and contributor(s) and not of MDPI and/or the editor(s). MDPI and/or the editor(s) disclaim responsibility for any injury to people or property resulting from any ideas, methods, instructions or products referred to in the content. |
© 2026 by the authors. Licensee MDPI, Basel, Switzerland. This article is an open access article distributed under the terms and conditions of the Creative Commons Attribution (CC BY) license.