


Abstract
Advanced cyberattacks in life-critical Internet of Medical Things (IoMT) environments may preserve normal network availability while creating subtle inconsistencies between physiological conditions, transmitted telemetry, alarm behavior, and clinician-visible information. This study proposes an attention-enhanced CNN–BiLSTM intrusion detection framework for identifying a novel patient-state perception dissociation attack in smart hospital IoMT systems. The attack deliberately separates the patient’s actual physiological state from the information presented across interconnected clinical and cyber-physical layers, allowing dangerous deterioration to remain externally plausible and difficult to detect using conventional traffic-based intrusion detection mechanisms. To support realistic evaluation, a multi-zone smart hospital testbed was implemented in GNS3, incorporating heterogeneous medical devices, IoMT gateways, telemetry servers, clinical workstations, alarm components, security-monitoring nodes, and adversarial access paths. A stage-aware dataset was subsequently generated to represent benign operation, intrusion progression, gateway compromise, telemetry manipulation, alarm interference, contextual obfuscation, and complete cross-layer dissociation. Within the proposed architecture, convolutional layers learn local cross-feature relationships, bidirectional long short-term memory layers capture forward and backward temporal dependencies, and an attention mechanism emphasizes the telemetry–alarm–context deviations most indicative of hidden cyber-physical manipulation. Evaluation across fifteen operational and adversarial scenarios produced 98.57% validation accuracy, 98.43% testing accuracy, a 97.93% F1-score, and an area under the receiver operating characteristic curve of 0.998. The small validation–testing performance gap further indicates stable generalization to previously unseen samples. These results demonstrate that attention-guided deep learning can extend intrusion detection beyond conventional network anomalies by identifying semantically inconsistent attack behavior across multiple IoMT layers, providing a practical foundation for deployable threat monitoring in life-critical smart hospital environments.
1. Introduction
Deep learning has become a core analytical technology for intrusion detection in cyber-physical and Internet-of-Things (IoT) environments because it can model nonlinear dependencies, temporal attack progression, and complex interactions among heterogeneous data sources. These capabilities are particularly important in life-critical systems, where malicious activity may not produce an obvious service interruption or a recognizable traffic signature. Smart hospital Internet of Medical Things (IoMT) environments represent a challenging example because they integrate physiological sensors, medical devices, communication networks, gateways, clinical servers, alarm systems, and decision-support platforms within a tightly coupled cyber-physical ecosystem [1]. Such connectivity enables continuous monitoring, remote diagnosis, automated clinical workflows, and rapid intervention [2,3]. However, it also expands the attack surface and allows cyber manipulation to influence how a patient’s physiological condition is represented and interpreted by healthcare personnel [4,5].
Cyber threats in smart hospitals are therefore not limited to denial-of-service attacks, malware propagation, unauthorized access, or abnormal packet behavior. A more stealthy adversary may preserve the apparent availability of the infrastructure while corrupting the semantic consistency of information exchanged across clinical and computational layers [6]. This study investigates a patient-state perception dissociation attack, in which the patient’s actual physiological condition is deliberately separated from transmitted telemetry, alarm behavior, and clinician-visible context [7]. An attacker may replay or modify physiological measurements, suppress or delay alarms, and alter contextual indicators to create a credible false-safe condition while the patient is deteriorating [8]. The resulting attack is difficult to identify because individual observations may remain statistically plausible, whereas the malicious behavior becomes visible only through their temporal and cross-layer inconsistency [9].
Conventional intrusion detection systems are poorly suited to this threat model. Signature-based approaches depend on previously defined attack patterns, while statistical and machine-learning methods frequently rely on isolated network features, including packet rates, traffic volumes, protocol behavior, and connection characteristics [10]. Although these indicators are effective for identifying common attacks, they may fail when an adversary manipulates the relationships among physiological truth, telemetry delivery, alarm logic, and displayed clinical information [11]. Similarly, models that process observations independently may overlook gradual attack progression and semantic contradictions across heterogeneous sources [12]. An effective detector must therefore jointly capture local feature interactions, bidirectional temporal dependencies, attack-stage transitions, and the relative importance of cross-layer deviations [13].
To address this challenge, this study proposes an attention-enhanced convolutional neural network–bidirectional long short-term memory (CNN–BiLSTM) intrusion detection framework for identifying patient-state perception dissociation attacks in smart hospital IoMT systems. A realistic multi-zone hospital testbed is implemented in GNS3 to reproduce heterogeneous medical devices, IoMT gateways, telemetry services, clinical workstations, alarm components, monitoring nodes, remote-access paths, and adversarial entry points. The testbed supports the generation of a stage-aware dataset representing benign operation, intrusion progression, gateway compromise, telemetry manipulation, alarm interference, contextual obfuscation, and complete cross-layer dissociation. Within the proposed detector, convolutional layers learn local relationships among network, physiological, gateway, alarm, and contextual features; BiLSTM layers model attack evolution in both temporal directions; and an attention mechanism assigns greater importance to deviations that are most indicative of hidden cyber-physical manipulation.
The novelty of the proposed approach lies in shifting intrusion detection from isolated traffic classification toward semantic cyber-physical consistency analysis. Rather than identifying only whether network behavior is malicious, the framework determines whether the physiological state, transmitted telemetry, alarm response, and clinician-visible context remain mutually consistent over time. This formulation enables the detector to identify stealthy attacks that preserve operational availability and locally plausible observations while producing a globally deceptive clinical state. The proposed framework is therefore aligned with the need for mathematically structured, deep-learning-based, and practically deployable intrusion detection solutions capable of operating in real-world, life-critical environments.
Main Contributions:
- Cross-Layer Threat Model: A novel multi-stage patient-state dissociation attack is formulated to capture coordinated manipulation of physiological telemetry, alarm behavior, and clinical context.
- Realistic IoMT Cybersecurity Testbed: A multi-zone GNS3 smart hospital environment and stage-aware dataset are developed to reproduce progressive and complete dissociation attacks under realistic operating conditions.
- Attention-Enhanced Deep IDS: A CNN–BiLSTM architecture with attention is introduced to jointly learn cross-feature interactions, bidirectional attack progression, and high-risk telemetry–alarm–context deviations.
- Semantic Anomaly Detection: The proposed framework extends conventional network intrusion detection by identifying globally inconsistent yet locally plausible cyber-physical states in life-critical IoMT systems.
2. Literature Review
The cybersecurity requirements of the Internet of Medical Things (IoMT) extend beyond the conventional protection of connected IoT devices and network traffic because the protected information and services participate directly in patient monitoring and clinical decision-making. In a smart-hospital environment, critical IoMT functions include continuous acquisition of physiological measurements, reliable transmission of patient telemetry, gateway-mediated aggregation and forwarding, timely generation and propagation of clinical alarms, preservation of medical-device state, clinician-facing visualization of patient information, and delivery of trustworthy information for clinical response. Consequently, a cyberattack may affect not only confidentiality, integrity, or network availability, but also the correspondence between the patient’s actual physiological condition and the digital information upon which clinical personnel rely. Important IoMT-specific cybersecurity factors therefore include physiological-data integrity, temporal freshness of telemetry, alarm latency and visibility, device and gateway authenticity, cross-layer consistency, communication latency, resource constraints, and the clinical consequences of false-negative or false-positive security decisions. These characteristics distinguish IoMT intrusion detection from generic IoT traffic classification and require security mechanisms to consider both cyber behavior and clinically meaningful system functions.
Babar et al. (2025) [14] presented an efficient hybrid deep learning-driven framework to enhance the security and performance of Healthcare Internet of Things (H-IoT) environments, and the study is strongly connected to the present work because it explicitly addresses cyberattack detection in healthcare-oriented IoT systems while combining security analysis with communication-performance optimization. The study focused on the problem that H-IoT devices suffer from both security vulnerabilities and Quality of Service constraints due to their critical, dynamic, and resource-constrained nature, which makes conventional network architectures and standalone detection approaches insufficient. Methodologically, the authors proposed an SDN-driven deep learning framework integrated with fog computing, where smart medical devices transmit sensed physiological data to fog nodes, while a hybrid BiLSTM-based attack-detection component models malicious traffic behavior and a CNN-assisted mechanism supports efficient fog-node selection and reduction of redundant transmissions to improve overall network efficiency. The reported results showed strong performance, achieving 99.59% accuracy, 99.53% F1-score, 3 ms latency, and about 55 W energy consumption, demonstrating effective attack detection together with improved H-IoT operational efficiency. However, the study remains focused on secure communication and performance-aware cyberattack detection at the network and fog-management levels, and it does not address cross-layer clinical inconsistency, telemetry–alarm–context dissociation, or the detection of hidden patient-state obfuscation in smart hospital workflows, which is the specific research gap addressed by the proposed framework. From an IoMT functional perspective, the protected functions in this study are primarily medical-device communication, physiological-data transport, and fog-assisted service availability. It does not examine whether compromised telemetry remains consistent with the patient’s actual condition, whether an associated clinical alarm is generated correctly, or whether manipulated information propagates to clinician-facing systems.
Akash et al. (2025) [15] presented a deep-learning-based study for cyberattack detection in Internet of Health Things (IoHT) environments, with a clear focus on improving intrusion detection performance in highly connected healthcare systems through transformer-aware feature selection and hybrid sequential learning. The study aimed to address the research problem that conventional intrusion detection methods often struggle to maintain high accuracy, low latency, and strong robustness when dealing with complex and heterogeneous IoHT attack traffic. Methodologically, the authors proposed a transformer-aware feature selection mechanism combined with a CNN-BiLSTM architecture optimized by a hybrid Whale Optimization Algorithm–Grey Wolf Optimizer (WOA–GWO), where CNN layers extracted discriminative spatial traffic features, BiLSTM layers captured temporal dependencies in attack sequences, and the hybrid optimizer improved feature selection and model performance. The framework was evaluated on IoHT attack-detection tasks and compared against baseline models such as LSTM-RNN, SVM, and information-gain-based feature-selection approaches. The results showed that the proposed model achieved 99.12% accuracy with a latency of 0.88 ms in the reported healthcare attack-detection setting, while also demonstrating superior classification performance over the comparison methods. The study remains focused on traffic-level intrusion recognition and feature-optimization efficiency, without explicitly modeling patient-state perception dissociation, telemetry–alarm–context misalignment, hidden clinical deterioration obfuscation, or cross-layer semantic inconsistency between actual physiological truth and clinician-visible state. Although its sequential-learning component is relevant to time-dependent IoMT communication, the temporal information being modeled is primarily associated with attack traffic rather than the clinically meaningful evolution of physiological measurements, alarm responses, and patient-state presentation. Therefore, high traffic-classification performance alone does not establish preservation of critical IoMT clinical functions under semantic data manipulation.
Berguiga et al. (2025) [16] presented HIDS-IoMT, a deep learning-based intelligent intrusion detection framework for the Internet of Medical Things, which is strongly connected to the present study because it focuses on securing IoMT environments against cyberattacks using hybrid deep-learning-based traffic analysis. The study addressed the problem of accurately detecting sophisticated and dynamic intrusions in highly connected medical environments, where traditional security mechanisms often fail to capture complex malicious traffic behavior. Methodologically, the authors developed a hybrid CNN–LSTM architecture in which the CNN component performed automatic spatial feature extraction from network traffic, while the LSTM component modeled temporal dependencies and sequential attack patterns. The framework was further deployed within a fog-computing architecture using Raspberry Pi to support decentralized and low-latency detection near medical devices. Experimental evaluation on the IoTID20 and Edge-IIoTset datasets, covering attacks such as DDoS, SQL injection, vulnerability scanning, host scanning, port scanning, and Mirai, reported 99.92% accuracy, 99.91% precision, 99.99% recall, and 99.95% F1-score. However, the study remains focused on general network intrusion detection and does not address cross-layer clinical inconsistency, telemetry–alarm–context dissociation, or hidden patient-state obfuscation in smart hospital environments. This limitation is particularly relevant to the distinction between IoT and IoMT cybersecurity because the employed attack categories and traffic datasets predominantly characterize conventional network threats. They do not explicitly represent failure of critical medical functions such as physiological-state integrity, alarm correctness, or consistency between sensed patient state and clinician-visible information.
Balaji et al. (2025) [17] presented a deep-learning-based study for intrusion detection in healthcare environments, with a clear focus on improving cyberattack identification in Internet of Health Things settings where malicious traffic can disrupt hospital operations and threaten patient safety. The study aimed to address the research problem that conventional anomaly-based intrusion detection systems often suffer from higher processing overhead, limited temporal retention, and increased complexity when applied to healthcare communication environments. Methodologically, the authors proposed a hybrid framework that combines SqueezeNet and NasNet, where SqueezeNet was used to extract salient traffic features and a NasNet-based classifier was employed to detect intrusions across healthcare communications; in addition, the Rider Optimization Algorithm (ROA) was used for hyperparameter tuning, while an Auxiliary Classifier Generative Adversarial Network (ACGAN) was integrated to mitigate class imbalance. The framework was evaluated on three public datasets, namely WUSTL-EHMS, ECU-IoHT, and TON-IoT. The reported results showed that the proposed method achieved 99.17% accuracy, 99.05% precision, 98.97% recall, and 99.01% F1-score on WUSTL-EHMS; 99.68% accuracy, 99.62% precision, 99.59% recall, and 99.60% F1-score on ECU-IoHT; and 99.48% accuracy, 99.42% precision, 99.37% recall, and 99.39% F1-score on TON-IoT. However, the study remains centered on traffic-level intrusion classification and does not explicitly model patient-state perception dissociation, telemetry–alarm–context misalignment, hidden clinical deterioration obfuscation, or cross-layer semantic inconsistency between actual physiological truth and clinician-visible state. Its use of healthcare-oriented datasets improves domain relevance compared with purely generic IoT evaluation; nevertheless, the learning objective remains attack classification rather than verification of whether critical patient-monitoring, alarm, and clinical-perception functions remain mutually consistent during an intrusion.
Ullah et al. (2025) [18] presented an interpretable and adaptive GAN-BiLSTM framework for cyber threat detection in IoMT-based Healthcare 5.0. The study addressed data imbalance, adaptability to attack-related features, and limited interpretability in deep-learning-based healthcare intrusion detection. The proposed framework combined a Generative Adversarial Network (GAN) to generate samples for underrepresented attack classes with a Bidirectional Long Short-Term Memory (BiLSTM) network to learn temporal attack behavior. SHapley Additive exPlanations (SHAP) and Permutation Feature Importance (PFI) were additionally employed to improve interpretation of the resulting detection decisions. Experimental assessment on the NSL-KDD dataset reported a precision of 93.81% and an F1-score of 82.95%. Although interpretability is particularly important in life-critical healthcare applications, the use of a general-purpose intrusion dataset limits the ability to evaluate whether the identified features correspond to actual IoMT clinical functions such as vital-sign integrity, medical-device behavior, alarm response, or clinician-visible patient state. Thus, the work contributes to explainable attack recognition, but it does not directly evaluate the clinical-semantic consequences of successful cyber manipulation.
Doménech et al. (2024) [19] conducted a systematic literature review of 81 studies on behavior-based intrusion detection in IoMT environments with explicit consideration of patient safety. Their analysis showed that artificial intelligence techniques were adopted in approximately 84% of the reviewed studies, while important gaps remained in the availability of IoMT-specific datasets, direct consideration of patient-safety consequences, and integration of prevention and mitigation mechanisms. This finding is important because it demonstrates that applying an AI classifier to healthcare-labeled network traffic is not sufficient by itself to establish IoMT-specific protection. Patient-centric cybersecurity assessment must additionally determine how attacks influence the medical functions that convert sensed physiological conditions into reliable monitoring and clinical response.
Doménech et al. (2025) [20] further examined the domain specificity of machine-learning-based IoMT intrusion detection by comparing models using the general CICIoT2023 dataset and the IoMT-specific CICIoMT2024 dataset. Their experiments revealed cross-dataset F1-score reductions of up to 66.87%, demonstrating substantial distribution differences between general IoT and medical-IoT traffic. The study therefore provides empirical evidence that IoMT cannot simply be treated as a renamed generic IoT security domain. It also emphasized temporal organization, appropriate dataset partitioning, balancing, and domain-specific preprocessing as important factors for reliable IoMT IDS evaluation.
Kumar et al. (2025) [21] considered IoMT cybersecurity in the context of connected medical devices and sensors used for local and remote monitoring of patient vital parameters and for alerting healthcare personnel during critical conditions. Their framework combined feature selection and a weighted one-dimensional convolutional LSTM model for cyberthreat classification with a Proof-of-Authentication mechanism for IoMT device and sensor-data authentication. Evaluation was performed using the WUSTL-EHMS-2020 and ECU-IoHT datasets, with reported test accuracies of 100% and 98.55%, respectively. This work more directly reflects IoMT-specific requirements because trustworthy sensing, authenticated medical data, temporal patient information, and timely clinical alerting are explicitly connected to the security objective. Nevertheless, the approach primarily establishes whether devices and traffic are legitimate and whether attacks can be classified; it does not jointly verify the semantic consistency of actual physiology, transmitted telemetry, alarm behavior, and clinician-visible information.
The reviewed literature therefore indicates several factors that are specifically important when machine learning is applied to IoMT cybersecurity. First, medical telemetry is temporally structured and clinically meaningful, so integrity must be evaluated not only at the packet level but also against the underlying physiological evolution. Second, latency has a clinical interpretation: delayed telemetry or an alarm can preserve network availability while preventing timely intervention. Third, authentication of medical devices and gateways is necessary but does not guarantee that the values subsequently transmitted or displayed remain clinically truthful. Fourth, excessive false alarms can interfere with clinical workflows, whereas false negatives may leave dangerous deterioration undetected. Fifth, IoMT devices operate under heterogeneous communication protocols and resource constraints, making detection latency and computational cost operationally important. Finally, domain-specific datasets are required because models developed using general IoT traffic may not transfer reliably to medical-IoT environments.
Taken together, existing ML-based IoMT intrusion-detection studies have achieved strong results in network-attack classification, feature selection, class balancing, temporal traffic modeling, and device/data authentication. However, comparatively limited attention has been given to the integrity of the complete clinical information chain: actual physiological state → medical sensing → IoMT gateway → transmitted telemetry → alarm response → clinician-visible patient state. A system may therefore remain connected and operational while this chain becomes semantically inconsistent. This gap motivates the present cross-layer patient-state perception dissociation framework, in which CNN-based local feature learning, BiLSTM-based temporal modeling, and attention-based prioritization are applied jointly to network, physiological, gateway, alarm, and clinical-context information. The objective is consequently not to relabel generic IoT traffic classification as IoMT security, but to detect cyber manipulation that compromises the life-critical relationship between the physical patient state and the digital clinical representation used for monitoring and response.
3. Methodology
This part has a single-minded methodology of modeling, simulating, and identifying patient-state perception dissociation attacks within smart hospital IoMT settings. A multi-zone hospital architecture is built in GNS3 in a realistic way to simulate interconnected medical devices, gateways, clinical systems and security components to allow the cross-layer interactions between telemetry, alarm mechanisms, clinician-observable context to be accurately modeled. In this setting, a multi-stage adversarial model is executed in order to model the process of transitioning between external access and internal pivoting to compromise the gateway, manipulate the telemetry, interfere with the alarm, and completely cross-layer the dissociation. The process of capturing heterogeneous data sources, such as network traffic, physiological signals, gateway logs, and alarm events, is followed by preprocessing, synchronizing, and projecting it into a cross-layer feature space to generate a structured dataset. A CNN-BiLSTM model with attention added is followed to optimize temporal relationships and semantic discrepancies between these layers to give a powerful method to identify subtle and stealthy conditions of dissociation when operating in realistic conditions.
Figure 1 presents the overall architecture of the proposed cross-layer patient-state perception dissociation detection framework for smart hospital IoMT environments. The figure integrates three tightly coupled views of the system. On the left, the smart hospital clinical infrastructure captures the operational medical layer, including bedside monitoring devices, physiological sensors, infusion systems, nurse stations, imaging workstations, and device-management services, all connected through a sensor gateway. At the center, these heterogeneous inputs are fused into the proposed detection core, where telemetry integrity monitoring, alarm consistency analysis, clinical context verification, cross-layer feature fusion, threat scoring, stage-aware classification, and hidden deterioration inference are jointly orchestrated through the attention-enhanced CNN-BiLSTM model. On the right, the figure expands the broader operational context by showing the telemetry server, alarm console, EHR terminal, SIEM server, hospital firewall, building-management server, PLC/HVAC controller, and access-control PLC, thereby illustrating that the framework does not operate on isolated network traces alone, but instead on a unified cyber-physical representation of clinical, infrastructural, and security-relevant interactions.
Figure 1.
Cross-layer smart hospital IoMT dissociation detection architecture.
The stream of architecture also contributes to the fact that the explicit modeling of the telemetry-alarm-context dissociation that can be adversarial is the planned core novelty of the study. The upper overlay shows the sequence of attack stages as it advances with compromising the gateway to replaying or rewriting of telemetry, re-activating or deactivating alarms, and distorting the context, ultimately leading to full dissociation of perception of patient-state and application of silent clinical worsening. Simultaneously, the lowest pipeline of the formal analogy explains how raw data is transformed into operational intelligence through the application of data consolidation, time-stamping, preprocessing, creation of feature matrices, cross-layer fusion, and neural inference. What is important about this dual representation is that it offers a visual correlation between the physical hospital environment, the adversarial process, and the AI-based mechanism of analysis within a single framework. As a result, it quickly becomes apparent that the number is not only a demonstration of the fact that the proposed system is directed not at detecting abnormal traffic, but at exposing clinically dangerous semantic inconsistencies that are unveiled in the case of purposeful distortion of real patient condition, spread telemetry, alarm behavior, and displayed clinical context.
3.1. Smart Hospital IoMT Simulation Environment and Topology Design
The proposed methodology was implemented within a realistic smart hospital IoMT simulation environment constructed in GNS3. The complete networked healthcare environment was instantiated according to a floor-plan-guided architectural design and configured to reproduce the operational interactions among patient-side medical devices, ICU and ward monitoring nodes, nursing stations, IoMT gateways, alarm services, health-information systems, imaging workstations, security-monitoring components, and building-automation controllers. The implemented simulation was organized into multiple functional hospital areas, including monitored patient rooms, intensive-care and ward-monitoring areas, imaging and examination zones, administrative and biomedical-support areas, a central server and data-management block, an OT/security block, remote-access services, and an external adversarial segment. This multi-zone organization provided the distributed operational structure required for the executed smart-hospital experiments.
To preserve architectural realism and cyber-physical relevance, the GNS3 environment incorporated routers, firewalls, switches, workstations, servers, PLC-driven subsystems, and representative IoMT endpoints, including bedside monitors, infusion pumps, ventilators, ECG sensors, and SpO2 sensors. GNS3 therefore served as the operational emulation environment in which communication paths, service interactions, routing dependencies, adversarial routes, and attack surfaces were instantiated and exercised. The resulting topology reproduced cross-layer interactions among physiological telemetry, gateway forwarding, alarm propagation, clinician-facing visualization, security monitoring, and contextual-state synchronization.
The implemented environment supported controlled execution of benign and adversarial scenarios together with synchronized traffic generation, event logging, feature extraction, and stage-aware analytical assessment. In particular, the simulation allowed patient-state information to be followed from physiological sensing through gateway-mediated telemetry transmission, alarm processing, and clinician-visible presentation, thereby providing the experimental substrate required to construct and evaluate telemetry–alarm–context dissociation. The methodology is organized into six interconnected subsections covering GNS3 topology implementation, device and service configuration, attack execution, dataset generation and feature extraction, machine-learning-based detection, and the fifteen experimental configurations.
Figure 2 illustrates the complete GNS3 topology implemented for the smart hospital IoMT experiments. The topology contains monitored patient rooms, ICU and ward-monitoring segments, imaging and examination resources, administrative and biomedical-support systems, a central clinical core, an OT/security segment, remote-access infrastructure, and a controlled adversarial segment. Physiological sensors, bedside monitors, infusion pumps, gateways, workstations, servers, automation controllers, security systems, and routing devices were interconnected through defined communication paths rather than isolated point-to-point links. This organization enabled normal telemetry delivery, gateway forwarding, clinical visualization, alarm propagation, security monitoring, infrastructure-control communication, and adversarial traffic generation to be reproduced within one integrated environment.
Figure 2.
Implemented GNS3 smart hospital IoMT simulation topology used for benign operation, adversarial execution, and multi-source trace generation.
The topology also defines the communication dependencies used during execution of the patient-state perception dissociation scenarios. Patient-side observations travel through sensing and gateway layers toward the central clinical services, while alarms and clinician-visible context are generated through their corresponding processing paths. The controlled external adversarial path was implemented separately from these internal clinical segments. Specifically, the attacker endpoint resides in the adversarial VLAN 90 subnet and reaches the hospital perimeter through the multi-hop external path represented by R3, R2, the upstream network, R1, and Hospital-FW-01. The attacker is therefore not modeled as a host directly connected to R1 or directly attached to the protected hospital perimeter.
This addressing distinction is important for interpretation of the topology. The subnet 10.10.90.0/24 represents the attacker-facing adversarial LAN behind R3, whereas point-to-point or upstream addressing used around the external edge represents routing/transit connectivity and is not the attacker host network. Consequently, adversarial traffic generated from VLAN 90 follows the configured routing path before reaching the hospital boundary. Access beyond Hospital-FW-01 is subject to the firewall and remote-access policies described in the subsequent device-configuration and attack-execution subsections; the topology does not assume unrestricted external bypass of the perimeter firewall.
Figure 2 therefore defines the experimental substrate from which the simulation traces were generated and subsequently transformed into the analytical dataset. Attack stages were executed over these instantiated communication dependencies, and the resulting network, gateway, telemetry, alarm, security, and clinical-context observations were collected for the downstream machine-learning process described in Section 3.4 and Section 3.5.
Table 1 summarizes the nodes instantiated in the GNS3 smart hospital environment and their operational or security roles. The deployed assets cover the external edge, perimeter-protection layer, central clinical services, ICU monitoring, ward observation, imaging, device-management support, OT/security infrastructure, and remote-access domains. This heterogeneous composition enabled the experiments to reproduce interactions among medical sensing, gateway forwarding, clinical services, infrastructure control, security monitoring, and controlled adversarial activity rather than modeling the hospital as a collection of isolated IoMT sensors.
Table 1.
Smart hospital node inventory and functional roles.
From an analytical perspective, the patient-side telemetry sources include ICU-Monitor-01, ECG-Sensor-01, BedMonitor02, SpO2 sensors, and other medical endpoints, while IoMT-Gateway-01, IoMTGateway02, Device-Mgmt-SRV-01, and the central services support aggregation, forwarding, management, and storage. Security and infrastructure visibility is provided through Hospital-FW-01, SIEM-SRV-01, HVAC-PLC-01, AccessControlPLC01, and the associated OT/security resources. The external attacker node provides the controlled adversarial source used during attack-stage execution. Together, these nodes form the operational basis for telemetry propagation, alarm-related workflows, remote access, security observation, and the multi-stage patient-state perception dissociation experiments.
Table 2 defines the segmentation and addressing used in the executed GNS3 environment. Clinical telemetry, device management, imaging, ward operations, central services, OT/security functions, remote-access infrastructure, adversarial activity, and perimeter routing are separated into dedicated communication domains. Inter-zone communication is controlled through the corresponding routing and security infrastructure rather than through unrestricted direct connectivity.
Table 2.
Network segmentation, VLAN assignment, addressing scheme, and controlled external-adversarial routing roles.
Of particular relevance to the attack experiments, VLAN 90 (10.10.90.0/24) is the dedicated adversarial LAN containing the attacker endpoint, Attacker-SW-01, and its R3-side connectivity. Traffic originating from this segment follows the intended multi-hop path through R3 and the external-access/upstream routing infrastructure before reaching R1 and Hospital-FW-01. The external-edge transit network used by R1 is therefore distinct from the attacker LAN and does not represent the attacker’s local subnet. This separation preserves the topology shown in Figure 2 and prevents the attacker from being modeled as directly adjacent to the hospital edge router.
The segmentation scheme consequently provides both functional isolation of medical and operational resources and a controlled basis for reproducing the successive ingress, internal-pivoting, gateway-compromise, telemetry-manipulation, alarm-interference, and cross-layer dissociation conditions examined in the subsequent experiments.
3.2. Device Emulation, Service Deployment, and Communication Logic
The smart hospital IoMT environment was instantiated in GNS3 using a heterogeneous collection of clinically relevant, infrastructure, security, and external-access nodes distributed across the functional zones defined in Table 2. The emulated assets included bedside monitors, infusion pumps, ECG and SpO2 sensors, nurse-station workstations, imaging systems, IoMT gateways, device-management servers, building-automation controllers, security appliances, and central clinical services. Remote-access endpoints and a dedicated adversarial segment were also instantiated to reproduce controlled external interaction and multi-stage attack progression.
The communication logic preserved the functional dependencies among physiological sensing, gateway-mediated forwarding, central monitoring, alarm processing, clinical visualization, and security observation. Patient-side devices generated physiological observations that were forwarded through local gateway and access components toward telemetry, alarm, and clinical-information services. Administrative, security, building-management, remote-access, and adversarial traffic were maintained within their corresponding network segments and traversed the routing and security infrastructure defined by the topology. This configuration allowed benign operation and adversarial behavior to be executed over the same underlying hospital communication environment while preserving the cross-layer dependencies required for patient-state perception dissociation analysis.
Figure 3 illustrates the hierarchical communication structure instantiated in the GNS3 environment. Physiological observations and device-status messages generated by bedside monitors, infusion systems, ECG sensors, SpO2 sensors, and other patient-facing assets are first delivered to their local access or gateway layer. The gateway layer subsequently forwards the resulting telemetry toward central telemetry services, alarm-processing components, EHR-related services, databases, and clinician-facing workstations. This hierarchy reproduces the mediated nature of smart-hospital communication, in which patient observations pass through multiple forwarding and processing components before becoming visible to clinical personnel.
Figure 3.
Implemented device-to-gateway-to-server communication architecture and controlled external-access path in the GNS3 smart hospital IoMT environment.
The same architecture establishes the communication dependencies required by the cross-layer threat model. Manipulation of an intermediate gateway, telemetry stream, alarm process, or clinical-context representation can modify the semantic relationship between the patient’s actual physiological state and the information available at downstream clinical interfaces even when basic network connectivity remains available. Figure 3 therefore provides both the operational communication model and the structural basis from which telemetry–alarm–context inconsistencies were generated and subsequently analyzed by the attention-enhanced CNN–BiLSTM framework.
Table 3 summarizes the communication relationships exercised during benign operation and adversarial execution. Of particular importance, the table distinguishes the attacker LAN from the R1-facing upstream transit network. The attacker originates in VLAN 90, reaches R3 through Attacker-SW-01, and subsequently traverses R3, R2, the external transit path, and R1 before reaching Hospital-FW-01. The point-to-point address used on the external interface of R1 therefore represents upstream transit connectivity rather than the address of the attacker host.
Table 3.
Communication flows, protocol mapping, and controlled external-access relationships in the implemented smart hospital IoMT environment.
The main node configurations were instantiated using Linux-based GNS3 appliances. Only the configuration elements directly relevant to addressing, routing, exposed services, telemetry collection, and security observation are retained below; routine package-installation and verification commands are omitted because they do not affect the conceptual cybersecurity workflow.
The edge router R1 provides the final upstream routing hop before Hospital-FW-01. Its external point-to-point interface uses the 200.10.0.0/30 transit network, whereas its hospital-facing interface belongs to the perimeter backbone. In this configuration, 200.10.0.2 denotes the upstream transit peer and not the attacker endpoint.
# R1 edge-router addressing and routing |
ip addr add 200.10.0.1/30 dev eth0 |
ip addr add 10.10.99.1/24 dev eth1 |
ip link set eth0 up |
ip link set eth1~up |
sysctl -w net.ipv4.ip_forward=1 |
ip route replace 10.10.0.0/16 via~10.10.99.2 |
# Upstream transit-peer reachability |
ping -c 4 200.10.0.2 |
Hospital-FW-01 was configured as the stateful enforcement point between the external edge and the protected clinical network. The default INPUT and FORWARD policies remained restrictive, established and related traffic was permitted, and internal hospital nodes were allowed to initiate outbound communication. Consequently, unsolicited inbound connectivity was not generally permitted.
For the controlled E2 foothold experiment, one explicitly defined exception was introduced rather than bypassing the firewall. TCP port 8443 on the perimeter-facing interface was mapped to the HTTPS service of Device-Mgmt-SRV-01 (10.10.20.20:443), and the forwarding policy permitted only new TCP connections associated with this destination. This service represented the deliberately exposed remote-management surface used in the controlled adversarial scenario. All other unsolicited inbound forwarding remained blocked by the default policy. The initial foothold therefore occurred through a specifically permitted experimental service, after which the subsequent pivoting and internal attack stages were executed through the staged attack logic described in Section 3.3.
# Hospital firewall addressing |
ip addr add 10.10.99.2/24 dev eth0 |
ip addr add 10.10.60.1/24 dev eth1 |
ip link set eth0 up |
ip link set eth1~up |
sysctl -w net.ipv4.ip_forward=1 |
# Routing |
ip route replace default via 10.10.99.1 |
ip route replace 10.10.0.0/16 via~10.10.60.2 |
# Restrictive baseline |
iptables -F |
iptables -t nat -F |
iptables~-X |
iptables -P INPUT DROP |
iptables -P FORWARD DROP |
iptables -P OUTPUT~ACCEPT |
# Stateful return traffic |
iptables -A INPUT -i lo -j ACCEPT |
iptables -A INPUT -m conntrack \ |
--ctstate ESTABLISHED,RELATED -j ACCEPT |
iptables -A FORWARD -m conntrack \ |
--ctstate ESTABLISHED,RELATED -j~ACCEPT |
# Controlled experimental remote-management exposure: |
# external TCP/8443 -> Device-Mgmt-SRV-01 TCP/443 |
iptables -t nat -A PREROUTING -i eth0 \ |
-p tcp --dport 8443 \ |
-j DNAT --to-destination 10.10.20.20:443 |
iptables -A FORWARD -i eth0 \ |
-p tcp -d 10.10.20.20 --dport 443 \ |
-m conntrack --ctstate NEW,ESTABLISHED \ |
-j~ACCEPT |
# Allow hospital-originated outbound communication |
iptables -A FORWARD -s 10.10.0.0/16 -o eth0 -j~ACCEPT |
# Source NAT for hospital-originated external communication |
iptables -t nat -A POSTROUTING \ |
-s 10.10.0.0/16 -o eth0 -j MASQUERADE |
This firewall configuration reconciles the external-compromise stage with the restrictive perimeter policy. The attack did not rely on arbitrary inbound access through Hospital-FW-01. Instead, adversarial traffic first traversed the intended external route and could reach only the designated exposed management service. The corresponding permitted connection generated firewall and service traces that were included in the pre-compromise and intrusion-progression observations used for dataset construction.
IoMT-Gateway-01 operated as an active telemetry aggregation and forwarding component in the device-management segment. The gateway used a fixed address on VLAN 20 and ran a local MQTT broker to reproduce the publish/subscribe behavior required for medical telemetry forwarding. During the later adversarial stages, this instantiated gateway provided the controlled intermediate point at which replay, delay, or semantic modification of telemetry could be introduced according to the attack scenario.
# IoMT gateway core configuration |
ip addr add 10.10.20.10/24 dev eth0 |
ip link set eth0 up |
ip route replace default via~10.10.20.1 |
systemctl enable mosquitto |
systemctl restart~mosquitto |
mosquitto_pub -h 127.0.0.1 \ |
-t "ward/telemetry/test" \ |
-m "gateway_online" |
Device-Mgmt-SRV-01 was instantiated at 10.10.20.20/24 as the internal management-service endpoint. HTTPS and administrative services were enabled for device-supervision operations. Its HTTPS service was also the specifically exposed experimental entry point referenced by the firewall policy above, thereby providing a reproducible initial access surface without making the remainder of the internal network directly reachable from the external side.
# Device-management server core configuration |
ip addr add 10.10.20.20/24 dev eth0 |
ip link set eth0 up |
ip route replace default via~10.10.20.1 |
systemctl enable ssh |
systemctl restart~ssh |
systemctl enable apache2 |
systemctl restart apache2 |
Telemetry-SRV-01 was configured as a central observation point for physiological and gateway-mediated communication. Its fixed address on the clinical-core subnet and packet-capture process allowed packet- and flow-level records to be collected during both benign and adversarial scenarios. These traces were subsequently synchronized with gateway, alarm, security, and clinician-context records as described in Section 3.4.
# Telemetry server core configuration |
ip addr add 10.10.60.30/24 dev eth0 |
ip link set eth0 up |
ip route replace default via~10.10.60.1 |
# Scenario trace acquisition |
timeout 60 tcpdump -i eth0 -nn -tttt \ |
-w telemetry_core_capture.pcap |
SIEM-SRV-01 operated as the centralized security-observation node in VLAN 70. UDP and TCP syslog listeners were enabled on port 514 so that security-relevant records generated by perimeter, gateway, clinical, and infrastructure components could be collected during scenario execution. These records provided the security-event component of the heterogeneous GNS3 trace set used for subsequent feature extraction.
# SIEM server core configuration |
ip addr add 10.10.70.20/24 dev eth0 |
ip link set eth0 up |
ip route replace default via~10.10.70.1 |
# Centralized syslog reception |
cat > /etc/rsyslog.d/10-listener.conf <<EOF |
module(load="imudp") |
input(type="imudp" port="514") |
module(load="imtcp") |
input(type="imtcp" port="514") |
EOF |
systemctl enable rsyslog |
systemctl restart rsyslog |
Collectively, these configurations establish the implemented communication and security substrate used in the experimental study. The external attacker was kept within the dedicated VLAN 90 adversarial segment, external traffic traversed the intended R3–R2–upstream–R1 path, Hospital-FW-01 enforced restrictive stateful filtering with only a narrowly defined experimental management-service exception, and the internal gateway, telemetry, management, and SIEM nodes produced the heterogeneous observations required for attack execution and downstream dataset construction.
3.3. Attack Scenario Construction, Attack-Taxonomy Distinction, and Adversarial Execution Logic
The patient-state perception dissociation attack considered in this study is defined as a multi-stage cross-layer adversarial formulation whose objective is to separate the patient’s underlying physiological condition from the digital state ultimately available to clinical personnel while preserving an apparently functioning communication environment. The attack may therefore remain difficult to recognize using availability-, traffic-volume-, or single-layer monitoring alone because individual services can continue to operate even though the semantic relationship among physiological telemetry, gateway forwarding, alarm behavior, and clinician-visible information has been progressively corrupted.
The individual cyberattack mechanisms used to construct this scenario are not claimed as independently novel attack techniques. Replay attacks, false-data or semantic data manipulation, command/event manipulation, alarm delay or suppression, unauthorized access, internal pivoting, and interception or man-in-the-middle-style mediation are established adversarial mechanisms. In the present framework, such mechanisms are treated as attack primitivesor enabling actions that may be instantiated at different points of the smart-hospital IoMT communication path.
The methodological contribution of the proposed threat formulation lies instead in the coordinated clinical objective assigned to these primitives. Rather than terminating when an attacker achieves unauthorized access, intercepts a flow, replays telemetry, modifies a value, or suppresses an alarm, selected mechanisms are orchestrated across dependent network, gateway, telemetry, alarm, and clinician-presentation layers. Their combined objective is to produce a clinically plausible but incorrect digital patient representation while the underlying physiological state follows a different trajectory. The term patient-state perception dissociation therefore refers to this cross-layer semantic end state and the coordinated process used to construct it, rather than to a newly invented replay, injection, interception, or alarm-suppression primitive.
Accordingly, an isolated retransmission of previously observed telemetry is classified as a replay attack; alteration of selected physiological values is a form of data or semantic manipulation; modification of event or control information is a form of command/data manipulation; delayed or hidden alerts constitute alarm interference; and compromise of an intermediate forwarding component may provide an interception or mediation capability comparable to known man-in-the-middle-style behavior. These actions become components of the proposed patient-state perception dissociation scenario only when they are coordinated toward the cross-layer objective of maintaining a false-safe clinical representation.
Table 4 establishes the terminology used throughout the remainder of the methodology. In particular, the terms replay attack, data manipulation, alarm suppression, interception, and internal pivoting refer to established attack mechanisms. Cross-layer orchestration describes how selected mechanisms are coordinated, whereas patient-state perception dissociation denotes the resulting clinically significant adversarial condition. The proposed CNN–BiLSTM framework addresses a separate problem: detecting the progression of these conditions from observation-based temporal evidence.
Table 4.
Conceptual distinction among established attack techniques, cross-layer orchestration, the proposed patient-state perception dissociation formulation, and the associated detection problem.
3.3.1. Formal Separation of Attack Primitives, Orchestration, and Adversarial Objective
Let the set of available adversarial primitives be represented abstractly as
where the elements denote access establishment, internal movement, intermediary observation/manipulation, telemetry replay, data/semantic modification, alarm interference, and clinician-context distortion, respectively. The set consists of attack mechanisms rather than the proposed attack contribution itself.
The coordinated adversarial process is represented by an ordered orchestration
where the selected primitives are applied at different cyber and clinical layers according to the attack scenario. Not every realization is required to instantiate every possible primitive; rather, the defining property is that the selected actions jointly influence the downstream relationship among patient-state observations, forwarding behavior, alarm response, and clinician-visible context.
Let represent the underlying physiological state and represent the patient state presented through the relevant digital clinical interfaces. The adversarial objective of patient-state perception dissociation can be expressed conceptually as
under an operating condition in which the affected communication and service paths can remain sufficiently available to avoid an obvious denial-of-service signature. The inequality represents semantic disagreement rather than a model-input feature. Quantitative actual–displayed discrepancy measures are calculated only for retrospective severity assessment, as defined in Section 3.4, and are not supplied to the classifier.
The detection problem is distinct from the adversarial formulation. Given an observation-based temporal tensor constructed according to Section 3.4, the downstream model estimates
where the six classes correspond to Benign, Pre-Compromise, Internal Compromise/Pivoting, Telemetry Manipulation, Alarm Interference, and Cross-Layer Dissociation. Thus, attack execution constructs the controlled adversarial conditions, whereas the detection model subsequently learns to recognize those conditions from the underlying observations.
Figure 4 illustrates the distinction between attack mechanisms and the overall adversarial objective. The early portion of the chain represents enabling intrusion behavior, including external access, internal pivoting, and compromise of strategically positioned forwarding resources. Subsequent stages use established manipulation mechanisms, including telemetry replay or alteration, alarm interference, and clinician-context distortion. Their coordinated operation across dependent layers produces the proposed cross-layer dissociation condition.
Figure 4.
Cross-layer orchestration of established adversarial techniques toward the proposed patient-state perception dissociation objective in the smart-hospital IoMT environment.
The figure should therefore not be interpreted as presenting each action as a new cyberattack type. External access and pivoting provide reachability; gateway compromise enables observation or manipulation of downstream communications; replay and data alteration affect the patient-information path; alarm interference changes the alerting path; and context manipulation affects the human-facing representation. Novelty is associated with their orchestration toward sustained semantic separation between physiological truth and clinical perception.
Table 5 separates the technique used at each stage from the role of that stage in the proposed cross-layer threat formulation. Stages S1–S7 primarily establish adversarial access, progression, and observation capability. These stages employ known intrusion and intermediary compromise concepts and do not by themselves constitute patient-state perception dissociation.
Table 5.
Attack stages, underlying attack-technique roles, and cross-layer orchestration paths in the proposed smart-hospital IoMT scenario.
Stages S8–S10 apply established manipulation mechanisms to clinically relevant information paths. S8 represents replay or semantic data alteration, S9 represents alarm interference, and S10 represents clinician-context distortion. Each mechanism can exist independently as a conventional attack technique. The proposed threat formulation emerges when such mechanisms are coordinated across dependent layers, as represented by S11 and S12, to produce a coherent false-safe patient representation.
This distinction also clarifies the relationship between a cyber–physical attack in the broad sense and the specific formulation considered here. Patient-state perception dissociation is a particular cross-layer cyber–physical deception objective in which the adversary targets the semantic relationship between physiological reality and the information used for clinical interpretation. The claim of novelty therefore concerns this clinically motivated orchestration and end-state formulation rather than the existence of cyber–physical, replay, injection, interception, or suppression attacks as general categories.
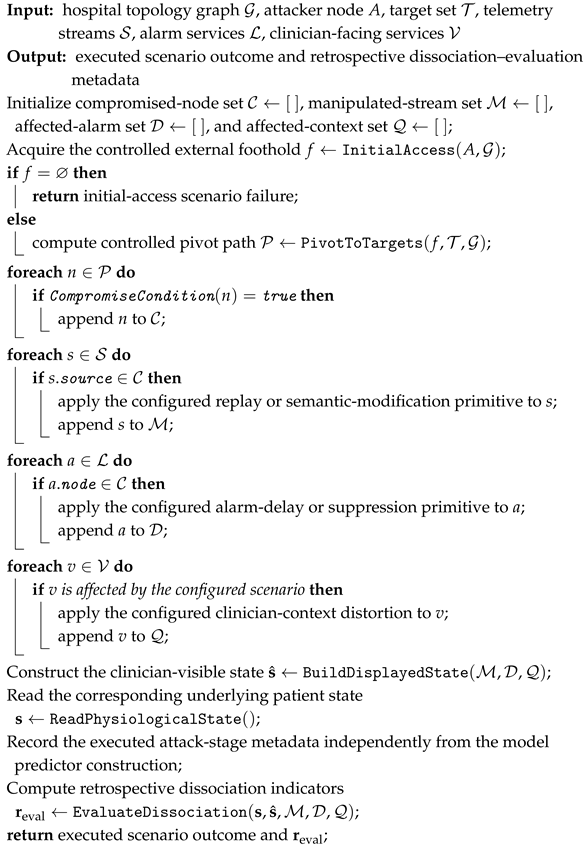
Algorithm 1 describes the construction of the adversarial scenario rather than the operation of the detection model. The first part establishes controlled access and progression toward selected internal components. The subsequent operations instantiate established attack primitives, including telemetry replay or modification and alarm interference, followed where configured by distortion of the clinician-facing patient context. The final operations combine the resulting effects into the cross-layer patient-state perception condition.
The retrospective dissociation indicators generated at the end of Algorithm 1 are used only to characterize whether and to what extent the intended adversarial condition was realized. They are not appended to the CNN–BiLSTM predictor tensor. Ground-truth classifier labels are assigned separately from the controlled scenario schedule as described in Section 3.4. This maintains a strict separation between attack construction, retrospective attack-severity assessment, and machine-learning detection.
| Algorithm 1: Cross-Layer Patient-State Perception Dissociation Scenario Execution |
 |
3.3.2. Controlled External Adversarial-Node Initialization
The external adversarial node is initialized as a controlled endpoint within the dedicated adversarial segment defined by the smart-hospital topology. Its network parameters are obtained from the corresponding experiment configuration rather than being hard-coded to the upstream point-to-point transit network. This preserves the intended multi-hop adversarial path and keeps the attacker subnet logically distinct from the perimeter transit link. A parameterized initialization form is shown below.
# Controlled external adversarial-node initialization |
sudo apt-get update |
sudo apt-get install -y iproute2 iputils-ping traceroute dnsutils~net-tools |
sudo hostnamectl set-hostname~attacker-node |
# Values are loaded from the adversarial-segment experiment configuration |
: "${ATTACKER_ADDR:?Set ATTACKER_ADDR according to the GNS3 scenario}" |
: "${ATTACKER_GW:?Set ATTACKER_GW according to the GNS3 scenario}" |
sudo ip addr flush dev eth0 |
sudo ip addr add "$ATTACKER_ADDR" dev eth0 |
sudo ip link set eth0 up |
sudo ip route replace default via "$ATTACKER_GW" |
# Verification |
ip addr show dev eth0 |
ip route show |
ping -c 4 "$ATTACKER_GW" |
traceroute "$ATTACKER_GW" |
The initialization procedure establishes only the network state required for the controlled adversarial endpoint to participate in the executed GNS3 scenario. It does not itself define a new attack mechanism. Subsequent scenario stages determine which established primitives are activated and how they are coordinated across the smart-hospital communication path.
This separation of concepts is maintained throughout the subsequent methodology. Section 3.4 describes how observations generated by the benign and adversarial executions are transformed into leakage-controlled, observation-based datasets; Section 3.5 defines the CNN–BiLSTM–attention classification problem; and Section 3.6 maps the controlled scenario realizations to the fixed six-class prediction space. Accordingly, the proposed contribution should be interpreted as a clinically motivated cross-layer threat formulation and corresponding detection framework rather than as a claim that the underlying replay, false-data manipulation, interception, pivoting, alarm suppression, or cyber–physical attack techniques are themselves newly introduced.
3.4. Dataset Generation, Leakage-Controlled Partitioning, Preprocessing, Labeling, and Feature Extraction
The GNS3-based smart-hospital environment serves as the controlled simulation and data-generation layer of the proposed framework, whereas the machine-learning stage is executed subsequently on observations produced by the benign and adversarial scenarios. Experiments E1–E14 generate the operational and attack traces required for benchmark construction, while experiment E15 represents the consolidated model-development and evaluation configuration. The learning model is therefore not executed inside GNS3; rather, GNS3 generates the heterogeneous network, gateway, physiological, alarm, security, and clinician-facing observations from which the analytical input to the attention-enhanced CNN–BiLSTM model is constructed.
Each execution of a controlled GNS3 scenario is treated as an independent scenario run or capture session. A unique run identifier is associated with all packet, gateway, telemetry, alarm, clinician-context, and security records generated during that execution. The run identifier is used exclusively for provenance tracking, leakage-controlled partitioning, and reproducibility; it is never provided to the classifier as an input feature.
A strict distinction is maintained among four types of information: (i) direct observations generated by the emulated environment, (ii) non-target-defining operational predictors derived from those observations, (iii) metadata used only for synchronization, grouping, and ground-truth assignment, and (iv) retrospective dissociation quantities used only for post hoc analysis. Direct observations include physiological measurements, gateway events, alarm states, clinician-facing displayed values, packet and flow observations, firewall events, authentication events, and SIEM records. Ordinary derived predictors include quantities such as packet and byte counts, flow duration, inter-arrival behavior, gateway forwarding rate, gateway delay, security-event counts, and cross-segment transition counts.
In contrast, actual–displayed physiological gaps, telemetry–alarm misalignment measures, telemetry–context mismatch measures, the overall dissociation magnitude, the dissociation-outcome flag, and the operational-stage label are excluded from the model predictor vector. Similarly, run identifiers, experiment identifiers, absolute wall-clock timestamps, literal IP/MAC addresses, hostnames, and other identifiers that could reveal a particular synthetic execution are retained only as metadata and are not supplied as predictors. This design reduces the possibility that the classifier learns capture identity, fixed addressing, predetermined scenario timing, or an explicitly constructed representation of the target condition rather than the underlying cyber–clinical behavior.
During each scenario run, observations are collected from the functional components represented in the smart-hospital topology. Network packet traces characterize protocol behavior, communication volume, relative timing, and endpoint roles; gateway records describe telemetry reception, forwarding, queueing, and service behavior; medical-device and bedside-monitor streams provide physiological observations; alarm-service records provide alarm state, severity, visibility, and event timing; clinician-facing workstation records preserve the values and contextual information presented to clinical personnel; and firewall, authentication, routing, and SIEM records characterize security activity and adversarial progression.
Exact network addresses are not treated as semantic predictors. Where communication endpoints are required for analysis, they are represented by functional roles, such as external source, perimeter node, gateway, telemetry service, alarm service, clinician workstation, or security-monitoring node, rather than by literal IP addresses. Likewise, absolute timestamps are used for synchronization but are excluded from the learning representation; temporal behavior is represented through relative or within-window quantities such as inter-arrival intervals, flow duration, and event-order relationships.
3.4.1. Run-Level Partitioning and Temporal Leakage Control
The training, validation, and testing division is performed at the level of complete independent scenario runs rather than at the level of individual records, observation windows, or temporal sequences. Complete run groups are assigned to the training, validation, and testing partitions according to the 70%/15%/15% protocol, while preserving representation of the relevant supervised classes whenever possible. Once a run is assigned to a partition, all raw records, windows, and temporal sequences originating from that run remain exclusively in that partition.
The experimental results reported in Tables 10–13 were obtained using the observation-based predictor representation and run-grouped partitioning protocol described in this subsection. Actual–displayed physiological gaps, telemetry–alarm misalignment measures, telemetry–context mismatch measures, and dissociation scores were excluded from the classifier input throughout training, validation, and testing. These quantities were retained exclusively for retrospective severity assessment. The original experimental pipeline assigned complete independent scenario runs to mutually exclusive training, validation, and testing subsets using the 70%/15%/15% allocation. Feature extraction, preprocessing, temporal-sequence construction, and model evaluation followed this same protocol. Consequently, the numerical results presented in Tables 10–13 correspond to the experimental procedures specified in this methodology.
This grouping constraint is particularly important for temporal IoMT data. Adjacent or overlapping windows extracted from the same capture may contain highly similar packet sequences, physiological measurements, device states, and attack transitions. Randomly distributing such windows among training, validation, and testing subsets could therefore expose the model to nearly duplicated observations during both optimization and evaluation. The adopted run-level procedure prevents this condition by enforcing
where , , and denote the sets of run identifiers assigned to training, validation, and testing, respectively.
For any scenario run g, all samples derived from that run therefore satisfy
but never more than one of these sets. Here, denotes all model-ready temporal samples originating from run g. Thus, no temporal window from one capture can contribute to model training while another adjacent or overlapping window from the same capture is used for validation or testing.
The split is established before any data-dependent preprocessing parameters are estimated. Deterministic record operations, such as timestamp alignment, format validation, and duplicate removal within a run, do not use information from other partitions. Any imputation rule requiring estimated statistics, numerical scaling parameters, or categorical encoding vocabulary is fitted using training-run observations only and subsequently applied unchanged to the validation and test runs.
3.4.2. Window Construction and Observation-Based Predictors
Within each run, heterogeneous records are aligned according to their timestamps and partitioned into fixed observation intervals of duration . Windows are constructed independently for each run and are never allowed to cross a run boundary. Let
denote the set of synchronized observation windows generated from scenario run g, where is the number of windows available in that run.
For each , an observation-based predictor vector is constructed. The vector preserves the underlying components of a potentially inconsistent patient state as separate variables. For example, physiological heart rate and clinician-displayed heart rate remain distinct features rather than being replaced by an actual–displayed heart-rate gap. Physiological SpO2 and displayed SpO2, alarm activation and visibility, gateway behavior, and network/security observations are likewise maintained as separate evidence. The CNN, BiLSTM, and attention mechanisms are therefore required to learn their relationships from the temporal observations.
The model-input representation includes network-flow behavior, endpoint-role information, gateway activity, physiological telemetry, clinician-facing displayed values, alarm observations, and security activity. It does not include actual–displayed physiological gaps, telemetry–alarm misalignment scores, telemetry–context mismatch scores, dissociation magnitude , dissociation-outcome metadata, operational-stage labels, capture/run identifiers, experiment identifiers, absolute timestamps, or literal node addresses.
Figure 5 summarizes the complete simulation-to-learning interface. Independent GNS3 executions first generate raw cross-layer observations. Entire executions are assigned to mutually exclusive training, validation, or testing groups before model-dependent preprocessing is fitted. Windows and temporal sequences are subsequently constructed only within their originating runs, ensuring that no sequence crosses a capture or partition boundary. The resulting observation-based predictors are supplied to the learning model, while ground-truth labels and retrospective dissociation quantities follow independent analytical paths.
Figure 5.
Leakage-controlled GNS3-to-ML dataset pipeline showing independent scenario-run grouping, mutually exclusive training/validation/test allocation, within-run temporal-window construction, observation-based feature extraction, separate ground-truth labeling, and retrospective dissociation analysis.
Table 6 separates predictor variables from metadata that could otherwise create shortcuts. Direct observations and ordinary operational statistics constitute the learning representation. Exact IP addresses, hostnames, run identifiers, experiment identifiers, and absolute timestamps do not enter the model. Functional endpoint roles and relative temporal behavior preserve the relevant communication structure without exposing the identity of a particular capture or deterministic scenario position.
Table 6.
Provenance and analytical role of model inputs, grouping metadata, retrospective dissociation quantities, and supervised targets.
The actual–displayed HR and SpO2 gaps, telemetry–alarm misalignment, telemetry–context mismatch, and dissociation magnitude likewise remain outside the learning representation. They are calculated independently for retrospective analysis and are not available to the model during optimization or inference.
3.4.3. Mathematical Formulation of Run-Grouped Observations, Predictors, Retrospective Quantities, and Class Labels
For independent scenario run g, let the heterogeneous raw records be
The run identifiers are divided into mutually exclusive groups,
The target allocation follows the 70%/15%/15% training, validation, and testing protocol at the run-group level rather than by randomly selecting individual temporal windows.
After within-run synchronization, records belonging to run g are divided into
Let denote the direct observable quantities from and let contain only non-target-defining operational transformations. The model predictor is
Explicit dissociation descriptors are computed separately as
with
For the directly interpretable physiological discrepancies,
These quantities are computed only for retrospective evaluation. Their constituent observations may remain separate model inputs, but the explicit difference itself does not enter the classifier.
The dissociation magnitude is similarly retained only for severity analysis,
Ground-truth stage assignment follows an independent scenario-metadata path,
where class 0 denotes Benign, class 1 denotes Pre-Compromise, class 2 denotes Internal Compromise/Pivoting, class 3 denotes Telemetry Manipulation, class 4 denotes Alarm Interference, and class 5 denotes Cross-Layer Dissociation. These six categories constitute the complete classifier output space. The metadata , the run identifier g, and the resulting ground-truth label are not available to the feature extraction function.
The observation-based feature-generation process is therefore
subject to
Temporal sequences are then generated strictly within the same run. For sequence length T,
No sequence is allowed to contain windows from different runs,
and consequently no model-ready sample can cross a training, validation, or test boundary.
The three model datasets are defined according to run membership:
Thus,
The complete model-ready dataset can then be expressed as
The separately retained retrospective evaluation representation is
which is used only for post hoc cross-layer severity analysis and never for model fitting, model-state selection, or inference.
Algorithm 2 makes the partitioning unit explicit. The primary unit of separation is the independent GNS3 scenario run, not an individual row, fixed-duration window, or CNN–BiLSTM sequence. A complete capture is assigned to exactly one partition before its model-ready sequences are used. Consequently, adjacent or overlapping observations originating from the same execution cannot appear simultaneously in training and held-out evaluation data.
| Algorithm 2: Run-Grouped GNS3 Observation Processing, Leakage-Controlled Temporal-Sequence Construction, and Independent Evaluation-Quantity Extraction |
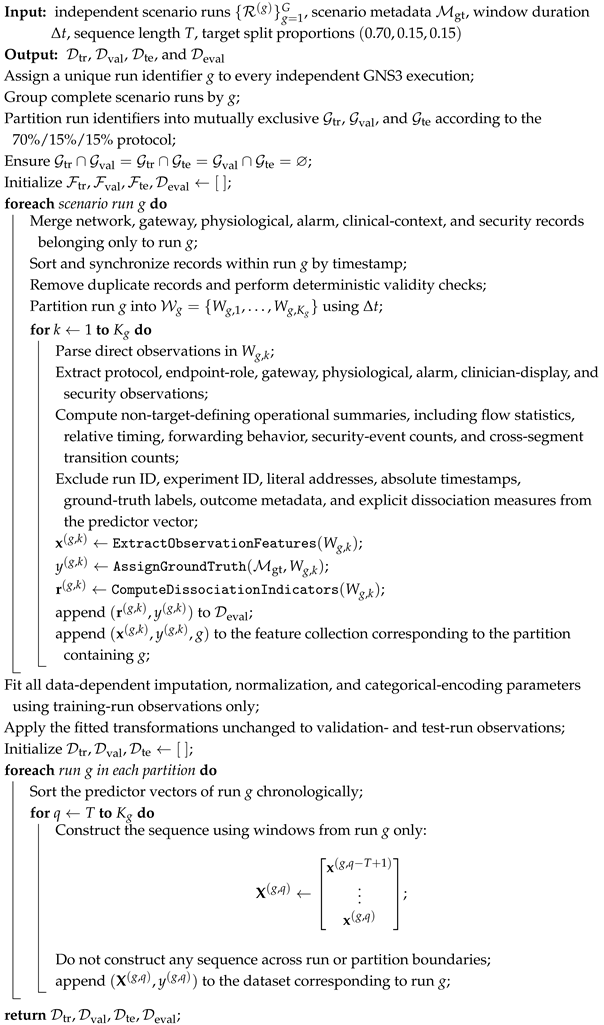 |
The algorithm additionally ensures that model-dependent preprocessing does not transfer information from held-out data into the training pipeline. Scaling, categorical mappings, and any statistically estimated missing-value treatment are fitted on training-run observations only and are subsequently frozen when processing validation and test runs.
A second source of potential shortcut learning is controlled through feature selection. Run identifiers, experiment identifiers, absolute timestamps, literal node addresses, and explicit dissociation/mismatch quantities are not included in the input tensor. The model instead receives observation-based network, gateway, physiological, alarm, clinician-display, and security evidence. This prevents direct use of capture identity, fixed network addressing, predetermined absolute stage timing, or a precomputed representation of the attack definition as a classification shortcut.
The run-grouped holdout protocol evaluates generalization to observations from executions that were not used for parameter fitting. Nevertheless, the present evaluation remains confined to the controlled GNS3 smart-hospital environment. Run-level separation prevents capture-level and temporal-window leakage, but it does not by itself demonstrate invariance to entirely different network topologies, device populations, addressing schemes, attack implementations, or real-hospital operating conditions. The reported test performance should therefore be interpreted as held-out cross-run generalization within the defined simulated environment rather than as direct evidence of unrestricted real-world generalization.
Implementation-level packet-capture, MQTT-logging, firewall-monitoring, workstation-recording, and SIEM-log-reception utilities serve only as observation mechanisms at the relevant GNS3 nodes. Their role is to expose the underlying cyber and clinical evidence required by the dataset pipeline. They do not determine the training/test allocation and do not provide experimental identifiers or target-defining discrepancy quantities to the learning architecture.
3.5. Attention-Enhanced CNN–BiLSTM Model Development and Cross-Layer Dissociation Detection Strategy
The attention-enhanced CNN–BiLSTM model constitutes the analytical stage following the GNS3-based scenario execution, run-grouped dataset construction, and leakage-controlled preprocessing procedure described in Section 3.4. The GNS3 environment generates heterogeneous observations from independent benign and adversarial scenario runs, whereas the machine-learning stage operates only on the observation-based temporal tensors constructed from those records. Importantly, the training, validation, and test partitions are established at the independent scenario-run level before model fitting. Consequently, Algorithm 3 receives the already separated datasets , , and generated by the leakage-control procedure in Section 3.4 and does not perform a random window-level split.
Each temporal input tensor contains T chronologically ordered observation-based feature vectors derived from a single GNS3 scenario run g. No tensor contains windows from different runs, and no run contributes samples to more than one of the training, validation, or testing partitions. The run identifier itself is retained only for grouping and provenance and is not included among the predictor dimensions.
The feature groups supplied to the learning architecture preserve the functional structure of the smart-hospital environment while avoiding target-defining shortcuts. Network features describe protocol behavior, relative traffic timing, communication volume, and functional endpoint roles; gateway features describe forwarding activity, queue state, and delay; physiological features preserve patient-state measurements; clinician-facing features preserve displayed patient-state values; alarm features represent activation, severity, visibility, and relative timing; and security features represent firewall, authentication, routing, and SIEM activity.
Explicit actual–displayed physiological gaps, telemetry–alarm misalignment scores, telemetry–context mismatch scores, dissociation magnitude, attack outcome metadata, scenario-run identifiers, experiment identifiers, absolute timestamps, and literal node addresses are not supplied to the neural model. The physiological, alarm, gateway, network, security, and clinician-facing observations from which such relationships may arise are instead retained as separate input variables. The CNN–BiLSTM–attention architecture is therefore required to learn discriminative cross-source and temporal relationships from the underlying observations rather than receiving a precomputed representation of patient-state dissociation.
The detection strategy is based on the observation that patient-state perception dissociation may emerge through coordinated changes across several cyber and clinical sources over time rather than through a single anomalous packet or explicit service failure. The CNN block first learns compact local relationships among the multivariate observations. The BiLSTM block then models how these learned representations evolve across consecutive temporal steps in both forward and backward directions. The attention mechanism subsequently weights the resulting latent temporal states according to their learned relevance to classification. The attention-weighted representation is finally supplied to a six-class dense softmax output layer.
The complete leakage-controlled simulation-to-classification pathway is summarized as
Here, denotes the heterogeneous observations generated during independent run g; , , and are the mutually exclusive run-grouped datasets defined in Section 3.4; is the observation-based temporal tensor; denotes the CNN feature maps; denotes the BiLSTM hidden-state sequence; contains the learned temporal attention weights; is the resulting context representation; is the class-logit vector; and is the final predicted class.
Figure 6 illustrates the complete data-to-decision pathway. Independent GNS3 runs first generate packet, gateway, physiological, alarm, clinician-facing, authentication, firewall, routing, and SIEM observations. Section 3.4 subsequently assigns complete scenario runs to mutually exclusive training, validation, and testing groups, fits data-dependent preprocessing transformations using training runs only, and constructs temporal tensors exclusively within individual run boundaries. The three resulting datasets then constitute the direct inputs to the learning procedure described in this subsection.
Figure 6.
Leakage-controlled end-to-end pathway from independent GNS3 scenario runs and run-grouped temporal input construction to attention-enhanced CNN–BiLSTM six-class intrusion detection.
The neural model does not receive the raw GNS3 files directly. The records are first synchronized within their originating run, cleaned, represented through direct observations and non-target-defining operational summaries, and organized into temporal sequences . No sequence crosses a capture boundary or a training/validation/test boundary. Explicit dissociation scores and mismatch quantities are calculated along a separate retrospective-analysis path and do not enter .
The first trainable transformation is the one-dimensional CNN block. The convolutional layers operate on the temporally ordered multivariate representation and learn local relationships among network behavior, gateway activity, physiological measurements, alarm observations, clinician-facing values, and security activity. Because related observations are retained as separate variables, the convolutional block must learn useful combinations directly from the data rather than operate on an explicitly calculated dissociation score.
The CNN feature maps are subsequently supplied to the BiLSTM block. The forward LSTM models dependencies from earlier to later observations, while the backward LSTM captures complementary dependencies in the reverse direction. The resulting hidden-state sequence therefore represents how the observed cyber–clinical condition develops over the temporal interval represented by the input tensor. Since every tensor originates from a single run, these dependencies cannot cross independent capture or dataset-partition boundaries.
The temporal attention mechanism operates on the BiLSTM hidden-state sequence and learns a normalized importance coefficient for each temporal state. These coefficients determine how strongly each latent state contributes to the final context representation. The attention mechanism is not given explicit telemetry–alarm, telemetry–context, or actual–displayed mismatch scores; its weights are learned solely from the latent representation produced from the underlying observation-based inputs.
The dense output layer maps the attention-weighted representation to six class logits, which are transformed by softmax into class probabilities. The six classifier categories are identical to the label space defined in Section 3.4: Benign(0), Pre-Compromise (1), Internal Compromise/Pivoting (2), Telemetry Manipulation (3), Alarm Interference (4), and Cross-Layer Dissociation (5). Descriptive scenario terms used in Table 9, including gateway compromise, context distortion, partial multi-stage attack, and full dissociation attack, denote experimental realizations and do not introduce additional classifier outputs.
Algorithm 3 deliberately does not perform the training/validation/test split. The three datasets are received directly from the run-grouped partitioning procedure in Algorithm 2. Thus, the learning algorithm cannot randomly redistribute adjacent or overlapping temporal windows across partitions. Complete scenario runs remain mutually exclusive throughout model training, validation-based model selection, and held-out testing.
Within the training partition, sample order may be shuffled for stochastic mini-batch optimization because this operation does not change partition membership. Validation observations are used only to monitor model performance and retain the best model state. Test-run observations are excluded from parameter optimization, preprocessing estimation, and validation-based model selection and are accessed only after the final model state has been fixed.
| Algorithm 3: Attention-Enhanced CNN–BiLSTM Training, Validation, and Inference over Run-Grouped GNS3-Derived Partitions |
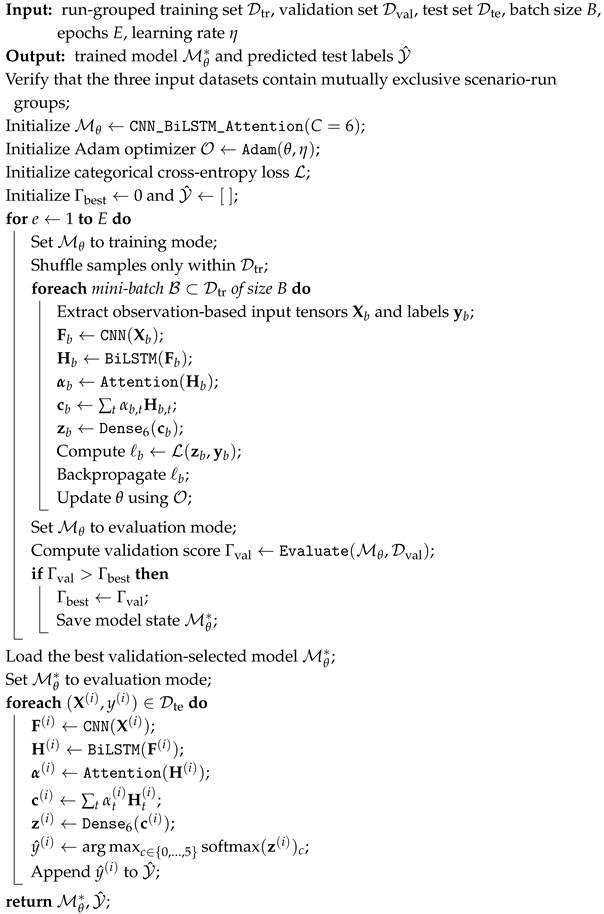 |
Each mini-batch follows the same computational pathway shown in Figure 6: observation-based temporal tensors are processed by the CNN, transferred to the BiLSTM, weighted by the temporal attention mechanism, summarized into a context vector, and mapped to six class logits. Cross-entropy loss and Adam optimization are applied only to the training partition.
Table 7 makes the relationship between Section 3.4 and Section 3.5 explicit. Dataset partitioning is completed before the learning algorithm begins. The model receives three separate run-grouped datasets rather than a single collection of temporally adjacent windows that is subsequently randomized. The notation therefore preserves the capture-level independence required for leakage-controlled testing.
Table 7.
Parameters of the run-grouped attention-enhanced CNN–BiLSTM training and inference algorithm.
Mathematical Definition of the CNN–BiLSTM–Attention Transformation, Six-Class Model Output, Loss Function, and Optimization Objective.
For the ith temporal sample from any one of the run-grouped datasets, the input to the model is
where T is the number of consecutive observation-based feature vectors and d is the predictor dimension. By construction, contains observations from exactly one scenario run and does not include the run identifier, experiment identifier, absolute timestamp, literal network address, ground-truth label, attack-outcome flag, or retrospective dissociation measures.
The CNN block transforms the temporal input into local feature maps according to
where denotes the ReLU activation. With two convolutional layers, the transformation is successively applied according to the configuration summarized in Table 8.
Table 8.
Complete model architecture, hyperparameters, leakage-controlled partitioning protocol, and evaluation criteria of the attention-enhanced CNN–BiLSTM framework.
The resulting feature maps are supplied to the BiLSTM block,
where and denote the forward and backward hidden-state sequences.
For temporal state , the attention score is
where , , and are trainable parameters.
The normalized attention coefficient is
The attention-weighted context representation is
The dense output layer maps the context representation to a six-dimensional logit vector,
The corresponding class-probability vector is
with
The predicted class is therefore
The fixed class space is
where 0 denotes Benign, 1 Pre-Compromise, 2 Internal Compromise/Pivoting, 3 Telemetry Manipulation, 4 Alarm Interference, and 5 Cross-Layer Dissociation.
For supervised learning over the training samples, categorical cross-entropy is defined as
An regularization term is incorporated into the training objective,
where denotes the complete set of trainable CNN, BiLSTM, attention, and dense-layer parameters and is the regularization coefficient. The learning objective is
Importantly, this optimization is performed exclusively on . The validation set does not contribute gradient updates and is used only for model-state selection, whereas is withheld until final inference. Because all three datasets consist of mutually exclusive scenario-run groups, the reported test evaluation measures performance on temporal samples derived from executions not used for model fitting.
Table 8 summarizes both the neural architecture and the leakage-controlled evaluation protocol. The principal partitioning unit is a complete independent scenario run rather than an individual temporal window. Therefore, the 70%/15%/15% proportions refer to run groups, and all windows and sequences generated from a particular run remain in one partition. Data-dependent preprocessing parameters are fitted only on the training-run group and applied unchanged to the validation and test groups.
The table also reflects the observation-only predictor design introduced in Section 3.4. Explicit mismatch and dissociation quantities are excluded from the input representation, while the final dense layer contains exactly six softmax outputs corresponding to the fixed classifier label space. Together, Section 3.4 and Section 3.5 therefore define a continuous and leakage-controlled pipeline from independent GNS3 executions to held-out six-class evaluation.
The resulting held-out performance should be interpreted as cross-run generalization within the controlled GNS3 environment. Run-level separation prevents temporally adjacent or overlapping samples from the same capture from appearing across training and evaluation partitions; however, it does not by itself establish invariance to completely different hospital topologies, device populations, addressing schemes, or independently developed attack implementations.
3.6. Experimental Configurations, Progressive Evaluation, and Six-Class Label Mapping
The experimental protocol separates three related activities: (i) controlled scenario execution and trace generation in GNS3, (ii) progressive construction of the analytical benchmark, and (iii) development and evaluation of the attention-enhanced CNN–BiLSTM model. Experiments E1–E14 define the benign and adversarial operating conditions executed within the GNS3-based smart-hospital environment. Each experiment generates synchronized network, gateway, physiological, alarm, security, and clinician-facing observations corresponding to a controlled operational or attack condition. These observations are processed according to the dataset-construction procedure described in Section 3.4 and subsequently mapped to the fixed classifier label space defined below. Experiment E15 is not an additional attack class or scenario label; it represents the final model-development and evaluation configuration using the complete benchmark constructed from E1–E14.
A distinction is therefore maintained between an experimental scenario and a classifier class. Terms such as Gateway Compromise, Context Distortion, Dissociation State, Partial Multi-Stage Attack, and Full Dissociation Attack describe the operational conditions instantiated during individual GNS3 experiments. They do not represent additional output neurons or independent class labels. All observations generated by these scenarios are mapped to the following six-class supervised output space:
where class 0 denotes Benign, class 1 denotes Pre-Compromise, class 2 denotes Internal Compromise/Pivoting, class 3 denotes Telemetry Manipulation, class 4 denotes Alarm Interference, and class 5 denotes Cross-Layer Dissociation. These six categories constitute the complete prediction space of the CNN–BiLSTM classifier throughout the study.
The mapping consolidates closely related scenario realizations into their corresponding supervised classes. Gateway reconnaissance, internal movement, and realized gateway compromise are assigned to class 2 because they represent successive forms of compromise and pivoting before direct manipulation of clinical information. Telemetry replay and semantic alteration are assigned to class 3, while alarm delay and suppression are assigned to class 4. Context distortion and the subsequent partial or complete coordinated telemetry–alarm–context dissociation scenarios are assigned to class 5. Thus, different experiments can represent different realizations or severity levels of the same classifier category without increasing the number of predicted classes.
To examine model behavior as the benchmark becomes progressively more diverse, the experimental protocol also defines cumulative evaluation checkpoints. At checkpoint , the analytical benchmark contains the benign reference observations and the scenario-specific observations introduced through that point in the experimental sequence. The architecture, preprocessing procedure, temporal representation, optimization settings, and evaluation criteria are kept unchanged across these checkpoints. Classes that have not yet been introduced by a particular early checkpoint simply have no samples in that checkpoint; the architecture itself retains the same six-output classification head. Accordingly, E1–E14 denote progressive experimental configurations and not fifteen predicted classes.
For each learning configuration, model-ready temporal samples are partitioned according to the 70%/15%/15% training, validation, and testing protocol specified in Table 8. The training partition is used for parameter optimization, the validation partition is used for model-state selection and early stopping, and the test partition is reserved for held-out evaluation. Transformations requiring fitted parameters are estimated from the corresponding training data and subsequently applied unchanged to validation and test observations.
The sequence begins with benign operation in E1 and subsequently introduces external access, internal movement, gateway compromise, telemetry manipulation, alarm interference, clinician-context distortion, and increasingly coordinated cross-layer dissociation. The purpose of this staged design is to generate traceable scenario-specific evidence under controlled conditions. It should not be interpreted as an ablation of individual model components or as a set of separate classifier outputs.
The progressive experimental protocol determines the applicability of class-specific evaluation metrics. E1 contains exclusively benign observations and therefore supports baseline classification assessment but does not provide the positive–negative composition required for attack-discrimination ROC-AUC. From E2 onward, the cumulative benchmark contains benign and attack observations, enabling general attack-discrimination evaluation when both categories are represented in the held-out subset. However, Cross-Layer Dissociation (class 5) is absent from E1–E9 and is introduced only at E10. Consequently, class-5 detection and false-negative rates are undefined for E1–E9 and are reported as N/A. For E10–E15, these rates are evaluated only when class-5 ground-truth observations are present, while class-5 ROC-AUC additionally requires negative observations. Any aggregate ROC-AUC is calculated only over eligible classes using the averaging convention specified in Table 8. This evaluation protocol distinguishes the availability of supervised categories from the fixed six-neuron classification architecture and ensures that every reported metric corresponds to a statistically valid evaluation population.
Table 9 makes explicit that the experiment identifiers, scenario descriptions, and classifier labels serve different purposes. E1–E14 identify the controlled GNS3 conditions used to generate observations. The “Classifier Label” column provides the corresponding supervised category used by the CNN–BiLSTM model. Consequently, multiple experimental scenarios may share the same classifier label. For example, E3–E5 represent different forms of internal progression and gateway compromise but are mapped to Internal Compromise/Pivoting (class 2), while E10–E14 represent different manifestations and severities of Cross-Layer Dissociation (class 5).
Table 9.
Fifteen-experiment protocol showing the distinction between GNS3 scenario configuration and the fixed six-class CNN–BiLSTM output space.
This mapping also reconciles the experimental protocol with the class space defined mathematically in Section 3.4. No labels named Gateway Compromise,’ Context Distortion, Dissociation State, Partial Multi-Stage Attack, or Full Dissociation Attack are produced as additional softmax outputs. Those terms describe scenario semantics only. The dense classification head always produces probabilities over the fixed set .
The distinction is particularly important for E11–E14. These experiments construct increasingly coordinated forms of patient-state dissociation, but the explicit telemetry–alarm, telemetry–context, and actual–displayed discrepancy measures associated with these conditions are not used as predictors. In accordance with Section 3.4, the classifier receives the underlying network, gateway, physiological, alarm, clinician-display, and security observations, whereas explicit discrepancy quantities are retained separately for the retrospective severity analysis in Section 4.3.
E15 constitutes the final consolidated model-development and evaluation configuration and should not be interpreted as a fifteenth scenario class or a seventh classifier category. At E15, the processed samples generated from E1–E14 are combined to represent all six classes and are divided into the training, validation, and testing subsets according to the specified 70%/15%/15% protocol. The final softmax output therefore remains six-dimensional:
with the predicted category obtained as
The progressive checkpoints E1–E14 are used to examine model behavior as the benchmark incorporates increasingly diverse operating and adversarial conditions. The model architecture itself is not changed between checkpoints; rather, the observations represented in the benchmark become progressively broader. Because several checkpoints correspond to different realizations of the same supervised class, the E1–E15 identifiers reported in the Results section should be interpreted as experimental configurations or evaluation checkpoints, not as predicted category identifiers.
Accordingly, the fifteen experiments form one connected experimental protocol. E1–E14 provide controlled scenario-generation conditions and their associated six-class label mapping, while E15 represents the complete model-development and evaluation configuration. This formulation establishes a consistent relationship among the class definition in Section 3.4, the scenario design in Table 9, the six-neuron softmax output described in Section 3.5, and the performance measures reported in Section 4.
4. Results and Discussion
This part entails an extensive analysis of the given attention-enhanced CNN-BiLSTM model within the fifteen experimentally specified conditions (E1–E15), which gradually capture benign operation, intrusion formation and complete cross-layer dissociation setups of the network. The analysis is designed in such a way that it embodies the multi-stage framework of the suggested smart hospital IoMT threat model, in which the system behavior shifts to more intricate adversarial misalignment. The results are therefore discussed under the training, testing, cross layer dissociation analysis, and robustness evaluation to offer a comprehensive picture of model performance.
The given findings are intended to measure not just the traditional classification performance but also the capability of the model to reflect the subtle cross-layer inconsistencies caused by manipulation of telemetry, interference with alarms, and distortion of context. This section shows the effect of the progressive acquisition of adversarial complexity on the learning dynamics, the detection accuracy as well as the ability to generalize by matching the evaluation with the staged experimental design. Specific focus is put on the statistical trends in across experiments, consistency of performance measures, and the efficacy of the suggested framework in uncovering patient-state perception dissociation.
This part fills the gap between methodological design and the results of the analysis by showing how the created dataset, feature space, and model architecture work together to achieve high and consistent detection results. The discussion also contextualizes the findings with reference to real-life smart hospital settings, where the practical importance of identifying cross-layer misalignment situations that cannot be detected by the use of a traditional network-centric analysis is critical.
4.1. Training and Validation Performance
The training and validation results in Table 10 evaluate the optimization and model-selection stages defined in Figure 6 and Algorithm 3. For each progressive experimental checkpoint, the GNS3-derived temporal tensors constructed in Section 3.4 are supplied to the same attention-enhanced CNN–BiLSTM architecture. During training, each input tensor passes sequentially through the CNN feature-extraction block, the BiLSTM temporal-modeling block, the attention mechanism, and the dense classification layer. The resulting classification loss is minimized using Adam optimization, while performance on the validation subset is monitored to retain the best model state according to Algorithm 3. Consequently, the training accuracy and loss quantify parameter learning, whereas the validation accuracy, validation loss, and validation F1-score quantify how effectively the learned representation generalizes during model selection.
Table 10.
Training and validation performance of the attention-enhanced CNN–BiLSTM model across the progressive experimental checkpoints E1–E15.
The results show a consistent improvement as the experimental dataset becomes progressively enriched from E1 to E15. Training accuracy increases from 91.84% in E1 to 99.12% in E15, while validation accuracy increases from 91.12% to 98.57%. At the same time, training loss decreases from 0.214 to 0.059 and validation loss decreases from 0.228 to 0.078. The parallel improvement of training and validation measures indicates that optimization of the model parameters is accompanied by corresponding improvement on data not used directly for gradient updates, rather than by an isolated increase in training-set fit. The validation F1-score also rises from 90.95% in E1 to 98.31% in E15, showing progressively stronger balance between precision and recall as additional adversarial and cross-layer conditions are incorporated into the analytical dataset.
The progression in Table 10 can also be interpreted with respect to the experimental protocol defined in Section 3.6. The early configurations E1–E4 contain predominantly benign, ingress, internal-pivoting, and gateway-facing observations. Under these conditions, validation accuracy increases from 91.12% to 93.76%, while validation F1 increases from 90.95% to 93.42%. These results establish the initial learning behavior of the architecture when the available evidence is dominated by network- and access-oriented patterns.
The intermediate configurations E5–E10 progressively introduce gateway compromise, telemetry replay or alteration, alarm delay or suppression, and clinician-context distortion. Validation F1 increases from 94.28% in E5 to 97.05% in E10, while validation loss decreases from 0.168 to 0.112. This behavior is consistent with the model exploiting the increasingly heterogeneous feature representation supplied through the pathway shown in Figure 6. In these configurations, the input tensors contain not only network and security evidence but also gateway, physiological, alarm, and context-related variables. The CNN block therefore receives richer local cross-feature relationships, while the BiLSTM operates over temporal sequences containing progressively more informative stage transitions.
The final configurations E11–E15 contain explicit telemetry–alarm mismatch, telemetry–context inconsistency, partial multi-stage chaining, and complete patient-state perception dissociation. Validation accuracy reaches 97.71% in E11 and increases to 98.57% in E15, while validation F1 reaches 98.31% in the final configuration. The relatively small difference between training and validation accuracy is maintained even as the dataset incorporates the most complex cross-layer conditions. In E15, for example, training accuracy is 99.12% and validation accuracy is 98.57%, corresponding to a gap of only 0.55 percentage points. Similarly, training and validation losses remain close at 0.059 and 0.078, respectively. These results support the validation-based model-selection procedure used in Algorithm 3 and indicate that the final model state is not selected solely according to training performance.
Importantly, the results in Table 10 evaluate the complete CNN–BiLSTM–attention pipeline rather than isolated architectural components. They demonstrate that the end-to-end transformation defined in Figure 6 can be optimized consistently as progressively richer GNS3-derived evidence is introduced.
Figure 7 provides a visual assessment of the training and validation stages implemented in Algorithm 3. Training accuracy increases steadily from 91.84% in E1 to 99.12% in E15, while validation accuracy follows a closely aligned progression from 91.12% to 98.57%. Validation F1 similarly increases from 90.95% to 98.31%. The consistent correspondence between these measures indicates that the improvement obtained during parameter optimization is also reflected during validation-based model selection.
Figure 7.
Training and validation behavior of the attention-enhanced CNN–BiLSTM model across E1–E15, showing accuracy and F1 improvement together with decreasing optimization loss and a controlled training–validation gap.
The loss trajectories provide complementary evidence regarding the optimization process. Training loss decreases from 0.214 to 0.059, whereas validation loss decreases from 0.228 to 0.078. These trends are consistent with the cross-entropy minimization and Adam-based parameter-update procedure defined in Algorithm 3. More importantly, the validation loss does not diverge from the training loss as increasingly complex attack conditions are introduced, which indicates that the retained model state continues to represent the progressively enriched data without an increasing optimization–validation discrepancy.
The accuracy gap between training and validation remains approximately 0.55–0.75 percentage points across the experimental sequence. This controlled difference is particularly important for E13–E15, where the input representation contains the strongest combinations of gateway compromise, telemetry manipulation, alarm interference, contextual distortion, and complete cross-layer dissociation. The model therefore maintains similar learning and validation behavior even when the temporal tensors contain the most complex adversarial relationships considered in the study.
Taken together, Table 10 and Figure 7 provide experimental support for the training and validation portion of Figure 6 and Algorithm 3. The decreasing optimization loss demonstrates successful parameter learning, the closely aligned validation behavior supports the best-model selection procedure, and the increasing validation F1-score shows that the learned representation becomes progressively more effective as cross-layer adversarial information is incorporated. The unseen-test inference stage of Algorithm 3 is evaluated separately in the following subsection.
4.2. Testing Performance and Stage-Aware Detection Results
The testing results in Table 11 evaluate the inference stage defined in Figure 6 and Algorithm 3. After completion of training and validation at each progressive experimental checkpoint, the model state associated with the best validation performance is retained and applied to the held-out test subset. No test samples are used for gradient-based parameter updating or validation-based model selection. During inference, each unseen temporal tensor follows the same computational path established in Section 3.5: CNN-based local feature extraction, BiLSTM temporal modeling, attention-based weighting of informative hidden states, context-vector formation, and dense softmax classification. The predicted class is then compared with its ground-truth stage label to compute test accuracy, precision, recall, and F1-score.
Table 11.
Held-out testing performance of the attention-enhanced CNN–BiLSTM model across the progressive experimental checkpoints E1–E15.
The results demonstrate progressively stronger generalization as increasingly diverse benign and adversarial evidence is incorporated from E1 to E15. Test accuracy increases from 90.92% in E1 to 98.43% in E15, while precision increases from 90.51% to 98.11%, recall from 90.08% to 97.76%, and F1-score from 90.29% to 97.93%. The simultaneous improvement of these four metrics indicates that the increasing test accuracy is accompanied by corresponding improvements in both positive predictive performance and sensitivity to the modeled attack conditions rather than by improvement in a single evaluation measure alone.
The early checkpoints E1–E4 provide an initial assessment of the inference pathway under benign, ingress, internal-pivoting, and gateway-facing conditions. Test accuracy increases from 90.92% to 93.61%, while F1-score increases from 90.29% to 92.92%. These results show that the retained model states can classify previously unseen temporal samples when the available feature space is dominated by baseline and early intrusion behavior.
A more pronounced improvement is observed across E5–E10, where the analytical dataset progressively incorporates gateway compromise, physiological-telemetry replay or alteration, alarm delay and suppression, and clinician-context distortion. Test accuracy increases from 94.46% in E5 to 97.18% in E10, while F1-score increases from 93.79% to 96.60%. Recall increases from 93.62% to 96.42%, indicating improved sensitivity to the increasingly complex adversarial conditions, whereas precision increases from 93.97% to 96.78%, indicating that this sensitivity is achieved without a corresponding deterioration in positive predictive performance. These observations support the effectiveness of the complete feature-to-decision pathway represented in Figure 6.
The final checkpoints E11–E15 introduce explicit telemetry–alarm and telemetry–context inconsistencies, partial multi-stage chaining, and complete patient-state perception dissociation. Despite the greater cross-layer complexity of these conditions, test accuracy increases from 97.52% in E11 to 98.43% in E15 and F1-score increases from 96.94% to 97.93%. In the complete E15 configuration, precision reaches 98.11% and recall reaches 97.76%, corresponding to a separation of only 0.35 percentage points. The close behavior of these metrics indicates that the final classifier maintains a balanced relationship between predictive precision and sensitivity under the complete stage-aware dataset.
These test results provide direct experimental evaluation of the inference operations specified in Algorithm 3. In particular, for each held-out test sample, the algorithm implements
and the metrics in Table 11 quantify the correctness of the resulting predictions against the corresponding ground-truth labels. Thus, Table 11 evaluates the complete test-time computational path shown in Figure 6, rather than reporting performance values disconnected from the architecture.
Figure 8 provides a complementary visual assessment of the unseen-sample inference stage. All four evaluation measures increase progressively across E1–E15. Test accuracy reaches 98.43% in E15, precision reaches 98.11%, recall reaches 97.76%, and F1-score reaches 97.93%. The parallel progression of these measures shows that the improvement in the final predictions is distributed across several aspects of classification performance rather than being attributable only to overall accuracy.
Figure 8.
Held-out testing performance across E1–E15, showing the progression of accuracy, precision, recall, and F1-score produced by the inference pathway of the attention-enhanced CNN–BiLSTM model.
The relationship between precision and recall is particularly relevant to the targeted IoMT detection problem. Across the experimental checkpoints, both measures remain closely aligned; their difference is approximately 0.43 percentage points in E1 and 0.35 percentage points in E15. This indicates that increasing sensitivity to adversarial samples is accompanied by comparably strong precision. In the context of the proposed framework, this behavior is desirable because missed adversarial conditions and excessive incorrect alerts are both important considerations when analyzing patient-state perception inconsistencies.
The final E13–E15 configurations provide the most demanding assessment because the corresponding temporal tensors contain combined gateway, telemetry, alarm, and clinical-context inconsistencies. The persistence of high precision, recall, and F1-score under these conditions indicates that the best validation-selected model state retains effective discriminative behavior when applied to held-out samples containing the complete multi-stage attack structure. This finding complements the training and validation analysis in Section 4.1 by demonstrating that the learned model is not evaluated solely on the data used during parameter optimization or model-state selection.
Taken together, Table 11 and Figure 8 provide direct quantitative support for the test-time portion of Figure 6 and Algorithm 3. Section 4.1 demonstrated the optimization and validation behavior leading to selection of , whereas the present subsection evaluates the subsequent inference of that retained model on the held-out test subset.
4.3. Retrospective Cross-Layer Dissociation Analysis Under Telemetry–Alarm–Context Misalignment
This subsection provides a retrospective characterization of cross-layer severity across the controlled experimental configurations E1–E15. The analysis is separated from the predictor construction described in Section 3.4. The dissociation indicators are not supplied to the CNN–BiLSTM–attention model during training, validation, testing, or inference. Instead, they are calculated independently from synchronized physiological, telemetry, alarm, and clinician-facing observations to characterize the degree of patient-state perception dissociation.
The retrospective evaluation distinguishes four complementary quantities: the overall dissociation magnitude, the telemetry gap, the telemetry–alarm misalignment, and the telemetry–context mismatch. Alarm-delivery delay is also retained as a separate temporal measure. These quantities describe different aspects of cyber–clinical inconsistency and are calculated independently of the supervised classification process.
4.3.1. Physiological State Representations and Measurement Units
For observation window k of independent scenario run g, three synchronized physiological representations are distinguished: the actual patient state, the telemetry received by the clinical service, and the state displayed to clinical personnel. The corresponding state vectors are defined as
Here, subscripts a, t, and d denote the actual, received-telemetry, and displayed states, respectively. Heart rate is expressed in beats per minute (bpm), while oxygen saturation is expressed in percentage points. The actual state is obtained from the reference physiological record, the telemetry state from the receiving service, and the displayed state from the clinician-facing record. The measurements are aligned by their originating patient, scenario run, and observation interval.
The physiological discrepancy calculation uses only components available in the corresponding synchronized representations. Other observations, including blood pressure, temperature, infusion-pump status, and bed-occupancy state, remain distinct operational variables. They are not implicitly incorporated into the physiological distance unless corresponding actual, transmitted, and displayed representations and their normalization rules are explicitly established.
4.3.2. Normalization of Heterogeneous Physiological Measurements
Directly combining heart-rate differences and oxygen-saturation differences in an unnormalized Euclidean distance would make the resulting magnitude dependent on their heterogeneous measurement scales. Therefore, a component-wise normalized discrepancy between two physiological representations and is formulated as
where j indexes the physiological components and is a fixed positive normalization range expressed in the same physical unit as component j. Accordingly, is expressed in bpm, whereas is expressed in percentage points. The normalization constants are fixed for all experimental configurations and are not estimated independently for each attack scenario. The clipping operation constrains the normalized component-wise discrepancy to .
The normalized weighted physiological distance is expressed as
where p is the number of physiological components and is the fixed weight assigned to component j. The weights and normalization ranges must be selected according to the actual experimental configuration and applied consistently across E1–E15. Because each normalized discrepancy lies in and the weights sum to one, the weighted distance also lies in .
The normalization ranges and weights are parameters of the retrospective evaluation procedure, not trainable parameters of the CNN–BiLSTM–attention model. Their values must be documented and verified against the implementation used to generate the reported severity indicators.
4.3.3. Overall Dissociation Magnitude
The overall dissociation magnitude quantifies the normalized difference between the actual physiological state and the clinician-displayed physiological state:
This formulation specifies the normalization and weighting associated with the Euclidean-distance interpretation of dissociation. A larger indicates greater disagreement between the reference patient state and the information presented to clinical personnel. The indicator is dimensionless and bounded between zero and one.
4.3.4. Telemetry Discrepancy
The telemetry gap evaluates the discrepancy between the actual physiological state and the physiological values received by the clinical telemetry service:
This indicator characterizes alteration or divergence introduced before or during telemetry delivery. It is distinct from the overall dissociation magnitude, which compares the actual state directly with the clinician-displayed state.
4.3.5. Telemetry–Context Mismatch
The telemetry–context mismatch measures disagreement between the physiological values received by the clinical service and the corresponding physiological values presented at the clinician workstation:
This quantity captures inconsistencies arising between telemetry reception and clinical presentation. For example, received telemetry may indicate an abnormal physiological condition while the displayed values remain stale or have been altered to represent a different patient state. The indicator is dimensionless and uses the same normalization ranges and weights as the other physiological discrepancy measures.
If non-physiological contextual attributes, such as categorical patient status or device status, are included in a broader context-consistency assessment, their disagreement rules and combination weights must be defined separately. They are not implicitly included in the physiological mismatch equation above.
4.3.6. Alarm Delay and Telemetry–Alarm Misalignment
Alarm consistency is evaluated using the relationship between the physiological telemetry available to the alarm service and the alarm subsequently presented to clinical personnel. Let denote the alarm state expected under the configured physiological alarm rules, and let denote the corresponding observed clinician-visible alarm state. The expected state is determined from the received telemetry using the alarm thresholds configured in the simulation.
For an expected alarm that is successfully delivered, the alarm-delivery delay is defined as
where is the timestamp at which the configured alarm condition is first satisfied and is the timestamp at which the corresponding alarm becomes visible. Alarm delay is expressed in seconds.
When an expected alarm is suppressed or never delivered, its delivery delay is considered unobserved rather than being assigned an arbitrary finite duration. Such events are instead represented explicitly in the alarm-state misalignment indicator.
The normalized telemetry–alarm misalignment is formulated as
where is a fixed alarm-delay normalization constant expressed in seconds. The first case represents contradictory alarm states, including suppression of an expected alarm and the appearance of an unexpected alarm. The second case represents the normalized delay associated with a correctly delivered expected alarm. The third case represents agreement when no alarm is expected or observed.
The alarm thresholds and must correspond to the implemented alarm-service configuration. The normalized misalignment score lies in , whereas the separately reported alarm delay retains its unit of seconds.
4.3.7. Aggregation Across Observation Windows and Scenario Runs
The retrospective indicators are first calculated at the observation-window level. For a generic indicator z, let denote the set of windows in run g for which the indicator is valid. The run-level mean is
Missing or undefined measurements are excluded from the corresponding aggregation rather than being replaced by zero. A run with no valid observations for indicator z is excluded from the calculation of that indicator’s experiment-level mean.
Let denote the set of eligible scenario runs represented in experimental configuration E. The corresponding experiment-level mean is formulated as
This run-balanced aggregation gives each eligible independent capture equal weight and prevents longer scenario runs from dominating the reported experiment-level indicator. For cumulative experimental checkpoints, the eligible run set includes the runs represented up to the corresponding checkpoint.
The aggregation must be applied independently to each retrospective indicator. In particular, alarm delay is averaged only over alarm events with an observed delivery time, whereas suppressed and contradictory alarm events are retained in the normalized telemetry–alarm misalignment analysis. The normalization constants, component weights, valid-window rules, and aggregation procedure must match the implementation used to obtain the reported numerical values.
4.3.8. Separation from the Predictive Representation
The retrospective indicator vector for window k of scenario run g is expressed as
These quantities are retained exclusively for retrospective characterization. They are not concatenated with the observation-based predictor vectors and are not supplied to the model during parameter optimization, model-state selection, testing, or inference. The underlying physiological, telemetry, alarm, gateway, network, clinician-display, and security observations may remain separate model inputs.
Table 12 presents the reported retrospective severity indicators across the fifteen experimental configurations. The dissociation magnitude, telemetry gap, and context-mismatch indicators characterize different relationships among the actual physiological state, received telemetry, and clinician-displayed information. Alarm delay provides a separate temporal measure of alarm propagation.
Table 12.
Retrospective cross-layer dissociation indicators across the controlled E1–E15 configurations. The dissociation magnitude, telemetry gap, and context-mismatch values are dimensionless severity indicators, whereas alarm delay is expressed in seconds. All indicators are excluded from the CNN–BiLSTM–attention model input. The reported values require verification against the specified normalization, weighting, and aggregation procedures.
The early configurations E1–E4 exhibit comparatively limited cross-layer divergence. The reported dissociation magnitude ranges from 0.08 to 0.24, while the telemetry gap increases from 0.05 to 0.17. The context-mismatch measure remains between 0.04 and 0.16, and the alarm-delay measure increases from 0.6 s to 1.8 s. These quantities describe the reference and initial intrusion configurations. They should not be interpreted as measurements of Cross-Layer Dissociation classification performance because class 5 is absent from these checkpoints.
Across E5–E9, the experimental configurations incorporate gateway compromise, telemetry manipulation, and alarm interference. The reported dissociation magnitude increases from 0.31 to 0.61, the telemetry gap increases from 0.22 to 0.46, and context mismatch increases from 0.21 to 0.45. The observed alarm-delay measure increases from 2.5 s to 5.4 s. These indicators characterize the progressive disturbance of the cyber–clinical observation streams before class 5 is introduced.
E10 introduces Cross-Layer Dissociation into the supervised class space represented in the experimental benchmark. The subsequent configurations E11–E14 incorporate increasingly coordinated telemetry, alarm, gateway, and clinician-context manipulation, while E15 represents the consolidated evaluation configuration.
Across E10–E15, the reported dissociation magnitude increases from 0.68 to 0.96, telemetry gap increases from 0.52 to 0.80, and context mismatch increases from 0.51 to 0.79. The reported alarm-delay measure rises from 6.1 s to 9.5 s. These values describe the severity of the modeled cross-layer disturbances rather than the classification accuracy of the detection model.
The distinction between telemetry gap and context mismatch is particularly important. A nonzero telemetry gap indicates that the values received by the clinical service differ from the reference physiological state. A nonzero context mismatch indicates that the clinician-displayed values differ from the telemetry received by that service. The overall dissociation magnitude captures the resulting disagreement between the reference patient state and the displayed state.
These indicators are related but are not interchangeable. For example, alteration introduced during telemetry delivery may produce a substantial telemetry gap even when the clinical display reproduces the received values without further modification. Conversely, manipulation at the clinician-facing interface may produce a context mismatch even when the received telemetry remains consistent with the reference physiological state.
The telemetry–alarm misalignment measure provides a complementary description of alarm behavior. It distinguishes discrepancies between expected and observed alarm states from delays associated with correctly delivered alarms. The separately reported alarm-delay measure retains its physical unit of seconds and should not be interpreted as interchangeable with the dimensionless alarm-misalignment score.
The analytical separation between prediction and retrospective severity assessment is represented by the predictive pathway
where represents the underlying observations and denotes the corresponding temporal predictor tensor. The CNN–BiLSTM–attention model processes the predictor tensor to generate the predicted class .
In parallel, the independent retrospective pathway is expressed as
The indicator vector is not supplied to the predictor tensor . Consequently, the retrospective discrepancy values are used only for characterizing the severity of the experimental conditions and do not constitute direct model-input variables.
The experiment-level trends in Table 12 provide a descriptive characterization of the controlled scenario progression. They do not establish a causal relationship between any individual severity indicator and the output of the detection model. Similarly, these results do not isolate the contributions of the CNN, BiLSTM, or attention components. Such architectural conclusions require separate controlled ablation experiments.
Class-specific detection performance must be evaluated independently using the ground-truth labels and held-out predictions associated with the corresponding checkpoint. In particular, Cross-Layer Dissociation detection and false-negative rates are defined only for evaluation populations containing class-5 observations. The retrospective severity analysis therefore complements the classification results without substituting severity measurements for statistically valid detection metrics.
The overall interpretation remains restricted to the controlled GNS3 smart-hospital environment. The retrospective indicators characterize the modeled physiological, telemetry, alarm, and clinical-context relationships under the specified simulation conditions; their behavior does not independently establish generalization to previously unseen real-hospital environments.
4.4. Comparative Experimental Discussion and Robustness Interpretation
The relative robustness findings as indicated by Table 13 indicate a noticeable and statistically stable increase in model reliability as the experimental scenarios change between E1 and E15. The general accuracy is raised to 98.43% and the F1-score is raised to 97.93% as well, which confirms that the model is not biased in its perception of the classification in all conditions. At the same time, the AUC increases to 0.944 to 0.998, which means that the later stages almost perfectly separate between benign and adversarial classes. All of these trends indicate that the model is capable of successively learning increasingly discriminative representations as the input data becomes increasingly complicated.
Table 13.
Comparative robustness and generalization analysis.
The most significant finding of Table 13 is that the score of robustness has been gradually rising between 0.71 E1 to 0.97 E15 with the accompanying stability score rising between 0.69 to 0.95. It means that the model is not only more predictive but it becomes more resilient to changes in data distribution and adversarial conditions. Meanwhile, the generalization gap decreases considerably (0.92 to 0.40) indicating that the gap between training and testing performance is being reduced progressively. This decrease indicates enhanced model generalization and less overfitting especially as the model is subjected to a wider and more complex pattern cross-layers.
During the last stages of experimentation (E11–E15), Table 13 displays that the improvement in performance level starts to level off, which is the sign of the approach towards the ideal regime of robustness. Although the scenarios become more and more challenging, the model retains high accuracy, F1-score, and AUC values, and has the highest levels of robustness and stability with the smallest level of generalization gap. This saturation behavior, asserts that the underlying statistical architecture of cross-layer dissociation phenomena, has been well represented by the model. In general, all these findings confirm the given framework as highly predictive and robust since it can maintain a stable performance even in the most complicated and confrontational settings.
Figure 9 evidences the fact that the proposed framework does not only ensure continuous enhancement of predictive performance, but also a visible enhancement of robustness and the ability to generalize traits across the experiments E1-E15. The left panel indicates that the accuracy rate is growing steadily with 90.92% in E1 to 98.43 in E15 and F1-score also increases with 90.29 to 97.93 indicating that the model gains more and more stability in its overall classification behavior. An equally positive trend is seen with AUC, which increases to 0.944 to 0.998, suggesting a steadily growing separability and a very stable discriminatory ability in the later experimental conditions. Meanwhile, the robustness increases by 0.71 to 0.97, and the stability increases by 0.69 to 0.95, indicating that the model not only becomes more accurate, but also more resilient and consistent under the circumstances that are evaluated. This interpretation is further supported by the right panel, as it demonstrates that the generalization gap between 0.92 in E1 and 0.40 in E15 decreases significantly and in a monotonic way, which also indicates that the later configurations are better at transferring the learned training behavior to unseen data without excessive drift. Combined, this number ensures that the suggested framework develops in a balanced fashion, with the improvement of accuracy and F1-score being offset by an increase in robustness, greater stability, and reduced generalization discrepancy, so the final experiments, E13-E15 in particular are the most mature and stable of all considered settings.
Figure 9.
Comparative robustness and generalization behavior across experiments E1–E15, illustrating the coordinated improvement in predictive quality, robustness, and stability, together with the progressive reduction in generalization gap.
Table 14 demonstrates that the proposed CNN–BiLSTM–Attention framework achieves the strongest overall performance among all evaluated baseline detectors under the same leakage-controlled experimental protocol. The conventional machine-learning models show lower performance, with Random Forest and XGBoost obtaining accuracies of 94.86% and 95.72%, respectively, while the MLP achieves 93.91%. The deep-learning baselines provide progressively stronger results as temporal modeling is introduced: the 1D-CNN reaches 96.34% accuracy, the LSTM achieves 96.72%, and the BiLSTM improves this value to 97.21%, indicating the benefit of modeling temporal dependencies in both directions. Combining convolutional feature extraction with bidirectional temporal learning further increases accuracy to 97.88% for the CNN–BiLSTM baseline, with an F1-score of 97.47% and an AUC of 0.996. The proposed attention-enhanced architecture achieves 98.43% accuracy, 98.11% precision, 97.76% recall, a 97.93% F1-score, and an AUC of 0.998, corresponding to an accuracy improvement of 0.55 percentage points over CNN–BiLSTM, 1.22 points over BiLSTM, 1.71 points over LSTM, 2.09 points over 1D-CNN, 2.71 points over XGBoost, and 3.57 points over Random Forest. The consistent improvements across accuracy, precision, recall, F1-score, and AUC indicate that the integrated use of convolutional local-pattern extraction, bidirectional temporal modeling, and attention-based weighting provides the most effective representation among the evaluated architectures for distinguishing the multi-stage cyber–clinical patterns considered in the smart-hospital IoMT environment.
Table 14.
Comparative performance of the proposed model and baseline detectors under the same leakage-controlled evaluation protocol.
5. Conclusions and Future Work
This study introduced an attention-enhanced CNN–BiLSTM intrusion detection framework for identifying patient-state perception dissociation attacks in smart hospital IoMT environments. Unlike conventional attacks that primarily disrupt communication or system availability, the investigated threat preserves apparently normal operation while manipulating the semantic consistency among the patient’s physiological condition, transmitted telemetry, alarm behavior, and clinician-visible information. To support realistic cybersecurity evaluation, a multi-zone smart hospital testbed was implemented in GNS3, incorporating heterogeneous medical devices, IoMT gateways, telemetry services, clinical workstations, alarm components, security-monitoring nodes, and adversarial access paths. The testbed enabled the systematic generation of a stage-aware dataset covering benign operation, intrusion progression, gateway compromise, telemetry manipulation, alarm interference, contextual obfuscation, and complete cross-layer dissociation. The proposed architecture combines convolutional feature extraction, bidirectional temporal learning, and attention-based prioritization to identify local cross-feature relationships, progressive attack patterns, and high-risk telemetry–alarm–context inconsistencies. Experimental evaluation across fifteen operational and adversarial scenarios achieved 98.43% testing accuracy, a 97.93% F1-score, and an AUC of 0.998, while the limited difference between validation and testing performance indicated stable learning and reliable generalization to previously unseen samples. These findings demonstrate that intrusion detection in life-critical IoMT systems should extend beyond isolated network-traffic classification toward temporal and semantic consistency analysis across interconnected cyber and clinical layers. Future work will validate the framework using real hospital-network and physiological telemetry traces, integrate explainable artificial intelligence mechanisms, investigate online and edge-based deployment, improve computational and memory efficiency, and incorporate uncertainty-aware threat scoring and continual learning. Additional evaluation will consider missing telemetry, noisy sensors, class imbalance, concept drift, adaptive adversaries, and previously unseen attack strategies, while automated response mechanisms will be explored for alarm verification, compromised-device isolation, trustworthy telemetry recovery, and coordinated incident response.
Author Contributions
Conceptualization, S.A.A. and K.H.A.; methodology, S.A.A.; software, S.A.A.; validation, S.A.A. and K.H.A.; formal analysis, S.A.A.; investigation, S.A.A. and K.H.A.; resources, S.A.A. and K.H.A.; data curation, S.A.A.; writing—original draft preparation, S.A.A.; writing—review and editing, S.A.A. and K.H.A.; visualization, S.A.A.; supervision, K.H.A.; project administration, S.A.A.; funding acquisition, S.A.A. and K.H.A. All authors have read and agreed to the published version of the manuscript.
Funding
The authors extend their appreciation to the Deanship of Scientific Research at Northern Border University, Arar, KSA for funding this research work through the project number NBU-FFR-2026-3555-04.
Data Availability Statement
The dataset generated and analyzed in this study is publicly available on Kaggle under the title “IoMT Patient-State Dissociation Dataset” at: [22].
Acknowledgments
The authors extend their appreciation to the Deanship of Scientific Research at Northern Border University, Arar, KSA for funding this research work through the project number NBU-FFR-2026-3555-04.
Conflicts of Interest
The authors declare no conflicts of interest.
References
- Akram, M.; Khan, W.; Rasheed, M.D.; Imran, M.; Iqbal, M.W.; Delshadi, A.; Sultana, M. Cybersecurity Risk Assessment Model for Internet of Medical Things (IOMT) Devices in Healthcare Systems. Spectr. Eng. Sci. 2026, 4, 312–326. [Google Scholar]
- Mohammed, B.; Al-Shareeda, M.; Hamzah, A.; Alhasnawi, B.; Homod, R.; Alkhabra, Y.; Al-Mekhlafi, Z.; Alrashdi, R.; Alshammari, G.; Alreshidi, I. Security challenges and solutions in Internet of Medical Things (IoMT) communication: A review. J. King Saud Univ. Comput. Inf. Sci. 2026, 38, 254. [Google Scholar] [CrossRef] [Scilit]
- Farooqui, N.A. Of Medical Things (IoMT). Innovating Credentialing and Data Management in Higher Education with Blockchain and AI; IGI Global: Hershey, PA, USA, 2026; p. 441. [Google Scholar]
- Pastore, F.; Anwar, R.W.; Jabeur, N.H.; Ali, S. Intelligent Fusion: A Resilient Anomaly Detection Framework for IoMT Health Devices. Information 2026, 17, 117. [Google Scholar] [CrossRef] [Scilit]
- Song, Y.; Ksibi, A.; Agarwal, K.; Qu, B. Explainable Deep Learning for Cyber Threat in IoMT: A Synchronization-Enhanced Sparse Autoencoder Approach. IEEE J. Biomed. Health Inform. 2026. early access. [Google Scholar] [CrossRef] [Scilit] [PubMed]
- Aggarwal, S.K.; Sachdeva, M.; Kumar, D. Internet of Medical Things (IoMT) and Telemedicine. In Empowering Healthcare Through AI and Blockchain; Wiley-IEEE Press: Piscataway, NJ, USA, 2026; pp. 141–177. [Google Scholar]
- Aldhyani, T.H.H.; Nair, R.; Alkahtani, H.; Ibrahim, O. AI-Powered Security-Aware Reconfiguration in Cyber-Physical Systems for Smart Healthcare and Energy Domains. Int. J. Adv. Soft Compu. Appl. 2026, 18, 156. [Google Scholar] [CrossRef] [Scilit]
- Alqahtani, A.; Bhatia, M. Digital Twin-empowered Cybersecurity Framework for Healthcare Vulnerability Assessment. IEEE Internet Things J. 2026, 13, 23471–23479. [Google Scholar] [CrossRef] [Scilit]
- Shabbir, M.; Shabbir, F. A Machine and Deep Learning Approaches for Intrusion Detection and Attack Classification in Medical IoT Networks. Comput. Sist. 2026, 30, 549–564. [Google Scholar] [CrossRef] [Scilit]
- Bhanja, S.N.; Niu, H.; Chen, Y.; Omitaomu, O.A.; Laurio, A.; Trickey, A.; Sampath, V.; Nebeker, J.R. Emerging Anomaly Detection Techniques for Electronic Health Records: A Survey. Intell.-Based Med. 2026, 13, 100349. [Google Scholar] [CrossRef] [Scilit]
- Shwayat, D.; Abu Al-Haija, Q.; Alma’aitah, A. Resource-aware ML framework for multi-level cross-layer and cross-protocol attack detection in IoMT. J. Supercomput. 2026, 82, 291. [Google Scholar] [CrossRef] [Scilit]
- Palaniappan, S.; Sengan, S. Hybrid feature selection for IoMT based intrusion detection system for integrating mutual information filtering with deep learning based accelerated metaheuristic optimization. Sci. Rep. 2026, 16, 16120. [Google Scholar] [CrossRef] [Scilit] [PubMed]
- Sharma, A.; Sharma, S.; Kaur, S. Enhancing IoMT security: A novel blockchain-based anomaly detection framework leveraging explainable AI. Clust. Comput. 2026, 29, 87. [Google Scholar] [CrossRef] [Scilit]
- Babar, M.; Tariq, M.U.; Qureshi, B.; Ullah, Z.; Arif, F.; Khan, Z. An efficient and hybrid deep learning-driven model to enhance security and performance of healthcare internet of things. IEEE Access 2025, 13, 22931–22945. [Google Scholar] [CrossRef] [Scilit]
- Akash, T.R.; Mohammed, A.A.; Al Farooq, A.; Zerine, I.; Kabir, M.H.; Wata, C. IoHT attack detection using transformer-aware feature selection with CNN-BiLSTM optimized by hybrid WOA–GWO. Discov. Artif. Intell. 2025, 5, 423. [Google Scholar] [CrossRef] [Scilit]
- Berguiga, A.; Harchay, A.; Massaoudi, A. HIDS-IoMT: A Deep Learning-Based Intelligent Intrusion Detection System for the Internet of Medical Things. IEEE Access 2025, 13, 32863–32882. [Google Scholar] [CrossRef] [Scilit]
- Balaji, K.; Satheesh Kumar, S.; Vivek, D.; Prem Kumar Deepak, S.; Daya Sagar, K.V.; Thabassum Khan, S. An effective deep Learning-Based intrusion detection system for the healthcare environment. Int. J. Comput. Intell. Appl. 2025, 24, 2450033. [Google Scholar] [CrossRef] [Scilit]
- Ullah, Z.; Arif, F.; Khan, N.A.; Khan, M.A.; Ud Din, I.; Almogren, A.; Altameem, A. Interpretable and adaptive GAN-BiLSTM approach for cyber threat detection in IoMT-based healthcare 5.0. IEEE J. Biomed. Health Inform. 2025. early access. [Google Scholar] [CrossRef] [Scilit] [PubMed]
- Doménech, J.; Martin-Faus, I.V.; Mhiri, S.; Pegueroles-Vallés, J. Ensuring patient safety in IoMT: A systematic literature review of behavior-based intrusion detection systems. Internet Things 2024, 28, 101420. [Google Scholar] [CrossRef] [Scilit]
- Doménech, J.; León, O.; Siddiqui, M.S.; Pegueroles, J. Evaluating and enhancing intrusion detection systems in IoMT: The importance of domain-specific datasets. Internet Things 2025, 32, 101631. [Google Scholar] [CrossRef] [Scilit]
- Kumar, M.; Singh, S.K.; Kim, S. Hybrid deep learning-based cyberthreat detection and IoMT data authentication model in smart healthcare. Future Gener. Comput. Syst. 2025, 166, 107711. [Google Scholar] [CrossRef] [Scilit]
- Alshammari, S. IoMT Patient-State Dissociation Dataset. Kaggle. 2026. Available online: https://www.kaggle.com/datasets/samialshammari8/iomt-patient-state-dissociation-dataset (accessed on 24 September 2026).
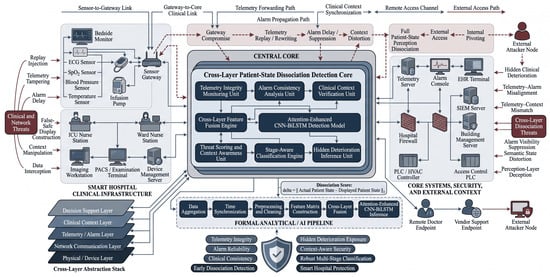
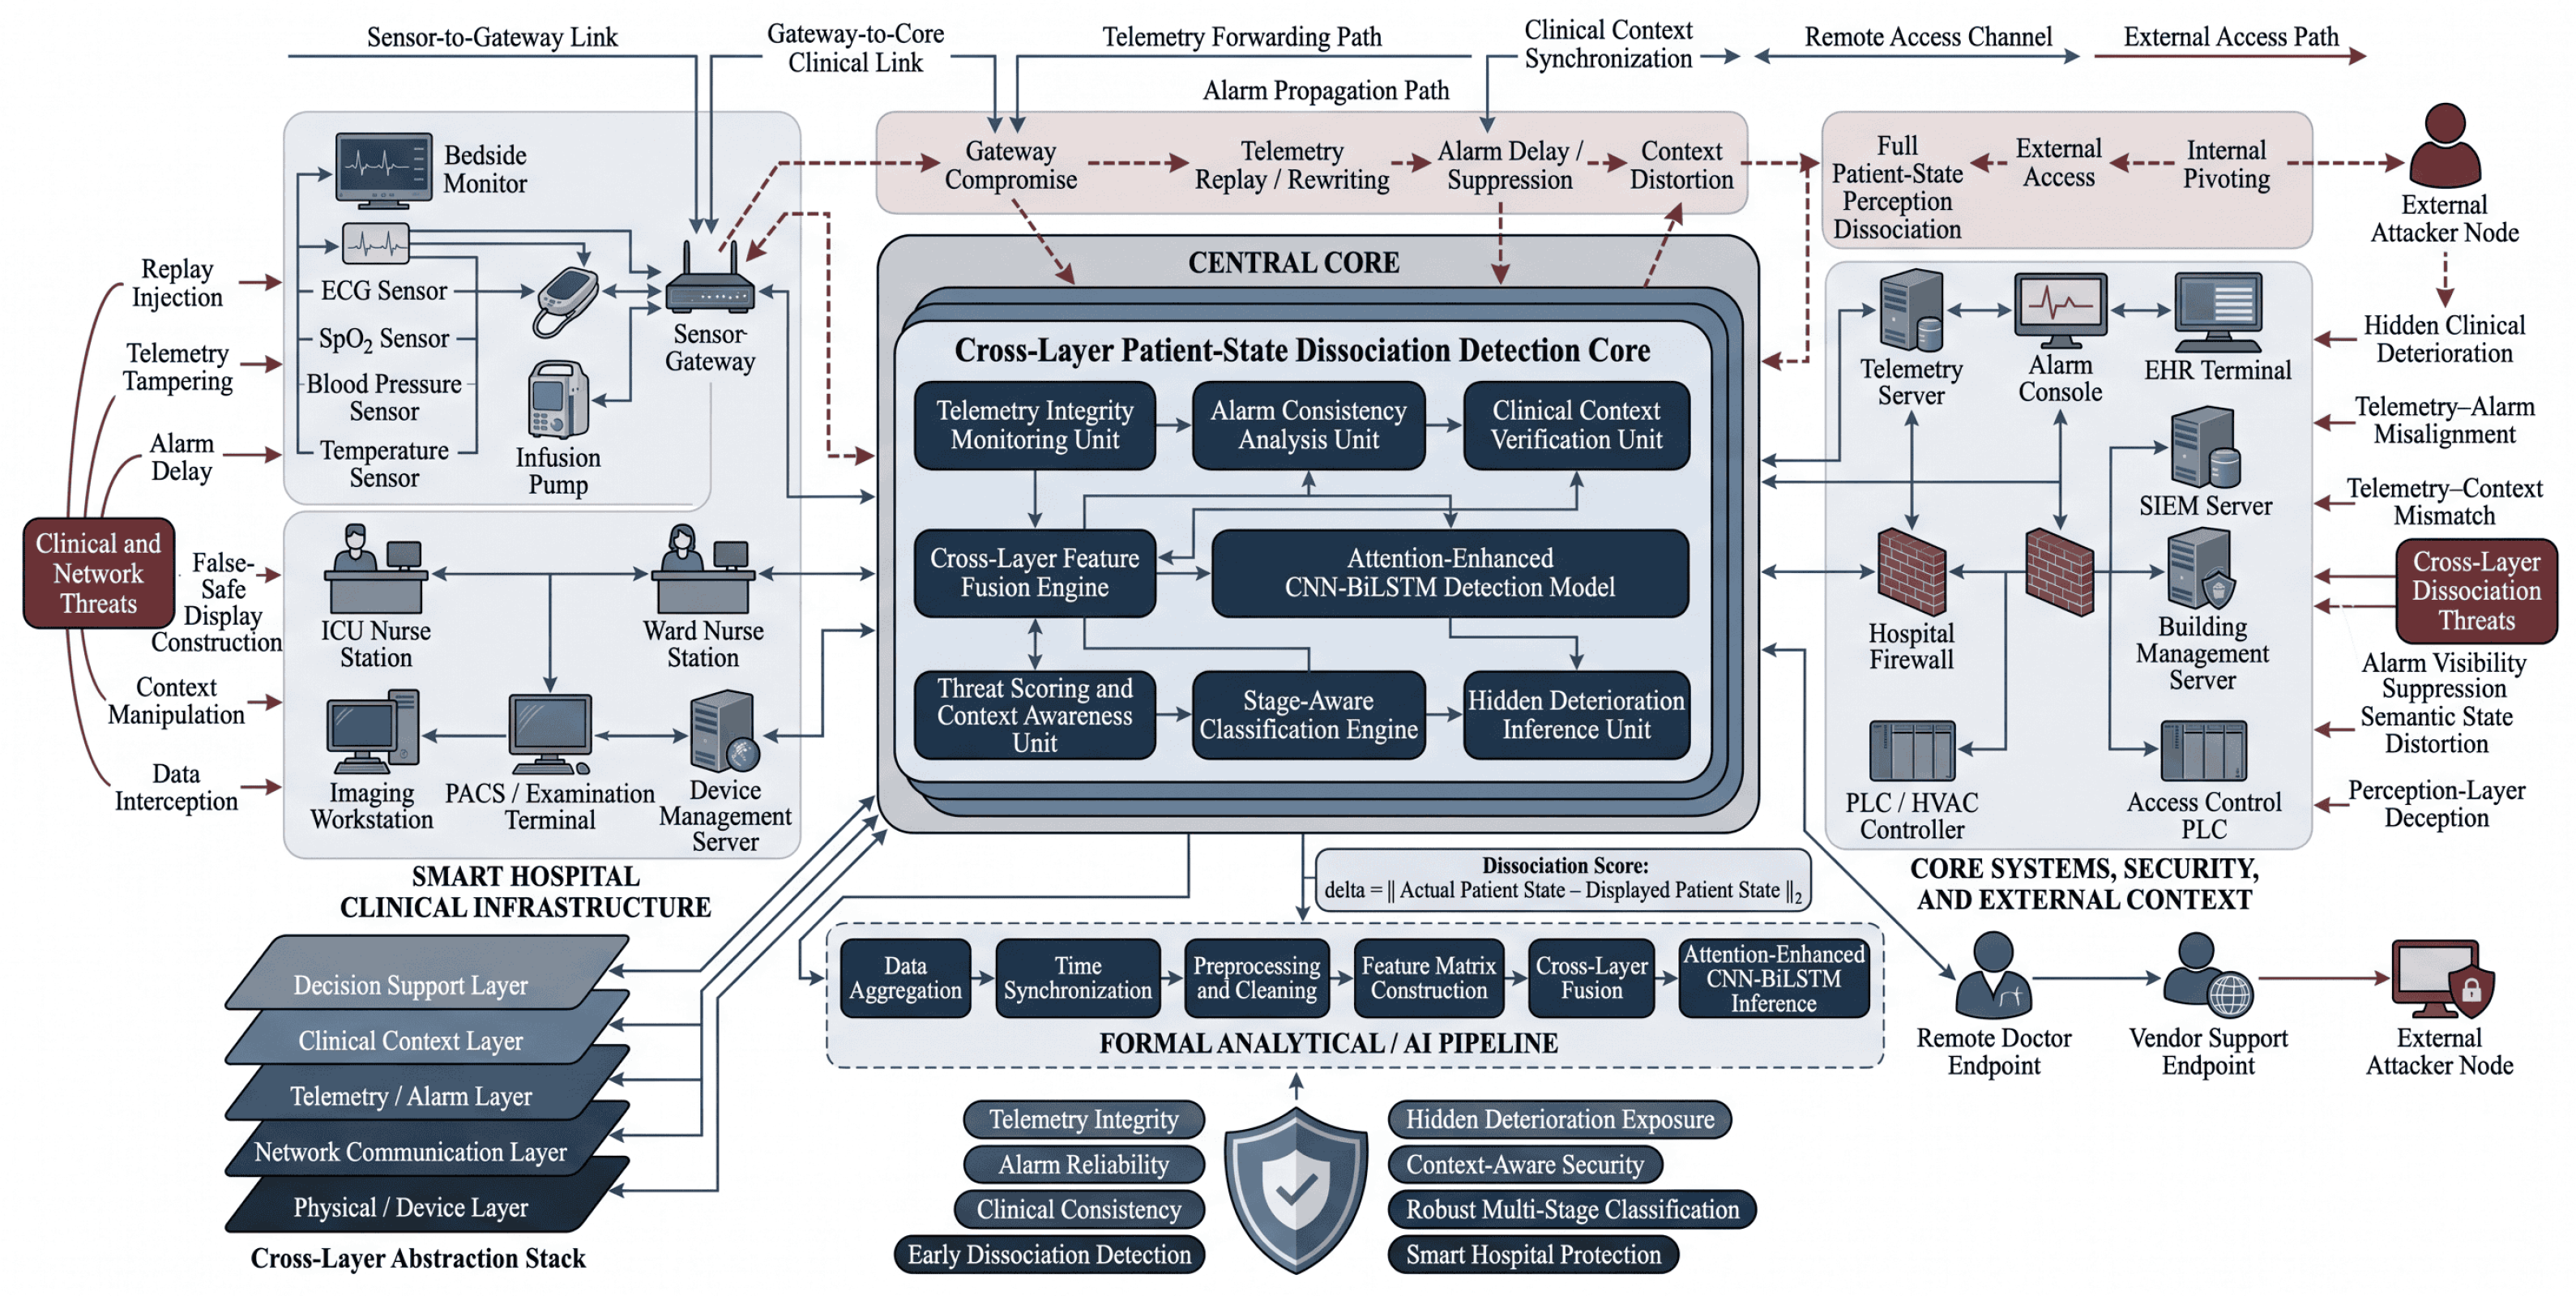
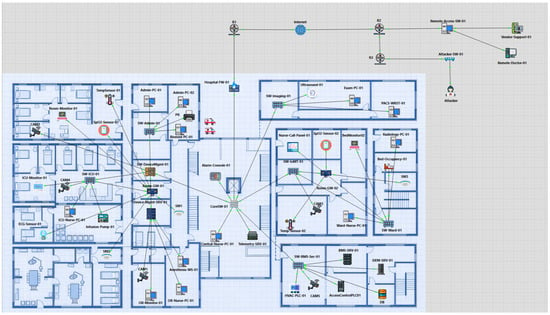
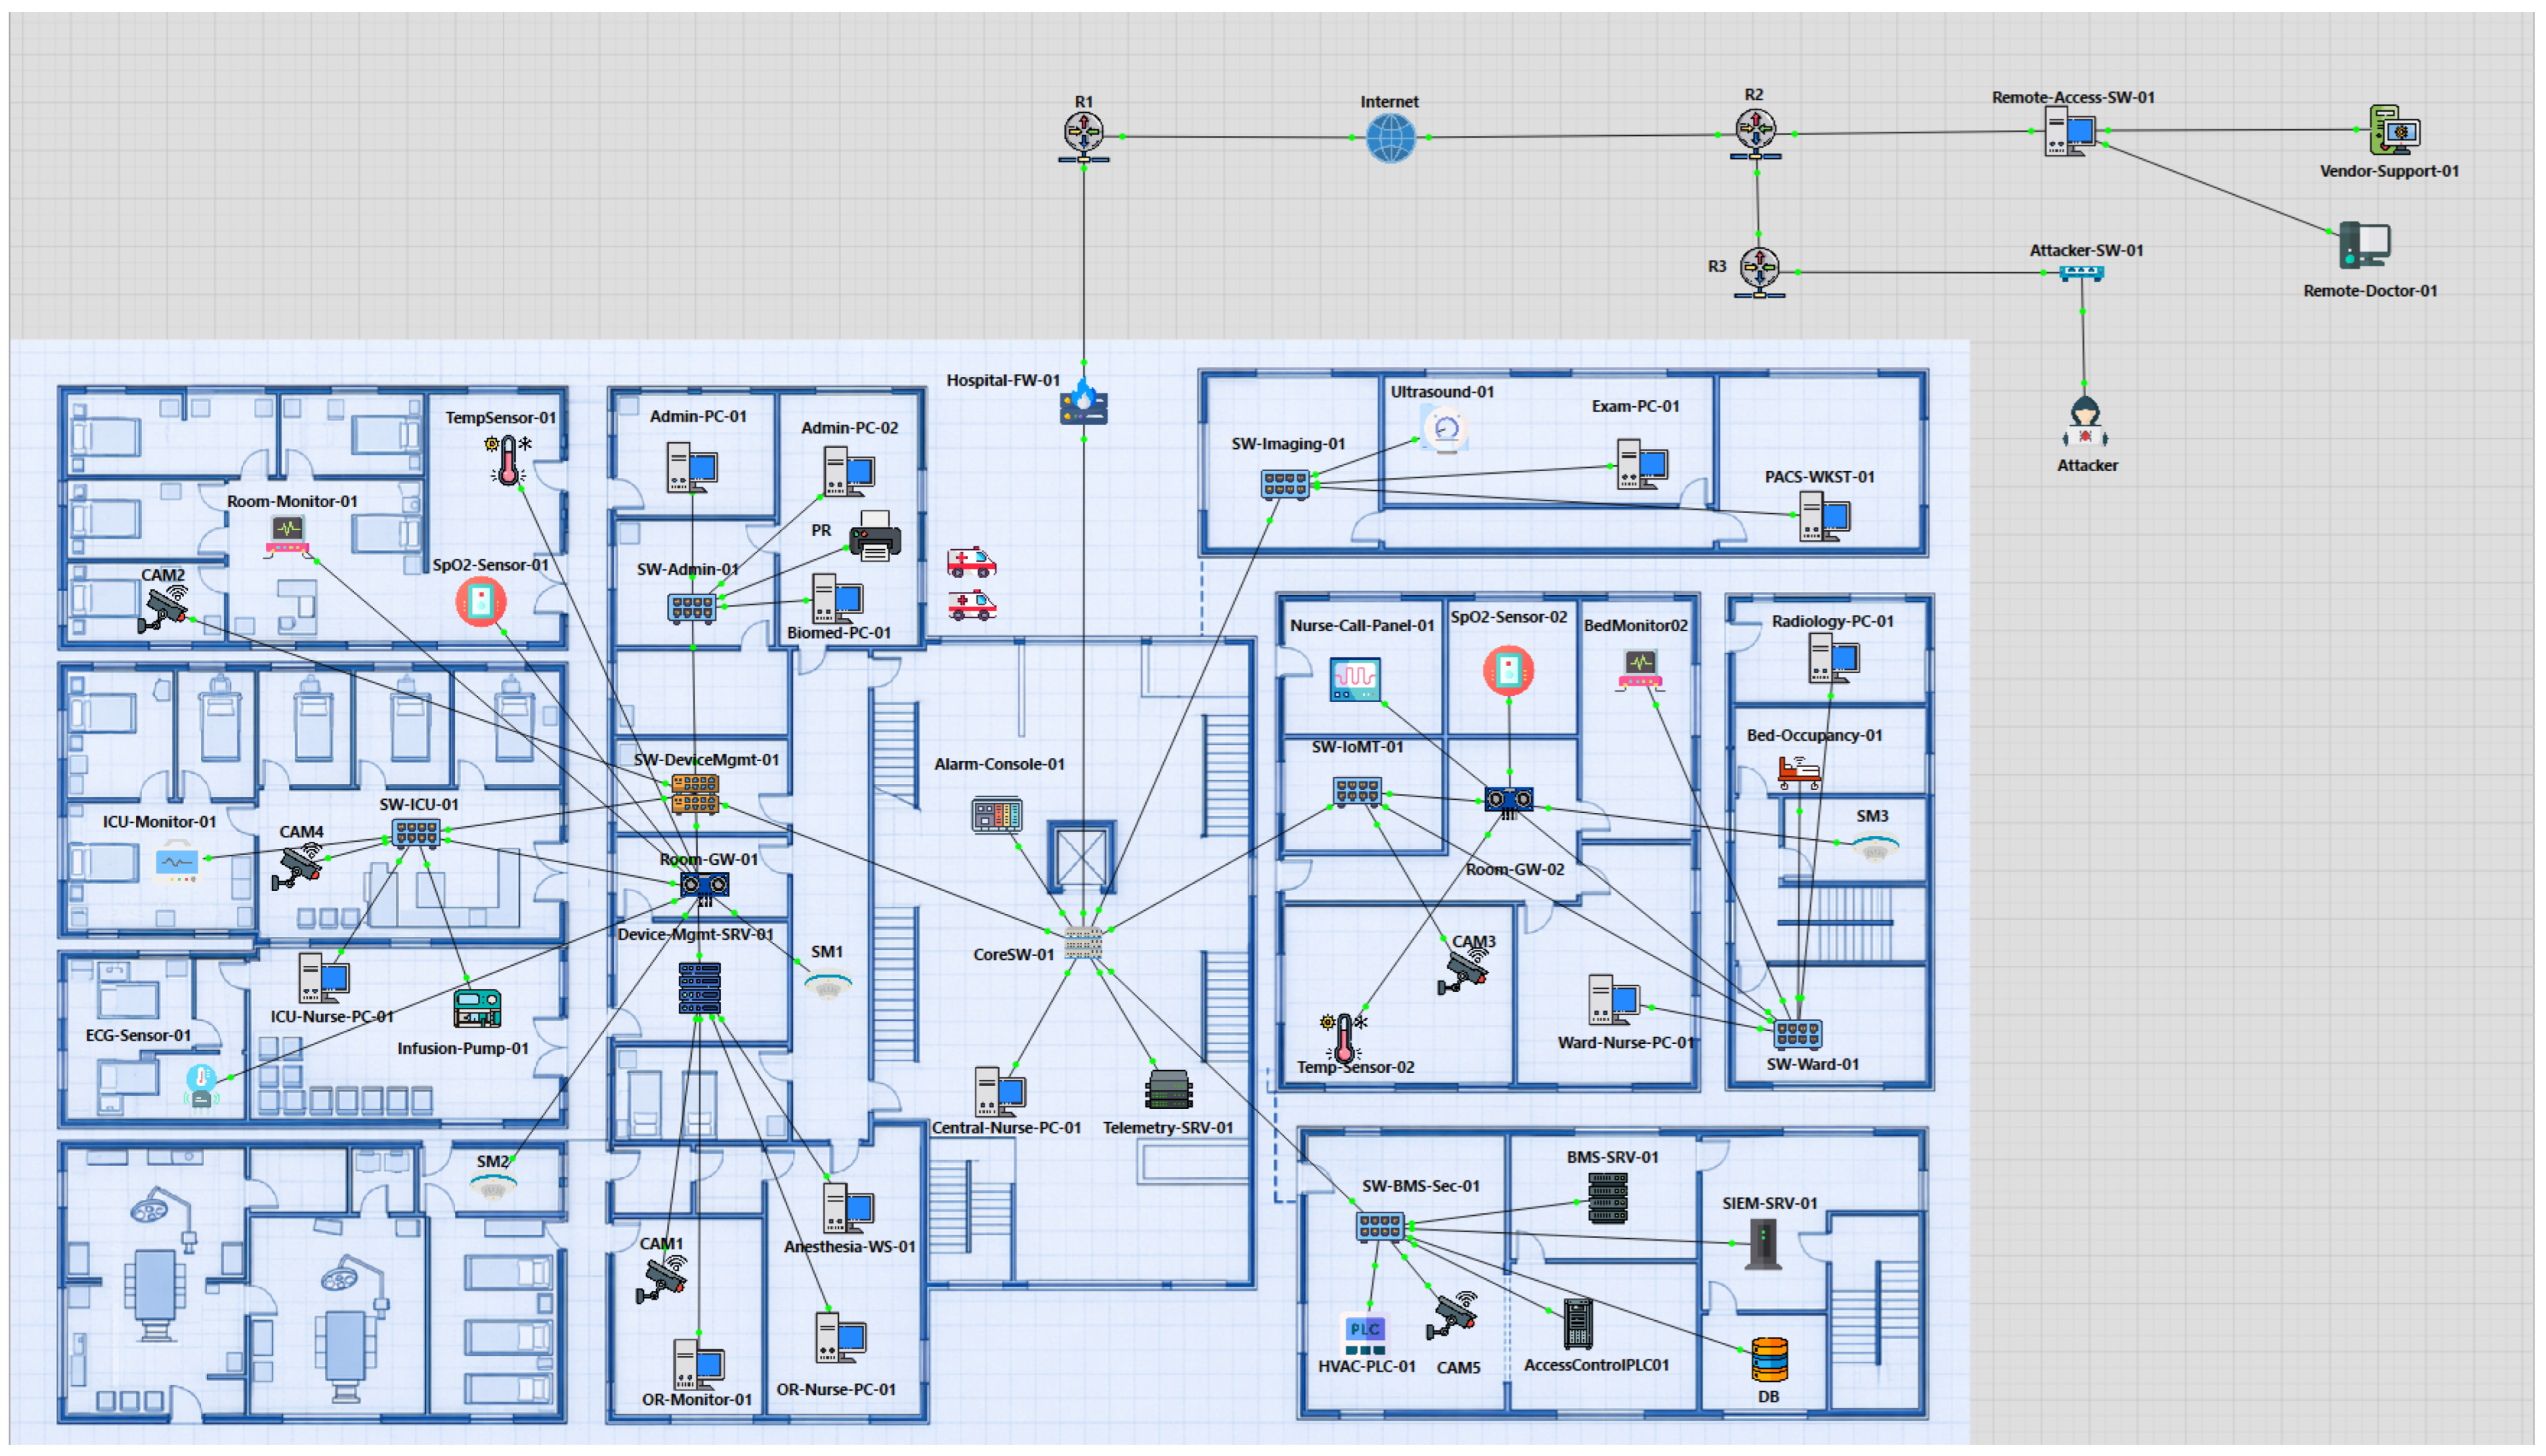
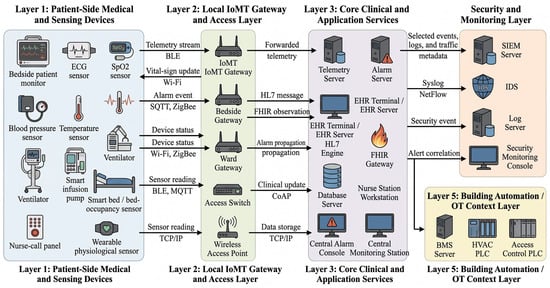
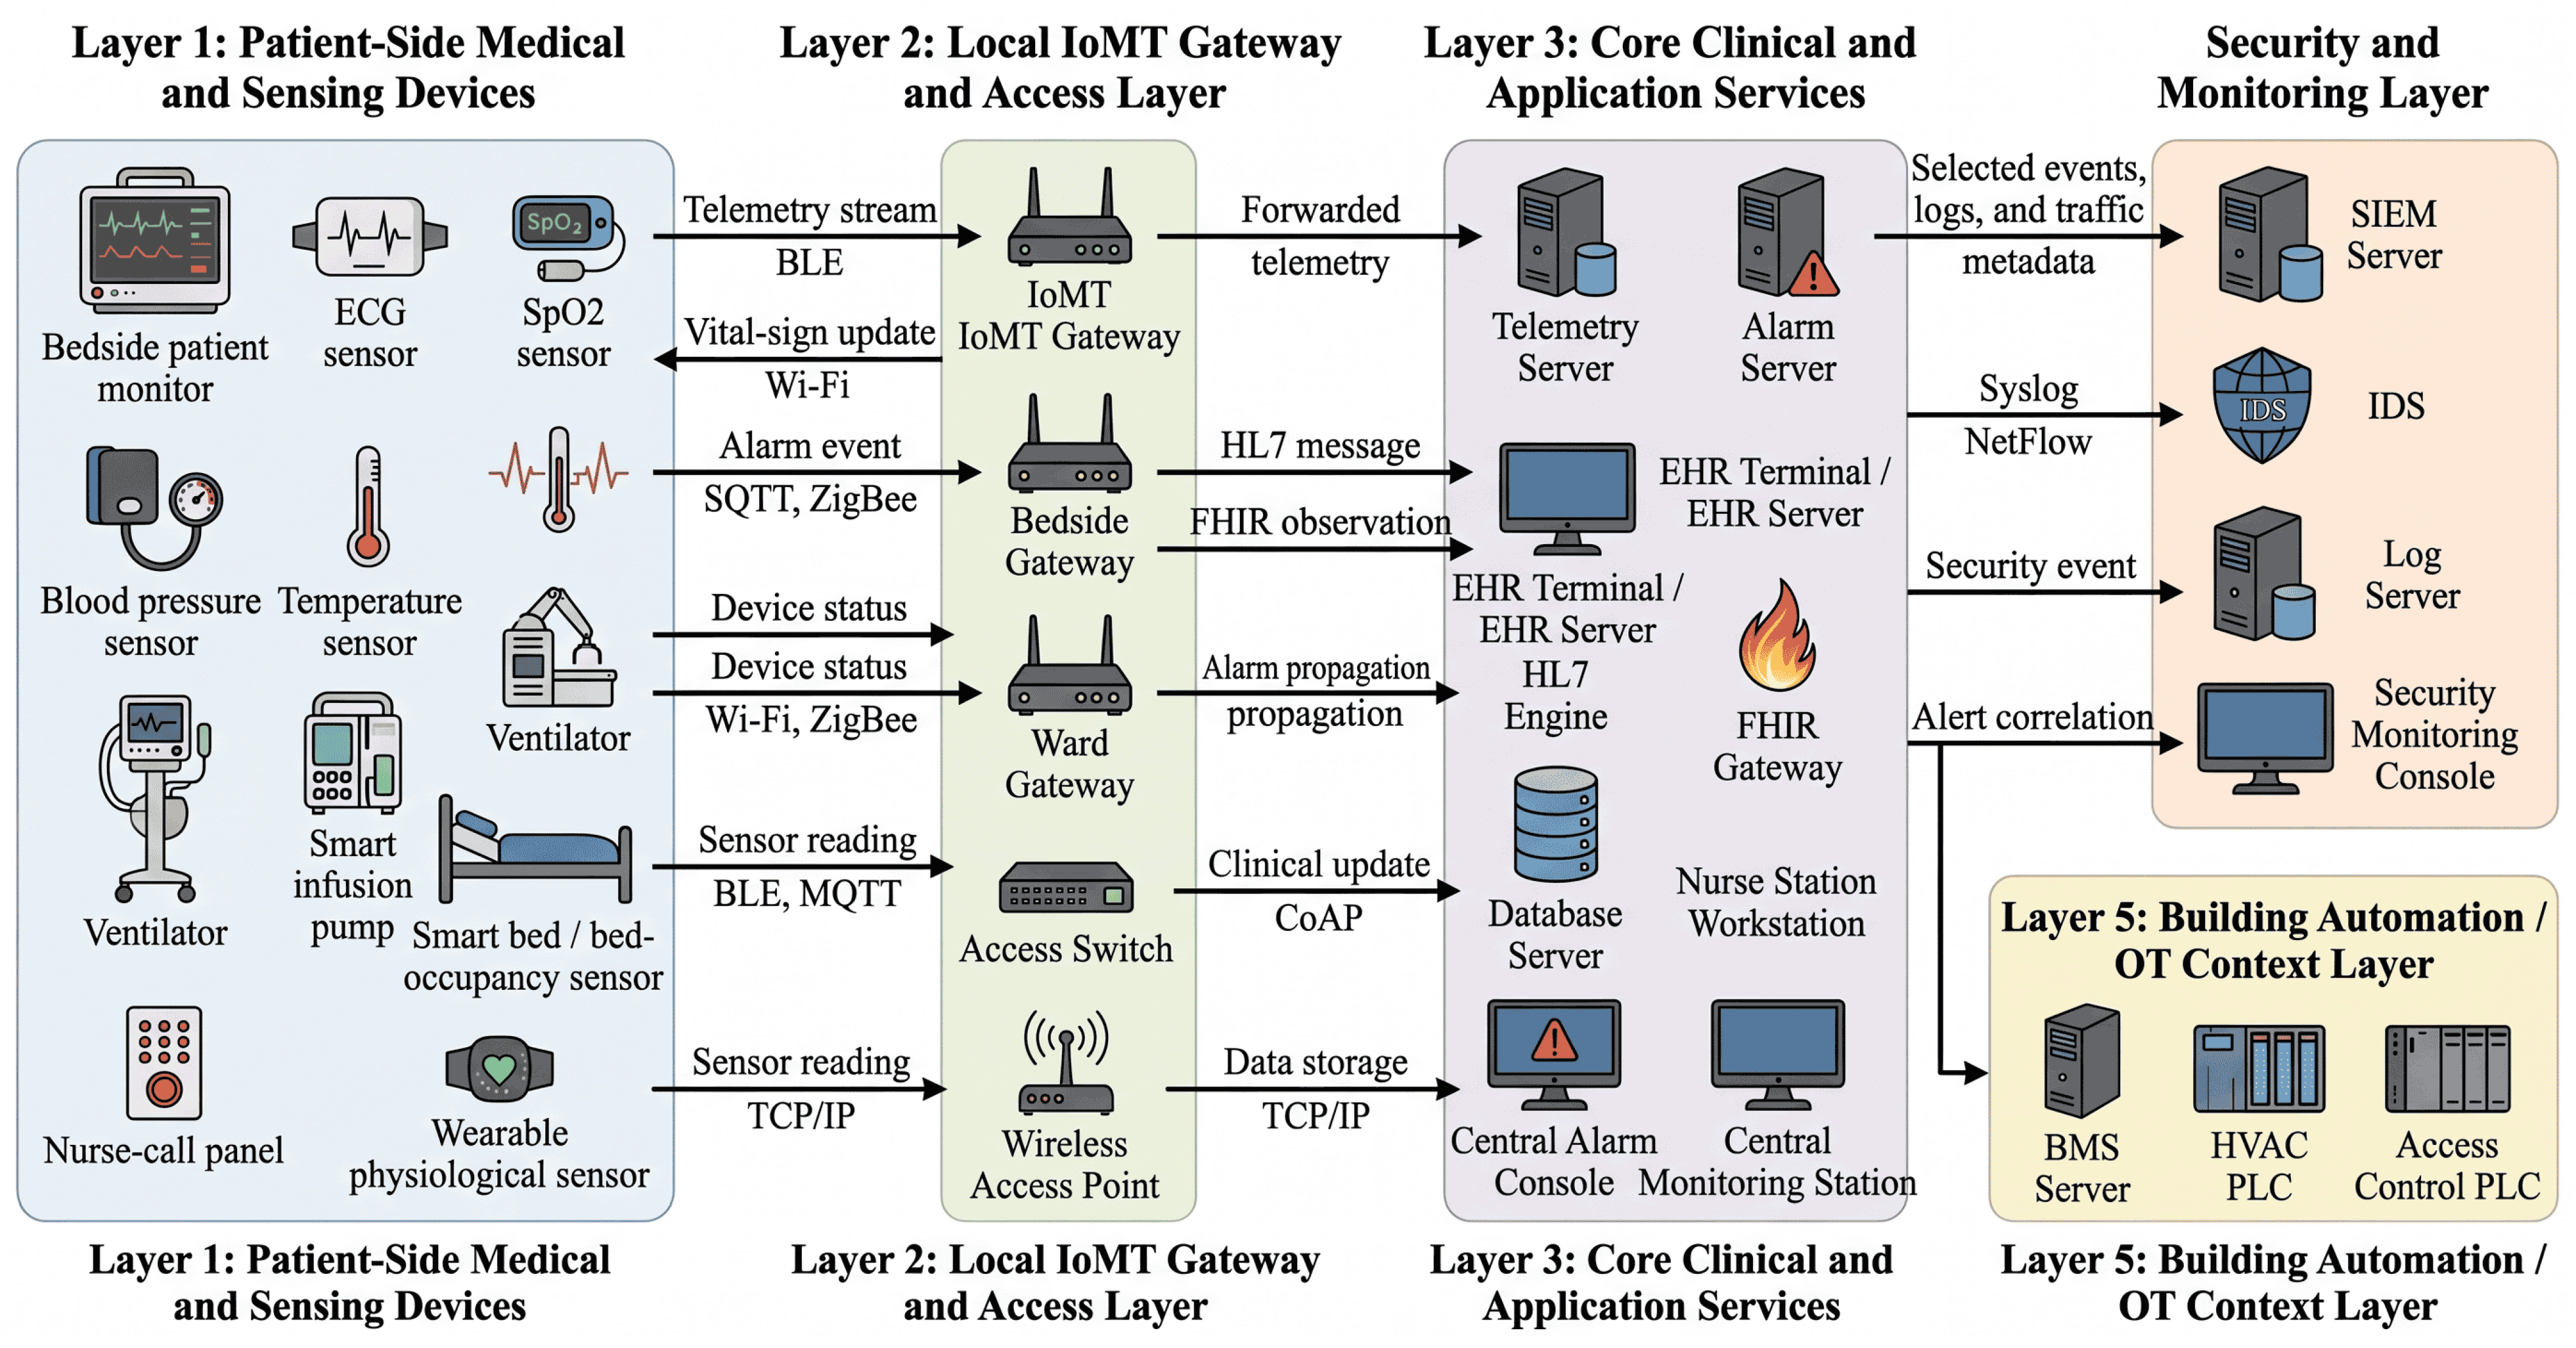
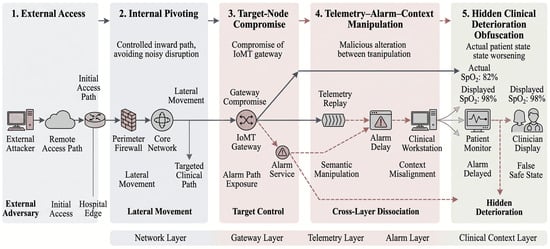
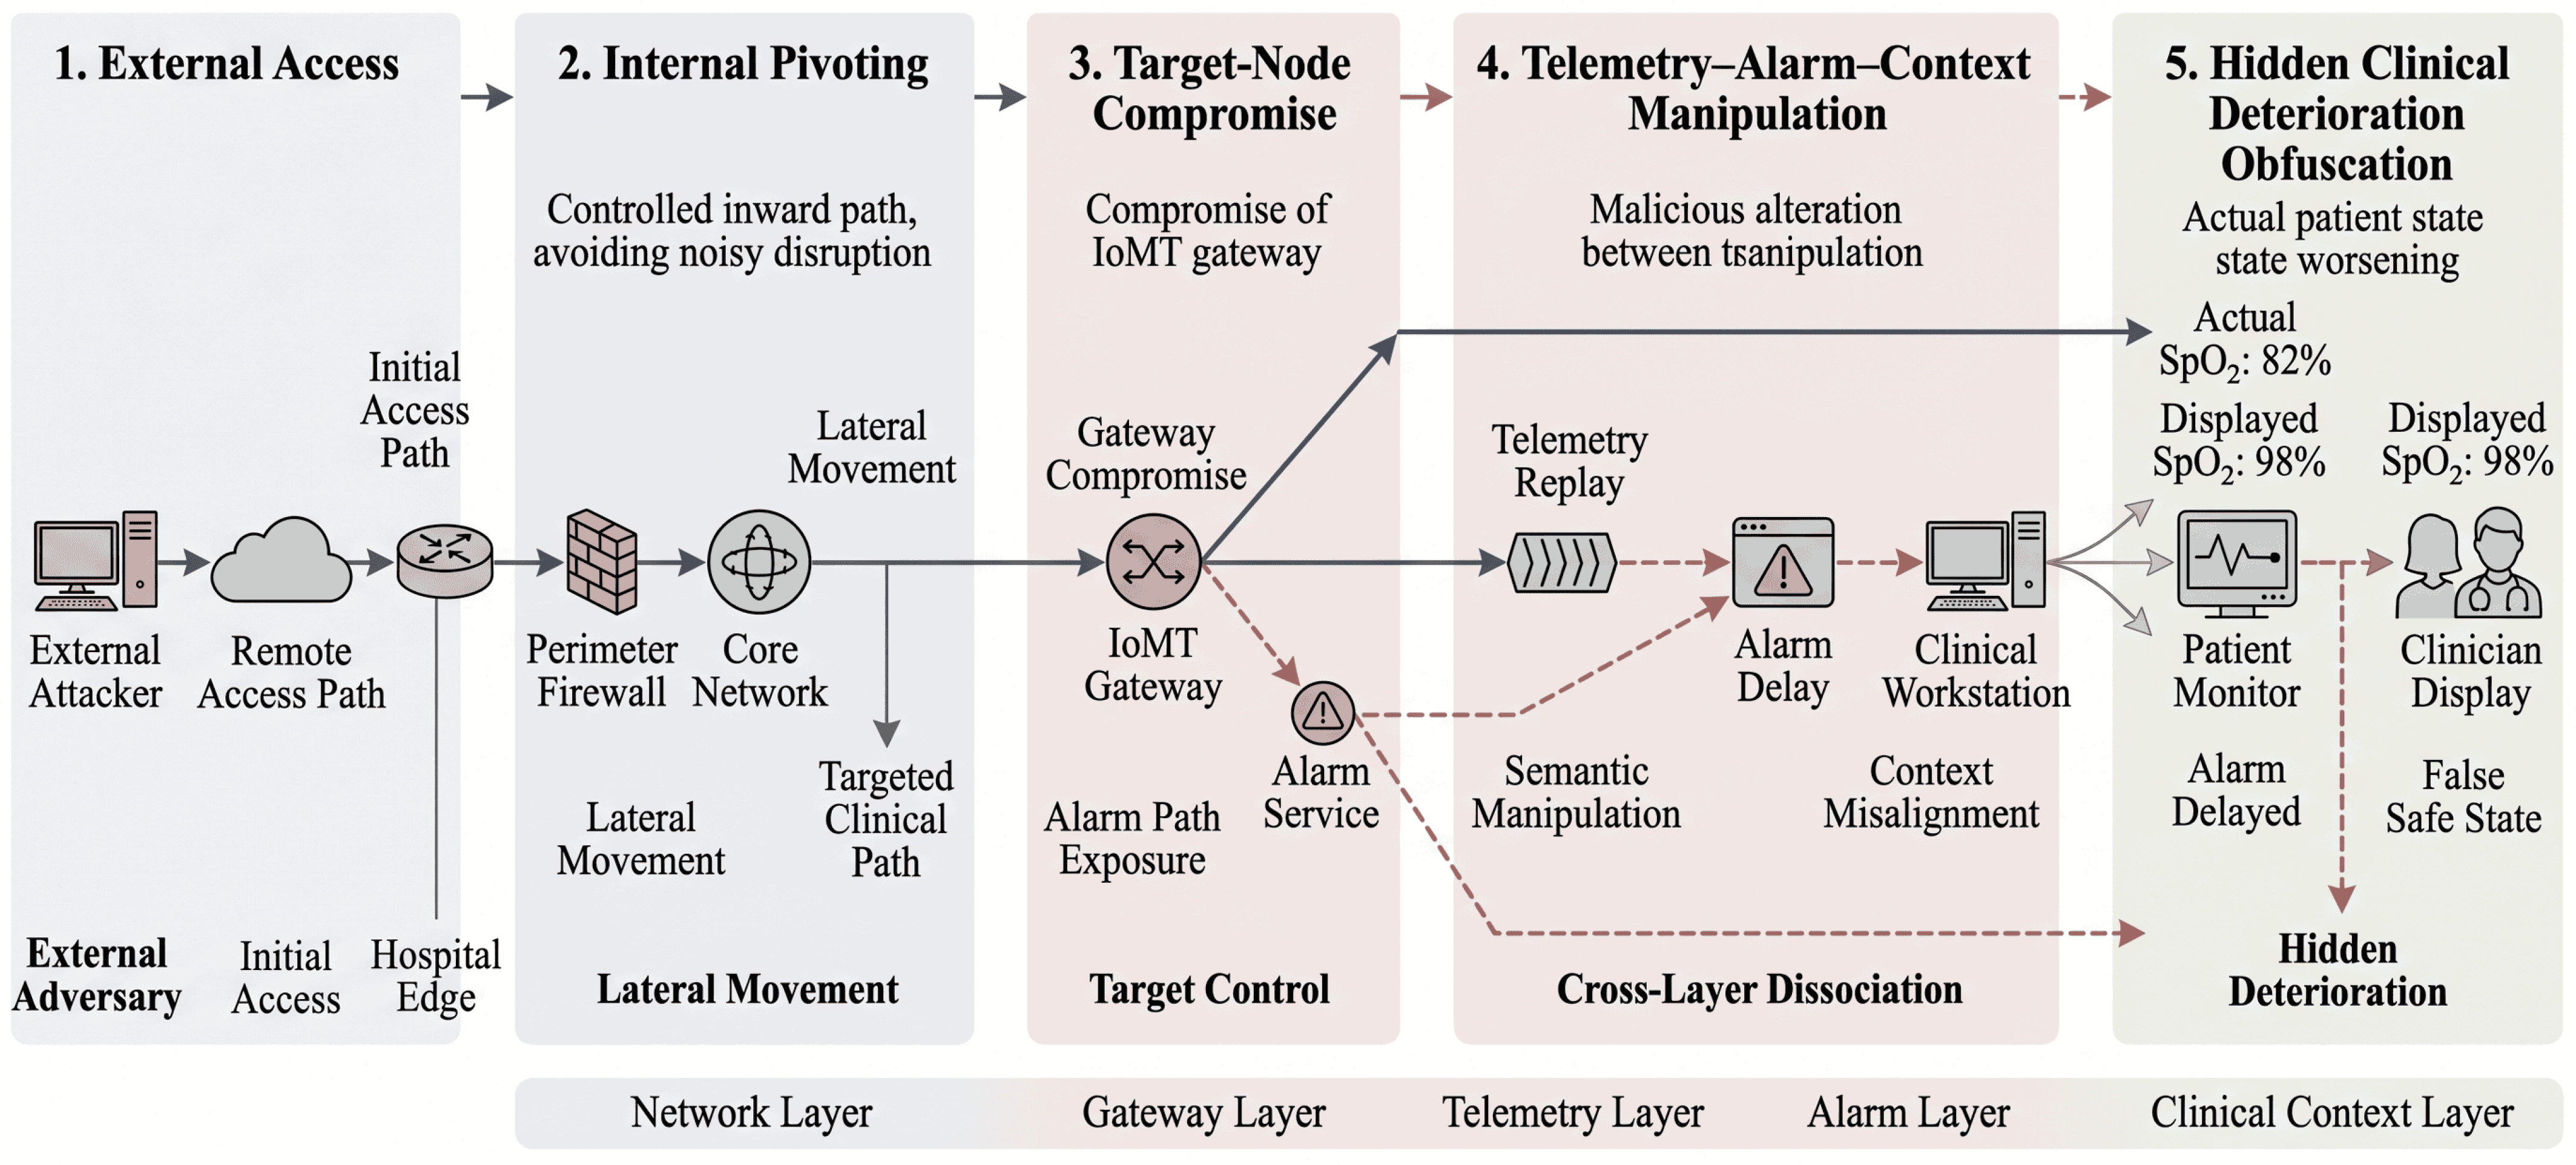
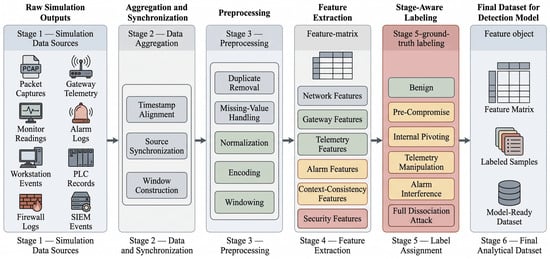
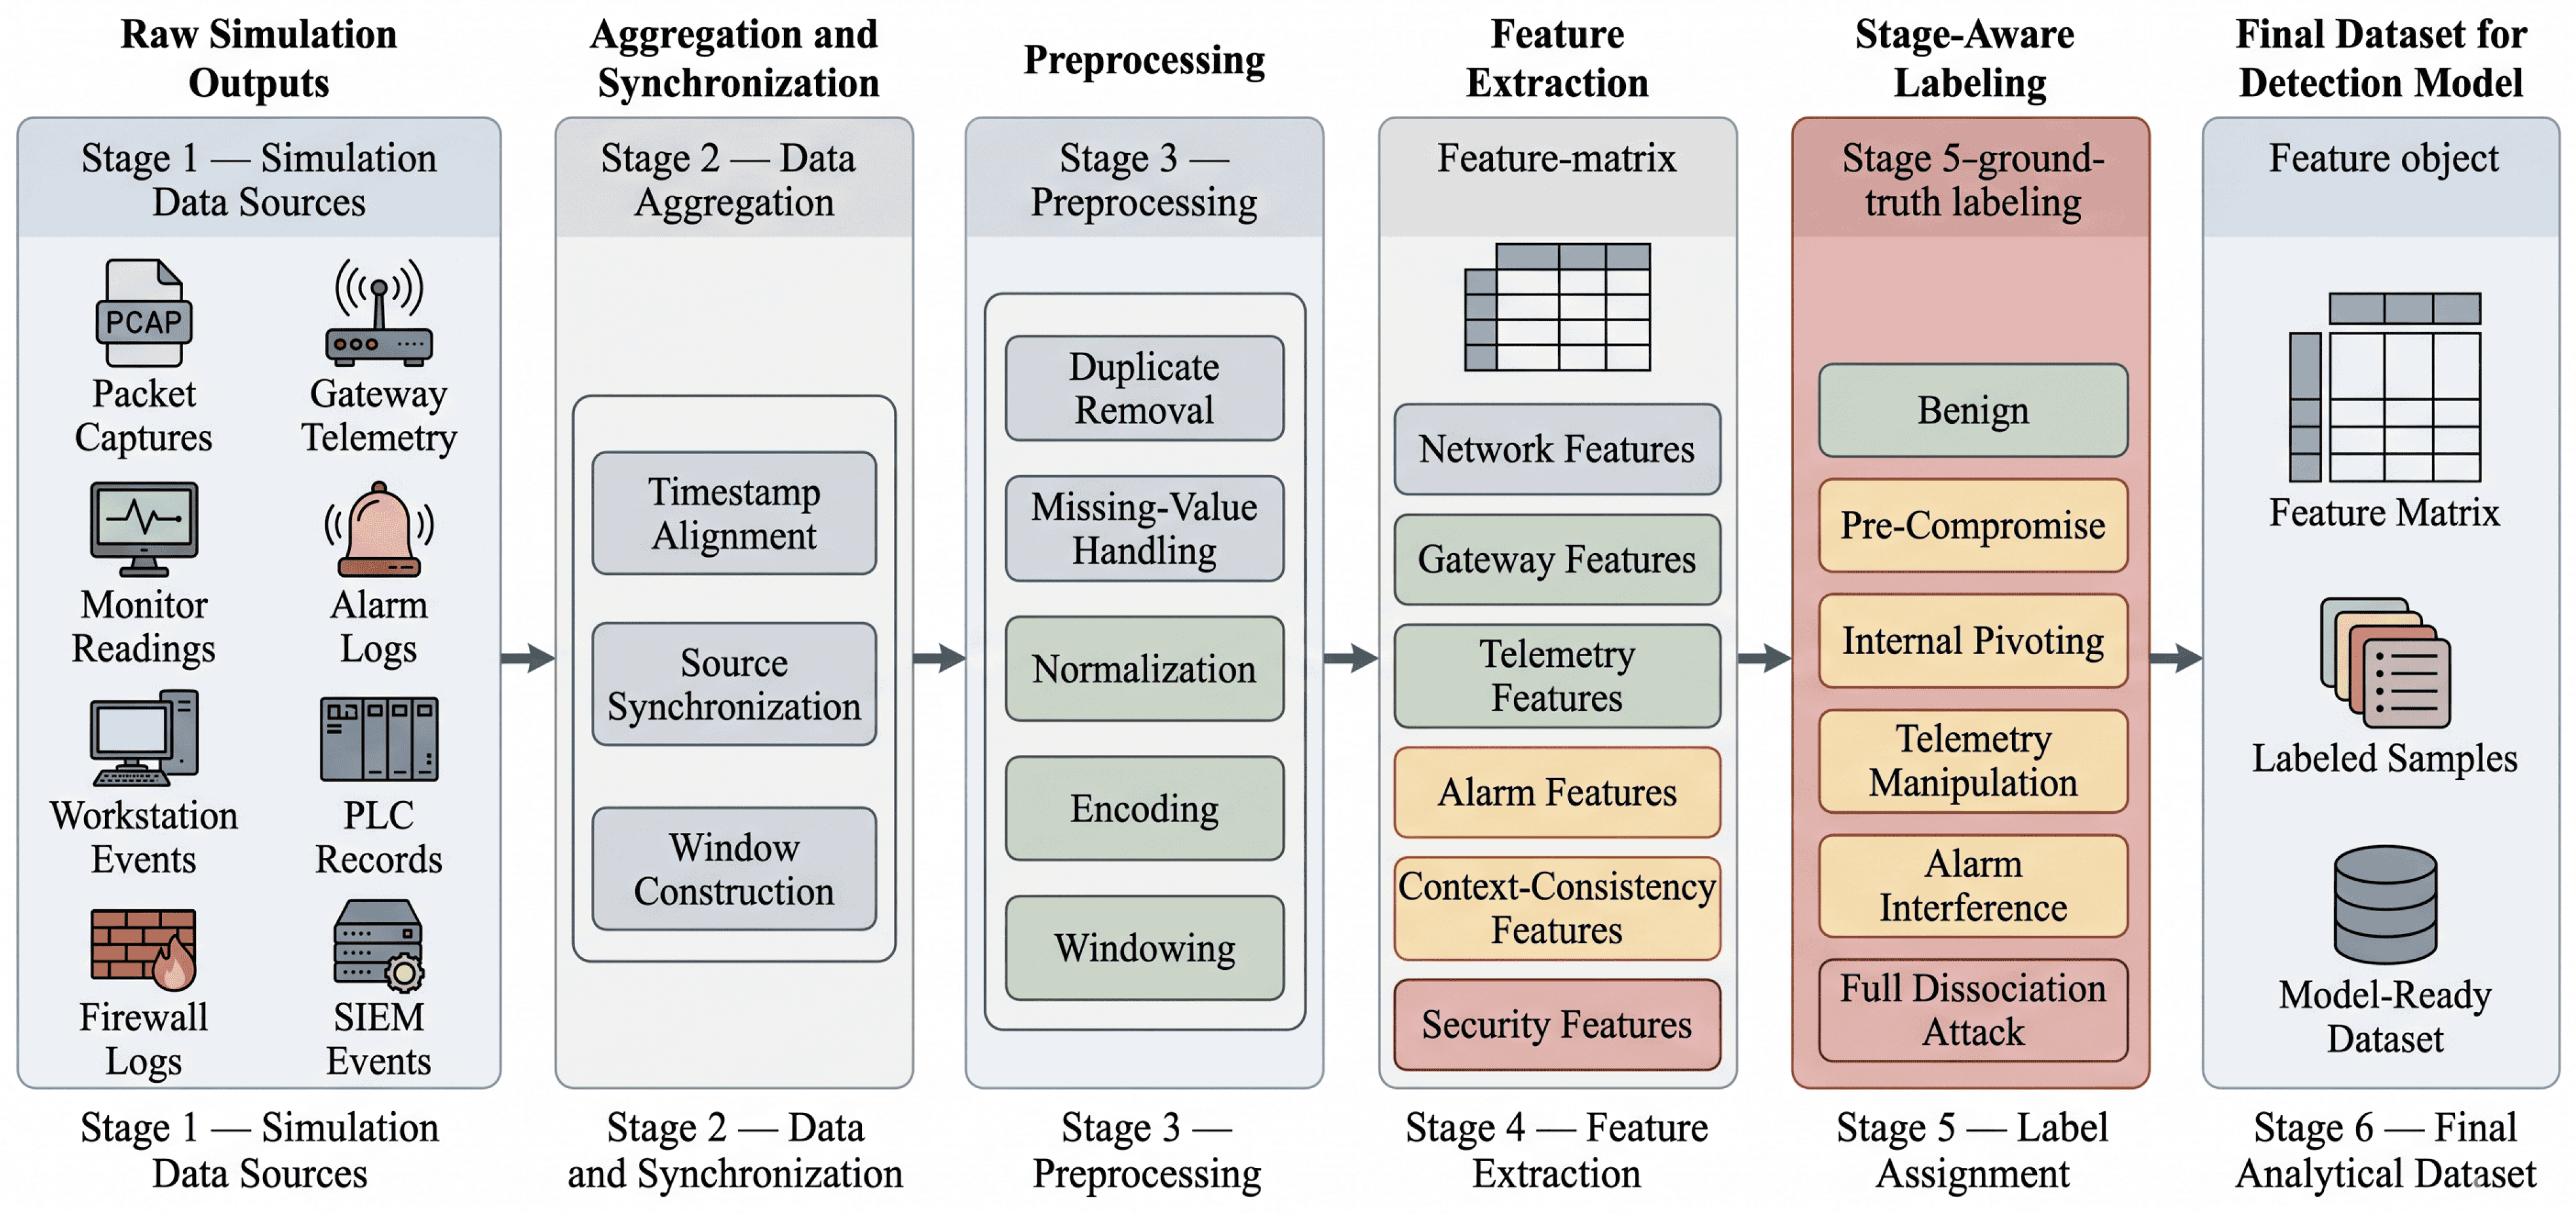
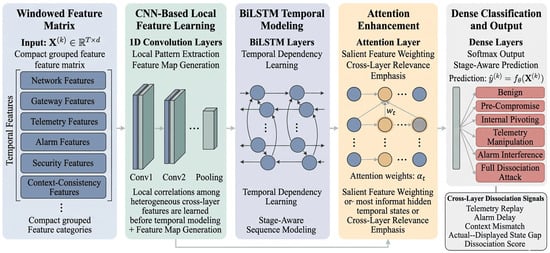
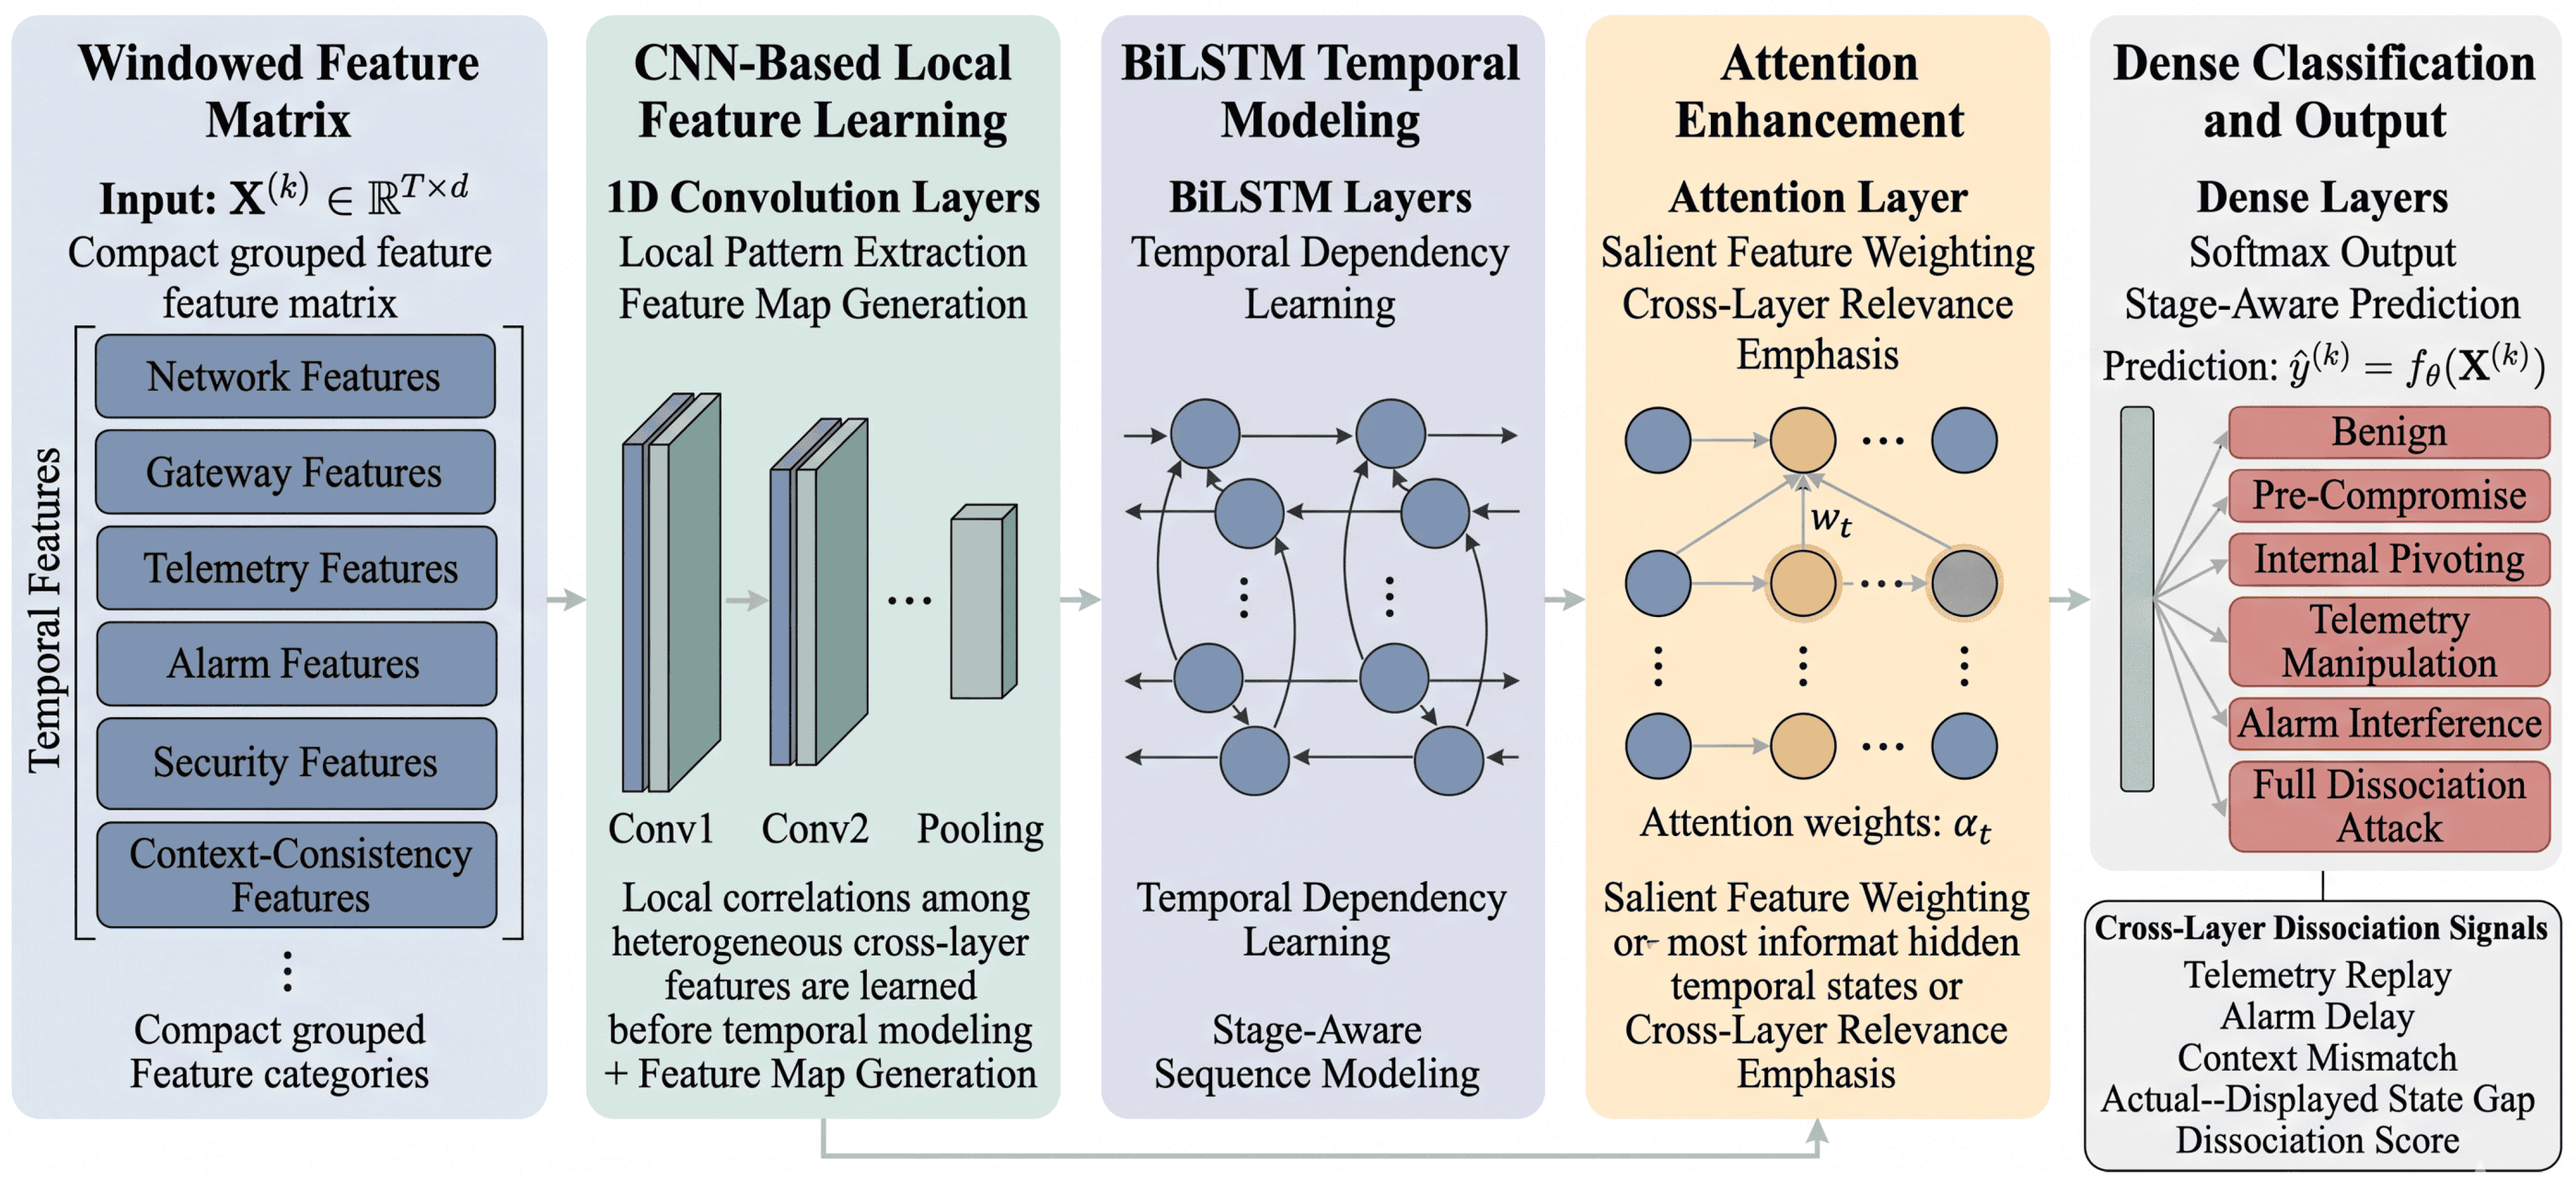
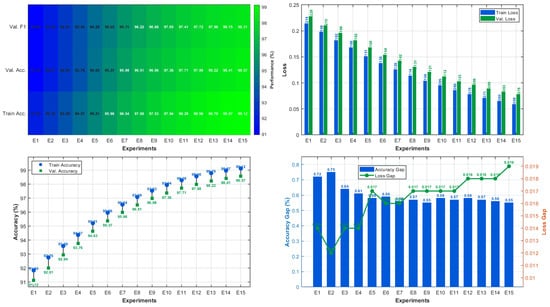
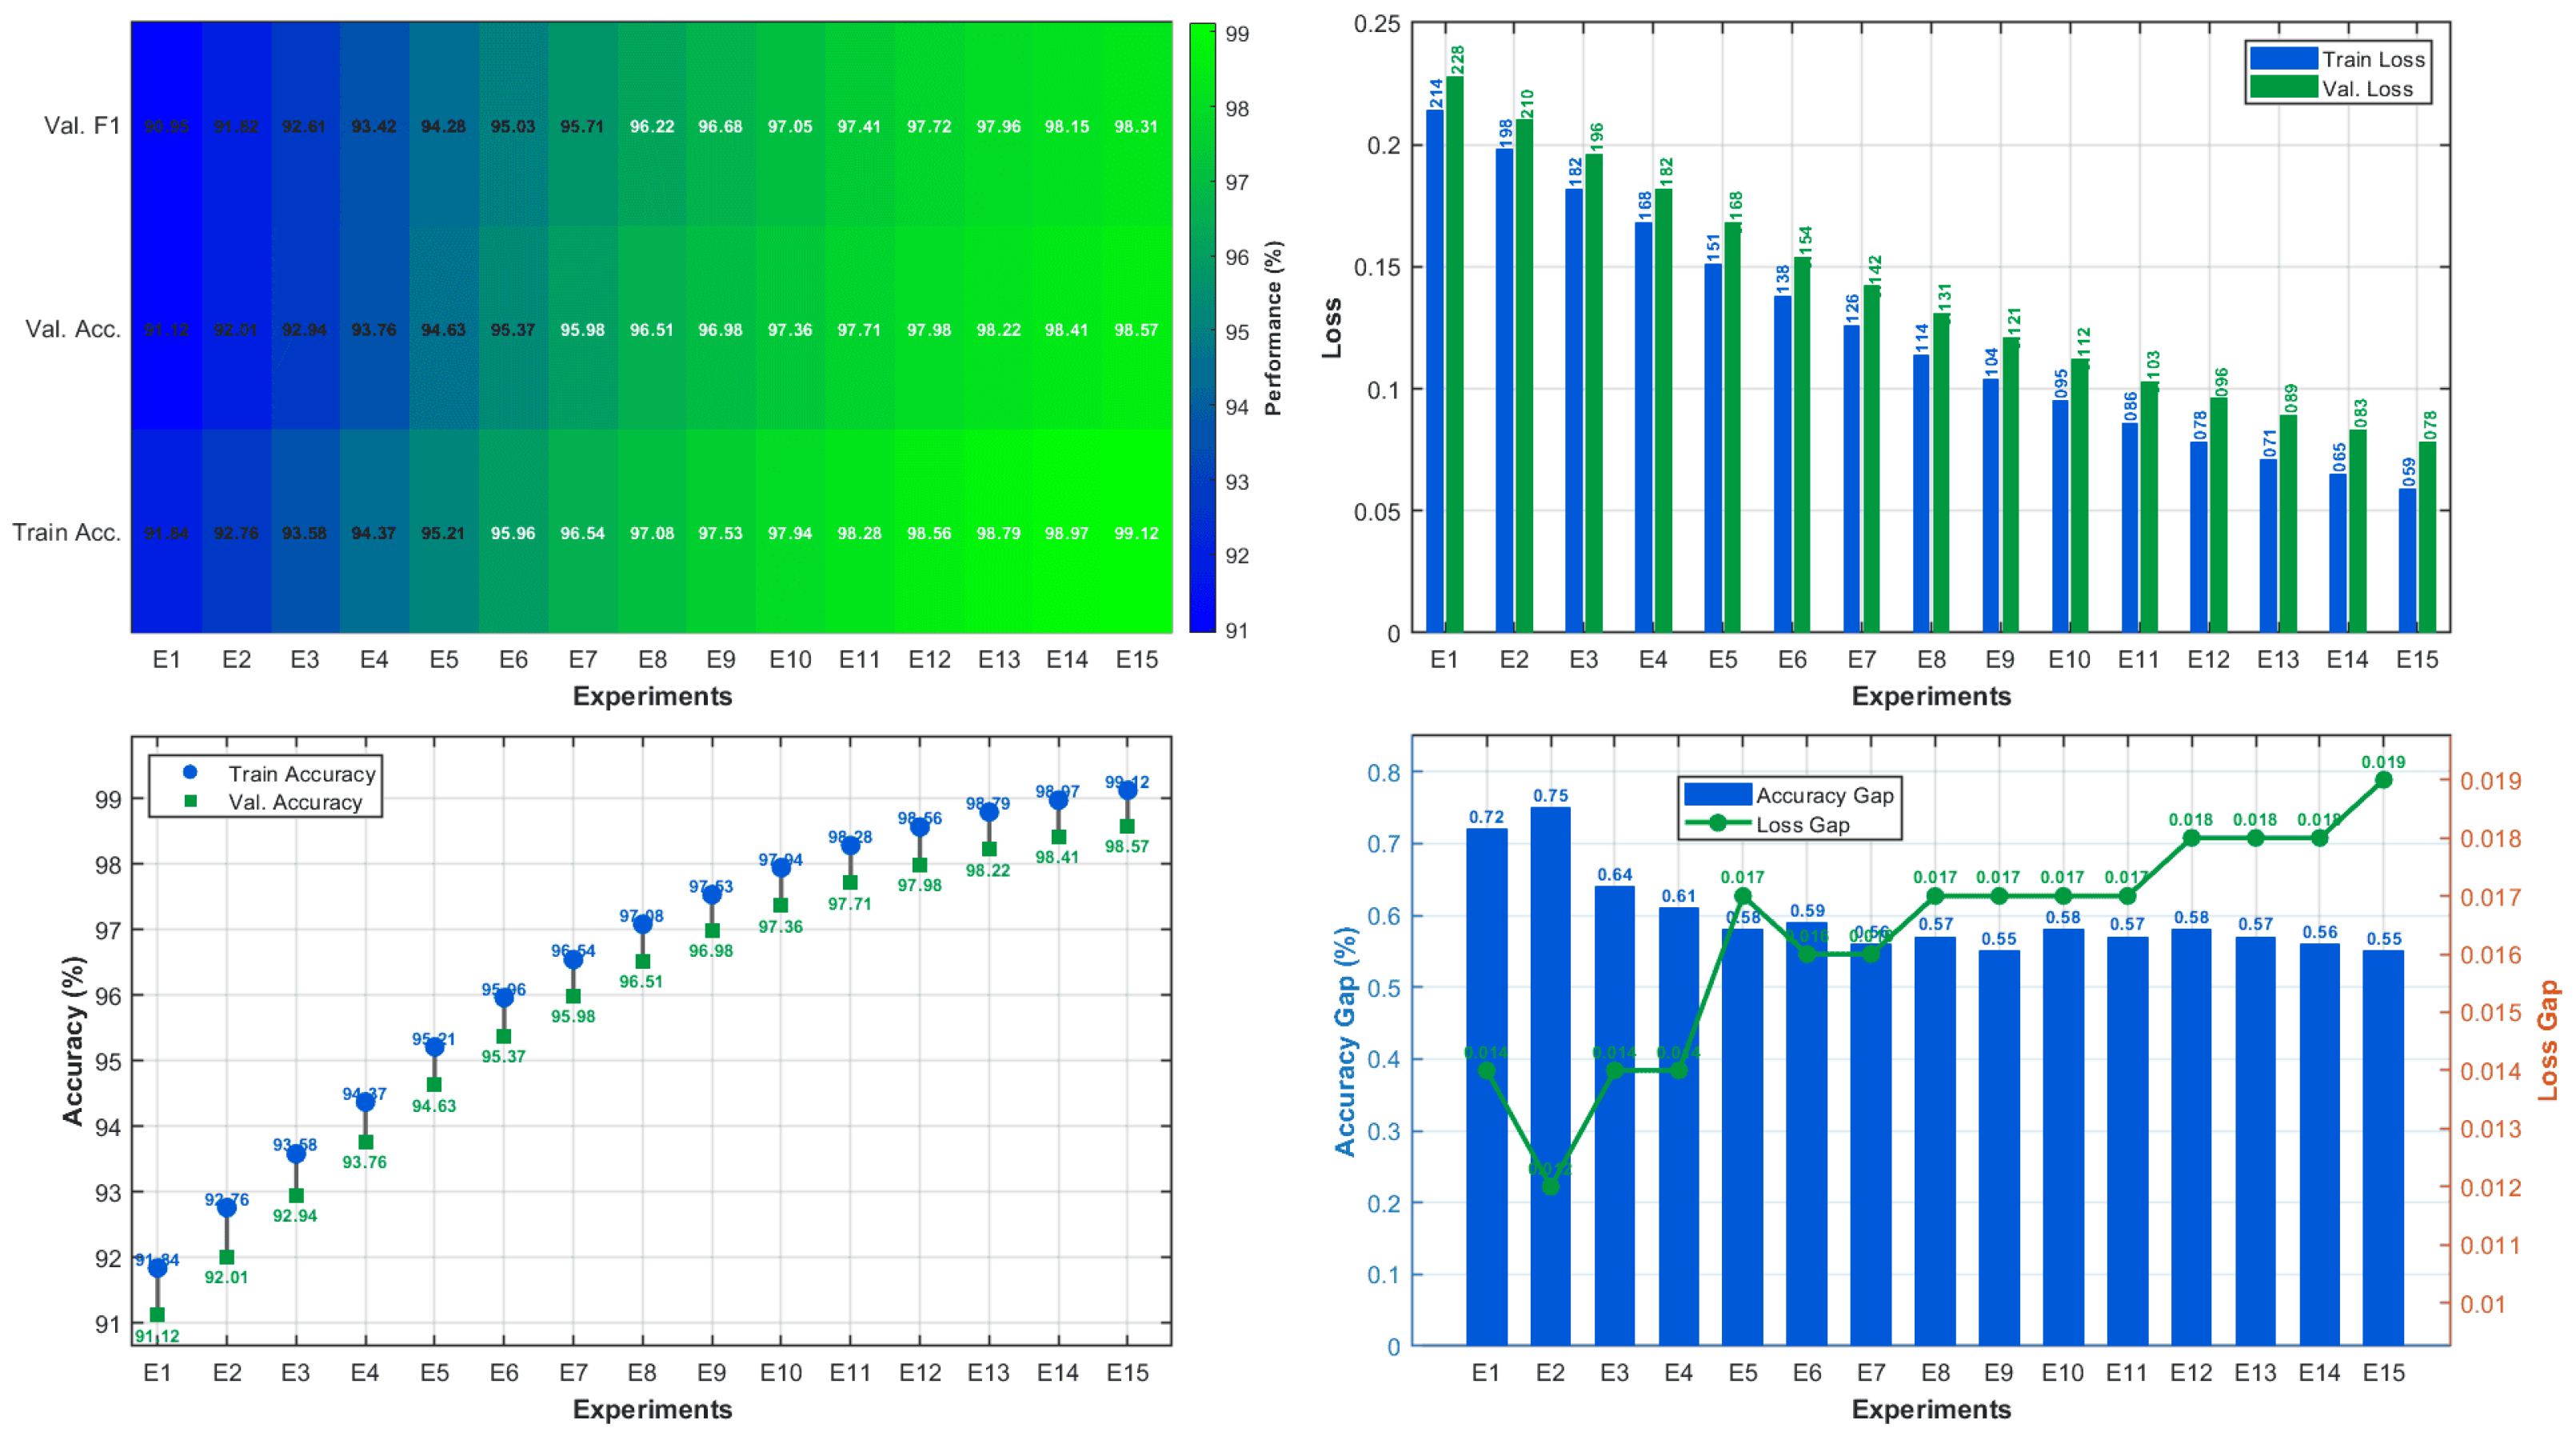
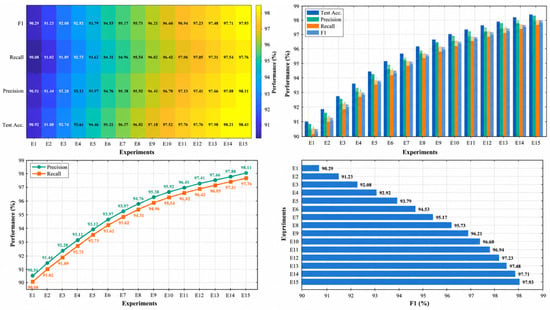
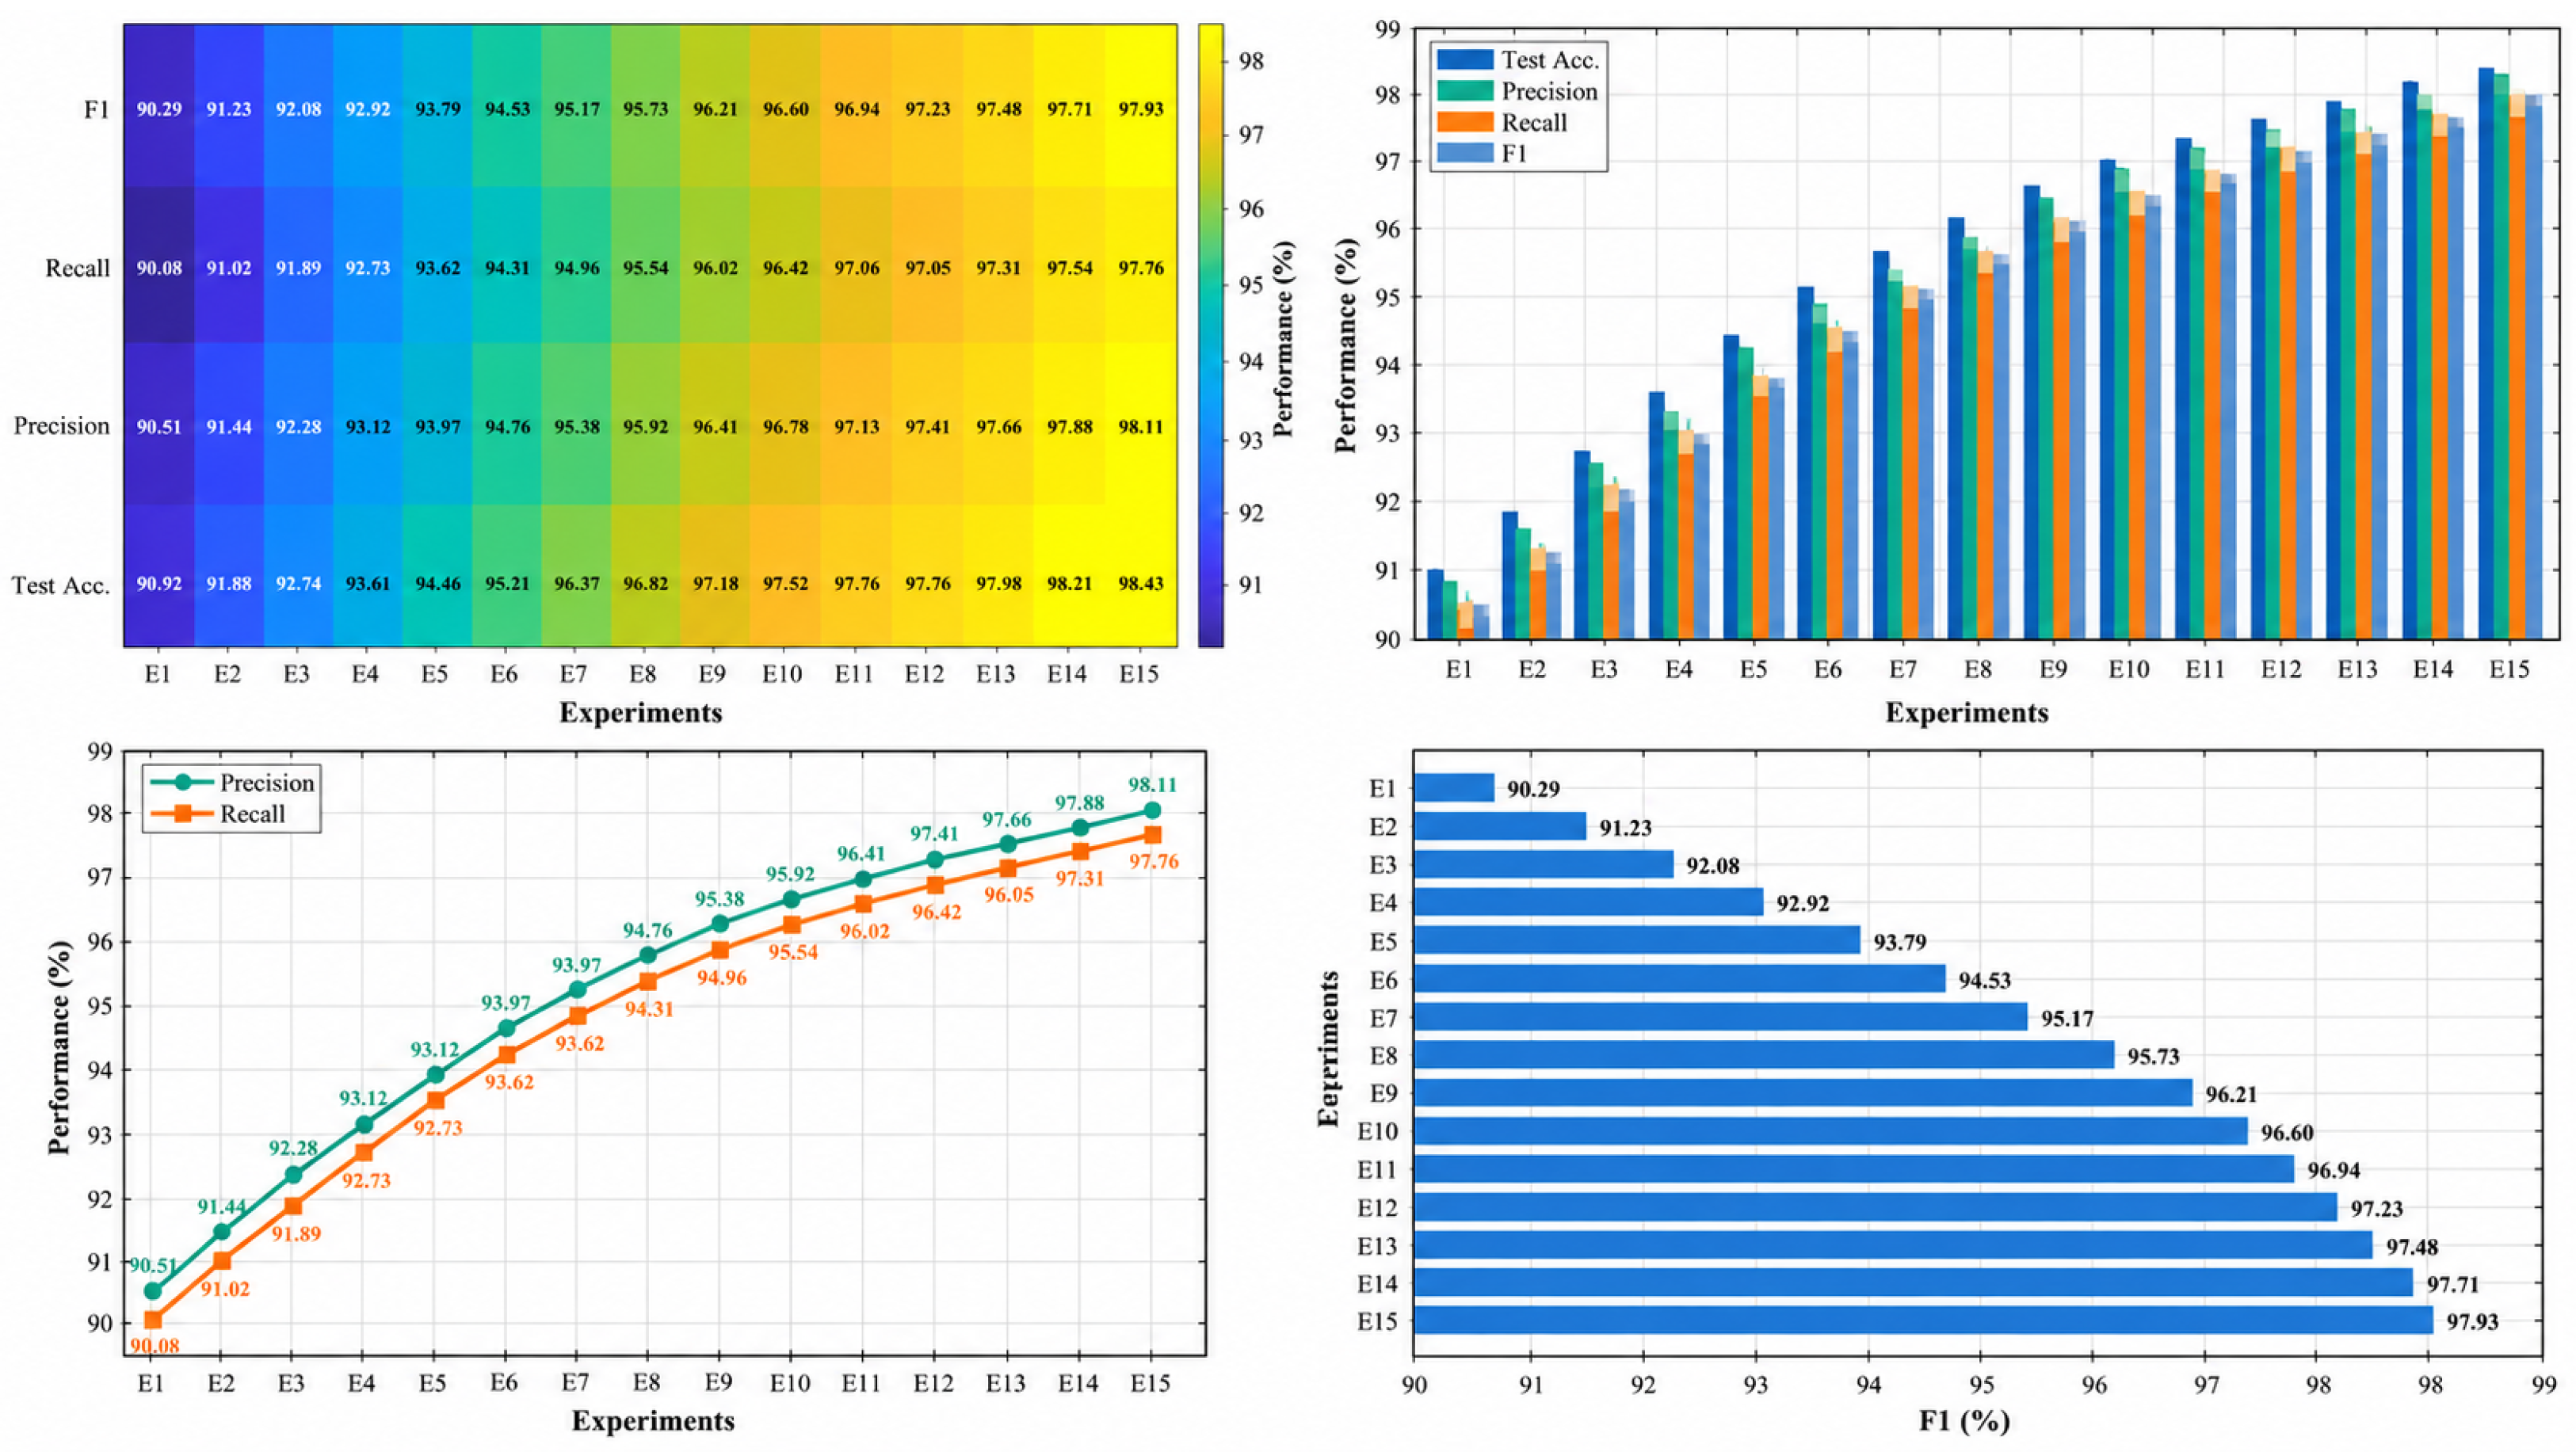
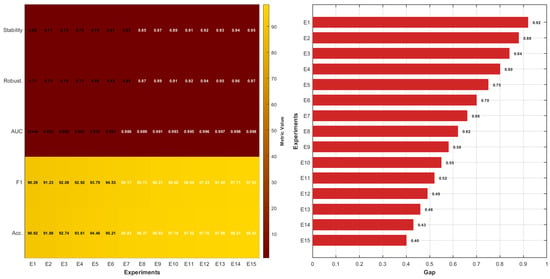
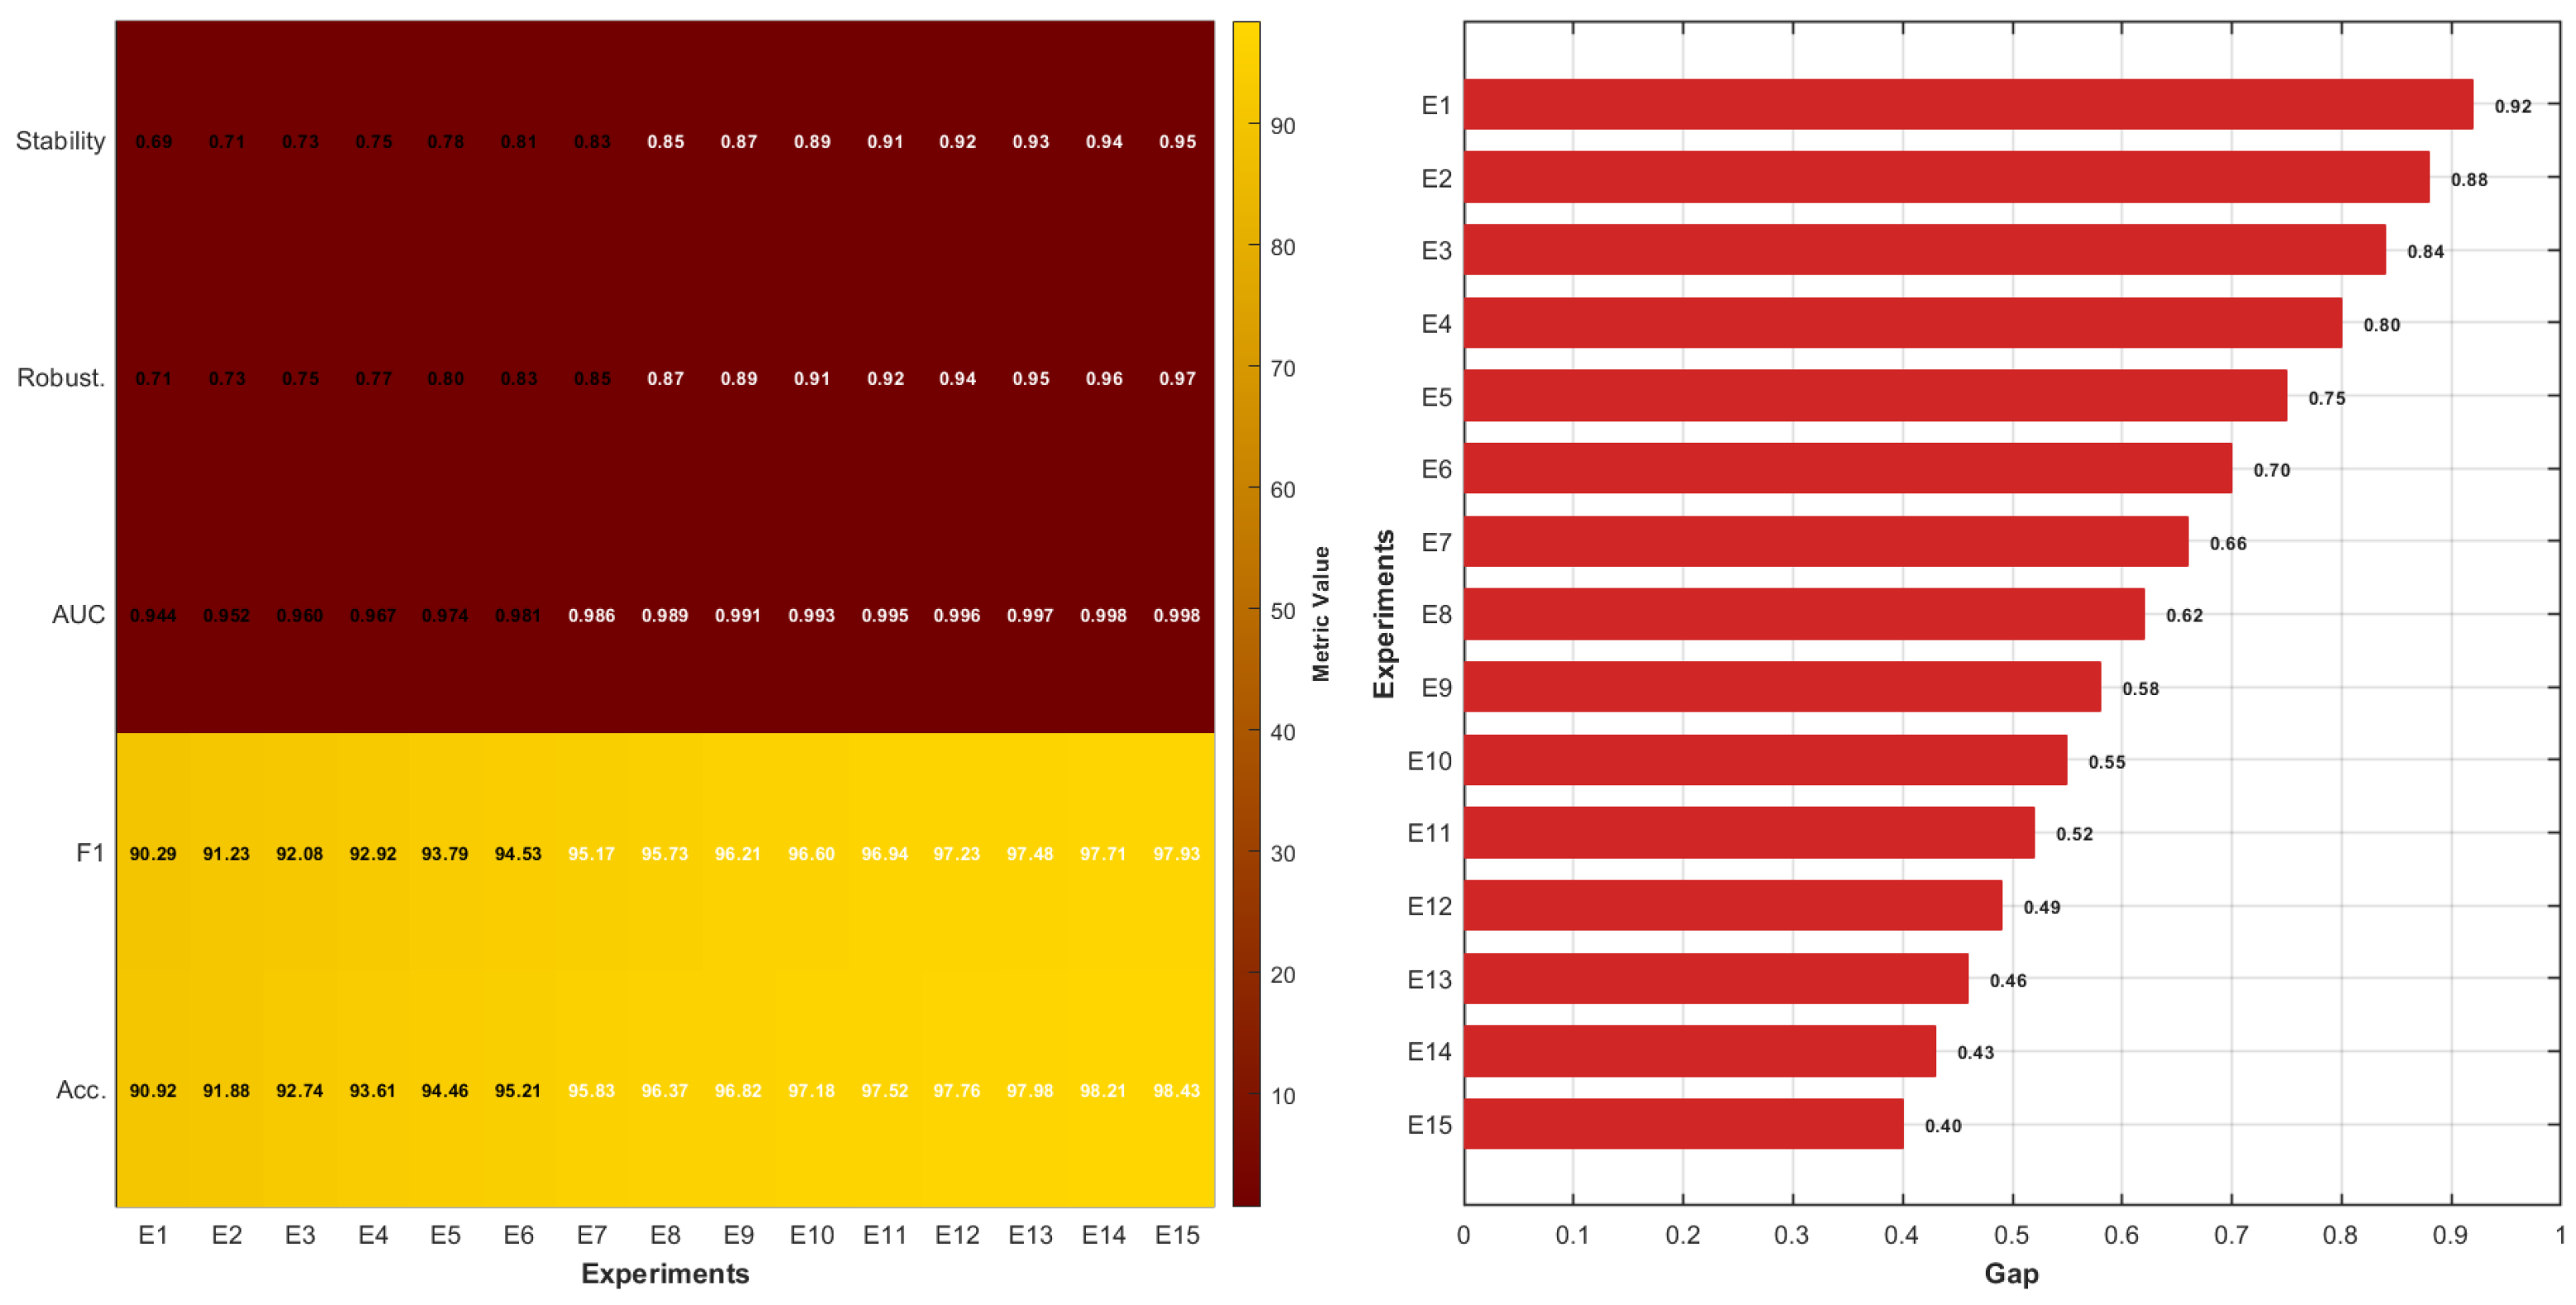

Disclaimer/Publisher’s Note: The statements, opinions and data contained in all publications are solely those of the individual author(s) and contributor(s) and not of MDPI and/or the editor(s). MDPI and/or the editor(s) disclaim responsibility for any injury to people or property resulting from any ideas, methods, instructions or products referred to in the content. |
© 2026 by the authors. Licensee MDPI, Basel, Switzerland. This article is an open access article distributed under the terms and conditions of the Creative Commons Attribution (CC BY) license.