


Abstract
The P300 component is a well-established event-related potential (ERP) widely employed in brain–computer interface (BCI) systems, particularly in visual oddball paradigms such as the P300 speller. In this study, we analyze the large-scale BigP3BCI dataset to characterize the neurophysiological properties of P300 responses and to perform a preliminary evaluation of machine learning-based classification. EEG recordings were segmented into epochs aligned to stimulus onset and averaged separately for Target and non-target conditions to compute ERPs. The analyses revealed differences between Target and non-target responses, with a predominantly centro-parietal distribution broadly consistent with the classical P3b component. Although the grand-average ERP exhibited an earlier positive deflection, additional analyses performed separately across study/paradigm groups demonstrated substantial variability in ERP morphology and peak latency, highlighting the heterogeneous composition of the dataset. A preliminary machine learning analysis was subsequently performed using Logistic Regression and shrinkage Linear Discriminant Analysis (LDA). Classification performance improved progressively with epoch averaging, reaching an area under the receiver operating characteristic curve (AUC) of approximately 0.82 after averaging ten epochs. Performance was initially evaluated using five-fold stratified cross-validation at the classification-example level. To assess generalization under stricter leakage-controlled conditions, additional group-disjoint analyses were performed using leave-one-participant-out, leave-one-study-out, and leave-one-paradigm-out validation. In these analyses, train/test groups were defined before epoch averaging, which was performed separately within each partition and restricted to epochs from the same participant, session, and class. Classification performance increased with epoch averaging under both the preliminary example-level and group-disjoint validation schemes. With ten-epoch averaging, mean ROC-AUC reached approximately 0.81 under participant-disjoint validation, 0.78 under study-disjoint validation, and 0.77 under paradigm-disjoint validation. Overall, the study provides a large-scale neurophysiological characterization of BigP3BCI together with interpretable linear-classification baselines and an initial assessment of cross-participant, cross-study, and cross-paradigm generalization.
1. Introduction
Brain–computer interfaces (BCIs) represent an emerging technology aimed at establishing a direct communication pathway between the brain and external devices [1,2,3,4]. Their primary goal is to provide alternative communication and control systems for individuals affected by severe neuromuscular disorders, such as amyotrophic lateral sclerosis, spinal cord injury, or stroke [5,6,7,8,9,10,11,12,13,14]. Among the different BCI approaches, electroencephalography (EEG)-based systems are widely used due to their non-invasive nature, relatively low cost, and ease of implementation. In particular, event-related potentials (ERPs) have gained considerable attention, as they allow the detection of brain responses that are time-locked to specific stimuli. One of the most studied ERP components in BCI research is the P300 [15,16,17], a positive deflection in the EEG signal that typically occurs approximately between 250 and 500 ms after the presentation of a rare or task-relevant stimulus. The P300 is commonly elicited using the oddball paradigm, in which infrequent target stimuli are interspersed among frequent non-target stimuli. This component is associated with cognitive processes such as attention allocation, stimulus evaluation, and working memory updating [17]. Due to its robustness and improved signal-to-noise ratio after averaging, the P300 has been extensively employed in BCI applications, particularly in speller systems that allow users to select characters by focusing attention on specific visual stimuli [18,19]. However, despite its widespread use, the P300 signal remains relatively weak at the single-trial level, requiring multiple repetitions and appropriate signal processing techniques to ensure reliable detection. In recent years, the integration of machine learning techniques has become essential for translating P300 responses into practical BCI systems. Most modern EEG-based BCIs rely on machine learning algorithms to decode neural signals and infer user intentions [20,21]. In particular, classification algorithms are employed to automatically discriminate between target and non-target responses, enabling real-time interaction with external devices [22]. However, detecting P300 signals at the single-trial level remains challenging due to the low signal-to-noise ratio and the high variability of EEG signals [21]. Several machine learning approaches have been proposed for P300 classification, including traditional methods such as support vector machines, random forests, and linear discriminant analysis, as well as more recent deep learning models [22]. Despite these advances, the performance of BCI systems strongly depends on data quality, preprocessing strategies, and intrinsic signal variability, which remain open challenges in the field [23].
More recently, ensemble deep learning architectures have also been proposed for P300 detection, including the inception-based two-stage ensemble framework (ITSEF), further illustrating the increasing use of learned spatiotemporal representations for target–non-target discrimination [24]. Beyond conventional subject-specific classification, increasing attention has been directed toward models capable of transferring across participants and experimental conditions. Compact convolutional architectures such as EEGNet have been evaluated for both within-subject and cross-subject EEG classification, including P300 paradigms, demonstrating the potential of learned spatial and temporal representations for reducing dependence on participant-specific feature engineering [25].
P300 decoding has also been investigated using established spatial-filtering approaches such as xDAWN, which was specifically developed to enhance evoked responses for BCI classification [26]. More recent P300-specific approaches have investigated multi-scale convolutional representations and few-shot learning strategies [27,28].
Transformer-based architectures have also recently been investigated for P300 decoding, including the P3T model specifically developed for P300 speller systems [29]. In parallel, subject-independent and cross-participant approaches have increasingly focused on learning representations that generalize to unseen users. Invariant-pattern CNN approaches have been proposed for subject-independent P300 BCIs [30], while more recent domain-adaptation strategies combine deep feature learning with adversarial training to reduce inter-participant distribution differences under leave-one-participant-out evaluation [31]. These developments emphasize that validation design is critical: performance obtained from randomly partitioned epochs addresses a different question from subject-independent or cross-study evaluation, in which data from unseen participants or experimental settings are explicitly held out.
In this context, large-scale and well-annotated EEG datasets play a crucial role in advancing both neurophysiological understanding and the development of robust BCI algorithms. In particular, datasets integrating recordings acquired across different participants, experimental paradigms, and acquisition settings provide an opportunity to investigate the variability of P300 responses under heterogeneous conditions and to assess the robustness of decoding approaches beyond individual experimental settings. However, such heterogeneity also poses methodological challenges, as differences in stimulation protocols, signal characteristics, and ERP morphology may affect both grand-average neurophysiological measures and machine learning performance.
Because BigP3BCI was released only recently, peer-reviewed studies systematically benchmarking modern decoding architectures across the complete heterogeneous resource remain limited. This provides additional motivation for establishing transparent dataset-level characterization and preliminary baselines before evaluating more complex subject- and study-independent decoding strategies.
Representative methodological developments in P300 decoding are summarized in Table 1. Importantly, these studies differ substantially in dataset composition, classification target, epoch averaging, and validation design. Accordingly, their reported performance values are provided for methodological context rather than for direct numerical comparison. In particular, subject-disjoint evaluations address generalization to unseen participants, whereas example-level cross-validation, as used for the preliminary baseline in the present study, addresses a more limited within-dataset discrimination setting.
Table 1.
Comparison of representative methodological approaches for P300 decoding. Studies are summarized according to dataset, classification approach, validation protocol, subject-disjoint evaluation, and reported performance. Reported performance values are provided for methodological context only and should not be interpreted as directly comparable because of differences in dataset composition, preprocessing, classification targets, epoch averaging, validation design, and evaluation metrics. LR, Logistic Regression; LDA, Linear Discriminant Analysis; AUC, area under the receiver operating characteristic curve; ITR, information transfer rate; CRR, character recognition rate.
In this study, we analyze the large-scale BigP3BCI dataset [32,33] to characterize P300 responses across its heterogeneous collection of visual oddball paradigms. Specifically, we investigate the temporal and spatial properties of target-related ERPs, with particular attention to target–non-target differentiation and variability across experimental paradigms. In addition, we perform a preliminary machine learning analysis using two classical linear classifiers, logistic regression and linear discriminant analysis (LDA), to quantify the discriminative information contained in the extracted ERP features under different epoch-averaging conditions. Accordingly, the aims of this study are twofold: (i) to provide a neurophysiological characterization of P300 responses in a large-scale heterogeneous BCI dataset, including their temporal, spatial, and inter-paradigm variability; and (ii) to establish an interpretable baseline assessment of the dataset for machine learning-based target–non-target discrimination. The contribution of the present study is therefore not the development of a new machine learning algorithm. Rather, it lies in (i) the large-scale neurophysiological characterization of BigP3BCI, (ii) the systematic analysis of ERP variability across its heterogeneous study/paradigm groups, and (iii) the establishment of transparent preliminary linear-classifier baselines for assessing the effect of epoch averaging on target–non-target discrimination.
2. Materials and Methods
2.1. Dataset
This study was conducted using the BigP3BCI dataset, a large-scale, publicly available EEG database specifically designed for the development and evaluation of P300-based brain–computer interface (BCI) algorithms. The dataset is distributed through PhysioNet and integrates recordings acquired in multiple independent studies performed at different research laboratories under a common acquisition and annotation framework. The database contains EEG recordings collected during visual P300 speller experiments based on oddball paradigms. During each experiment, participants were instructed to focus their attention on a predefined target symbol while groups of visual stimuli were sequentially intensified. Each stimulus presentation was automatically annotated as either target or non-target, allowing supervised analyses of event-related potentials and machine learning classification. Unlike conventional single-study datasets, BigP3BCI combines several experimental paradigms, including row–column, checkerboard, pattern-based, adaptive, and tool-assisted spellers. Consequently, recordings exhibit substantial variability in stimulus presentation protocols, ERP morphology, and peak latency, making the database particularly suitable for evaluating the robustness and generalizability of signal processing and classification algorithms. The complete database includes recordings acquired from both healthy volunteers and individuals affected by amyotrophic lateral sclerosis (ALS). In the present work, all available recordings were included in order to characterize the global neurophysiological properties of the dataset without restricting the analysis to a specific clinical population. Clinical-group stratification was subsequently examined as a supplementary analysis to assess whether the effect of epoch averaging on classification performance was consistently observed in the ALS and NonALS groups; this analysis was not designed as a formal comparison of classification performance between clinical populations.
Throughout this study, a recording denotes an individual EEG recording file included in BigP3BCI, a participant denotes the individual from whom one or more recordings were acquired, a study denotes the original source study represented in the aggregated dataset, and a paradigm denotes the experimental paradigm or condition used to elicit the P300 response. An epoch denotes an EEG segment time-locked to a single stimulus onset and labelled as Target or Non-Target. The term trial is reserved for the experimental trial structure defined by the original paradigm and is not used interchangeably with epoch. For the machine learning analysis, a classification example denotes the input supplied to the classifier: either one individual epoch or an averaged epoch obtained by averaging multiple epochs of the same class.
A quantitative summary of the dataset included in the present analysis is provided in Table 2. A total of 6980 EDF+ recordings were examined, and all 6980 satisfied the recording-level validation criteria; therefore, no recording was excluded at this stage. The dataset contained 295 raw study–participant units, of which 293 had reliable participant identifiers and were retained for participant-level and clinical-group analyses. These comprised 245 NonALS and 48 ALS participant-level units. After event selection and boundary checking, 4,583,479 epochs were retained, including 452,707 target and 4,130,772 non-target epochs, while 37 otherwise eligible events were discarded because the corresponding epoch extended beyond the recording boundaries. Channel harmonization across the valid recordings resulted in 16 common EEG channels.
Table 2.
Quantitative summary of the BigP3BCI dataset included in the present analysis.
2.2. Data Extraction and Preprocessing
EEG data extraction and preprocessing were performed offline using custom Python 3.13.9 scripts developed with the MNE-Python 1.12.0, NumPy 2.3.4, and Pandas 2.3.3 libraries. All EDF+ recordings contained in the BigP3BCI dataset were recursively identified and inspected. Recordings were considered valid only if they contained EEG channels together with the event streams required for stimulus identification, namely StimulusBegin, StimulusType, and PhaseInSequence. EEG channels were automatically selected according to their channel labels, retaining only signals whose names started with the prefix EEG_. Because the BigP3BCI database integrates recordings acquired in multiple independent studies with partially different acquisition configurations, the available EEG channels varied across recordings. To ensure a consistent data representation across the entire dataset, only EEG channels present in every valid recording were retained. This intersection yielded 16 common EEG channels (C3, C4, CP3, CP4, Cz, F3, F4, Fz, Oz, P3, P4, PO7, PO8, Pz, T7, and T8), which constituted the channel dimension of the preprocessed EEG dataset. Stimulus onset events were detected by identifying the rising edges of the StimulusBegin signal. Only stimulus presentations occurring during the active spelling phase (PhaseInSequence = 2) were included in the analysis. Each event was labeled according to the associated value of StimulusType, with target stimuli assigned the label 1 and non-target stimuli assigned the label 0. For each valid stimulus presentation, EEG epochs were extracted using a nominal time window from −200 to +800 ms relative to stimulus onset. Given the nominal sampling frequency of 256 Hz, each extracted epoch comprised 256 time samples. Epochs extending beyond the recording boundaries were discarded. Baseline correction was applied independently to each EEG channel and each epoch by computing the mean signal amplitude over the pre-stimulus baseline interval (−200 to 0 ms) and subtracting this value from all time points of the corresponding epoch.
According to the BigP3BCI dataset documentation, the original EEG signals were band-pass filtered and, in some recordings, notch filtered at the biosignal-amplifier stage before data storage. No additional band-pass or notch filtering was applied in the present analysis pipeline. Likewise, no additional ICA- or EOG-based ocular-artifact correction, muscle-artifact rejection, amplitude-threshold epoch rejection, or bad-channel interpolation was performed. Channel harmonization was instead achieved by retaining the 16 EEG channels available across all valid recordings, as described above. This deliberately minimal additional preprocessing strategy was adopted to maintain a uniform and transparent analysis across the heterogeneous recordings included in BigP3BCI. Consequently, residual physiological and non-physiological artifacts may remain in the analyzed signals and should be considered when interpreting the ERP and classification results.
To efficiently manage the large size of the dataset, the extracted epochs were stored as single-precision floating-point arrays using a memory-mapped representation on disk. The resulting preprocessed dataset consisted of an EEG epoch matrix (X), the corresponding binary label vector (y), epoch-level metadata, and summary information describing the extracted epochs, selected common EEG channels, and acquisition parameters. No temporal downsampling was applied during epoch extraction; temporal subsampling was introduced only subsequently during machine learning feature extraction, as described in Section 2.4.
2.3. Event-Related Potential Analysis
Event-related potentials (ERPs) were computed using a participant-balanced averaging procedure. For each reliably identified participant-level unit, defined by the combination of study and subject identifiers, baseline-corrected epochs were first averaged separately for Target and non-target stimuli across all available recordings and sessions belonging to that participant. The resulting participant-level ERP waveforms were then averaged across the 293 reliably identified participant-level units, assigning equal weight to each participant irrespective of the number of available epochs, recordings, or sessions. These participant-balanced grand-average ERPs were used for the principal temporal and spatial ERP characterization. The difference wave was subsequently computed as the point-by-point subtraction of the non-target ERP from the target ERP (target–non-target), thereby emphasizing target-related activity relative to the response elicited by non-target stimuli.
ERP waveforms were initially inspected over the entire epoch interval (−200 to 800 ms), while quantitative analyses focused on the conventional P300 latency window between 250 and 500 ms after stimulus onset. Since the P300 response is known to exhibit a centro-parietal scalp distribution, ERP analyses were primarily performed on the Pz electrode. Additional comparisons were conducted across four representative midline electrodes (Fz, Cz, Pz, and Oz), selected from the 16 common EEG channels (C3, C4, CP3, CP4, Cz, F3, F4, Fz, Oz, P3, P4, PO7, PO8, Pz, T7, and T8), to evaluate the spatial distribution of the target and non-target responses and to identify the scalp location exhibiting the largest P300-related activity. This four-electrode subset was used exclusively for the spatial ERP comparison and did not define the channel set of the preprocessed EEG dataset. Because the BigP3BCI database integrates recordings acquired using multiple experimental paradigms, an additional exploratory analysis was performed by computing ERPs separately for individual study/paradigm groups. This analysis was intended to assess inter-paradigm variability in ERP morphology and peak latency, thereby evaluating whether differences observed in the global average could be attributed to the heterogeneous composition of the dataset rather than to atypical neurophysiological responses. For the study/paradigm-specific analysis, peak amplitude and latency were quantified at Pz separately for the target ERP and the target-minus-non-target difference wave. Within each predefined search interval, the time sample corresponding to the maximum positive amplitude was identified using a direct sample-wise maximum (argmax) criterion. Peak amplitude was defined as the amplitude at this sample, and peak latency as its corresponding post-stimulus time. Peak extraction was performed directly on the averaged ERP waveforms without additional temporal smoothing and without imposing a minimum amplitude, peak height, or prominence threshold. For descriptive characterization of the overall post-stimulus waveform, the maximum positive deflection was initially identified within the broader 0–500 ms interval. This broad-window measure was not interpreted as a P300-specific latency measure because it could capture earlier positive components. P300-specific peak latency was therefore quantified separately using a constrained peak measure, defined as the latency of the maximum positive amplitude within the predefined 250–500 ms P300 interval. For visualization of inter-group ERP variability, the 10 study/paradigm groups with the largest total numbers of available Target epochs were selected. Group ranking was based on the complete number of available Target epochs in each group and was therefore determined by an explicit quantitative criterion rather than by visual inspection of ERP morphology. For construction of the displayed ERP waveforms, up to 20,000 epochs per stimulus class were randomly sampled within each group. The total number of available Target epochs used for ranking, rather than the visualization subsample size, is reported for each group in the Results Section. To quantitatively assess the target–non-target amplitude difference within the conventional P300 interval, an additional participant-level analysis was performed at Pz. For each participant, mean amplitude over the 250–500 ms interval was calculated separately for Target and non-target epochs, and the paired target-minus-non-target difference was subsequently obtained. To avoid pseudoreplication arising from repeated epochs, inferential statistics were performed at the participant level rather than at the individual-epoch level. Participants were identified using the composite study and subject identifiers, and all available sessions and recordings associated with the same participant were aggregated before statistical testing. Recordings with missing or UNKNOWN subject identifiers were excluded from participant-level inference because they could not be reliably assigned to independent participants. Only participant-level units containing both Target and non-target epochs were retained. The paired difference was summarized using its mean, 95% confidence interval, and Cohen’s dz effect size and was evaluated using a paired-samples t-test. Given the non-normal distribution of participant-level differences, a Wilcoxon signed-rank test was additionally performed as a non-parametric sensitivity analysis.
2.4. Preliminary Machine Learning Analysis
To evaluate the discriminative information contained in the extracted EEG epochs, a preliminary supervised machine learning analysis was performed to classify Target and non-target stimuli. For the primary P300-oriented analysis, feature extraction was restricted a priori to the conventional 250–500 ms latency interval. This interval was selected on neurophysiological grounds to focus the baseline classification analysis on the expected P300 response rather than being optimized on the present dataset. The analysis used the 16 EEG channels common to all valid recordings, in the following order: C3, C4, CP3, CP4, Cz, F3, F4, Fz, Oz, P3, P4, PO7, PO8, Pz, T7, and T8. At the nominal sampling frequency of 256 Hz, the 250–500 ms interval contained 64 temporal samples per channel. Temporal subsampling by a factor of four retained every fourth sample, yielding 16 temporal samples per channel. Epoch averaging was performed before feature extraction: each classification example was represented either by one individual epoch or by the pointwise average of 5 or 10 same-class epochs, depending on the averaging condition. The selected temporal samples were then concatenated in channel-major order, following the channel sequence listed above and chronological temporal order within each channel. The resulting feature vector therefore contained 16 channels × 16 temporal samples = 256 features per classification example.
To assess whether this temporal reduction discarded discriminative information relevant to P300 classification, an additional sensitivity analysis was performed using the original temporal resolution (×1; 64 samples per channel, 1024 features) and an intermediate two-fold reduction (×2; 32 samples per channel, 512 features), in addition to the original four-fold reduction (×4; 16 samples per channel, 256 features). All other feature-extraction, epoch-averaging, classification and cross-validation settings were kept unchanged across the three configurations. The same sampled and averaged examples and the same cross-validation folds were used for each downsampling factor to isolate the effect of temporal resolution.
An additional sensitivity analysis was performed to evaluate the effect of the temporal feature window. The original 250–500 ms interval was compared with a wider 100–600 ms window, selected to include both the earlier positive activity observed in the ERP analysis and later P300-related activity. All other analysis settings were kept unchanged, including the four-fold temporal subsampling, the 16 common EEG channels, epoch-averaging levels, classifiers, feature standardization, class balancing, and cross-validation procedure. The same sampled epochs, averaged examples, and cross-validation folds were used for both temporal windows, so that the temporal feature window was the intended varying factor.
Two widely used linear classifiers were evaluated: Logistic Regression (LR) and shrinkage Linear Discriminant Analysis (LDA), implemented using scikit-learn 1.7.2. LR used the L-BFGS solver with L2 regularization, C = 1.0, a maximum of 2000 iterations, balanced class weights, and a random seed of 42. LDA used the least-squares (“lsqr”) solver with automatic shrinkage estimation (“auto”). For both classifiers, feature standardization was performed using StandardScaler within the classification pipeline. In each cross-validation fold, the scaler was fitted exclusively on the training-fold classification examples, and the resulting training-fold feature means and standard deviations were subsequently used to transform both the training and corresponding held-out examples.
Classification was evaluated at three averaging levels: 1, 5, and 10 epochs. At averaging level 1, each classification example corresponded to one individual epoch. At averaging levels 5 and 10, each classification example was an averaged epoch obtained by averaging 5 or 10 randomly grouped epochs of the same class, respectively. Thus, “epoch” and “classification example” are equivalent only at averaging level 1.
Epoch averaging was performed before cross-validation. Within each averaging condition, epochs were randomly partitioned into non-overlapping groups of the same class, such that each selected epoch contributed to only one classification example within that condition. For each class, a maximum of 60,000 epochs was randomly sampled without replacement before averaging. When the number of selected epochs was not exactly divisible by the averaging size, incomplete groups were discarded.
Five-fold stratified cross-validation was implemented using StratifiedKFold with shuffling enabled and a random seed of 42. Cross-validation was performed at the classification-example level; participants, recordings, studies, and paradigms were not explicitly separated between folds. Accordingly, this validation protocol evaluates within-dataset discrimination and should not be interpreted as participant-, recording-, study-, or paradigm-independent validation.
To complement the preliminary example-level cross-validation and directly assess generalization to unseen groups, three additional group-disjoint validation analyses were performed: leave-one-participant-out, leave-one-study-out, and leave-one-paradigm-out validation. Participant-disjoint validation included the 293 reliably identified participant-level units. Study-disjoint validation comprised 18 study groups represented among these reliably identified units, whereas paradigm-disjoint validation was restricted to the six explicitly identified paradigm labels (AD, ADdiff, CB, PB, RC, and RD). In each group-disjoint iteration, the train/test partition was defined before construction of the classification examples. Epoch averaging was subsequently performed independently within the training and held-out partitions and was restricted to epochs sharing the same participant, recording session, and stimulus class. Consequently, no averaged classification example contained epochs from different participants or sessions, and no averaged example crossed the train/test boundary. Feature extraction was then applied separately to the resulting training and test examples using the same predefined 250–500 ms window, four-fold temporal subsampling, 16 common EEG channels, and 256-feature representation used in the primary analysis. StandardScaler was fitted exclusively on the training partition and subsequently applied to the held-out partition. For computational tractability, training epochs were capped at 60,000 per class only after the group-disjoint split had been defined; the held-out test partition was not globally capped. Logistic Regression and shrinkage LDA were evaluated at averaging levels of 1, 5, and 10 epochs. Performance was summarized across the held-out groups using ROC-AUC and Balanced Accuracy.
Performance was primarily quantified using the Area Under the Receiver Operating Characteristic Curve (ROC-AUC) and Balanced Accuracy. These metrics were selected as the primary performance measures because the complete extracted dataset exhibited substantial class imbalance between Target and non-target epochs. ROC-AUC provides a threshold-independent measure of discrimination, whereas Balanced Accuracy gives equal weight to sensitivity and specificity. To provide a more complete characterization of classification performance, Precision–Recall AUC (PR-AUC; computed as Average Precision), sensitivity (Target-class recall), and specificity (non-target-class recall) were additionally calculated. Confusion matrices were obtained by pooling the predictions from the mutually exclusive test partitions across the five cross-validation folds. Mean values and standard deviations across the five folds were reported for the scalar performance metrics. Overall accuracy was not treated as a primary performance measure.
Target prevalence was calculated on the complete extracted epoch dataset before class-balanced sampling. The complete dataset contained 452,707 Target and 4,130,772 non-target epochs, corresponding to a Target prevalence of 9.88%. For the primary classification analysis, however, up to 60,000 epochs were randomly sampled without replacement from each class before epoch averaging, resulting in a class-balanced evaluation sample. Accordingly, PR-AUC, sensitivity, specificity, and confusion-matrix results characterize performance under this balanced evaluation setting and should not be interpreted as estimates obtained under the natural Target prevalence of the complete dataset. The classification analysis was intentionally restricted to two simple and interpretable linear models and was not intended to optimize classification performance or establish an algorithmic benchmark. LDA was selected because linear discriminant methods are well established in P300 decoding, whereas Logistic Regression provided a complementary regularized linear discriminative model. The use of simple linear classifiers was particularly appropriate to the dataset-characterization objective of the present study because it allowed the discriminative information contained in the predefined EEG representation, and its variation with epoch averaging and temporal feature selection, to be examined without introducing additional spatial-filtering stages or architecture-specific representation learning. The resulting performance therefore provides a transparent preliminary reference rather than a comparison with state-of-the-art P300 decoding pipelines. More elaborate approaches, including xDAWN-based pipelines, SWLDA, SVMs, and modern deep learning architectures, would require a controlled benchmarking framework and were outside the scope of the present analysis. Accordingly, the present results should not be interpreted as a direct performance comparison with state-of-the-art P300 decoding architectures.
The methodological settings of the preliminary classification analysis were selected according to a combination of neurophysiological motivation, standard modeling practice, and pragmatic computational considerations rather than through optimization on the present dataset. Specifically, the 250–500 ms feature window was defined a priori on the basis of the conventional P300 latency range and was therefore literature- and neurophysiology-motivated; the wider 100–600 ms interval was examined only subsequently as a sensitivity analysis and was not used to redefine the primary analysis. Four-fold temporal subsampling was initially adopted as a pragmatic dimensionality-reduction strategy to reduce computational burden while retaining the temporal structure of the P300 interval; its effect was subsequently evaluated empirically by comparison with ×1 and ×2 temporal resolutions. Averaging levels of 1, 5, and 10 epochs were selected a priori to provide three representative conditions spanning individual-epoch classification and progressively increased ERP averaging, rather than being selected through performance optimization. Logistic Regression was implemented using a conventional L2-regularized configuration (C = 1.0), with the L-BFGS solver, balanced class weights to address class imbalance, and a sufficiently high maximum iteration limit to permit convergence. For LDA, automatic covariance shrinkage was used to provide regularized covariance estimation in the high-dimensional feature space without manually tuning a shrinkage parameter on the analyzed data. Finally, five-fold stratified cross-validation was selected as a conventional compromise between the number of training observations per fold and repeated performance estimation while preserving class proportions. The number of folds was not optimized empirically. Thus, with the exception of the explicitly reported sensitivity analyses, methodological settings were not selected by searching for the configuration yielding the highest classification performance.
To assess whether the improvement associated with epoch averaging was consistent across the heterogeneous composition of the dataset, additional subgroup analyses were performed across participants, experimental paradigms, and clinical groups. Participant-specific analyses were conducted separately for each reliably identified participant-level unit, defined by the combination of study and subject identifiers. Paradigm-specific analyses were restricted to the six explicitly identified paradigm labels (AD, ADdiff, CB, PB, RC, and RD), with UNKNOWN paradigm labels excluded. Clinical status was obtained directly from the Patient field of the original EDF headers, which explicitly distinguished ALS and NonALS recordings; clinical status was not inferred from study names or participant identifiers. For the paradigm- and clinical-group analyses, epoch averaging was performed separately within each participant and stimulus class before classification examples were pooled within the corresponding subgroup, thereby preventing averaged examples from combining epochs from different participants. Logistic Regression and shrinkage LDA were evaluated at averaging levels of 1, 5, and 10 epochs using the same 250–500 ms feature window, four-fold temporal subsampling, and five-fold stratified cross-validation framework as in the primary analysis. These subgroup analyses were intended to assess the consistency of the association between epoch averaging and classification performance across the heterogeneous dataset and should not be interpreted as participant-disjoint validation or as formal statistical comparisons between subgroups.
To investigate the spatiotemporal structure underlying target/non-target discrimination, an additional model-interpretability analysis was performed using Haufe-style activation patterns. This analysis was restricted to the primary 250–500 ms feature window, four-fold temporal subsampling, and averaging level 1, for which each classification example corresponded to an individual epoch. For both Logistic Regression and shrinkage LDA, out-of-fold decision scores were obtained using the same five-fold stratified cross-validation procedure as in the primary analysis. Activation patterns were then computed from the covariance between the original, unstandardized EEG features and the out-of-fold decision scores, normalized by the variance of the decision scores. The resulting 256-element patterns were reshaped into 16-channel × 16-latency matrices and normalized by their maximum absolute value for visualization. These patterns were interpreted as descriptive representations of the spatiotemporal signal structure associated with the classifiers’ discriminant scores rather than as direct measures of feature importance or causal neural contributions.
An overview of the complete methodological workflow, from EDF+ recording validation to classification and performance evaluation, is provided in Figure 1. The workflow distinguishes the preliminary classification-example-level five-fold cross-validation from the additional group-disjoint analyses used to assess generalization to unseen participants, studies, and paradigms.
Figure 1.
End-to-end methodological workflow of the BigP3BCI analysis. The workflow summarizes the main processing steps from the original EDF+ recordings to classification and performance evaluation. The preliminary baseline analysis used five-fold stratified classification-example-level cross-validation. Additional group-disjoint analyses used leave-one-participant-out, leave-one-study-out, and leave-one-paradigm-out validation. For the group-disjoint analyses, the train/test partition was defined before epoch averaging; averaged examples were constructed separately within each partition and restricted to the same participant, session, and stimulus class. Feature standardization was fitted exclusively on the training partition before application to the corresponding held-out data. LR, Logistic Regression; LDA, Linear Discriminant Analysis; ROC-AUC, area under the receiver operating characteristic curve; PR-AUC, area under the precision–recall curve. The arrows indicate the sequence of processing steps and the branching into the two validation approaches (A,B).
2.5. Computational Environment
All analyses were performed on a Windows 11 workstation equipped with 128 GiB of system RAM and 32 logical CPU cores. An NVIDIA RTX A4000 GPU with approximately 16 GB of memory was available on the system; however, the scikit-learn Logistic Regression and shrinkage LDA implementations used in the present analysis were CPU-based and did not use GPU acceleration. The computational environment included Python 3.13.9 and scikit-learn 1.7.2.
The complete memory-mapped epoch representation comprised 4,583,479 epochs × 16 channels × 256 samples stored as 32-bit floating-point values, corresponding to 75.10 GB (69.94 GiB) on disk. Memory mapping was used to permit access to this representation without requiring the complete dataset to be loaded simultaneously into physical memory. For the primary machine learning configuration, feature extraction for 120,000 classification examples (256 features per example) required 1.66 s on the above system, and the resulting feature matrix occupied 122.88 MB.
Across the five cross-validation folds, mean training time was 3.254 ± 0.243 s per fold for Logistic Regression and 0.643 ± 0.013 s per fold for shrinkage LDA. Mean inference time was 0.0343 ± 0.0037 s per fold for Logistic Regression and 0.0228 ± 0.0008 s per fold for shrinkage LDA, corresponding to approximately 0.00143 and 0.00095 ms per classification example, respectively. The original EDF-to-epoch preprocessing pipeline was not prospectively timed during the initial dataset extraction; therefore, a retrospective preprocessing duration is not reported.
3. Results
The results are presented in four complementary sections. First, the grand-average ERP response of the entire BigP3BCI dataset is characterized by comparing target and non-target stimuli. Next, the spatial distribution of the P300 component is investigated across the main midline electrodes. Since the grand-average analysis revealed an earlier positive peak than expected, ERP responses are subsequently examined separately across selected study/paradigm groups to assess the influence of dataset heterogeneity on waveform morphology and peak latency. Finally, a preliminary machine learning analysis is presented to evaluate the discriminability of target and non-target responses using classical linear classifiers under different epoch-averaging conditions.
3.1. Grand-Average ERP Characterization
Participant-balanced grand-average event-related potentials (ERPs) were obtained by first averaging the baseline-corrected epochs separately for Target and non-target stimuli within each of the 293 reliably identified participant-level units and subsequently averaging the resulting participant-level waveforms with equal weight across participants. Figure 2 shows the resulting ERP waveforms at electrode Pz together with the corresponding difference wave (target–non-target). A clear positive response was observed following target stimulation, whereas the non-target waveform remained close to baseline throughout most of the post-stimulus interval. Consistent with the epoch-level baseline correction, the grand-average non-target ERP remained centered around the zero-amplitude reference during the pre-stimulus interval, as explicitly indicated by the horizontal zero line in the revised Figure 2.
Figure 2.
Participant-balanced ERP waveforms at Pz for Target and non-target stimuli and the corresponding target-minus-non-target difference wave. Grand-average waveforms were obtained by assigning equal weight to each reliably identified participant-level unit (n = 293), irrespective of the number of available epochs, recordings, or sessions. Shaded bands indicate pointwise 95% confidence intervals across participant-level ERP waveforms. The shaded vertical region indicates the predefined P300 window (250–500 ms), and the dashed vertical line indicates stimulus onset.
Consequently, the difference wave closely matched the morphology of the target ERP, indicating that the observed response was primarily driven by target-related activity. The participant-balanced grand-average waveform exhibited its largest positive deflection at approximately 200 ms after stimulus onset. Because this latency precedes the conventional P300 interval and may overlap with earlier visually evoked activity, including P2-related activity, this maximum was not interpreted as a P300 peak. The ERP nevertheless remained positive within the predefined 250–500 ms P300 interval, which was therefore analyzed separately for P300-specific latency characterization. These observations motivated a more detailed analysis across study/paradigm groups to characterize temporal variability in ERP morphology and P300-specific peak latency while avoiding attribution of the approximately 200-ms global maximum specifically to P300 activity. Participant-level inferential analysis was additionally performed to quantify the target–non-target amplitude difference at Pz within the predefined 250–500 ms P300 interval. Across the 293 reliably identified participant-level units, mean Pz amplitude was −0.053 ± 1.227 µV for Target epochs and 0.038 ± 0.133 µV for non-target epochs, yielding a mean paired target-minus-non-target difference of −0.091 ± 1.308 µV. The 95% confidence interval of the mean paired difference ranged from −0.241 to 0.060 µV. The paired-samples t-test did not indicate a significant mean difference, t (292) = −1.188, p = 0.236, with a very small standardized paired effect size (Cohen’s dz = −0.069). Because the participant-level paired differences were markedly non-normal, a Wilcoxon signed-rank test was additionally performed as a sensitivity analysis and yielded W = 17,310, p = 0.0036. The discrepancy between the parametric and non-parametric tests indicates that the participant-level distribution was asymmetric and that the fixed-window target–non-target effect should not be summarized solely by statistical significance.
3.2. Spatial Distribution of the P300 Response
To evaluate the spatial distribution of the target-related ERP response, grand-average waveforms were compared across the principal midline electrodes (Fz, Cz, Pz, and Oz). Figure 3 presents both the target ERP and the corresponding difference wave (target–non-target) for each channel. A clear target-related positive deflection was observed across all electrodes, although its amplitude varied according to scalp location. The largest responses were recorded over the centro-parietal electrodes (Cz and Pz), whereas frontal activity was slightly reduced and occipital responses exhibited substantially smaller amplitudes. This spatial distribution is consistent with the well-established centro-parietal topography of the P3b component. The overall waveform morphology was remarkably similar across channels, with the principal differences being related to response amplitude rather than temporal profile. Based on both its response amplitude and its established relevance in the P300 literature, electrode Pz was selected as the representative channel for the subsequent analyses of ERP variability across experimental paradigms.
Figure 3.
Participant-balanced Target ERP and target-minus-non-target difference waveforms across the Fz, Cz, Pz, and Oz electrodes. Grand-average waveforms were obtained by assigning equal weight to each reliably identified participant-level unit (n = 293), irrespective of the number of available epochs, recordings, or sessions. Shaded bands indicate pointwise 95% confidence intervals across participant-level ERP waveforms. The shaded vertical region indicates the predefined P300 window (250–500 ms), and the vertical dashed line indicates stimulus onset.
3.3. ERP Variability Across Experimental Paradigms
Although the grand-average ERP exhibited an apparent positive peak around 200 ms after stimulus onset, this observation is influenced by the heterogeneous composition of the BigP3BCI dataset. Since the database combines multiple studies employing different experimental paradigms, participant populations, and stimulation protocols, ERP responses were therefore examined separately across the study/paradigm groups selected according to the quantitative Target-epoch-count criterion described in Section 2.3. Figure 4a compares the target-minus-non-target difference waves recorded at electrode Pz for the ten analyzed study/paradigm groups with the largest number of available target epochs. Marked variability was observed in both waveform morphology and peak latency across paradigms. While some paradigms exhibited an early positive maximum close to 200 ms, others showed broader positive responses extending well into the conventional P300 latency interval (250–500 ms). Differences were also evident in the amplitude and duration of the positive deflection, as well as in the subsequent negative component. These findings indicate that the earlier positive maximum observed in the participant-balanced grand-average ERP should not be interpreted as a systematic shift in P300 latency. The substantial variability in ERP morphology observed across the selected study/paradigm groups demonstrates that the pooled waveform combines temporally heterogeneous responses acquired under different experimental conditions.
Figure 4.
(a) Target-minus-non-target difference waves at electrode Pz for the 10 study/paradigm groups with the largest total numbers of available Target epochs. Groups were ranked according to the complete number of available Target epochs, reported as n in the panel labels. For visualization, ERP waveforms were computed using up to 20,000 randomly sampled epochs per stimulus class within each group. The shaded area indicates the predefined P300 latency window (250–500 ms), and the vertical dashed line indicates stimulus onset. For groups lacking a specific paradigm identifier in the corresponding metadata field, the label UNKNOWN is used and the available experimental-condition labels are reported instead. Thus, UNKNOWN denotes an unavailable or non-reliably assignable paradigm identifier and does not indicate missing EEG data. (b) Distribution of Target P300 peak latencies across the 10 study/paradigm groups with the largest number of Target epochs. Peak latency was defined as the latency of the maximum positive Target ERP deflection within the predefined 250–500 ms P300 window. Detailed labels indicate the paradigm or experimental conditions represented within each study-level group.
Despite this variability, all representative paradigms exhibited a clear target-related positive response, showing that target-related positive activity within or extending into the conventional P300 interval was observable across the selected groups.
To quantify P300-specific latency variability, the latency of the maximum positive Target ERP deflection was determined within the predefined 250–500 ms P300 interval using the sample-wise maximum criterion described in Section 2.3.
As summarized in Figure 4b, peak latencies varied substantially across the selected study/paradigm groups, ranging approximately from 253 to 429 ms. Some groups exhibited maxima near the beginning of the conventional P300 interval, whereas others showed markedly later positive maxima. These findings further demonstrate the temporal heterogeneity of target-related responses across the BigP3BCI dataset and indicate that the earlier positive maximum observed in the global ERP should not be interpreted as a uniform shift in P300 latency across experimental conditions.
3.4. Preliminary Machine Learning Analysis Results
To assess whether the extracted ERP features contained sufficient information for automatic target detection, target and non-target responses were classified using Logistic Regression and shrinkage Linear Discriminant Analysis (LDA). Performance was evaluated under three epoch-averaging conditions (1, 5, and 10 epochs) using five-fold stratified cross-validation. Both classifiers exhibited very similar performance and a consistent improvement as the number of averaged epochs increased. In the single-epoch condition, classification performance was relatively limited, with AUC values of 0.622 ± 0.003 for Logistic Regression and 0.621 ± 0.003 for LDA, corresponding to balanced accuracies of 0.590 ± 0.002 and 0.589 ± 0.003, respectively.
Averaging five epochs substantially improved performance, increasing the AUC to approximately 0.74 and the balanced accuracy to approximately 0.68 for both classifiers. The best results were obtained after averaging ten epochs, where LDA achieved an AUC of 0.817 ± 0.008 and a balanced accuracy of 0.740 ± 0.012, while Logistic Regression reached an AUC of 0.814 ± 0.009 and a balanced accuracy of 0.739 ± 0.011. Overall, these findings show that epoch averaging was associated with higher target–non-target discrimination under the present example-level cross-validation protocol. Because participants, recordings, sessions, and paradigms were not explicitly separated between folds, the between-fold variability should not be interpreted as evidence of reproducibility or generalization to independent participants or recording sessions.
To assess the effect of temporal subsampling on classification performance, the analysis was repeated using the original temporal resolution (×1) and an intermediate two-fold reduction (×2), while keeping the ×4 configuration used in the primary analysis as reference. Performance remained closely similar across temporal resolutions. Compared with ×4, using the original temporal resolution increased mean AUC for shrinkage LDA by 0.0020, 0.0021, and 0.0030 for averaging sizes of 1, 5, and 10 epochs, respectively. For Logistic Regression, the corresponding differences were 0.0035, 0.0024, and 0.0006. Changes in balanced accuracy were likewise small, with mean differences between ×1 and ×4 ranging from 0.0007 to 0.0051 across classifiers and averaging conditions. The intermediate ×2 configuration did not show a consistent advantage over ×1. Overall, increasing the temporal resolution from 16 to 64 samples per channel produced only modest numerical changes in classification performance while increasing feature dimensionality from 256 to 1024 features.
The sensitivity analysis of the temporal feature window showed a consistent improvement in classification performance when the interval was extended from 250–500 ms to 100–600 ms. For shrinkage LDA, mean AUC increased from 0.621 to 0.680 for single-trial classification, from 0.745 to 0.838 with five-epoch averaging, and from 0.817 to 0.912 with ten-epoch-averaging. Logistic Regression showed a similar pattern, with mean AUC increasing from 0.622 to 0.681, from 0.744 to 0.837, and from 0.814 to 0.907, respectively. Balanced accuracy likewise increased from 0.589 to 0.633, 0.684 to 0.762, and 0.740 to 0.833 for shrinkage LDA and from 0.590 to 0.634, 0.685 to 0.762, and 0.739 to 0.829 for Logistic Regression. The higher performance of the 100–600 ms window was observed across all five cross-validation folds for both classifiers and all averaging conditions. These results indicate that temporal information outside the predefined 250–500 ms P300 interval contributed additional discriminative information in the present analysis. To determine whether the improvement associated with epoch averaging was consistent across the heterogeneous composition of the dataset, classification performance was additionally examined across participants, experimental paradigms, and clinical groups (Figure 5). Across the 293 reliably identified participant-level units, mean participant-specific AUC increased from 0.765 to 0.900 and 0.934 for Logistic Regression and from 0.767 to 0.905 and 0.940 for shrinkage LDA at averaging levels of 1, 5, and 10 epochs, respectively. AUC increased from 1 to 5 averaged epochs in all 293 participants for both classifiers and from 5 to 10 epochs in 275/293 (93.9%) participants for Logistic Regression and 279/293 (95.2%) for shrinkage LDA. The same monotonic increase in AUC and balanced accuracy was observed across all six explicitly identified paradigms included in the subgroup analysis (AD, ADdiff, CB, PB, RC, and RD). Clinical-group analyses similarly showed increasing performance with epoch averaging in both groups. For ALS participants (n = 48), AUC increased from 0.621 to 0.723 and 0.786 for Logistic Regression and from 0.619 to 0.722 and 0.785 for shrinkage LDA. For NonALS participants (n = 245), the corresponding AUC values were 0.640, 0.767, and 0.832 for Logistic Regression and 0.640, 0.767, and 0.832 for shrinkage LDA. These subgroup analyses indicate that the association between epoch averaging and increased discrimination was observed across participants, paradigms, and both clinical groups, although they were not designed to test statistical differences between subgroups or to assess generalization to unseen participants.
Figure 5.
Stratified classification performance across participants, experimental paradigms, and clinical groups. (A) Distribution of participant-specific ROC-AUC values across the 293 reliably identified participant-level units for Logistic Regression and shrinkage LDA at averaging levels of 1, 5, and 10 epochs. Boxplots summarize the participant-level distributions, with individual participant-level values superimposed. The horizontal line within each box indicates the median ROC-AUC. (B) Paradigm-stratified ROC-AUC for the six explicitly identified paradigms (AD, ADdiff, CB, PB, RC, and RD) at the three epoch-averaging levels. (C) Clinical-group-stratified ROC-AUC for ALS (n = 48) and NonALS (n = 245) participant-level units. In panels (B,C), points indicate mean ROC-AUC and error bars indicate ±1 standard deviation across the five stratified cross-validation folds. Colors and marker shapes identify the epoch-averaging level, while solid and dashed lines identify Logistic Regression and shrinkage LDA, respectively. Subgroup analyses were performed using classification-example-level cross-validation and should not be interpreted as participant-disjoint estimates of generalization.
To facilitate quantitative comparison, the cross-validated classification results are summarized in Table 3.
Table 3.
Cross-validated target–non-target classification performance under the three epoch-averaging conditions. ROC-AUC, PR-AUC (Average Precision), Balanced Accuracy, sensitivity, and specificity are reported as mean ± standard deviation across the five stratified cross-validation folds. Sensitivity refers to the Target class and specificity to the non-target class. The classification evaluation sample was class-balanced by construction; therefore, PR-AUC and threshold-dependent metrics refer to this balanced evaluation setting rather than to the natural Target prevalence of the complete dataset.
The numerical results confirm the trends observed in Figure 6, highlighting the progressive improvement in both AUC and balanced accuracy with increasing epoch averaging and the comparable performance of the two linear classifiers.
Figure 6.
Classification performance as a function of epoch-averaging. (a) Area under the ROC curve (AUC) obtained using Logistic Regression and shrinkage Linear Discriminant Analysis (LDA) under 1-, 5-, and 10-epoch averaging conditions. Values are reported as mean ± standard deviation across the five folds of stratified cross-validation. (b) Balanced accuracy obtained under the same experimental conditions. Classification performance progressively improves with increasing epoch-averaging, while both classifiers exhibit very similar performance across all averaging levels.
The complete extracted dataset contained 452,707 Target and 4,130,772 non-target epochs, corresponding to a natural Target prevalence of 9.88%. Because the primary classification analysis used equal class sampling before epoch averaging, the classification examples evaluated by cross-validation were balanced between Target and non-target classes. Under this balanced evaluation setting, PR-AUC increased progressively with epoch averaging. For Logistic Regression, mean PR-AUC increased from 0.613 ± 0.004 at averaging level 1 to 0.734 ± 0.010 at level 5 and 0.807 ± 0.014 at level 10. For shrinkage LDA, the corresponding values were 0.613 ± 0.004, 0.735 ± 0.011, and 0.811 ± 0.013. Sensitivity and specificity showed the same progressive pattern: for Logistic Regression, sensitivity/specificity increased from 0.582/0.598 to 0.681/0.689 and 0.734/0.745, whereas for shrinkage LDA they increased from 0.581/0.597 to 0.680/0.688 and 0.734/0.747. These PR-AUC and threshold-dependent metrics refer to the class-balanced evaluation sample and not to the natural Target prevalence of the complete dataset. The corresponding pooled out-of-fold confusion matrices are reported in Table 4, providing the absolute numbers of correctly and incorrectly classified Target and non-target examples for each classifier and epoch-averaging condition.
Table 4.
Pooled out-of-fold confusion matrices for the primary classification analysis. Counts were obtained by summing predictions from the mutually exclusive test partitions of the five stratified cross-validation folds. TNs, true negatives; FPs, false positives; FNs, false negatives; TPs, true positives. The evaluation samples were class-balanced by construction.
Generalization was subsequently evaluated using the additional group-disjoint validation protocols. Under leave-one-participant-out validation across the 293 reliably identified participant-level units, mean ROC-AUC for Logistic Regression increased from 0.640 ± 0.088 with individual epochs to 0.760 ± 0.140 with five-epoch averaging and 0.814 ± 0.151 with ten-epoch averaging. Shrinkage LDA yielded corresponding values of 0.639 ± 0.088, 0.759 ± 0.142, and 0.814 ± 0.156. Mean Balanced Accuracy increased from 0.602 to 0.741 for Logistic Regression and from 0.601 to 0.743 for shrinkage LDA between the one- and ten-epoch conditions.
A similar pattern was observed under leave-one-study-out validation across 18 held-out study groups. Logistic Regression ROC-AUC increased from 0.624 ± 0.056 to 0.729 ± 0.097 and 0.779 ± 0.110 at averaging levels of 1, 5, and 10 epochs, respectively, whereas shrinkage LDA yielded 0.624 ± 0.057, 0.731 ± 0.099, and 0.782 ± 0.114. Mean Balanced Accuracy at ten-epoch averaging was 0.716 for Logistic Regression and 0.720 for shrinkage LDA.
Finally, leave-one-paradigm-out validation across the six explicitly identified paradigms yielded Logistic Regression ROC-AUC values of 0.612 ± 0.016, 0.716 ± 0.026, and 0.772 ± 0.032 and shrinkage-LDA values of 0.612 ± 0.016, 0.717 ± 0.025, and 0.773 ± 0.031 for 1-, 5-, and 10-epoch averaging, respectively. Corresponding ten-epoch Balanced Accuracy was approximately 0.701 for both classifiers. Thus, the association between epoch averaging and increased discrimination was preserved when entire participants, studies, or paradigms were held out. At the same time, the substantial between-participant and between-study variability indicates heterogeneous generalization performance across held-out groups. The complete results of the three group-disjoint validation analyses are summarized in Table 5.
Table 5.
Group-disjoint target–non-target classification performance under the three epoch-averaging conditions. Results are reported for leave-one-participant-out (Participant LOSO; 293 participant-level units), leave-one-study-out (18 study groups), and leave-one-paradigm-out (6 explicitly identified paradigms) validation. ROC-AUC and Balanced Accuracy are reported as mean ± standard deviation across the corresponding held-out groups. For each group-disjoint iteration, the train/test partition was defined before epoch averaging; averaged classification examples were constructed separately within the training and held-out partitions using only epochs from the same participant, session, and stimulus class. Feature standardization was fitted exclusively on the training partition. LR, Logistic Regression; LDA, Linear Discriminant Analysis; ROC-AUC, area under the receiver operating characteristic curve.
To further characterize the spatiotemporal signal structure underlying target/non-target discrimination, Haufe-style activation patterns were examined for Logistic Regression and shrinkage LDA (Figure 7). The two classifiers exhibited highly similar spatiotemporal patterns. In both cases, the strongest positive activation pattern was observed at Cz at approximately 253 ms, with prominent positive contributions also evident at Pz and Fz during the early portion of the predefined P300 window. These positive patterns progressively decreased across subsequent latencies and transitioned toward negative values at several central and centro-parietal channels in the later portion of the window. Overall, the similarity between the two classifiers indicates that the discriminative information captured by the linear models was associated with a consistent, distributed, and temporally evolving EEG pattern rather than with a single channel or latency. The prominent midline and centro-parietal contributions were broadly consistent with the spatial organization observed in the ERP analysis.
Figure 7.
Haufe-style activation patterns for Logistic Regression and shrinkage Linear Discriminant Analysis (LDA). Activation patterns were computed for the primary 250–500 ms feature window using four-fold temporal subsampling and the single-epoch classification condition. Out-of-fold discriminant scores were obtained using the same five-fold stratified cross-validation procedure as in the primary analysis. Patterns were computed from the covariance between the original unstandardized EEG features and the out-of-fold decision scores, normalized by the variance of the decision scores, and subsequently normalized by their maximum absolute value for visualization. Positive and negative values indicate the direction of the association between the EEG signal structure and the classifier discriminant scores and should not be interpreted as causal neural contributions or direct feature-importance measures.
4. Discussion
The present study investigated the neurophysiological characteristics of P300 responses in the BigP3BCI database, one of the largest publicly available collections of EEG recordings acquired using P300-based paradigms. Rather than focusing on maximizing classification performance, the primary objective was to characterize the electrophysiological properties of the dataset and to assess its suitability for future brain–computer interface research. The grand-average ERP analysis revealed a visible differentiation between Target and non-target waveforms. However, the additional participant-level analysis showed that this waveform-level separation did not translate into a consistent positive target-minus-non-target mean-amplitude difference when activity was averaged over the entire fixed 250–500 ms interval at Pz.
The participant-balanced grand-average waveform exhibited its largest positive deflection at approximately 200 ms. Because activity at this latency may overlap with earlier visually evoked components such as P2, the present analysis does not identify this early maximum as a P300 peak. Instead, P300-specific latency characterization was restricted to the predefined 250–500 ms interval. The marked variability in ERP morphology observed across study/paradigm groups further indicates that the global waveform reflects the superposition of temporally heterogeneous responses; however, the selected representative groups alone are not sufficient to attribute the approximately 200-ms maximum specifically to heterogeneous P300 latency. At first glance, this observation could suggest an unusually early P300 response. Nevertheless, the subsequent analyses demonstrated that this apparent temporal shift is mainly a consequence of the heterogeneous composition of the BigP3BCI dataset. Indeed, the database aggregates recordings originating from multiple independent studies, encompassing different visual paradigms, stimulation protocols, acquisition systems, participant populations, and experimental objectives. When study/paradigm groups were analyzed separately, substantial variability emerged in both waveform morphology and peak latency. Several paradigms exhibited positive peaks within the conventional P300 latency window (250–500 ms), whereas others showed earlier or broader responses. Consequently, the early peak observed in the grand-average waveform should not be interpreted as evidence of a systematic latency reduction in the P300 component but rather as an averaging artifact resulting from the superposition of heterogeneous ERP responses.
This interpretation is further supported by the participant-level amplitude analysis. When Pz activity was averaged across the entire 250–500 ms interval, the mean target-minus-non-target difference was small (−0.091 µV), its 95% confidence interval included zero, and the standardized paired effect size was very small. Thus, the conventional fixed P300 interval did not capture a uniform positive target-related mean-amplitude enhancement across participant-level units. This finding is compatible with the substantial temporal and morphological heterogeneity observed across study/paradigm groups, as positive responses occurring at different latencies may be attenuated when summarized using a single broad fixed-window mean. The discrepancy between the paired t-test and the supplementary Wilcoxon signed-rank analysis further indicates that the participant-level differences were strongly asymmetric and should not be reduced to the outcome of a single significance test. Taken together, these results emphasize the distinction between grand-average waveform morphology, peak-based characterization, and participant-level fixed-window mean amplitude.
The spatial analysis provided complementary information on the scalp distribution of the target-related response. Target-related responses showed maximal amplitudes over centro-parietal electrodes, particularly at Pz, with progressively smaller responses over frontal and occipital regions. This distribution is broadly consistent with the centro-parietal topography typically associated with the P3b component reported in the ERP literature, supporting the reliability of the database despite its heterogeneous composition. The preliminary machine learning analysis demonstrated that the extracted ERP features contain discriminative information sufficient for target-versus-non-target classification. Both Logistic Regression and shrinkage Linear Discriminant Analysis produced comparable results, suggesting that the discriminative information captured by the selected ERP features could be exploited consistently by both linear classification approaches. As expected, performance improved steadily as multiple trials were averaged before classification. The AUC increased from approximately 0.62 for single-trial classification to more than 0.81 after averaging ten epochs, while balanced accuracy increased from approximately 0.59 to 0.74. These findings are consistent with the well-established effect of epoch-averaging in enhancing the signal-to-noise ratio of ERP components.
The additional temporal-resolution sensitivity analysis showed that retaining the original temporal resolution within the P300 window resulted in only modest numerical improvements compared with the four-fold temporally subsampled representation used in the primary analysis. Across classifiers and epochs-averaging conditions, the increase in mean AUC obtained at the original temporal resolution ranged from approximately 0.0006 to 0.0035, while changes in balanced accuracy ranged from approximately 0.0007 to 0.0051. At the same time, four-fold temporal subsampling reduced feature dimensionality by 75%, from 1024 to 256 features. These findings support the use of the four-fold subsampling setting as a pragmatic trade-off between temporal resolution and feature dimensionality for the preliminary linear-classification analysis performed here. Nevertheless, temporal subsampling removes fine-grained waveform information that could potentially be relevant to models specifically designed to exploit ERP morphology or temporal dynamics. Therefore, these results should not be interpreted as evidence that temporal resolution is generally irrelevant for P300 decoding, but rather as indicating that the additional temporal samples provided only limited performance gains under the feature representation and linear classifiers evaluated in the present study.
The additional feature-window sensitivity analysis showed that temporal-window selection had a substantially larger effect on classification performance than the temporal subsampling factor examined in the present study. Extending the feature interval from the predefined 250–500 ms P300 window to 100–600 ms consistently increased both AUC and balanced accuracy across classifiers and epochs-averaging conditions. This finding indicates that restricting the feature representation to the conventional P300 interval excluded discriminative temporal information that was captured when a broader portion of the post-stimulus response was considered. This result is also compatible with the temporal heterogeneity observed in the ERP analysis, where the latency and morphology of positive deflections varied across study/paradigm groups. Importantly, however, the wider 100–600 ms interval contains more temporal samples and encompasses both earlier and later post-stimulus activity. Therefore, the present comparison does not identify which specific temporal sub-interval or ERP component accounts for the observed improvement, nor does it establish the 100–600 ms interval as an optimal feature window. Rather, these findings highlight temporal-window selection as an important methodological factor when developing classifiers for heterogeneous multi-study P300 datasets.
Although the classification results are encouraging, they should be regarded as a proof of concept rather than a benchmark of the BigP3BCI dataset.
The present work intentionally employed simple linear classifiers and a limited feature representation to demonstrate the feasibility of decoding target-related activity rather than to establish state-of-the-art classification performance. Recent P300-decoding studies have explored substantially more complex data-driven approaches. For example, Hu et al. proposed the inception-based two-stage ensemble framework (ITSEF) for P300 detection [24], Wang et al. developed a multi-scale convolutional neural network [27], and Pan et al. subsequently introduced a multiple-scale convolutional few-shot learning framework for online P300-based BCI, specifically addressing P300 recognition under limited-data conditions [28]. These approaches can learn temporal and spatial representations directly from EEG data and therefore differ substantially from the fixed-window feature representation and linear classifiers evaluated here. Direct numerical comparison with the present results would not be appropriate because of differences in datasets, participant populations, experimental paradigms, and validation procedures.
A controlled algorithmic comparison would instead require conventional P300-specific approaches and modern learned architectures to be evaluated using the same preprocessing, feature construction, epoch-averaging procedure, and, importantly, participant- or study-disjoint validation protocol.
Nevertheless, these recent developments indicate that multi-scale representation learning, deep neural architectures, and few-shot strategies constitute relevant directions for future investigation on BigP3BCI, particularly for assessing whether more flexible models can exploit the temporal and inter-study heterogeneity identified in the present analysis. More sophisticated machine learning and deep learning approaches could be investigated in future work to determine whether alternative feature representations and nonlinear models can better exploit the temporal and inter-subject variability present in the dataset. Overall, the analyses presented here highlight both the strengths and the challenges associated with large aggregated EEG databases.
An important methodological distinction concerns the validation design used for the different classification analyses. The preliminary five-fold stratified analysis was performed at the classification-example level and therefore allowed examples originating from the same participant, session, study, or paradigm to occur in different folds. Its performance estimates should consequently be interpreted as within-dataset discrimination rather than as estimates of generalization to unseen groups. To address this limitation directly, additional leave-one-participant-out, leave-one-study-out, and leave-one-paradigm-out analyses were performed using a stricter leakage-controlled procedure in which train/test groups were defined before epoch averaging. Averaged examples were then constructed independently within the training and held-out partitions and restricted to the same participant, session, and stimulus class, while feature standardization was estimated exclusively from the training data. The persistence of increased classification performance with epoch averaging under all three group-disjoint protocols indicates that this association was not limited to the original example-level partitioning scheme. Nevertheless, the relatively broad distributions across held-out participants and studies demonstrate substantial heterogeneity in generalization performance. Accordingly, these results provide an initial group-disjoint assessment of the linear baseline rather than establishing a definitive benchmark for generalization across all possible participants, studies, acquisition systems, or experimental conditions. On one hand, the large sample size enables robust characterization of P300 activity across diverse experimental conditions. On the other hand, the considerable heterogeneity between paradigms emphasizes the importance of accounting for study-specific characteristics when interpreting grand-average ERPs or developing generalized decoding algorithms. These observations suggest that BigP3BCI represents a valuable resource for future investigations aimed at developing robust, cross-paradigm BCI methods capable of generalizing across heterogeneous experimental settings. Several additional limitations should be acknowledged. First, the analyses were restricted to the 16 EEG channels common to all valid recordings, ensuring a consistent feature space across studies but reducing the spatial information available from recordings with denser electrode montages. Second, healthy participants and participants with amyotrophic lateral sclerosis (ALS) were pooled in the present dataset-level characterization, because the objective was to characterize the aggregated BigP3BCI resource rather than to perform a clinical group comparison. Consequently, the present results should not be interpreted as demonstrating equivalent neurophysiological or classification characteristics across these populations Third, although the BigP3BCI documentation reports acquisition-stage band-pass filtering and, for some recordings, notch filtering, no additional filtering or dedicated artifact-rejection/correction procedure was applied in the present analysis pipeline beyond the baseline correction and epoch-selection steps described in the Methods. Therefore, residual ocular, muscular, or other non-neural artifacts may contribute to the observed neurophysiological and classification variability. Fourth, differences in acquisition systems, recording configurations, stimulus paradigms, and experimental protocols across the constituent studies represent potential sources of confounding that cannot be fully disentangled in the present pooled analysis. Fifth, although participant-, study-, and paradigm-disjoint validation was added, no independent external dataset was used for validation, and session-disjoint generalization was not evaluated as a separate validation target. The group-disjoint results therefore remain internal evaluations within the heterogeneous BigP3BCI resource. Finally, although the initial pooled ERP characterization can be influenced by unequal numbers of epochs across participants, the revised principal ERP analyses address this issue by first averaging epochs within each reliably identified participant-level unit and then assigning equal weight to each participant (n = 293). These participant-balanced analyses additionally provide pointwise 95% confidence intervals across participant-level ERP waveforms, thereby quantifying subject-level uncertainty. Nevertheless, participant identifiers could not be reliably established for all recordings, and the corresponding data were excluded from these participant-level analyses.
Comparison with existing P300 datasets and baselines. The present classification results should be interpreted in the context of the substantial differences between BigP3BCI and commonly used P300 benchmark datasets. For example, the ERP component of the OpenBMI dataset comprises 54 healthy participants recorded over two sessions using a relatively standardized row–column P300 speller paradigm, with 62 EEG channels sampled at 1000 Hz [34]. In the original OpenBMI study, subject-dependent spatiotemporal features and an LDA classifier were used for P300 decoding [34]. In contrast, BigP3BCI combines recordings originating from multiple P300 studies, participants, sessions, stimulus configurations, and experimental conditions. The present Logistic Regression and shrinkage-LDA analyses were deliberately restricted to simple, common-channel features and were evaluated on the pooled heterogeneous dataset. Consequently, numerical performance should not be directly compared with results obtained on individual homogeneous P300 datasets because differences in validation protocols, preprocessing, feature extraction, epoch averaging, class balance, and evaluation metrics can substantially affect reported performance. Rather than providing a state-of-the-art performance benchmark, the present results establish an interpretable baseline for a substantially larger and more heterogeneous P300 resource. This heterogeneity represents an important distinguishing value of BigP3BCI for future investigations of cross-subject, cross-session, and cross-paradigm generalization under explicitly group-aware validation protocols.
5. Conclusions
This study provides a large-scale neurophysiological characterization of the BigP3BCI dataset, with particular emphasis on the temporal, spatial, and cross-paradigm variability of P300-related responses. Unlike studies primarily aimed at developing or optimizing a specific P300 decoding algorithm, the present work focuses on characterizing the heterogeneous structure of this recently released multi-study resource and on establishing a transparent and interpretable preliminary machine learning baseline. The contribution of the study therefore lies primarily at the dataset-characterization and methodological levels rather than in the development of a novel classification architecture.
The ERP analyses identified target-related responses with a predominantly centro-parietal distribution broadly consistent with the classical P3b topography, while also revealing substantial variability in waveform morphology and peak latency across study/paradigm groups. In particular, the apparent early positive maximum observed in the global average should not be interpreted as a systematic shift in the P300 response, as the study/paradigm-specific analyses demonstrated that the aggregated waveform reflects responses with heterogeneous temporal characteristics. These findings illustrate the importance of considering the multi-study composition of BigP3BCI when interpreting dataset-level ERP measures.
The preliminary machine learning analyses further showed that the extracted EEG features contain information useful for target-versus-non-target discrimination and that classification performance increased with epoch averaging. Additional analyses indicated that this association was observed across individual participants, across the explicitly identified experimental paradigms, and separately within the ALS and NonALS groups. Sensitivity analyses further showed that temporal-window selection had a greater influence on classification performance than the degree of temporal subsampling examined here. Together, these results provide an initial characterization of how selected methodological choices and dataset heterogeneity influence a simple linear decoding baseline.
Importantly, the preliminary example-level classification results should be distinguished from the additional group-disjoint evaluations. Leave-one-participant-out, leave-one-study-out, and leave-one-paradigm-out analyses provided an initial assessment of generalization to unseen groups while preventing averaged examples from crossing training and test partitions. The improvement associated with epoch averaging was preserved under all three validation schemes, with ten-epoch ROC-AUC values of approximately 0.81 for unseen participants, 0.78 for unseen studies, and 0.77 for unseen paradigms. Nevertheless, the substantial variability observed across held-out participants and studies, together with the absence of independent external-dataset validation and dedicated session-disjoint evaluation, indicates that these results should not be interpreted as establishing a definitive performance benchmark. Rather, they provide a transparent group-aware baseline for future controlled comparisons of conventional and more advanced P300 decoding approaches.
Overall, the present study establishes a neurophysiological and methodological reference characterization of BigP3BCI and identifies several sources of variability that should be considered in subsequent analyses of this resource. Its large scale and heterogeneous composition make BigP3BCI particularly relevant for future investigations of cross-participant, cross-study, and cross-paradigm P300 decoding, while the results reported here provide both a transparent within-dataset baseline and an initial group-disjoint reference for subsequent cross-participant, cross-study, and cross-paradigm decoding studies.
Author Contributions
Conceptualization, A.P. and V.G.; methodology, A.P. and V.G.; software, V.G.; validation, A.P. and V.G.; formal analysis, V.G.; investigation, A.P. and V.G.; resources, V.G. and A.P.; data curation, V.G.; writing—original draft preparation, V.G.; writing—review and editing, A.P. and V.G.; visualization, V.G.; supervision, A.P.; project administration, A.P. All authors have read and agreed to the published version of the manuscript.
Funding
This research received no external funding.
Data Availability Statement
The data analyzed in this study are publicly available through PhysioNet in the BigP3BCI dataset (version 1.0.0) at https://doi.org/10.13026/0byy-ry86. No new experimental data were collected as part of the present study. The results reported in this article were obtained by processing and analyzing the publicly available BigP3BCI dataset.
Conflicts of Interest
The authors declare no conflicts of interest.
References
- Palumbo, A.; Ielpo, N.; Calabrese, B. An FPGA-embedded brain-computer interface system to support individual autonomy in locked-in individuals. Sensors 2022, 22, 318. [Google Scholar] [CrossRef] [Scilit] [PubMed]
- Vidal, J.J. Towards direct brain-computer communication. Annu. Rev. Biophys. Bioeng. 1973, 2, 157–180. [Google Scholar] [CrossRef] [Scilit] [PubMed]
- Wolpaw, J.R.; Birbaumer, N.; McFarland, D.J.; Pfurtscheller, G.; Vaughan, T.M. Brain–computer interfaces for communication and control. Clin. Neurophysiol. 2002, 113, 767–791. [Google Scholar] [CrossRef] [Scilit] [PubMed]
- Donoghue, J.P. Connecting cortex to machines: Recent advances in brain interfaces. Nat. Neurosci. 2002, 5, 1085–1088. [Google Scholar] [CrossRef] [Scilit] [PubMed]
- Wolpaw, J.; McFarland, D.J.; Neat, G.W.; Forneris, C.A. An EEG-based brain-computer interface for cursor control. Electroencephalogr. Clin. Neurophysiol. 1991, 78, 252–259. [Google Scholar] [CrossRef] [Scilit] [PubMed]
- Pfurtscheller, G.; Flotzinger, D.; Kalcher, J. Brain-computer interface—A new communication device for handicapped persons. J. Microcomput. Appl. 1993, 16, 293–299. [Google Scholar] [CrossRef] [Scilit]
- Wolpaw, J.; McFarland, D.; Vaughan, T.; Schalk, G. The Wadsworth Center brain-computer interface (BCI) research and development program. IEEE Trans. Neural Syst. Rehabil. Eng. 2003, 11, 1–4. [Google Scholar] [CrossRef] [Scilit] [PubMed]
- Müller-Putz, G.R.; Scherer, R.; Pfurtscheller, G.; Rupp, R. EEG-based neuroprosthesis control: A step towards clinical practice. Neurosci. Lett. 2005, 382, 169–174. [Google Scholar] [CrossRef] [Scilit] [PubMed]
- Leeb, R.; Friedman, D.; Müller-Putz, G.; Scherer, R.; Slater, M.; Pfurtscheller, G. Self-paced (asynchronous) BCI control of a wheelchair in virtual environments: A case study with a tetraplegic. Comput. Intell. Neurosci. 2007, 2007, 079642. [Google Scholar] [CrossRef] [Scilit] [PubMed]
- Scherer, R.; Müller, G.R.; Neuper, C.; Graimann, B.; Pfurtscheller, G. An asynchronously controlled EEG-based virtual keyboard: Improvement of the spelling rate. IEEE Trans. Biomed. Eng. 2004, 51, 979–984. [Google Scholar] [CrossRef] [Scilit] [PubMed]
- Hema, C.R.; Paulraj, M.P.; Yaacob, S.; Adom, A.H.; Nagarajan, R. Asynchronous brain machine interface-based control of a wheelchair. Adv. Exp. Med. Biol. 2011, 696, 565–572. [Google Scholar] [CrossRef] [Scilit] [PubMed]
- Kübler, A.; Kotchoubey, B.; Hinterberger, T.; Ghanayim, N.; Perelmouter, J.; Schauer, M.; Fritsch, C.; Taub, E.; Birbaumer, N. The thought translation device: A neurophysiological approach to communication in total motor paralysis. Exp. Brain Res. 1999, 124, 223–232. [Google Scholar] [CrossRef] [Scilit] [PubMed]
- Birbaumer, N.; Ghanayim, N.; Hinterberger, T.; Iversen, I.H.; Kotchoubey, B.; Kübler, A.; Perelmouter, J.; Taub, E.; Flor, H. A spelling device for the paralysed. Nature 1999, 398, 297–298. [Google Scholar] [CrossRef] [Scilit] [PubMed]
- Birbaumer, N.; Cohen, L.G. Brain-computer interfaces: Communication and restoration of movement in paralysis. J. Physiol. 2007, 579, 621–636. [Google Scholar] [CrossRef] [Scilit] [PubMed]
- Farwell, L.; Donchin, E. Talking off the top of your head: Toward a mental prosthesis utilizing event-related brain potentials. Electroencephalogr. Clin. Neurophysiol. 1988, 70, 510–523. [Google Scholar] [CrossRef] [Scilit] [PubMed]
- Fabiani, M.; Gratton, G.; Karis, D.; Donchin, E. Definition, identification, and reliability of measurement of the P300 component of the event related potential. Adv. Psychophysiol. 1987, 2, 1–78. [Google Scholar]
- Polich, J. Updating P300: An integrative theory of P3a and P3b. Clin. Neurophysiol. 2007, 118, 2128–2148. [Google Scholar] [CrossRef] [Scilit] [PubMed]
- Maslova, O.; Komarova, Y.; Shusharina, N.; Kolsanov, A.; Zakharov, A.; Garina, E.; Pyatin, V. Non-invasive EEG-based BCI spellers from the beginning to today: A mini-review. Front. Hum. Neurosci. 2023, 17, 1216648. [Google Scholar] [CrossRef] [Scilit]
- Krusienski, D.J.; Sellers, E.W.; Cabestaing, F.; Bayoudh, S.; McFarland, D.J.; Vaughan, T.M.; Wolpaw, J.R. A comparison of classification techniques for the P300 Speller. J. Neural Eng. 2006, 3, 299–305. [Google Scholar] [CrossRef] [Scilit] [PubMed]
- Lotte, F.; Bougrain, L.; Cichocki, A.; Clerc, M.; Congedo, M.; Rakotomamonjy, A.; Yger, F. A review of classification algorithms for EEG-based brain-computer interfaces: A 10 year update. J. Neural Eng. 2018, 15, 031005. [Google Scholar] [CrossRef] [Scilit] [PubMed]
- Blankertz, B.; Lemm, S.; Treder, M.; Haufe, S.; Müller, K.R. Single-trial analysis and classification of ERP components—A tutorial. NeuroImage 2011, 56, 814–825. [Google Scholar] [CrossRef] [Scilit] [PubMed]
- Leoni, J.; Strada, S.C.; Tanelli, M.; Brusa, A.; Proverbio, A.M. Single-trial stimuli classification from detected P300 for augmented Brain–Computer Interface: A deep learning approach. Mach. Learn. Appl. 2022, 9, 100393. [Google Scholar] [CrossRef] [Scilit]
- Sarraf, J.; Pattnaik, P.K. A study of classification techniques on P300 speller dataset. Mater. Today Proc. 2023, 80, 2047–2050. [Google Scholar] [CrossRef] [Scilit]
- Hu, W.; Zhang, D.; Chen, W. ITSEF: Inception-based two-stage ensemble framework for P300 detection. Neural Netw. 2026, 193, 108014. [Google Scholar] [CrossRef] [Scilit] [PubMed]
- Lawhern, V.J.; Solon, A.J.; Waytowich, N.R.; Gordon, S.M.; Hung, C.P.; Lance, B.J. EEGNet: A compact convolutional neural network for EEG-based brain-computer interfaces. J. Neural Eng. 2018, 15, 056013. [Google Scholar] [CrossRef] [Scilit] [PubMed]
- Rivet, B.; Souloumiac, A.; Attina, V.; Gibert, G. xDAWN Algorithm to Enhance Evoked Potentials: Application to Brain–Computer Interface. IEEE Trans. Biomed. Eng. 2009, 56, 2035–2043. [Google Scholar] [CrossRef] [Scilit] [PubMed]
- Wang, H.; Pei, Z.; Xu, L.; Xu, T.; Bezerianos, A.; Sun, Y.; Li, J. Performance enhancement of P300 detection by Multi-Scale-CNN. IEEE Trans. Instrum. Meas. 2021, 70, 2507012. [Google Scholar] [CrossRef] [Scilit]
- Pan, J.; Cai, H.; Huang, H.; He, Y.; Li, Y. Multiple scale convolutional few-shot learning networks for online P300-based Brain–Computer Interface and its application to patients with disorder of consciousness. IEEE Trans. Instrum. Meas. 2023, 72, 2510616. [Google Scholar] [CrossRef] [Scilit]
- Hong, J.; Najafizadeh, L. P3T: A Transformer Model for Enhancing Character Recognition Rates in P300 Speller Systems. In Proceedings of the 58th Asilomar Conference on Signals, Systems and Computers (ACSSC 2024), Pacific Grove, CA, USA, 27–30 October 2024; pp. 514–518. [Google Scholar] [CrossRef] [Scilit]
- Gao, W.; Yu, T.; Yu, J.-G.; Gu, Z.; Li, K.; Huang, Y.; Yu, Z.L.; Li, Y. Learning Invariant Patterns Based on a Convolutional Neural Network and Big Electroencephalography Data for Subject-Independent P300 Brain-Computer Interfaces. IEEE Trans. Neural Syst. Rehabil. Eng. 2021, 29, 1047–1057. [Google Scholar] [CrossRef] [Scilit] [PubMed]
- Li, S.; Daly, I.; Guan, C.; Cichocki, A.; Jin, J. Inter-participant Transfer Learning with Attention Based Domain Adversarial Training for P300 Detection. Neural Netw. 2024, 180, 106655. [Google Scholar] [CrossRef] [Scilit] [PubMed]
- Mainsah, B.; Fleeting, C.; Balmat, T.; Sellers, E.; Collins, L. bigP3BCI: An Open, Diverse and Machine Learning Ready P300-Based Brain-Computer Interface Dataset, version 1.0.0. PhysioNet 2025. [Google Scholar] [CrossRef]
- Goldberger, A.L.; Amaral, L.A.N.; Glass, L.; Hausdorff, J.M.; Ivanov, P.C.; Mark, R.G.; Mietus, J.E.; Moody, G.B.; Peng, C.K.; Stanley, H.E. PhysioBank, PhysioToolkit, and PhysioNet: Components of a new research resource for complex physiologic signals. Circulation 2000, 101, e215–e220. [Google Scholar] [PubMed]
- Lee, M.-H.; Kwon, O.-Y.; Kim, Y.-J.; Kim, H.-K.; Lee, Y.-E.; Williamson, J.; Fazli, S.; Lee, S.-W. EEG dataset and OpenBMI toolbox for three BCI paradigms: An investigation into BCI illiteracy. GigaScience 2019, 8, giz002, È il lavoro associato al dataset OpenBMI ERP/P300. [Google Scholar] [CrossRef] [Scilit] [PubMed]
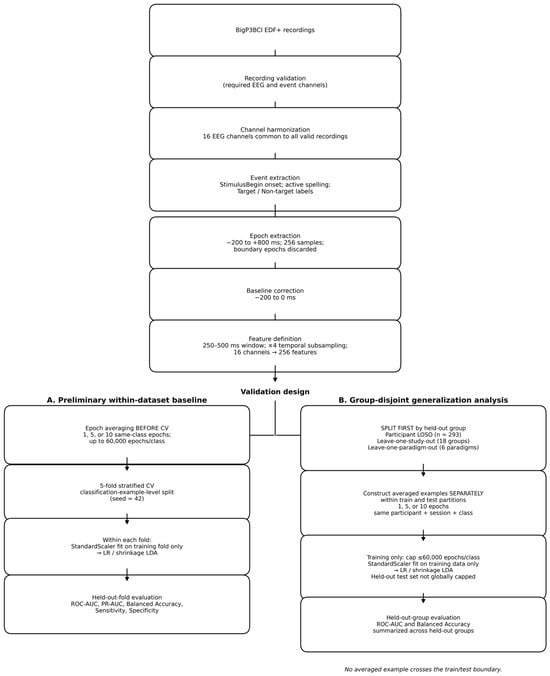
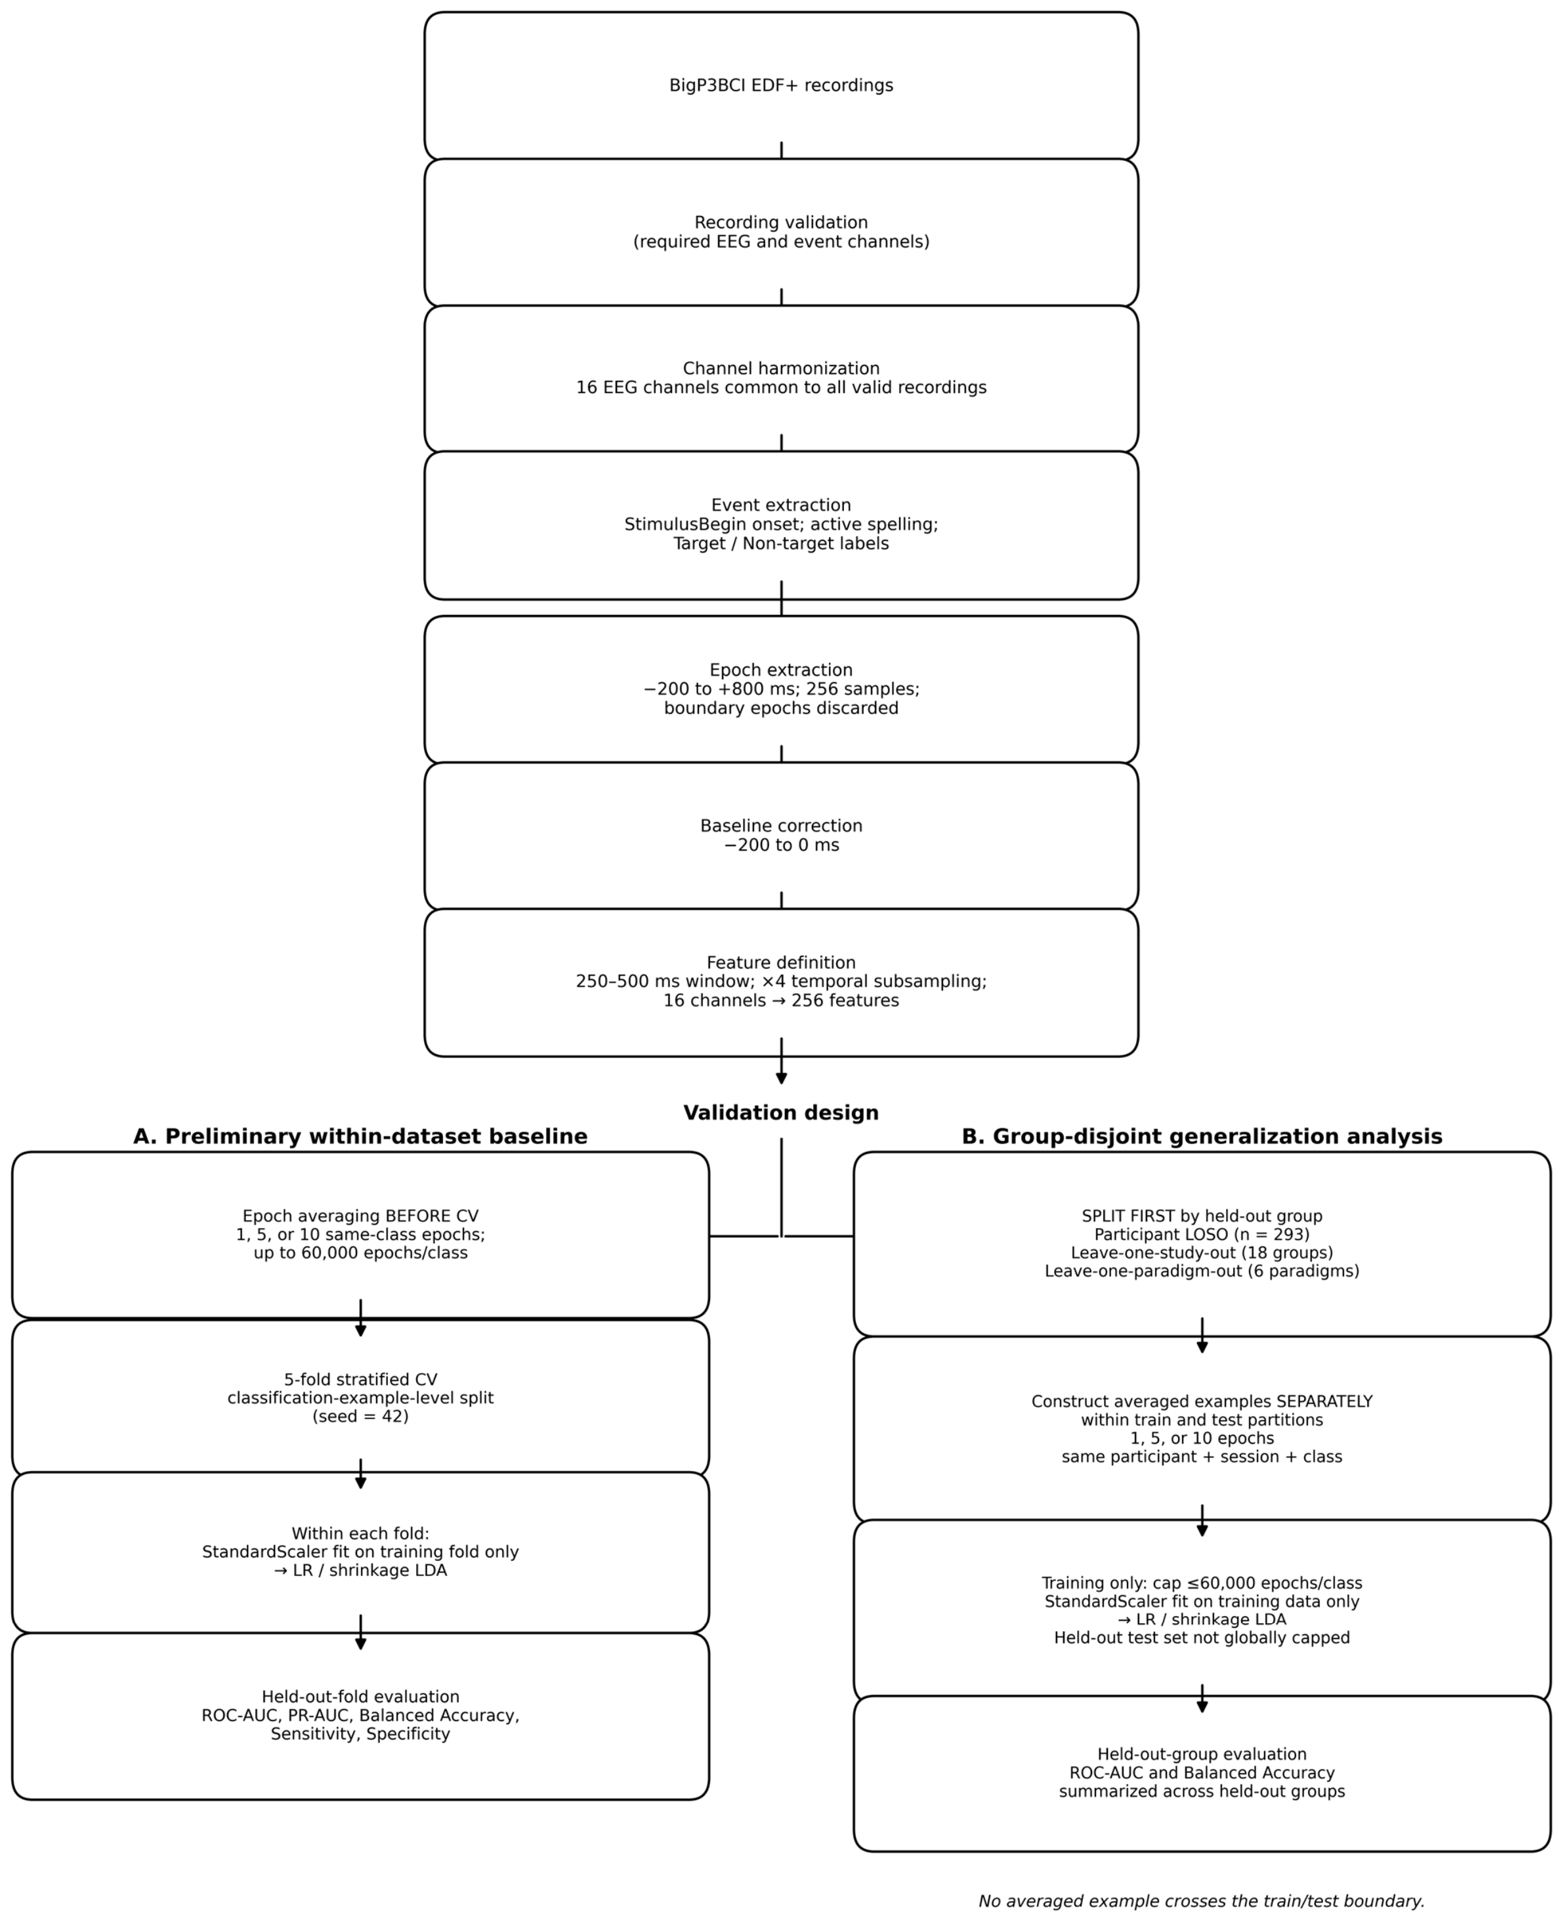
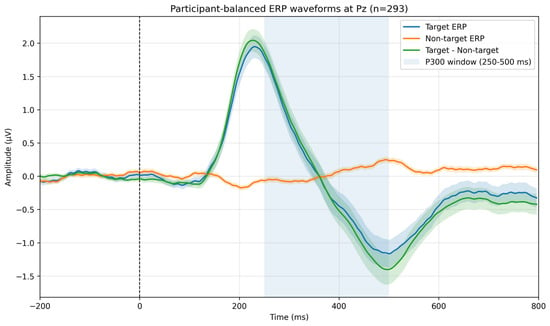
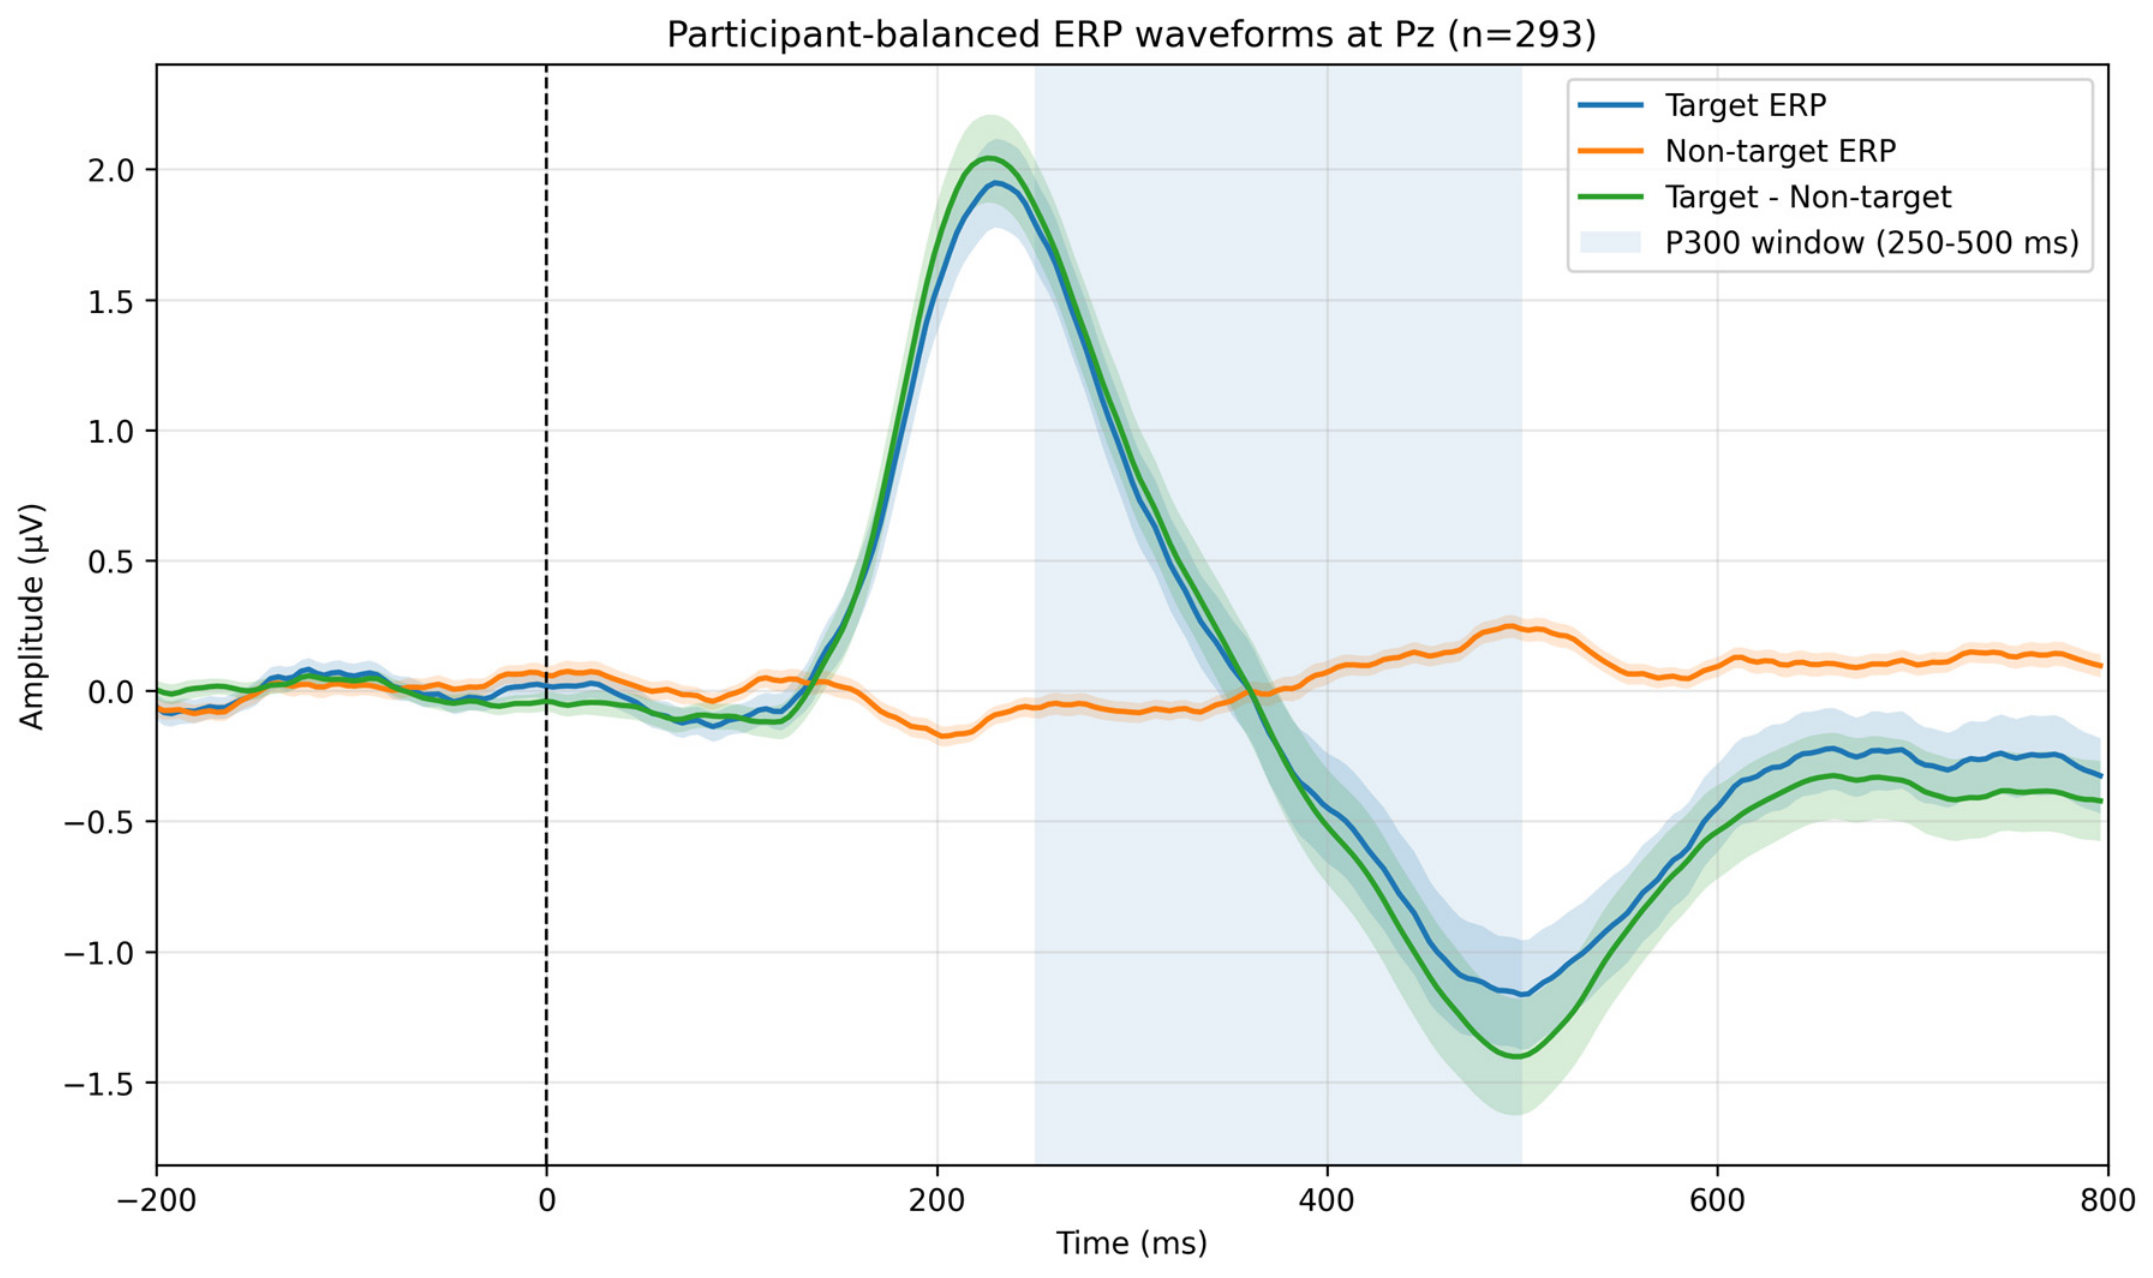
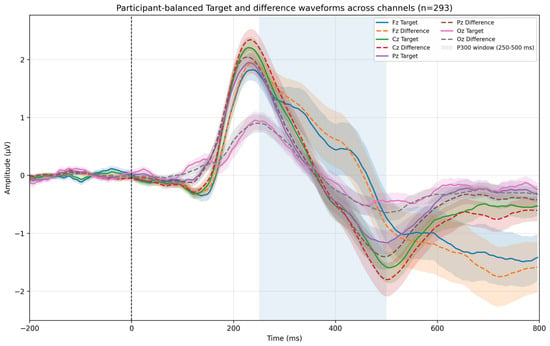
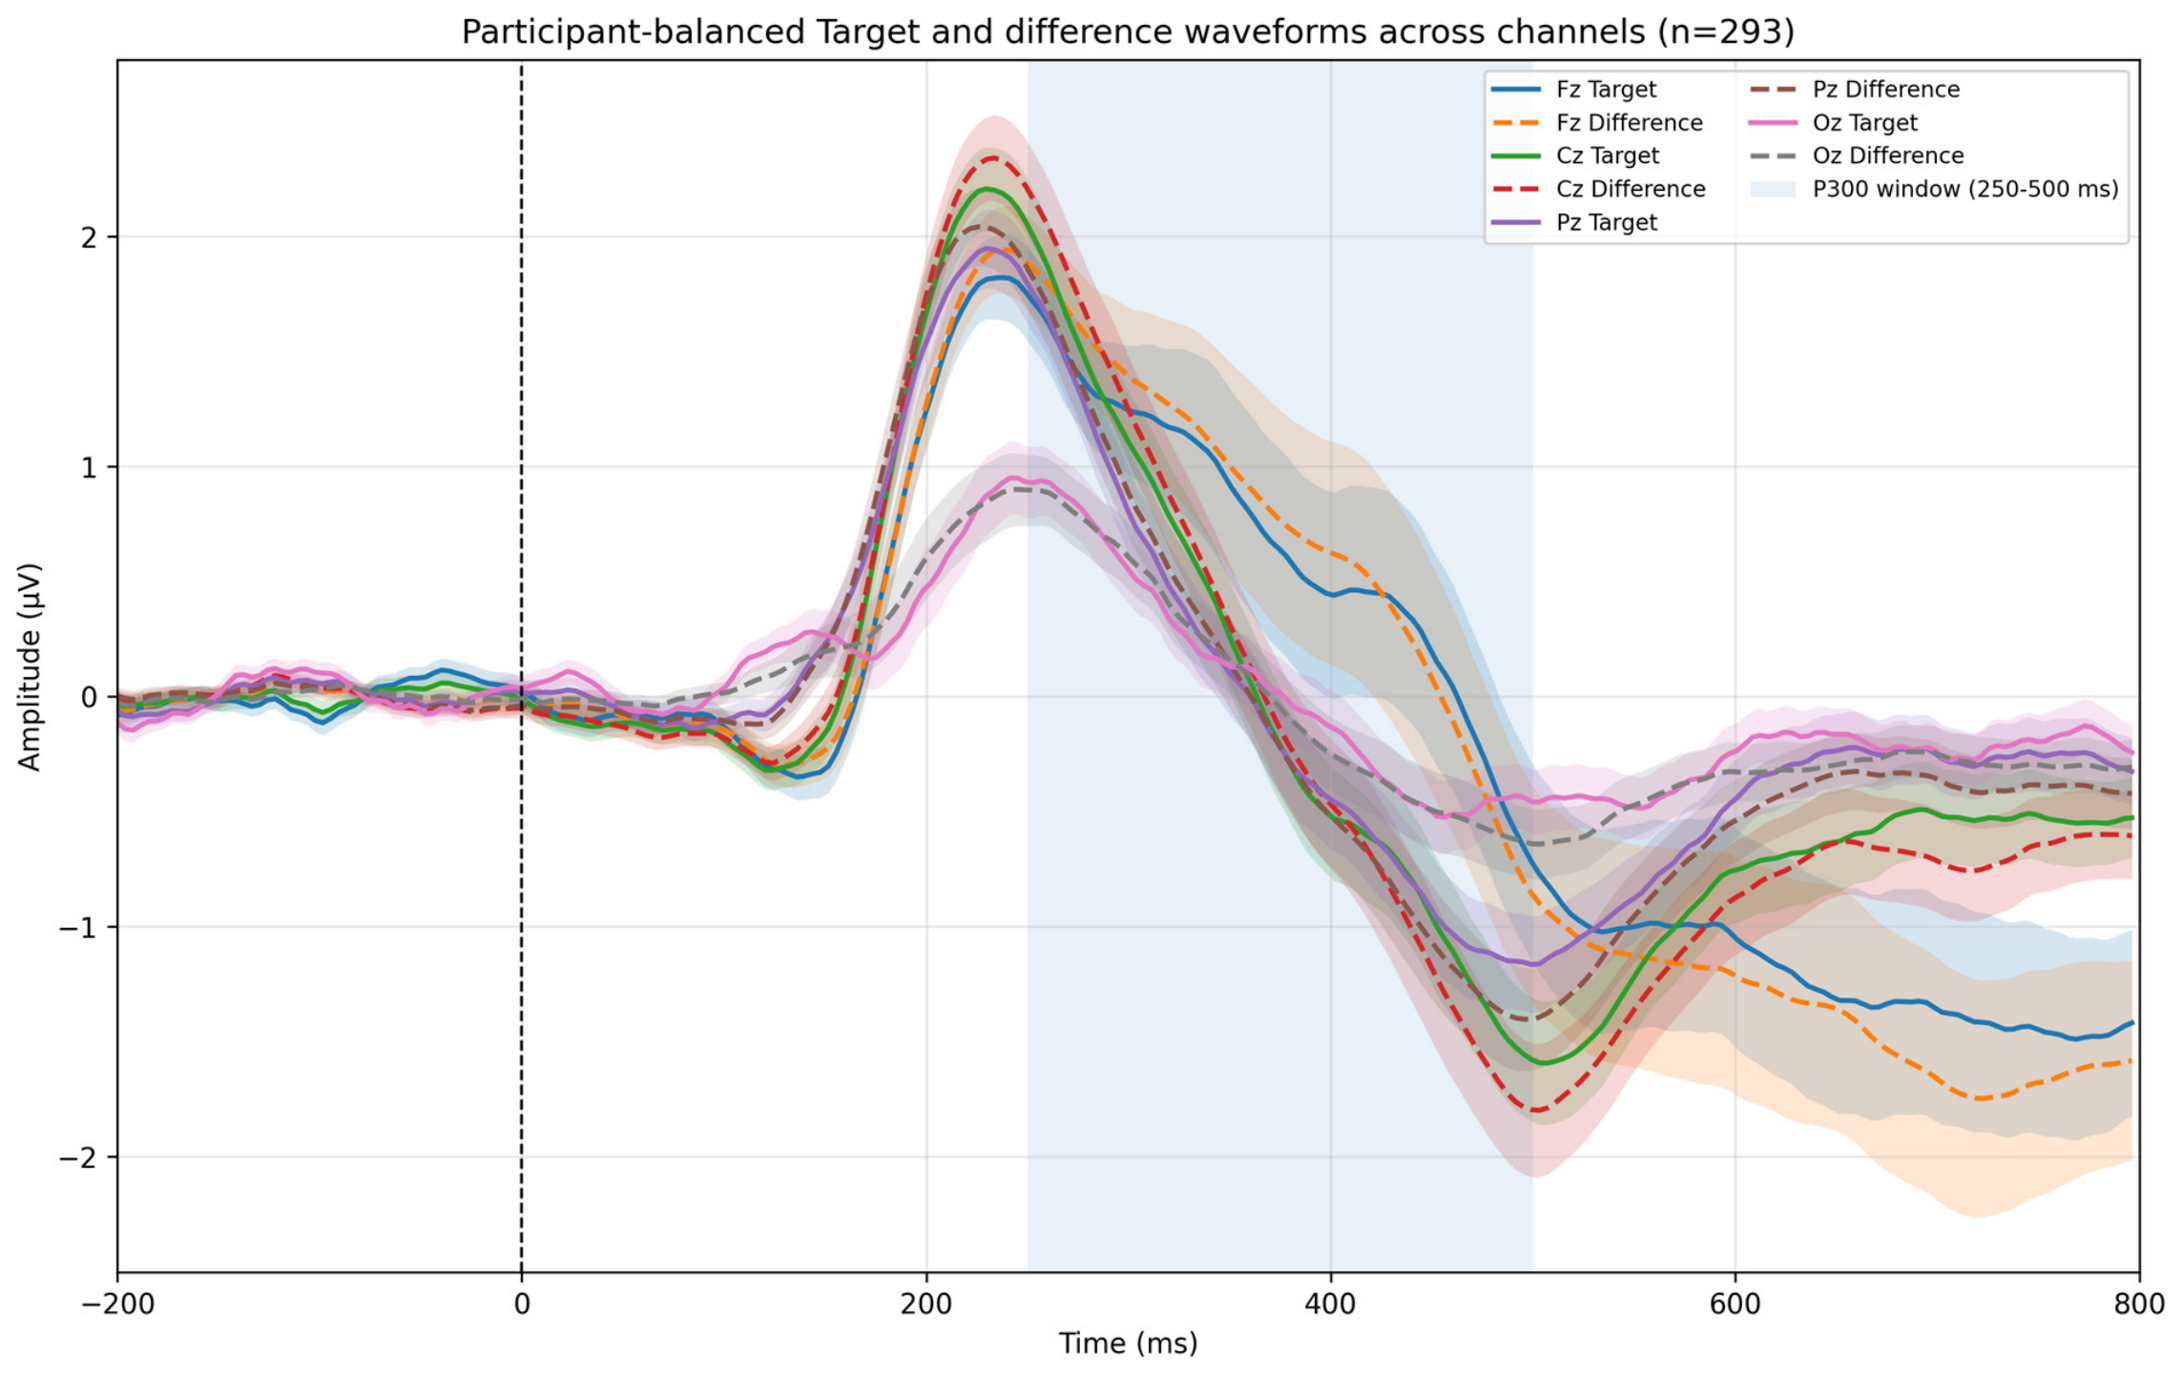
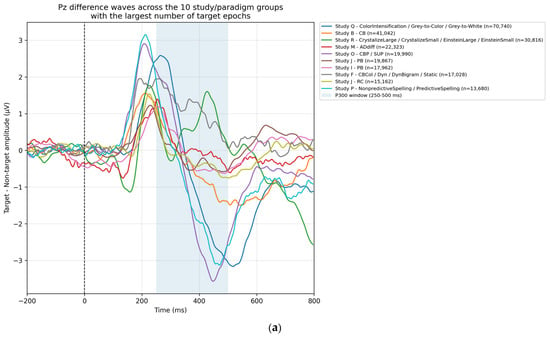
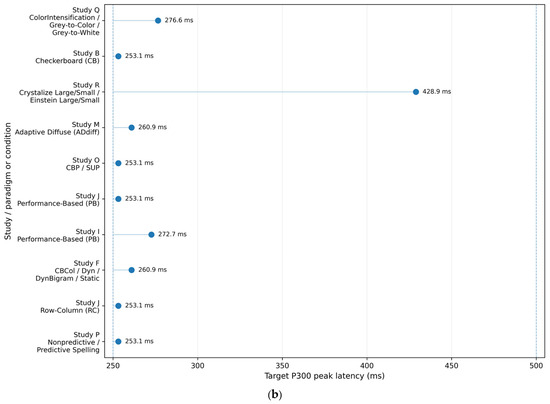
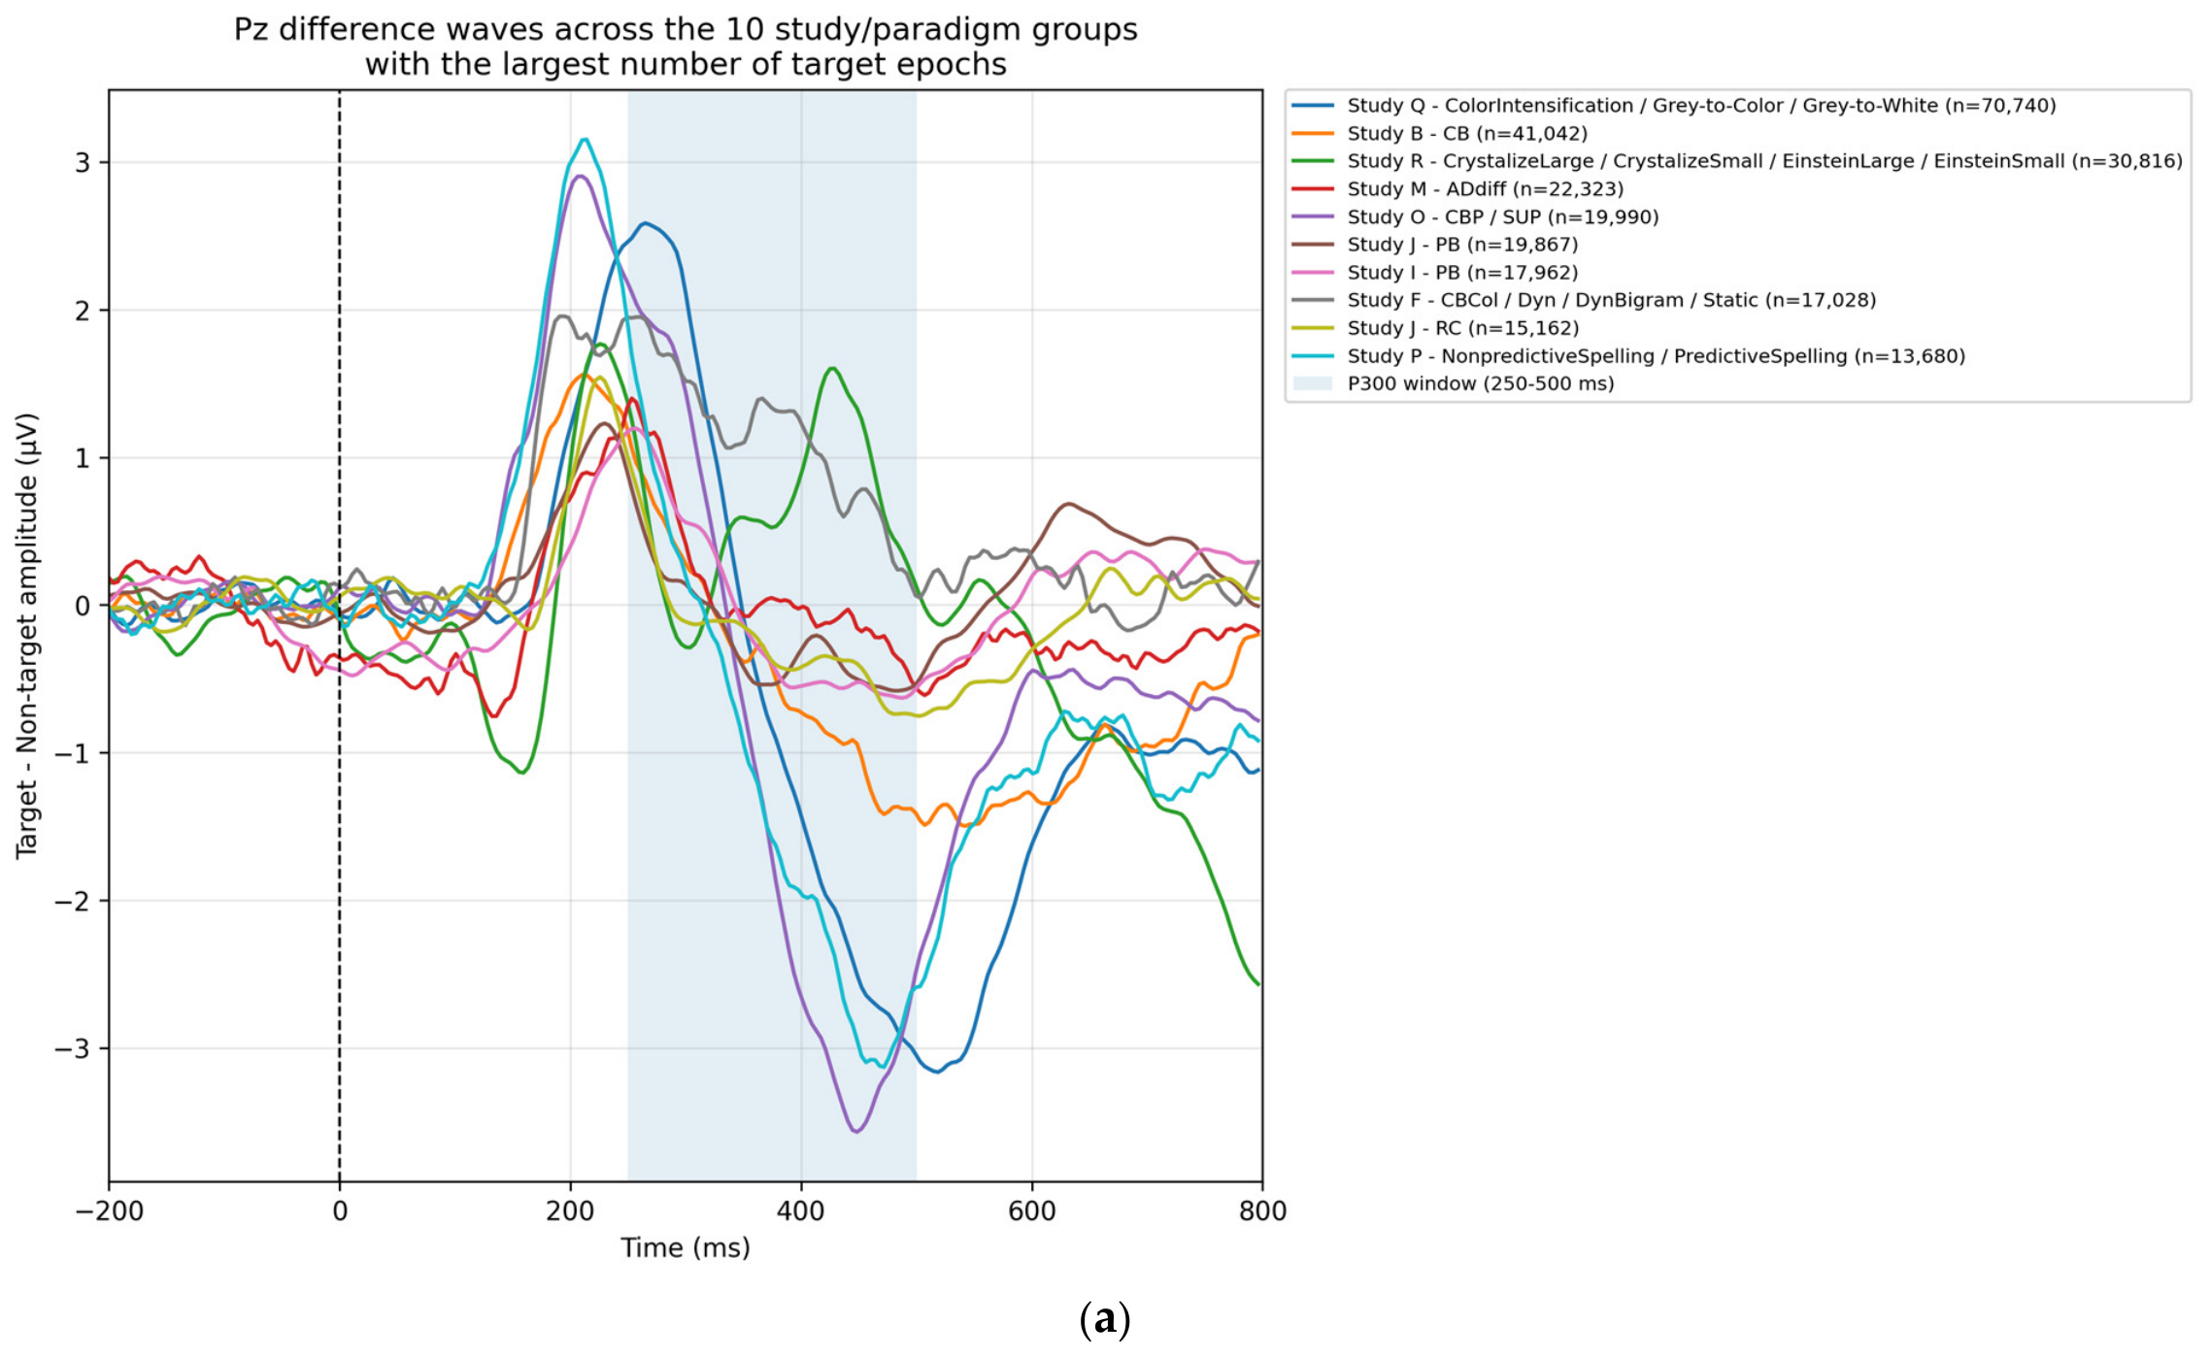
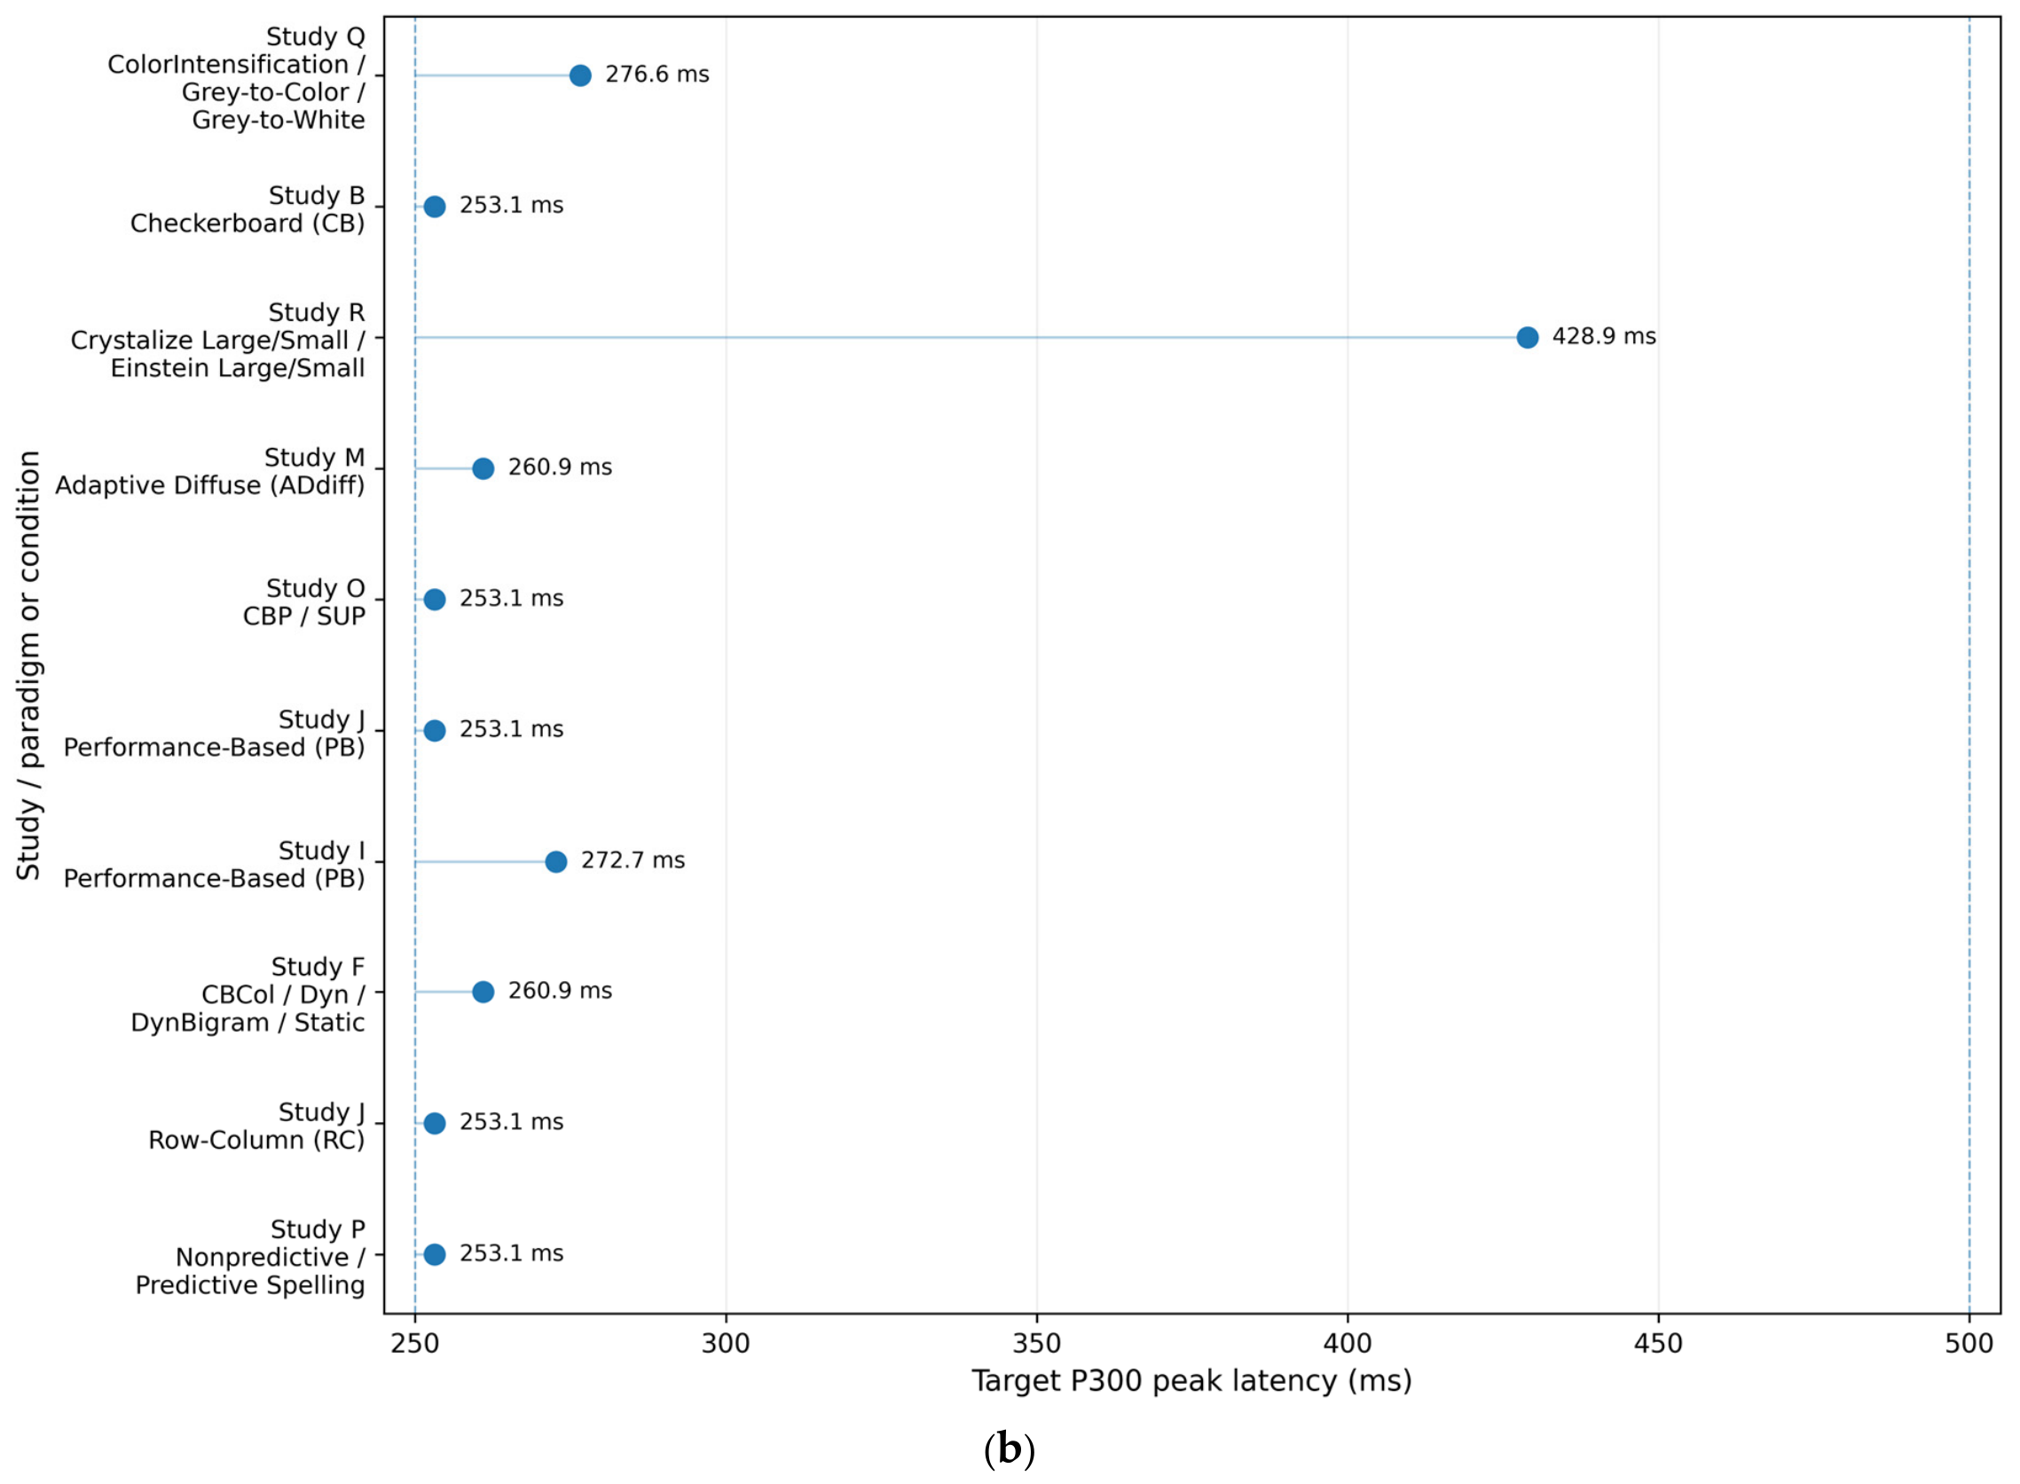
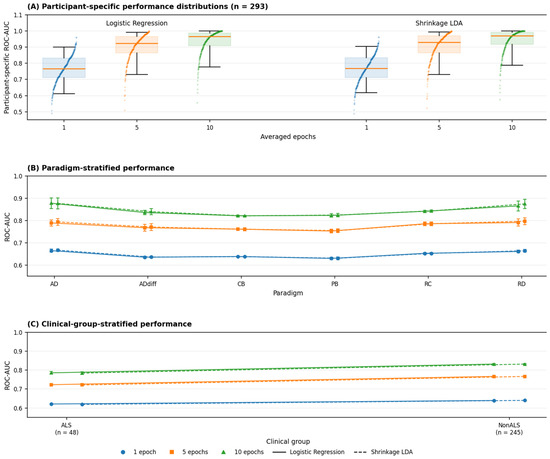
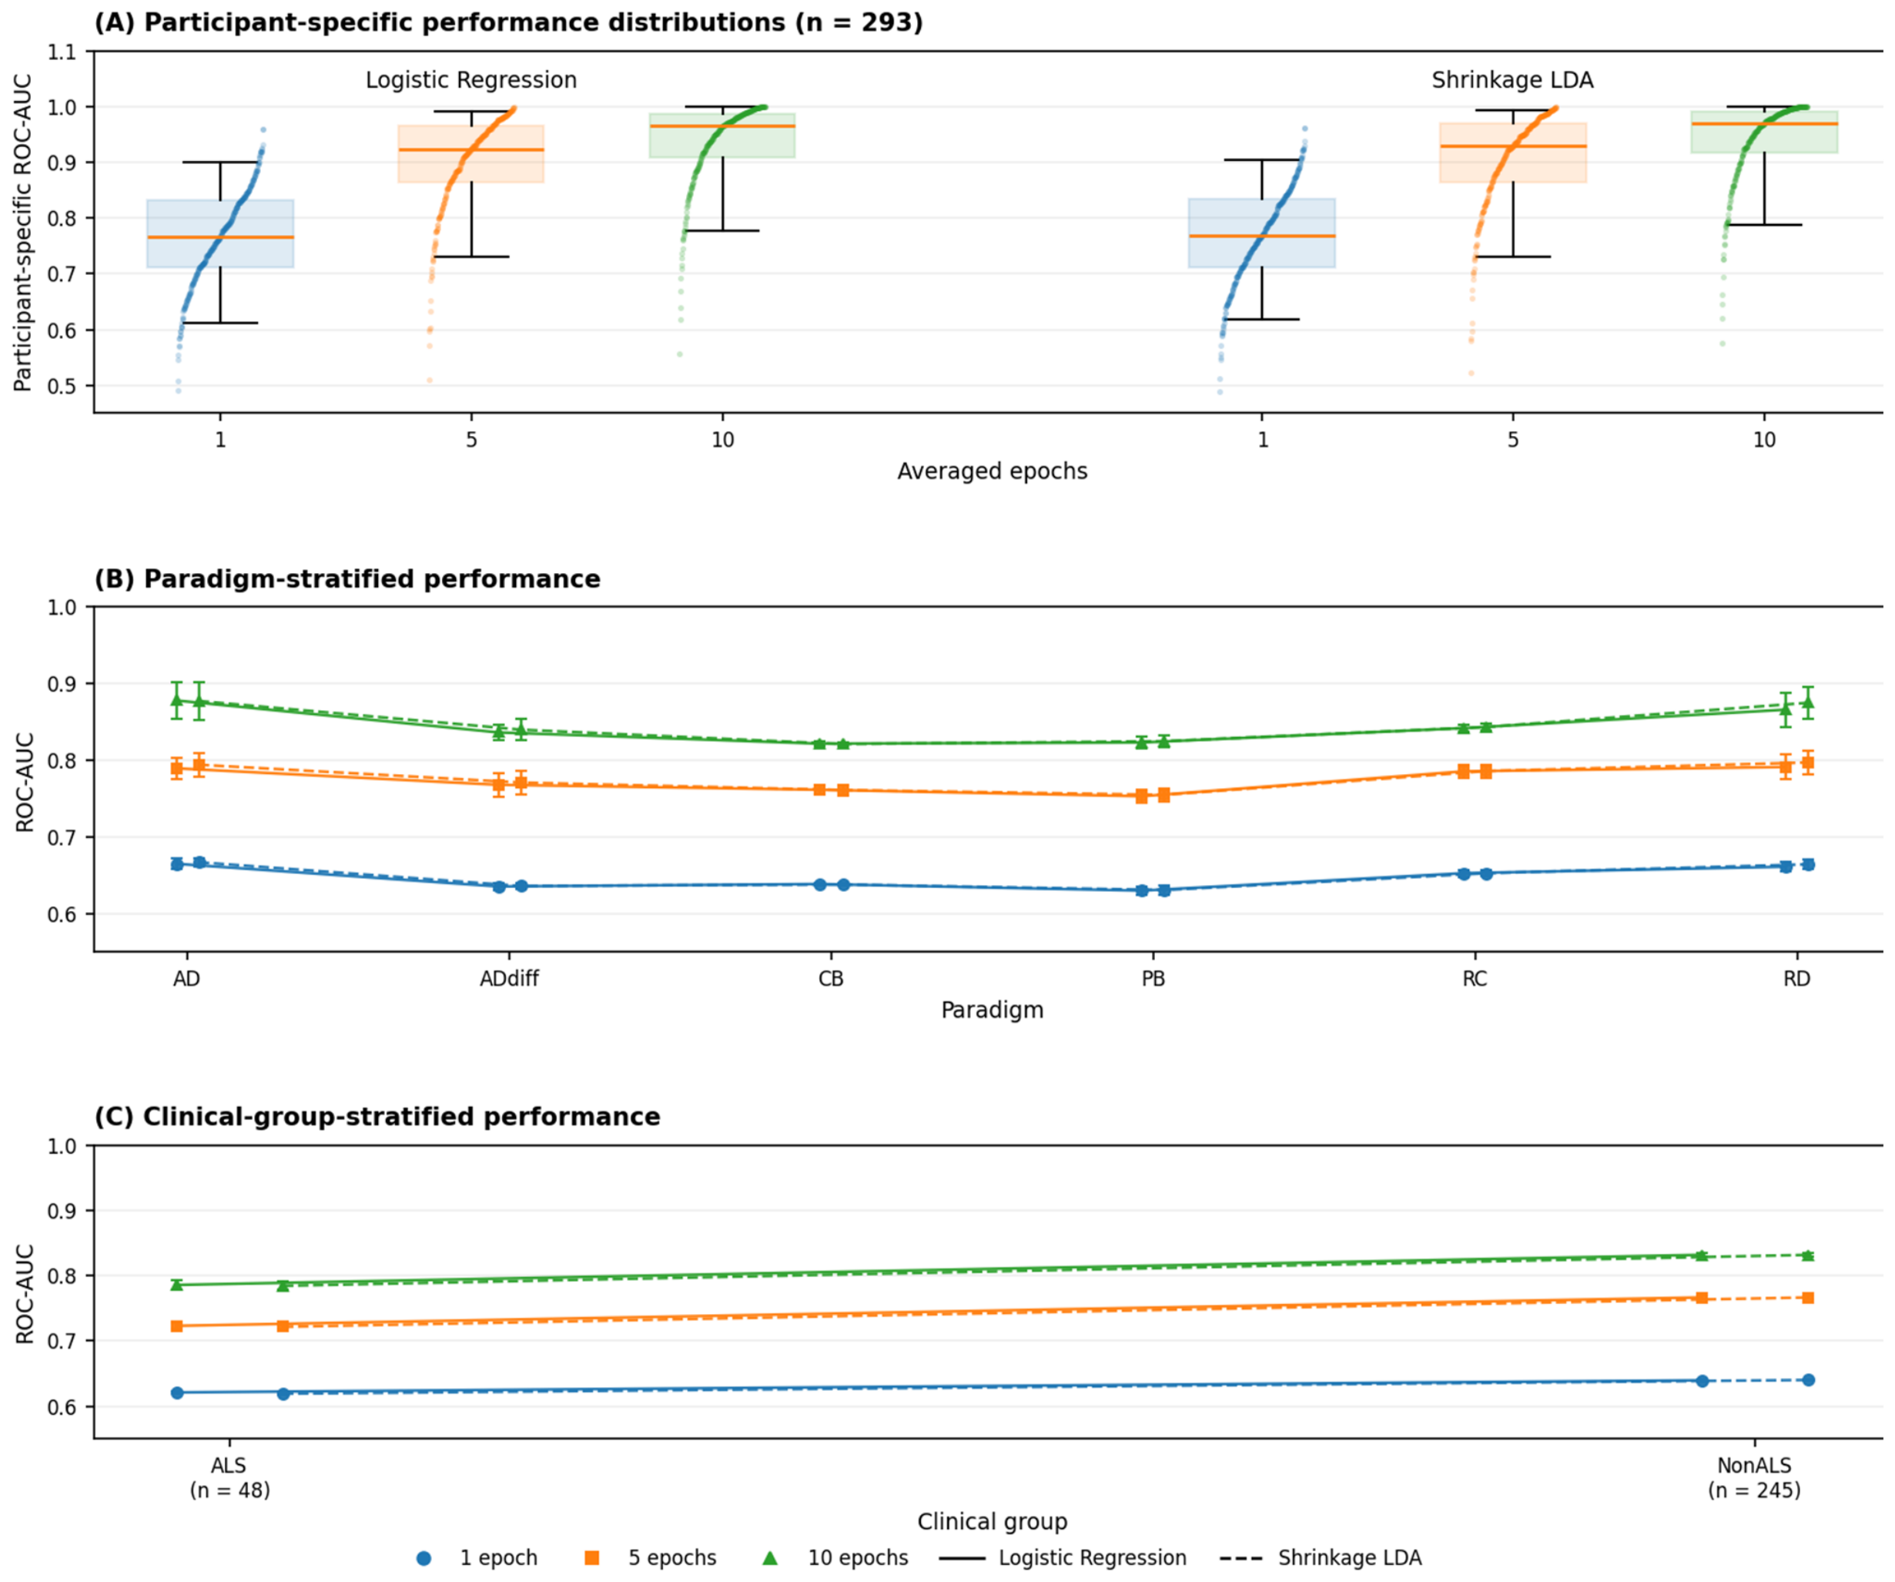
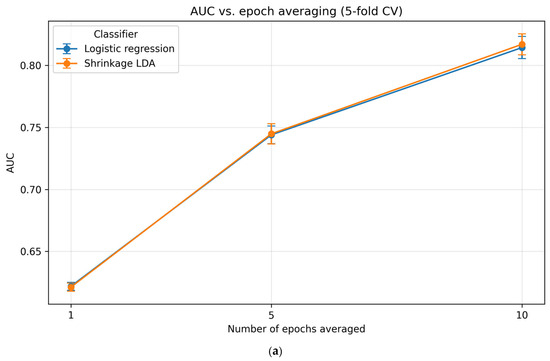
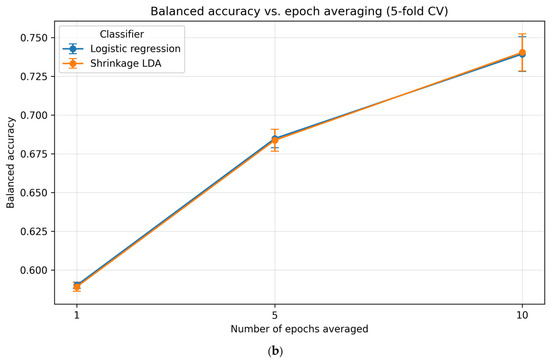
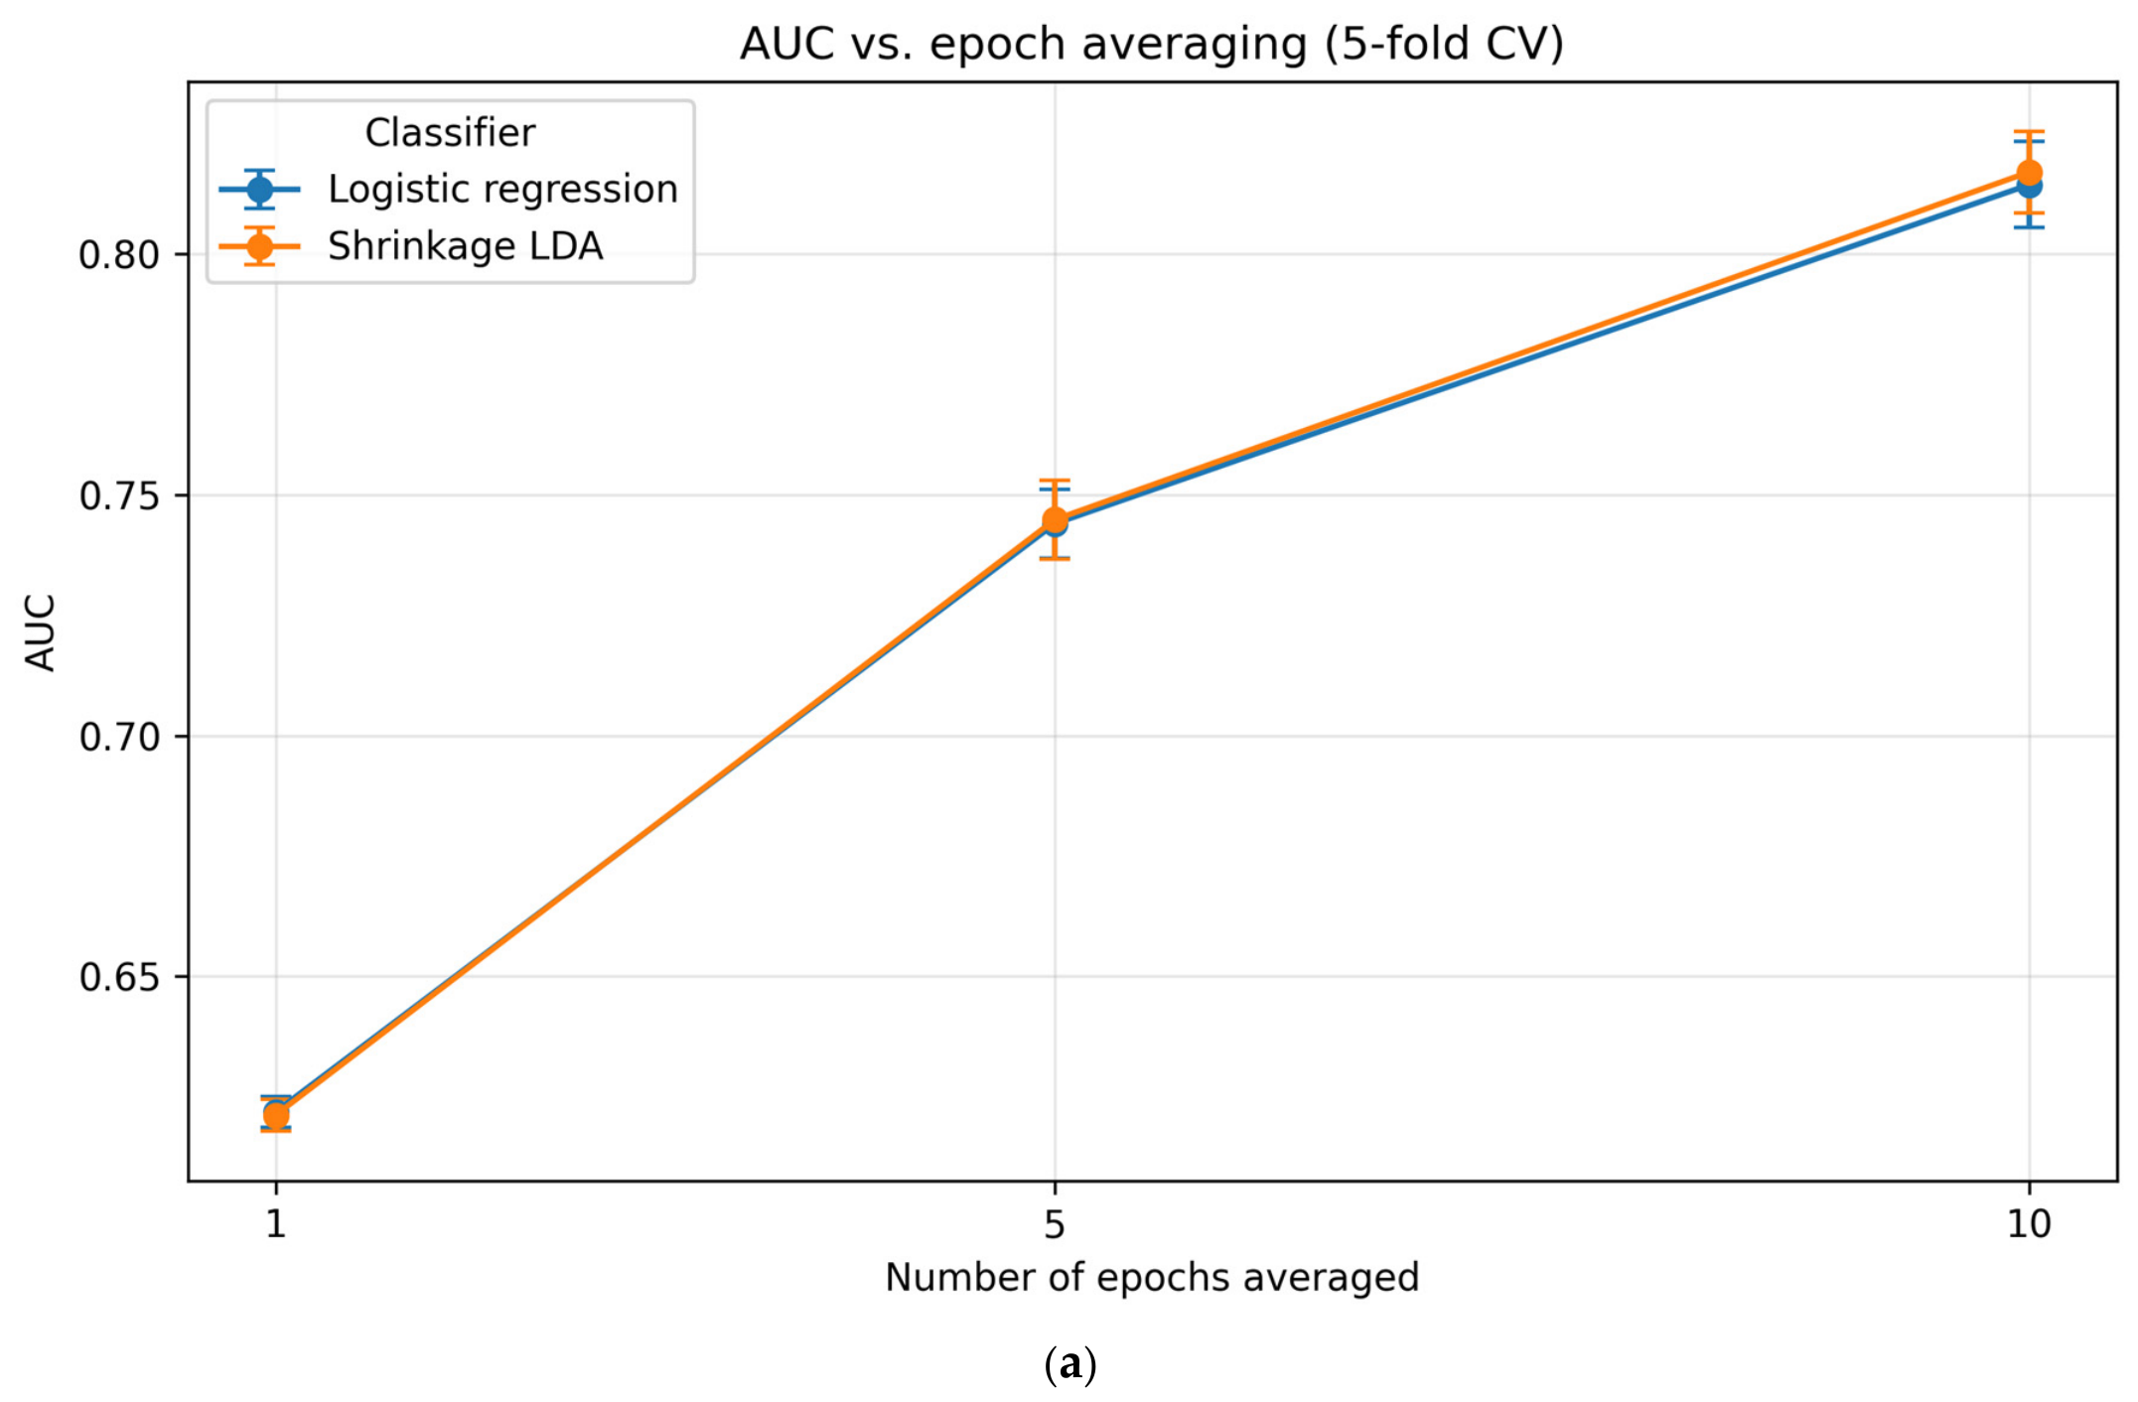
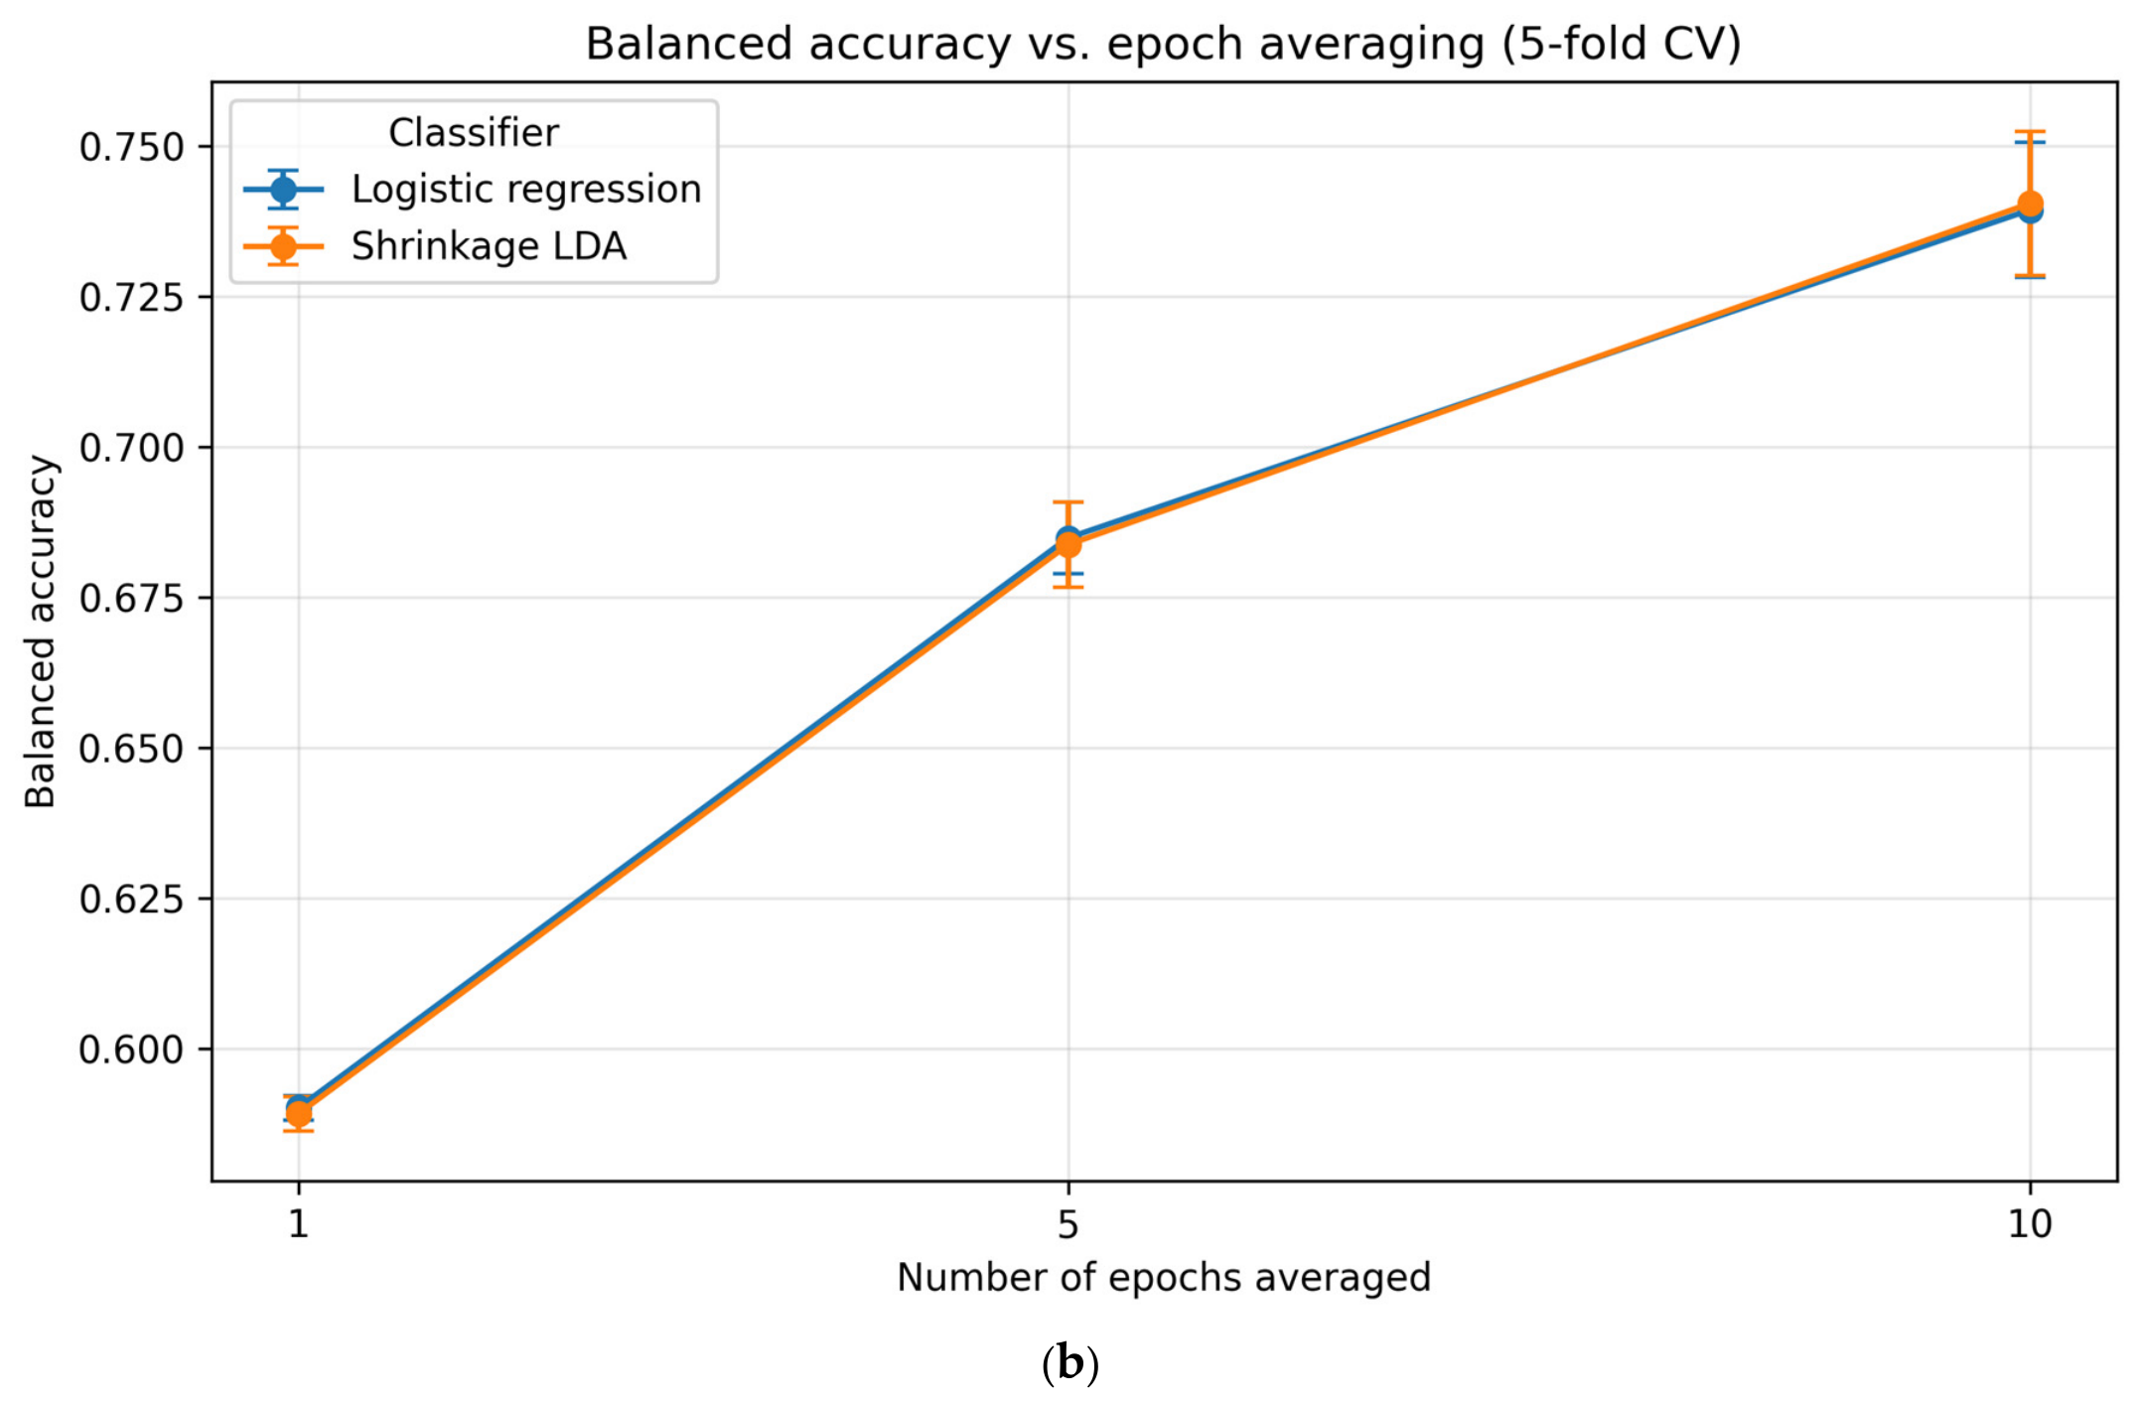
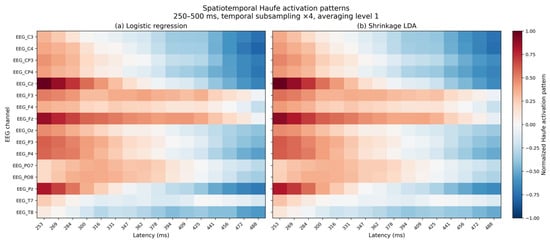
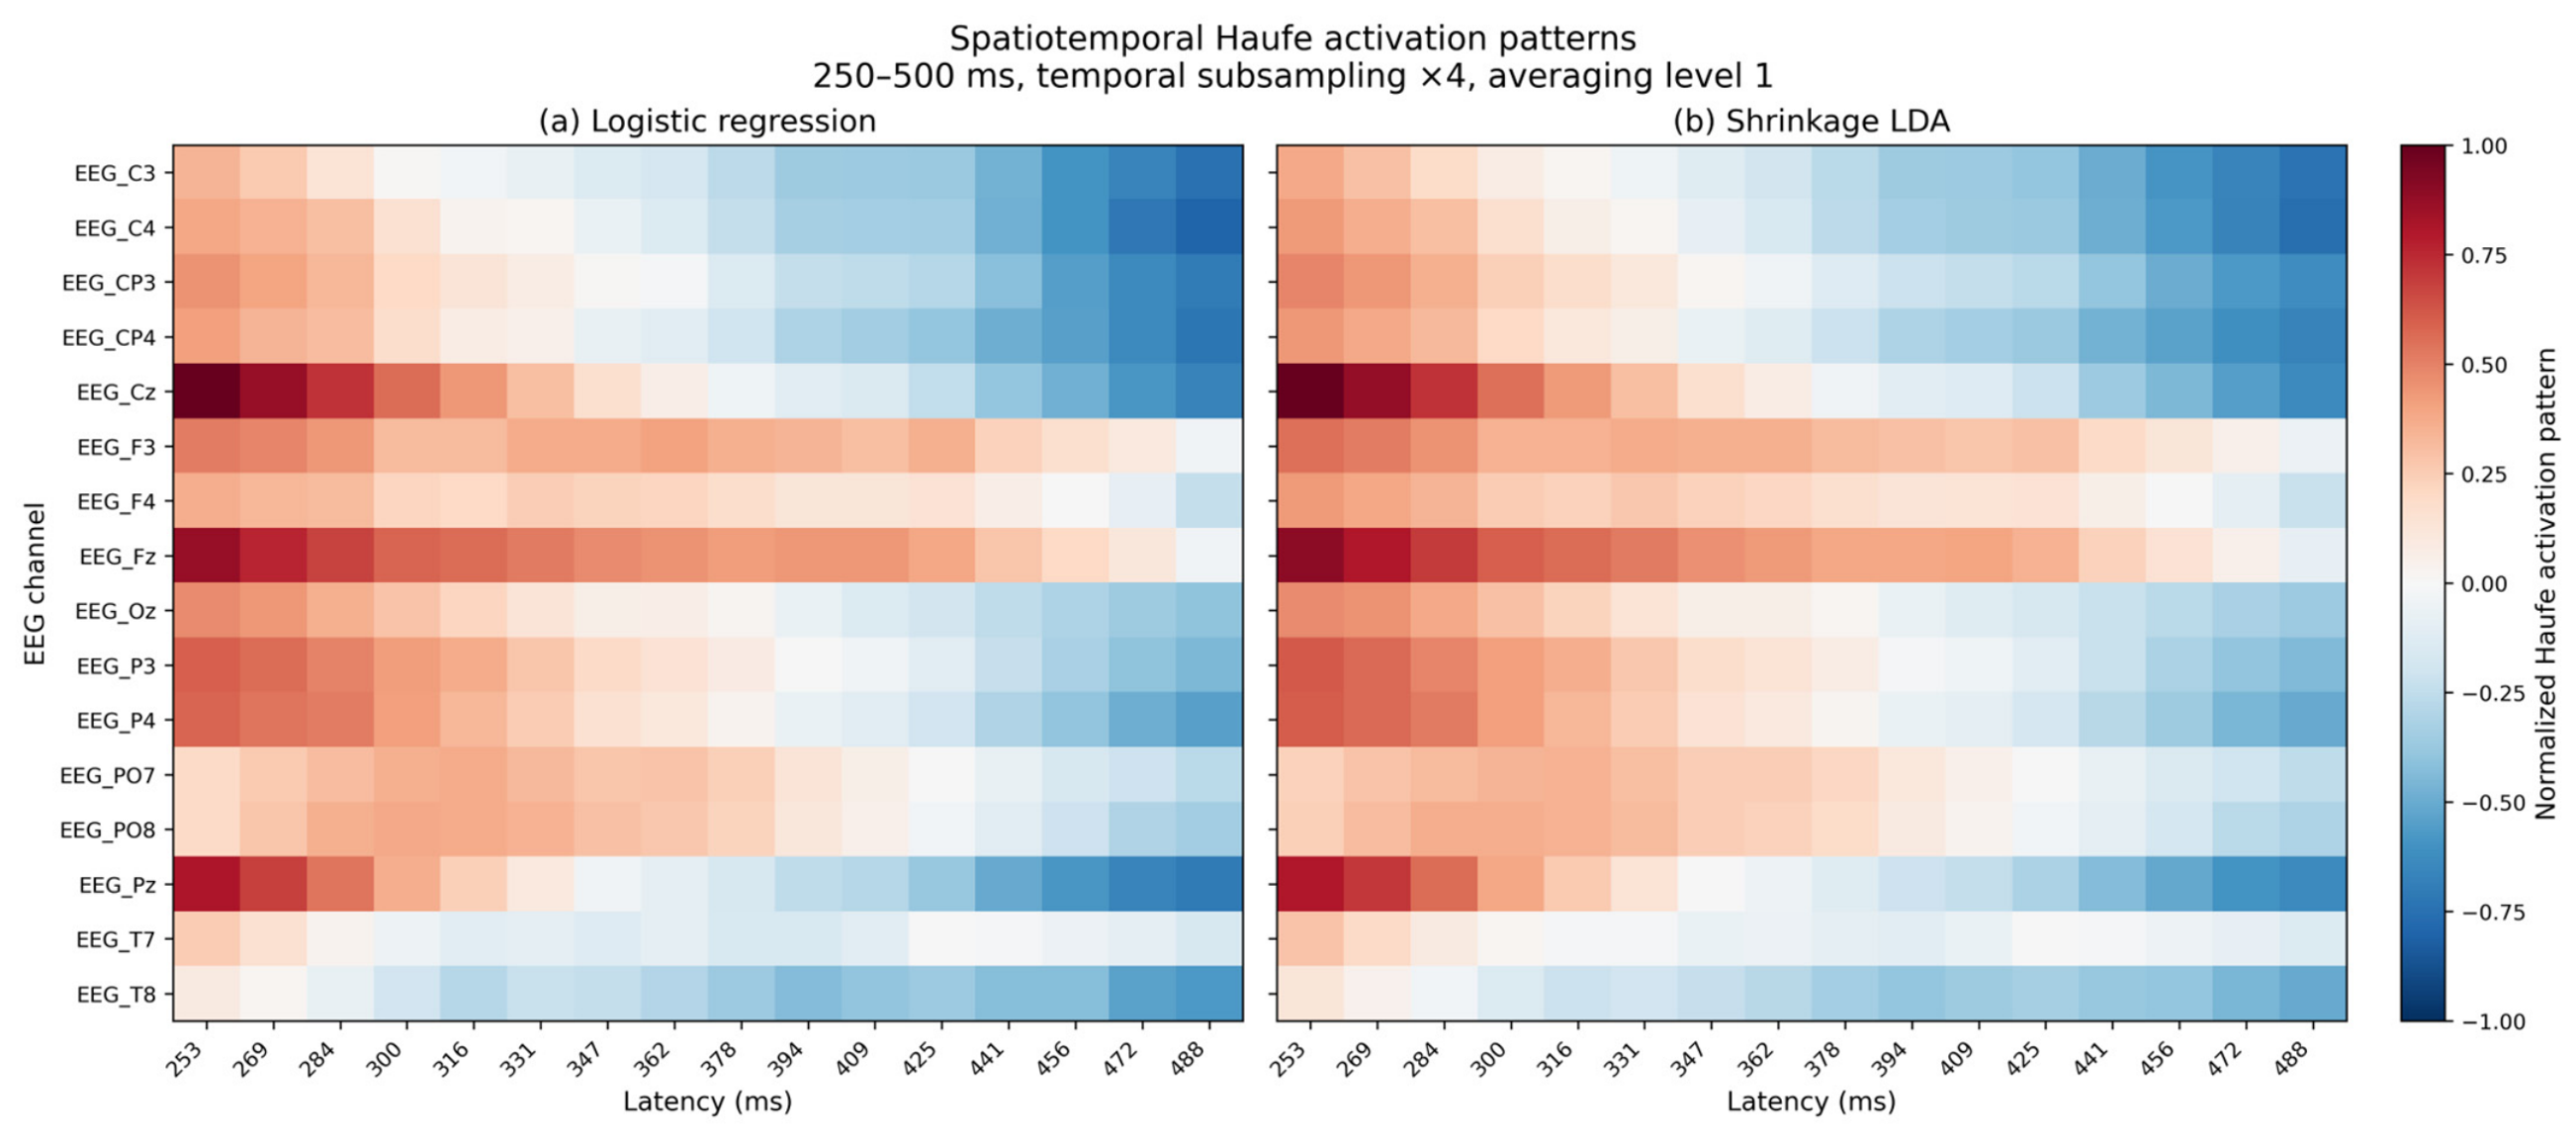

Disclaimer/Publisher’s Note: The statements, opinions and data contained in all publications are solely those of the individual author(s) and contributor(s) and not of MDPI and/or the editor(s). MDPI and/or the editor(s) disclaim responsibility for any injury to people or property resulting from any ideas, methods, instructions or products referred to in the content. |
© 2026 by the authors. Licensee MDPI, Basel, Switzerland. This article is an open access article distributed under the terms and conditions of the Creative Commons Attribution (CC BY) license.