


Abstract
Large language models (LLMs) are increasingly useful as front-end tools for decision support, particularly when extensive textual reports must be read and transformed into a structured analytical form. However, summarisation and decision making are different tasks: summarisation is primarily epistemic compression, whereas choice is normative aggregation. An LLM such as ChatGPT can identify alternatives, criteria, and qualitative assessments in policy documents, but it does not by itself provide a transparent and reproducible method for aggregating conflicting criteria under uncertainty. This paper examines a hybrid architecture in which ChatGPT prepares the decision basis while a multi-criteria decision analysis (MCDA) tool performs the formal evaluation. The approach is examined through the Swedish Nord-Syd infrastructure case. It was first analysed manually in 2011, based on a human panel’s binary and ordinal assessments. In 2026, ChatGPT 5.6 translated the same report evidence into interval-valued assessments using the same 19 terminal criteria, which were supplied as part of the experimental setup, while the panel’s assessments were withheld from the LLM. The panel-derived 2011 model and the LLM-generated 2026 model were analysed using the same −5 to +5 preference scale, criteria hierarchy, equal local weights, and MCDA procedure. The panel-derived assessments implied 31 strict pairwise ordering relations and 26 ties among the three active alternatives. The LLM interval midpoints reproduced the direction of all 31 strict relations; including ties, exact three-state relation agreement was 43/57 (75.4%). In addition, 50 of 57 non-reference interval pairs overlapped, with a mean absolute midpoint difference of 1.12 points. In this case study, the results illustrate how LLM-based extraction and MCDA evaluation can play complementary roles: the former structures complex textual evidence, while the latter provides an explicit and inspectable evaluative framework.
1. Introduction
Large and consequential decisions are commonly supported by extensive textual material. Public investigations, environmental assessments, technical reports, consultation documents, and policy analyses may contain hundreds of pages describing alternatives, expected effects, uncertainties, stakeholder concerns, and conflicting objectives. The problem is therefore seldom a lack of information. More often, the difficulty lies in transforming dispersed and partly qualitative evidence into a form that can support a transparent comparison of alternatives. Important observations may be distributed across different chapters, expressed at different levels of specificity, or formulated in language that does not map directly onto numerical decision models.
Large language models (LLMs) offer new possibilities for addressing this front-end problem. An LLM is a generative model trained to predict and produce language from large collections of textual data. Through an interactive interface such as ChatGPT, a user can ask the model to summarise documents, identify recurrent concepts, classify statements, extract entities and relationships, compare passages, and reorganise unstructured text into tables or other structured formats. Contemporary LLMs have demonstrated strong performance on a wide range of language-oriented tasks, including summarisation, question answering, classification, and information extraction. Their performance can sometimes be improved through techniques such as chain-of-thought prompting [1], self-consistency [2], and iterative interaction with a human user [3].
These capabilities are potentially valuable in decision support. A lengthy report may describe several alternatives against numerous technical, economic, environmental, and social objectives without presenting the information in a form directly usable by a formal decision model. An LLM can assist by locating relevant passages, grouping them by criterion and alternative, and translating verbal assessments into a preliminary analytical structure [3]. In this role, the model functions as a reader, extractor, and translator between natural-language evidence and a more structured representation. This can substantially reduce the effort required to prepare an initial decision basis.
However, producing a structured summary is not the same as making a decision. The distinction can be stated succinctly: summarisation is primarily epistemic compression, whereas choice is normative aggregation. Summarisation reduces informational overload while attempting to preserve the content relevant to the problem. Choice requires something different: conflicting criteria must be weighed, trade-offs must be made explicit, uncertainty must be handled, and the preference assumptions leading from evidence to an overall evaluation must be declared.
LLMs generate responses by modelling patterns in language rather than by applying a declared decision rule. Their fluent output may contain unsupported claims, inconsistent interpretations, or plausible but unverified explanations. Even highly capable models remain fallible in real-world reasoning tasks, and apparent confidence in generated prose should not be interpreted as evidence that the underlying judgment is reliable [3,4]. An LLM may therefore perform epistemic compression convincingly without providing a transparent or reproducible procedure for normative aggregation.
This distinction can also be expressed as one between semantic processing and evaluative aggregation. Semantic processing concerns what the source material says: which alternatives are considered, what effects are attributed to them, which objectives are relevant, and where the evidence is uncertain or contradictory. Evaluative aggregation concerns what should follow from that information once value judgements and trade-offs are introduced. The first task is primarily interpretative and descriptive; the second is partly normative, partly prescriptive.
Multi-criteria decision analysis (MCDA) addresses this second class of tasks. It comprises formal approaches for evaluating alternatives against several, often conflicting, criteria by representing the alternatives, criteria, performance assessments, preference information, and aggregation procedure explicitly. Its purpose is not merely to calculate a ranking, but to make the structure of the evaluation transparent and inspectable and to show how the result depends on assessments, weights, uncertainty, and modelling assumptions.
The two technologies therefore have complementary roles. For readers primarily familiar with LLMs, MCDA supplies the explicit evaluative structure that generated recommendations ordinarily lack. For readers primarily familiar with MCDA, an LLM offers a way to reduce the preparatory work required to extract and organise evidence from extensive qualitative reports. In the proposed hybrid architecture, the LLM performs the linguistic work of reading, extraction, and preliminary structuring, while the MCDA tool performs the declared and reproducible aggregation.
The distinction is particularly important in public infrastructure planning. Such decisions involve large expenditures, long time horizons, uncertain forecasts, and competing social objectives. Accessibility, regional development, safety, environmental impact, construction cost, land use, and distributive effects may all be relevant, but they cannot normally be reduced to one uncontested measure. Different stakeholders may reasonably assign different importance to these dimensions. A defensible decision-support process must therefore expose rather than conceal the assumptions through which heterogeneous evidence is combined.
The present study examines this problem through the Swedish Nord-Syd road-planning case, concerning alternative north–south road connections in the Stockholm region. The Swedish Road Administration report compared a null alternative (Nollalternativet; Zero/No Action) and three principal tunnel alternatives, including Förbifart Stockholm and Diagonal Ulvsunda, across a broad set of goals and effects [5]. The report contained extensive qualitative and quantitative information, but its evaluative tables did not aggregate the criteria into an overall ranking. Indeed, the report explicitly acknowledged that the different goals could not simply be added because their relative importance had not been determined.
The case also permits a comparison that is unusual in studies of LLM-supported decision modelling. The report had already been analysed in 2011 using the DecideIT 3.5 MCDA tool [6]. It is a tool based on interval-valued input data. In that analysis, the human panel used binary Yes/No assessments for the first eight criteria and ordinal qualitative assessments for criteria 9–19, principally using the categories −−, −, 0, +, and ++ together with intermediate assessments. For the present comparison, these judgments were mapped by a fixed rule onto interval-valued assessments on a −5 to +5 preference scale, with Nollalternativet fixed at [0, 0]. In 2026, ChatGPT was instructed to analyse the same report and translate its qualitative evidence concerning the alternatives directly into interval-valued assessments on the same −5 to +5 preference scale. The list of 19 terminal criteria was supplied because the report pages revealing the human panel’s assessments had been withheld, but the panel’s assessments themselves were not available to the LLM. ChatGPT used the remaining report to reconstruct the criteria definitions and hierarchical relationships and to generate the alternative assessments. Thus, both analyses ultimately used interval-valued inputs on the same −5 to +5 scale in the same MCDA tool, but the assessment data were produced through different procedures: human panel judgments followed by a fixed numerical mapping for the 2011 model, and report-based LLM interval assignment for the 2026 model. The two models were subsequently evaluated using the same MCDA tool, the same criteria hierarchy, and the same equal-local-weight baseline, with equal weights assigned among sibling criteria under each parent node.
The purpose of this comparison is not to treat the panel-derived 2011 model as an objective ground truth. Translating qualitative policy statements into numerical assessments necessarily involves interpretation, whether the interpretation is performed by a human analyst or an LLM. It is therefore not the aim to determine which of the two assessment procedures is intrinsically “correct” or “best.” What is examined is the degree of convergence between two sets of criteria assessments produced through separate procedures from the same report, and whether differences at the criterion level materially affect the aggregated ranking.
This leads to the main research question of the paper: To what extent can an LLM-generated representation of a qualitative policy report reproduce the preference structure and decision-analytic conclusions obtained from a pre-existing human-panel assessment?
The study addresses this question at several levels. It compares criterion-level ordering, numerical calibration relative to Nollalternativet, the aggregated values and rankings produced by DecideIT, the pairwise strength of the resulting comparisons, and the sensitivity of the alternatives’ overall values to variation in individual criterion weights. The aim is not to demonstrate that the LLM eliminates the need for human analysts. Rather, it is to determine whether, in this case, the LLM-generated decision basis is sufficiently close to the pre-existing panel-derived model to constitute a reasonable starting point for subsequent MCDA evaluation. The study is thus designed as a controlled comparative single-case study: it examines convergence between two assessment procedures for the same historically fixed decision problem while holding the source report, terminal criteria, preference scale, weighting scheme, and MCDA procedure constant.
Within the scope of this case study, the article makes three principal contributions that together constitute its novelty. First, it provides a conceptually explicit division of labour between LLMs and MCDA. The LLM is used for reading, extraction, and translation of qualitative evidence, while the MCDA tool performs the declared and reproducible aggregation. Second, it illustrates, in the Nord-Syd case, a practical workflow in which the intermediate Excel workbook serves as an inspectable and directly importable boundary between generated interpretation and formal evaluation. Third, and most distinctively, it exploits an unusual historical comparison: the same policy report had already been assessed by a human panel in 2011, and those panel judgments had subsequently been represented in a DecideIT model. This allows the 2026 report-only LLM assessments to be compared with pre-existing panel-derived assessments without exposing the LLM to the panel’s judgments. The comparison examines convergence at both the criterion and aggregate levels while holding the terminal criteria, preference scale, weighting scheme, and MCDA procedure constant.
The paper is organised as follows. Section 2 reviews the relevant literature on LLM capabilities and limitations, tool-supported LLM architectures, MCDA, and the DecideIT framework, and develops the conceptual basis for combining LLM-based extraction with formal decision analysis. Section 3 presents the Nord-Syd case, the report-derived criteria structure, the prompting and extraction procedure, and the design of the comparison between the 2011 and 2026 models. Section 4 reports the criterion-level and aggregated results, including the comparative sensitivity analyses. Section 5 discusses the implications and limitations of the study and concludes with the proposed role of LLMs as preparatory components in transparent MCDA-based decision-support processes.
2. Background and Related Work
2.1. Large Language Models as Readers, Extractors, and Draft Analysts
When used through a conversational interface such as ChatGPT, LLMs can respond to natural-language instructions, retain information from an ongoing interaction, and transform textual material into summaries, classifications, comparisons, tables, and other structured representations. Their most visible capability is fluent text generation, but for decision-support applications their more relevant capability is often the transformation of unstructured information into an intermediate analytical form.
This distinction is important. In most decision problems, the source material does not arrive as a complete or ready-to-use decision model. A report may discuss alternatives in separate chapters, describe some effects quantitatively and others qualitatively, and use several overlapping formulations for similar objectives. Before a formal evaluation can begin, an analyst must identify which alternatives are being considered, which objectives and criteria are relevant, what the report says about each alternative on each criterion, and where the evidence is incomplete or contradictory. This preparatory work is labour-intensive even when the subsequent MCDA calculation is relatively straightforward.
LLMs can assist with several parts of this preparatory process. They can identify named alternatives, extract passages concerning a specified criterion, group statements according to themes, compare descriptions across alternatives, and translate verbal judgments into a tabular format. They can also produce draft definitions, rationales, and source notes that make an emerging model easier to inspect. These tasks can be described as semantic labour: the transformation of information from one linguistic or representational form into another without yet making the final evaluative trade-offs.
Large-scale evaluations show that ChatGPT-type systems can perform strongly across many language-oriented tasks, including summarisation and interactive information-processing tasks, while also displaying uneven reasoning performance and confabulating behaviour [3]. The GPT-4 technical report similarly documents broad benchmark capabilities but cautions that strong measured performance does not imply human-level reliability across real-world situations [4]. For decision support, the implication is that useful information-extraction performance and dependable overall judgment should not be treated as the same capability.
Prompting techniques can improve performance on tasks requiring several intermediate steps. Chain-of-thought prompting encourages a model to produce an explicit sequence of intermediate reasoning steps rather than only a final answer [1]. Self-consistency samples several reasoning paths and selects an answer based on agreement among them, thereby improving results on some reasoning tasks [2]. Interactive prompting can also allow a user to identify omissions, request reformulations, and gradually refine the structure produced by the model. These methods can improve the quality of the generated output, but they do not transform the LLM into a formally specified decision method.
One reason is that an LLM-generated explanation should not automatically be treated as a faithful account of the process that produced the answer. A model can be prompted to state criteria, weights, comparison rules, or intermediate reasoning explicitly, but the resulting verbal account remains generated output rather than an independently verifiable record of the model’s internal computation. Lipton distinguishes between transparency and post hoc interpretability and warns against treating an intelligible explanation as equivalent to access to the underlying mechanism [7]. Miller similarly emphasises that explanations are selective and socially constructed rather than neutral reproductions of an internal process [8]. For LLMs specifically, visible reasoning traces may improve performance while still failing to represent the model’s operative reasoning faithfully [9].
This creates a particular difficulty when an LLM is asked to move directly from source material to a recommendation. A natural-language answer may state that one alternative is preferable because it performs better on accessibility, cost, or environmental impact, but the answer may not specify how these dimensions were weighted or aggregated. Even when the model lists advantages and disadvantages, the implied trade-off rule may remain hidden. The recommendation can therefore appear transparent because it is accompanied by an explanation, while the evaluative structure underlying the recommendation may remain incompletely specified or may exist only as generated prose rather than as an independently executable decision model. Further, applying different stakeholder views or carrying out serious sensitivity analyses would be difficult.
Verifiability is a related problem. Generative systems may produce statements accompanied by source-like language or citations, yet empirical audits show that apparently supported claims can remain only partly substantiated or connected to inaccurate references [10]. This is especially problematic in decision settings where each assessment should be traceable to a source passage. A public-policy model should allow an analyst or stakeholder to inspect not only the final recommendation but also the evidence supporting every criterion assessment.
These limitations do not imply that LLMs are unsuitable for decision support. Rather, they suggest that their role should be defined more carefully. An LLM is well suited to proposing a structured interpretation of a text, but less suited to acting as an autonomous and opaque aggregator of conflicting objectives. The generated structure can be treated as a draft analytical artefact: useful, rapidly produced, and open to inspection, but not automatically authoritative.
The distinction can also be expressed in terms of descriptive and normative tasks. For example, extracting the information that one road alternative is expected to improve regional accessibility is primarily descriptive, even though interpretation may be involved. Deciding how much that accessibility improvement should compensate for higher construction cost or greater environmental harm is normative. The latter task requires preferences, value judgments, and aggregation principles that do not follow from the report text alone. Unless these assumptions are separately elicited and represented, an LLM recommendation risks embedding them implicitly.
Recent research on tool-augmented LLMs supports a division of labour in which the language model does not attempt to perform every task internally. Program-of-Thoughts delegates numerical computation to an external program rather than relying on a generated verbal calculation [11]. Toolformer concerns the ability of language models to invoke external tools and application programming interfaces when required [12]. ReAct combines language-based reasoning with actions in an external information environment [13]. The common principle is that language models become more useful when tasks requiring specialised representations, reliable computation, or external verification are assigned to components designed for those purposes.
The same principle has been emphasised in planning research. Kambhampati and colleagues [14] argue that autoregressive LLMs should not be treated as reliable autonomous planners or self-verifiers and instead propose LLM-modulo architectures in which model-based external components constrain, verify, or complete the work initiated by the language model. Strategic decision making has similar characteristics. It requires not only understanding the wording of a problem but also representing alternatives, constraints, values, uncertainty, and aggregation rules in an explicit model.
In the present context, the appropriate role of ChatGPT is therefore upstream of the final decision calculation. It can read the report, identify its alternatives and criteria, associate passages with the resulting report-derived decision structure, and propose interval-valued assessments together with a separate textual explanation. It can store the resulting numerical assessments in, for example, an Excel matrix that exposes the numerical inputs in a form that can be inspected separately from the eventual aggregation, while the accompanying explanation records the principal interpretations and coding judgments. This does not guarantee that every extracted assessment is correct, but it makes disagreement local and contestable. An analyst can challenge a particular score or interval without having to reconstruct the entire reasoning implicit in a prose recommendation.
2.2. Multi-Criteria Decision Analysis and Explicit Evaluative Structure
Multi-criteria decision analysis addresses decisions in which several alternatives must be evaluated against multiple criteria and no single criterion provides a sufficient basis for choice. Such problems arise when objectives conflict, measurements use different scales, or relevant effects cannot be expressed in a common natural unit. Infrastructure planning is a typical example: an alternative may improve accessibility while increasing cost, reduce congestion while harming natural environments, or benefit one geographical area more than another.
MCDA is a broad family of methods rather than one uniform algorithm. Different methods use different mathematical representations and aggregation principles, but most require a number of common modelling elements. These include a set of decision alternatives, a set or hierarchy of criteria, an assessment of each alternative on each criterion, and preference information describing how the criteria should influence the overall evaluation. The result may take the form of a ranking, a classification, a set of non-dominated alternatives, or an analysis of the conditions under which one alternative becomes preferable to another. The field encompasses several major traditions, including multi-attribute value and utility approaches, outranking methods, and broader decision-aiding frameworks; classic treatments include Keeney and Raiffa, Roy, and Bouyssou and colleagues [15,16,17].
For readers primarily familiar with LLMs, it is useful to distinguish the principal components of an MCDA model. The alternatives are the possible courses of action under consideration. The criteria represent the objectives or dimensions according to which the alternatives are evaluated. The performance assessments describe how well each alternative performs on each criterion. The weights or other preference parameters express the relative importance of the criteria or the strength of the trade-offs among them. Finally, an aggregation procedure combines the assessments and preferences into an overall evaluation.
These components represent different kinds of information and should not be conflated. A report may provide evidence concerning expected travel time, environmental disturbance, or construction cost. It normally does not determine how much one of these effects should count relative to another. Performance information and preference information therefore have different origins. The first concerns beliefs about the consequences of the alternatives; the second concerns judgments about what matters in the decision. One of the principal benefits of MCDA is that this distinction becomes visible.
In preference-based MCDA, weights should not generally be interpreted as objective properties of the criteria. They form part of the preference model and may express importance, scaling factors, or trade-off relationships depending on the particular method. Some MCDA approaches nevertheless use the term objective weighting for procedures that derive criterion weights from statistical or information-theoretic properties of the performance data rather than from elicited preferences [18]. Such data-derived coefficients serve a different modelling role from the stakeholder preference weights considered in the present study. Equal weighting provides a simple and transparent baseline, but its implementation must be specified in a hierarchical criteria model. In the present study, equal local weighting means that sibling criteria are assigned identical imprecise weight specifications and are treated symmetrically: no sibling criterion is assigned a systematically larger or more probable weight than another. The weights are nevertheless represented by intervals rather than fixed points. For a sibling group, the admissible weight set can be written as . where and denote the lower and upper bounds of criterion weight wi respectively. Individual points in this set may therefore contain unequal component weights, even though the weight information supplied for the sibling criteria is equal. For example, the seven first-level criteria in this case study all have the identical interval; every admissible weight vector nevertheless sums to 100%. DecideIT evaluates this admissible parameter space jointly, with second-order belief information represented over the imprecise weights, rather than reducing the weights to a single point vector. Thus, “equal local weights” refers to the symmetric weight specification, not to an assumption that every evaluated point has numerically identical weights. Because the criteria tree is hierarchical, equal local weighting also does not imply identical global weights for all terminal criteria.
Aggregation is additive within each sibling group of the criteria hierarchy. For any admissible combination of local weights and criterion values, the value at a parent node p is where C(p) is the set of child criteria under p, wi is the locally normalised weight of child i, and vi(a) is the value of alternative a on that child. The same rule is applied recursively through the hierarchy. Because both assessments and weights may be imprecise, DecideIT evaluates this aggregation over their admissible ranges rather than reducing them to a single fixed input vector.
In the present study, sibling criteria were assigned identical imprecise local-weight specifications under each parent node. This should not be interpreted as a claim that all terminal criteria have identical global weights or that all criteria are normatively equally important. The symmetric specification provides a common baseline for comparing the two assessment procedures, while DecideIT evaluates the admissible weight intervals jointly. Separate sensitivity analyses subsequently examine the leverage of individual criterion weights.
The same observation applies to numerical criterion assessments. A specific value (or an interval) on a scale does not make an originally qualitative judgment objectively precise. The scale is a representation chosen for analytical purposes. Its usefulness lies in making the interpretation explicit and allowing the consequences of that interpretation to be examined. A numerical model can therefore be transparent without claiming that the underlying policy evidence is precise.
Uncertainty enters MCDA at several levels. The consequences of an alternative may be uncertain, the source material may be vague, analysts may disagree about how a verbal statement should be coded, and decision makers may be unwilling or unable to provide precise preference parameters. Forcing all such information into exact point estimates can create an appearance of precision that the evidence does not support. Interval-valued assessments offer one way of representing residual imprecision. An interval such as [+1, +3] indicates that the evidence is compatible with a range of values rather than one uniquely justified score.
An interval in this setting should not be confused with a statistical confidence interval unless it has been constructed through a statistical procedure. It instead represents the range of assessments regarded as reasonably consistent with the available evidence and interpretation. A narrow interval may reflect specific and internally consistent source information, while a wider interval may reflect vague, mixed, indirect, or conflicting statements. The interval therefore retains information that would be lost if every qualitative description were reduced to one exact value.
Sensitivity analysis provides another essential part of the MCDA process. A ranking obtained under one set of assessments and weights may be informative, but a responsible analysis should also examine whether the conclusion changes when uncertain or contestable assumptions are varied. A stable result remains unchanged across the examined ranges. A sensitive result changes when one or more assumptions are modified. Neither outcome is inherently good or bad: sensitivity may reveal that alternatives are genuinely close or that stakeholder priorities are decisive.
MCDA should therefore be understood as decision support rather than decision automation. The model does not discover the uniquely correct alternative independently of human judgment. It organises information and preferences so that their implications can be examined systematically. A ranking is conditional on the model structure, assessments, weights, and aggregation rule. Transparency consists of exposing these conditions, not in pretending that they disappear.
This perspective is consistent with the decision-support framework described by Borking and colleagues, where the purpose of formal analysis is to structure complex information, separate facts from values, and permit alternative assumptions to be examined explicitly [6]. In contested public decisions, this is particularly important. Different stakeholders may disagree about both expected consequences and the importance of the criteria. A useful model should permit these disagreements to be represented rather than concealing them in a single unexplained recommendation.
The DecideIT tool used in this study was developed for decision problems involving imprecise probabilities, values, and preferences. The original system supported interval-based and comparative information so that analysts were not forced to provide exact numerical judgments where the available knowledge did not justify them [19]. Later developments incorporated second-order belief-based evaluation, where probabilities and values may be represented through intervals, rankings, modal points, and other forms of incomplete information [20].
Second-order representations concern uncertainty about the values used in the decision model rather than only uncertainty about external events. Instead of calculating one aggregated number from one fixed set of inputs, the model represents a distribution of belief over possible expected values. This makes it possible to examine not only which alternative has the highest central evaluation but also how strongly the available information supports pairwise comparisons among alternatives.
The output can therefore distinguish between a large and secure advantage and a marginal lead under substantial uncertainty. Two alternatives may have different average values while still being difficult to separate confidently. This distinction is central in public planning. A small numerical advantage should not automatically be presented as a decisive superiority if the underlying assessments and weights permit substantial overlap.
The hybrid workflow explored in this paper provides three complementary forms of transparency. First, the Excel workbook provides input transparency by displaying all lower and upper assessment bounds in an explicit and inspectable matrix, while the accompanying ChatGPT-generated explanation documents the interpretations and coding judgments behind those values. Second, DecideIT provides preferential transparency by representing the weights and other preference assumptions separately from the performance assessments. Third, it provides computational transparency by applying a specified aggregation procedure and making the resulting values, pairwise comparisons, belief distributions, and sensitivity analyses inspectable.
Decisions concerning the criterion structure, scales, intervals, and weights remain consequential. However, these choices become visible and can be revised individually. A critic may argue that a particular interval is too narrow, that a criterion has been omitted, or that an alternative weighting scheme is more defensible. Such criticism can be incorporated into the model without abandoning the entire analytical framework.
2.3. Combining LLM-Based Extraction with MCDA Evaluation
The potential complementarity between LLMs and MCDA arises because the two technologies address different bottlenecks. While the tool-augmented LLM literature demonstrates the value of delegating computation and verification to external components [11,12,13,14], the present study examines the more specific question of using an LLM to prepare criterion-level evidence from a qualitative report for subsequent formal MCDA evaluation. MCDA provides an explicit structure for evaluating alternatives but ordinarily requires structured input. LLMs can produce that input from reports and other unstructured textual sources but do not, by themselves, provide a transparent normative aggregation procedure. A hybrid architecture assigns each component the task for which it is better suited. Recent work has begun to examine LLMs more directly within MCDA and AHP settings. Examples include using LLMs to generate criteria and pairwise judgments within an AHP evaluation framework [21], comparing ChatGPT-based supplier evaluations with conventional MCDM results [22], and benchmarking LLM-generated AHP criterion weights against human experts [23]. These studies place the LLM inside parts of the preference-elicitation or evaluative process, whereas the present workflow deliberately confines the LLM to extracting and structuring report-based performance evidence before normative aggregation is performed in the MCDA tool.
The proposed division of labour follows the central distinction introduced above. LLM-based summarisation and extraction perform epistemic compression by converting extensive textual evidence into a manageable analytical representation. MCDA performs normative aggregation by combining that representation with explicit preference information and a declared evaluation procedure.
In the proposed workflow, the source report remains the primary evidential basis. In the controlled experiment reported here, ChatGPT was supplied with the 19 terminal criteria and instructed to reconstruct their definitions and hierarchical relationships from the report without supplementing the report with external considerations. It then extracted the report evidence concerning the alternatives on those criteria and translated that evidence into interval-valued assessments. The numerical inputs were placed in an Excel matrix, while a separate Evidence sheet recorded the supporting report evidence, source location, and interval rationale for each assessment. DecideIT subsequently performed the aggregation, pairwise comparison, uncertainty representation, and sensitivity analysis. The intended boundary between the two components is therefore the completed performance-assessment matrix. The LLM may assist interactively in extracting, documenting, and revising the report-based performance information, but criterion weights, preference trade-offs, aggregation, and the resulting ranking are kept outside the LLM stage and handled explicitly in the MCDA process.
The spreadsheet is an important part of this architecture because it acts as a boundary object between linguistic interpretation and formal evaluation. Before the data enters the MCDA tool, all interval-valued assessments are displayed explicitly in a matrix, with separate minimum and maximum values for each alternative on each criterion. The workbook therefore makes the complete numerical input inspectable and directly importable. The Evidence sheet preserves the reasoning behind the intervals by recording, for each non-reference assessment, the relevant report evidence and page or section together with the rationale for the interval location and width.
In a normal operational decision process, these inputs should be reviewed by analysts and relevant stakeholders. Human reviewers would check whether the LLM identified the appropriate report passages, interpreted the direction of each criterion correctly, and selected defensible interval bounds. They might revise assessments, add missing evidence, or change the criterion structure before the formal evaluation. Such review need not repeat the complete extraction process from scratch: because each proposed assessment is linked to specific report evidence and a source location, the analyst can review the resulting candidate model cell by cell and return to the original report where an assessment appears doubtful or consequential. The efficiency gain therefore lies in replacing initial exhaustive extraction with targeted validation, not in eliminating human scrutiny. The LLM functions as a first-stage analyst rather than as an autonomous source of authoritative values.
The present study applies this architecture in a controlled comparison. ChatGPT was supplied with the 19 terminal criteria but not with the human panel’s assessments or their panel-derived numerical representation. The 2026 LLM-generated assessments were transferred to the MCDA model without human correction, although such validation would normally be required in an operational decision process. Separation in this comparison therefore refers to the fact that the 2026 criterion assessments were generated from the supplied report evidence without access to the panel assessments and under explicit instructions not to use external sources. This controls the information supplied during the experiment, but does not by itself exclude possible prior exposure to information about the Nord-Syd case through the model’s training data.
The 2011 model cannot be treated as an objective ground truth, since translating qualitative policy language into analytical assessments necessarily involves interpretation. The relevant empirical concept is therefore convergence rather than accuracy. The comparison examines whether assessment sets produced by two different procedures show similar criterion-level ordering patterns and aggregate conclusions when the terminal criteria, preference scale, weighting scheme, and MCDA procedure are held constant. A high degree of convergence would indicate that the LLM can perform a substantial proportion of the preparatory assessment work without producing materially different criterion-level ordering patterns or aggregate conclusions; it would not establish that either assessment is objectively correct.
The proposed architecture therefore combines efficiency with contestability. The LLM can reduce the work required to convert a lengthy report into structured candidate assessments. The spreadsheet exposes those assessments for inspection. The MCDA tool separates the performance information from the weighting assumptions and produces reproducible aggregated results. Sensitivity analysis then shows how strongly the conclusions depend on individual preference parameters.
The architecture does not remove judgment from decision making. It redistributes judgment across visible stages. The LLM interprets the source language; analysts normally review that interpretation; decision makers or stakeholders provide or examine preference assumptions; and the MCDA tool calculates the implications of those inputs. Each contribution can be evaluated according to its own role rather than being merged into one fluent but opaque recommendation.
This division of labour provides the conceptual basis for the Nord-Syd case study. The study does not ask whether ChatGPT can independently decide which Stockholm road alternative should have been selected. It asks whether ChatGPT can reconstruct the assessment basis of an existing qualitative report closely enough that a formal MCDA evaluation produces conclusions comparable to those obtained from the pre-existing human-panel model. The following section describes how this comparison was implemented.
3. Case Study
3.1. The Nord-Syd Decision and the LLM–MCDA Workflow
The Swedish Road Administration’s report [5] was tasked with identifying the corridor that would best connect the northern and southern parts of the Stockholm region without further burdening the central city, while also improving accessibility, supporting employment and housing integration, enabling a multi-centred region, and contributing to development in a fast-growing metropolitan area. The report evaluated three principal alternatives against a zero-action reference case without expanded road capacity. The report’s own base table recorded large substantive differences among the options, including road lengths, tunnel lengths, and construction costs in 2003 prices.
The report evaluated the alternatives against a mixed set of goals. For the first eight terminal criteria, the human panel used binary Yes/No assessments, while criteria 9–19 were assessed using the ordinal categories −−, −, 0, +, and ++, with some intermediate assessments such as 0/+, 0/−, and +/−. It also noted that the different goals could be assigned different weights and that the qualitative ratings therefore could not legitimately be summed without an explicit weighting and aggregation model. The report consequently provided a rich evidential basis for comparing the alternatives, but not a procedure for producing an aggregate ranking across the objectives. ChatGPT was supplied with the list of 19 terminal criteria available to the human panel and was tasked with reconstructing their definitions and hierarchical relationships from the report without adding, removing, splitting, or merging terminal criteria. It then translated the report’s qualitative evidence concerning the alternatives into interval-valued assessments and generated an Excel matrix for direct import into DecideIT. The four alternatives formed the rows, while each of the 19 criteria was represented by two adjacent columns containing the minimum and maximum bounds of the interval-valued assessment, giving 38 assessment columns in total. Nollalternativet was fixed at [0, 0] throughout, leaving 57 non-reference assessments generated by the LLM. The workbook also contained an Evidence sheet documenting the report basis, page or section, and interval rationale for each non-reference assessment. The interval width was not intended as a statistical confidence interval, nor as an objectively measured degree of uncertainty.
The present case study operationalises that insight with an LLM-mediated workflow using the supplied ChatGPT-prepared Excel workbook as the interface between narrative text and formal evaluation. The workflow is simple but methodologically meaningful:
- (1)
- Source formation. The Nord-Syd report provides the original alternatives, project goals, and comparative narratives.
- (2)
- LLM-assisted extraction and workbook generation. ChatGPT was instructed to use the supplied list of 19 terminal criteria and to reconstruct their definitions and hierarchical relationships from the original report, without introducing information from external sources. It then translated the report’s qualitative evidence concerning the alternatives into interval-valued assessments and generated an Excel matrix for direct import into DecideIT. The four alternatives formed the rows, while each of the 19 criteria was represented by two adjacent columns containing the minimum and maximum bounds of the interval-valued assessment, giving 38 assessment columns in total. Nollalternativet was fixed at [0, 0] throughout, leaving 57 non-reference assessments generated by the LLM. The workbook also contained an Evidence sheet documenting the report basis, page or section, and interval rationale for each non-reference assessment.
- (3)
- Human validation. In general use, the spreadsheet remains editable and auditable, allowing an analyst to inspect and revise each interval in light of the report. Human correction was deliberately omitted in the present experiment: all LLM-generated assessments and interval widths were transferred unchanged to the MCDA model, and no criterion assessment was revised after comparison with the panel-derived 2011 values.
- (4)
- MCDA evaluation. DecideIT reads the Excel file and computes rankings, pairwise superiority information, and uncertainty visualisations.
The important point is not automation for its own sake, but the separation of roles. ChatGPT converts a complex report into a structured candidate model, while DecideIT performs the subsequent decision analysis. Figure 1 summarises the comparative workflow. The 2011 pathway starts from the human panel’s binary and ordinal assessments, which are mapped by a fixed rule to the common −5 to +5 preference scale. The 2026 pathway starts from the report-based LLM assessments, with the human panel’s assessments withheld. Both pathways use Nollalternativet (Zero/No Action) as the common reference and subsequently enter the same DecideIT evaluation procedure.
Figure 1.
Comparative workflow for the Nord-Syd case.
The LLM-extracted decision basis was used for a new decision analysis conducted in 2026. This was not the first MCDA evaluation of the Nord-Syd report. The same source report had previously been analysed in 2011 using the same MCDA tool and essentially the same report-derived decision structure [6]. As mentioned above, the original human panel used binary Yes/No assessments for the first eight criteria and ordinal qualitative assessments for criteria 9–19, principally using the categories −−, −, 0, +, and ++ together with intermediate expressions such as 0/+, 0/−, and +/−. For the comparison of the 2011 DecideIT analysis, these panel assessments were mapped directly onto interval-valued assessments on a −5 to +5 preference scale. The mapping was rule-based: for example, ++ was represented by [+3, +5], + by [+1, +3], 0 by [−1, +1], − by [−3, −1], and −− by [−5, −3], with corresponding intervals used for the intermediate categories. The resulting 2011 panel-derived model is therefore directly comparable numerically with the 2026 LLM-generated model, since both use the same −5 to +5 preference scale with Nollalternativet fixed at [0, 0] as the common reference alternative. The availability of the earlier panel assessments therefore made it possible to compare the 2026 LLM-generated assessments with pre-existing human judgments derived from the same source material, rather than assessing the LLM-generated model only in isolation. As a sensitivity check on this numerical representation, the convergence measures were also recalculated using an alternative equally spaced point-anchor mapping: −− = −5, − = −2.5, 0 = 0, + = +2.5, and ++ = +5, with 0/− = −1.25, 0/+ = +1.25, and +/− = 0; Yes and No were represented as +2.5 and −2.5, respectively. This point-valued mapping was used only as a robustness check and not as an alternative DecideIT representation, since it deliberately removes the interval-valued uncertainty retained in the main analysis.
To isolate the effect of the information-extraction method, the panel-derived 2011 model and the 2026 LLM-generated model were evaluated using the same equal-local-weight scheme. Within each group of sibling criteria, identical imprecise local-weight specifications were assigned under their common parent node, subject to local normalisation. Because the criteria tree is hierarchical, this does not give all terminal criteria identical global weights. The scheme was selected as a transparent common baseline, not as a claim that all criteria are normatively equally important. Holding the criteria hierarchy, aggregation method, and weighting scheme constant prevents differences in stakeholder preferences or analyst-selected weights from confounding the comparison between the panel-derived and LLM-generated assessment procedures. For the same reason, the study does not compare alternative MCDA aggregation methods. Varying the decision method, number of alternatives, or criteria structure would introduce additional experimental factors and would address the robustness of the hybrid approach across decision settings rather than the present question of convergence between two assessment procedures for the same fixed case.
3.2. From Report Text to the Excel Workbook
The report was not first summarised as free prose and then manually converted into a spreadsheet. Instead, ChatGPT was instructed to use the four alternatives and the supplied list of 19 terminal criteria and to translate the report evidence concerning the alternatives into interval-valued assessments in an Excel matrix suitable for import into DecideIT. The four alternatives formed the rows, while each of the 19 criteria was represented by two adjacent columns containing the lower and upper bounds of the interval-valued assessment. Nollalternativet was fixed at [0, 0] throughout, leaving 57 non-reference assessments generated by the LLM. The LLM assessment was conducted through the ChatGPT web interface in August 2026 using OpenAI GPT-5.6 Sol with High reasoning effort. No API was used, and the ChatGPT interface did not expose a separate model-build or interface-version identifier to the user.
For every non-reference alternative–criterion combination, ChatGPT was instructed to derive a minimum and maximum value from the qualitative evidence in the report. Each alternative row consequently contained 19 pairs of interval bounds. The completed assessment matrix was imported into DecideIT without intermediate manual correction of the LLM-generated values. The prompts used for the 2026 LLM assessment are reproduced in Appendix A. Documenting the prompt makes the task specification inspectable and facilitates replication attempts, but it does not imply that an LLM will generate identical numerical assessments in every run. The prompt protocol should therefore be understood as part of the experimental specification rather than as a deterministic algorithm. Despite these instructions, the chatbot occasionally provided opinions on rankings, possible advantages of alternatives, and other “helpful” information. Such unsolicited material was not transferred to DecideIT; only the interval assessment matrix was used as MCDA input.
The workbook contained both the structured assessment matrix required by DecideIT and a separate Evidence sheet documenting the basis for each of the 57 non-reference assessments. For every assessment, the Evidence sheet records the alternative and criterion, the minimum and maximum values, a brief account of the supporting report evidence, the relevant report page or section, and the rationale for both the interval location and its width. The numerical assessment matrix was used for import into DecideIT, while the Evidence sheet preserved the LLM’s report-based justification for the generated values. Appendix B reports all 57 non-reference assessments from both the panel-derived 2011 model and the 2026 LLM model, permitting the numerical comparison to be reproduced directly from the paper; a sample of the corresponding Evidence-sheet documentation is provided in Appendix C. Criterion weights, aggregation, sensitivity analysis, and the final ranking were handled subsequently in DecideIT.
In the 2026 comparative experiment, the workbook generated through this procedure was transferred to DecideIT without human correction of the LLM-generated assessments. It is important to underscore that the human panel’s Yes/No and qualitative assessments, as well as their numerical representation in the 2011 model, were withheld from ChatGPT and were not included in the prompt or used as examples during the extraction process. As an additional diagnostic, ChatGPT was subsequently probed in a separate session without the report, supplied documents, web search, or external tools. It reported only limited and uncertain general familiarity with the Nord-Syd case and no usable pre-existing knowledge of the 2011 panel assessments, their coding scheme, numerical representation, or resulting ranking. This, of course, differs from the recommended operational workflow, in which an analyst would normally check the extracted evidence and revise questionable codings before evaluation. Human correction was omitted here so that the separately produced LLM model could be compared with the panel-derived 2011 model without contamination from subsequent analyst intervention.
Convergence between the panel-derived and LLM-generated assessments was examined at two levels. First, criterion-level ordering was compared for each of the three pairs of active alternatives within each of the 19 criteria. The midpoint of each panel-derived interval and each 2026 LLM interval was used to classify the corresponding pair as higher, lower, or tied, yielding 57 pairwise ordering relations. The panel-derived assessments implied 31 strict relations and 26 ties. Agreement in these relations was therefore assessed using directional consistency for the 31 strict panel-implied relations, exact three-state agreement (higher, lower, or tied) across all 57 relations, and unweighted Cohen’s κ as a chance-corrected measure of three-state agreement. In addition, Kendall’s τ_b was calculated across the 57 pairs of panel-derived and LLM interval midpoints to quantify their rank association while accounting for ties. Second, scale and reference-point agreement was examined across the 57 non-reference alternative–criterion assessments by calculating the proportion of overlapping 2011 and 2026 intervals and the mean absolute difference between their interval midpoints. The two levels address different questions: similarity in criterion-level relative ordering and similarity in numerical calibration relative to Nollalternativet.
4. Results
4.1. The Criteria Tree
The four alternatives and the list of 19 terminal criteria were supplied to ChatGPT as part of the experimental setup, since the report pages revealing the human panel’s assessments had been withheld. ChatGPT was instructed to use these 19 terminal criteria without adding, removing, splitting, or merging them and to reconstruct their definitions and hierarchical relationships from the remaining report. The resulting hierarchy corresponded to that used in the panel-derived 2011 model, enabling a direct comparison while keeping the panel’s criterion assessments hidden from the LLM. Figure 2 shows the first level of criteria in the tree.
Figure 2.
First level of criteria in the tree (CH stands for sub-criteria hierarchy).
4.2. Interpreting the DecideIT Outputs
The baseline DecideIT analyses used the equal-local-weight scheme described in Section 3.1. To permit a direct comparison, the panel-derived 2011 model and the 2026 LLM-generated model were represented on the same −5 to +5 preference scale, with Nollalternativet fixed at [0, 0], and were evaluated using the same criteria hierarchy, MCDA procedure, and locally normalised weights. The 2011 intervals were obtained through a fixed rule-based mapping of the human panel’s binary and ordinal assessments, whereas the 2026 intervals were generated directly by ChatGPT from the report evidence. Figure 3 and Figure 4 present the results from the two models side by side. Any differences between the displayed outputs originate from the separately produced assessment inputs since weights and aggregation procedures were held constant.
Figure 3.
Aggregated values and pairwise confidence markers: (top) 2011 panel-derived model, (bottom) 2026 LLM-generated model. Alt. 1 denotes Förbifart Stockholm, Alt. 2 Diagonal Ulvsunda, Alt. 3 Kombinationsalternativet, and Alt. 4 Nollalternativet.
Figure 4.
Interval ranges for 90% belief mass: (left) 2011 panel-derived model, (right) 2026 LLM-generated model. Alt. 1 denotes Förbifart Stockholm, Alt. 2 Diagonal Ulvsunda, Alt. 3 Kombinationsalternativet, and Alt. 4 Nollalternativet.
The strongest directional consistency was found for the strict ordering relations implied by the panel-derived assessments. Across the 19 criteria, these assessments implied 31 strict pairwise ordering relations and 26 ties among Förbifart Stockholm, Diagonal Ulvsunda, and Kombinationsalternativet. All 31 strict relations were reproduced in the same direction by the 2026 LLM interval midpoints. Of the 26 panel-derived ties, 12 were also ties in the LLM midpoints, while 14 were differentiated by the LLM. Thus, directional consistency conditional on the strict panel-implied relations was 31/31, whereas exact three-state relation agreement across all 57 pairwise comparisons was 43/57 (75.4%; binomial 95% interval: 62.2–85.9%). Chance-corrected three-state agreement was Cohen’s κ = 0.640, and the rank association between the 57 panel-derived and LLM interval midpoints was Kendall’s τb = 0.723. Numerical calibration relative to the common [0, 0] reference point showed a different pattern. Of the 57 non-reference alternative–criterion interval pairs, 50 (87.7%; binomial 95% interval: 76.3–94.9%) overlapped between the panel-derived 2011 model and the 2026 LLM model. Because the 57 comparisons share criteria and alternatives and are therefore not statistically independent, these intervals are reported only as descriptive uncertainty ranges rather than as population-level inferential confidence intervals. Under the alternative equally spaced point-anchor mapping, directional consistency remained 31/31, exact three-state agreement remained 43/57 (75.4%), Cohen’s κ remained 0.640, and Kendall’s τb remained 0.723; the mean absolute midpoint difference changed only from 1.12 to 1.14 points. The LLM therefore did not reverse any strict ordering relation implied by the panel-derived assessments, but it frequently differentiated alternatives that the panel-derived assessments treated as tied.
Figure 3 compares the aggregated values and pairwise superiority confidence obtained from the two models on the scale [−5, +5]. In the 2026 model, the displayed aggregate values are 1.5190 for Förbifart Stockholm, 1.3452 for Diagonal Ulvsunda, 0.3810 for Kombinationsalternativet, and 0 for Nollalternativet. The corresponding 2011 values are 1.1667, 1.5952, −0.5048, and 0, respectively. Both analyses therefore place Förbifart Stockholm and Diagonal Ulvsunda as the top two alternatives, while the Combination Alternative and the Null Alternative remain far behind. The pairwise confidence markers provide additional information about the strength of these comparisons. In both models, Förbifart Stockholm and Diagonal Ulvsunda are well separated from the two lower-ranked alternatives (more than 90% confidence), whereas the support for ranking between Förbifart Stockholm and Diagonal Ulvsunda is inconclusive. The same broader pattern remains visible in both models: the two leading alternatives are close to one another but clearly stronger than the two lower-ranked alternatives.
Figure 4 shows 90% belief-mass intervals for the aggregated value of each alternative on the scale [−5, +5]. Each displayed interval contains 90% of the represented second-order belief mass for that alternative’s aggregated value. Again, it can be seen that the top two alternatives overlap and the distance to the other two is substantial. However, the ordering within both clusters differs between the two evaluations and no decisive conclusion about the ranking of the top two alternatives can be drawn from either evaluation.
Weight sensitivity was examined at two levels. First, the interval-valued weight specification is evaluated jointly by DecideIT over the admissible weight space, subject to the specified bounds and local normalisation constraints. Second, separate tornado analyses varied each criterion weight individually between its lower and upper bounds in order to identify its leverage on the evaluation of each alternative. These analyses were used as diagnostic robustness checks rather than as a separate empirical comparison between the 2011 and 2026 models. They showed broadly similar sensitivity patterns and did not displace Förbifart Stockholm and Diagonal Ulvsunda as the leading pair within the examined weight ranges.
5. Discussion
These results illustrate an important contribution of the MCDA tool: it reports not only the ordering of the alternatives, but also the degree of support for the individual pairwise comparisons. A ChatGPT-only answer could easily compress this into “Förbifart Stockholm and Diagonal Ulvsunda are the two leading alternatives,” which would be directionally consistent with both analyses yet methodologically insufficient. ChatGPT could also be explicitly prompted to provide pairwise comparisons between the alternatives. The distinction is therefore not whether an LLM can generate pairwise statements, but how those statements are obtained. In DecideIT, the pairwise results are derived reproducibly from the declared criterion assessments, weights, uncertainty representation, and aggregation procedure rather than generated as an additional language-model judgment. DecideIT therefore shows not only which alternative is preferred to another, but also the degree of support produced by the specified decision model. Under the common equal-local-weight baseline, both models clearly separate the two lower-ranked alternatives from Förbifart Stockholm and Diagonal Ulvsunda, while the two leading alternatives remain comparatively close. Accordingly, this single-case study takes no position on the general reliability of LLM-based MCDA extraction in either direction: it neither confirms nor refutes such reliability, which lies outside the scope of the present design.
The more extensive 2011 study also examined alternative weighting structures and found that Diagonal Ulvsunda became particularly competitive when environmental criteria received greater weight [6]. Those analyses addressed a different question from the controlled comparison reported here. In the present comparison, the same equal-local-weight scheme is applied to both the 2011 panel-derived model and the 2026 LLM-generated model in order to isolate the effect of the assessment procedure. The earlier scenario analyses nevertheless illustrate why the transparent workbook and DecideIT’s sensitivity functions remain important in operational use: once stakeholder-specific priorities are introduced, the resulting ranking may depend on the adopted weight structure.
The hybrid architecture made four features of the decision-support process explicit that would not be represented by a stand-alone narrative recommendation. First, it makes the path from report interpretation to criterion coding inspectable through the numerical matrix and accompanying explanation. Second, it externalises preference handling so that weights can be debated by stakeholders rather than guessed by the model. Third, it renders uncertainty visible through intervals, pairwise support, and belief-mass ranges. Fourth, it improves contestability: critics can challenge a score, a weight, or a structural assumption without having to reject the whole analytical framework. DecideIT was explicitly built to work with imprecise values, comparative judgments, and second-order belief distributions [19,20]. It is therefore well suited to representing the residual ambiguity that remains after the LLM has extracted and organised the report evidence. ChatGPT can structure and interpret the evidence, but by itself it does not provide the explicit aggregation, uncertainty handling, and sensitivity analysis required for transparent decision support. In the present study, these functions were supplied by DecideIT.
The comparison does not establish that either the panel-derived 2011 model or the LLM-generated 2026 model is the more accurate representation of the report. The human panel’s qualitative judgments and the LLM’s interval assignments both involve interpretation of the report evidence, and the fixed numerical mapping of the panel judgments does not turn the 2011 model into an objective ground truth against which the LLM output can be scored. The comparison should therefore not be understood as an accuracy test between two competing models.
What can be assessed is the degree of convergence between the panel-derived and LLM-generated assessments when the criteria structure, weighting assumptions, and MCDA procedure are held constant. The strongest result concerns directional consistency for the strict ordering relations implied by the panel-derived assessments. Across the 19 criteria, these assessments implied 31 strict pairwise ordering relations and 26 ties among the three active alternatives. All 31 strict relations were reproduced in the same direction by the 2026 LLM interval midpoints. However, only 12 of the 26 panel-derived ties were also ties in the LLM midpoints. Thus, directional consistency conditional on the strict panel-implied relations was 31/31, while exact three-state agreement across all 57 pairwise ordering relations was 43/57 (75.4%). The corresponding chance-corrected agreement was Cohen’s κ = 0.640, while Kendall’s τb = 0.723 indicated substantial rank association between the panel-derived and LLM interval midpoints. Agreement in numerical calibration relative to Nollalternativet showed a different pattern: 50 of the 57 non-reference interval pairs (87.7%) overlapped, and the mean absolute difference between interval midpoints was 1.12 points on the −5 to +5 scale. The LLM therefore did not reverse any strict ordering relation implied by the panel-derived assessments, but it often differentiated alternatives that the panel-derived assessments treated as tied. Some of the largest calibration differences occur for land and water stewardship, the Saltsjö–Mälar section, investment, and create bypass, but they do not reflect a common directional bias. For the first eight criteria, an important source of numerical difference is the binary form of the original 2011 panel judgments. Yes and No were represented by the intervals [2,5] and [−5,−2], whereas the 2026 report-based extraction expressed graded, near-neutral, or mixed assessments. This is particularly visible for the Saltsjö–Mälar section and create bypass. For land and water stewardship, the difference mainly reflects how mixed evidence was calibrated relative to Nollalternativet: the report describes tunnelling as favourable for land stewardship while also stating that the reference alternative uses the least land and water resources. For investment, the 2011 qualitative category mapped to a strongly negative interval, whereas the 2026 assessment used the reported investment ranges to distinguish the magnitude of the three alternatives’ disadvantage relative to the reference. Thus, the largest discrepancies arise from differences in numerical calibration and in the resolution of the underlying evidence rather than from a consistent tendency of the LLM to score alternatives higher or lower. In this case study, the observed convergence shows that the LLM was able to serve as a practical first-stage instrument for extracting and structuring qualitative evidence for MCDA, while also showing why the generated numerical assessments should remain inspectable and open to human review. However, it cannot, by itself, make the trade-off structure normatively explicit in a way that is transparent and faithful to a declared decision rule. In the present study, this places the chatbot upstream of the decision calculation and downstream of the source text: as a translator from unstructured evidence into a structured decision model whose evaluative core is handled by MCDA rather than improvised in prose [9,14]. A subsequent no-document diagnostic probe found no usable recall of the 2011 panel assessments or their numerical representation, although such a probe cannot exclude latent exposure through the model’s training data.
These quantitative measures are descriptive of the present case and should not be interpreted as estimates of general LLM reliability. In particular, the 31/31 result measures directional consistency conditional on the 31 strict ordering relations implied by the panel-derived assessments; it excludes the 26 panel-derived ties and should therefore not be interpreted as 100% overall ordinal agreement. When ties are included, exact three-state agreement across all 57 pairwise ordering relations is 43/57 (75.4%). Neither measure is a claim about the general reliability rate of the LLM. The study uses one source report and one reported LLM assessment run and therefore does not estimate run-to-run variation, sensitivity to alternative prompt formulations, or generalisation across decision domains. Estimating those properties would require a multi-case benchmark with controlled prompt variations and repeated runs. The study likewise does not test whether the observed convergence would persist with other MCDA methods or with decision problems containing different numbers or structures of alternatives and criteria.
6. Concluding Remarks
The Nord-Syd case illustrates a useful division of labour between LLMs and MCDA tools. ChatGPT was able to read a complex policy document, reconstruct the meaning and hierarchy of the supplied report-derived criteria, locate the corresponding evidence, and translate that report evidence into interval-valued assessments in a structured Excel input file. In the present case, this provided a useful way of transforming lengthy, heterogeneous, and only partly structured source material into an explicit input for decision analysis.
The DecideIT analysis shows why that distinction matters. The results do not merely announce a winner. They show the strength of the alternatives, the closeness between Förbifart Stockholm and Diagonal Ulvsunda, the weaker position of the Combination and Null alternatives, the uncertainty represented by the interval-valued assessments, and the sensitivity of the outcome to changes in individual criterion weights. In the present study, these features were made explicit by the MCDA evaluation rather than by the preceding LLM extraction stage.
The comparison with the panel-derived 2011 model also defines what can and cannot be concluded from the study. Since neither coding constitutes an objective representation of the qualitative source material, the study cannot determine whether the human or LLM-generated model is intrinsically better. Its empirical contribution is instead the observed convergence between assessment sets produced by two different procedures. The principal result is substantial rather than exact convergence: the LLM did not reverse any strict ordering relation implied by the panel-derived assessments, while differences arose mainly in the treatment of ties and in numerical calibration relative to the reference alternative. The detailed agreement statistics are reported in Section 4.2. In this case study, the observed convergence indicates that the LLM was able to serve as a practical first-stage instrument for extracting and structuring qualitative evidence for MCDA, provided that the resulting numerical assessments remain transparent and open to subsequent human review. The LLM assessment was produced in a single experimental run, so the study does not estimate stochastic run-to-run variation in the generated intervals. The results should therefore be interpreted as evidence from this comparative case rather than as an estimate of the general reliability of LLM-based MCDA extraction.
The proposed LLM-to-MCDA architecture should therefore be understood as decision support rather than decision automation. In the workflow examined here, the LLM performs the preparatory extraction and organisation of the decision basis; the MCDA tool performs the transparent evaluative aggregation; and the human analyst remains responsible for validation, weighting, interpretation, and final judgment. In the comparative experiment reported here, human correction was deliberately omitted to preserve the procedural separation between the LLM-generated assessments and subsequent analyst intervention. In operational use, however, such review would remain an essential part of the workflow. In the workflow examined here, the fluency of the LLM is combined with an explicit and inspectable decision model; this separation of roles is the principal architectural contribution illustrated by the case.
Funding
The author was partially funded by the European Commission research programme Horizon Europe, grant agreement 101074075.
Data Availability Statement
The complete criterion-level assessment matrices used in the comparison are reported in Appendix B, the prompt protocol is reproduced in Appendix A, and representative Evidence-sheet documentation is provided in Appendix C. The complete 2026 assessment workbook with its Evidence sheet, the original human-panel assessments underlying the 2011 model, and the corresponding analysis files are available from the author on request. See [6] for details of the original 2011 DecideIT analysis.
Conflicts of Interest
The author declares no conflicts of interest.
Abbreviations
The following abbreviations are used in this manuscript:
| MCDA | Multi-criteria Decision Analysis |
| LLM | Large Language Model |
| Tillgänglighet | Accessibility |
| Saltsjö–Mälarsnittet | Saltsjö–Mälar section |
| Centrala delarna | Central parts |
| Skapa förbifart | Create bypass |
| Infartsleder | Access roads |
| Gemensam marknad | Common market |
| Flerkärnighet | Multi-centre structure |
| Förutsättningar för utveckling | Basis for development |
| Färre döda och svårt skadade | Fewer fatalities and seriously injured |
| Förbättra för kvinnor | Improved conditions for women |
| Hälsa | Health |
| Säkerhet | Safety |
| Natur, kulturmiljö och friluftsliv | Nature, cultural environment and recreation |
| Klimatmål | Climate targets |
| Hushållning med mark och vatten | Land and water resource stewardship |
| Hushållning med energi och material | Energy and materials stewardship |
| Investering | Investment |
| Drift och underhåll | Operation and maintenance |
| Samhällsekonomi | Socio-economic efficiency |
Appendix A
The prompts below are the ones used in the 2026 LLM assessment. The consolidated list of 19 terminal criteria was supplied separately because the report page containing that list also revealed the human panel’s assessments and was therefore withheld from the source document. The panel assessments themselves were not supplied to the LLM.
Appendix A.1. Prompt 1: Extraction of the Report-Defined Decision Structure
Read the supplied Nord-Syd report as the source document for a multi-criteria decision analysis. Identify and use the alternatives, objectives, criteria, and hierarchical relationships presented in the report. Use only information contained in the report and do not introduce external alternatives, criteria, facts, or assumptions. Identify:
- the decision alternatives, including the reference or null alternative;
- the objectives and evaluation criteria used or implied in the report;
- any hierarchical relationships between main criteria and sub-criteria;
- the report passages supporting each identified criterion.
Present the result as a structured table containing the criterion name, criterion definition, direction of preference, parent criterion where applicable, and the relevant report page or section. Do not assign scores or weights at this stage. The supplied criterion list defines the 19 terminal evaluation criteria. Use the report to reconstruct their definitions and hierarchical relationships, but do not split, merge, add, or remove terminal criteria.
Appendix A.2. Prompt 2: Translation into Interval-Valued Assessments
Using the four alternatives and the 19 terminal criteria, assess each alternative on every terminal criterion using an interval-valued score on a −5 to +5 preference scale.
The four alternatives are:
- Förbifart Stockholm
- Diagonal Ulvsunda
- Kombinationsalternativet
- Nollalternativet (Zero/No Action)
Use only the supplied Nord-Syd report. Do not search the web, consult other reports, use later government decisions, consultation responses, background knowledge, or any other external source, even when such information could clarify or verify the report. The purpose is to assess exactly the information available to readers of the supplied document.
Treat the Nollalternativet as the reference alternative. It must receive the interval [0, 0] on every criterion.
For every other alternative, scores are relative to Nollalternativet on the same criterion:
- +5 = extremely/decisively better than Nollalternativet
- +4 = very substantially better
- +3 = clearly and substantially better
- +2 = moderately better
- +1 = slightly better
- 0 = no material difference supported by the report
- −1 to −5 = the corresponding degrees of worse performance.
The sign always represents preference, not the physical direction of the underlying measure. Thus, for criteria such as cost, emissions, fatalities, resource use, or environmental damage, a reduction relative to Nollalternativet is positive and an increase is negative.
For each alternative–criterion assessment:
- give a lower and upper bound;
- quote briefly or closely paraphrase the relevant report evidence;
- identify the report page or section;
- explain the location of the interval relative to zero;
- explain the width of the interval;
- explicitly state when the report does not provide enough information for a narrow assessment.
The interval represents the range of evaluations reasonably supported by the supplied report. It is not a statistical confidence interval and must not represent uncertainty arising merely from lack of confidence in your own reasoning.
Use interval width systematically:
- very narrow (width 0–1): direct quantitative evidence or an explicit, unambiguous comparative conclusion;
- moderate (width 2): clear qualitative evidence but no precise quantitative translation to the −5/+5 scale;
- wide (width 3 or more): incomplete, indirect, mixed, conflicting, or weak evidence.
Do not infer effects merely from the physical design of an alternative when the report itself evaluates that effect. Prefer the report’s explicit comparative assessment over your own engineering, economic, environmental, or transport-planning inference.
Do not assign criterion weights. Do not aggregate criteria or calculate an overall ranking.
Before finalising, perform a source-control check for all 57 non-reference assessments: verify that every score is supported solely by the supplied report and that no external information has entered the assessment.
Present the final numerical results in the supplied Excel template. Alternatives are rows 1–4 in the order given above. Columns cr1–cr19 correspond exactly to the 19 criteria listed above, each represented by a minimum and maximum column.
Also retain a separate evidence table containing, for each of the 57 non-reference assessments: alternative, criterion, min, max, report evidence, page/section, and interval rationale.
Appendix B. Criterion-Level Assessment Matrices
Table A1 reports the complete set of 57 non-reference interval assessments used in each model. The 2011 columns contain the interval representation of the human-panel assessments, while the 2026 columns contain the report-based LLM assessments transferred unchanged to DecideIT. Nollalternativet is not shown because it was fixed at [0, 0] as the common reference alternative in the present comparison.
Table A1.
Panel-derived 2011 and LLM-generated 2026 interval assessments.
Appendix C. Sample Evidence-Sheet Documentation
Table A2 reproduces six entries from the 2026 Evidence sheet. The examples were selected to provide equal representation of the three active alternatives and, for each alternative, to illustrate both close correspondence and a larger numerical difference between the panel-derived 2011 and LLM-generated 2026 assessments. The evidence text, page/section references, and interval rationales are reproduced from the 2026 workbook.
Table A2.
Sample documentation from the 2026 Evidence sheet.
References
- Wei, J.; Wang, X.; Schuurmans, D.; Bosma, M.; Ichter, B.; Xia, F.; Chi, E.; Le, Q.; Zhou, D. Chain-of-thought prompting elicits reasoning in large language models. arXiv 2022. [Google Scholar] [CrossRef] [Scilit]
- Wang, X.; Wei, J.; Schuurmans, D.; Le, Q.V.; Chi, E.H.; Narang, S.; Chowdhery, A.; Zhou, D. Self-consistency improves chain of thought reasoning in language models. arXiv 2023, arXiv:2203.11171. [Google Scholar]
- Bang, Y.; Cahyawijaya, S.; Lee, N.; Dai, W.; Su, D.; Wilie, B.; Lovenia, H.; Ji, Z.; Yu, T.; Chung, W.; et al. A multitask, multilingual, multimodal evaluation of ChatGPT on reasoning, hallucination, and interactivity. In Proceedings of the 13th International Joint Conference on Natural Language Processing and the 3rd Conference of the Asia-Pacific Chapter of the Association for Computational Linguistics; Association for Computational Linguistics: Stroudsburg, PA, USA, 2023; Volume 1, pp. 675–718. [Google Scholar]
- OpenAI; Achiam, J.; Adler, S.; Agarwal, S.; Ahmad, L.; Akkaya, I.; Aleman, F.L.; Almeida, D.; Altenschmidt, J.; Altman, S.; et al. GPT-4 Technical Report. arXiv 2023. [Google Scholar] [CrossRef] [Scilit]
- Vägverket. Nord-Sydliga Förbindelser I Stockholmsområdet: Sammanfattning Av Vägutredning; PM 2005 RIII (Dnr 314-2499/2005); Swedish Road Administration: Stockholm, Sweden, 2005. (In Swedish) [Google Scholar]
- Borking, K.; Danielson, M.; Davies, G.; Ekenberg, L.; Idefeldt, J.; Larsson, A. Transcending Business Intelligence; Sine Metu Productions: Stockholm, Sweden, 2011. [Google Scholar]
- Lipton, Z.C. The mythos of model interpretability. Commun. ACM 2018, 61, 36–43. [Google Scholar] [CrossRef] [Scilit]
- Miller, T. Explanation in artificial intelligence: Insights from the social sciences. Artif. Intell. 2019, 267, 1–38. [Google Scholar] [CrossRef] [Scilit]
- Lyu, Q.; Havaldar, S.; Stein, A.; Zhang, L.; Rao, D.; Wong, E.; Apidianaki, M.; Callison-Burch, C. Faithful chain-of-thought reasoning. In Proceedings of the 13th International Joint Conference on Natural Language Processing and the 3rd Conference of the Asia-Pacific Chapter of the Association for Computational Linguistics; Association for Computational Linguistics: Stroudsburg, PA, USA, 2023; Volume 1, pp. 305–329. [Google Scholar]
- Liu, N.F.; Zhang, T.; Liang, P. Evaluating verifiability in generative search engines. In Findings of the Association for Computational Linguistics: EMNLP 2023; Association for Computational Linguistics: Stroudsburg, PA, USA, 2023; pp. 7001–7025. [Google Scholar]
- Chen, W.; Ma, X.; Wang, X.; Cohen, W.W. Program of thoughts prompting: Disentangling computation from reasoning for numerical reasoning tasks. arXiv 2023, arXiv:2211.12588. [Google Scholar]
- Schick, T.; Dwivedi-Yu, J.; Dessì, R.; Raileanu, R.; Lomeli, M.; Zettlemoyer, L.; Cancedda, N.; Scialom, T. Toolformer: Language models can teach themselves to use tools. In Proceedings of the Advances in Neural Information Processing Systems 36, New Orleans, LA, USA, 10–16 December 2023. [Google Scholar]
- Yao, S.; Zhao, J.; Yu, D.; Du, N.; Shafran, I.; Narasimhan, K.; Cao, Y. ReAct: Synergizing reasoning and acting in language models. arXiv 2022. [Google Scholar] [CrossRef] [Scilit]
- Kambhampati, S.; Valmeekam, K.; Guan, L.; Verma, M.; Stechly, K.; Bhambhri, S.; Saldyt, L.; Murthy, A. LLMs can’t plan, but can help planning in LLM-modulo frameworks. Proc. Mach. Learn. Res. 2024, 235, 22895–22907. [Google Scholar]
- Keeney, R.L.; Raiffa, H. Decisions with Multiple Objectives: Preferences and Value Tradeoffs; Wiley: New York, NY, USA, 1976. [Google Scholar]
- Roy, B. Multicriteria Methodology for Decision Aiding; Kluwer Academic Publishers: Dordrecht, The Netherlands, 1996. [Google Scholar]
- Bouyssou, D.; Marchant, T.; Pirlot, M.; Perny, P.; Tsoukiàs, A.; Vincke, P. Evaluation and Decision Models: A Critical Perspective; Kluwer Academic Publishers: Boston, MA, USA, 2000. [Google Scholar]
- Ayan, B.; Abacıoğlu, S.; Basilio, M.P. A Comprehensive Review of the Novel Weighting Methods for Multi-Criteria Decision-Making. Information 2023, 14, 285. [Google Scholar] [CrossRef] [Scilit]
- Danielson, M.; Ekenberg, L.; Johansson, J.; Larsson, A. The DecideIT decision tool. In Proceedings of the Third International Symposium on Imprecise Probabilities and Their Applications; Carleton Scientific: Ottawa, ON, Canada, 2003; pp. 204–217. [Google Scholar]
- Danielson, M.; Ekenberg, L.; Larsson, A. DecideIT 3.0: Software for second-order based decision evaluations. Proc. Mach. Learn. Res. 2019, 103, 121–124. [Google Scholar]
- Lu, X.; Li, J.; Takeuchi, K.; Kashima, H. AHP-Powered LLM Reasoning for Multi-Criteria Evaluation of Open-Ended Responses. In Findings of the Association for Computational Linguistics: EMNLP 2024; Association for Computational Linguistics: Stroudsburg, PA, USA, 2024; pp. 1847–1856. [Google Scholar]
- Wang, X.; Wu, X. Can ChatGPT Serve as a Multi-Criteria Decision Maker? A Novel Approach to Supplier Evaluation. In Proceedings of the ICASSP 2024—2024 IEEE International Conference on Acoustics, Speech and Signal Processing, Seoul, Republic of Korea, 14–19 April 2024. [Google Scholar]
- Memduhoğlu, A.; Fulman, N.; Polat, N.; Ataş, T. Large language models as virtual experts? Evaluating AHP-based criteria weighting performance for solar power plant site selection. Expert Syst. Appl. 2026, 299, 130171. [Google Scholar] [CrossRef] [Scilit]
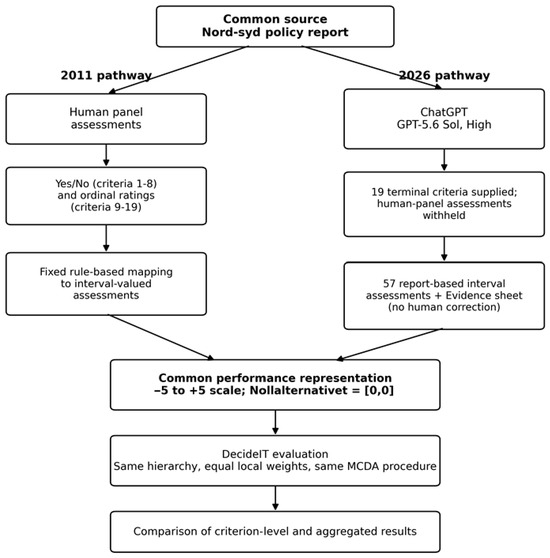
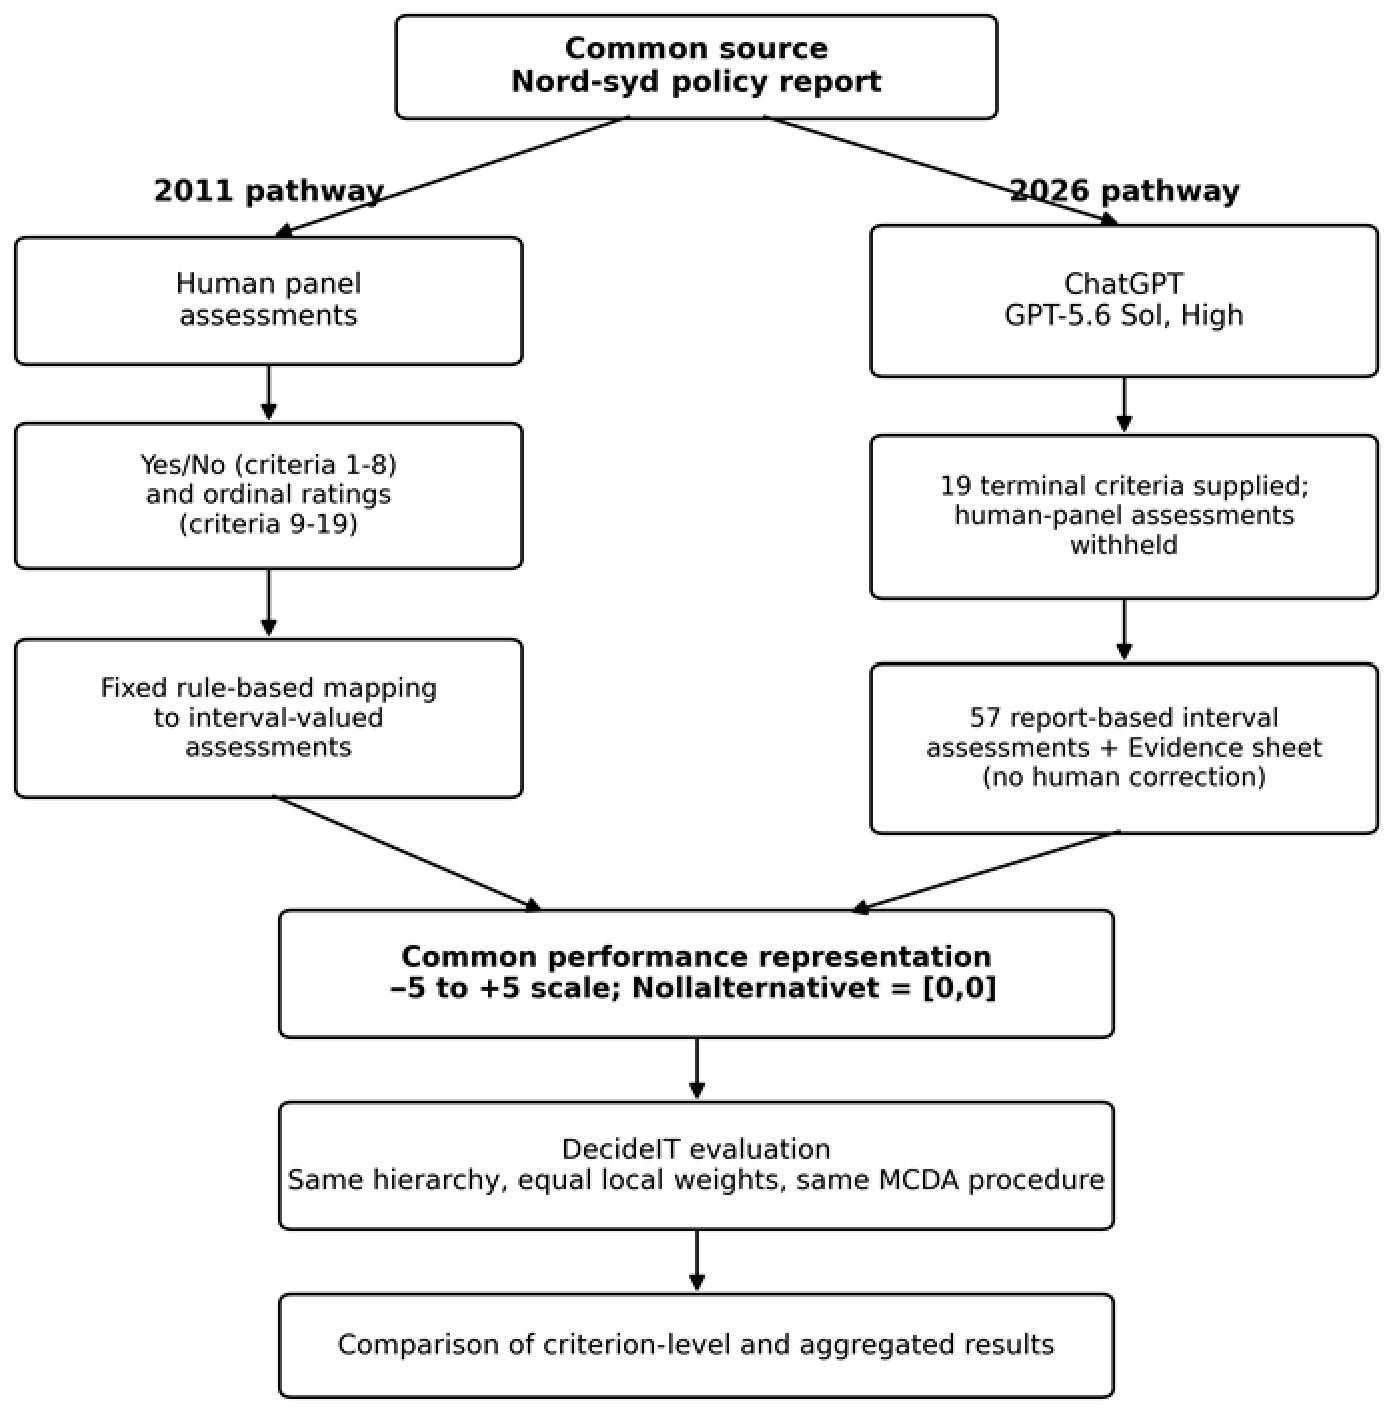
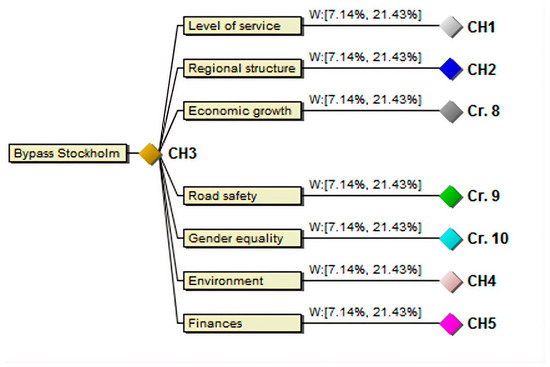
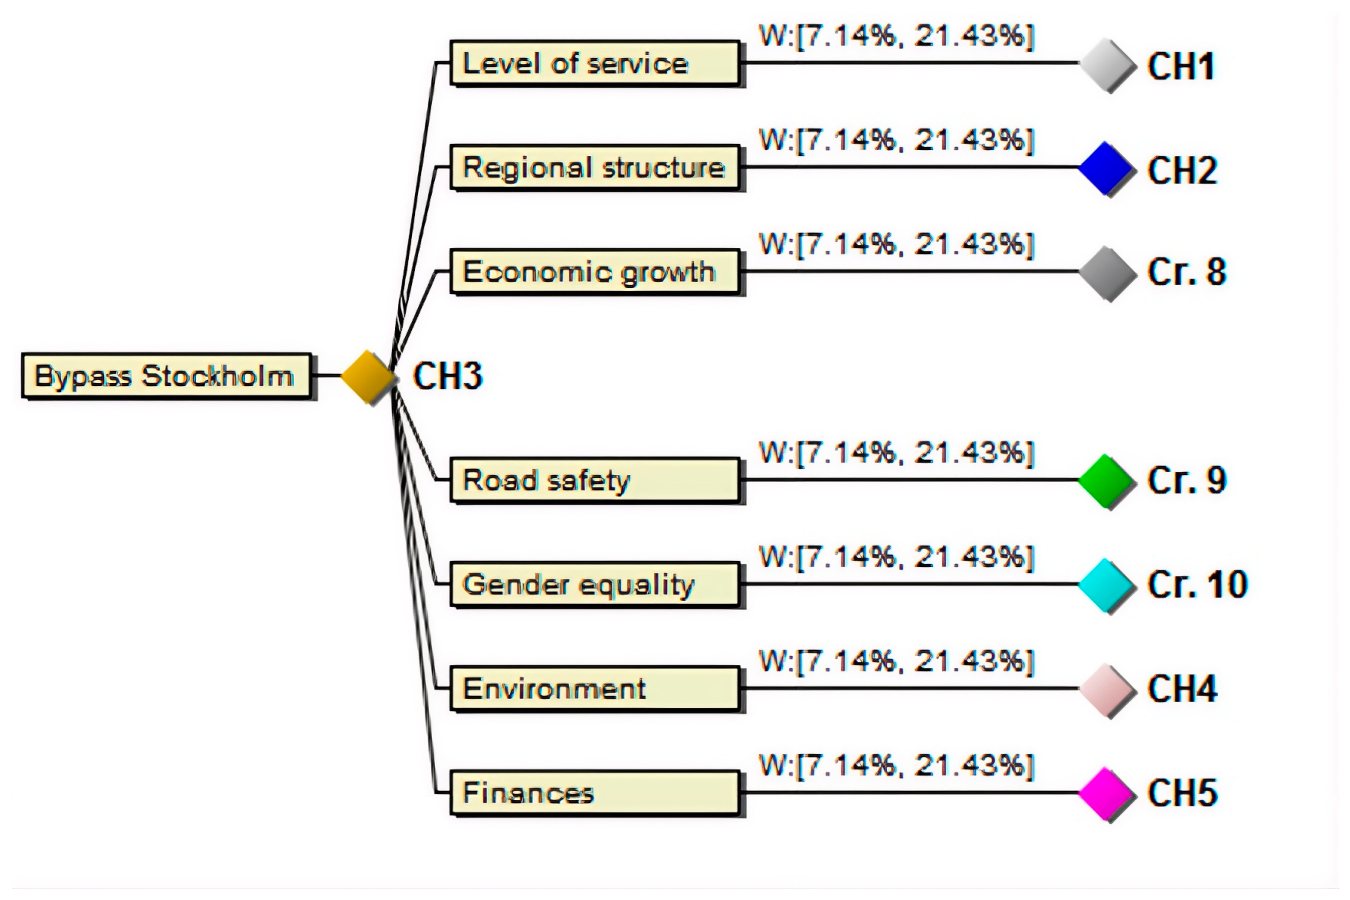
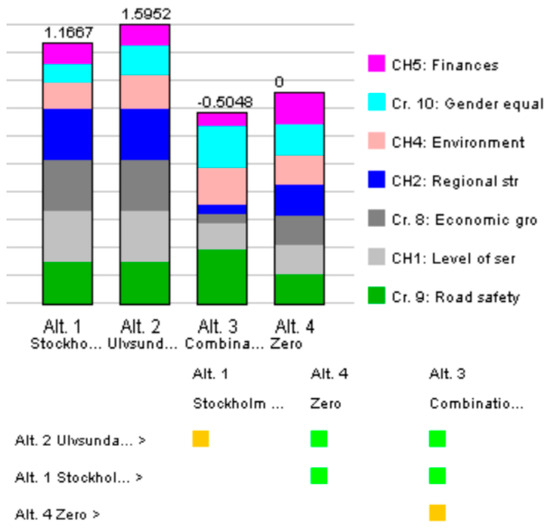
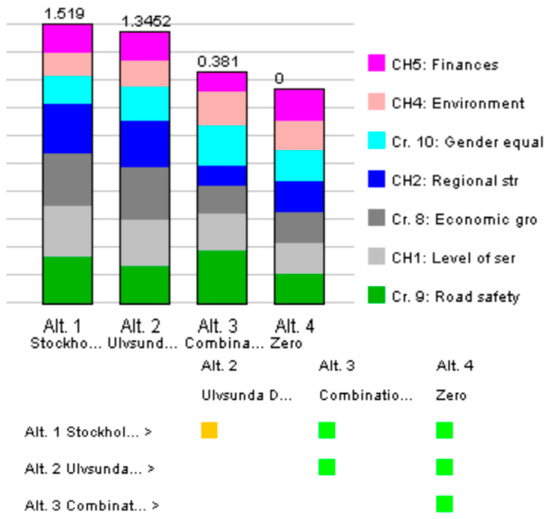
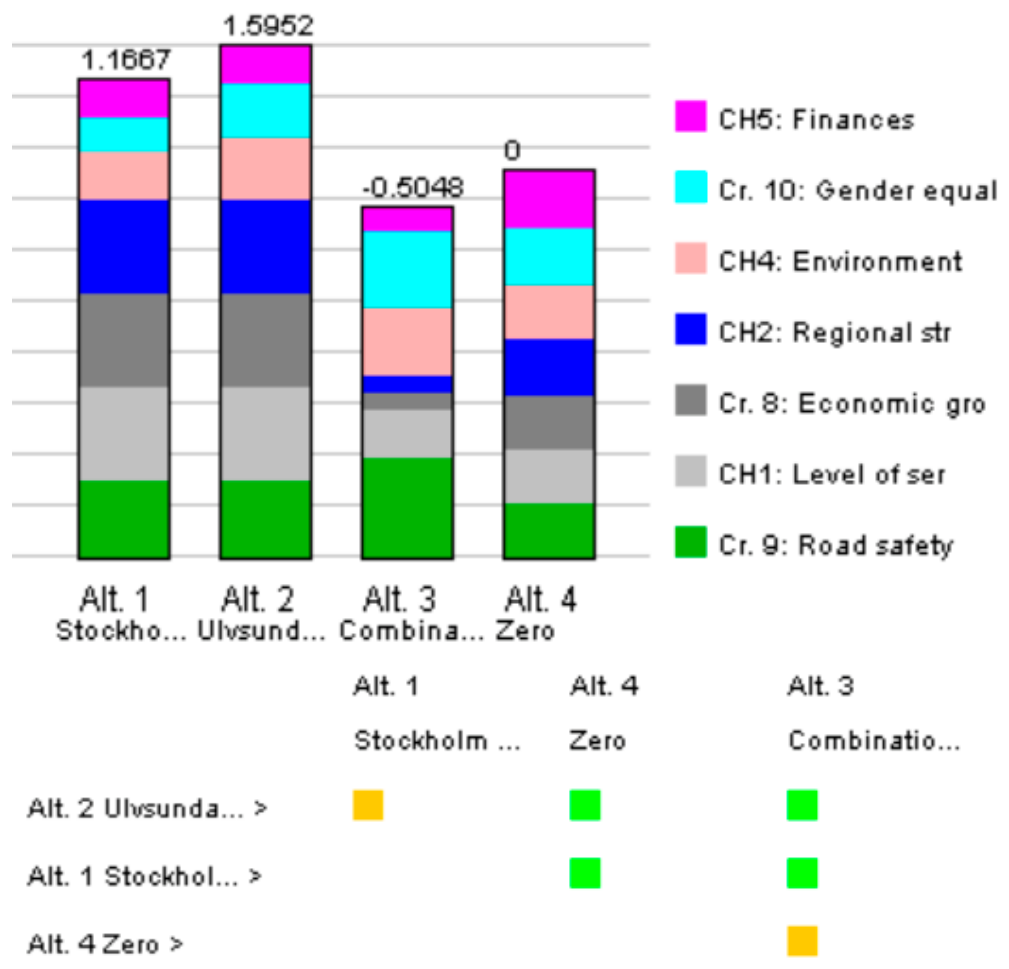
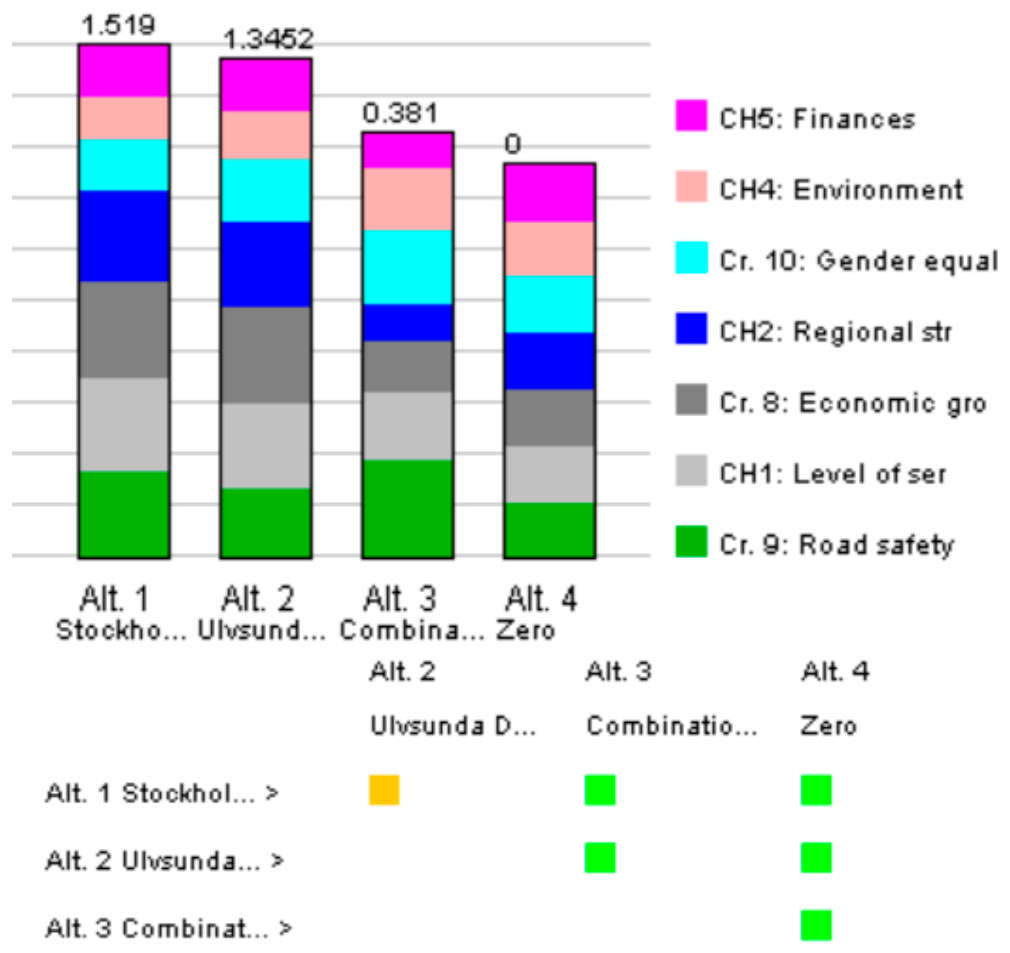
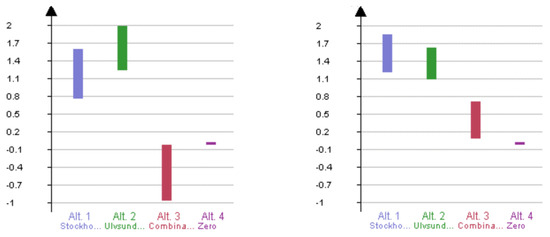
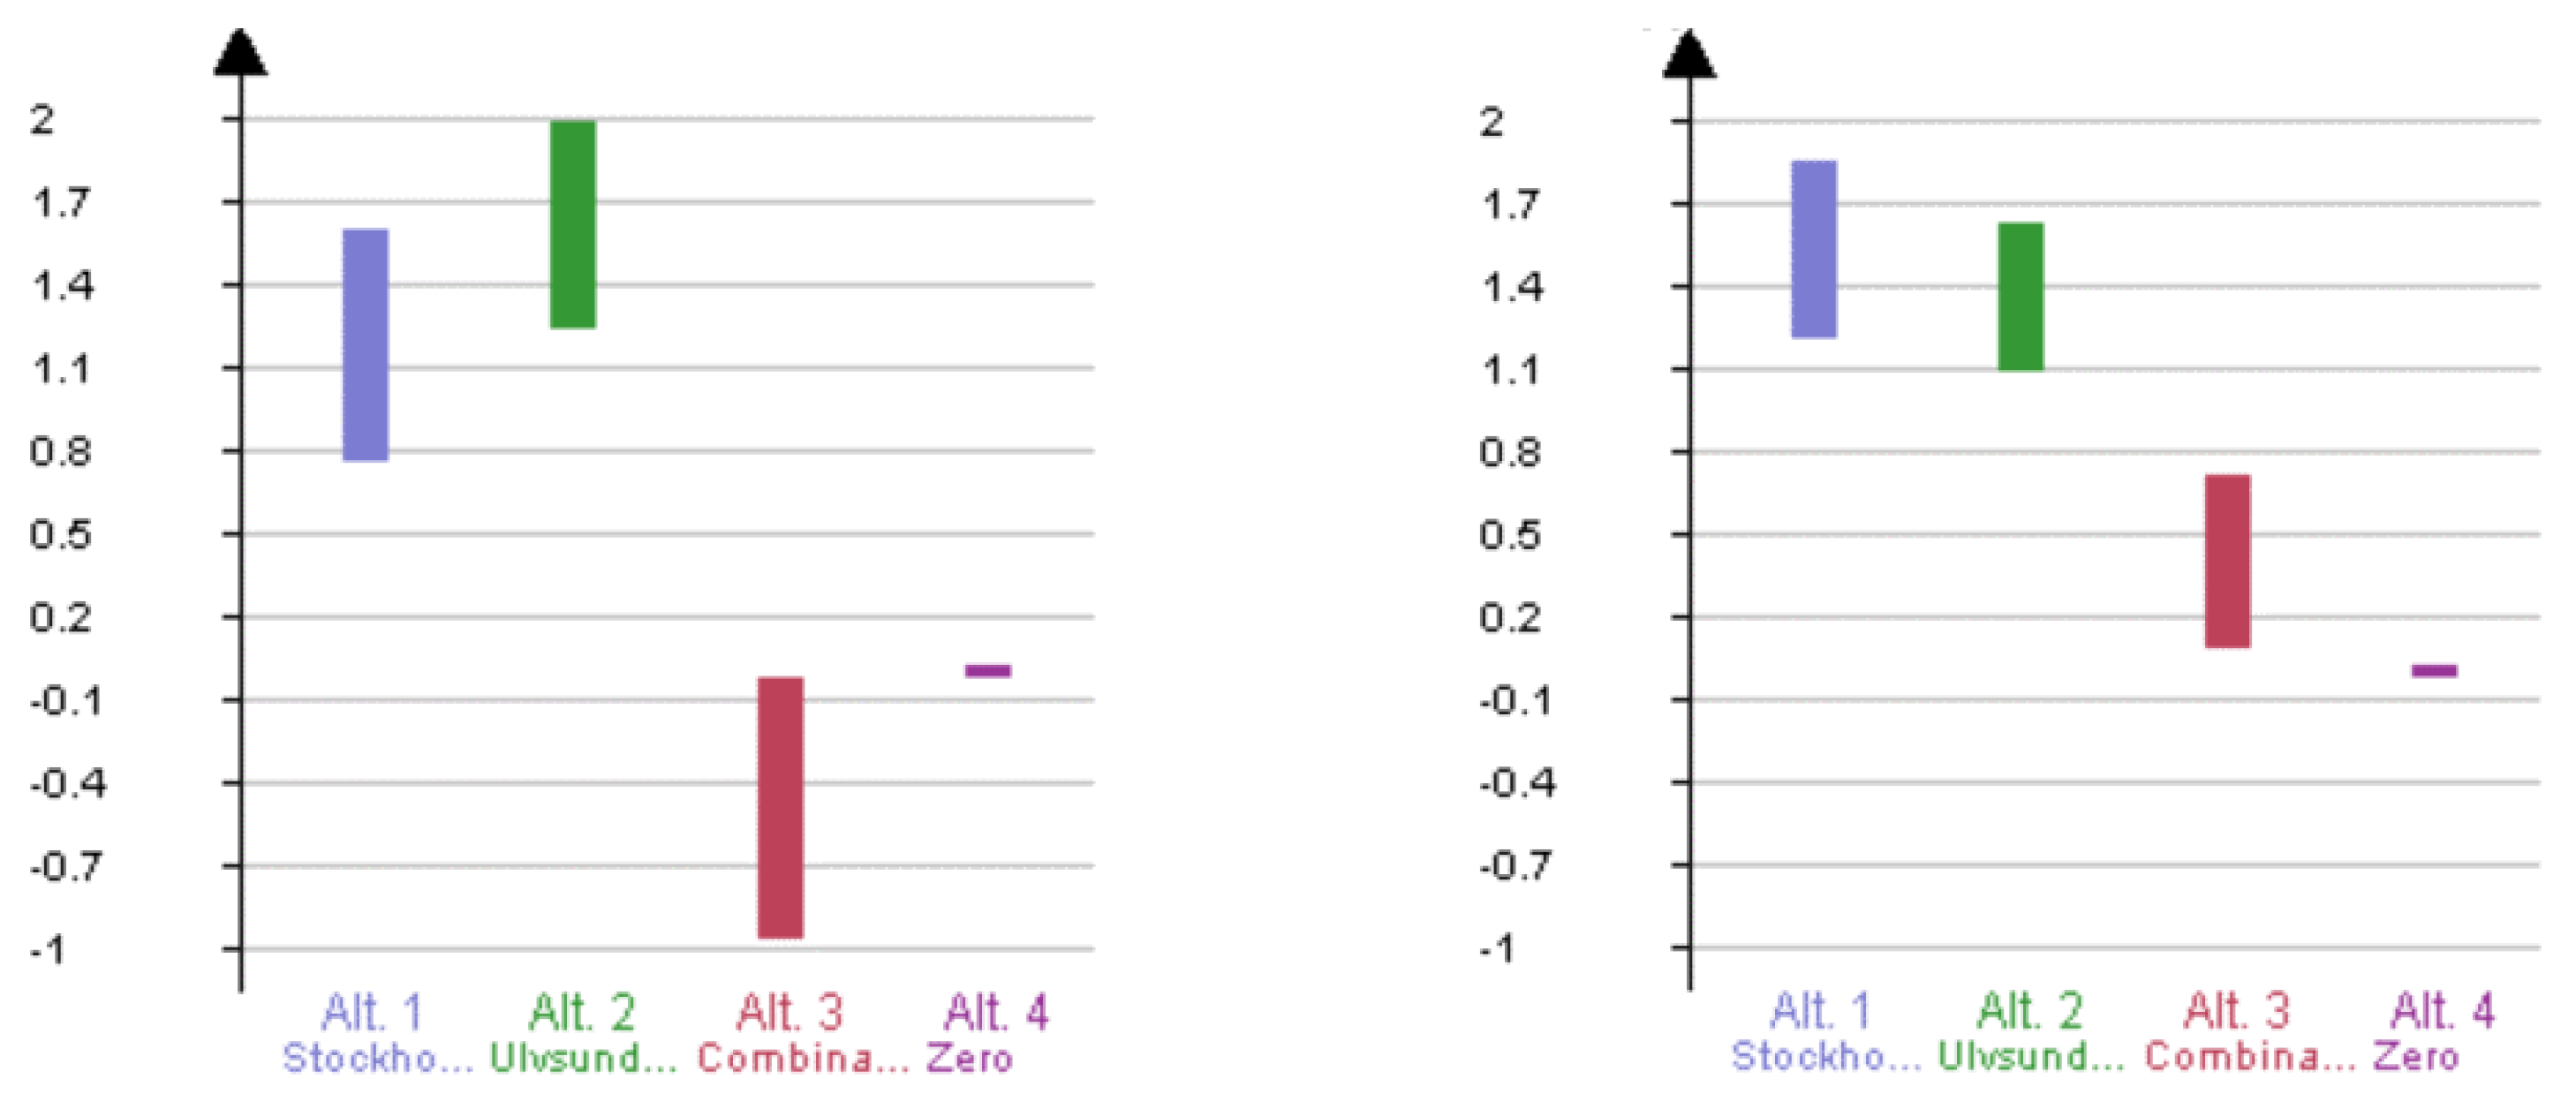
Disclaimer/Publisher’s Note: The statements, opinions and data contained in all publications are solely those of the individual author(s) and contributor(s) and not of MDPI and/or the editor(s). MDPI and/or the editor(s) disclaim responsibility for any injury to people or property resulting from any ideas, methods, instructions or products referred to in the content. |
© 2026 by the author. Licensee MDPI, Basel, Switzerland. This article is an open access article distributed under the terms and conditions of the Creative Commons Attribution (CC BY) license.