


Abstract
Background: Cardiovascular disease (CVD) remains the leading cause of morbidity and mortality among patients undergoing peritoneal dialysis (PD). Despite advances in clinical management, accurate prediction of cardiovascular events in patients receiving PD continues to be a major challenge due to the complexity and heterogeneity of patient data. This study proposes a novel Pro-PD diagnostic model to enhance the prediction of cardiovascular events, including myocardial dysfunction, stroke, and heart attack. Methods: The model integrates deep learning (DL) with the Grey Wolf Marking (GWM) optimization technique and incorporates a dual-mode authentication and decision-support mechanism governed by GWM to optimize feature selection and classification performance. It leverages multidimensional datasets comprising demographic characteristics, clinical indicators, and dialysis-specific parameters to extract complex patterns associated with CVD risk. Results: Experimental evaluation demonstrates that the proposed approach achieves an accuracy of 95.62% in identifying selective pattern attributes and classifying PD patients into CVD risk categories. Conclusions: The proposed Pro-PD framework demonstrated promising predictive performance, achieving 95.62% training accuracy and 92.64% validation accuracy for the local model under an 80% training–20% validation split. The global feature-mapping model achieved an AUC (area under ROC curve) of 92.41%.
1. Introduction
Peritoneal dialysis (PD) stands as a pivotal renal replacement therapy for individuals grappling with end-stage renal disease (ESRD), which is marked by the inability of the kidneys to sufficiently purge waste products and surplus fluids from the bloodstream. In contrast to hemodialysis, which involves extracorporeal blood purification via an external dialysis machine, PD harnesses the intrinsic filtration capabilities of the peritoneal membrane, a semi-permeable structure enveloping the abdominal cavity. This process unfolds through the introduction of aseptic dialysis solution, known as dialysate, into the peritoneal cavity via a surgically implanted catheter. The peritoneum then serves as a conduit for the exchange of solutes and fluids, facilitated by the mechanisms of diffusion and osmosis. Waste products and excess fluids traverse from the capillaries surrounding the peritoneum into the dialysate solution, thereby effecting clearance. Subsequently, the used dialysate, laden with uremic toxins and metabolic byproducts, undergoes drainage, thus concluding a dialysis session.
Beyond its mechanistic underpinnings, PD offers a suite of advantages over hemodialysis. Notably, PD affords patients greater autonomy and flexibility in managing their treatment regimen, as it can be performed in the comfort of their homes without necessitating frequent visits to dialysis centres. Moreover, the absence of an extracorporeal circuit mitigates the risk of blood access-related complications commonly observed in hemodialysis. Dietary restrictions are comparatively fewer than with hemodialysis, empowering patients to maintain a more liberalized diet. Additionally, PD may confer a degree of preservation of residual renal function, thereby potentially attenuating the rate of decline in kidney function progression over time—a phenomenon not often observed in the hemodialysis population. These collective attributes position PD as a compelling therapeutic option for individuals navigating the complexities of ESRD management, underscored by its ability to offer both clinical efficacy and enhanced quality of life.
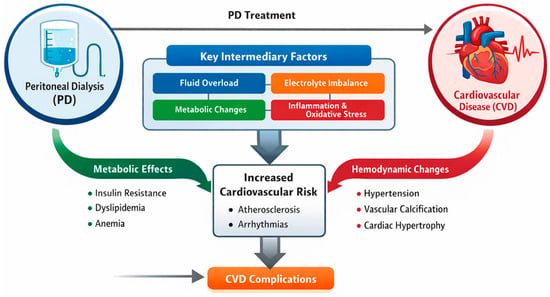
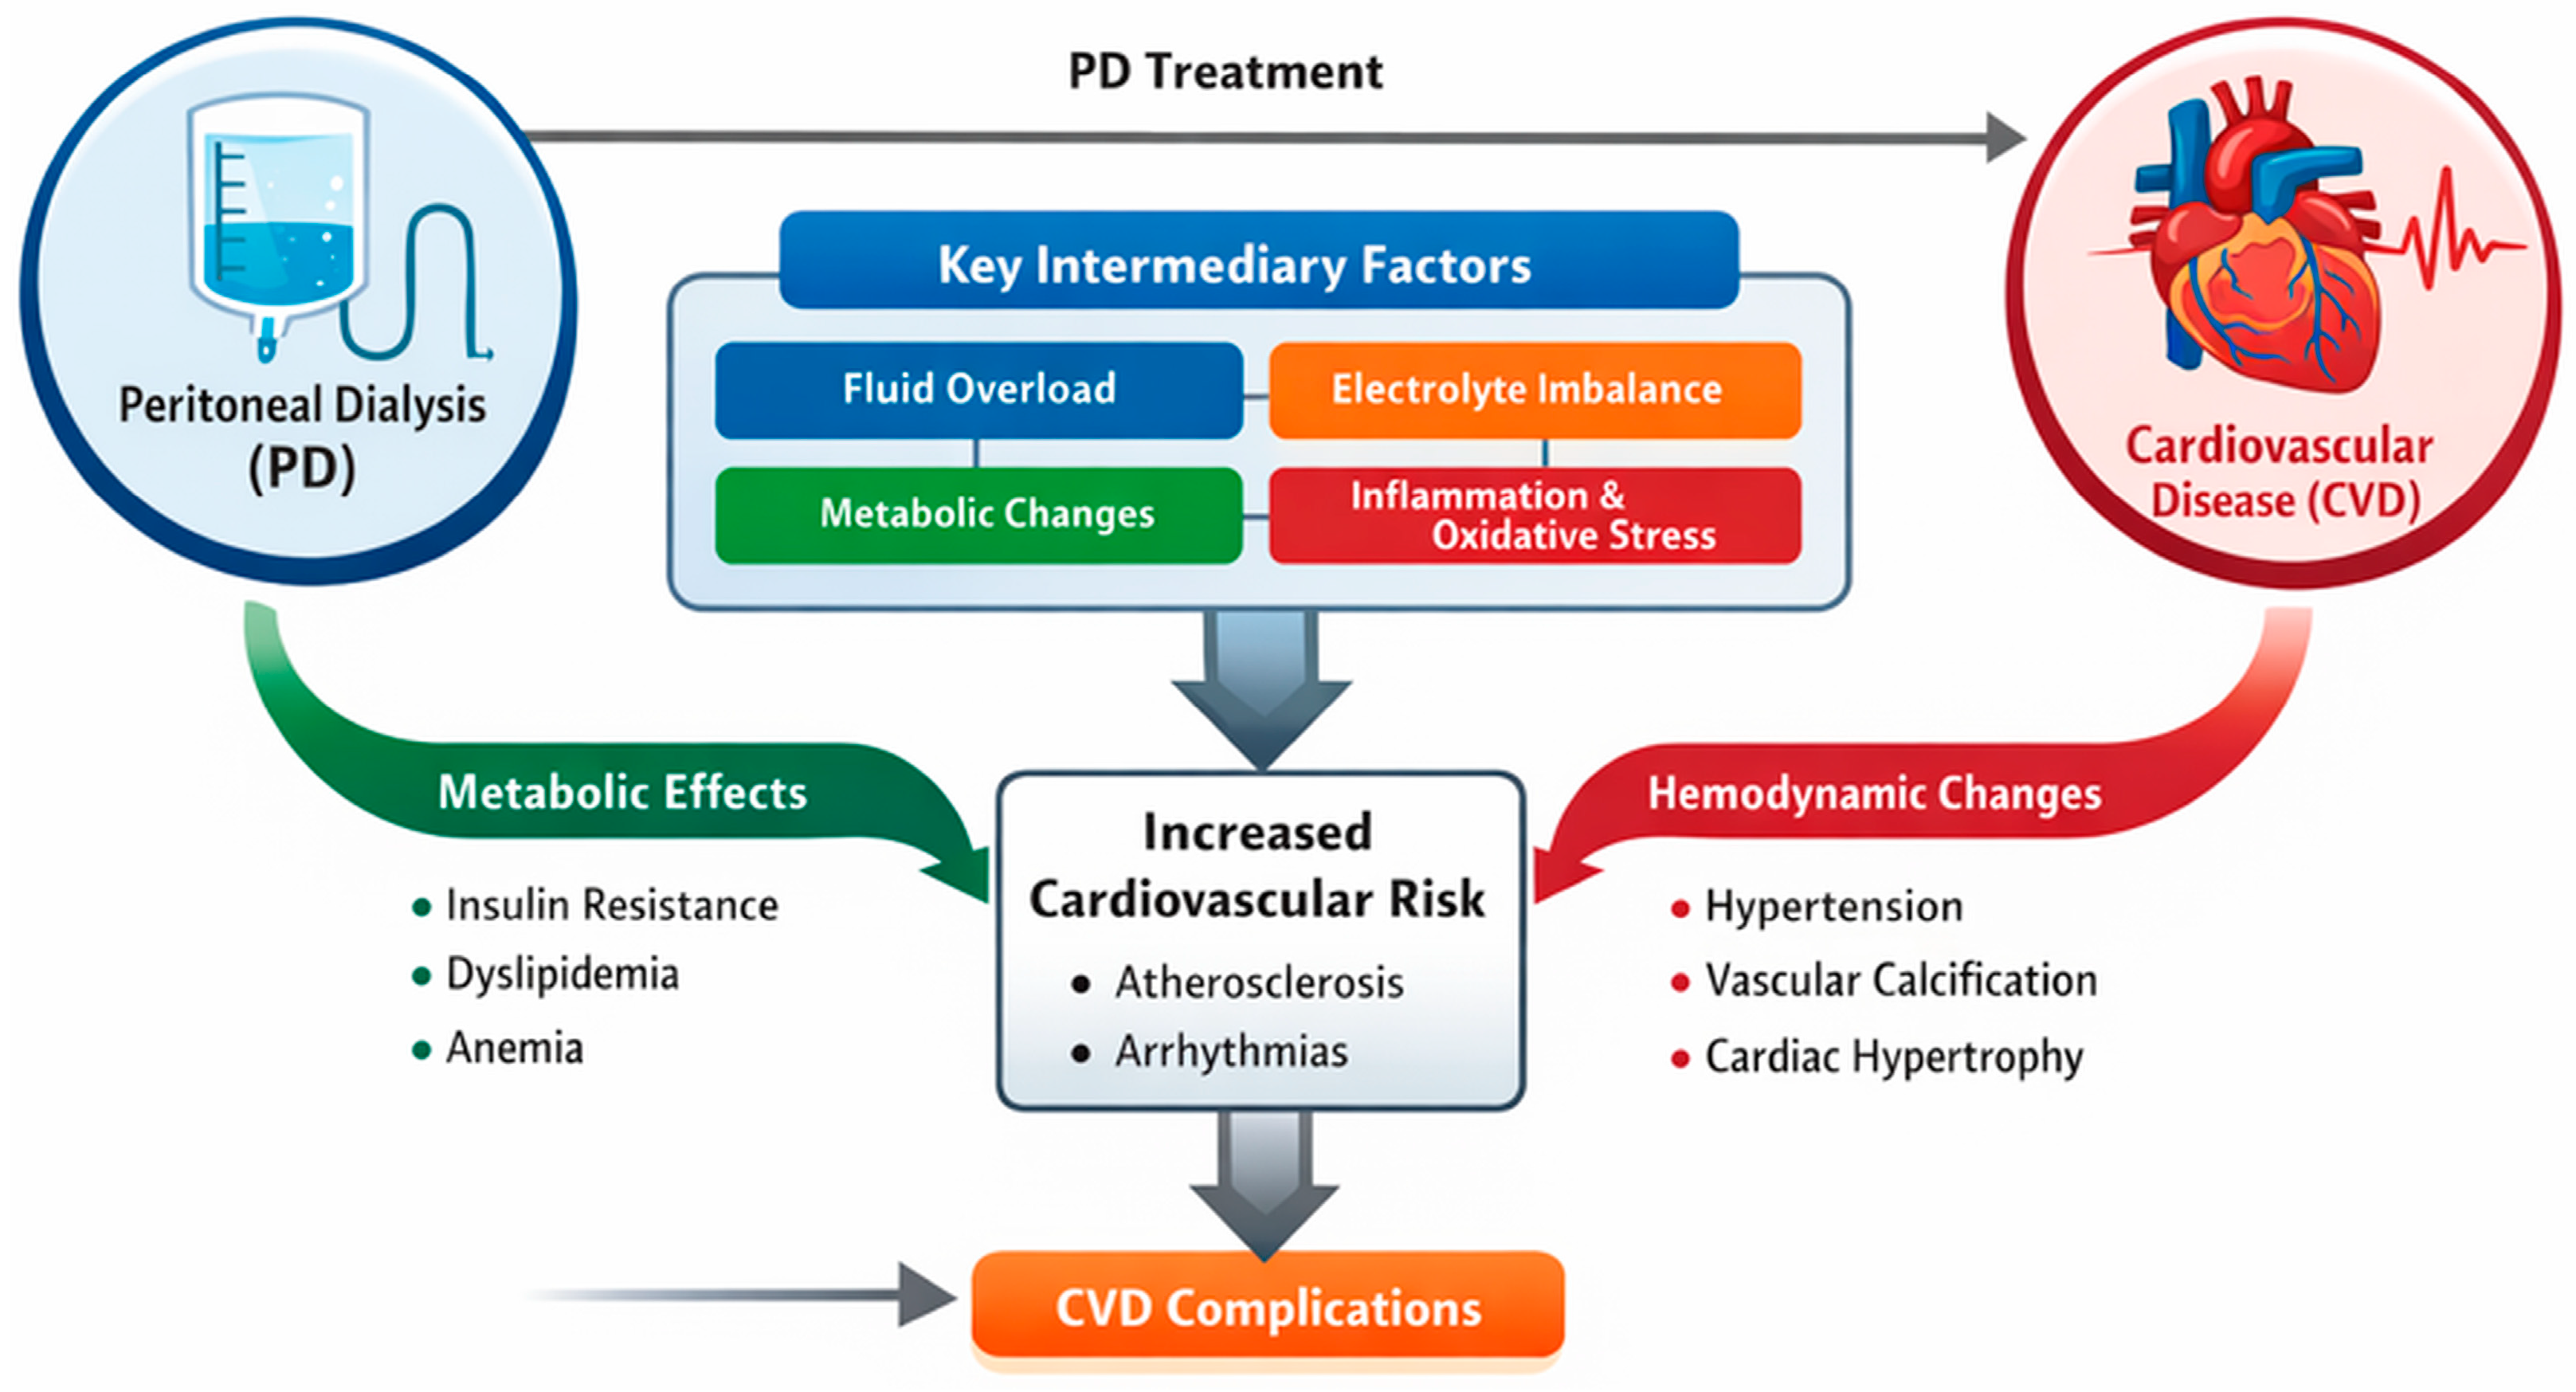
The relationship between PD and cardiovascular disease (CVD) is complex and multifaceted. ESRD patients, including those undergoing PD, exhibit a disproportionately high burden of cardiovascular morbidity and mortality compared to the general population. Multiple factors contribute to this heightened cardiovascular risk, including traditional risk factors such as hypertension, dyslipidemia, and diabetes, as well as non-traditional risk factors such as chronic inflammation, oxidative stress, and uremic toxin accumulation. Importantly, PD-specific factors, such as alterations in fluid and electrolyte balance, technique adequacy, and peritoneal membrane function, further influence cardiovascular outcomes in this population. Understanding the interplay between PD and CVD is crucial for optimizing patient care and outcomes in ESRD. Research efforts focus on elucidating the mechanisms underlying cardiovascular risk in PD patients, identifying novel biomarkers for risk stratification, and developing tailored therapeutic interventions to mitigate cardiovascular complications. By comprehensively addressing the cardiovascular implications of PD, clinicians and researchers can advance the paradigm of renal replacement therapy and improve the long-term prognosis of individuals navigating the complexities of ESRD management. Figure 1 illustrates the risks of CVD during PD.
Figure 1.
PD and CVD risk pathways.
CVD is predicted using ML algorithms like logistic regression, SVM, k-NN, and Random Forest; however, traditional ML methods have many limitations when applied to complex clinical datasets such as those for patients receiving PD. One major limitation is that traditional ML models rely heavily on manual feature selection based on the knowledge of experts, leaving open the potential for missing some latent patterns in the data that may contain important information for the prediction of CVD risk. ML models are also not able to adequately model complex, nonlinear interdependencies among several types of biomedical variables, such as blood pressure, lipid profile, renal functioning markers, and markers of inflammation. As the development of CVD risk for patients receiving PD occurs through complex physiological interactions among many variables, traditional linear or shallow learning models are unable to adequately represent the interactions that may be present in this population. Consequently, traditional ML techniques are inadequate for providing accurate and dependable predictions of CVD risk in peritoneal dialysis.
Deep-learning (DL) methods create models without human intervention, which means that, by automatically identifying meaningful patterns in raw data, they do not suffer from the same limitations as traditional ML methods. Convolutional neural networks (CNN) and long short-term memory (LSTM) are examples of deep networks capable of capturing the complex and temporal relationships between various clinical parameters. These models should predict CVD risk in patients on PD, therefore making DL a more reliable and accurate alternative to ML methods. DL models, however, are only as good as their features and hyperparameters. Hyperparameter tuning is an optimization method for selecting features relevant to the predicted CVD risk in patients on PD. Grey Wolf Optimization may be used to determine relevant features and then optimize the associated hyperparameters by using them to build the final DL model.
The number of patients developing CVD while on PD continues to grow. Using available computational models analyzing the interrelationship of renal and cardiovascular systems has yielded limited results. Existing research has generally focused on either renal or cardiovascular system parameters independently, which limits clinical insight. The application of GWM will provide new analytic tools to identify subtle patterns of interdependence that current prediction models overlook. GWM will determine if combined renal and cardiovascular system parameters can provide improved risk prediction. Recent advances in bio-inspired and optimization-based learning have provided alternative mechanisms for feature selection and model optimization; however, the present study focuses specifically on dependency-aware feature representation through MADM followed by GWM-based optimization and deep-learning prediction.
Although patients undergoing PD may primarily be receiving treatment for their kidneys, studies have shown that many patients also develop complications of CVD while on PD; for example, the studies indicate that patients receiving PD have a higher risk for developing congestive heart failure than do patients who are not on PD. There is a complex relationship between renal and cardiovascular systems, and the current prediction models for CVD do not adequately address the interaction between renal and cardiovascular health; therefore, there is a need for further study to determine the interrelationship between PD and CVD with respect to risk prediction.
Cardiovascular-event prediction in patients undergoing peritoneal dialysis requires consideration of heterogeneous demographic, clinical, dialysis-specific, and cardiovascular attributes. The available PDTAP cohort contains multiple categories of patient and dialysis information, including PD status, dialysis modality, prescription parameters, comorbidities, residual renal function, laboratory measurements, and lifestyle characteristics. These characteristics motivate a structured representation rather than independent treatment of individual predictors. The proposed framework therefore follows a sequential computational strategy in which the available attributes are preprocessed and represented as local patient-specific and global reference features, their interdependencies are structured using MADM, and GWM is subsequently used to optimize the feature subset and model configuration before deep-learning-based CVD risk classification. The feasibility of this approach is evaluated using internal training–validation experiments and multiple predictive-performance measures. This formulation provides a direct methodological link between the identified PD-CVD modelling gap and the proposed contributions.
The primary contributions of the work are summarized as follows:
- We present an innovative multidimensional mapping system for examining how various factors relating to PD may contribute to CVD risk.
- We reformulate PD treatment into a structured reference attribute format to verify patients’ clinical and behavioural characteristics during their PD treatment.
- The newly developed ProPDD (Predictive Peritoneal Dialysis Diagnosis) technique uses multidimensional attribute mapping, dependence analysis, and deep learning to provide more reliable predictions of CVD risk among PD patients.
- The GWM methodology is utilized to find and optimize key dependency relationships of PD attribute data to CVD outcomes.
- The ProPDD-GWM model is trained and validated with curated clinical datasets, in order to improve classification accuracy and reliability of decision-making.
- By employing this approach, the framework demonstrates superior predictive performance compared to traditional methods and will also support better clinical evaluation and individualized patient care.
2. Literature Review
The literature survey on PD spans a broad spectrum, encompassing studies investigating its physiological underpinnings, technological advancements in dialysis solutions and delivery systems, clinical outcomes in diverse patient populations, and the economic implications of PD implementation. Furthermore, the literature delves into the intricacies of patient management, including strategies for optimizing dialysis adequacy, mitigating complications such as peritonitis and fluid overload, and promoting patient adherence to treatment regimens. The advent of Artificial Intelligence (AI) has profoundly influenced PD observation and statistical studies [1]. However, the focus of this survey is restricted to machine-learning techniques and approaches.
ML methodologies have revolutionized the approach to assessing mortality risk in peritoneal dialysis (PD) patients, offering sophisticated prediction and categorization models [2]. This study, conducted with a cohort of Korean patients, delves deeply into the multifaceted factors contributing to mortality within the PD population. By meticulously analyzing demographic, clinical, and treatment-related variables, the research provides valuable insights into the complex interplay of factors influencing patient outcomes. In a parallel endeavor [3], researchers undertake a comprehensive analysis of data from 873 PD patients to predict adverse prognoses. Utilizing advanced statistical techniques such as the computation of the area under the curve (AUC), the study rigorously evaluates the performance of predictive models. Through this meticulous evaluation, the research aims to identify robust predictors of adverse outcomes, thereby facilitating early intervention and personalized treatment strategies for PD patients at risk.
A seminal investigation [4] focuses on mortality prediction within a large cohort of 27,615 US veterans diagnosed with end-stage renal disease (ESRD), with particular emphasis on those undergoing PD. Leveraging electronic health record (EHR) data, the study employs sophisticated machine-learning algorithms tailored to the unique characteristics of PD treatment. By mining vast datasets, the research endeavours to uncover novel insights into the predictors of mortality specific to the PD population, thereby enhancing risk stratification and informing clinical decision-making. These studies collectively underscore the pivotal role of machine learning in advancing our understanding of mortality risk in PD patients. By leveraging data-driven approaches, researchers aim to identify actionable insights that can ultimately improve patient outcomes and inform evidence-based clinical practice in the management of ESRD.
Under PD, the risk of cardiac arrest, commonly known as a heart attack, is a prevalent concern. Continuous monitoring and validation of cardiovascular events are crucial, necessitating the application of ML techniques. Recent studies [5,6] have proposed ML-based approaches for predicting and classifying heart failure in hospitalized PD patients. Furthermore, reports [7,8,9] delve deeper into the influence of CVD in the PD population. Despite the recording and monitoring of CVD-based occurrences in PD since 2007, the challenge lies in establishing attribute dependencies for dataset development. Additionally, investigations [10,11] have focused on evaluating death and survival rates in continuous peritoneal dialysis processes. Furthermore, studies [12] explore surgical outcomes and interdependencies, shedding light on the intricate dynamics within the PD patient population. Additionally, authors in [13,14] present findings on home dialysis in patients with CVD, offering insights into the feasibility and outcomes of this approach. Collectively, these studies contribute to our understanding of cardiovascular risks and outcomes in PD patients, paving the way for improved management strategies and patient care.
From our comprehensive observation, we have identified a notable deficiency in datasets and literature directly addressing the influence of CVD on PD outcomes. Moreover, there is a lack of timely reporting of hospitalization statistics and evaluations based on electronic health records (EHR). A study [15] emphasizes the importance of maintenance for PD patients during hospitalization. To bridge this research gap, we have proposed a novel solution: developing a direct connection between PD and CVD and constructing a dataset-based training model, both locally and globally, for continuous learning and prediction. This innovative approach aims to enhance our understanding of the intricate interplay between PD and CVD while facilitating more accurate prognostication and personalized patient care.
The detailed validation of classifying the attributes in a medically sensitive dataset is represented in [16], and a collective article in [17] demonstrates the challenges and effective solutions for eHealth informatics attribute-based processing. The early detection and decision-making of the CVD events are reported in [18,19,20] with interdependency parameter-based evaluation. These approaches have been validated on a direct and single source dependency of the source, whereas [21] has included the reliability study on COVID occurrence and the dependency of CVD in decision-making. Empirical Mode Decomposition (EMD) is an approach that was used in [22] for extracting features from electrocardiograms (ECG) as a means of better classifying cardiovascular disease. The extracted features from the ECG signals were then used in a deep-learning model that offered improved performance compared to normal methods of classification.
A recent study from [23] uses XGBoost output to estimate cardiovascular incidents among PD patients and achieves strong results; however, this work does not provide DL-based information on dependency. Likewise, ref. [24] used nomograms and ML for measuring heart failure risk in PD cohorts, but they were unable to adequately identify sources of interdependency among predictors and find optimal predictors. While [25] indicated that ML is encouraged in predicting PD outcomes, they also noted that there are biases in datasets and gaps in the validation processes related to this work. Conversely, although both [26,27] review various machine-learning methodologies in general to predict cardiovascular disease, these studies did not account for the specific clinical factors related to PD. Hybrid techniques combining metaheuristic optimization [28] with traditional ensemble methods [29] and Grey Wolf-based networks [30] have led to enhanced prediction accuracy; however, they have failed to provide a detailed analysis of the dependencies of structured attributes needed for assessing PD-CVD.
In spite of advancements made to date, much of the existing literature continues to examine only improvements in model performance and classification at the signal level, with little attention being given to systematically modelling structured interdependencies among various characteristics of PD as they relate to CVD outcomes. Moreover, there is a lack of optimization-driven DL models designed specifically for populations receiving PD. These limitations provide sufficient justification for creating the proposed ProPDD framework, which incorporates Grey Wolf Marking and will offer improved predictions of CVD risk for patients receiving PD through structured mapping of dependencies.
Despite the advancements seen in recent studies that indicate the advantage of ML, DL, and metaheuristic feature selection methods for disease prediction, there are still numerous weaknesses. Traditional ML methods are greatly reliant on the quality and relevance of the chosen features while standard GWO (Grey Wolf Optimization) suffers from a slow rate of convergence and early stagnation at a local optimum solution. In order to solve this problem, the Pro-PD framework utilizes a dual model of GWO. Even though recent modified GWO algorithms dealt with the mentioned problems and proved successful feature reduction for chronic disease prediction, their analysis and evaluation have mainly been carried out for individual diseases or usual benchmark datasets. The proposed framework addresses this gap by applying optimized feature selection to structured peritoneal dialysis and cardiovascular variables for cardiovascular risk prediction. In addition, not enough attention has been paid to the process of identifying discriminative patterns of features and developing a feature-mapping strategy for differentiating between local relationships among features and global representations of features during the PD-CVD risk classification process.
Thus, the suggested method provides a unified technique that merges dual-mode GWO-focused feature optimization with local–global deep feature mapping, dealing with the shortcomings of traditional feature selection, optimization halt, disease-specific relevancy and lack of complementary feature relationship representation. These aspects together form a coherent mechanism for better identification of discriminative features and reliable classification of PD-CVD risk.
3. Materials and Methods
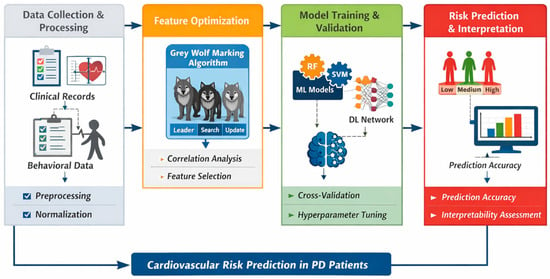
The primary objective of this research is to construct a comprehensive interdependency attribute-based mapping system aimed at predicting the likelihood of cardiovascular events occurring during PD treatment. To achieve this, we meticulously tailored the PD process into a structured referencing attribute format, allowing for the validation of patients’ habitual behaviours throughout their dialysis regimen. While the direct correlation between PD and the occurrence of CVD is relatively minimal, there exists a passive, yet noteworthy attribution to PD’s presence. This manuscript delves deeper into elucidating the intricate interplay between PD and the influence of CVD, employing the sophisticated Grey Wolf Marking (GWM) technique. By leveraging the GWM technique, we can effectively delineate the dependencies between PD and CVD, shedding light on the nuanced relationship between the two entities. Our approach involves meticulous training and validation of the interdependency attribute-based model using carefully curated datasets. Through this rigorous process, we aim to enhance the accuracy of classification and decision-making regarding cardiovascular risk assessment in PD patients. By leveraging detailed datasets and advanced techniques, we seek to provide a nuanced understanding of the dynamic interplay between PD and CVD, ultimately advancing our ability to mitigate cardiovascular risks and improve patient outcomes in this vulnerable population. The proposed architecture is as shown in Figure 2.
Figure 2.
Proposed architecture.
The proposed framework is organized into four primary stages and explained as follows: Stage 1 of the predictive risk system includes the acquisition of data from the PDTAP database which provides structured clinical data and behaviours of patients with PD. These characteristics include demographic factors, adequacy measures for dialysis, laboratory analyses, blood pressure readings, and outcomes associated with cardiovascular events. While previous research has typically looked at these attributes in a linear fashion as individual attributes, this architecture will take this information and arrange it into a structured multidimensional entity in order to provide consistent and reliable representation of the clinical evidence multiple times. This will allow for consistent, repeatable data and a validated representation of clinical evidence. Techniques for preprocessing the data will be implemented to improve the quality of the clinical data and to improve the analytical reliability of the findings. Some of these preprocessing techniques are replacing missing data values, normalizing the scale of measurement, categorizing variables, and eliminating abnormal values.
The second stage will introduce a new mechanism for optimizing multidimensional data based on a novel dual-mode GWM strategy in order to build models that identify and evaluate the complex interdependencies between pairs of attributes. This dual-mode strategy will allow the modelling process to capture both the direct and indirect relationships between variables associated with PD and cardiovascular warning signs. Based on an iterative search process, the GWM algorithm will identify an optimal subset of predictor variables and the appropriate parameters to use in training the model. By using the GWM optimization process to build a model that produces the optimal subset of features and parameter values, we will be able to improve the relevance of the dimension of each feature in our dataset while minimizing redundant and/or irrelevant noise from the final dataset.
In the third stage, the deep-learning classifier is trained using the optimized features and evaluated on the held-out 20% test set to generate CVD-risk predictions for patients receiving PD. Finally, the newly developed framework will provide classifications of CVD risk for PD patients as either low, medium, or high-risk classifications. The framework supports interpretability through the evaluation of variable contributions to overall scores produced by the model and enables identification of key PD-related variables that impacted risk scores generated by the model as well as supports systematic modelling of each of the PD and CVD variables/models utilized and produces accurate CVD risk classifications compared to many existing CVD models.
To construct and validate the predictive model, we first created a clinical dataset from PD patients called PDTAP. Then we developed a complete pipeline of methods including data preprocessing, optimization of features through the GWM algorithm, training of the model using the optimized features, and evaluation of performance of trained models to establish the robustness, generalizability, and clinical utility of this proposed framework. The methods and materials are discussed as follows.
3.1. Dataset
The Peritoneal Dialysis Telemedicine-assisted Platform (PDTAP) cohort described in this study comprises 7539 adult patients receiving peritoneal dialysis (Table 1) [31]. The subsidiary attributes such as height, weight (body mass), age, gender and Electronic Health Records are extended as derived attributes, and the normalized missing attributes are saturated via the data preprocessing approaches. The proposed model is trained with two distinct inputs, i.e., the local datasets and global valued datasets termed as threshold datasets.
Table 1.
Baseline characteristics of the PDTAP study population.
Table 1 summarizes the demographic, dialysis-related, clinical, laboratory, lifestyle, and socioeconomic characteristics available in the PDTAP cohort. Not all variables listed in the table are directly used as numerical optimization variables. Continuous variables are represented using their measured numerical values and undergo preprocessing and normalization before model training. Categorical variables, such as sex, PD status, and dialysis modality, are transformed into machine-readable representations before being incorporated into the feature space. Variables that are descriptive, qualitative, or not sufficiently measurable for reliable computational modelling are retained for cohort characterization but are not directly optimized by GWM. Therefore, the optimization operates on the preprocessed and quantifiable feature representation rather than on all variables reported in Table 1.
To improve the characterization of the selected features, a minimalist framework of the deep-learning model, Pro-PD-DLNet (Pro-PD Deep Feature Mapping Network), was created. The inputs of the model are the features selected using the dual-mode GWO algorithm. The network has three fully connected layers, having 128, 64, and 32 neurons, respectively. The hidden layers utilize the ReLU activation mechanism, which allows the nonlinear transformation of the features. To prevent overfitting and improve generalization, the dropout rate is 0.30. For the final output layer, the Softmax activation function is employed to calculate the classes of CVD risk. The training process is conducted with the help of the Adam optimizer, utilizing a learning rate of 0.001, in combination with a batch size of 32 for 100 epochs of operation. The categorical cross-entropy is utilized as a loss function of the training process. The dataset is split in the ratio of 80% for training and 20% for testing. After the completion of the learning process, the features learned are utilized for the purposes of distinguishing between classes of PD–CVD.
3.2. Dual Input Training
For improved CVD prediction in the PD population, this framework proposes a dual input training system. The dual approach utilizes both local datasets related specifically to patient factors as well as global values (thresholds) that provide background data regarding the patients’ cardiovascular risk based solely on standardized clinical limits. Because of the variability in patient characteristics associated with each location (demographics, duration of dialysis, lab results, etc.), an individual cohort only gives us one element of the universe of PD patients, and thus can be limited due to potential overfitting and may limit the ability of the model to carry over to other locations. Thus, a global threshold input was included to represent standardized clinical reference limits and population evidence. Therefore, the dual model allows for the system to represent both an individual patient and an overall population based on clinical (global) standards.
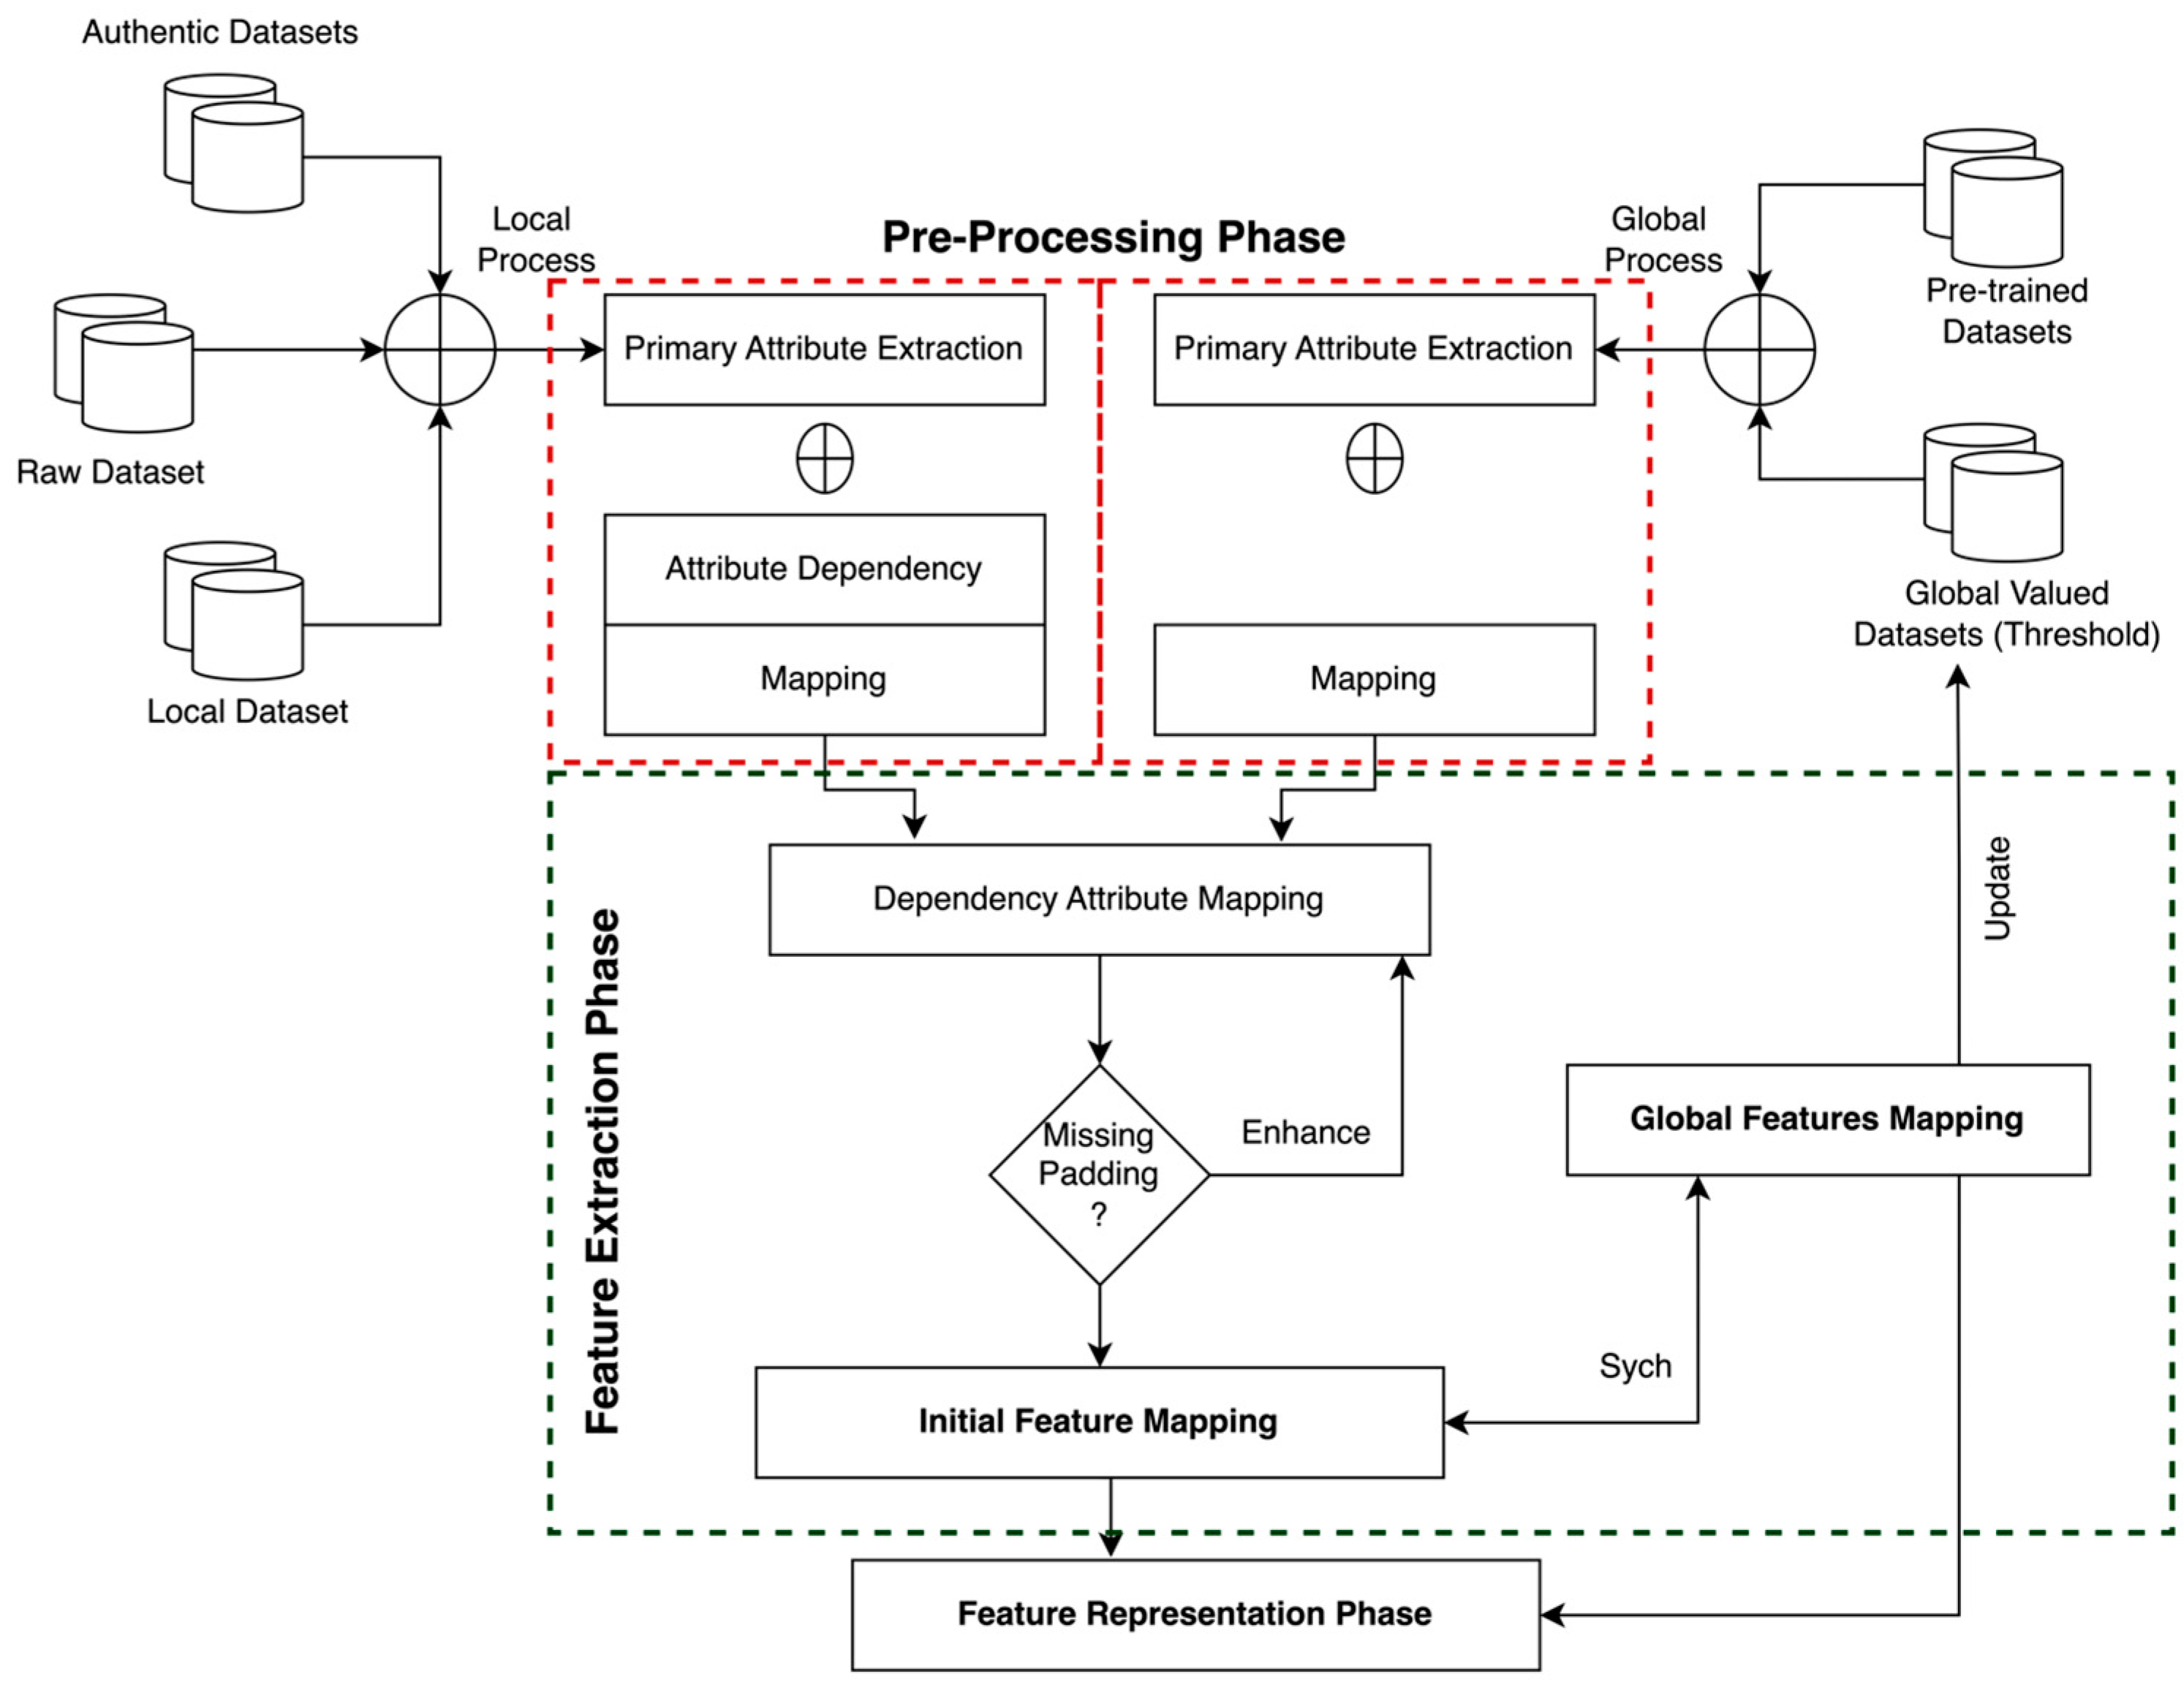
As illustrated in Figure 3, the first step within the framework is the preprocessing phase of the raw datasets. The raw datasets are separated into local and global sources, and each source has a separate extraction process for the PD variables to create a structured representation of the extracted variables. The second step is to map the relationships between the multidimensional clinical data elements. This step is important due to the complexity of patients’ cardiovascular outcomes, which are determined by the relationship of multiple variables including dialysis adequacy, metabolic markers, and cardiovascular indicators.
Figure 3.
Architectural representation of feature mapping from peritoneal dialysis datasets on global and local models.
In the feature extraction stage of the system, dependency attributes are linked to both locally distributed features and also globally located features with threshold tolerances. Afterwards, the global feature mapper will align patient-specific features with clinically determined thresholds for features that define normal physiological variations vs. clinically meaningful deviations from normal. This alignment creates an improved ability to interpret the information and also helps to form stronger decision boundaries within the learning paradigm. Through the use of combining local evidence along with globally referenced mappings, the proposed model will help to reduce bias, provide increased stability, and also provide improved predictability. Also, through the use of two modes of feature representation, the developed system will ultimately produce a model that reflects both individualized dialysis regimens and standardized cardiovascular risk factors, allowing for a more accurate and meaningful cardiovascular risk classification for the population on PD.
3.3. Grey Wolf Marking Technique
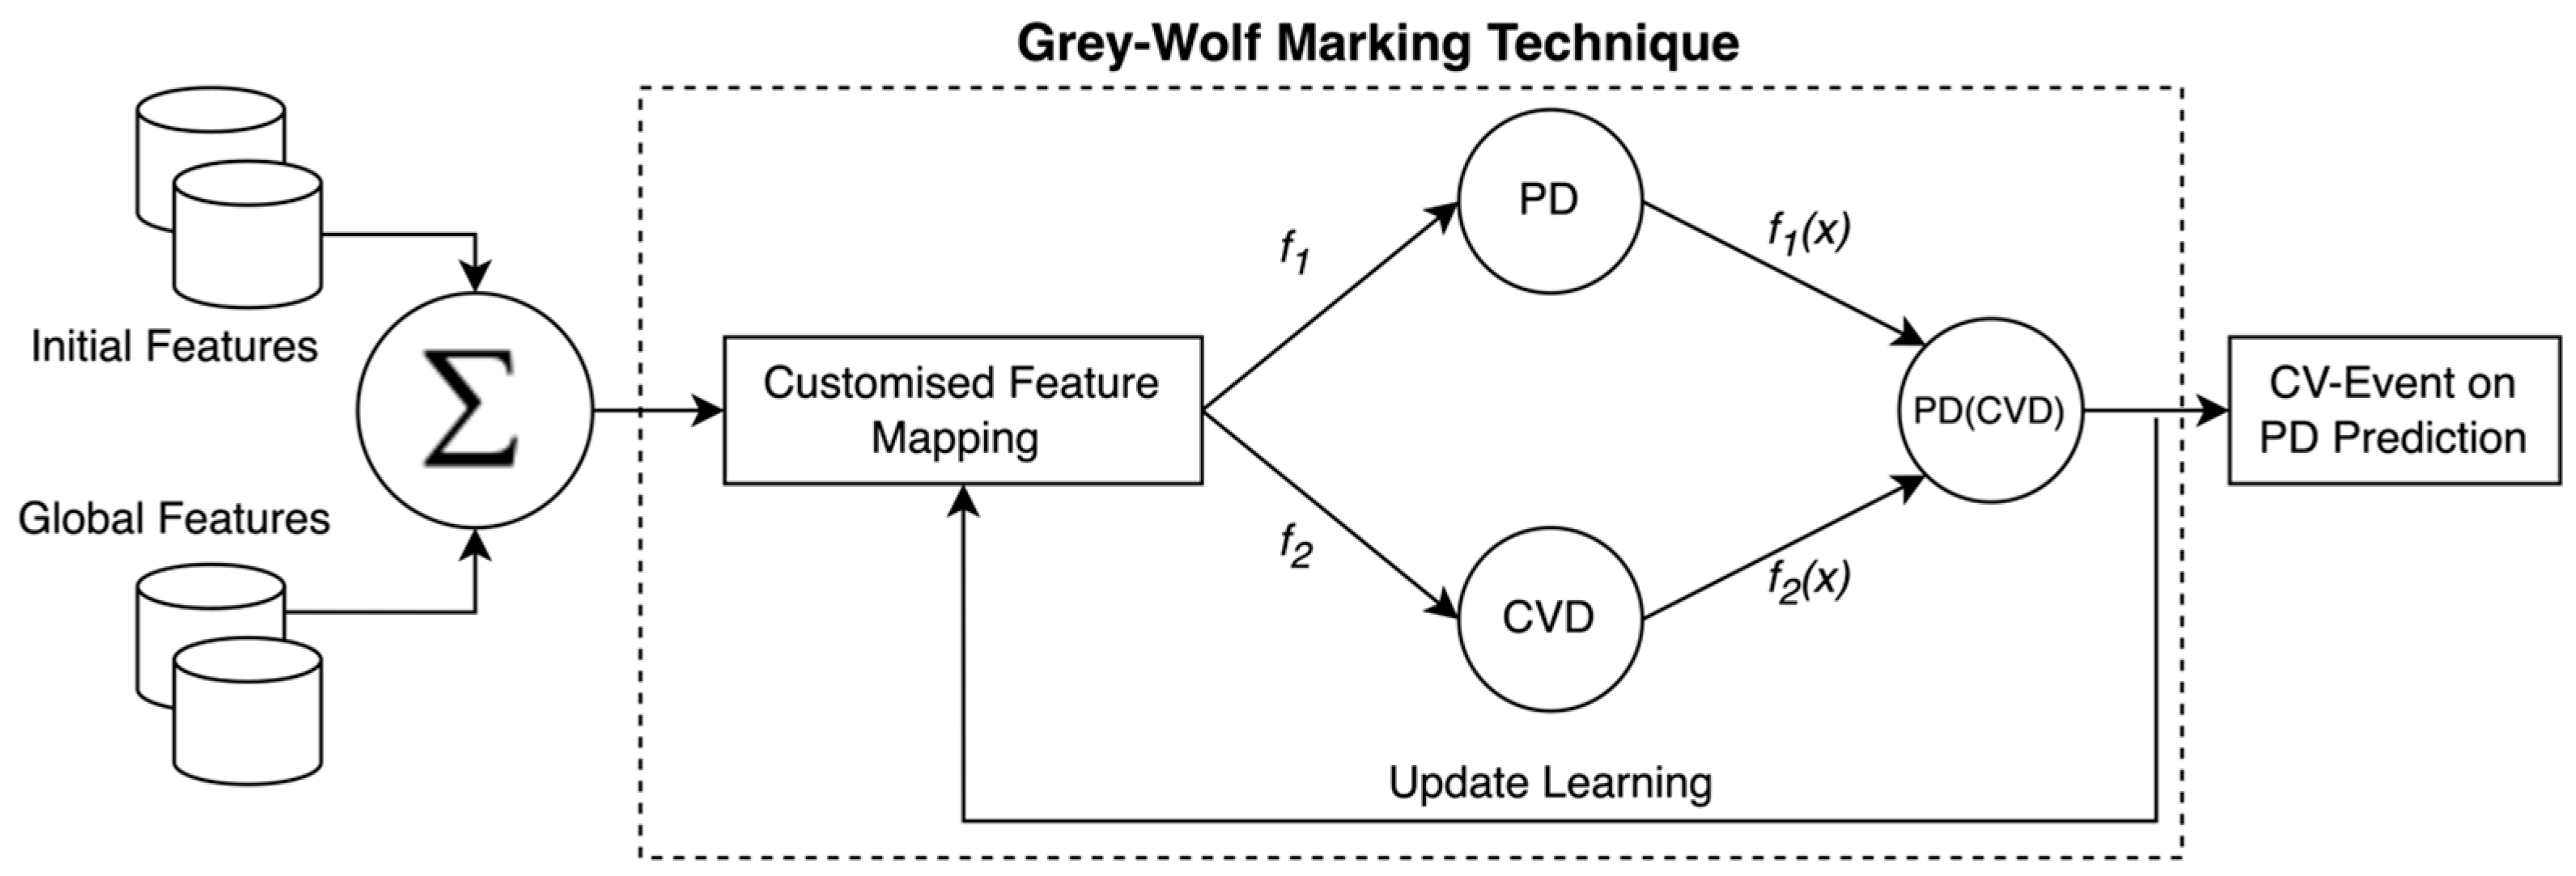
Figure 4 depicts the dual-input learning model based on GWM for predicting CVD outcomes from various PD attribute variables. This model provides a unified, optimization-driven predictive architecture for predicting CVD outcomes through the use of both local patient-specific feature data and global reference feature data. The local features come directly from the individual patient’s PD record, while the global features reflect both the threshold-based clinical standards as well as the aggregation of the attributes across all patients (e.g., aggregation across all PD patients for each studied parameter). The local and global feature sets are first aggregated and normalized together (by summation and normalization) to create a structured feature base from which the predictions will be made. The intent of integrating the unique local and global feature sets into a single structured feature set is to include both the biological difference between PD patients’ physiology at an individual level and the clinical model differences (e.g., variations due to the clinical model used) for PD-related conditions.
Figure 4.
Customization of PD prediction under CVD via the GWM technique.
After the creation of the combined feature space (i.e., feature integration), it is passed to the custom-designed feature mapping module. The module will perform the structured transformation of the integrated local and global feature attributes for analysis of multidimensional interactions among PD-related attributes and cardiovascular indicators. The proposed methodology considers the interactions of PD and CVD as interdependent variables, whereas traditional methodologies consider PD attributes and outcomes separately from CVD attributes and outcomes. The GWM Optimization Block represents the mapped attributes as two separate nodes that represent the PD and CVD attribute clusters. In GWM optimization, the interaction weights of PD and CVD, represented as λ1 and λ2, respectively, are updated iteratively to reflect the relative strength of the relationship between the attributes of interest in relation to the development of cardiovascular events. The adaptive update learning algorithm used to find the optimal solution uses the same principles of the social structure of grey wolves when hunting, as dominant algorithm solutions (the wolves) direct their subordinate algorithm solutions (subordinate wolves) toward the optimal solution, which allows for more balanced exploration and exploitation of solution space.
The relation of PD (CVD) within the interaction term is a representation of the learned mapping of dependencies between heart failure and cardiovascular conditions associated with PD and the variables common to heart disease and cases of death caused by heart disease. By utilizing iterative weight refinement and update learning in the optimization of PD and CVD criteria in GWM, the model reinforces the association between clinically relevant attribute pairs while decreasing or eliminating the associations between non-clinically relevant attributes or weakly correlated attributes. The resulting final optimized output is then delivered to the cardiovascular event prediction module, which produces a prediction of the probability that a patient with PD will have a cardiac event. The GWM optimization process has a direct correlation to the dual-input training mechanism as local features help the model develop patient-specific dialysis patterns and global threshold features provide stability and border determination with the use of clinical thresholds. Both of these types of features warrant their weight adjustment during the update phase of the GWM, thereby reducing reliance on patient population variation when determining the prediction of a particular PD patient, while providing a solid foundation of established clinical standards to validate the prediction. The dual influences from local and global features improve overall generalization and decrease overfitting, as well as provide increased predictive reliability for the full range of heterogeneous PD patients. The dual-mode GWM algorithm is presented in Algorithm 1.
| Algorithm 1: Dual-Mode GWM |
| Input: LF—local features, GF—global threshold features, N—size of the population, T—max iterations. Output: Model parameters and optimal feature. 1. Feature Integration: Merge dual inputs FM = Feature_Map(LF, GF) 2. Population Initialization: Create random grey wolves Xi that represent hyperparameters and feature masks. Fitness is evaluated through validation loss. 3. Leaders Identification: Select the three best candidate solutions, denoted Xα(t), Xβ(t), and Xδ(t), where α, β, and δ indicate their respective ranks. 4. Update control parameter: Here, t is the current iteration, T is the maximum number of iterations, and a is the control parameter that decreases linearly from 2 to 0. Calculate coefficient vectors, A and C. Update the wolves’ positions according to Xδ. Use dual-mode marking updates: where are used to balance the influence of features locally and globally Fitness is re-evaluated using validation loss, and new leaders may be updated 5. Output: The final output will be the optimal feature subset and parameter configuration, denoted by Xα. |
3.4. Multidimensional Attribute Dependency Mapping
Utilizing a Multidimensional Attribute Dependency Mapping (MADM) approach, the proposed framework allows for mapping multidimensional dependencies of complex multisystem inter-relationships that exist between PD and CVD variables. This contrasts with conventional methods of feature selection which typically isolate features and evaluate them independently, while using attribute-to-attribute mapping to show clinical relationships between multiple attributes. The provided data are made up of contributing attributes that have relationships where a primary attribute could have multiple contributing secondary attributes. For example, the individual anthropometric characteristic of height is not viewed in isolation as an attribute but instead has contributing secondary attributes such as body weight, body mass index (BMI), body surface area, capacity for fluid exchange, and PD fluid volume associated with it. All of these related attributes combined increase the likelihood of cardiovascular stress and increase the risk of fluid overload (i.e., excess fluid accumulation) in individuals undergoing PD. For these reasons, multidimensional modelling of these relationships is an important aspect of accurate prediction of cardiovascular events for individuals with end-stage renal disease receiving PD.
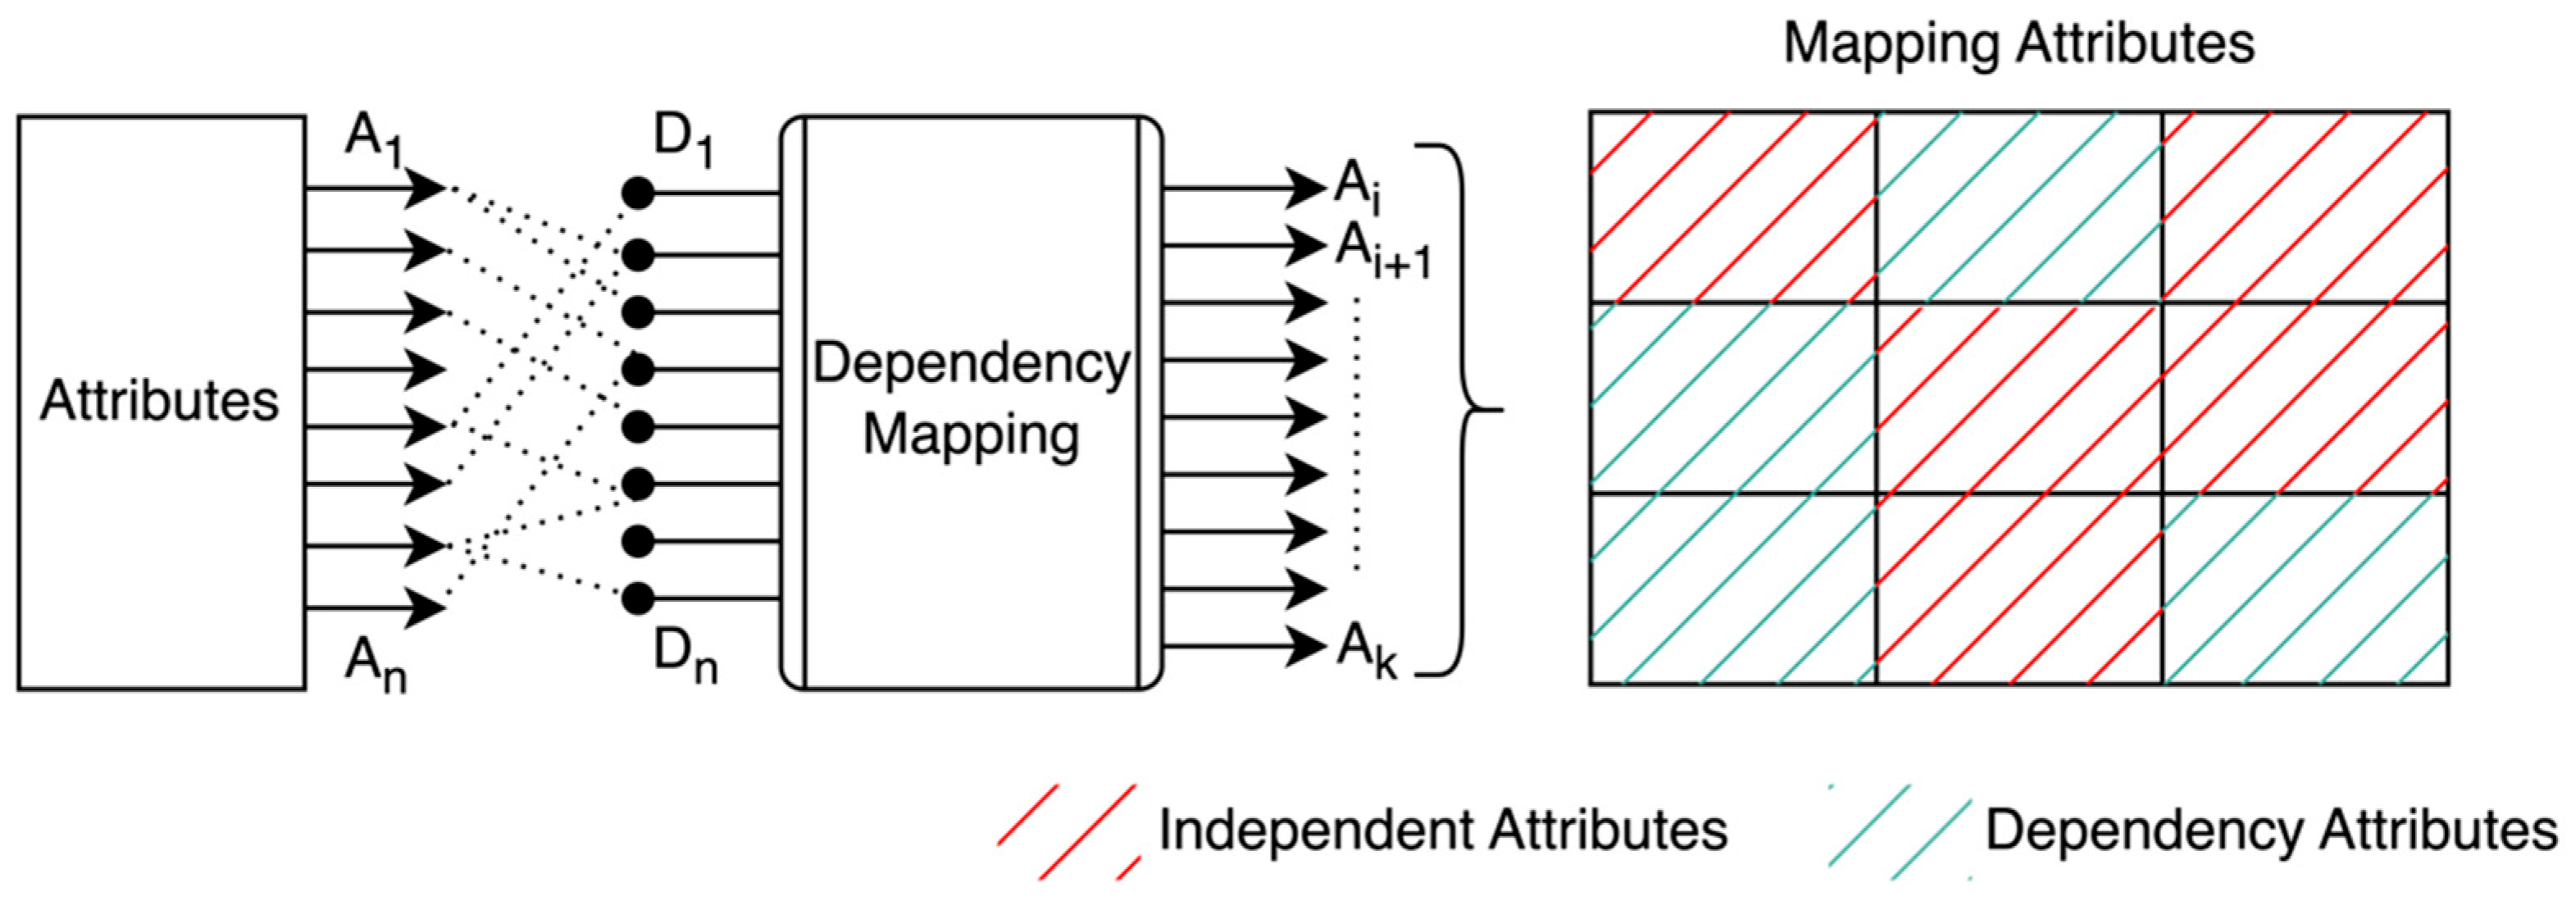
As shown in Figure 5, the attributes within the dataset were identified and placed in a structured dependency matrix. Following this, a module was used to assess variable interactions at both the pairwise level as well as the grouping level. The shaded box designations in the graphic represent strong inter-attribute correlation, whereas the unshaded box designations represent either weak or no interaction at all. This structured matrix representation makes it possible to identify clinically relevant clusters, which include anthropometric, dialysis adequacy, etc. Through this structure of mapping attribute dependencies before training the model itself, any redundant or weakly contributing relationships have been minimized while also preserving the significant interacting pairs. The results of this process increase how well the features are represented, improve their interpretability, and provide well-structured inputs to the Grey Wolf Marking optimization phase which will allow for the further refinement of these dependencies once completed. After performing the aforementioned processes, the learning module will thus have access to this dependency-mapped feature space in order to optimize the prediction of future cardiovascular events.
Figure 5.
Attribute mapping with dependencies.
The GWM algorithm is employed as a derivative-free search mechanism for optimizing the feature-selection masks and model parameters in the proposed framework. Rather than applying the optimization directly to the complete raw clinical feature space, the MADM stage first identifies and organizes the relevant PD-CVD attribute dependencies and minimizes weak or redundant relationships. This reduces the effective search space presented to GWM. The optimization subsequently identifies an appropriate feature subset and parameter configuration based on validation loss. The dual-mode mechanism incorporates local patient-specific features and global threshold features, with λ1 and λ2 controlling their respective influence during the optimization process. The deep-learning model then uses the optimized feature representation for nonlinear CVD risk classification. Thus, GWM functions as an optimization and feature-selection component rather than replacing the gradient-based learning mechanism of the deep-learning model.
3.5. Feature Extraction
The attribute dependencies are further evaluated with the process of feature selection. The phase includes a series of attribute dependency mapping and padding. The validated attributes with multiple dependencies are mapped as the features for supportive evaluation and the process is continued until the validation result is equal to the feature set extracted and results in no further feature set creation. At this phase, the global trained dataset is synchronized and validated for effective feature representation. The features considered here are derived from PD and are effectively attributed to the processing of CV events. In general, the processed attribute and feature relationship is coordinated with two feature sets, i.e., the initial feature and the global feature set of PD for effective decision-making in predicting the cardiovascular events occurring during PD. The effectiveness of the deep-learning model in Figure 2 is subject to customization of feature sets with respect to PD and CVD. In this approach the likelihood of predicting cardiovascular events such as heart attack, major CVDs and arterial flow is predicted and classified within a monitored environment.
3.6. ProPDD Technique
The process of building and customizing the training model is dependent upon the factor of raw dataset elements added in the process. Consider the universal dataset as with raw datasets , authentic dataset and pretrained datasets such that at an instance of any given time. Here, U_i denotes the ith element of the universal dataset U; L_D and G_D denote the local and global datasets, respectively; and G_Di denotes the ith component of the global dataset. The index t denotes time. Typically, the fundamental element of is . Thus, the resultant has training capabilities related to global valued dataset . Both dataset models from training are referred to as and where is the threshold value associated with the training model in extracting a stable version of computation. The primary attribute extraction is the process associated with the initial review of PD parameters as such that at and where is the defined attribute for processing.
Here, A_i denotes the ith input attribute, PD_i the ith PD-related attribute, C_i the ith cardiovascular attribute, and D the resulting dependency representation. The symbol n denotes the number of indexed attributes. Consider the attribute such as chronic kidney disease, age, height, weight and gender as primary computation values. Typically, the process of computing attributes is such that and at any given time . Such value coordination and computing reflect the mapping of PD existence in the initial processing stage. The initial attributes are further assigned with dependency model evaluation, i.e., the dependencies are evaluated by inter-mapping the dependency score with the corresponding CVD attribute and thus the dependency is represented as shown in Equations (1) and (2).
The attribution of functional variables further associates the reliability factor of each interdependent variable caused in extracting the dependencies of PD and CVD such that at a given time . These dependencies are further evaluated and categorized as with as the thresholding factor for customizing the dependencies in a generalized form.
Multidimensional Attribute Mapping
The indices j and k identify individual dependency terms, while z denotes the global mapping bound used in Equations (3) and (4). With the individual attribute dependency extraction, the process of mapping is subject to the attribution of dependency occurrences from one instance of attribute to another dependency ratio as . If attained attribute values and are derived from a single dataset stream , the dependency can be associated as where for instance , i.e., the functional values of each attribute segment are customized and reflected with if extracted via and are thus represented in Equation (3).
Thus, according to Equation (4), the dependency values of each customizing attribute are re-mapped with instances of dependencies such that and is the global value of mapping for customizing variables . The overall progress element and the association are reflected as shown in Table 2 for the purpose of attribute dependency relationship mapping.
Table 2.
Attribute dependency mapping and source generator.
Here, M denotes the attribute mapping and ΔM the mapping score. In Equation (5), ΔP_Di and ΔD_j denote variations in the ith PD attribute and the jth dependency measure, while Δt_i and Δt_j denote the corresponding time intervals. In Equations (6) and (7), D_A denotes the mapped dependency attribute, ΔD_A its variation, and ΔM_i the mapping score at index i.
According to Table 1, the matrix associating PD attributes with cardiovascular events is recorded and studied. The mapping is based on the dependency source extracted from Equation (4) for the computation of mapping score . The relevance can be evaluated by considering one PD-attribute and its associated cardiovascular event as chronic kidney disorder is influenced by heartbeat and further dependency can be extracted as such that and at time . The assurance is reflected and ensured within the operational range of dependencies . The dependency score is the probability score associated with the operational vector of two independent attributes.
The purpose of multidimensional mapping of attributes is to ensure the interdependencies of each progressive element are further associated or integrated with at time under the computational environment of mapping . Consider the case where ; then, Equation (5) is used for computing the mapping .
Dependency Attribute Mapping
The dependencies the result from multi-trained models on the distribution index for mapping generated with reference to Equation (5). The process of mapping primarily includes the computation of PD attribute and CV attributes dependencies, whereas these attributes are yet defined and validated within the operational limits of mapping attributes. Thus, the dependencies of each functional mapping are extracted and validated in this section. Typically, the dependencies are formulated within a thresholding range of sustainable attributes influencing the occurrence of cardiovascular event within contributing PD attributes. The support vector of the dependency matrix is extracted and fetched as shown in Equation (6).
Thus, according to Equation (7), the computational differences in dependency attributes mapping are based on the mapping occurrence of PD attribute and its associated CV attributes and further intersection with the relevance of independent CV-attribute associated with instance for the validated dependency mapping. The generative attribute is further associated with two independent attributes. The further is validated with the padding matrix. The padding values associated with the dependency attribute are to reflect the association of interdependency between the and fetching features. The features are primarily not validated in the phase, whereas they are extracted and aligned in the padding operation. Here, F_i denotes the ith extracted feature, P_Fi its padded representation, and P_F the resulting padded feature representation. D_Ai and D_Aj denote the mapped dependency attributes indexed by i and j, respectively. Consider the feature set to be extracted with collective features as in alignment with padding of features such as such that and has a well-defined feature set attribute correlation matrix as shown in Equation (8).
Thus, from Equations (9) and (10), we can conclude that the occurrence ratio of padding features is dependent on the union of at the given time by providing a reliable factor of padding attributes across the dependencies to extract effective results. Fundamentally, the processes of padding features are correlated to the feature set generation at local processing unit/model and further synchronized with the global model for evaluation. The global features and local/initial features are further aligned and synchronized as shown in Equation (11) for feature representation . The global feature set G_F and the initial local feature set F_I are aligned to form F. In Equations (11) and (12), ΔF_Ii and ΔG_Fj denote variations in the ith local feature and the jth global feature, respectively.
According to Equation (12), the functional parameters of , the dependency features for classifying PD occurrence with respect to CV events are denoted within and such that unbiased features are extracted and evaluated. Typically, the process of feature bound interconnected ratio with and thus the feature ratio and because and occurrence of factor is preceded with as whereas and . These ratios of dependencies can be observed in Equation (12) where a summarized time interval is replaced with instances. The overall attribution function for and features is not directly dependent without an interdependency feature from local models such that on a regular interval of time. The coordination thus reflects the PD’s influencing feature supported by cardiovascular events.
Experimental setup
The research involved 7539 adult peritoneal dialysis patients, with an average age of 49.9 ± 15.0 years; the group included 55.8% men and 44.2% women. Among the research participants, 52.5% of the patients had advanced existing peritoneal dialysis and 47.5% were newly diagnosed with peritoneal dialysis. The average period of dialysis was 19.2 months with an interquartile range of 6.1 to 40.4 months. For the primary evaluation, 7539 patients were randomly divided once, without stratification, into a training set of 6031 patients (80%) and a held-out test set of 1508 patients (20%). The same partition was used for the compared models, and the test set was evaluated after model training. No cross-validation or repeated 80:20 runs were performed. The additional 40:60 and 60:40 training–validation configurations represent different partition proportions; they do not measure variability across repeated 80:20 splits. Consequently, estimates of run-to-run variability are not available.
4. Results
The influence of PD and its association with cardiovascular event occurrence is studied and validated in this research article. The purpose of the study is to include and validate features corresponding to the primary PD occurrence driven and influenced by cardiovascular events. The analyses reported here refer to the PDTAP cohort of 7539 patients described in Section 3.1 and Table 1. The observation matrix obtained via the defined technique has retrieved a structural dependency of feature-to-feature (F:F) ratio by computing deep feature extraction and learning in a phased manner.
The chronic attributes and dependency features are bound for validation as presented in Table 1. The PD attributes considered are directly dependent on the PD occurrence as per healthcare experts whereas the reflective patterns of dependency are drawn from CV-attributes. The dependency score and mapping score are computed for a higher ratio of decision-making. The process of feature-to-feature correlation mapping and feature-to-attribute dependency is fetched via Random Forest and SVM algorithms in classifying the dependencies of each attribute/feature. The True (T) and False (F) ratios are computed with precision (P), F1-score (F1) and recall (R) under a generative accuracy (A). The score values are bound with TP/TN/FP/FN alignments on the feature-to-attribute dependency according to multidimensional attributes mapping (MAM), the bounding score is dependent on TP ratio v/s the TN and FP ratio for determining the True Positive Rate (TPR). Technically, the computation of these matrices is represented in Table 3.
Table 3.
Performance metric of PDTAP dataset ratio at various ML techniques.
The computational model is represented via receiver operating characteristic (ROC) of DL-based multi-feature extraction technique proposed under the schematic as shown in Figure 6. The representation of ROC is bound to feature the training and validation matrix of each attribute element associated within the classification. The overall fitting of performance with proposed local and global feature mapping is represented in Table 3. ROC analysis has been carried out to assess the discriminative power of the models under study for different classification levels. The ROC curve was developed by altering the level of classification and indicating the resulting TPR against the FPR.
Figure 6.
ROC curve for training and testing models of PD/CVD datasets.
The AUROC results for the models have been presented in Table 3. The Random Forest and SVM models generated AUROC indices equal to 0.7412 and 0.7218, respectively, while the DL-based mapping features models produced higher AUROC indices compared to the two models. The local and global mapping features models obtained 0.8712 and 0.9241, respectively, which shows that the ROC analysis confirms the previously obtained findings regarding better class discrimination capabilities for the proposed DL mapping approach. The ROC analysis adds to the classification performance measures shown in Table 3. The indicators such as accuracy, precision, recall, and F1-score describe the classification accuracy with regard to a specific decision threshold, unlike the AUROC, which shows how well the model discriminates between two classes across different decision thresholds.
This specificity of AUROC scores supports the very good classification performance established on the basis of the DL models. The global feature-mapping model got an AUROC score of 0.9241 along with an accuracy of 89.62%, precision of 91.11%, recall of 97.24%, and F1-score of 93.20%. This means that the model is able to differentiate classes across multiple decision thresholds.
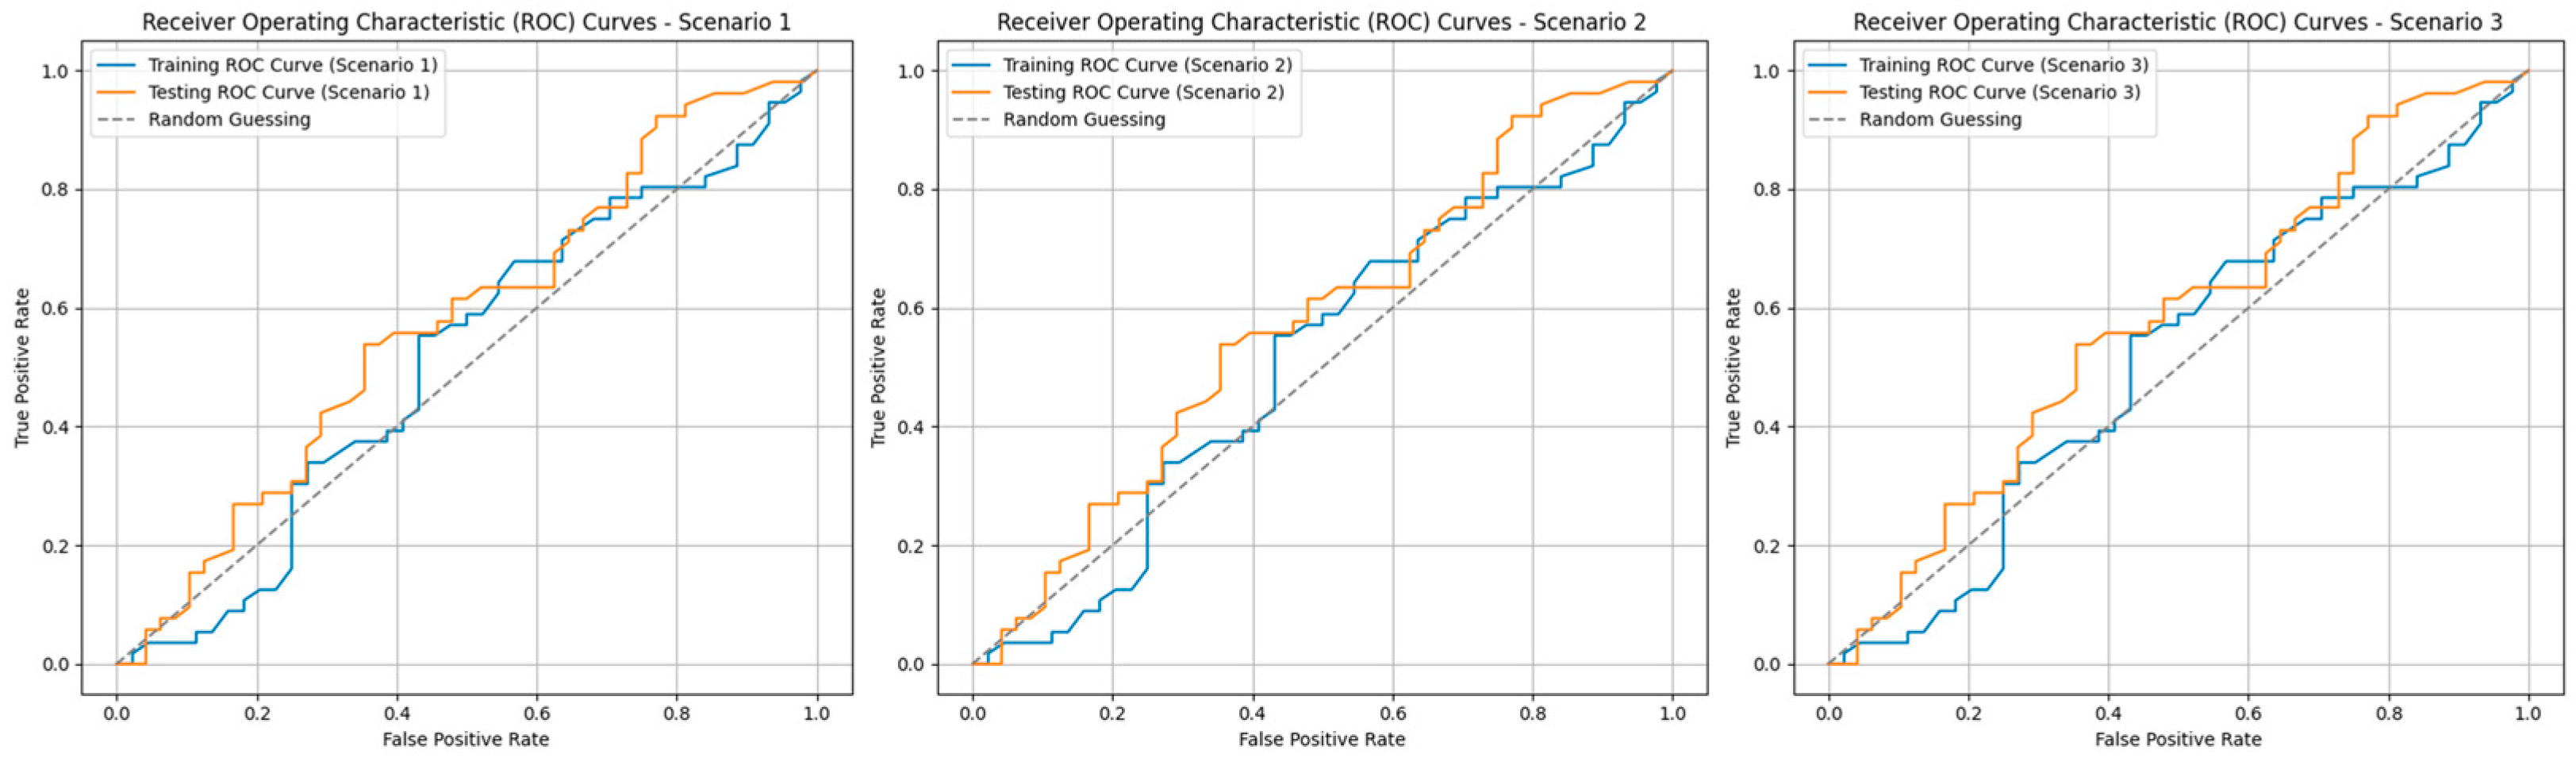
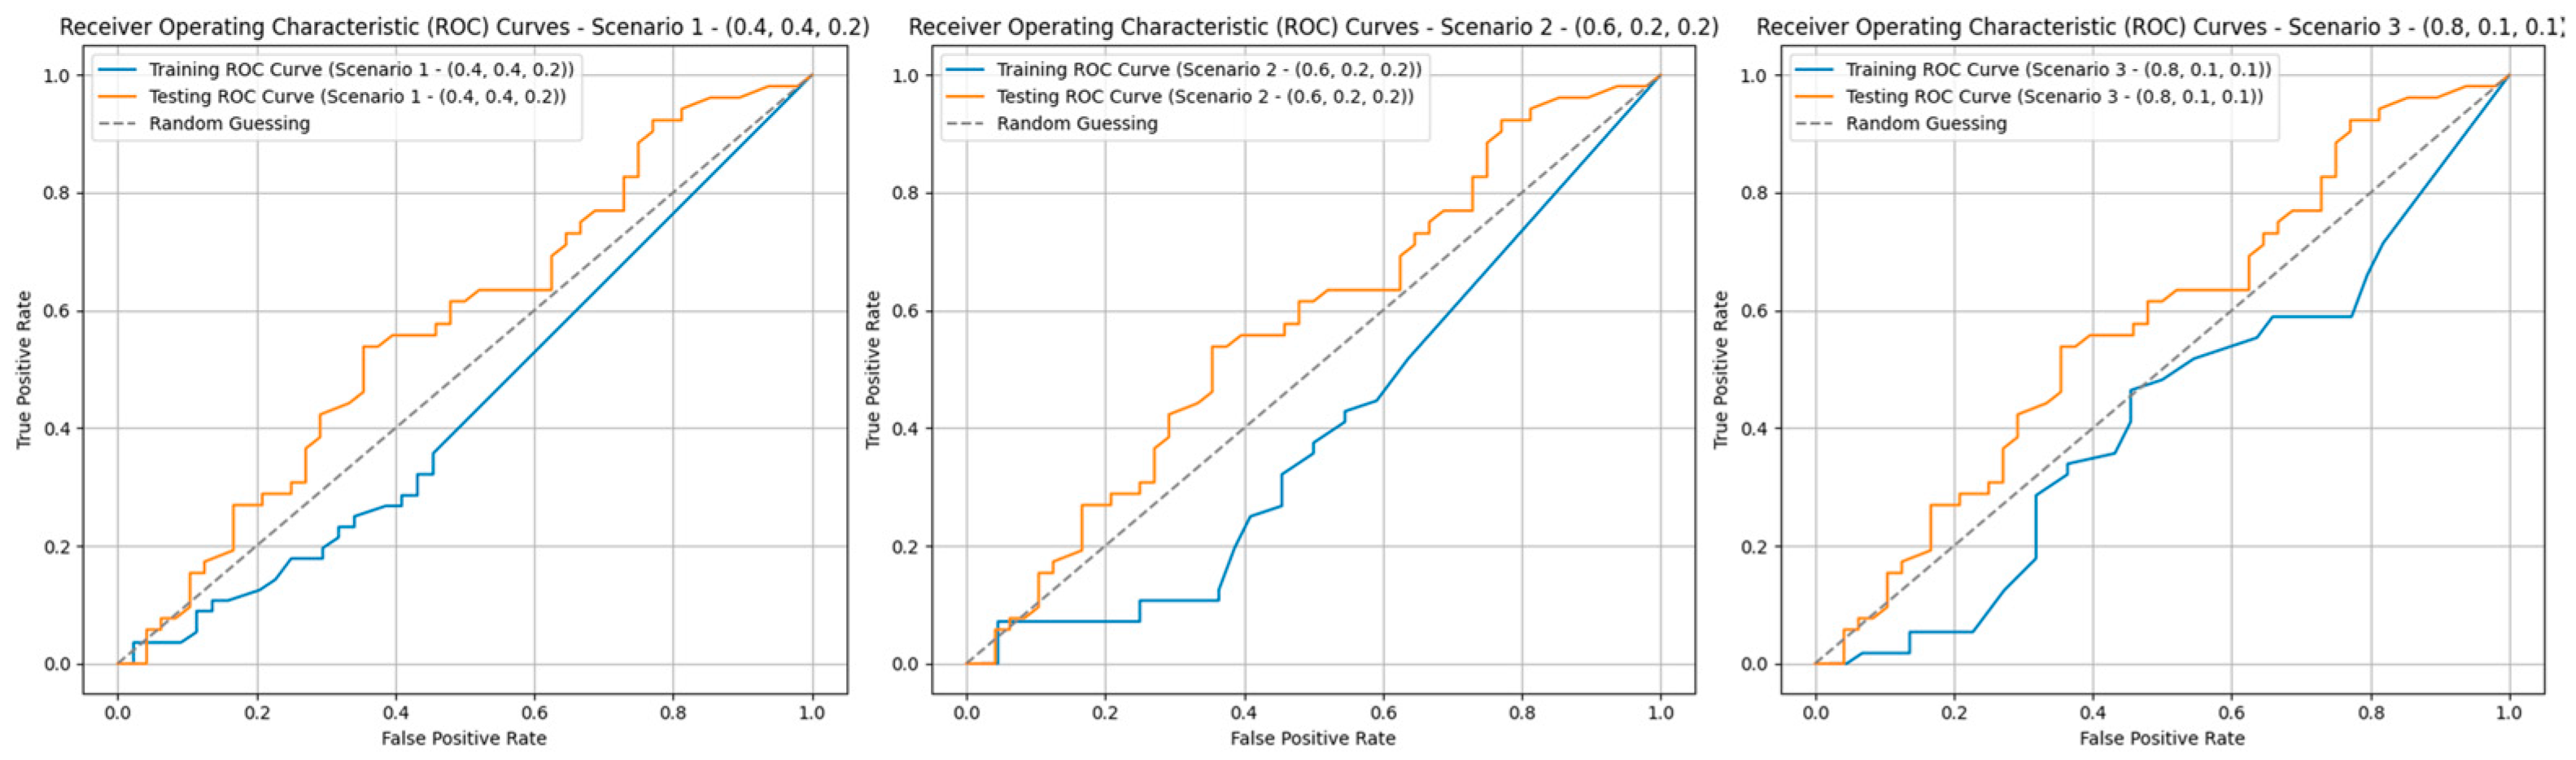
Confidence intervals could not be provided as the previous analysis preserved only the aggregate ROC curves and not the prediction results on the individual samples. Hence, the required and accurate 95% confidence intervals could not be obtained via reconstruction of the plotted curves. Therefore, using the estimated confidence intervals would lead to providing the misrepresentation of the statistical uncertainty pertaining to AUROC values. In Figure 7, one can observe the ROC performance across three experimental parameter situations (0.4, 0.4, 0.2), (0.6, 0.2, 0.2), and (0.8, 0.1, 0.1). Each situation has both training and testing ROC curves, revealing the discrimination capacity for the corresponding parameters.
Figure 7.
Training and testing at instance ratio for PD- and CVD-based ROC representation.
The ROC is computed for three scenarios, primarily the base attribute-feature mapping in the PD attribute referred to as ‘Scenario 1’, the local computation model with minimal initial attribute-feature mapping in PD and CVD referred to as ‘Scenario 2’ and the global training model referred to as ‘Scenario 3’. The ROC computation in this process has improved the False Positive Rate (FPR) and hence accounts for the stable dependency mapping as shown in Table 4. The Feature Prediction Rate and the FPR ratio are aligned with the dependency score to ensure the correctness of peritoneal dialysis attribute occurrence in the CV process and vice versa. The interim complexity of evaluating the outcome of the trained and validated model is shown in Table 5. The training is progressed with 40%, 60% and 80% whereas the corresponding validation is with respect to 60%, 40% and 20%. The detailed representation is shown in Figure 7 with each training and testing model of ROC with reference to the ratio on the above-mentioned three scenarios.
Table 4.
Dependency ratio computation between local and global models.
Table 5.
Training and validation computation of local and global models.
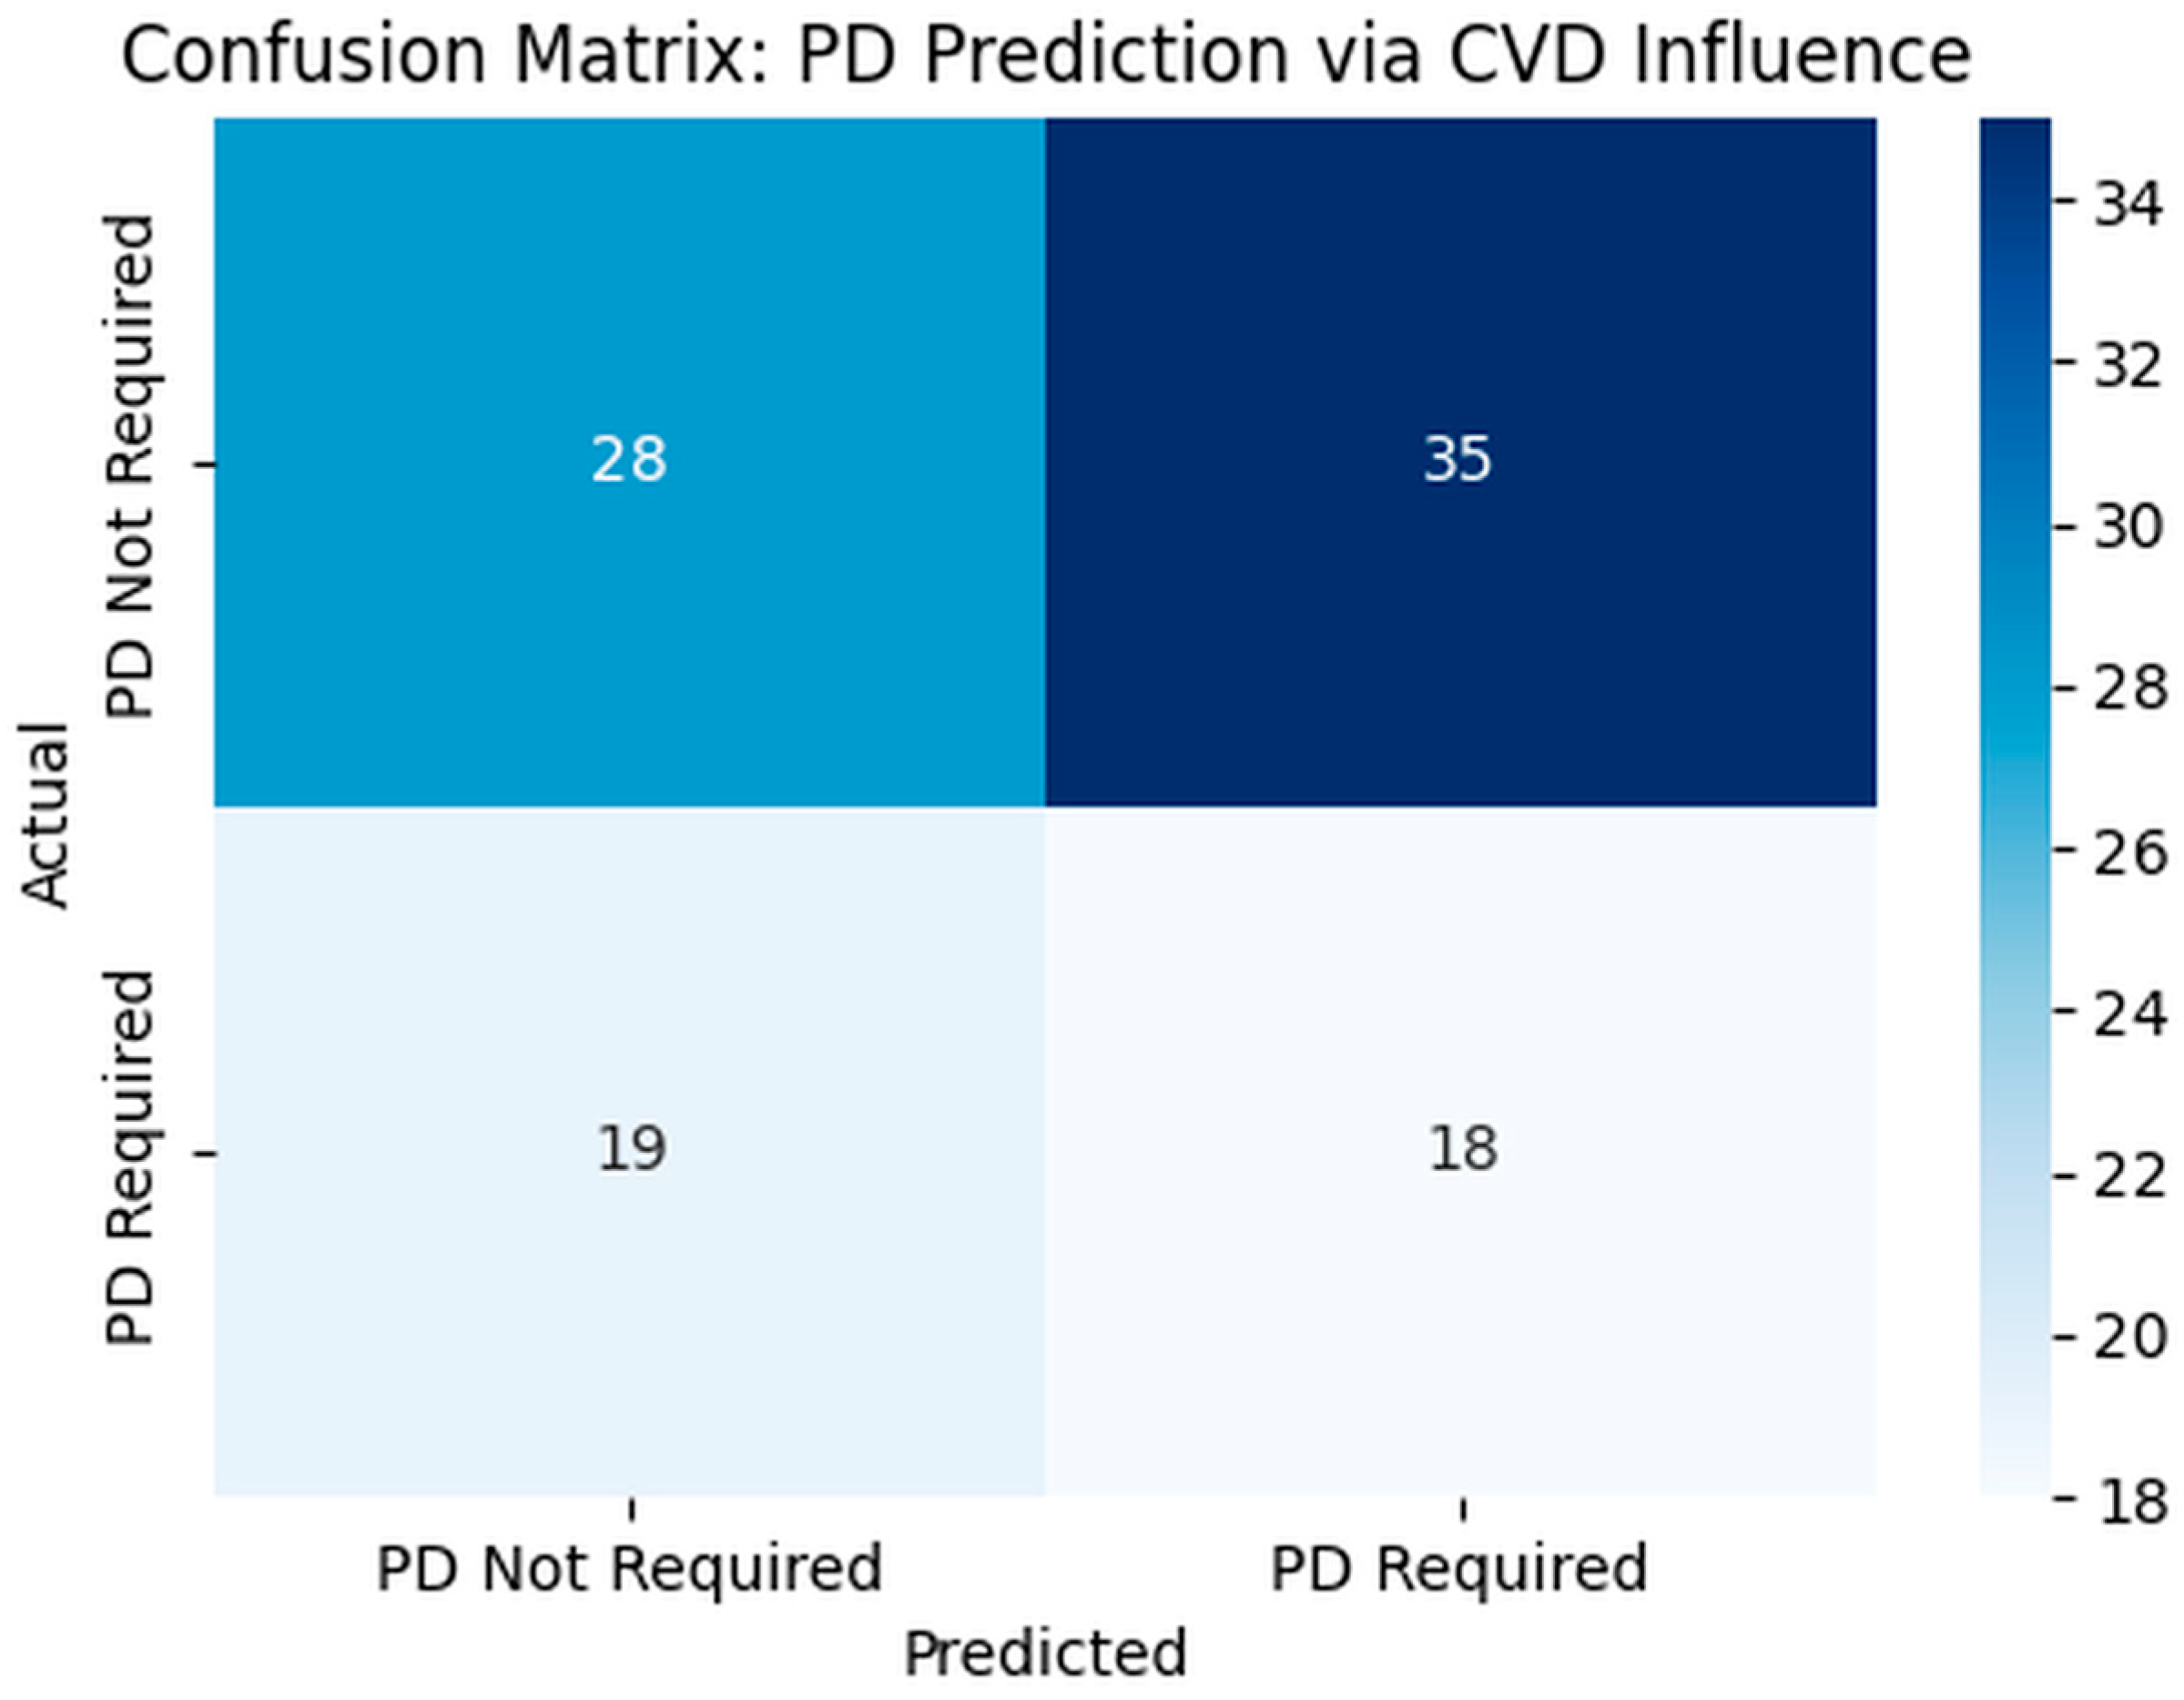
The CVD attributes are interdependent in nature and hence, the correlation between the CVD and PD attributes is extracted from True Positive Ratio (TPR) and thus the dependencies of these TPRs are bound with the primary feature prediction ratio and the dependency ratio as demonstrated in Figure 8. The primary goal of the dependency ratio is to validate the dependency of CVD on PD and vice versa under the predominant area of extraction and pattern mapping. The local model is expected to have a higher dependency ratio for the mapping since the data are localized at the centralized server and hence the external dependencies of attribute influence are eliminated. The local model achieved 93.627% accuracy in extracting the dependency score, whereas the global model was 2.154% lower than the local model due to external factors and decentralization of the datasets and learning models.
Figure 8.
Confusion matrix.
The percentages reported in Table 5 represent the classification accuracy (%) obtained by the local and global models under different training–validation split configurations. The training percentage indicates the accuracy obtained on the training subset, whereas the validation percentage indicates the accuracy obtained on the corresponding validation subset. The table reports the model performance for the evaluated split configurations and is intended to show the variation in predictive performance across different proportions of training and validation data.
It can be observed that, for some configurations, the validation accuracy is higher than the corresponding training accuracy. This observation does not necessarily indicate improved model learning on unseen data. The training and validation subsets can differ in their composition and difficulty, particularly in a heterogeneous clinical dataset, resulting in variation in the measured accuracy. Therefore, these values are reported as obtained for the respective data partitions and should not be interpreted as evidence that validation performance is inherently superior to training performance.
Ablation Analysis
In order to assess the importance of each component in the proposed ProPDD-GWM approach, an ablation experiment was performed by incrementally introducing the key components of the approach. The experiment included four configurations: (i) DL-only, which is the basic deep-learning model without any dependency mapping or Grey Wolf Optimization; (ii) DL + dependency mapping, where the MADM dependency mapping mechanism is included in order to capture how the input variables are dependent on each other; (iii) DL + GWM, in which the Grey Wolf Marking (GWM) is included in the deep-learning model alone without any dependency mapping; (iv) the complete ProPDD-GWM framework, which combines DL, dependency mapping, and GWM.
The findings reveal a progressive growth in classification capability with the incorporation of the suggested elements. The DL-only configuration represents the baseline performance, while the inclusion of dependency mapping enhances the representation of feature relationships and improves classifications. Adding GWM further enhances performance as it optimizes the relevant configuration of features and decisions. The full ProPDD-GWM framework achieves the highest total performance, proving that improvement is brought about by the combined effect of dependency mapping and GWM, rather than deep learning. The results of the ablation study can be found in Table 6.
Table 6.
Ablation analysis
Robustness and Clinical Relevance: The robustness of the proposed framework was assessed within the available dataset by evaluating its performance under different training–validation split configurations. The reported accuracy, TPR, FPR, precision, recall, F1-score, and ROC results provide complementary evidence of predictive performance for the evaluated data partitions. The multicenter nature of the cohort, comprising patients from 27 tertiary hospitals, also provides heterogeneity in the available patient characteristics. However, these results demonstrate internal predictive performance rather than definitive clinical utility. External validation using an independent PD cohort, temporal validation, calibration assessment, and prospective clinical evaluation would be required to establish generalizability and clinical usefulness. Therefore, the proposed framework should currently be considered a predictive decision-support approach rather than a clinically validated diagnostic system.
5. Discussion
The present study evaluated the ProPDD-GWM framework for modelling structured dependencies between peritoneal dialysis-related variables and cardiovascular risk. The global deep-learning feature-mapping model achieved an accuracy of 92.41%, with a true-positive rate of 93.2% and a false-positive rate of 6.8%, outperforming the Random Forest and support vector machine models. At the 80%/20% training–validation split, the local model achieved training and validation accuracies of 95.62% and 92.64%, respectively. The local model also obtained slightly higher feature-prediction and dependency ratios than the global model (94.32% versus 93.11% and 93.627% versus 91.473%, respectively). These findings suggest that combining patient-specific features with global threshold information can preserve individualized clinical patterns while maintaining stable decision boundaries.
The results are consistent with previous studies showing that machine-learning methods can support cardiovascular risk stratification in peritoneal dialysis populations [23,24]. However, previous approaches have generally focused on overall predictive performance or isolated predictors, whereas evidence concerning structured interdependencies and optimization-driven deep-learning models remains limited [25,26,27]. The proposed Multidimensional Attribute Dependency Mapping and Grey Wolf Marking components extend previous work by mapping the relationships between dialysis-specific and cardiovascular attributes before classification. The improvement over the comparison models supports the hypothesis that multidimensional dependency modelling may capture clinically relevant interactions that conventional feature-independent approaches overlook. Metaheuristic and hybrid optimization methods have similarly improved feature selection in other predictive settings [28,29,30].
Several limitations should be considered. The primary performance estimates were obtained from one random, non-stratified 80:20 train–test split of a single multicenter cohort, without repeated runs or cross-validation. The reported high performance may depend on which patients and outcome classes happened to be allocated to the test set; its stability across other random splits is unknown. Patient-level predictions were not retained, so an AUROC confidence interval cannot be reconstructed reliably from the available aggregate ROC curves. These findings represent preliminary internal performance and should not be interpreted as evidence of clinical effectiveness. Independent external and temporal validation, assessment of model calibration, and evaluation across centres and clinically relevant patient subgroups are required. Future studies should also compare the framework with established clinical risk models, investigate the contribution of individual variables using explainable methods, and determine whether model-assisted risk stratification improves prospective clinical decision-making. Accordingly, the ProPDD-GWM framework should currently be considered a promising decision-support approach rather than a clinically deployable diagnostic tool.
6. Conclusions
The proposed technique has validated the outcomes of feature dependency between peritoneal dialysis (PD) and cardiovascular disease (CVD). The proposed technique has deployed the grey wolf optimization for multidimensional attribute mapping and feature coordination. The dependency of attributes (CVD-PD) is based on the attribute mapping ratios such as ROC, dependency ratio and TPR for feature prediction and mapping. The proposed technique employs a deep learning and training model for customizing the feature selection and mapping over chronic PD attributes with respect to the occurrence of cardiovascular events. The training model under local feature computation has achieved an accuracy of 95.62% with 80% training and 20% validation. The cumulative observation has resulted in higher performance accuracy in decision-making for local and global models. In the future, the technique can be validated on attributes based on core chronic cardiovascular events with minimal dependency ratios for PD occurrence in a dynamic pattern evaluation of attributes and feature interdependencies.
Author Contributions
Conceptualization, I.M., R.S., V.V., O.G. and A.B.; Methodology, I.M., R.S., V.V. and V.D.K.; Software, I.M., V.V. and V.D.K.; Validation, R.S., V.V., V.D.K., O.G., C.B. and A.B.; Formal analysis, I.M., V.V. and V.D.K.; Investigation, I.M., R.S., V. V., V.D.K., O.G., C.B. and A.B.; Resources, I.M. and R.S.; Data curation, I. M., V.V. and V.D.K.; Writing—original draft, I.M., R.S., V.V. and V.D.K.; Writing—review & editing, I. M., O.G., C.B. and A.B.; Visualization, I.M., V.V. and V.D.K.; Supervision, R. S., O.G. and A.B.; Project administration, I.M. and R.S. All authors have read and agreed to the published version of the manuscript.
Funding
This research received no external funding.
Data Availability Statement
The dataset used in this study is publicly available through ClinicalTrials.gov under the identifier NCT03571451: https://www.clinicaltrials.gov/study/NCT03571451 (accessed on 23 September 2026).
Conflicts of Interest
The authors declare no conflicts of interest.
Abbreviations
The following abbreviations are used in this manuscript:
| AI | Artificial intelligence |
| APD | Automated peritoneal dialysis |
| AUC | Area under the curve |
| BMI | Body mass index |
| BP | Blood pressure |
| CAPD | Continuous ambulatory peritoneal dialysis |
| CNN | Convolutional neural network |
| CV | Cardiovascular |
| CVD | Cardiovascular disease |
| DL | Deep learning |
| ECG | Electrocardiogram |
| HER | Electronic health record |
| ESRD | End-stage renal disease |
| GWM | Grey Wolf Marking |
| k-NN | k-nearest neighbours |
| LSTM | Long short-term memory |
| MADM | Multidimensional Attribute Dependency Mapping |
| ML | Machine learning |
| PD | Peritoneal dialysis |
| ProPDD | Predictive Peritoneal Dialysis Diagnosis |
| ROC | Receiver operating characteristic |
| SVM | Support vector machine |
References
- Bai, Q.; Tang, W. Artificial Intelligence in Peritoneal Dialysis: General Overview. Ren. Fail. 2022, 44, 682–687. [Google Scholar] [CrossRef] [Scilit] [PubMed]
- Noh, J.; Yoo, K.D.; Bae, W.; Lee, J.S.; Kim, K.; Cho, J.H.; Lee, H.; Kim, D.K.; Lim, C.S.; Kang, S.-W.; et al. Prediction of the mortality risk in peritoneal dialysis patients using machine learning models: A nation-wide prospective cohort in Korea. Sci. Rep. 2020, 10, 7470. [Google Scholar] [CrossRef] [Scilit] [PubMed]
- Yang, J.; Wan, J.; Feng, L.; Hou, S.; Yv, K.; Xu, L.; Chen, K. Machine learning algorithms for the prediction of adverse prognosis in patients undergoing peritoneal dialysis. BMC Med. Inform. Decis. Mak. 2024, 24, 8. [Google Scholar] [CrossRef] [Scilit] [PubMed]
- Akbilgic, O.; Obi, Y.; Potukuchi, P.K.; Karabayir, I.; Nguyen, D.V.; Soohoo, M.; Streja, E.; Molnar, M.Z.; Rhee, C.M.; Kalantar-Zadeh, K.; et al. Machine learning to identify dialysis patients at high death risk. Kidney Int. Rep. 2019, 4, 1219–1229. [Google Scholar] [CrossRef] [Scilit] [PubMed]
- Xu, L.; Cao, F.; Wang, L.; Liu, W.; Gao, M.; Zhang, L.; Hong, F.; Lin, M. Machine learning model and nomogram to predict the risk of heart failure hospitalization in peritoneal dialysis patients. Ren. Fail. 2024, 46, 2324071. [Google Scholar] [CrossRef] [Scilit] [PubMed]
- Zang, Z.; Xu, Q.; Zhou, X.; Ma, N.; Pu, L.; Tang, Y.; Li, Z. Random forest can accurately predict the technique failure of peritoneal dialysis associated peritonitis patients. Front. Med. 2024, 10, 1335232. [Google Scholar] [CrossRef] [Scilit] [PubMed]
- García–López, E.; Carrero, J.J.; Suliman, M.E.; Lindholm, B.; Stenvinkel, P. Risk factors for cardiovascular disease in patients undergoing peritoneal dialysis. Perit. Dial. Int. 2007, 27, 205–209. [Google Scholar] [CrossRef] [Scilit]
- Sivakami, R.; Kumar, V.V.; Krishnamoorthy, N.; Yimer, T.E. Quantum-Enhanced Federated Blockchain for Privacy-Preserving Cardiovascular Intelligence. Sci. Rep. 2026, 16, 22221. [Google Scholar] [CrossRef] [Scilit] [PubMed]
- Wu, J.; Zhan, X.; Wen, Y.; Wang, X.; Feng, X.; Peng, F.; Wang, N.; Wu, X.; Wu, J. Preexisting cardiovascular disease, hypertension, and mortality in peritoneal dialysis. Rev. Cardiovasc. Med. 2023, 24, 30. [Google Scholar] [CrossRef] [Scilit] [PubMed]
- Olmaz, R.; Selen, T.; Gungor, O. Vascular calcification inhibitors and cardiovascular events in peritoneal dialysis patients. Ther. Apher. Dial. 2024, 28, 169–181. [Google Scholar] [CrossRef] [Scilit] [PubMed]
- Wang, L.; Fan, J.; Chen, X.; Lei, W.; Jiang, C.; Liu, H.; Yang, Y.; Shen, J. An Investigation into the Correlation between Intraperitoneal Teicoplanin Concentrations and Treatment Outcomes in Peritoneal Dialysis-Associated Peritonitis. Front. Pharmacol. 2024, 15, 1446774. [Google Scholar] [CrossRef] [Scilit] [PubMed]
- Bassil, E.; Matta, M.; El Gharably, H.; Harb, S.; Calle, J.; Arrigain, S.; Schold, J.; Taliercio, J.; Mehdi, A.; Nakhoul, G. Cardiac Surgery Outcomes in Patients Receiving Hemodialysis Versus Peritoneal Dialysis. Kidney Med. 2024, 6, 100774. [Google Scholar] [CrossRef] [Scilit] [PubMed]
- Dhiman, G.; Vinoth Kumar, V.; Kaur, A.; Sharma, A. Don: Deep learning and optimization-based framework for detection of novel coronavirus disease using x-ray images. Interdiscip. Sci. Comput. Life Sci. 2021, 13, 260–272. [Google Scholar] [CrossRef] [Scilit] [PubMed]
- Ushimaru, S.; Shimizu, S.; Osako, K.; Shibagaki, Y.; Sakurada, T. Association between inpatient education program for patients with pre-dialysis chronic kidney disease and new-onset cardiovascular disease after initiating dialysis. Clin. Exp. Nephrol. 2023, 27, 1042–1050. [Google Scholar] [CrossRef] [Scilit] [PubMed]
- Zhang, J.; Chen, Y.; Zhong, Y.; Wang, Y.; Huang, H.; Xu, W.; Pan, W.; Chen, L.; Zhu, Y.; Bischof, E.; et al. Intermittent Fasting and Cardiovascular Health: A Circadian Rhythm-Based Approach. Sci. Bull. 2025, 70, 2377–2389. [Google Scholar] [CrossRef] [Scilit] [PubMed]
- Ahmed, S.T.; Kumar, V.V.; Kim, J. AITel: eHealth augmented-intelligence-based telemedicine resource recommendation framework for IoT devices in smart cities. IEEE Internet Things J. 2023, 10, 18461–18468. [Google Scholar] [CrossRef] [Scilit]
- El-kenawy, E.-S.M.; Khodadadi, N.; Mirjalili, S.; Abdelhamid, A.A.; Eid, M.M.; Ibrahim, A. Greylag Goose Optimization: Nature-inspired optimization algorithm. Expert Syst. Appl. 2024, 238, 122147. [Google Scholar] [CrossRef] [Scilit]
- Wei, J.; Chen, H.; Yao, L.; Hou, X.; Zhang, R.; Shi, L.; Sun, J.; Hu, C.; Wei, X.; Jia, W. BioCompNet: A Deep Learning Workflow Enabling Automated Body Composition Analysis toward Precision Management of Cardiometabolic Disorders. Cyborg Bionic Syst. 2025, 6, 0381. [Google Scholar] [CrossRef] [Scilit] [PubMed]
- Javaid, A.; Zghyer, F.; Kim, C.; Spaulding, E.M.; Isakadze, N.; Ding, J.; Kargillis, D.; Gao, Y.; Rahman, F.; Brown, D.E.; et al. Medicine 2032: The future of cardiovascular disease prevention with machine learning and digital health technology. Am. J. Prev. Cardiol. 2022, 12, 100379. [Google Scholar] [CrossRef] [Scilit] [PubMed]
- Yassen, M.A.; Abdel-Fattah, M.G.; Ismail, I.; Kenawy, E.S.M.E.; Moustafa, H.E.D. An AI-Based System for Predicting Renewable Energy Power Output Using Advanced Optimization Algorithms. J. Artif. Intell. Metaheuristics 2024, 8, 1–8. [Google Scholar] [CrossRef] [Scilit]
- El-Sayed, M.; Marwa, M.; Abualigah, L. Machine Learning in Public Health Forecasting and Monitoring the Zika Virus. Metaheuristic Optim. Rev. 2024, 1, 1–11. [Google Scholar] [CrossRef] [Scilit]
- Li, Y.; Luo, J.-H.; Dai, Q.-Y.; Eshraghian, J.K.; Ling, B.W.-K.; Zheng, C.-Y.; Wang, X.-L. A Deep Learning Approach to Cardiovascular Disease Classification Using Empirical Mode Decomposition for ECG Feature Extraction. Biomed. Signal Process. Control 2023, 79, 104188. [Google Scholar] [CrossRef] [Scilit]
- Liu, L.; Zhang, L.; Zhang, D.; Guan, T.; He, T.; Liang, B.; Zhao, J. Risk Prediction of Cardiovascular Events in Peritoneal Dialysis Patients. BMC Nephrol. 2025, 26, 177. [Google Scholar] [CrossRef] [Scilit] [PubMed]
- Wang, L.; Tao, X.; Zhang, N.; Yang, X.; Jiang, H.; Li, X.; Wang, S.; Ding, S.; Yu, S.; Zhang, H.; et al. Macrophagic Sclerostin Loop2-ApoER2 Interaction Required by Sclerostin for Cardiovascular Protective Action. Adv. Sci. 2026, 13, e18735. [Google Scholar] [CrossRef] [Scilit] [PubMed]
- Mushtaq, M.M.; Mushtaq, M.; Ali, H.; Sarwar, M.A.; Bokhari, S.F.H. Artificial intelligence and machine learning in peritoneal dialysis: A systematic review of clinical outcomes and predictive modeling. Int. Urol. Nephrol. 2024, 56, 3857–3867. [Google Scholar] [CrossRef] [Scilit] [PubMed]
- Qiu, W.; Quan, C.; Yu, Y.; Kara, E.; Qian, K.; Hu, B.; Schuller, B.W.; Yamamoto, Y. Federated Abnormal Heart Sound Detection with Weak to No Labels. Cyborg Bionic Syst. 2024, 5, 0152. [Google Scholar] [CrossRef] [Scilit] [PubMed]
- Al-Alshaikh, H.A.; P, P.; Poonia, R.C.; Saudagar, A.K.J.; Yadav, M.; AlSagri, H.S.; AlSanad, A.A. Comprehensive evaluation and performance analysis of machine learning in heart disease prediction. Sci. Rep. 2024, 14, 7819. [Google Scholar] [CrossRef] [Scilit] [PubMed]
- Ameen, A.; Fattoh, I.E.; Abd El-Hafeez, T.; Ahmed, K. Advances in ECG and PCG-based cardiovascular disease classification: A review of deep learning and machine learning methods. J. Big Data 2024, 11, 159. [Google Scholar] [CrossRef] [Scilit]
- Mostofi, S.; Kordrostami, S.; Refahi Sheikhani, A.H.; Faridi Masouleh, M.; Shokri, S. Diagnosis of heart disease using an advanced triple hybrid algorithm combining machine learning techniques. J. Model. Manag. 2025, 20, 668–700. [Google Scholar] [CrossRef] [Scilit]
- Su, X.; Li, Z.; Yuan, X.; Yang, Y.; Guo, L.; Chen, D. An Integrated Computational Workflow for Myocardial Perfusion Combining the Multiple-Network Poroelastic Theory and Subject-Specific Imaging Data. Phys. Fluids 2026, 38, 011911. [Google Scholar] [CrossRef] [Scilit]
- Dataset: PDTAP. Available online: https://www.clinicaltrials.gov/study/NCT03571451 (accessed on 10 January 2026).

Disclaimer/Publisher’s Note: The statements, opinions and data contained in all publications are solely those of the individual author(s) and contributor(s) and not of MDPI and/or the editor(s). MDPI and/or the editor(s) disclaim responsibility for any injury to people or property resulting from any ideas, methods, instructions or products referred to in the content. |
© 2026 by the authors. Licensee MDPI, Basel, Switzerland. This article is an open access article distributed under the terms and conditions of the Creative Commons Attribution (CC BY) license.