


Abstract
RGB–infrared object detection relies on complementary information from two modalities, yet it implicitly assumes that the imaging quality of both stays stable. In practice, factors such as component aging and sensor gain drift can degrade one modality, a condition termed a modality anomaly. This work addresses the amplitude-attenuation regime of this condition and evaluates two representative cases: darkening of the visible image and flattening of infrared contrast. Fusion strategies trained on clean data are tied to the healthy statistics of both modalities. Once one side degrades, corrupted features propagate through fixed fusion weights and cause a disproportionate loss in accuracy. To solve this problem, this communication proposes a Spectral Rebalancing Network (SRNet) that restores robustness when either modality is degraded. The network preserves phase and adjusts amplitude in the frequency domain, and it contains two complementary modules: Cross-modal Amplitude Band Swapping (CABS), a training-only augmentation that reduces spectral overfitting at zero inference cost, and Band-wise Spectral Adaptive Fusion (BSAF), which replaces element-wise addition with content-adaptive spectral rebalancing. On M3FD and its degradation benchmarks, SRNet achieves the highest clean-data mAP, and it keeps the best accuracy among the compared methods at every degradation level on both sides. The gap between its accuracy in the two degradation directions is also the smallest.
1. Introduction
Visible and infrared sensors capture complementary information about a scene [1,2,3]. Fusing both modalities enables more accurate and reliable detection than using either alone [4,5,6]. RGB–infrared object detection has thus been widely deployed in autonomous driving and surveillance. These systems increasingly operate in long-term, unattended environments, so their robustness under practical conditions becomes a critical concern [7,8].
Recent work has improved RGB–infrared perception through dynamic and quality-aware fusion. RSDet [9] removes redundant spectral information and dynamically selects useful cross-modal features, while ConTriNet [10] aggregates modality-specific and complementary cues for RGB-T salient object detection. IAF-RTDETR [2] estimates illumination and adjusts multi-scale fusion weights accordingly. These methods adapt fusion using spectral, semantic, or illumination cues. However, they focus on selecting complementary features or on weighting the two modalities according to the scene. None of them models modality degradation in a unified way.
Li et al. [7] use evidential hybrid fusion to estimate uncertainty and improve robustness to modality noise or corruption. For modality degradation, Tian et al. [11] introduce pseudo-degradation training and a quality-aware module. However, as reported in that work, robustness remains imbalanced across the two degradation directions. This imbalance reflects two inherent challenges. First, suppressing the degraded modality discards structural content that may persist after degradation [12,13]. Second, degradations vary widely in spatial appearance, which limits the transferability of designs tailored to a specific form [14,15].
Prior frequency-domain studies show that many common degradations primarily affect the amplitude spectrum in a band-wise manner. The phase spectrum, which encodes structural information such as edges and contours, remains comparatively stable [16,17,18,19]. This commonality suggests that image degradations can be modeled through frequency-domain characteristics rather than spatial appearance, without designing for each spatial form separately. Rather than identifying the form a degradation takes and reweighting the two modalities accordingly, this view compensates for what different degradations share. No degradation-specific supervision or prior is therefore required. We adopt the principle of preserving phase and selectively adjusting amplitude.
Following this principle, we propose a Spectral Rebalancing Network (SRNet) with two complementary modules that model amplitude per band at the input stage and at the feature-fusion stage. At the input stage, Cross-modal Amplitude Band Swapping (CABS) swaps amplitude at randomly selected frequency bands between the two modalities while preserving phase. It reduces spectral overfitting at zero inference cost. However, this training-time regularization cannot adapt the fusion process to the spectral imbalance of a particular test pair. Band-wise Spectral Adaptive Fusion (BSAF) therefore complements CABS at the feature-fusion stage by replacing element-wise addition with content-adaptive, per-band spectral rebalancing. It reads the spectral energy profiles of both modalities and generates band-specific fusion gains to compensate for shifts in the amplitude distribution that vary from sample to sample.
The main contributions of this communication are as follows:
- A spectral rebalancing framework, SRNet, is proposed to improve robustness against amplitude-attenuation modality anomalies in RGB–infrared detection, based on a per-band principle in the frequency domain.
- A training-only band-swapping augmentation, CABS, is introduced to mitigate modality-specific spectral overfitting by exchanging amplitude across the two modalities at zero inference cost.
- A Band-wise Spectral Adaptive Fusion module, BSAF, is proposed to replace fixed element-wise addition and compensate for shifts in the amplitude distribution. It achieves balanced robustness across both degradation directions.
2. Materials and Methods
2.1. Overview
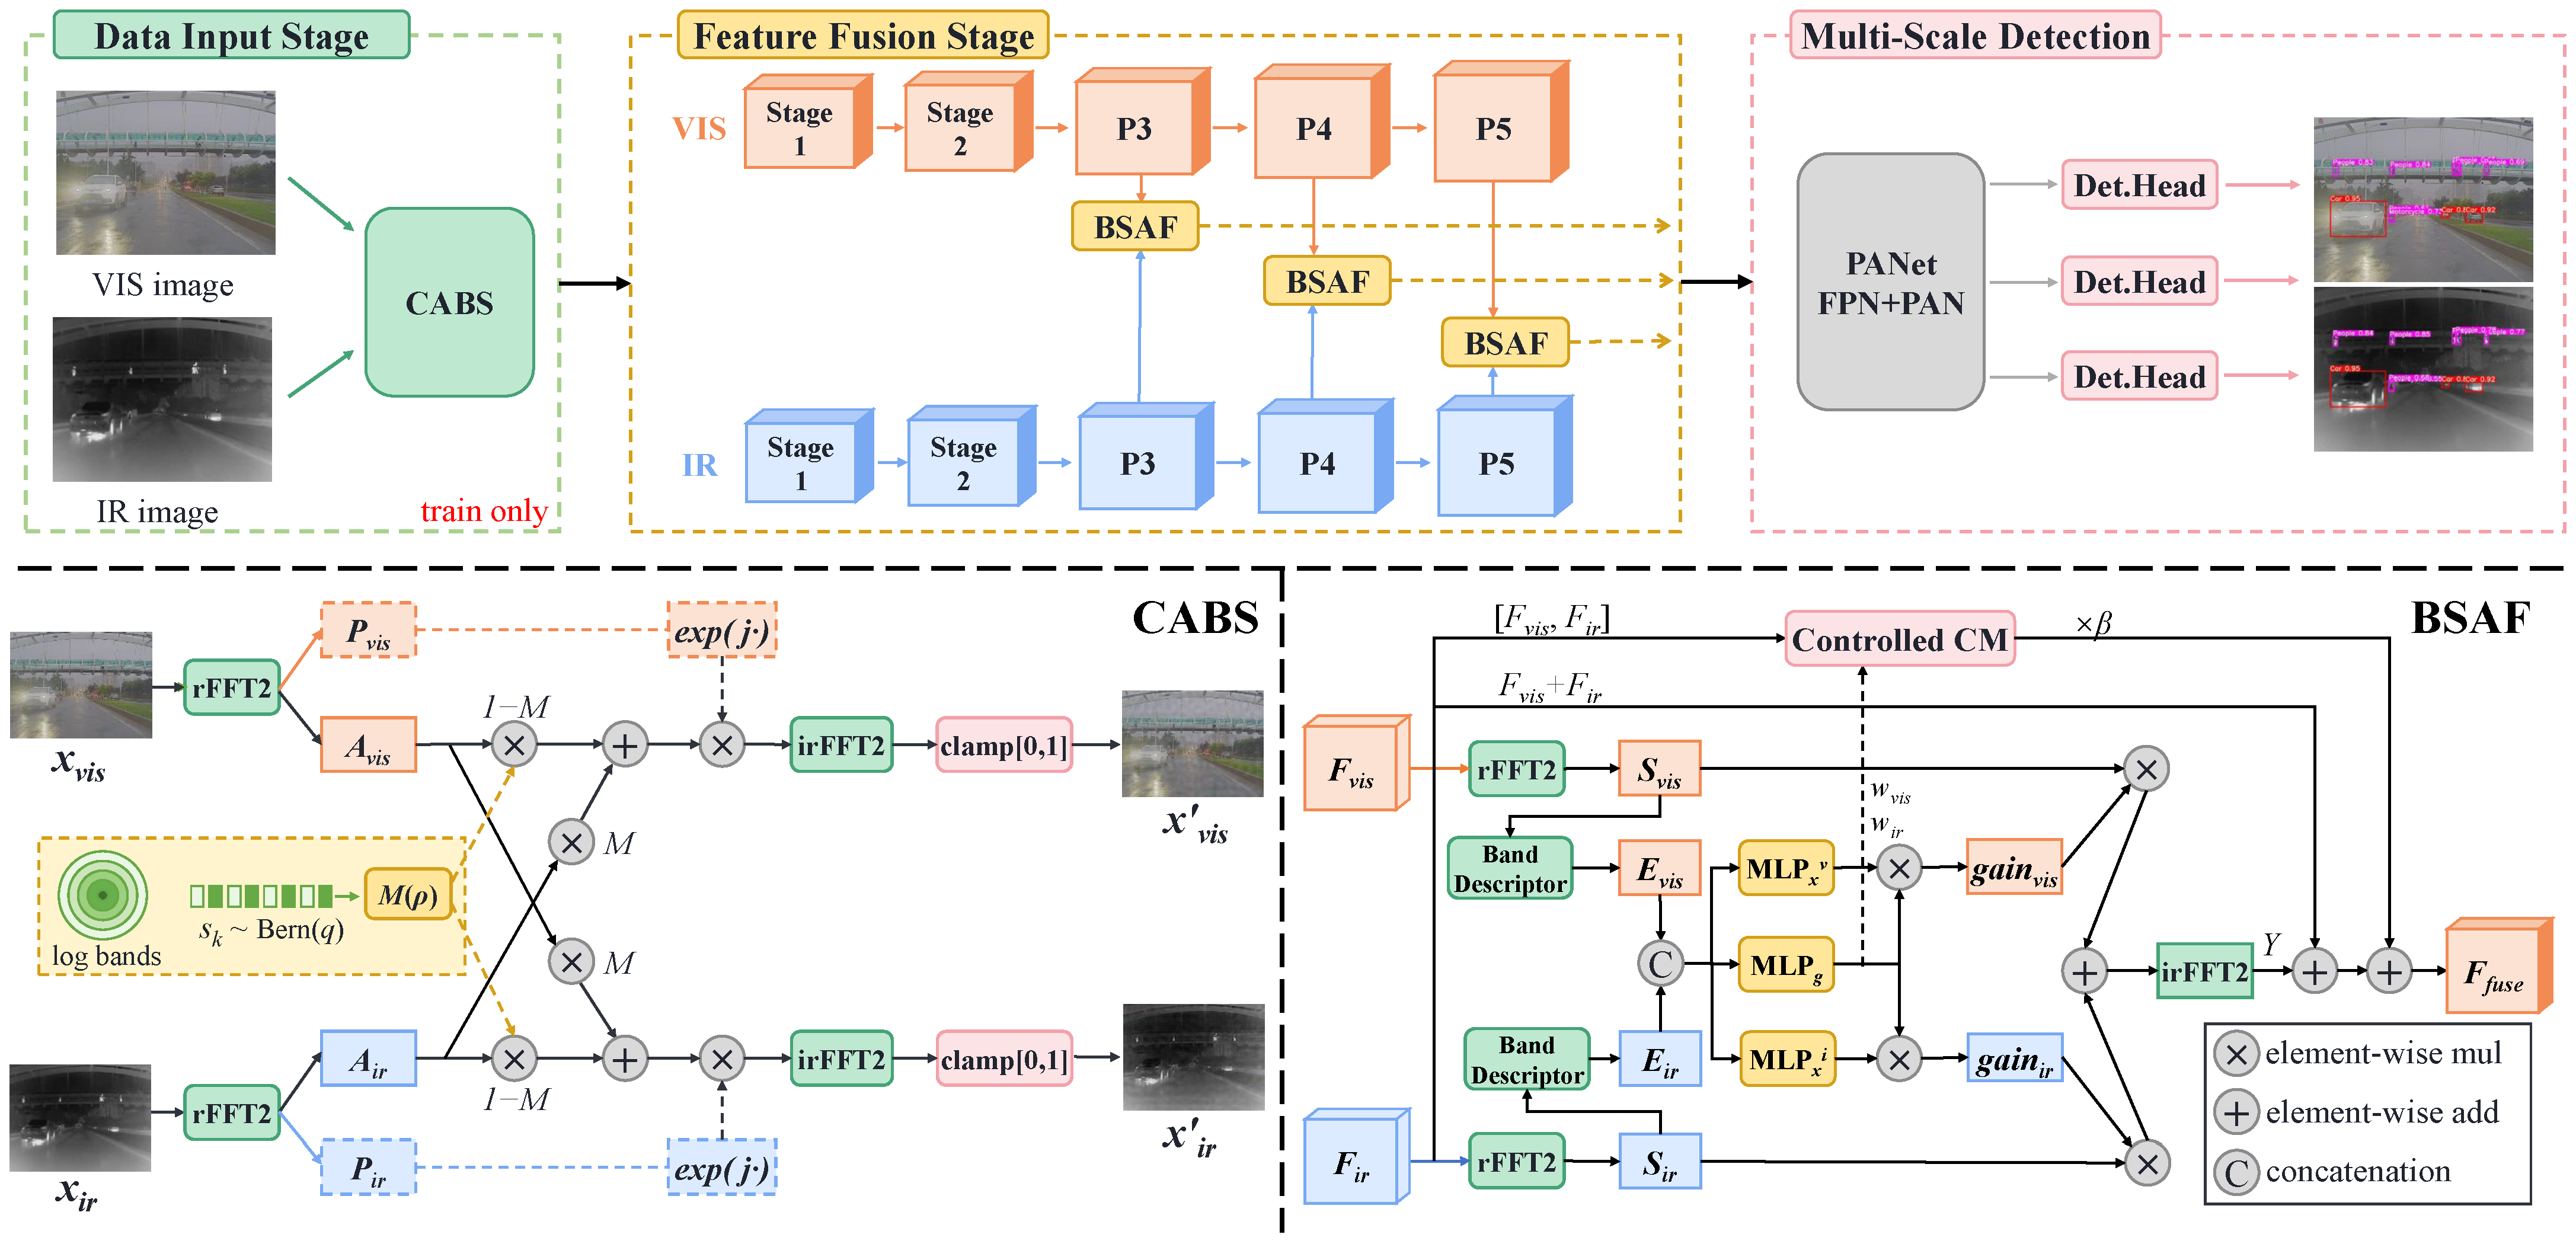
As illustrated in Figure 1, the pipeline consists of three stages. In the data input stage, CABS swaps amplitude bands between the two modalities with probability p during training. This exposes each branch to the other modality’s amplitude statistics at zero inference cost. In the feature-fusion stage, two symmetric CSPDarknet backbones extract visible and infrared features. At each of the P3, P4, and P5 scales, BSAF replaces element-wise addition with band-wise cross-modal fusion. In the multi-scale detection stage, the fused features are aggregated by the PANet neck and fed to three detection heads.
Figure 1.
Overview of SRNet. (Top): the dual-stream detection pipeline with training-only CABS augmentation at the input and BSAF fusion at P3–P5. (Bottom): the internal structures of CABS (left) and BSAF (right).
Both CABS and BSAF operate on a shared set of radial frequency bands defined on the normalized frequency radius , where and are the Nyquist indices of the transformed map. This gives at the spectral corner and at the single-axis Nyquist edge. Since is relative to the size of the map, the same band layout applies at every stage. The band edges form a geometric progression, and for with , so that every band spans an identical frequency ratio. The lowest band also absorbs the DC component. Since natural-image amplitude energy follows the law and concentrates in low frequencies, this constant relative bandwidth prevents the low-frequency range from collapsing into a single band. All band boundaries are softened with sigmoid transitions to suppress Gibbs ringing. Band k is realized as a soft window , where is the sigmoid. The outer sides of the first and the last band are set to one, so that no energy is lost at the ends of the spectrum. The transition width is . It is proportional to the band width, but it is never narrower than what the spectral grid of that stage can resolve. The coefficient is used for all bands, all stages, and all experiments. The windows are finally normalized at every frequency point, so that .
2.2. Cross-Modal Amplitude Band Swapping
In a dual-stream architecture, each branch observes only its own modality during training, so it can overfit to the spectral identity of that modality. CABS reduces this overfitting by periodically exposing each branch to the other modality’s amplitude statistics. Because the phase spectrum is preserved during swapping, each branch retains its own structural content and depends less on the amplitude statistics of its own modality. The internal structure of CABS is shown in Figure 1 (bottom left).
Given an aligned visible–infrared image pair, rFFT2 decomposes each image into its amplitude spectrum A and phase spectrum P. For each of the K bands, an independent Bernoulli variable determines whether that band is selected for swapping. The selected bands are aggregated into a soft radial mask , which depends only on frequency coordinates and is shared across all channels. The bidirectional amplitude swap is then computed as
where ⊙ denotes element-wise multiplication. This exchange is symmetric and preserves information. The component that leaves one side is received by the other rather than discarded, and the phase spectra of both sides remain untouched. The swapped amplitude is recombined with the original phase to form the complex spectrum . This spectrum is then inverse-transformed by irFFT2 and clamped to to reconstruct , where . CABS is applied after resizing and before mosaic and color augmentations to ensure pixel-level alignment.
2.3. Band-Wise Spectral Adaptive Fusion
Baseline element-wise addition implicitly assumes that both modalities are equally reliable across all frequencies and channels. To enable content-adaptive fusion, BSAF replaces element-wise addition with per-band spectral rebalancing at each fusion scale. Modality degradation can shift the amplitude of the feature spectrum band by band. The fusion process can respond to such shifts and compensate for them once it reads the spectral energy profiles of both modalities, and no degradation-specific supervision is needed. The internal structure of BSAF is shown in Figure 1 (bottom right).
Let (batch, channel, height, width) denote the feature map of modality . During training, is extracted from the CABS-augmented input, whereas at inference it is extracted from the original input. The feature spectrum is obtained as , with amplitude . This amplitude is distinct from the image-level swapped amplitudes and in (1). To characterize the spectral distribution of each modality, a band descriptor is constructed from two complementary components: a band-energy descriptor and a shape descriptor. The band-energy descriptor captures the per-band magnitude:
where is the set of frequency points belonging to the kth band. Each frequency is assigned to the single band whose edges bracket its radius, so that the bands form a disjoint partition of the spectrum and every frequency is counted once. The descriptor sums amplitudes rather than squared magnitudes, which keeps it on the same scale as the gains in (6). The bands contain different numbers of frequency points, but is fixed for all inputs at a given resolution. In the logarithmic domain it therefore contributes only an offset that does not depend on the input, and this offset is absorbed by the bias of the first gating layer. The descriptor is read to compare the same band across modalities and across samples, not to compare different bands against each other. A band that contains no sampled frequency at a given resolution yields for every input and is inert for the same reason. The shape descriptor normalizes the energy vector to encode distributional form, so that the subsequent gating can read both the amount and the shape of spectral energy:
where is a small constant for numerical stability, and denotes concatenation. The shape descriptor also removes any dependence on the overall scale. The descriptors enter the gating pathway with stop-gradient to prevent gating gradients from interfering with the main feature pathway.
The descriptors from both modalities are concatenated and passed through a joint multilayer perceptron (MLP), denoted , to produce per-band fusion gains :
where denotes the sigmoid function. The coefficient together with the offset maps each gain to . This range allows both attenuation and amplification by a factor of up to two, and it prevents unstable feature scaling. In addition, two modality-specific MLPs generate cross-modulation terms that capture inter-modal interactions:
where and have separate parameters. Although and are predicted from the same descriptor, they are used differently. is a joint allocation shared by both pathways. It enters the spectral gains through the product , and it is separately averaged into the scalar that scales the spatial pathway in (9). acts only on the spectral side, where it refines the shared allocation for each modality. A single output predicting their product is therefore not an equivalent choice, because it would leave the spatial pathway without a gating signal. The K-dimensional band gains are then expanded to full spectral resolution through the normalized soft windows defined in Section 2.1, producing the per-frequency gain map:
The resulting real-valued gains modulate the complex spectra of both modalities, and the fused spectrum is transformed back to the spatial domain:
where Y denotes the spatially reconstructed fused feature. The final fused feature is obtained as
where is a scalar summary of the band gains of modality m. The term serves as a fixed residual base that preserves a baseline-addition anchor for training stability. CM denotes a spatial pathway that maps the concatenated input back to . It supplements cross-channel interactions beyond the pointwise spectral gains. A convolution reduces the channel count from to C, followed by BN and SiLU, and a convolution with stride 1 and padding 1 preserves both the channel count and the spatial size. The input of CM is first scaled by , so that the spatial pathway follows the same gating decision as the spectral pathway rather than acting independently. Since is restored to , all three terms in (9) share the same shape. All MLP and CM output layers are zero-initialized, so the initial gains are constants that do not depend on the input. The spatial pathway therefore contributes nothing at the start of training, whatever the value of the learnable scalar . BSAF thus starts as a constant-scaled addition whose scaling is absorbed by subsequent batch normalization, and adaptive behavior grows smoothly during training.
2.4. Experimental Setup
2.4.1. Datasets
M3FD [20] contains 4200 aligned visible–infrared image pairs captured by a bispectral camera, with annotations for six classes: person, car, bus, lamp, motorcycle, and truck. The dataset is split into 3360 training and 840 validation pairs.
The two degradation sets instantiate the amplitude-attenuation regime defined in Section 1. They are intended as controlled, reproducible probes of that regime.
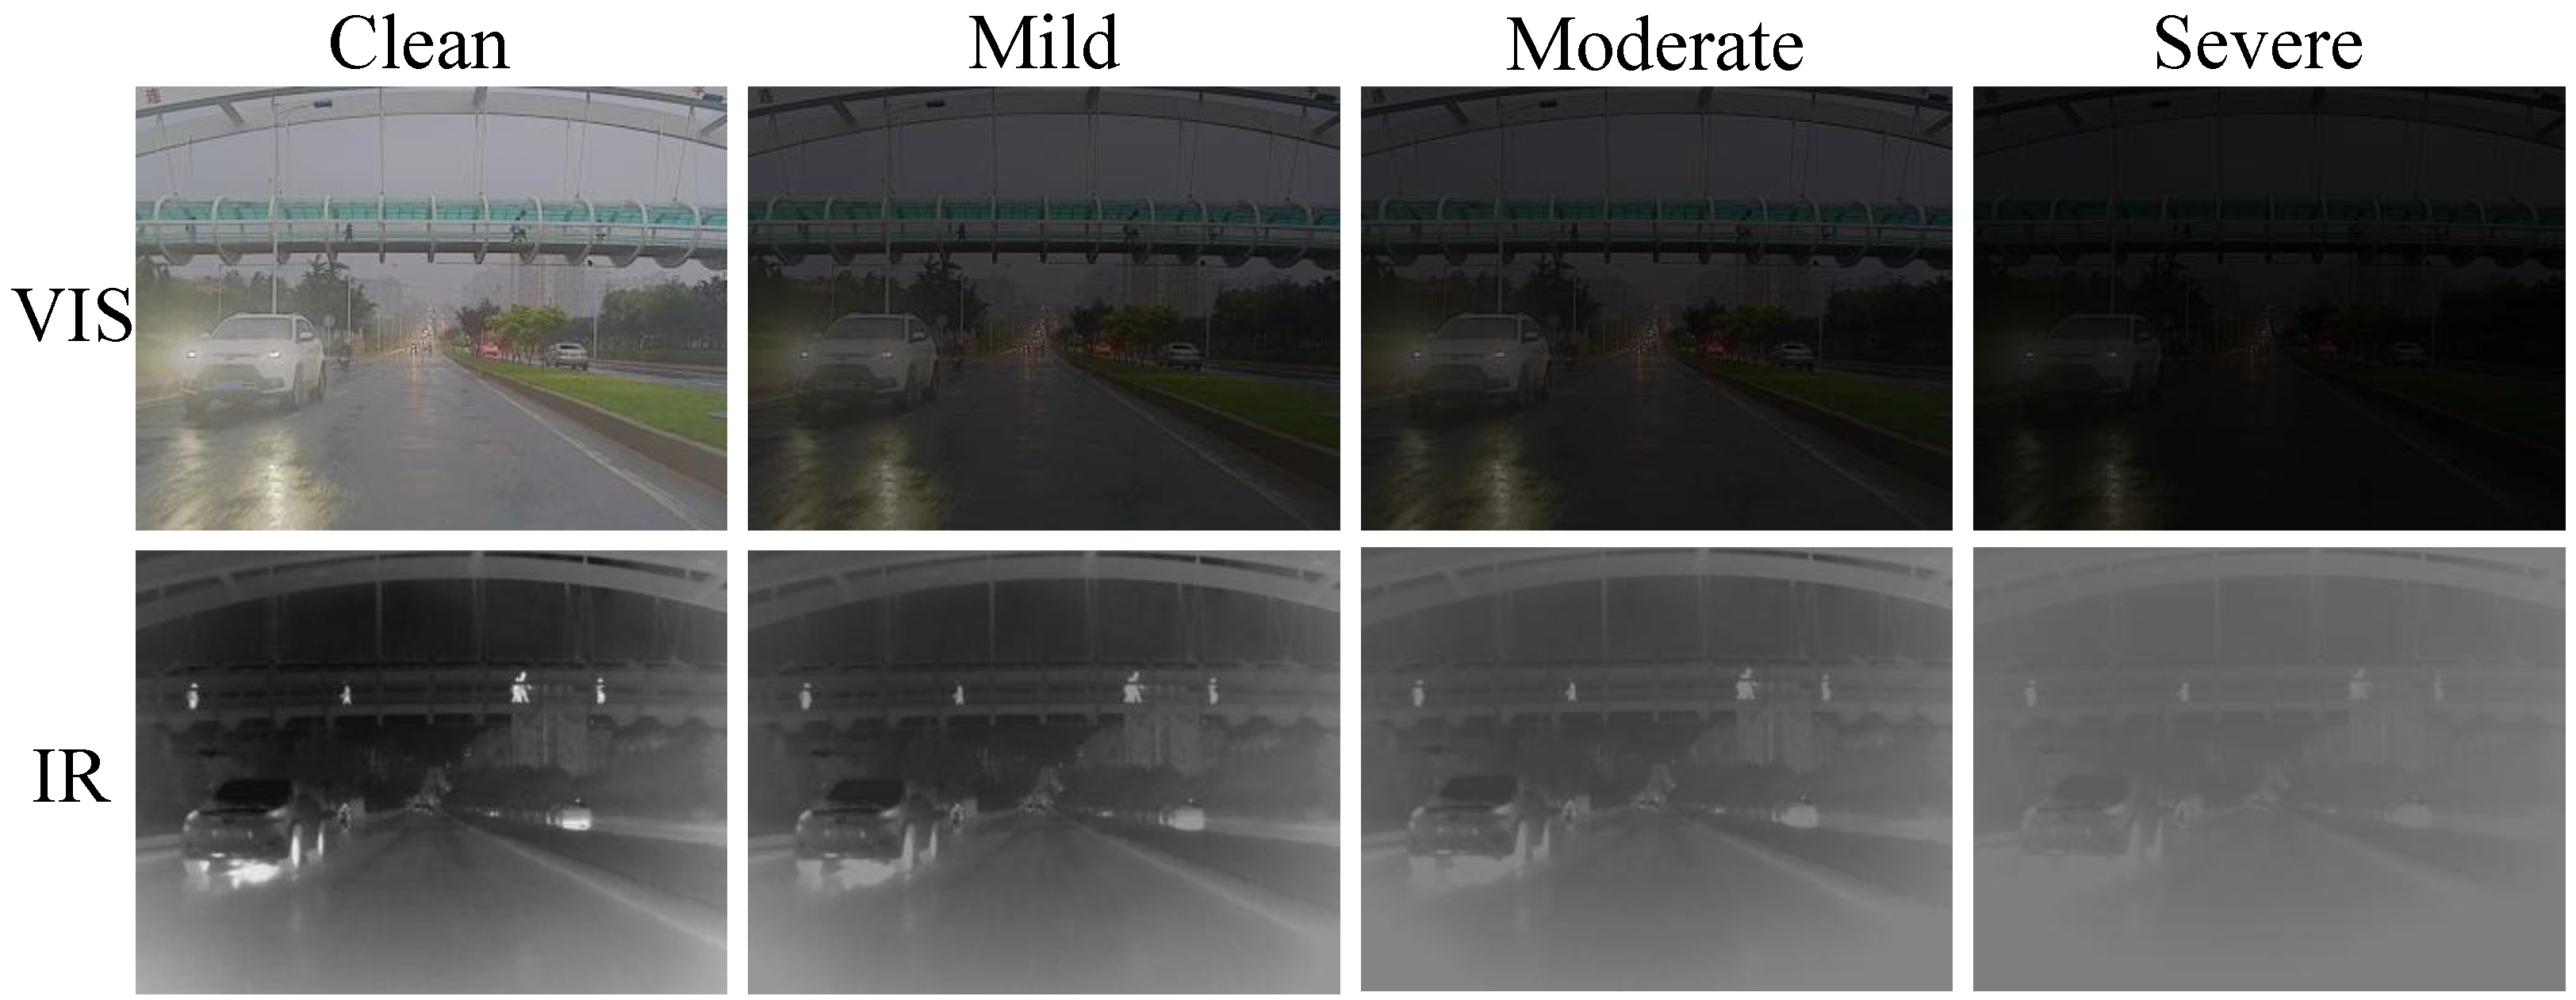
M3FD-DV (visible degraded, infrared clean) applies three levels of low-light degradation [21,22] to the visible side of the 840 validation pairs through gamma compression with linear gain reduction, , where x is the 8-bit intensity normalized to . The mapping is applied identically to the three color channels, and the result is clipped to , rescaled to , and quantized to 8 bits. The three levels are mild (, ), moderate (, ), and severe (, ).
M3FD-DI (infrared degraded, visible clean) applies three levels of thermal-contrast degradation [23,24] to the infrared side through high-value clipping, thermal-pedestal addition, and contrast compression, applied in this order to the single intensity channel . Let be the P-th percentile of the intensity histogram of that image. The three steps are , , and , where is the mean of , that is, of the map that has already been clipped and offset. The percentage P denotes the percentile above which intensities are truncated, so that the hottest of the pixels are collapsed onto a common ceiling. The result is clipped to and quantized to 8 bits. The three levels are mild (, , ), moderate (, , ), and severe (, , ).
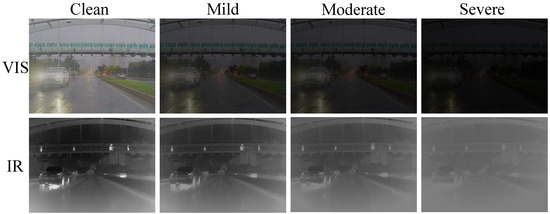
Both amplitude-based degradation sets are used only for evaluation and are never seen during training. Representative examples are shown in Figure 2.
Figure 2.
The three-level degradation protocol (mild/moderate/severe) applied to a sample pair from M3FD, with low-light degradation for the visible modality and thermal-contrast degradation for the infrared modality.
2.4.2. Implementation Details
The network is trained for 500 epochs using SGD with an initial learning rate of 0.01 (cosine decay to ), a batch size of 16, and an input resolution of . All experiments are conducted on a single NVIDIA RTX 4090. Standard YOLOv5s augmentations are applied. For fair comparison, all CSPDarknet53-based competing methods are unified to the small backbone variant and trained with the same schedule as SRNet. Their remaining hyperparameters are kept at the defaults of their respective official implementations. For CABS, p and q are both set to 0.3. For BSAF, the learnable scalar is initialized to 0.2 and updated together with the network parameters. This value is used in all experiments.
3. Results and Discussion
3.1. Comparison with State-of-the-Art Methods
Table 1 compares SRNet with recent methods on the clean M3FD validation set. SRNet achieves the highest mAP and mAP50, and it ranks second on mAP75. Although the margins are modest, they confirm that the robustness mechanisms of SRNet incur no cost in clean-data accuracy.
Table 1.
Comparison with state-of-the-art methods on clean M3FD. Bold indicates the highest precision.
Table 2 and Table 3 report mAP under visible-side and infrared-side degradation, respectively. SRNet achieves the best performance at every degradation level on both sides. The directional gap, defined as the difference between the severe scores of the two sides, is only 1.1 points for SRNet and 1.3 points for CDC-YOLO, while the other three methods show gaps of 9.8 to 18.3 points. Both balanced methods perform cross-modal mixing at the input stage to prevent the fusion backbone from binding to one modality’s appearance. CDC-YOLO swaps random spatial patches, which mixes both content and appearance at a regional level. SRNet instead exchanges amplitude at selected frequency bands while preserving phase. It therefore targets only the spectral statistics, and it exceeds CDC-YOLO by 2.1 and 2.3 points of mAP on the two severe settings.
Table 2.
Robustness comparison under visible-modality degradation (M3FD-DV). Bold indicates the highest precision.
Table 3.
Robustness comparison under infrared-modality degradation (M3FD-DI). Bold indicates the highest precision.
The single-modality rows of the three tables show what fusion contributes. On clean data the visible-only detector is competitive at mAP50 but falls behind by 5.5 and 4.1 points on mAP75 and mAP, where localization quality dominates. The gap widens once a modality degrades. With no alternative input, the two baselines drop to 36.5 and 12.0 under severe degradation, against 51.9 and 50.8 for SRNet.
On DV-severe, SRNet surpasses the clean IR-only detector, which shows that a severely darkened visible input still contributes rather than only contaminating the fusion. On DI-severe, a gap remains because thermal-contrast collapse destroys target-background separation irreversibly, whereas low-light darkening preserves recoverable intensities. Closing this gap is left for future work.
3.2. Ablation Study
Table 4 reports the contributions of CABS and BSAF. As a zero-cost regularizer, CABS alone improves DV-severe and DI-severe mAP by 4.2 and 11.8 points with no change in parameters or FLOPs. BSAF alone improves the baseline by 1.8 and 2.1 points, and it further lifts CABS to the best results. To isolate band granularity, BSAF is reduced to a single band (), which keeps parameters, FLOPs, and inference speed unchanged. This variant recovers almost none of the gain and barely exceeds CABS alone, so the improvement comes from per-band resolution rather than from added capacity. The FPS column confirms that CABS is free at inference. BSAF costs 5.3% of the throughput, which is well below the 25.5% increase in FLOPs, because the spectral transforms parallelize efficiently on GPU. At 175.4 FPS the full model remains well within real-time operation. The two modules are thus complementary. CABS gives cost-free robustness from the input, and BSAF refines fusion at the feature level.
Table 4.
Ablation study and model complexity. DV-Sev. and DI-Sev. denote the severe degradation level of M3FD-DV and M3FD-DI, respectively. Bold indicates the highest precision.
Table 5 reports the design choices of BSAF, with one factor changed at a time. The number of bands shows a single peak at . Accuracy rises from to and drops slightly at . All four settings share the same parameter count, so the drop reflects the smaller number of frequency samples that fall in each band rather than any change in capacity. Replacing the geometric spacing with a linear one costs 0.5 and 0.8 points. Linear spacing merges the low-frequency range into a single band and leaves the remaining bands unable to separate the degradation signatures shown in Figure 4. Removing the stop-gradient lowers accuracy by 0.8 and 0.5 points, which indicates that gating gradients do interfere with the main feature pathway when allowed to propagate. Restricting the fusion to P3 is the most damaging configuration. Its parameter count falls accordingly, so the drop reflects both the narrower coverage and the reduced capacity. The result still confirms that rebalancing is needed at all three scales rather than at the highest resolution alone.
Table 5.
Design choices of BSAF. Each row changes one factor with respect to the full configuration in the last row. Bold indicates the full configuration and the highest precision.
3.3. Spectral Rebalancing Analysis
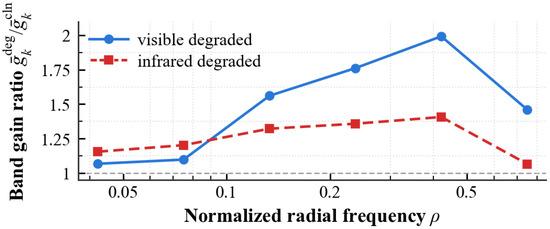
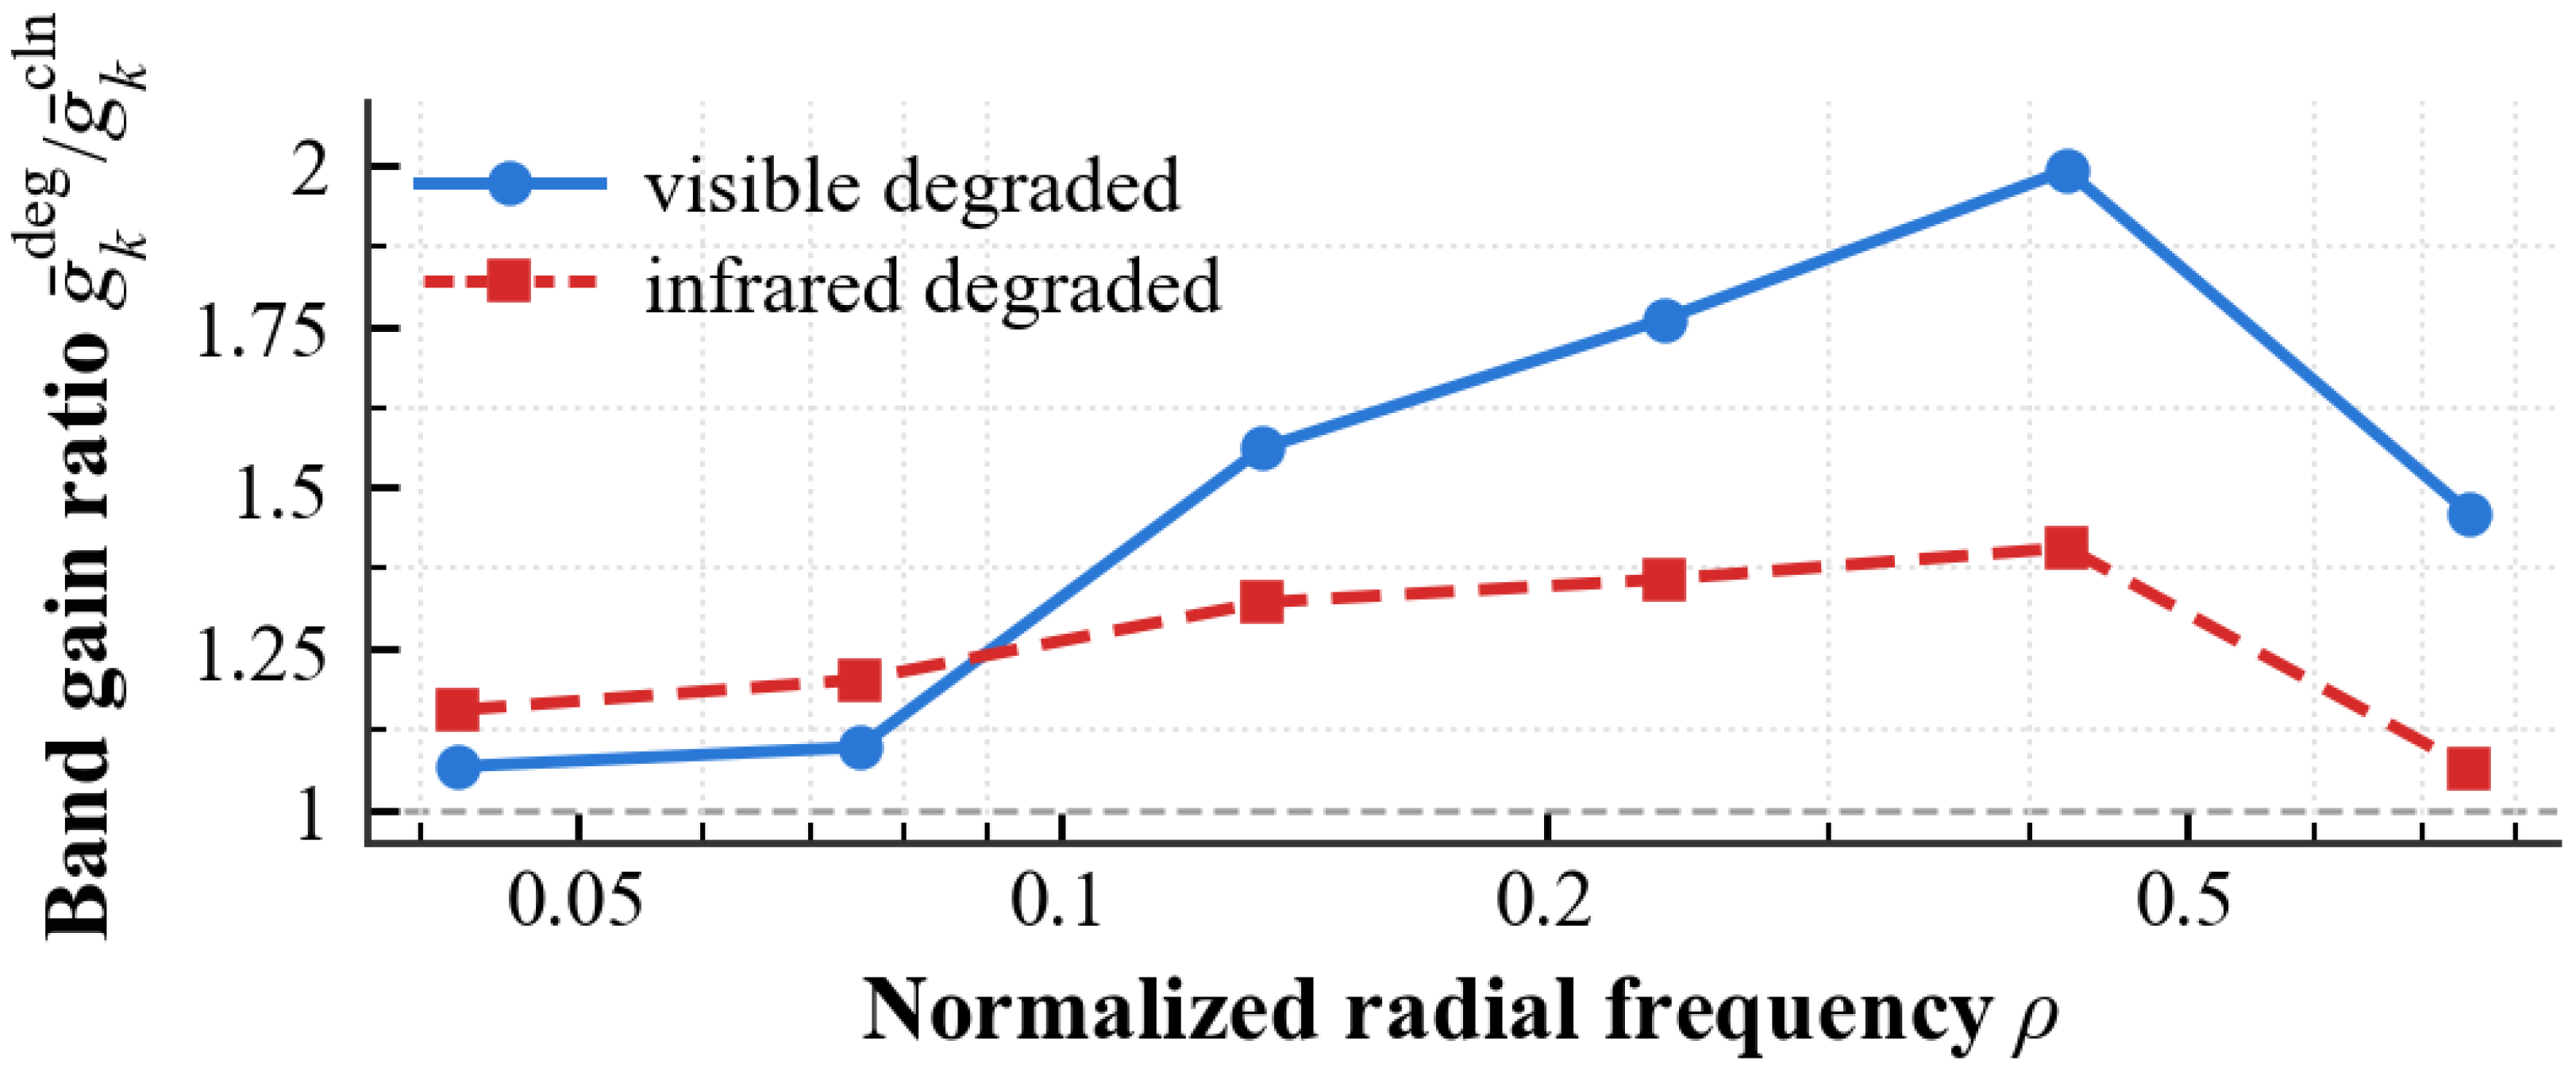
Figure 3 shows how BSAF responds when one modality is degraded at inference, using the per-band gains at the P4 scale. The horizontal axis is the normalized radial frequency . The vertical axis plots the ratio between the degraded-input and clean-input gain of the degraded branch, so a value above one marks a band whose gain is raised. Both curves lie above one, which shows that BSAF lifts the gain of the degraded branch to restore amplitude energy for the corrupted modality. Since the phase spectrum stays intact, the structural content of that modality remains usable and worth amplifying rather than discarding. The increase varies across bands rather than being uniform, which echoes the ablation where a single band () recovers almost none of the benefit. At the P4 resolution the first band contains only the DC component and the second contains no sampled frequency, so both are omitted.
Figure 3.
Per-band gain ratio of the degraded branch under severe single-modality degradation (P4 scale).
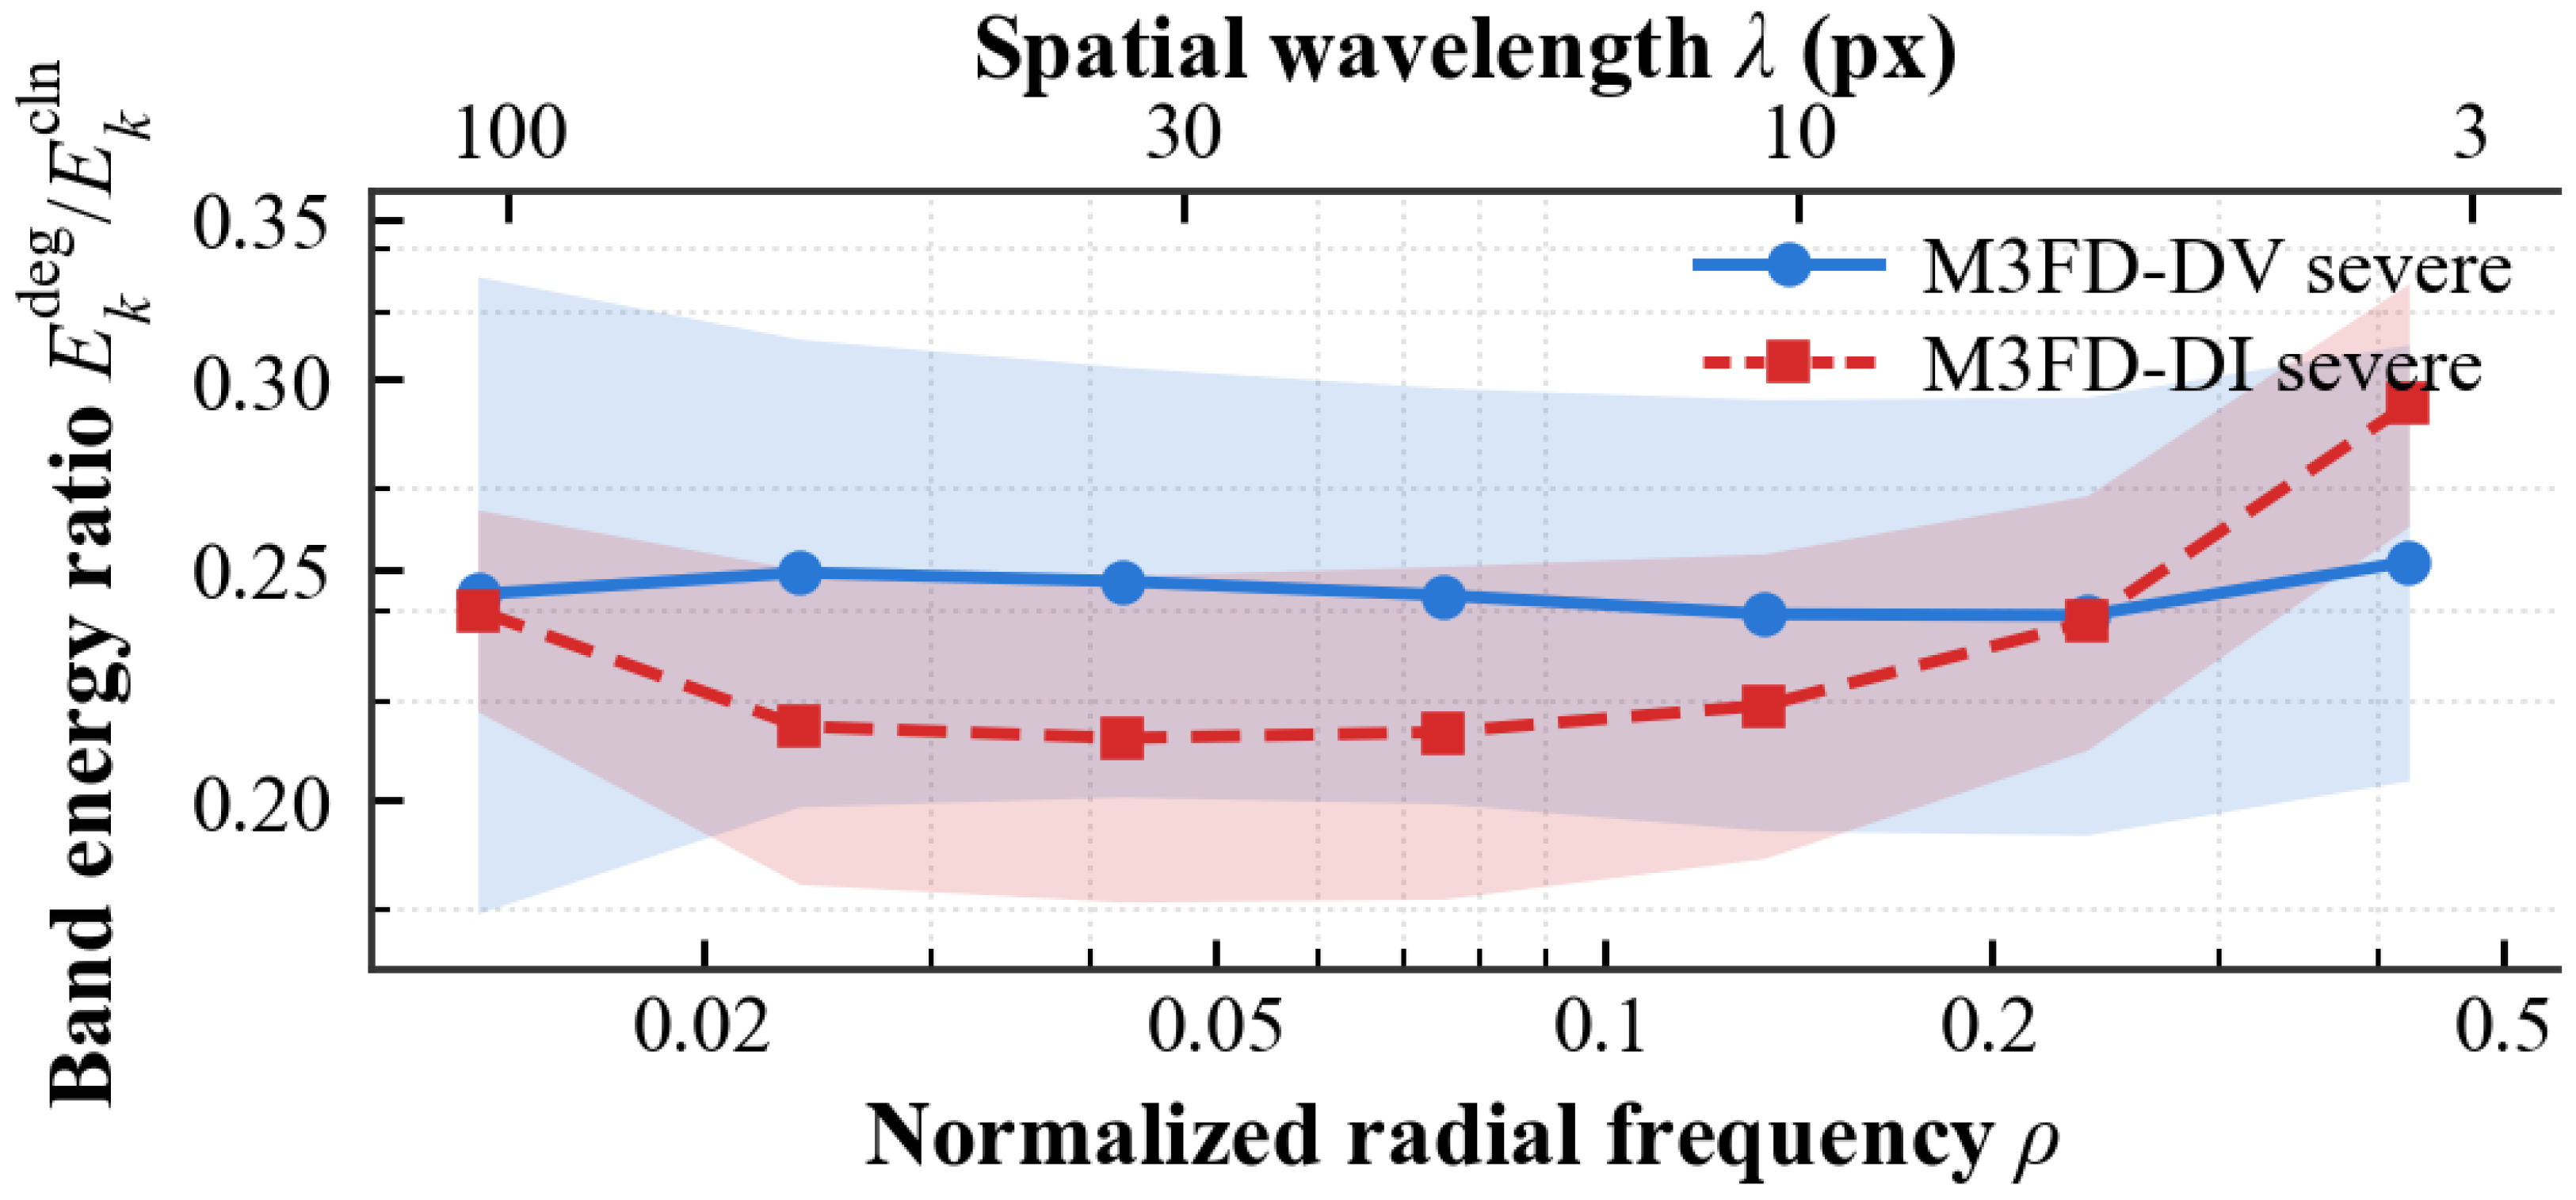
To characterize the two degradations beyond their spatial appearance, their effect on the amplitude spectrum is measured across frequency bands. For every band k, the ratio between the degraded and clean band energy is computed per image and averaged (geometric mean) over the 840 validation pairs. The top axis maps each radial frequency to a spatial wavelength in pixels. As shown in Figure 4, both degradations attenuate amplitude energy at every band, which confirms that they are amplitude-domain corruptions. Their band-wise signatures, however, differ markedly. Low-light degradation scales the spectrum almost uniformly and leaves a nearly flat profile, consistent with a monotonic global mapping. Thermal-contrast degradation instead removes energy selectively, with the deepest loss concentrated around px, which is the scale of pedestrians and vehicles. A single global gain cannot match two dissimilar band profiles at once, so compensating for such distribution shifts requires adjusting the fusion per band rather than globally. This is the design granularity adopted by SRNet. The outermost band ( px) is excluded, as it approaches the Nyquist limit and the quantization noise floor.
Figure 4.
Per-band amplitude energy ratio between clean and severely degraded inputs, averaged over the validation set (shaded: std).
3.4. Qualitative Comparison and Analysis
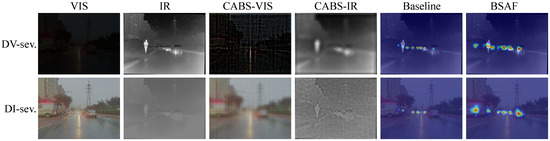
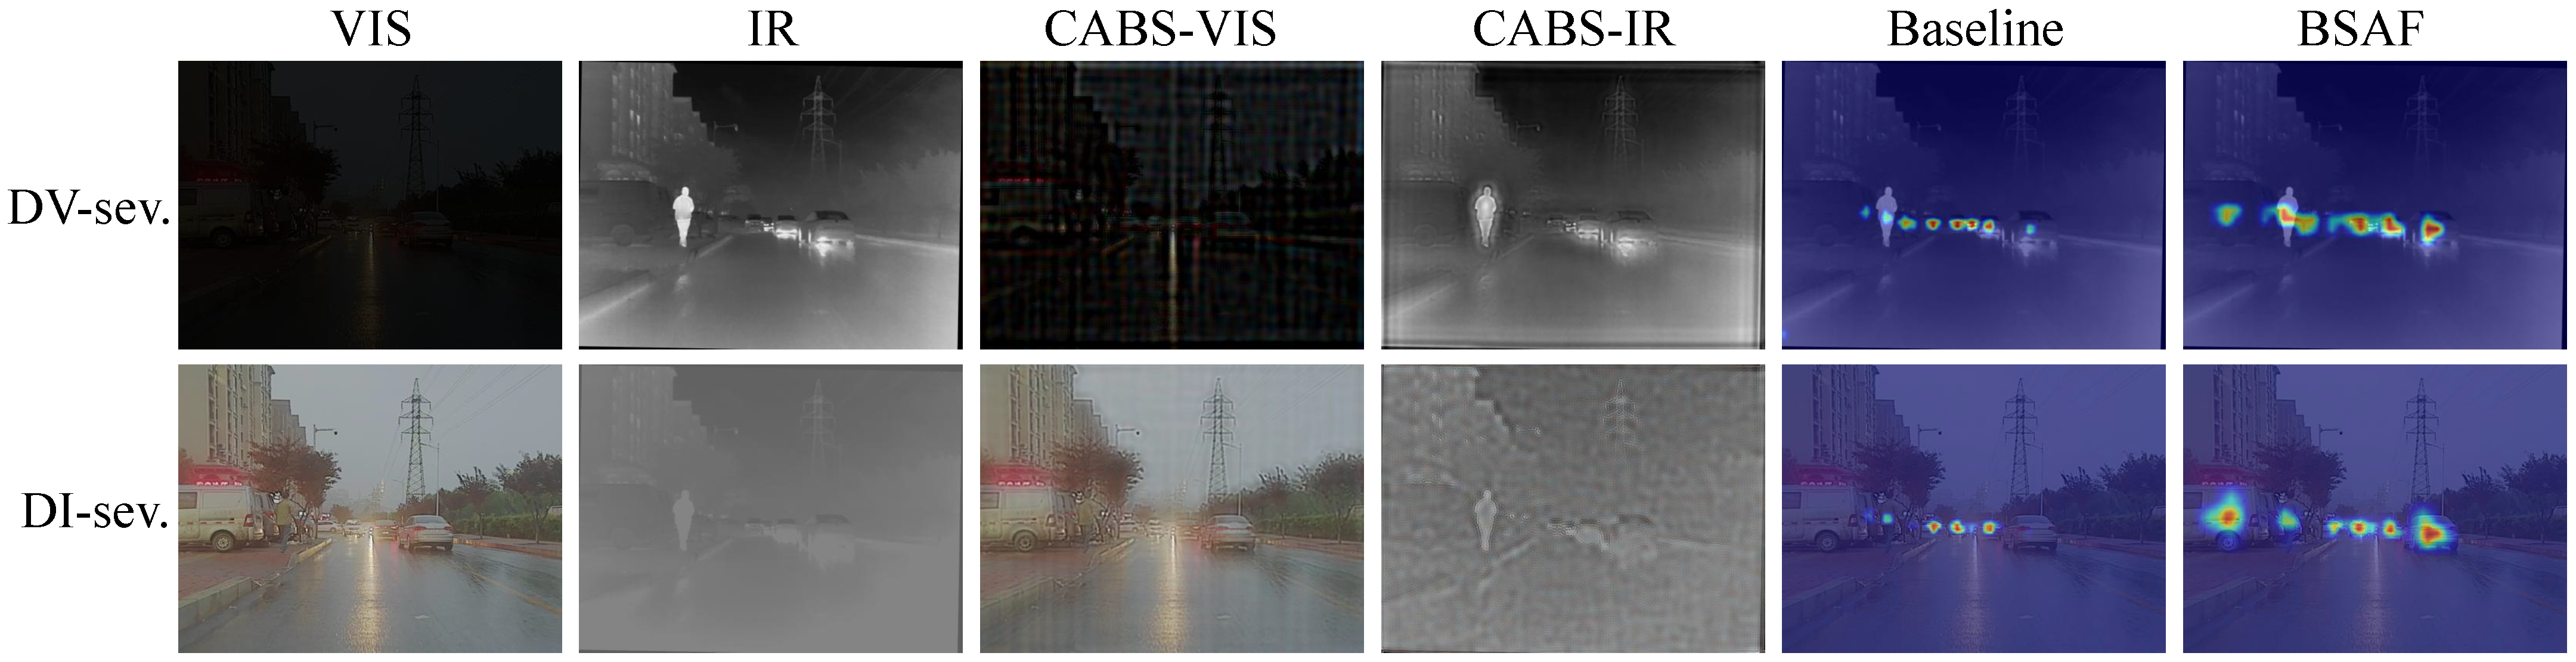
Figure 5 shows the two modules under severe degradation. The third and fourth columns show the CABS output. The exchanged bands introduce visible texture, yet the buildings, the pylon, and the vehicles remain in place, because the phase spectrum is left untouched. The last two columns compare the fused response at the P4 scale, the same stage analyzed in Figure 3. Under DV-severe, where the visible image is almost entirely dark, the baseline response is scattered and weak, whereas BSAF recovers the pedestrian and the vehicle line. Under DI-severe, where infrared contrast has collapsed, BSAF likewise produces a stronger and more concentrated response on the vehicles. The per-band gains reported in Figure 3 thus translate into a visibly restored spatial response for the degraded branch.
Figure 5.
Visualization of the two modules under severe degradation on a sample pair from M3FD. Columns 3–4 show the CABS output, where amplitude bands are exchanged and phase is preserved. Columns 5–6 compare the Grad-CAM response of the fused features at the P4 scale for element-wise addition and BSAF.
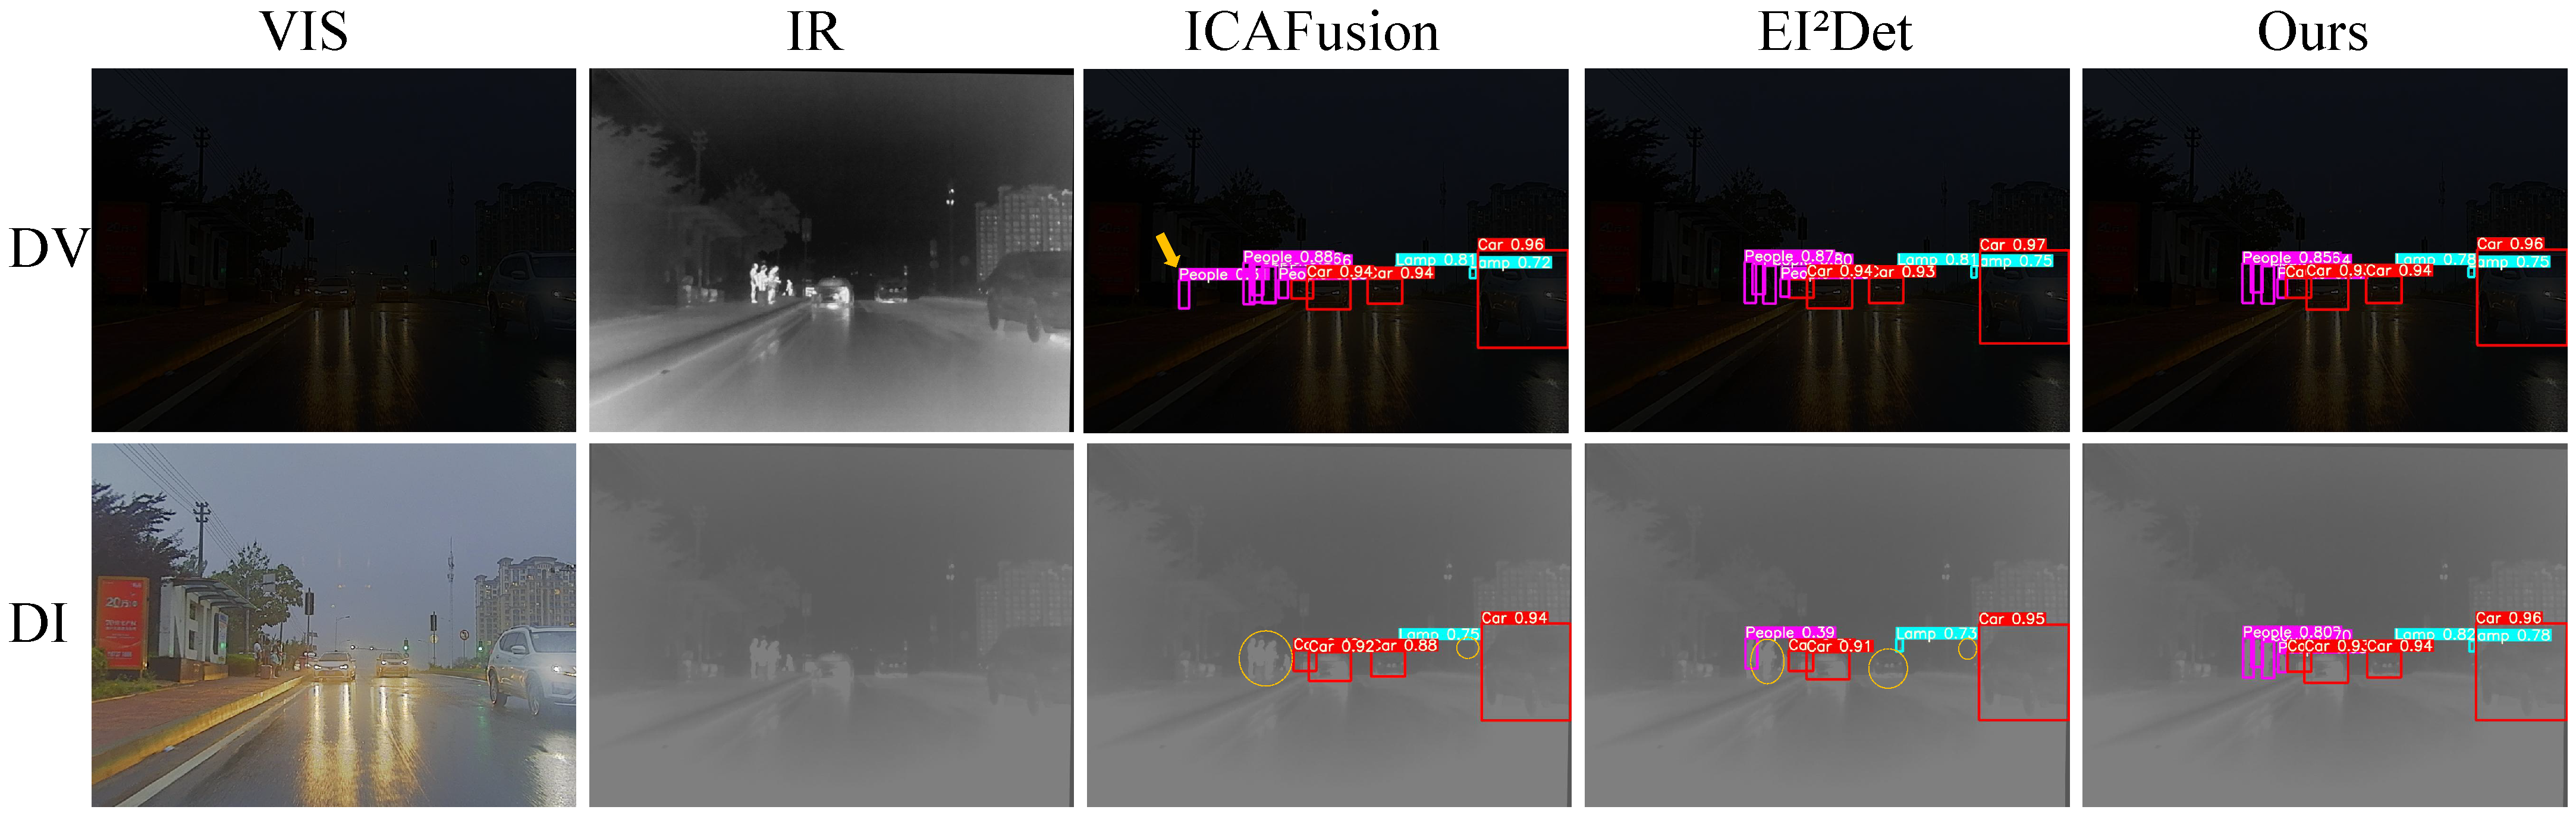
Figure 6 presents detection results under severe degradation on M3FD-DV (top row) and M3FD-DI (bottom row), with the degraded inputs shown in the first two columns. In the DV scene, the visible image is heavily darkened, so the infrared modality becomes the primary information source. ICAFusion produces a false detection on the road area (yellow arrow). Det avoids this false alarm but misses several objects (yellow dashed circles). SRNet detects the objects missed by the compared methods without introducing false positives. In the DI scene, the infrared image suffers severe contrast loss, which makes it difficult to distinguish thermal signatures from the background. Both ICAFusion and Det exhibit missed detections. They fail to locate objects whose thermal signatures have collapsed. SRNet produces more complete detections with fewer errors, and it is therefore robust regardless of which modality is degraded.
Figure 6.
Qualitative comparison under severe degradation on M3FD-DV (degraded visible, clean infrared) (top) and M3FD-DI (degraded infrared, clean visible) (bottom). Yellow arrows indicate false detections and yellow dashed circles indicate missed detections. Detection boxes are overlaid on the degraded modality for visualization.
4. Conclusions
This communication addresses the amplitude-domain modality anomaly in RGB–infrared object detection. Since degradation mainly affects the amplitude spectrum while phase largely preserves content structure [16,17,18,19], we preserve phase and adjust amplitude per band at both ends of the network: CABS, a training-only amplitude-swapping augmentation with zero inference cost, and BSAF, a band-wise spectral rebalancing fusion module. On M3FD and its degradation benchmarks, SRNet achieves the best clean-data mAP and the best robustness among the compared methods across both degradation directions.
The premise of this design is that a degradation attenuates amplitude while it leaves phase intact. The evaluation is limited to two degradations that satisfy it, and the results are not evidence of robustness to sensor anomalies in general. Corruptions that disturb the phase spectrum lie outside the premise altogether. The method itself, however, is supervised by no particular degradation. The two cases studied here have markedly different band-wise signatures (Figure 4) yet benefit from the same mechanism. How far this transfers is left for future work, together with two further directions: extending the shared band gains to spatially varying ones, and handling phase-domain corruptions.
We hope this work draws attention to the amplitude-domain modality anomaly as a practical yet underexplored failure mode in multispectral perception.
Author Contributions
Conceptualization, W.Y. and H.C.; methodology, W.Y., H.C. and X.C.; software, W.Y. and Z.S.; validation, W.Y. and H.C.; formal analysis, L.H.; investigation, X.C. and Z.S.; resources, L.H., X.C. and X.L.; writing—original draft preparation, W.Y. and H.C.; writing—review and editing, W.Y., H.C., L.H., X.C. and X.L.; visualization, W.Y.; supervision, X.C.; project administration, L.H. and X.C.; funding acquisition, W.Y. and X.C. All authors have read and agreed to the published version of the manuscript.
Funding
This work was supported by the Local Special Projects Supported by the Central Government under Grant 2022L3003; the Special Funds for Promoting High-Quality Development of Marine and Fishery Industries in Fujian Province under Grant FJHYF-L-2025-07-005; and the Natural Science Foundation of Fujian Province of China under Grant 2025J01461.
Institutional Review Board Statement
Not applicable.
Informed Consent Statement
Not applicable.
Data Availability Statement
The M3FD dataset analyzed in this study is publicly available from the source cited in this article.
Conflicts of Interest
The authors declare no conflicts of interest.
References
- Liu, J.; Ke, W.; Wang, S.; Yang, D.; Sheng, H. Cross-Modal Attention Guided Enhanced Fusion Network for RGB-T Tracking. IEEE Signal Process. Lett. 2026, 33, 276–280. [Google Scholar] [CrossRef] [Scilit]
- Hu, Q.; Yu, H.; Zhou, Z.; Li, S. IAF-RTDETR: Illumination Evaluation-Driven Multimodal Object Detection Network for Infrared–Visible Dual-Source Fusion. Electronics 2026, 15, 1332. [Google Scholar] [CrossRef] [Scilit]
- Zhang, L.; Jiang, Y.; Yang, W.; Liu, B. SGFNet: Semantic-Guided Fusion Network with Closed-Loop Feedback for RGB-Infrared Oriented Object Detection. Electronics 2026, 15, 1003. [Google Scholar] [CrossRef] [Scilit]
- Wu, Y.; Liu, Z.; Liu, J.; Fan, X.; Liu, R. Breaking Free From Fusion Rule: A Fully Semantic-Driven Infrared and Visible Image Fusion. IEEE Signal Process. Lett. 2023, 30, 418–422. [Google Scholar] [CrossRef] [Scilit]
- Yang, Q.; Zhang, Y.; Zhao, Z.; Zhang, J.; Zhang, S. IAIFNet: An Illumination-Aware Infrared and Visible Image Fusion Network. IEEE Signal Process. Lett. 2024, 31, 1374–1378. [Google Scholar] [CrossRef] [Scilit]
- Gong, J.; Yuan, Z.; Li, W.; Li, W.; Guo, Y.; Guo, B. A Lightweight Upsampling and Cross-Modal Feature Fusion-Based Algorithm for Small-Object Detection in UAV Imagery. Electronics 2026, 15, 298. [Google Scholar] [CrossRef] [Scilit]
- Li, Q.; Zhang, C.; Hu, Q.; Zhu, P.; Fu, H.; Chen, L. Stabilizing Multispectral Pedestrian Detection with Evidential Hybrid Fusion. IEEE Trans. Circuits Syst. Video Technol. 2024, 34, 3017–3029. [Google Scholar] [CrossRef] [Scilit]
- Zhang, Y.; Yu, H.; He, Y.; Wang, X.; Yang, W. Illumination-Guided RGBT Object Detection with Inter- and Intra-Modality Fusion. IEEE Trans. Instrum. Meas. 2023, 72, 1–13. [Google Scholar] [CrossRef] [Scilit]
- Zhao, T.; Yuan, M.; Jiang, F.; Wang, N.; Wei, X. Removal Then Selection: A Coarse-to-Fine Fusion Perspective for RGB-Infrared Object Detection. IEEE Trans. Intell. Transp. Syst. 2026, 27, 2504–2519. [Google Scholar] [CrossRef] [Scilit]
- Tang, H.; Li, Z.; Zhang, D.; He, S.; Tang, J. Divide-and-Conquer: Confluent Triple-Flow Network for RGB-T Salient Object Detection. IEEE Trans. Pattern Anal. Mach. Intell. 2024, 47, 1958–1974. [Google Scholar] [CrossRef] [Scilit] [PubMed]
- Tian, C.; Yang, C.; Zhu, G.; Wang, Q.; He, Z. Learning a Robust RGB-Thermal Detector for Extreme Modality Imbalance. Pattern Recognit. Lett. 2025, 196, 1–8. [Google Scholar] [CrossRef] [Scilit]
- Wang, Y.; Wei, S.; Xu, S.; Qin, Y.; Zhao, Y. Confidence-Driven Unimodal Interference Removal for Enhanced Multimodal Object Detection. IEEE Trans. Circuits Syst. Video Technol. 2025, 35, 11041–11053. [Google Scholar] [CrossRef] [Scilit]
- Yi, X.; Xu, H.; Zhang, H.; Tang, L.; Ma, J. Text-IF: Leveraging Semantic Text Guidance for Degradation-Aware and Interactive Image Fusion. In Proceedings of the IEEE/CVF Conference on Computer Vision and Pattern Recognition (CVPR); IEEE: Piscataway, NJ, USA, 2024; pp. 27026–27035. [Google Scholar]
- Xu, Y.; Wei, Z.; Xu, R.; Zhou, Z.; Yu, Z. Spatial Adaptive Filter Network with Scale-Sharing Convolution for Image Demoiréing. IEEE Signal Process. Lett. 2024, 31, 2495–2499. [Google Scholar] [CrossRef] [Scilit]
- Xie, C.; Li, Y.; Wu, S.; Chen, H. Toward All-in-One UAV Imagery Restoration via Prompt Learning with Multi-Scale Mamba. IEEE Signal Process. Lett. 2026, 33, 1641–1645. [Google Scholar] [CrossRef] [Scilit]
- Khan, R.; Negi, A.; Kulkarni, A.; Phutke, S.S.; Vipparthi, S.K.; Murala, S. Phaseformer: Phase-Based Attention Mechanism for Underwater Image Restoration and Beyond. In Proceedings of the IEEE/CVF Winter Conference on Applications of Computer Vision (WACV), Tucson, AZ, USA, 28 February–4 March 2025; pp. 9600–9611. [Google Scholar]
- Chattopadhyay, P.; Sarangmath, K.; Vijaykumar, V.; Hoffman, J. PASTA: Proportional Amplitude Spectrum Training Augmentation for Syn-to-Real Domain Generalization. In Proceedings of the IEEE/CVF International Conference on Computer Vision (ICCV), Paris, France, 4–6 October 2023; pp. 19288–19300. [Google Scholar]
- Li, K.; Ren, W.; Wang, W.; Cao, X. Detecting Compressed AI-Generated Images via Phase Spectrum Robustness. In Proceedings of the IEEE/CVF Conference on Computer Vision and Pattern Recognition (CVPR), Denver, CO, USA, 2–6 June 2026; pp. 35427–35436. [Google Scholar]
- Zhou, M.; Huang, J.; Guo, C.L.; Li, C. Fourmer: An Efficient Global Modeling Paradigm for Image Restoration. In Proceedings of the 40th International Conference on Machine Learning; PMLR: Cambridge, MA, USA, 2023; Volume 202, pp. 42589–42601. [Google Scholar]
- Liu, J.; Fan, X.; Huang, Z.; Wu, G.; Liu, R.; Zhong, W.; Luo, Z. Target-Aware Dual Adversarial Learning and a Multi-Scenario Multi-Modality Benchmark to Fuse Infrared and Visible for Object Detection. In Proceedings of the IEEE/CVF Conference on Computer Vision and Pattern Recognition (CVPR), New Orleans, LA, USA, 21–24 June 2022; pp. 5802–5811. [Google Scholar]
- Sun, S.; Ren, W.; Peng, J.; Song, F.; Cao, X. DI-Retinex: Digital-Imaging Retinex Model for Low-Light Image Enhancement. Int. J. Comput. Vis. 2025, 133, 8293–8314. [Google Scholar] [CrossRef] [Scilit]
- Reis, M.J.C.S. Low-Light Image Enhancement Using Deep Learning: A Lightweight Network with Synthetic and Benchmark Dataset Evaluation. Appl. Sci. 2025, 15, 6330. [Google Scholar] [CrossRef] [Scilit]
- Wang, Q.; Jin, P.; Wu, Y.; Zhou, L.; Shen, T. Infrared Image Enhancement: A Review. IEEE J. Sel. Top. Appl. Earth Obs. Remote Sens. 2025, 18, 3281–3299. [Google Scholar] [CrossRef] [Scilit]
- Liu, Z.; Wang, Z.; Liu, J.; Meng, F.; Ma, L.; Liu, R. DEAL: Data-Efficient Adversarial Learning for High-Quality Infrared Imaging. In Proceedings of the IEEE/CVF Conference on Computer Vision and Pattern Recognition (CVPR), Nashville, TN, USA, 11–15 June 2025; pp. 28198–28207. [Google Scholar]
- Bai, H.; Zhao, Z.; Zhang, J.; Wu, Y.; Deng, L.; Cui, Y.; Jiang, B.; Xu, S. ReFusion: Learning Image Fusion From Reconstruction with Learnable Loss via Meta-Learning. Int. J. Comput. Vis. 2025, 133, 2547–2567. [Google Scholar] [CrossRef] [Scilit]
- Shen, J.; Chen, Y.; Liu, Y.; Zuo, X.; Fan, H.; Yang, W. ICAFusion: Iterative Cross-Attention Guided Feature Fusion for Multispectral Object Detection. Pattern Recognit. 2024, 145, 109913. [Google Scholar] [CrossRef] [Scilit]
- Hu, K.; He, Y.; Li, Y.; Zhao, J.; Chen, S.; Kang, Y. EI2Det: Edge-Guided Illumination-Aware Interactive Learning for Visible-Infrared Object Detection. IEEE Trans. Circuits Syst. Video Technol. 2025, 35, 7101–7115. [Google Scholar] [CrossRef] [Scilit]
- Wang, Z.; Liao, X.; Yuan, J.; Yao, Y.; Li, Z. CDC-YOLOFusion: Leveraging Cross-Scale Dynamic Convolution Fusion for Visible-Infrared Object Detection. IEEE Trans. Intell. Veh. 2025, 10, 2080–2093. [Google Scholar] [CrossRef] [Scilit]

Disclaimer/Publisher’s Note: The statements, opinions and data contained in all publications are solely those of the individual author(s) and contributor(s) and not of MDPI and/or the editor(s). MDPI and/or the editor(s) disclaim responsibility for any injury to people or property resulting from any ideas, methods, instructions or products referred to in the content. |
© 2026 by the authors. Licensee MDPI, Basel, Switzerland. This article is an open access article distributed under the terms and conditions of the Creative Commons Attribution (CC BY) license.