


Abstract
Impedance spectroscopy (IS) is a powerful tool for analyzing the physical mechanisms occurring in single-junction solar cells. However, identifying the impedance responses of the top and bottom sub-cells within a tandem solar cell remains challenging. This is because the series connection of the two sub-cells results in an overall tandem impedance in which the contributions of the individual sub-cells are combined and may even overlap, making their individual impedance contributions difficult to distinguish and investigate. This work proposes a diagnostic approach for monolithic perovskite/silicon tandem solar cells. The proposed approach requires a preliminary numerical or experimental characterization of the individual sub-cells before analyzing the monolithic tandem device. In particular, static and dynamic characterization techniques, including J-V curve tracing, C-V and C-f analyses, relaxation-time measurements, and IS, can be performed on each sub-cell as a standalone device to identify the frequency ranges in which its contribution to the overall tandem impedance is expected to be dominant. Subsequently, J-V curve tracing and IS are performed on the monolithic tandem device. The regions of the Nyquist plot in which the contribution of each sub-cell is expected to be dominant are then analyzed to extract information on the actual operating conditions of the individual sub-cells. The proposed methodology is demonstrated through TCAD numerical simulations and applied to case studies involving a tandem cell operating under near-current-matched and current-mismatched conditions.
1. Introduction
The pursuit of photovoltaic (PV) efficiencies above the single-junction Shockley–Queisser limit has established tandem solar cells as one of the most promising options. Two-terminal (2T) monolithic configurations, and specifically perovskite/silicon tandem-based solar cells, provide a promising balance between high performance and the possibility for scalable production [1,2,3,4,5,6,7,8,9,10,11,12,13]. The operating principle behind these devices is based on the series connection of the sub-cells (resulting in the current-matching limitation) and the cumulative behavior of the voltages. Many such observations require an in-depth study and explanation of the physical mechanisms occurring because of these electrical interactions [14,15,16].
Impedance spectroscopy (IS) is one of the most commonly utilized techniques to analyze different physical mechanisms occurring in single junction photovoltaic devices. This technique involves the application of a small-amplitude AC perturbation superimposed on a DC operating bias. The resulting frequency-dependent current response is used to measure the complex impedance of the device. Since different physical processes occur on different time scales, IS can provide information on different physical phenomena which are otherwise difficult to measure from the current density-voltage (J-V) characteristics alone [17,18,19,20,21,22,23,24]. The most useful impedance representation is the Nyquist plot, a graph where the real part of the impedance is reported on the x-axis and the imaginary part on the y-axis. If the structure consists of a single junction, the corresponding Nyquist plot shows a semicircular shape. However, the more complex the device structure, the more challenging the interpretation of the corresponding Nyquist plots becomes. Consequently, in monolithic tandem solar cells, the IS interpretation is much more challenging. The top and bottom sub-cells are electrically connected in series through a tunnel junction. In a 2-Terminal (2T) tandem solar cell, there is no mid-contact available between the top and bottom sub-cells, in contrast to the tandem structures with 3 terminals (3T) where a mid-contact is available [25,26,27]. So, the impedance contributions from the sub-cells can neither be measured nor separated. In order to analyze and optimize monolithic tandem cells, new approaches are required to evaluate the individual sub-cell impedance contributions to the total tandem impedance.
Several approaches have been used for sub-cell-resolved characterization of tandem solar cells, including selective light-bias methods, selective optical excitation, and electroluminescence imaging [16,24,28]. In contrast, the present work is a simulation-based mixed-mode TCAD approach: a floating mid-contact is introduced in the numerical model, and the small-signal admittance matrix is used to extract the impedance contributions of the embedded top and bottom sub-cells while they remain electrically coupled in the 2T tandem.
This methodology is proposed to extract information on individual sub-cells by identifying their respective contributions within specific regions of the Nyquist plot of a 2T monolithic tandem solar cell. The methodology is implemented within the Sentaurus TCAD environment, a physics-based numerical simulation framework that solves the semiconductor transport equations, including Poisson’s equation and the carrier continuity equations. The proposed approach relies on prior knowledge of the electrical behavior of the individual sub-cells. To this end, the top and bottom sub-cells are first simulated as standalone devices to characterize their J-V characteristics and impedance spectra. Subsequently, the complete tandem solar cell is simulated under standard test conditions, and both its J-V characteristics and Nyquist plots are analyzed to determine whether specific regions of the overall impedance spectrum can be associated with the characteristic response of each sub-cell, consistently with their effective relaxation times.
To investigate the proposed methodology’s effectiveness, the impedance characteristics extracted from the monolithic 2T tandem device are compared with those obtained from the individual sub-cells. For validation purposes only, an additional floating electrical contact is introduced in the TCAD model at the tunnel junction between the top and bottom sub-cells. This virtual mid-contact enables the extraction of the J-V characteristics and impedance spectra of each embedded sub-cell without altering the operating conditions of the tandem structure. In particular, the impedance spectra are obtained from the admittance matrix computed through AC small-signal simulations, which provide the frequency-dependent conductance and capacitance of the device [29,30,31,32,33,34].
The primary objective of this study is to establish a methodology for extracting the impedance response of the individual sub-cells in monolithic tandem solar cells from the overall impedance spectrum of a conventional 2T device. As representative case studies, the proposed approach is applied to monolithic tandem cells operating under both near-current-matched and current-mismatched conditions, demonstrating its capability to distinguish the impedance contributions associated with each operating regime.
The remainder of this paper is organized as follows. Section 2 describes the materials and methods adopted in this study. Section 3 presents the J-V characteristics and impedance spectra of the standalone sub-cells. Section 4 analyses the electrical and impedance response of the tandem device under current-matched conditions, while Section 5 extends the analysis to near-current-mismatched operation. Section 6 investigates the sensitivity of the impedance response to carrier lifetime variations. Finally, Section 7 summarizes the main conclusions of the study.
2. Materials and Methods Used
2.1. Configuration of the Tandem Structure
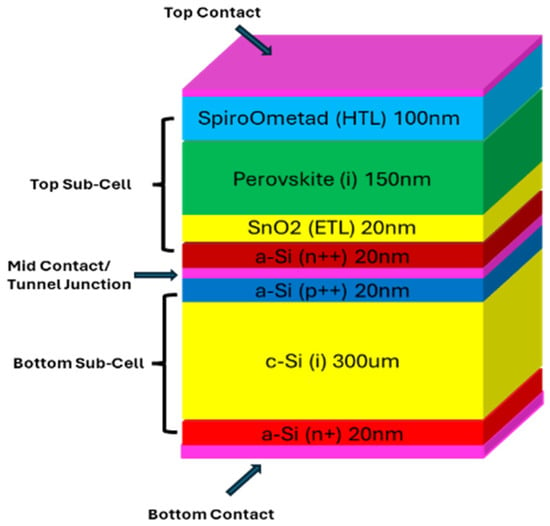
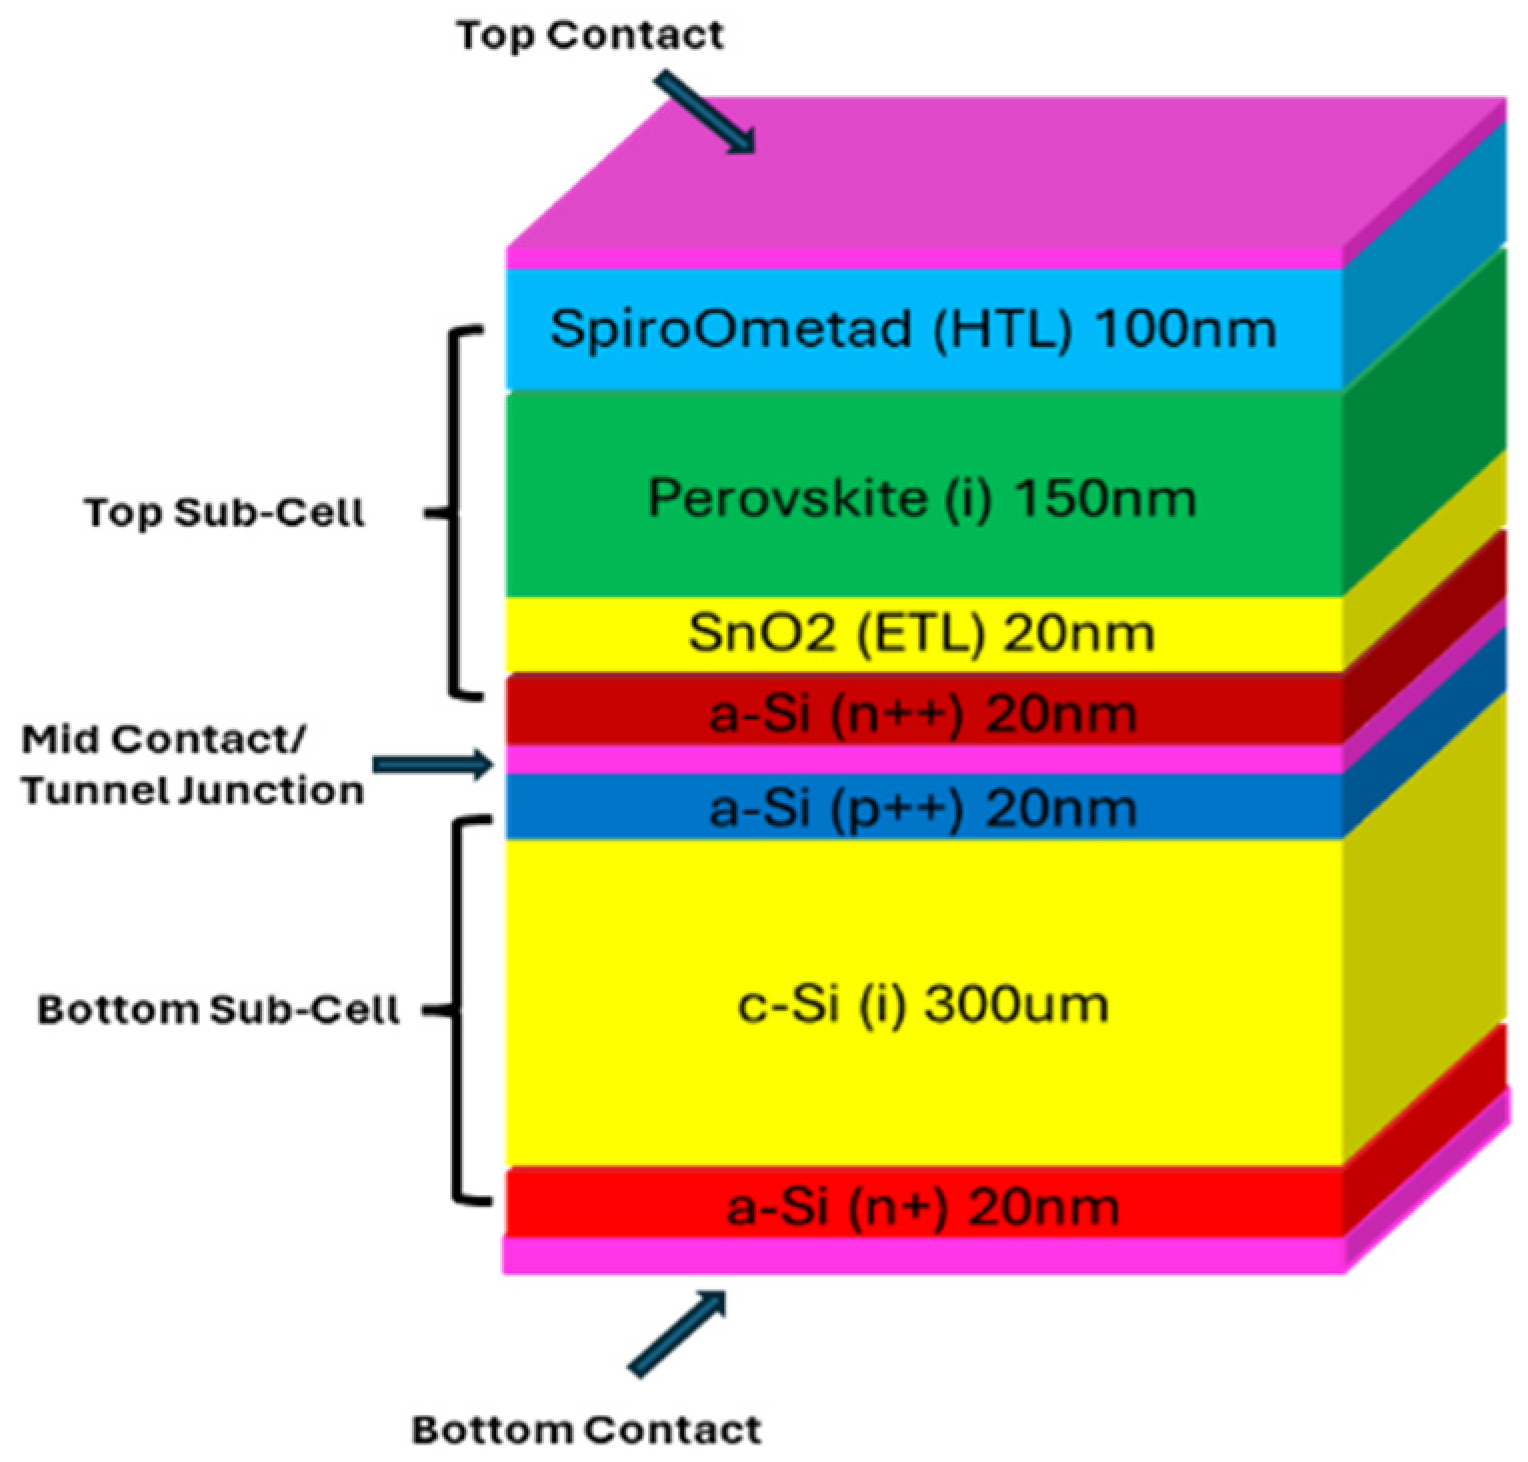
The tandem cell, shown in Figure 1, is a monolithic perovskite-silicon multijunction solar cell constructed and modeled in a Sentaurus TCAD environment. The top sub-cell was designed as a p-i-n structure with Spiro-OMeTAD as the hole transport layer (HTL), an intrinsic wide-bandgap perovskite absorber layer, and SnO2 as the electron transport layer (ETL). A bandgap of 1.75 eV was selected for the wide-bandgap perovskite to represent a tandem-relevant top absorber; wide-bandgap perovskite cells with bandgaps in this range have been reported in the literature [35]. The bottom sub-cell is a silicon heterojunction, composed of a p-type amorphous silicon layer, a low-doped crystalline silicon absorber, and an n-type amorphous silicon layer. The sub-cells are monolithically integrated via highly doped n-type and p-type amorphous silicon layers forming the interconnection region. The configuration of the complete structure is as follows: Spiro-OMeTAD/Perovskite(I)/SnO2/a-Si:H(n++)/a-Si:H(p++)/c-Si(i)/a-Si:H(n+). The device is representative of the state-of-the-art tandem solar cell, and the material parameters are adopted from the literature as shown in Table 1.
Figure 1.
Structure of tandem solar cell.
Table 1.
Tandem solar cell material parameters [29,35,36].
2.2. Description of Models
The key physical models utilized in the Sentaurus simulation are discussed in this section. In this work, Synopsys Sentaurus TCAD Version V-2023.12 was used.
The drift-diffusion transport model was enabled for solving Poisson’s equation and the carrier continuity equations. Moreover, Shockley-Read-Hall (SRH), Auger, and radiative recombination models were enabled [37,38,39,40]. The tunnel junction that connects the sub-cells plays an essential role in the proper operation of the tandem solar cell, enabling the flow of electrons and holes between the respective sub-cells. So, at the interface of the tunnel junction, a non-local mesh was established to provide a path for carrier transport.
Furthermore, a band-to-band tunneling model was activated at the junction of n-type and p-type amorphous silicon layers in the physics section. The numerical model employed in this study is based on a simplified description of the perovskite device, in which ionic migration and trap- or defect-assisted mechanisms within the perovskite absorber are neglected. The J-V characteristic was simulated at ambient room temperature conditions. The AM1.5G illumination spectrum was used as a reference for illumination. The transfer matrix method (TMM) was utilized in determining optical properties. Additional electrical boundary conditions, contact assumptions, defect assumptions, mesh settings, AC perturbation amplitude, frequency sampling, and the DC differential resistance calculation procedure are summarized in Supplementary Table S1.
3. Standalone Sub-Cells J-V and IS Response Obtained in TCAD
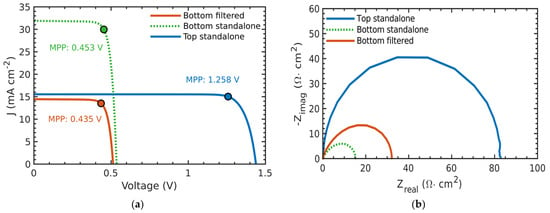
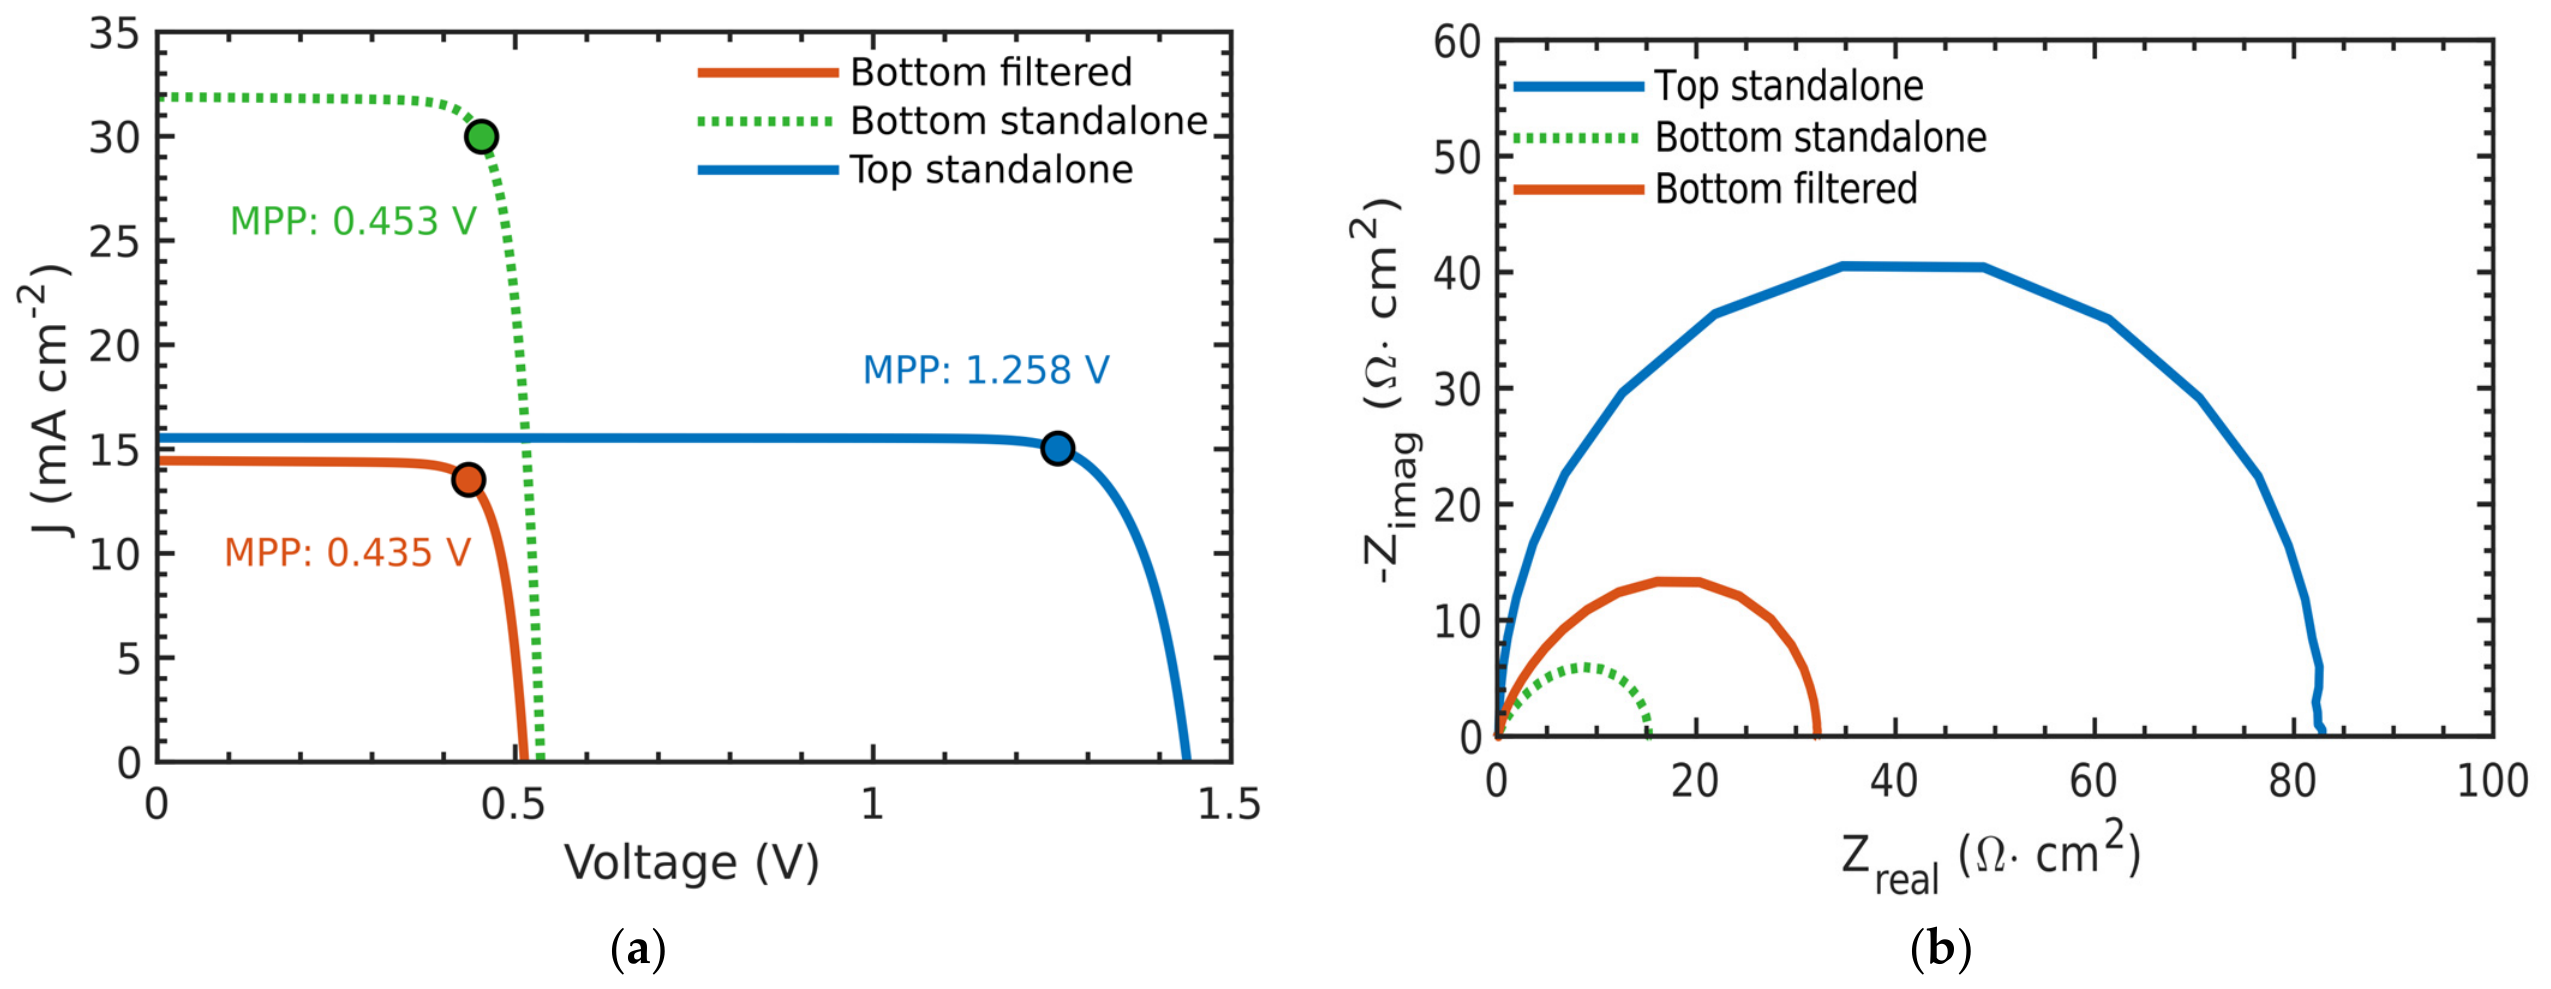
As highlighted above, preliminary knowledge of the sub-cells is needed to apply the approach. To this end, the individual sub-cells were implemented in TCAD as standalone devices in order to investigate their static and dynamic electrical behavior. It should be noted that the standalone sub-cells were defined using exactly the same set of parameters as those adopted for the corresponding sub-cells within the tandem configuration. Figure 2a shows the J-V characteristics of the standalone top (blue line) and bottom (dashed green line) cells, together with the filtered bottom sub-cell (red line). The standalone J-V curves were simulated under standard AM1.5G illumination and under spectrally filtered conditions derived from the critical wavelength of the absorber layers. The critical wavelength was obtained as follows:
where h is Planck’s constant, c is the speed of light, q is the electron charge, and Eg is the bandgap of the absorber material. Using Equation (1), the critical wavelength was calculated for the two sub-cells, and they were equal to and .
Figure 2.
(a) J-V characteristics of the standalone top, bottom, and filtered bottom solar cells; (b) Nyquist plots of the top, bottom, and filtered bottom solar cells.
This relation was used to define the simplified filtered illumination condition for the standalone bottom-cell reference. The cutoff therefore defines the incident filtered AM1.5G spectrum; TMM is subsequently used to calculate optical propagation and generation within the standalone device. As expected, the standalone bottom sub-cell exhibits a substantially higher short-circuit current density under the full AM1.5G spectrum, while the filtered spectrum reduces its current density to a value closer to that of the top sub-cell, thereby reflecting the near-current-matching condition required for tandem operation. In the present case, the top sub-cell gives a short-circuit current density (Jsc) of approximately 15.5 mA cm−2, whereas the bottom sub-cell’s Jsc reduces from about 31.8 mA cm−2 to approximately 14.4 mA cm−2 under the filtered spectrum.
In Figure 2a, the maximum power point of each standalone sub-cell is shown as a circle. Impedance spectroscopy was performed at the maximum power point (MPP) of each standalone sub-cell, and the corresponding Nyquist plots are presented in Figure 2b using the same color code already mentioned. In both cases, the impedance response is characterized by a single semicircular arc, indicating that the dynamics are dominated by one main relaxation process that can be represented by a parallel RC branch in an equivalent-circuit description [39]. Within this framework, the high-frequency intercept on the real axis is related to the series resistance, while the diameter of the semicircle reflects the differential resistance contribution of the dominant process [40]. The semicircle diameter provides an estimate of the differential resistance associated with the selected bias point. In particular, at the maximum power point, the condition yields . Therefore, in magnitude, the differential resistance of each sub-cell at its MPP is equal to the ratio between its operating voltage and current, i.e., . Accordingly, a close correspondence is observed between the differential resistance derived from the J-V characteristics and that inferred from the impedance spectra. The agreement between the static J-V behavior and the dynamic impedance response confirms the physical consistency of the standalone simulations and provides a reliable reference for the subsequent tandem analysis. It is worth pointing out that the J-V characteristics were considered solely to verify that the numerical model employed for the simulation of the Nyquist plots under AC conditions also provides a consistent description of the device under DC operation. Such consistency between AC and DC regimes cannot, in general, be assumed a priori for a given model.
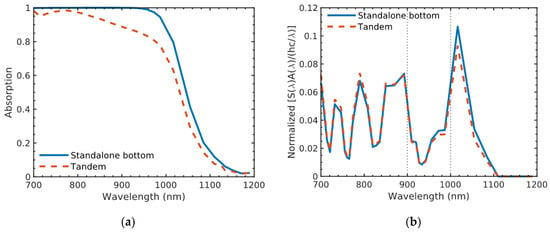
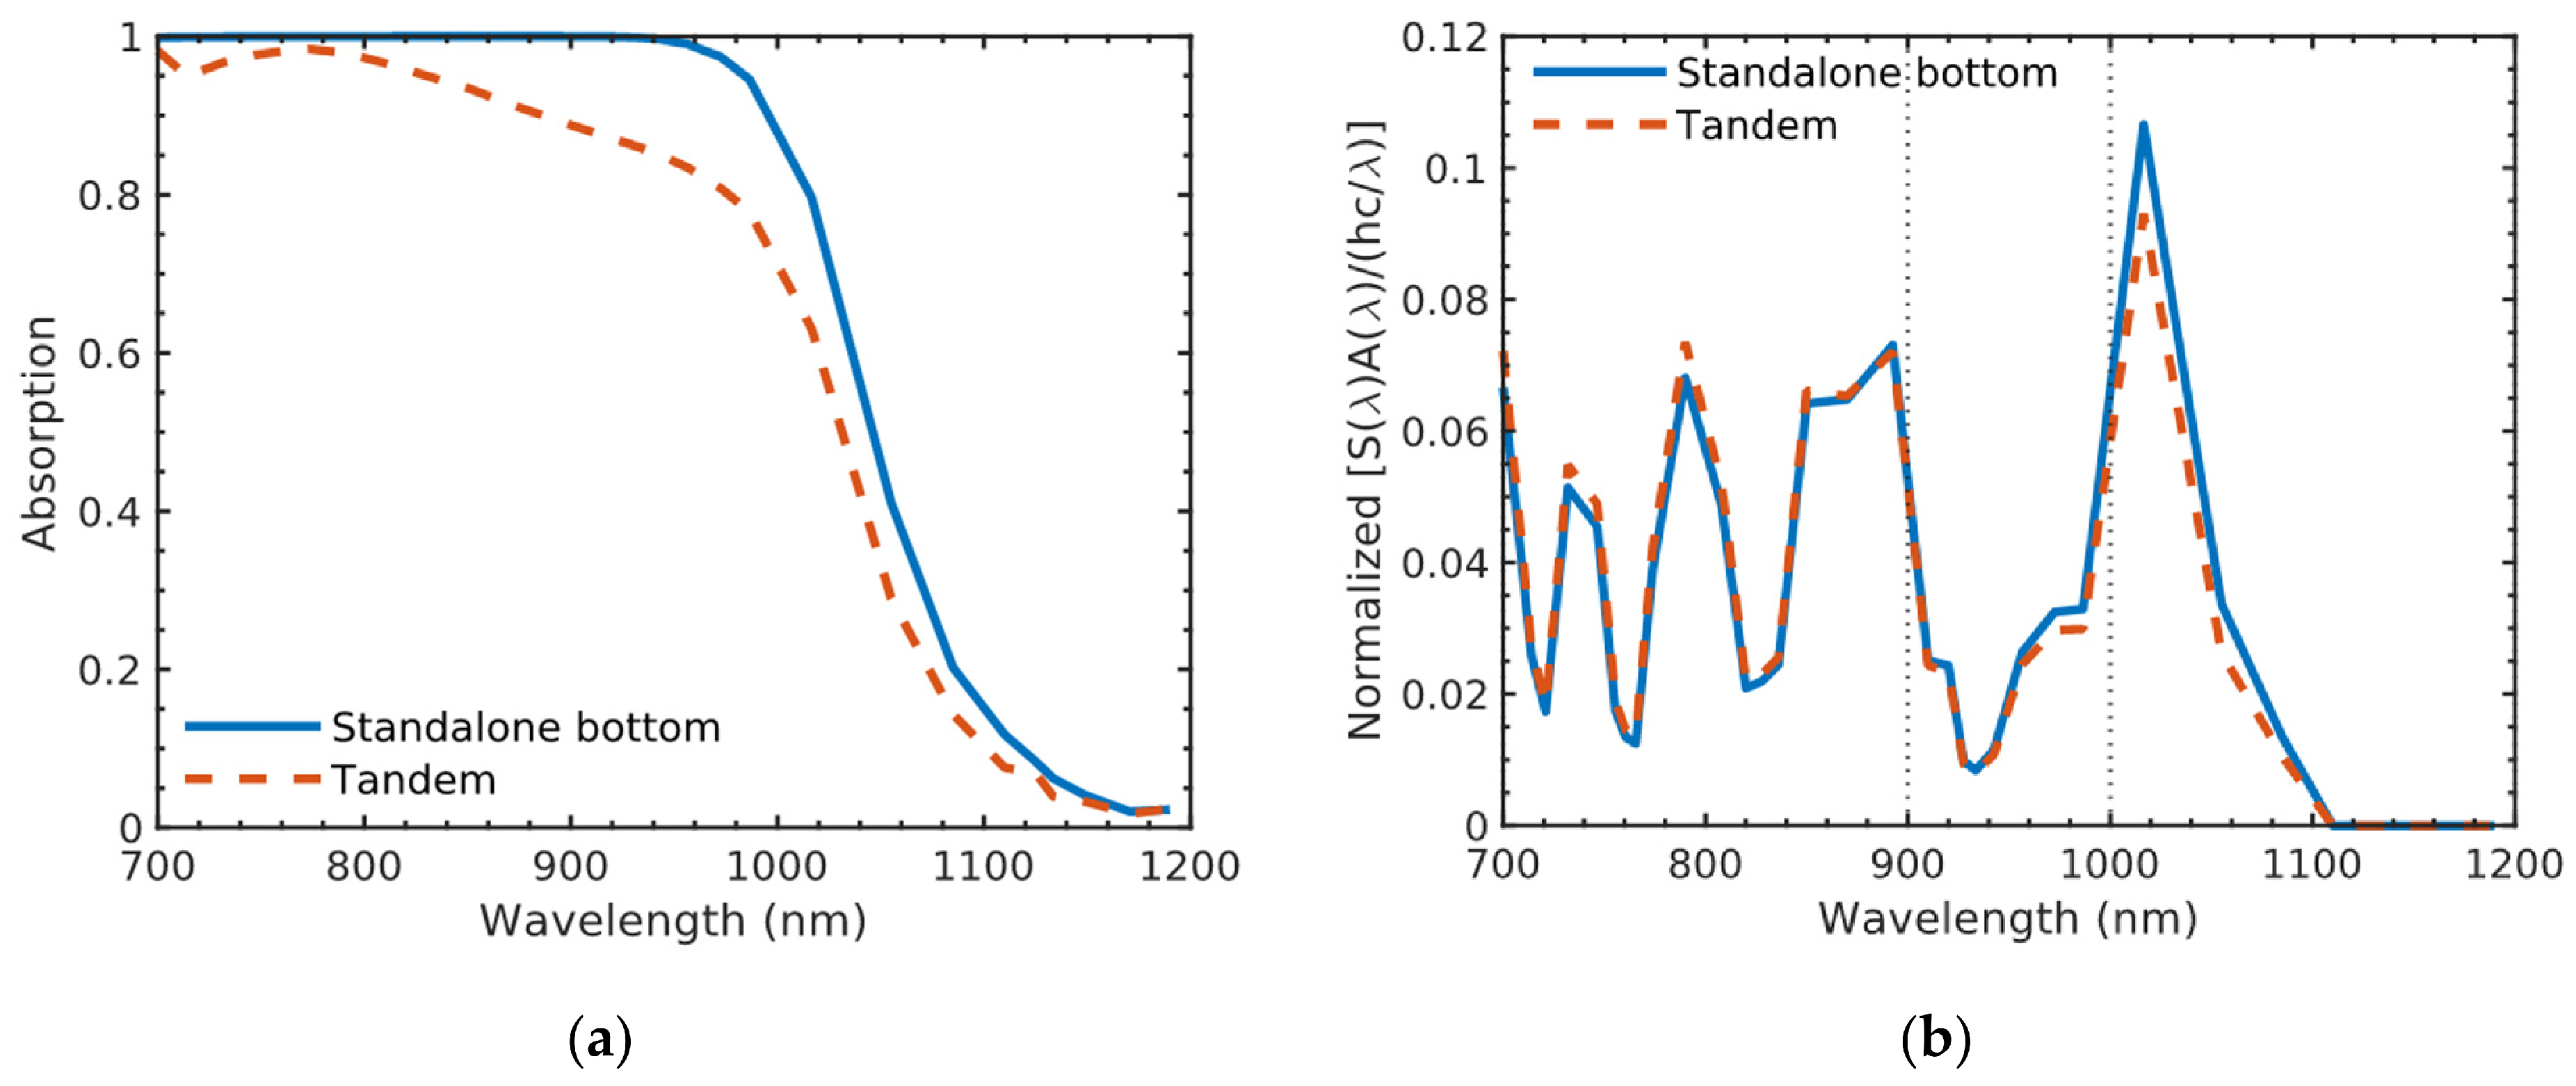
To verify that the spectral cutoff approach correctly estimates the behavior of the embedded bottom cell, an optical analysis was performed in TCAD. Transmittance, absorption, and reflectance spectra for tandem and standalone cells have been obtained. The transmittance spectrum of the standalone top cell was negligible in the range of wavelengths lower than 700 nm. Moreover, as shown in Figure 3a, the absorption spectra of the standalone bottom cell and the tandem are similar in the range of wavelengths higher than 700 nm, with some wavelength-dependent differences introduced by the complete tandem optical stack. To evaluate the effect of this discrepancy, a further analysis has been performed. In Figure 3b, the absorbed spectrum normalized to the photon energy, calculated as S(λ)∙A(λ)/(hc/λ), (where is the incident AM1.5G spectral intensity, is the wavelength-dependent absorption, is Planck’s constant, is the speed of light, and is the wavelength) is reported for both the tandem and standalone bottom cell. The curves exhibit a good match, and the gap between integrals calculated in MATLAB 2023b over the range of 700–1200 nm is within 2%, thus indicating that the ideal-cutoff approach provides a reasonable approximation of the bottom sub-cell illumination.
Figure 3.
(a) Absorption vs. wavelength plot for the standalone bottom sub-cell and tandem solar cell after 700 nm; (b) Absorbed spectrum normalized to the photon energy and wavelength plot for the standalone bottom sub-cell and the tandem.
4. Tandem J-V and IS Response in the Near-Current-Matched Configuration
After characterizing the standalone sub-cells, the monolithic tandem device was simulated in Sentaurus TCAD to obtain its J-V characteristics and impedance response. Based on the results presented in Section 3, the frequency regions of the tandem-cell Nyquist plot in which the contribution of each sub-cell is expected to be dominant were identified. These regions were then analyzed to extract information on the actual operating conditions of the individual sub-cells within the tandem device, thereby enabling the current-matching condition to be assessed.
For validation purposes, the internal contributions of the individual sub-cells were also independently extracted. In the following, the mixed-mode simulation approach implemented in the Sentaurus TCAD environment is first described, with particular emphasis on the introduction of a third virtual contact into the tandem structure. This additional contact is used exclusively to extract the internal J-V characteristics and impedance spectra of the individual sub-cells according to an analytical procedure based on the admittance matrix, which is described in detail in the following. Finally, the results are presented and discussed at the end of the section.
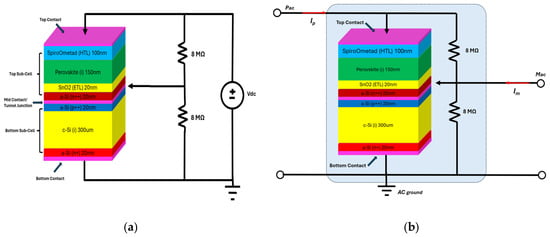
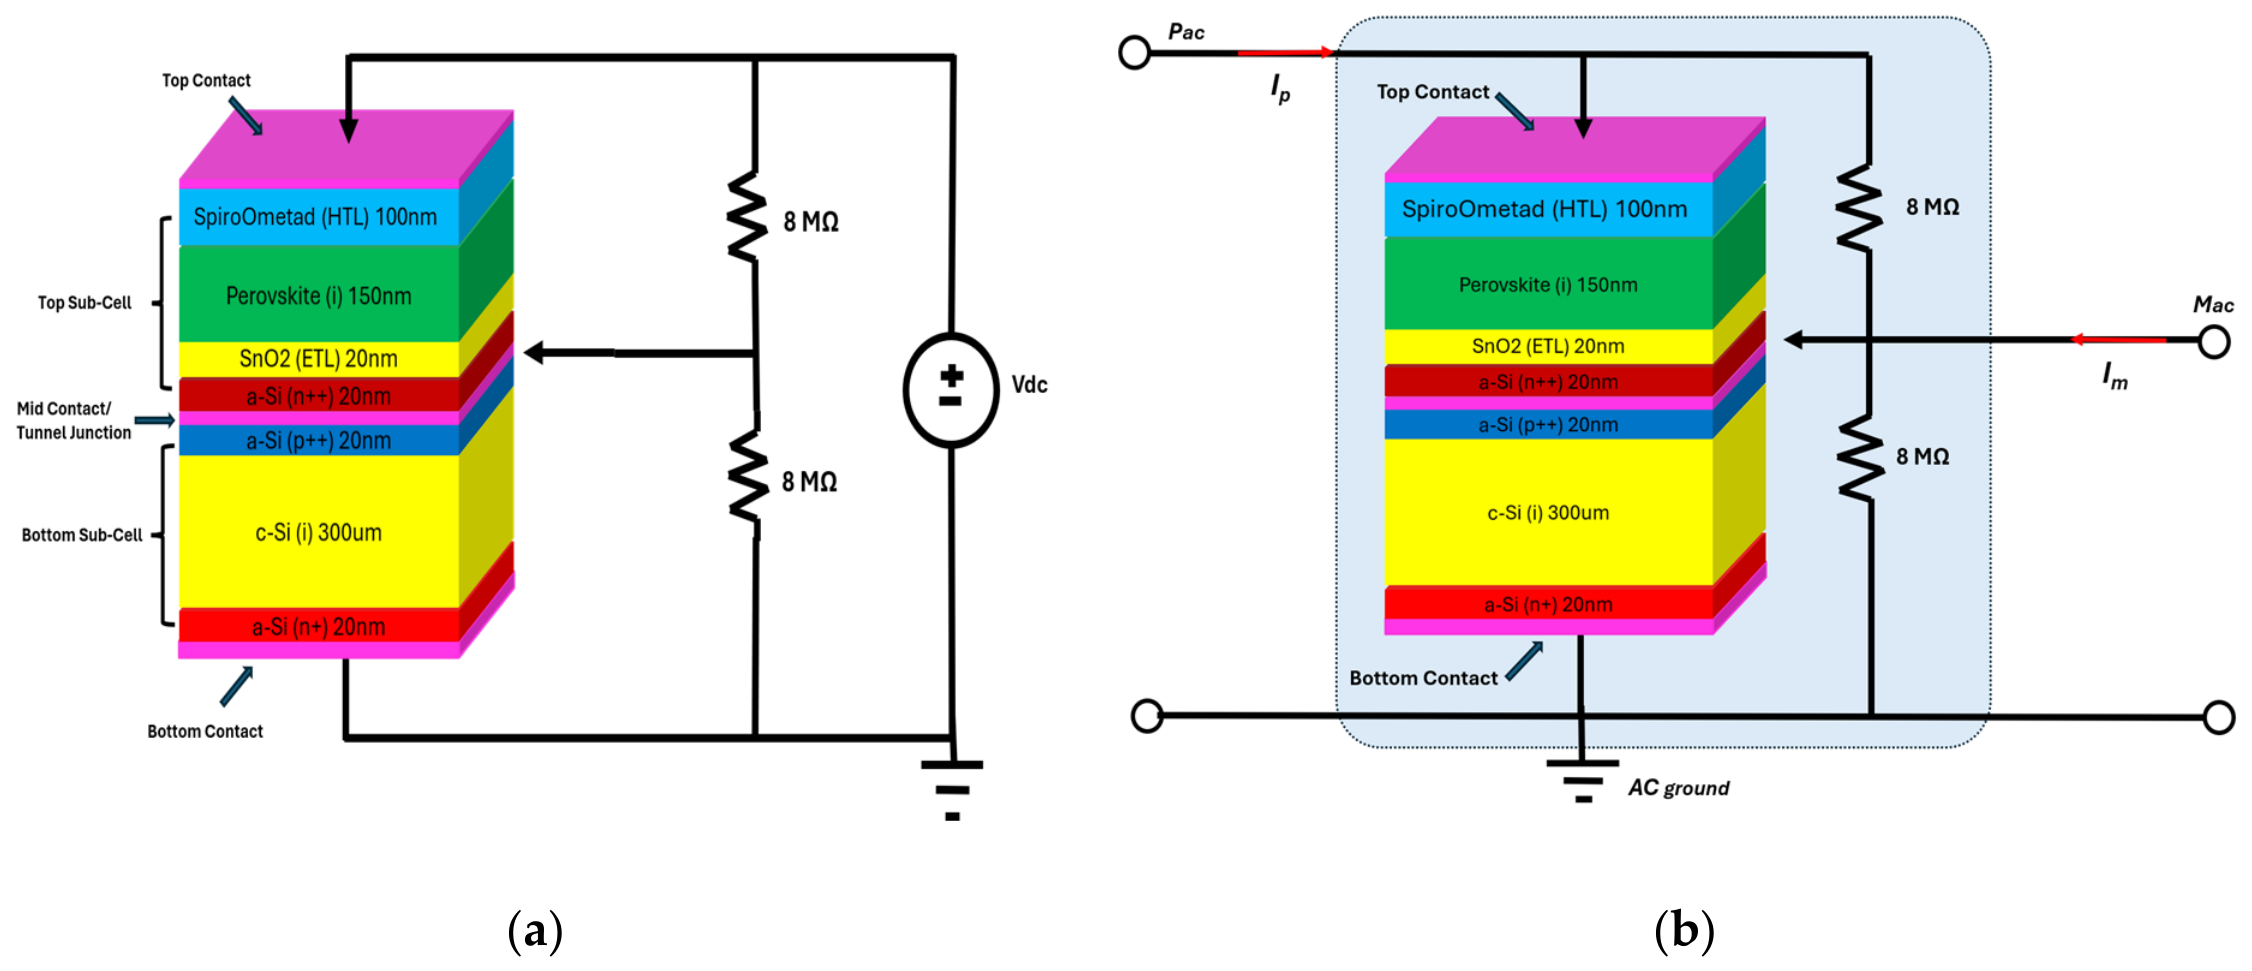
In the Sentaurus TCAD environment, biasing and the injection of a small-signal AC component are achieved through a SPICE-like approach by defining appropriate sources connected to the electrical terminals of the device as shown in Figure 4a,b. In a two-terminal tandem solar cell, to access information related to the behavior of the internal sections of the device, a simulation strategy was implemented based on the introduction of a mid-contact, to which probing sources can be connected and from which internal physical quantities can be extracted.
Figure 4.
(a) Mixed-mode configuration for extracting J-V curves for tandem, top, and bottom sub-cells. (b) Two-port network configuration for extracting the Nyquist plots for the tandem, top, and bottom sub-cells.
The mid-contact was introduced at the junction between the n-type and p-type amorphous silicon layers within the tunnel junction. The contact serves as an internal probe that allows access to the electrical node between the top and bottom sub-cells. The mid contact needs to be a floating contact in order to probe the internal voltage response without allowing any external current to flow through this node, thereby preserving the series-connected operation of the top and bottom sub-cells within the tandem structure. But to improve convergence, two 8 MΩ lumped resistors in parallel with the top and bottom sub-cells were introduced as shown in Figure 4a. For the complete tandem, TMM is applied directly to the full multilayer stack under AM1.5G illumination. The simplified cutoff is used only as a reference approximation for the standalone bottom cell and is not presented as the exact transmitted spectrum of a fabricated tandem. Using this configuration, the J-V plots of the top, bottom, and tandem solar cell were extracted. The proposed methodology is intended to provide numerical access to the otherwise inaccessible top and bottom-sub-cell dynamics of a 2T tandem structure. Therefore, the physical device remains a two-terminal structure, while the virtual internal node is used only as a numerical diagnostic probe. A corresponding real device can be reproduced in TCAD using its layer structure and material parameters, after which the proposed extraction procedure can be applied without modifying the physical device architecture.
Furthermore, for the AC analysis the top terminal was defined as the node, the internal mid-contact as the node, and the bottom terminal was used as the AC ground, and a small-signal AC source is also superimposed on the DC bias. The tandem for a given DC bias is analyzed as a two-port network, where the AC terminals pac and mac are referred to ground as shown in Figure 4b. The small-signal AC analysis was performed at the MPP of the tandem device over the frequency range from 1 mHz to 1 MHz. The resulting small-signal currents and voltages were used to construct the frequency-dependent admittance response.
To perform the two-port AC analysis, TCAD’s AC simulation framework was used; a 2 × 2 admittance matrix was obtained for the two AC nodes, and , with respect to the bottom terminal as ground. The linear small-signal relation can be written as
where Ip and Im are the small-signal currents at nodes and , respectively. While Ypp, Ypm, Ymp, and Ymm are the four admittance vectors, ω = 2πf (where f is the frequency), and is the imposed small-signal excitation amplitude. Each admittance component contains a real and imaginary contribution and can be expressed as
where A = conductance, C = capacitance.
The node mac is floating, which means that no external AC current is injected into that node. Therefore,
Substituting Equation (4) into the second row of Equation (2), the floating-node voltage is obtained as
With determined from Equation (5), the small-signal current at the node can be calculated from the first row of Equation (2):
Using the equations above, the tandem, bottom, and top Nyquist plots were generated using Equations (7)–(9), and the additivity check was performed using Equation (10). This additivity follows from the impedance definitions and is treated as an internal numerical consistency check.
In this way, the method allows the coupled monolithic tandem response to be separated into sub-cell-resolved impedance spectra at the selected operating point. This is particularly useful because standalone sub-cell simulations provide only reference behavior, whereas the proposed approach directly extracts the actual electrical response of each sub-cell while it remains coupled within the tandem device.
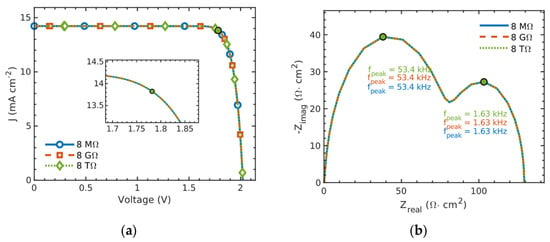
Furthermore, to prove that the contribution of the parallel resistances is negligible. A sensitivity analysis using 8 MΩ, 8 GΩ, and 8 TΩ is provided. As evident from Figure 5a,b, the J-V curves, Nyquist arc diameters, and the effective peak frequencies remained practically unchanged. This confirms that the resistors only stabilize the floating mid-contact numerically and do not materially affect the reported impedance response. Since the impact of the two resistances is not appreciable, their contribution is not explicitly discussed in the following, although they are still included in the equivalent circuit.
Figure 5.
(a) J-V characteristics of the tandem solar cell at 8 MΩ, 8 GΩ, 8 TΩ resistors under current-matched condition, (b) Nyquist plots of the tandem solar cell at 8 MΩ, 8 GΩ, 8 TΩ resistors under current-matched condition.
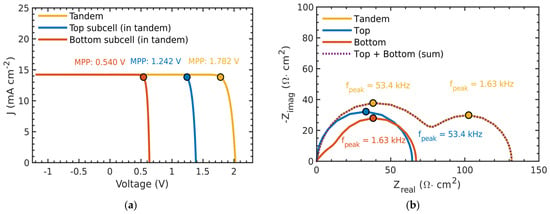
Using the mixed-mode extraction method described earlier, the tandem device was first analyzed under the near-current-matched configuration. Figure 6a. shows the J-V characteristics of the tandem device together with the extracted top and bottom sub-cells under this condition. The tandem short-circuit current density is approximately 14.2 mA cm−2, which is close to the short-circuit current density obtained for the filtered standalone bottom sub-cell (14.4 mA cm−2) and the top sub-cell (15.5 mA cm−2), as shown earlier in Figure 2a. This suggests that the tandem solar cell is operating near the near-current-matched condition. The extracted sub-cell J-V curves show the expected series-coupled behavior, where the top and bottom sub-cells share the same Jsc but contribute different open-circuit voltages to the total tandem open-circuit voltage. The MPP is also highlighted in Figure 6a and represents the bias point used for the impedance analysis.
Figure 6.
(a) J-V characteristics of the top, bottom, and tandem solar cell under near-current-matched condition; (b) Nyquist plots of the top (in-tandem), bottom (in-tandem) sub-cells and tandem solar cell under near-current-matched condition.
Figure 6b reports the corresponding Nyquist plots for the tandem device and for the extracted top and bottom sub-cells under the same near-current-matched condition. In this case, the extracted differential resistance of the tandem is approximately 131.5 Ω·cm2, while the differential resistances of the top and bottom sub-cells are about 67 Ω·cm2 and 64.4 Ω·cm2, as shown in Table 2. The exact agreement between the tandem differential resistance and the sum of the two extracted sub-cell differential resistances confirms that the mixed-mode formulation correctly partitions the total tandem impedance into physically meaningful top and bottom contributions. Also, the calculated Nyquist response from the J-V curves of Figure 6a at MPP (also called the DC analysis) under the near-current-matched condition shows that the top and bottom sub-cells contribute nearly equally to the total impedance of the tandem solar cells, as shown in Table 2. As evident from Table 2, the comparison between the static DC analysis and the lowest-frequency AC analysis shows good agreement of the results.
Table 2.
DC and AC differential resistance comparison for the top, bottom, and tandem solar cell under current-matched conditions.
This can also be visualized from the lowest differential resistance value from the sub-cells’ arc diameters, Figure 6b. Differential resistance at MPP was calculated using R_diff = dV/dI from the J-V curves for the tandem, top, and bottom sub-cells. The small discrepancies observed between the values extracted from the Nyquist plots and those derived from the J-V characteristics and reported in the table can be mainly attributed to two factors. First, the slope of the J-V characteristic at the operating point is numerically estimated through an incremental ratio using two consecutive points of the simulated curve, thus introducing a finite-step approximation error. Second, the comparison implicitly assumes equivalence between a quantity derived from a static characterization, i.e., J-V curve tracing, and the corresponding quantity obtained from a small-signal AC analysis. Although the latter is evaluated at a very low frequency (1 mHz), a residual discrepancy between the static and low-frequency AC responses may still be present.
It should also be noted that the tandem’s MPP current (13.8 mA cm−2) lies between the MPP current values of the standalone top (15.0 mA cm−2) and bottom (13.5 mA cm−2) sub-cells. Therefore, although the near-current-matched condition is closely approached, the operating currents of the sub-cells are not exactly identical to their standalone MPP conditions. This small difference explains the slight variation in the shape and amplitude of the extracted sub-cell Nyquist arcs compared with the standalone spectra.
In particular, if the sub-cell Nyquist plots of the tandem are compared with the standalone Nyquist plots, the top sub-cell arc shows a reduction in differential resistance, whereas the bottom sub-cell arc increases, which is consistent with the tandem MPP current relative to the standalone top and bottom MPP currents. This means that both the sub-cells are showing nearly equal resistance to the current in the tandem under near-current-matched conditions. In addition to the differential resistance contribution obtained from the arc diameter, the peak frequency of each extracted Nyquist arc provides information about the corresponding sub-cell based on the effective relaxation time constant. The effective relaxation time constant of the sub-cells is dependent on multiple physical mechanisms, in which the carrier lifetime is also an important contributor; this interpretation is further supported by the carrier lifetime sensitivity analysis in Section 6. In the current-matched configuration Figure 6b, the tandem spectrum highlights two peak frequency values, which are consistent with the extracted top and bottom sub-cells peak frequencies. This further confirms that the extracted impedance signatures of the individual sub-cells are correct and can be separated using the mixed-mode approach, providing direct access to the tandem and its internal sub-cell contributions.
A limitation of the proposed decomposition is that the assignment of individual impedance features becomes more ambiguous when the characteristic relaxation frequencies of the top and bottom sub-cells strongly overlap. The present TCAD results represent an ideal noise-free numerical case, whereas, in experimental measurements, noise and overlapping relaxation features may further reduce the reliability of the sub-cell assignment. The proposed decomposition is therefore most reliable when the characteristic responses of the two sub-cells exhibit sufficiently separated peak frequencies.
Moreover, particular attention should be paid to possible hysteresis in the J-V characteristics, as it may affect the consistency between the static J-V characterization and the impedance response. To mitigate this effect, the J-V characteristic obtained by averaging the forward and reverse voltage scans may be considered, while a sufficiently low scan rate (e.g., 10 mV/s) should be adopted to approach quasi-steady-state conditions.
5. Tandem J-V and IS Response in the Current-Mismatched Configuration
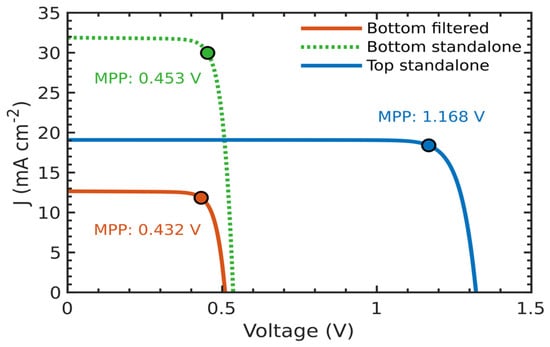
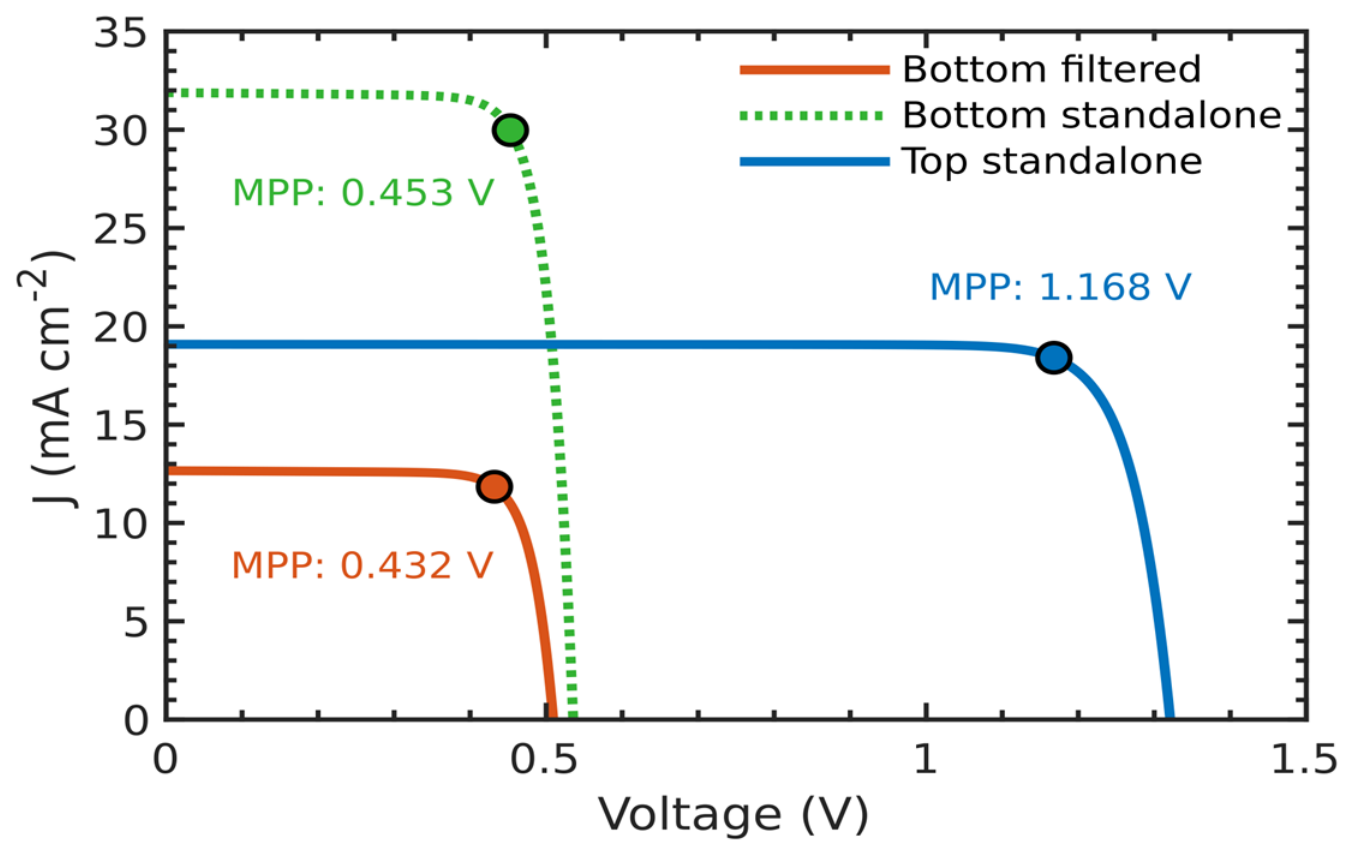
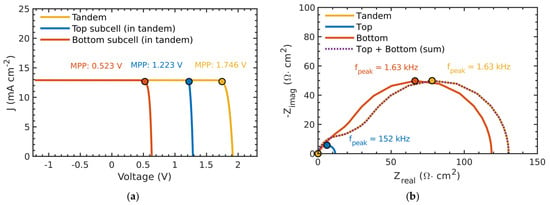
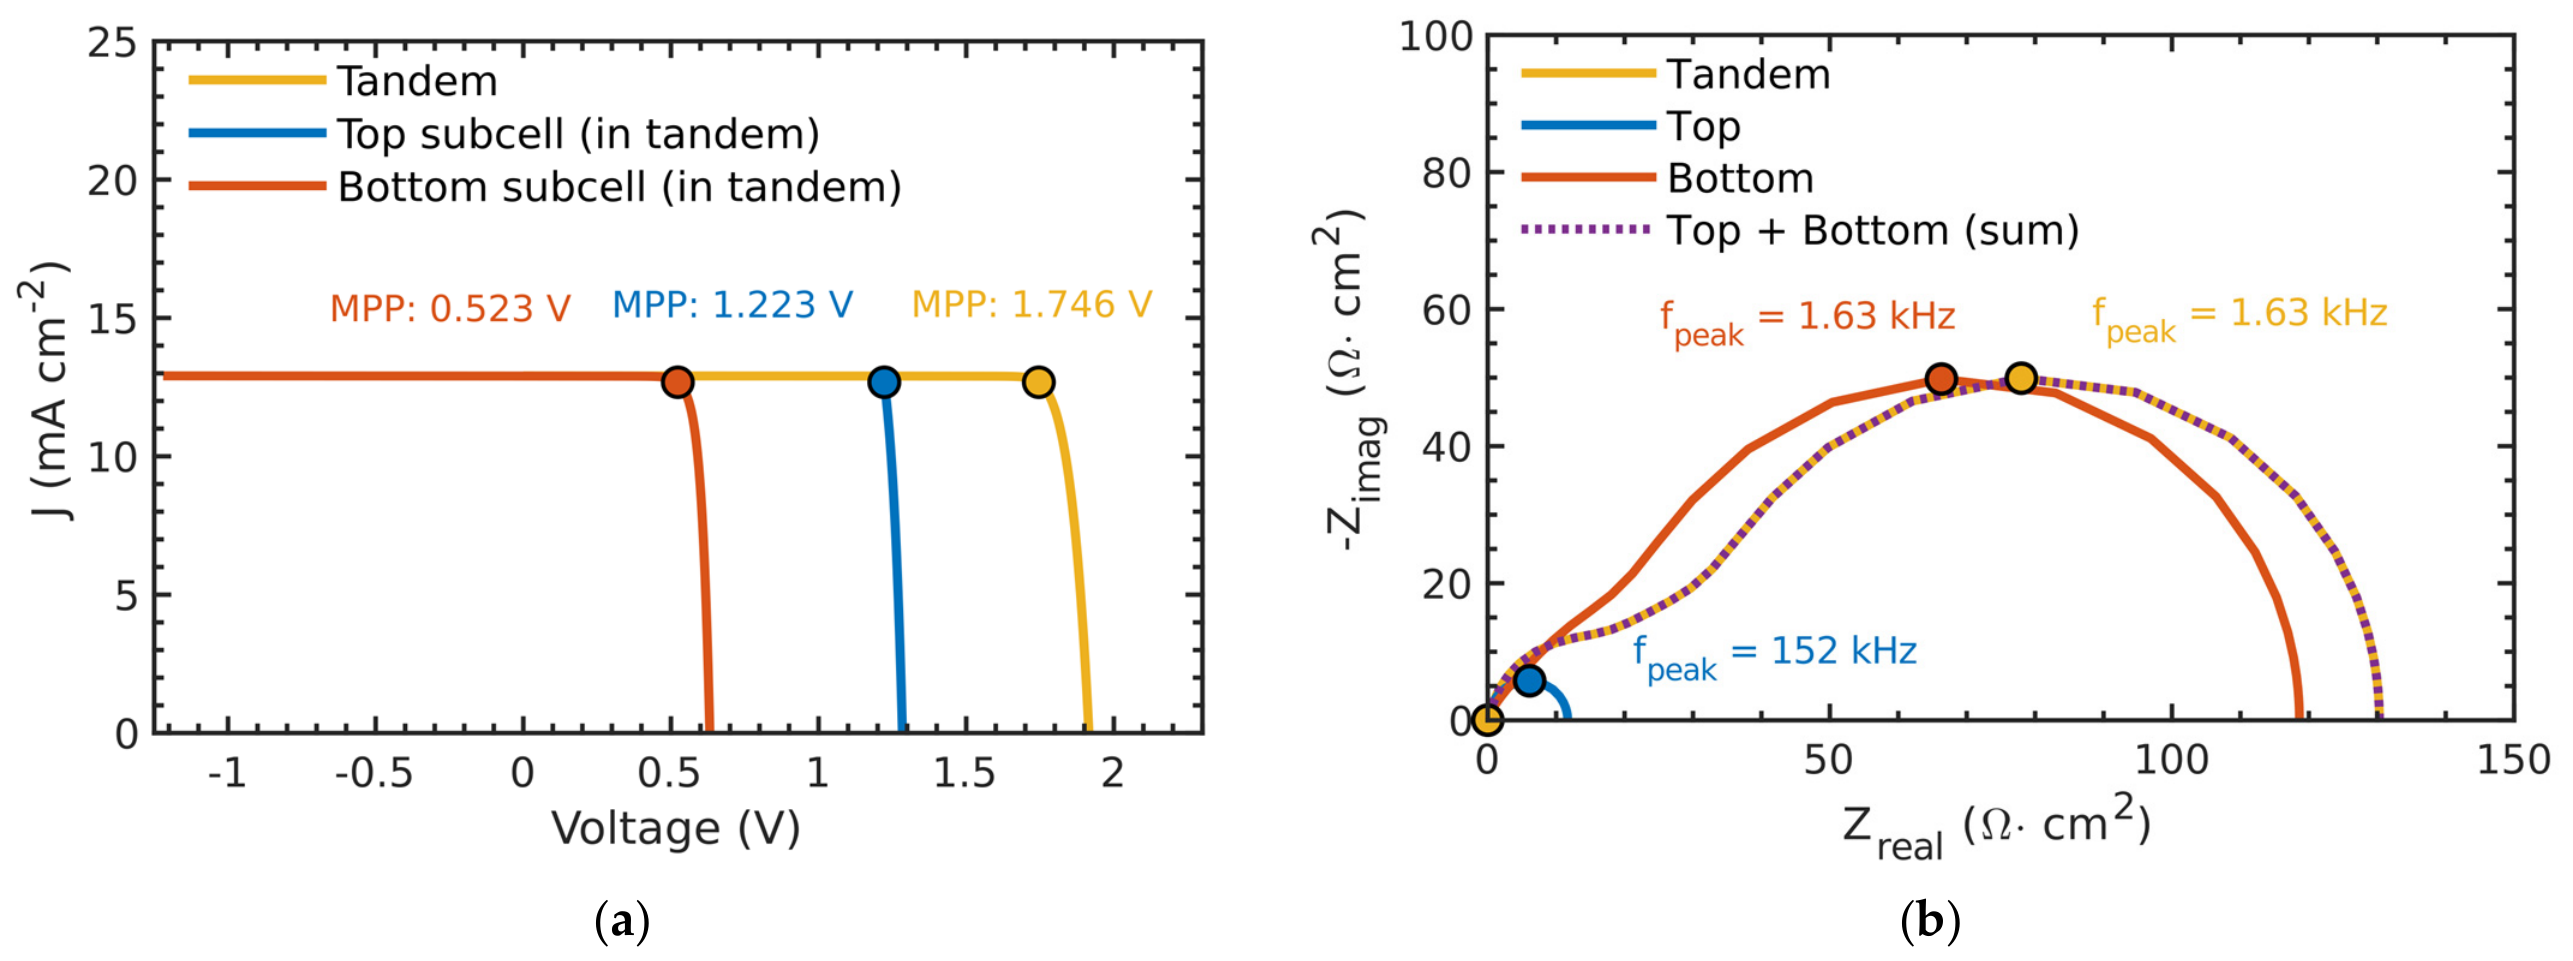
To further assess the sensitivity of the proposed mixed-mode approach, a current-mismatched configuration was also investigated. In this case, the bandgap of the top perovskite absorber was reduced from 1.75 eV to 1.64 eV, which modifies the current density balance between the two sub-cells and drives the tandem away from the near-current-matched configuration. The reason for reducing the bandgap of the top absorber from 1.75 to 1.64 eV was to increase the absorption capability of the top sub-cell and create a condition in which one of the sub-cells is limiting the overall current to implement our methodology. Figure 7 shows the J-V characteristics of the standalone top (perovskite) and bottom (c-Si) cells, together with the filtered bottom sub-cell under this condition. The J-V curves highlight that, under this condition, the Jsc of the standalone top sub-cell is 19.0 mA cm−2 and for the bottom sub-cell is 12.6 mA cm−2. Similarly, from Figure 8a it is also evident that the tandem’s Jsc, which is now 12.9 mA cm−2, indicates that the device is now current-limited by the bottom sub-cell.
Figure 7.
J-V characteristics of the standalone top, bottom, and filtered bottom solar cells under current-mismatched conditions.
Figure 8.
(a) J-V characteristics of the top, bottom, and tandem solar cells under current-mismatched conditions. (b) Nyquist plots of the top (in-tandem), bottom (in-tandem) sub-cells and tandem solar cell under current-mismatched conditions.
To further validate this analysis numerically, the corresponding Nyquist plots in Figure 8b show that the tandem differential resistance is approximately 130 Ω·cm2, while the extracted resistances of the top and bottom sub-cells are about 11.6 Ω·cm2 and 118.5 Ω·cm2, respectively. The tandem differential resistance is exactly equal to the sum of the extracted sub-cell resistances, confirming that the proposed method continues to extract the total response correctly even when the tandem is operated under the mismatched configuration. Even under current-mismatched conditions, the proposed model remains valid in both DC and AC regimes, as demonstrated by the good agreement between the corresponding results reported in Table 3.
Table 3.
DC and AC differential resistance comparison for the top, bottom, and tandem solar cells under current-mismatched conditions.
However, a clear redistribution of impedance contribution is observed in the current-mismatched case. The top sub-cell arc becomes significantly smaller, whereas the bottom sub-cell arc expands and dominates the overall tandem response. This behavior indicates that the bottom sub-cell becomes the limiting section under the mismatch case. The change in arc diameter/differential resistance therefore provides a direct indication of how the differential resistance contribution is redistributed between the two sub-cells when the short-circuit current density balance is modified under the current mismatch case.
Although the Nyquist response remains composed of characteristic sub-cell-related features, the relative contribution of these features changes substantially compared with the near-current-matched case. The persistence of the characteristic peak frequency features in the extracted impedance spectra for the bottom sub-cell indicates that the same sub-cell-related relaxation processes remain present, while the variation in arc amplitude reflects the shift in the dominant differential resistance contribution. This comparison between the near-current-matched and current-mismatched cases highlights the capability of the mixed-mode extraction method. It shows that the tandem impedance response can be decomposed into top and bottom contributions and that the transition from matched to mismatched operation is directly reflected in the Nyquist spectra through variations in arc diameter and differential resistance. In this way, the proposed approach provides a practical route for diagnosing the role of each sub-cell in the operation of the monolithic tandem solar cell.
6. Carrier Lifetime Sensitivity Analysis
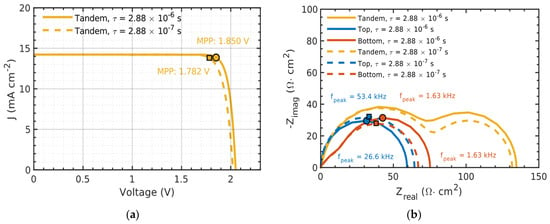
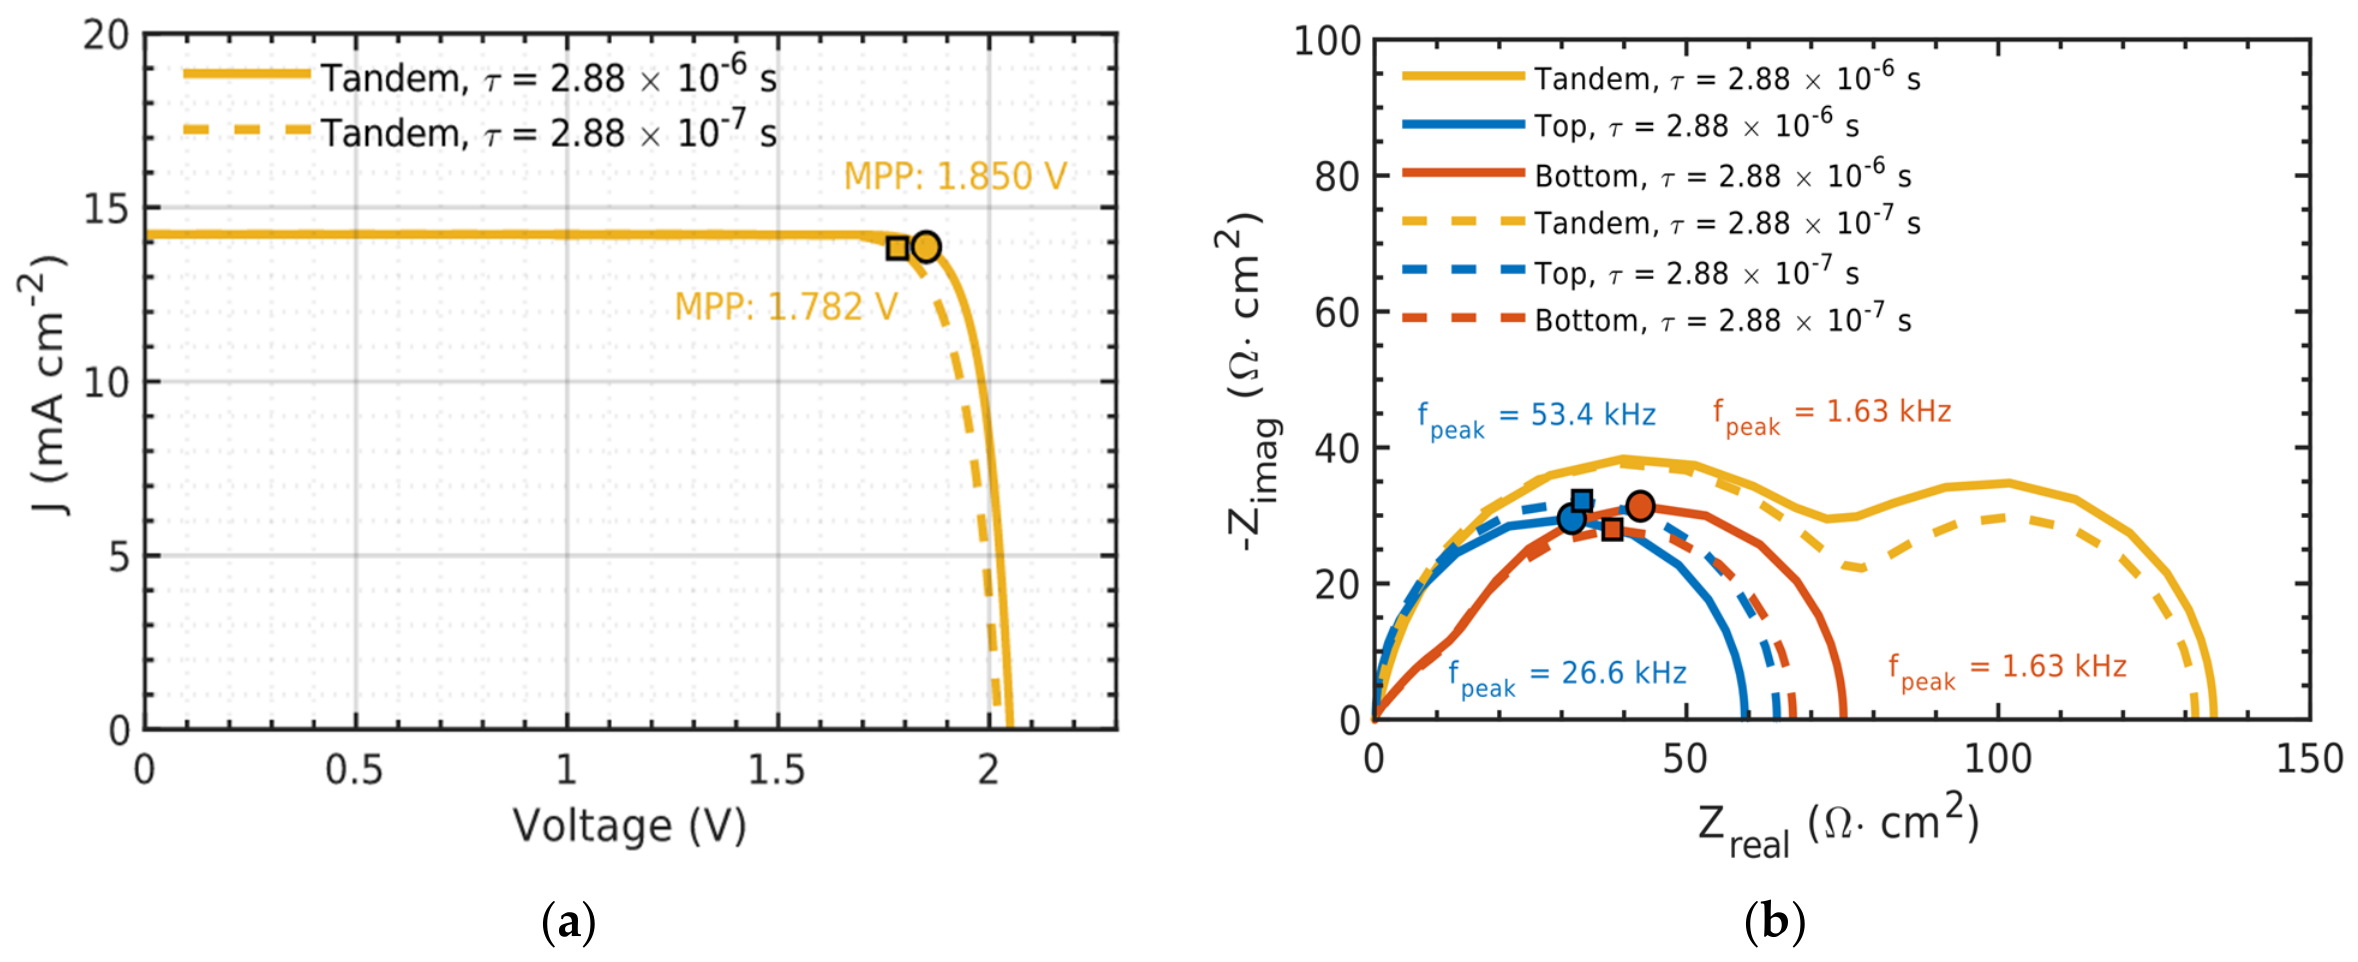
After validating the mixed-mode extraction method under both near-current-matched and current-mismatched conditions, a carrier lifetime sensitivity analysis was added as an additional robustness check. In this analysis, the electron and hole lifetimes in the perovskite absorber were assumed to be equal and were varied simultaneously. Figure 9a shows the corresponding J-V characteristics of the tandem, while Figure 9b presents the Nyquist plots for the tandem, top, and bottom sub-cells. The extracted differential resistance values are summarized in Table 4.
Figure 9.
(a) J-V characteristics of the tandem solar cell with different carrier lifetimes, with MPP denoted by the small squares and circles. (b) Nyquist plots of the top (in-tandem), bottom (in-tandem) sub-cells and tandem solar cell under different carrier lifetimes, with MPP denoted by the small squares and circles.
Table 4.
DC and AC differential resistance comparison for the top, bottom, and tandem solar cells under different carrier lifetimes.
The results show that changing the carrier lifetime modifies the MPP position, the differential resistance magnitude for the tandem, and the peak-frequency position of the top sub-cell. As shown in Figure 9b, the shift in the top sub-cell peak frequency caused by the change in carrier lifetime is effectively tracked by the proposed methodology. At the same time, the total tandem impedance remains consistent with the separated top and bottom sub-cell contributions. This confirms that the proposed methodology can also follow changes in the dynamic response of the sub-cell under material-parameter variation.
7. Conclusions
This work presented a diagnostic methodology for monolithic perovskite/silicon tandem solar cells based on the combined analysis of static and dynamic electrical characteristics. By preliminarily characterizing the individual sub-cells, the frequency ranges in which each sub-cell mainly contributes to the overall tandem impedance can be identified and subsequently used to interpret the response of the complete monolithic device. The proposed approach was investigated through TCAD simulations performed in the Sentaurus environment on both the standalone sub-cell structures and the sub-cells embedded within the tandem device. To enable direct access to the individual sub-cells in the tandem configuration, an additional test contact was introduced at the intermediate contact (mid-contact) between the two sub-cells. The extracted Nyquist response showed distinct sub-cell contributions with different arc amplitudes and peak frequencies. The arc amplitude was associated with differential resistance, while the peak frequency was interpreted as an effective relaxation feature rather than a direct measure of the absorber layer’s carrier lifetime. The proposed approach was then used to investigate the impedance spectra under both near-current-matched and current-mismatched operating conditions. The results show that the contributions of the individual sub-cells can be effectively distinguished from the tandem Nyquist response, providing information on their actual operating conditions. These findings highlight the potential of the proposed methodology as a diagnostic tool for identifying performance limitations and supporting the optimization of monolithic perovskite/silicon tandem solar cells.
Supplementary Materials
The following supporting information can be downloaded at: https://www.mdpi.com/article/10.3390/electronics15194351/s1, Table S1: All parameters used for the TCAD simulation.
Author Contributions
Conceptualization, Z.u.a.Q., P.G. and I.M.; Methodology, Z.u.a.Q., P.G. and I.M.; Investigation, Z.u.a.Q.; Writing—original draft, Z.u.a.Q.; Writing—review & editing, P.G. and I.M.; Supervision, P.G. and I.M.; Funding acquisition, I.M. All authors have read and agreed to the published version of the manuscript.
Funding
Innovative, Efficient, and Sustainable Integrated Photovoltaic Project in the framework of PTR 2025–2027, funded by MASE, Italian Ministry of the Environment and Energy Security. CUP I53C24003280001.
Data Availability Statement
All the simulation data related to the parameters and models used are available in the text.
Conflicts of Interest
The authors declare no conflicts of interest.
Abbreviations
The following abbreviations are used in this manuscript:
| AC | Alternate current |
| a-Si:H | Hydrogenated Amorphous silicon |
| c-Si | Crystalline silicon |
| DC | Direct current |
| ETL | Electron transport layer |
| HTL | Hole transport layer |
| IS | Impedance spectroscopy |
| MPP | Maximum power point |
References
- National Renewable Energy Laboratory (NREL). Interactive Best Research-Cell Efficiency Chart. Available online: https://www.nlr.gov/pv/interactive-cell-efficiency (accessed on 1 September 2026).
- Shockley, W.; Queisser, H.J. Detailed Balance Limit of Efficiency of p–n Junction Solar Cells. J. Appl. Phys. 1961, 32, 510–519. [Google Scholar] [CrossRef] [Scilit]
- Tiedje, T.; Yablonovitch, E.; Cody, G.D.; Brooks, B.G. Limiting Efficiency of Silicon Solar Cells. IEEE Trans. Electron Devices 1984, 31, 711–716. [Google Scholar] [CrossRef] [Scilit]
- De Vos, A. Detailed Balance Limit of the Efficiency of Tandem Solar Cells. J. Phys. D Appl. Phys. 1980, 13, 839–846. [Google Scholar] [CrossRef] [Scilit]
- Green, M.A. Solar Cells: Operating Principles, Technology, and System Applications; Prentice-Hall: Englewood Cliffs, NJ, USA, 1982. [Google Scholar]
- Würfel, P.; Würfel, U. Physics of Solar Cells: From Basic Principles to Advanced Concepts, 2nd ed.; Wiley-VCH: Weinheim, Germany, 2009. [Google Scholar]
- Eperon, G.E.; Hörantner, M.T.; Snaith, H.J. Metal Halide Perovskite Tandem and Multiple-Junction Photovoltaics. Nat. Rev. Chem. 2017, 1, 0095. [Google Scholar] [CrossRef] [Scilit]
- Futscher, M.H.; Ehrler, B. Efficiency Limit of Perovskite/Si Tandem Solar Cells. ACS Energy Lett. 2016, 1, 863–868. [Google Scholar] [CrossRef] [Scilit]
- Jošt, M.; Kegelmann, L.; Korte, L.; Albrecht, S. Monolithic Perovskite Tandem Solar Cells: A Review of the Present Status and Advanced Characterization Methods Toward 30% Efficiency. Adv. Energy Mater. 2020, 10, 1904102. [Google Scholar] [CrossRef] [Scilit]
- Al-Ashouri, A.; Köhnen, E.; Li, B.; Magomedov, A.; Hempel, H.; Caprioglio, P.; Márquez, J.A.; Vilches, A.B.M.; Kasparavicius, E.; Smith, J.A.; et al. Monolithic Perovskite/Silicon Tandem Solar Cell with >29% Efficiency by Enhanced Hole Extraction. Science 2020, 370, 1300–1309. [Google Scholar] [CrossRef] [Scilit]
- Hou, Y.; Aydin, E.; De Bastiani, M.; Xiao, C.; Isikgor, F.H.; Xue, D.-J.; Chen, B.; Chen, H.; Bahrami, B.; Chowdhury, A.H.; et al. Efficient Tandem Solar Cells with Solution-Processed Perovskite on Textured Crystalline Silicon. Science 2020, 367, 1135–1140. [Google Scholar] [CrossRef] [Scilit]
- Liu, J.; He, Y.; Ding, L.; Zhang, H.; Li, Q.; Jia, L.; Yu, J.; Lau, T.W.; Li, M.; Qin, Y.; et al. Perovskite/Silicon Tandem Solar Cells with Bilayer Interface Passivation. Nature 2024, 635, 596–603. [Google Scholar] [CrossRef] [Scilit]
- Shi, Y.; Berry, J.J.; Zhang, F. Perovskite/Silicon Tandem Solar Cells: Insights and Outlooks. ACS Energy Lett. 2024, 9, 1305–1330. [Google Scholar] [CrossRef] [Scilit]
- Rolston, N.; Prasanna, R.; Sofia, S.; Harwood, D.; Ma, W.; Moghadam, F.; Snaith, H.J.; Buonassisi, T.; Holman, Z.C.; Bent, S.F.; et al. A Taxonomy for Three-Terminal Tandem Solar Cells. ACS Energy Lett. 2020, 5, 1233–1242. [Google Scholar] [CrossRef] [Scilit]
- Park, I.J.; Park, J.H.; Ji, S.G.; Park, M.-A.; Jang, J.H.; Kim, J.Y. A Three-Terminal Monolithic Perovskite/Si Tandem Solar Cell Characterization Platform. Joule 2019, 3, 807–818. [Google Scholar] [CrossRef] [Scilit]
- Park, J.H.; Ji, S.G.; Park, I.J.; Hwang, S.K.; Lim, H.W.; Kim, J.Y. Sub-Cell Characterization of Two-Terminal Perovskite/Silicon Tandem Solar Cells. Cell Rep. Phys. Sci. 2022, 3, 101076. [Google Scholar] [CrossRef] [Scilit]
- Orazem, M.E.; Tribollet, B. Electrochemical Impedance Spectroscopy, 2nd ed.; Wiley: Hoboken, NJ, USA, 2017. [Google Scholar]
- Barsoukov, E.; Macdonald, J.R. (Eds.) Impedance Spectroscopy: Theory, Experiment, and Applications, 3rd ed.; Wiley: Hoboken, NJ, USA, 2018. [Google Scholar]
- Bisquert, J.; Bertoluzzi, L.; Mora-Seró, I.; Garcia-Belmonte, G. Theory of Impedance and Capacitance Spectroscopy of Solar Cells with Dielectric Relaxation, Drift-Diffusion Transport, and Recombination. J. Phys. Chem. C 2014, 118, 18983–18991. [Google Scholar] [CrossRef] [Scilit]
- Matacena, I.; Lancellotti, L.; Bobeico, E.; Usatii, I.; della Noce, M.; Santoro, E.; Scognamiglio, P.; Mercaldo, L.V.; Veneri, P.D.; Daliento, S. Impedance Spectroscopy for Interface Trap Effects Evaluation in Dopant-Free Silicon Solar Cells. Energies 2025, 18, 4558. [Google Scholar] [CrossRef] [Scilit]
- Matacena, I.; Lancellotti, L.; Lisi, N.; Veneri, P.D.; Guerriero, P.; Daliento, S. Impedance Spectroscopy for the characterization of the all-carbon graphene-based solar cell. Energies 2020, 13, 1908. [Google Scholar] [CrossRef] [Scilit]
- Matacena, I.; Lancellotti, L.; Daliento, S.; Alfano, B.; De Maria, A.; La Ferrara, V.; Mercaldo, L.V.; Miglietta, M.L.; Polichetti, T.; Rametta, G.; et al. Impedance spectroscopy of Perovskite solar cells with SnO2 embedding Graphene nanoplatelets. IEEE J. Photovolt. 2023, 13, 866–872. [Google Scholar] [CrossRef] [Scilit]
- Matacena, I.; Maresca, L.; Riccio, M.; Irace, A.; Breglio, G.; Daliento, S. Evaluation of Interface Traps Type, Energy Level and Density of SiC MOSFETs. Mater. Sci. Forum 2020, 1004, 248–254. [Google Scholar]
- Roose, B.; Dey, K.; Fitzsimmons, M.R.; Chiang, Y.-H.; Cameron, P.J.; Stranks, S.D. Electrochemical Impedance Spectroscopy of All-Perovskite Tandem Solar Cells. ACS Energy Lett. 2024, 9, 442–453. [Google Scholar] [CrossRef] [Scilit]
- Boudjemila, L.; Nenashev, G.; Malyshkin, V.; Terukov, E.; Aleshin, A. Impedance Dynamics in Tandem Solar Cells Based on c-Si with Upper Layers of CsPbBr (CsPbI) Perovskite Nanocrystals. Opt. Mater. 2024, 156, 115925. [Google Scholar] [CrossRef] [Scilit]
- Mercaldo, L.V.; Bobeico, E.; De Maria, A.; Della Noce, M.; Ferrara, M.; La Ferrara, V.; Lancellotti, L.; Rametta, G.; Sannino, G.V.; Usatii, I.; et al. Monolithic Perovskite/Silicon-Heterojunction Tandem Solar Cells with Nanocrystalline Si/SiO Tunnel Junction. Energies 2021, 14, 7684. [Google Scholar] [CrossRef] [Scilit]
- Matacena, I.; Guerriero, P.; Lancellotti, L.; Alfano, B.; De Maria, A.; La Ferrara, V.; Mercaldo, L.V.; Miglietta, M.L.; Polichetti, T.; Rametta, G.; et al. Impedance Spectroscopy Analysis of Perovskite Solar Cell Stability. Energies 2023, 16, 4951. [Google Scholar] [CrossRef] [Scilit]
- Mailoa, J.P.; Bailie, C.D.; Johlin, E.C.; Hoke, E.T.; Akey, A.J.; Nguyen, W.H.; McGehee, M.D.; Buonassisi, T. A 2-terminal perovskite/silicon multijunction solar cell enabled by a silicon tunnel junction. Appl. Phys. Lett. 2015, 106, 121105. [Google Scholar] [CrossRef] [Scilit]
- Altermatt, P.P. Models for Numerical Device Simulations of Crystalline Silicon Solar Cells—A Review. J. Comput. Electron. 2011, 10, 314–330. [Google Scholar] [CrossRef] [Scilit]
- Synopsys, Inc. Sentaurus™ Device User Guide; Synopsys, Inc.: Mountain View, CA, USA, 2017. [Google Scholar]
- Synopsys, Inc. Sentaurus™ MixedMode User Guide; Synopsys, Inc.: Mountain View, CA, USA, 2017. [Google Scholar]
- Mora-Seró, I.; Garcia-Belmonte, G.; Boix, P.P.; Vázquez, M.A.; Bisquert, J. Impedance spectroscopy characterisation of highly efficient silicon solar cells under different light illumination intensities. Energy Environ. Sci. 2009, 2, 678–686. [Google Scholar] [CrossRef] [Scilit]
- ASTM G173-23; Standard Tables for Reference Solar Spectral Irradiances: Direct Normal and Hemispherical on 37° Tilted Surface. ASTM International: West Conshohocken, PA, USA, 2023. [CrossRef] [Scilit]
- ASTM G173; Reference Air Mass 1.5 Spectra. National Renewable Energy Laboratory: Golden, CO, USA, 2003.
- Li, S.; Zheng, Z.; Ju, J.; Cheng, S.; Chen, F.; Xue, Z.; Ma, L.; Wang, Z. A Generic Strategy to Stabilize Wide Bandgap Perovskites for Efficient Tandem Solar Cells. Adv. Mater. 2024, 36, 2307701. [Google Scholar] [CrossRef] [Scilit]
- Ganesh, K.; Padmanabhan, R. Modeling of Perovskite-Silicon Tandem Solar Cells: A TCAD-based Approach. In Proceedings of the 2020 5th IEEE International Conference on Emerging Electronics (ICEE), New Delhi, India, 26–28 November 2020; pp. 1–4. [Google Scholar] [CrossRef] [Scilit]
- Alnuaimi, A.; Almansouri, I.; Nayfeh, A. Effect of mobility and band structure of hole transport layer in planar heterojunction perovskite solar cells using 2D TCAD simulation. J. Comput. Electron. 2016, 15, 1110–1118. [Google Scholar] [CrossRef] [Scilit]
- von Hauff, E.; Klotz, D. Impedance spectroscopy for perovskite solar cells: Characterisation, analysis, and diagnosis. J. Mater. Chem. C 2022, 10, 742–761. [Google Scholar] [CrossRef] [Scilit]
- von Hauff, E. Impedance Spectroscopy for Emerging Photovoltaics. J. Phys. Chem. C 2019, 123, 11329–11346. [Google Scholar] [CrossRef] [Scilit]
- Djeukeu, I.J.; Horn, J.; Meixner, M.; Wagner, E.; Glunz, S.W.; Ramspeck, K. Subcell-Resolved Electroluminescence Imaging of Monolithic Perovskite/Silicon Tandem Solar Cell for High-Throughput Characterization. Sol. RRL 2024, 8, 2400469. [Google Scholar] [CrossRef] [Scilit]

Disclaimer/Publisher’s Note: The statements, opinions and data contained in all publications are solely those of the individual author(s) and contributor(s) and not of MDPI and/or the editor(s). MDPI and/or the editor(s) disclaim responsibility for any injury to people or property resulting from any ideas, methods, instructions or products referred to in the content. |
© 2026 by the authors. Licensee MDPI, Basel, Switzerland. This article is an open access article distributed under the terms and conditions of the Creative Commons Attribution (CC BY) license.