


Abstract
Large language models (LLMs) are increasingly used in programming tasks, including code generation, debugging, validation, optimization, test generation, and educational support. Their use as graders of student programming assignments is, however, still not fully understood, especially in object-oriented programming (OOP). In this context, correctness depends not only on the final output of a program but also on class structure, encapsulation, abstraction, and design decisions. This paper introduces a dataset of 271 C++ student solutions to eight OOP examination problems, together with the problem statements and the reference grades produced by the university auto-grader. We evaluate four locally served open-weight models—phi4-mini, gpt-oss:20b, qwen3.6:27b, and qwq:32b—under one endpoint, one prompt, and deterministic decoding, and we report four properties that a deployable grader must have. The first is output-format compliance, which ranges from 88.9% to 98.9% across models: qwq:32b failed to terminate on 30 of 271 submissions even at a doubled generation budget, spending 7.7 MJ, 29.9% of its total energy, to produce nothing. The second is agreement with the reference grades on the 30-point course scale, where qwen3.6:27b performs best (MAE 3.23 points, ) and phi4-mini worst (MAE 10.90, ); all four models grade systematically more strictly than the auto-grader. The third is reproducibility, which fails at two levels. Repeating an identical run, three models returned identical grades at temperature 0 with a fixed seed while gpt-oss:20b varied by up to 21 points on the same submission; restricting the serving daemon to one concurrent request makes it reproducible, locating that failure in request batching rather than in sampling. Grading the same submissions as part of a different set, however, no model is reproducible: agreement with the original run ranges from 13 to 33 of 40 submissions, and a control run with the original client excludes our instrumentation as the cause. The fourth is degeneracy: phi4-mini awarded an identical grade of zero to every submission in three of the eight examinations, 109 submissions in total, so its aggregate agreement statistics describe a model that is not grading. On a subset graded blind by two instructors, each instructor agreed with the auto-grader more closely than the two agreed with each other, so the residual error of the best-performing model is of the same order as ordinary disagreement between human graders. We also report a negative result: a declaration-level reference could be reconstructed for only five of the eight examinations, because the auto-grader merges missing declarations and wrong return values into single checks. Together these results indicate that agreement with a reference is an insufficient basis for choosing a local grading model, and that compliance, determinism, degeneracy, and the cost of failed generations must be measured alongside it.
1. Introduction
Large language models (LLMs) have become important tools in software engineering and programming education. They are now used for code generation, code completion, debugging, documentation, test generation, code validation, and learning support. In educational contexts, these models can help instructors prepare teaching materials, generate examples, explain programming concepts, and provide feedback to students. These directions are especially relevant in programming courses, where instructors must evaluate a large number of student solutions and provide feedback that is both correct and useful.
Automatic grading is commonly based on predefined test cases. This approach is fast, objective, and easy to apply to many submissions. A student program is compiled, executed, and compared with the expected output for a set of inputs. However, this strategy does not always capture all aspects of programming knowledge. A program may pass several tests while still using a poor design, weak code organization, or an implementation that does not follow the concepts required by the assignment. At the same time, a partially correct program may fail some tests, although it still shows that the student understood important parts of the problem.
This limitation is particularly important in object-oriented programming (OOP). In OOP, the quality of a solution depends not only on the final output, but also on the way the solution is structured. A correct solution should define suitable classes, protect internal data, use constructors and methods properly, and apply abstraction, inheritance, or polymorphism when required. These elements are not always visible through input and output testing alone. For this reason, the evaluation of OOP assignments requires both functional checking and a form of semantic analysis of the submitted code.
Recent studies suggest that LLMs can support programming assessment by analyzing code, identifying errors, generating feedback, and comparing student submissions with a given rubric [1,2]. Other works show that LLMs can also help generate test cases for student programs, which can complement classical autograding methods [3,4]. At the same time, a growing body of work on the more general LLM-as-a-judge paradigm documents systematic failure modes of models used as scorers, including verbosity and self-preference biases, sensitivity to prompt formulation, and inconsistency across repeated evaluations [5,6,7,8,9]. These findings are directly relevant for grading, because a grade produced by a biased or unstable judge can affect a student. The use of LLMs as graders for OOP assignments in particular is still not fully understood. Many existing studies focus on introductory programming or on languages such as Python and Java, while fewer works analyze C++ OOP solutions, where syntax, memory management, class design, and code structure may strongly influence the quality of a submission.
In this context, this paper investigates whether LLMs can assist the grading of C++ object-oriented programming assignments. We introduce a dataset composed of programming problem statements and 271 student solutions collected from OOP assignments and examinations. The reference grades are obtained through automatic tests designed with instructor contribution. This makes the reference assessment scalable, while also keeping it connected to the learning objectives of the course. The dataset is intended to support future research on automated grading, educational feedback, and model adaptation for programming education.
The study compares the reference evaluation with grades generated by four LLMs: gpt-oss:20b, qwen3.6:27b, phi4-mini, and qwq:32b. These models were selected because they represent different tradeoffs between model size, reasoning ability, and local deployment. Each model receives the problem statement, the grading breakdown, the compilation output, and an anonymized student solution, and is asked to work through the point-bearing requirements and return a single numerical grade on the course scale.
The evaluation considers both grading quality and practical deployment aspects. We compare model grades with the reference grades using numerical agreement metrics, such as mean absolute error, root mean squared error, correlation, and tolerance accuracy. We also examine, for the models whose justifications the inference framework retains, the types of errors each model detects and the cases in which model grades differ from the reference assessment. In addition, we measure latency, memory usage, token usage, and energy consumption, because these factors influence whether local LLM-based grading can be used in real educational settings.
The research is guided by four main questions. First, we analyze how close the LLM-generated grades are to the reference grades obtained through automatic tests designed with instructor contribution. Second, we examine whether the evaluated models differ systematically in reliability when assessing OOP solutions, and to what extent those differences can be attributed to individual models rather than to a model class. Third, we study whether locally deployable models can offer a useful balance between grading quality, inference time, and energy consumption. Fourth, we ask what a grading deployment must retain in order for a grade to be inspectable at all, and what reaches the student when the material supplied to the model is itself defective.
The main contributions of this paper are the following: (i) we introduce a dataset of C++ OOP problem statements and 271 student solutions, (ii) we propose an evaluation protocol that reports output-format compliance, prediction variance and reproducibility alongside grading agreement, (iii) we compare classical test-based grading with LLM-based grading and validate the reference grades against independent instructor grading on a stratified subset, (iv) we show that two of the four models discard their own justification under default tooling, and that a defective rubric propagates into the retained justifications at rates that differ sharply between models, and (v) we evaluate the practical cost of local inference through latency, memory, token usage, and energy measurements.
The remainder of this paper is organized as follows. Section 2 reviews related work on automated programming assessment, LLM-based grading, LLM-as-a-judge reliability, and semantic code evaluation. Section 3 describes the dataset, the reference assessment, the human validation procedure, the selected models, the grading protocol, and the evaluation metrics. Section 4 presents the experimental setup and the collected efficiency measurements. Section 5 reports the quantitative and qualitative results. Section 6 discusses the implications, limitations, and practical use of LLM-assisted grading. Finally, Section 7 concludes the paper and presents future research directions.
2. Related Work
Automated assessment has been used for many years in programming education. Most classical systems evaluate student submissions by compiling the code, running it on predefined inputs, and comparing the generated output with the expected output. This strategy is useful because it is fast, objective, and scalable. It also allows students to receive feedback soon after submission. However, the quality of this evaluation depends strongly on the quality and diversity of the test cases. If the test suite is incomplete, some incorrect solutions may receive high grades. If the test suite is too narrow, valid alternative solutions may be penalized. These limitations are especially important in assignments where the goal is not only to produce the correct output but also to apply a specific programming concept.
Recent studies have investigated the use of LLMs for automated grading in programming education. Bernik et al. compared several LLMs for student assignment grading and analyzed accuracy, efficiency, and feedback quality [1]. Jukiewicz performed a systematic comparison of LLMs for automated assignment assessment and showed that model architecture and vendor can strongly influence grading behavior [2]. These studies indicate that LLM-based grading can support instructors, but they also show that model choice, prompt design, and human oversight remain important. Abbas and Atwell also studied LLM-based feedback for student assessment and highlighted the potential of open models to generate useful comments for programming related tasks [10].
The grading task addressed in this paper is an instance of the more general LLM-as-a-judge paradigm, in which a model assigns a score to a text or a program according to a rubric. This paradigm has known failure modes that are directly relevant to educational assessment. Zheng et al. showed that strong models can approach human levels of agreement when used as judges, but also identified position bias, verbosity bias, and self-enhancement bias [5]. Wang et al. demonstrated that judge scores can change when the presentation of the evaluated content changes, which indicates that the evaluation is not invariant to superficial factors [6]. Stureborg et al. reported that LLM evaluators are inconsistent across repeated runs and exhibit systematic score distribution biases, including a preference for a small number of score values [7]. Wataoka et al. analyzed self-preference bias, showing that judges tend to reward text that they would have produced themselves [8]. A recent survey by Gu et al. organizes these effects and the proposed mitigations, which include rubric decomposition, reference-guided grading, repeated sampling, and calibration against human ratings [9]. Three consequences follow for the present study and motivate design decisions described in Section 3: the rubric is decomposed into individually scored requirements, the grading is anchored on external ground truth for compilation, and Section 5.8 examines what of the model’s rationale is retained at all since a rationale that is discarded can neither be checked against the code nor shown to a student.
Another important direction is the use of LLMs for test case generation. Kumar and Lan proposed a student code guided approach for generating test cases in computer science education [3]. Their work is relevant because it shows that test cases for education should not only check software correctness, but should also measure student understanding. Alkafaween et al. studied LLM-generated test suites for introductory programming and compared them with instructor created tests [4]. These works suggest that LLMs can support automatic grading by helping instructors create richer tests. However, test generation alone does not fully solve the evaluation problem in object-oriented programming, because many design errors are not visible through input and output behavior.
The use of LLMs in code generation and software engineering has also been widely studied. Jabrw and Sarhan reviewed the use of LLMs for code generation and discussed evaluation metrics, benchmarks, prompt engineering, and security concerns [11]. Macedo et al. showed that output format can bias the evaluation of LLMs for code translation, because model outputs may contain code mixed with explanations or formatting elements [12]. This observation is important for automated grading, where the output must follow a strict schema and where small formatting differences may affect the evaluation pipeline. In our study, this issue is addressed by a fixed terminal output contract, described in Section 3.5, in which the grade must appear on the last line of the response in a fixed key–value form.
Object-oriented programming introduces additional assessment challenges. In OOP assignments, the correctness of a solution depends on class design, encapsulation, constructors, methods, inheritance, polymorphism, and the way responsibilities are distributed across objects. Several recent works have explored LLMs for modeling tasks that are closely related to OOP. Garaccione et al. compared different LLMs for the generation of UML class diagrams [13]. Calamo et al. analyzed the suitability of LLMs for generating UML class diagrams as conceptual models [14]. Lu et al. proposed an interactive tool for clarifying and generating UML models with LLM support [15]. These studies are relevant because UML class diagrams and OOP code share common structural concepts, such as classes, attributes, methods, and relationships. They also show that LLMs can reason about software structure, although the generated results still require validation.
LLMs have also been explored for formal specifications and program analysis. Su et al. proposed NL2ACSL, an approach for translating natural language into ANSI C Specification Language with LLM support [16]. This direction is important because it connects natural language requirements with formal properties of code. Other studies combine LLMs with program analysis for software repair and vulnerability detection. Li et al. introduced a hybrid program repair approach that combines LLM-generated patches with program analysis [17]. Fakih et al. proposed an iterative LLM-based pipeline for vulnerability repair [18]. Gnieciak and Szandala compared LLMs with static code analysis tools for vulnerability detection and recommended hybrid workflows because LLMs can reason over larger contexts, while deterministic tools remain important for high assurance verification [19]. These findings support the idea that LLM-based grading should not replace classical evaluation but should complement it.
Privacy and deployment constraints are also relevant in educational settings. Student submissions may contain personal information, metadata, or code that should not be sent to external services without institutional approval. Chuang et al. discussed privacy risks related to LLM-based data processing and showed the importance of balancing data utility and privacy protection [20]. For programming education, this motivates local inference and anonymization. Local deployment may reduce privacy risks, but it introduces practical constraints related to memory, latency, token usage, and energy consumption.
The models selected in this study reflect these practical constraints. gpt-oss:20b is an open-weight model designed for local and efficient inference [21]. qwen3.6:27b is a dense 27B open-weight model with an optional thinking mode [22]. qwq:32b is included as a reasoning-oriented model from the Qwen family [23]. phi4-mini is included as a small language model that may be suitable for lightweight local workflows [24]. Exact checkpoints and quantizations are reported in Section 3. By comparing these models, this study evaluates not only grading quality, but also the cost of using LLMs in realistic educational environments.
Overall, the existing literature shows that LLMs can support programming education through grading, feedback generation, test generation, code translation, UML modeling, and program analysis. At the same time, the literature also identifies important limitations, including grading variability, sensitivity to prompts, hallucinated feedback, privacy risks, limited benchmarks, and incomplete semantic understanding. This paper contributes to this research area by focusing on C++ object-oriented programming assignments, by introducing a dataset of 271 student solutions, and by comparing classical test-based grading with LLM-based grading under practical local inference constraints.
3. Materials and Methods
3.1. Dataset Construction
The dataset was constructed from object-oriented programming assignments and examination problems in C++, collected from the object-oriented programming course taken by first-year students in their second semester at the Faculty of Electronics, Telecommunications and Information Technology of the National University of Science and Technology Politehnica Bucharest. The submissions originate from two student cohorts of that academic year, 271 students in total, each of whom sat exactly one of the eight examination sessions. The corpus therefore contains one submission per student, and the submissions are independent. The selected problems cover core OOP concepts, including class definition, constructors, destructors, member functions, encapsulation, object interaction, inheritance, polymorphism, operator overloading, and the correct use of the C++ standard library. Each dataset entry is associated with the information required for automated grading and model evaluation as summarized in Table 1.
Table 1.
Dataset structure.
The dataset was designed to support research on automated grading, educational feedback, and semantic code assessment. In contrast to datasets focused mainly on functional correctness, this dataset includes programming tasks where code structure and design decisions are also relevant. For example, a submission may produce the expected output while failing to use the required classes, exposing internal data inappropriately, or not respecting the intended object-oriented design. This makes the dataset suitable for comparing classical test-based grading with LLM-based grading methods.
Table 2 reports the descriptive statistics of the dataset, including the number of distinct problems, the number of submissions per problem, the distribution of submissions over OOP concepts, and the distribution of reference grades. These statistics are necessary for the interpretation of the agreement metrics reported in Section 5.2, because a narrow or strongly skewed grade distribution can inflate correlation coefficients and tolerance accuracy. The reference grades span the full scale with a median of 13.00 of 30 and a mean of 11.87, and are not concentrated at either end: 12.96% of submissions score zero, almost all of them non-compiling, and 1.85% score full marks. The distribution is shown in Figure 1, and it is therefore not a distribution that would inflate the reported agreement. The course pass threshold is not recorded in the dataset, so no pass rate is reported.
Table 2.
Descriptive statistics of the dataset.
Figure 1.
Distribution of the auto-grader reference grades over the 270 submissions that carry one, on the 30-point scale.
To protect student privacy, all identifying information was removed during dataset preparation. Comments, file names, and metadata were reviewed to ensure that no student-identifying information is included. Ethical review was waived for this study, on the basis that it uses only coursework artifacts that were fully anonymized before analysis, involves no collection of personal data, and involves no interaction with human subjects. The anonymized dataset and the complete evaluation results will be deposited in a public repository upon acceptance; see the Data Availability Statement.
3.2. Reference Assessment
The reference grade for each submission is the total assigned by the university auto-grader, an automated test harness used for the examinations themselves. The harness compiles the submission, runs a set of numbered functional tests, and additionally applies named declaration-level checks that probe the class and method structure. The maximum is 30 points per problem. Where a submission fails to compile, the harness assigns 0; this occurred for 29 submissions. The same rule is stated to the models in the prompt.
The reference grades were verified against an independent record. Each submission carries an execution log that reports the harness total separately from the grade file; the two agree for 270 of 270 submissions. A further check attempted to reconstruct the total additively from the logged per-check deductions. This reconstruction succeeds for 232 submissions; of the 38 remaining, 28 are explained by tests that fail without emitting a comment block, and 10 could not be explained and are reported as such. No reference grade was altered, and none of the analysis depends on the reconstruction: the harness total is used as given.
A single reference grade is therefore available per submission, covering both functional behavior and declared structure. An earlier version of this study elicited two grades from each model, one restricted to declared structure and one covering the complete solution, and compared both against this single total. That design is not sound, because a structure-only prediction and a behavior-inclusive reference measure different constructs. Section 5.11 reports our attempt to reconstruct a genuine declaration-level reference from the harness output and the reasons it was abandoned. The evaluation reported here elicits and scores one grade per submission.
Some aspects of OOP design remain difficult to evaluate through automatic tests. A solution may pass the test suite while still using global variables, exposing internal state, avoiding the required abstraction, or implementing the task in a mostly procedural way. This limitation motivates both the LLM-based evaluation protocol used in this study and the human validation described next.
3.3. Human Expert Validation of the Reference Grades
Because the reference grades are produced by automatic tests, agreement with them is not by itself a measure of grading quality: a model may correctly identify an OOP problem that the tests do not capture and still be counted as deviating from the reference. To bound this effect, a stratified subset of 25 submissions was graded independently by two instructors, using the same task-specific breakdown that is supplied to the models. The subset was sampled to cover the full range of reference grades and all problem types, and it includes by construction the submissions on which the models and the automatic tests disagree most strongly.
Three agreement values are reported for this subset: human–human agreement, which establishes the ceiling any automated grader can be expected to reach; human–automatic agreement, which quantifies how well the reference grades approximate expert judgement; and human–model agreement, which measures the models against expert grading rather than against the tests. Given the subset size, agreement is reported as mean absolute error, root mean squared error, Pearson correlation and tolerance accuracy only; the smaller sample does not support the full metric set of Section 3.6. The instructors graded blind: their packets contained the problem statement, the grading breakdown where one exists, and the student’s source file, and no compilation output, test result, reference grade or model output. Results are given in Section 5.7.
3.4. Model Selection and Identification
Four models were selected in order to compare different reasoning and deployment profiles. The selection includes a small language model, a medium open model, a hybrid thinking model, and a reasoning-oriented model. This allows the study to evaluate both grading quality and practical feasibility for local or institutional deployment. Table 3 summarizes the role of each model in the study, and Table 4 gives the exact checkpoint, tag, and quantization used so that the comparison can be reproduced.
Table 3.
Models included in the evaluation.
Table 4.
Exact model identification.
Two clarifications are required for reproducibility. First, qwen3.6:27b is a dense 27B model from the Qwen3.6 family [22], and not a member of the earlier Qwen3 series; the two are not interchangeable and the corresponding model card is cited accordingly. Second, phi4-mini exists in an instruction-tuned and in a reasoning-tuned variant, which behave differently on rubric-following tasks. The tag used here is floating and pins no build, so the variant was identified from the header of the model file itself, which declares an instruction fine-tune and names the instruct repository in its license field. The evaluated model is therefore the instruction-tuned variant, which is consistent with its emitting no separate reasoning output. Where community builds or local quantizations were used, this is stated explicitly in the same table since quantization affects both grading behavior and the efficiency measurements reported in Section 4.
3.5. LLM Grading Protocol
Each model receives the same information for every submission: the problem statement, the anonymized student solution, the compilation output produced by the reference pipeline, and the available grading breakdown. The model is instructed to work through the point-bearing requirements one at a time and to produce a single grade on the 30-point scale of the grading breakdown. The same prompt, the same endpoint, and the same decoding parameters are used for all models.
The compilation status is supplied to the model as external ground truth rather than being inferred from the source code, because models frequently assert that a program fails to compile on the basis of superficial reading; this is an instance of the unsupported-claim failure mode discussed in Section 2.
The prompt template is shown in Listing 1, verbatim as sent. The template is unchanged across every run reported here.
| Listing 1. Grading prompt template used in the controlled evaluation. |
| You are an expert C++ programming instructor grading a student’s solution to a programming~ |
| assignment. |
| ## Assignment~Specification |
| {problem_statement} |
| ## Student’s Source~Code |
| ‘‘‘cpp |
| {source_code} |
| ‘‘‘ |
| ## Compilation~Output |
| ‘‘‘ |
| {compilation_output} |
| ‘‘‘ |
| ## Grading~Breakdown |
| {grading_breakdown} |
| ## Task |
| Award a single grade out of 30 points, reflecting a complete review of the submission: |
| - **Class structure** - field names, types and access modifiers; constructor parameter |
| types and order; method signatures (name, return type, const-ness, virtual/pure- |
| virtual); inheritance relationships. |
| - **Implementation correctness of every method body**, judged against the behavior |
| described in the specification above. |
| - **Correctness of the main function** - input parsing and each of the required~outputs. |
| Go through every point-bearing requirement in the specification one by one: |
| 1. State the requirement and its point value. |
| 2. Assess fulfillment (fully / partially / not at all), explaining briefly. |
| 3. Assign the points~earned. |
| **Important:** The compilation output above is the ground truth for whether the code |
| compiles. If~it is empty or contains no errors, the~code compiled successfully - do |
| NOT try to independently assess compilability by reading the source. Only conclude the |
| code does not compile if the compilation output explicitly contains errors. If~the |
| code does not compile, the~grade is~0. |
| After your analysis, your response MUST end with exactly this line - no other text after it |
| : |
| GRADE: <number> |
| Rules for <number>: always a plain decimal (e.g. 15 or 7.5). Never a fraction (not 15/30), |
| never text (not "N/A", not "Full points"). If~a student scores zero, write 0. |
3.5.1. Output Contract and Parsing
The output contract is not a JSON schema. Each model produces a free-form, requirement-by-requirement analysis and must terminate its response with a single line of the form GRADE: <number>. A rigid serialization format degrades rubric adherence in models that emit extended reasoning, whereas a terminal key–value line can still be parsed deterministically.
Responses are parsed by one policy for all models. Every occurrence of the grade label is located, and for each occurrence all value readings are attempted—same line, bracketed, next line, and alias forms—before any is accepted. The last occurrence yielding a structured reading wins since the contract requires the grade to appear at the end. A number preceded by scale wording such as “out of a possible 30” is rejected as a denominator rather than a grade; failing to make this distinction was the principal defect of an earlier version of this pipeline. Values outside are recorded as failures and never clamped.
Each parsed value carries a confidence level: high for a structured reading at the final label mention, medium for a structured reading at an earlier mention, and low for a loose reading. Medium- and low-confidence values are retained in the primary analysis, and a sensitivity analysis restricted to high-confidence values is reported alongside it.
A response from which no grade can be extracted is not treated as missing data. It is a failure of the model to complete the task, is counted, and is reported as a compliance outcome in Section 5.1. Each record additionally stores the completion reason returned by the inference framework, which distinguishes a response truncated at the generation limit from one that is malformed.
3.5.2. Repeated Evaluation and Stability
Each submission was graded once by each model. To measure stability independently of that single draw, a stratified subset of 30 submissions was graded five times by each model under the identical configuration. For this subset we report, per model, the proportion of submissions whose five grades are identical, the maximum spread, and the mean spread.
3.6. Evaluation Metrics
Let be the reference grade for submission i and be the grade assigned by a model, both on the 30-point scale. The mean absolute error is
the root mean squared error is
and the mean signed error, which indicates whether a model is systematically more lenient () or stricter () than the reference, is
The metrics are summarized in Table 5. Pearson and Spearman correlations are reported, together with tolerance accuracy at and points. These bands correspond to 3.3% and 10% of the maximum grade; a wider band on a 30-point scale would overstate agreement. Grades are also discretized into the four categories used by the course, and quadratic weighted Cohen’s kappa is reported for the resulting confusion matrix.
Table 5.
Quantitative evaluation metrics.
Because parse failures are an outcome rather than missing data, every agreement metric is reported together with the number of submissions it is computed over and with the format-compliance rate of the same model so that a model is not credited for performing well on the subset of submissions it managed to answer.
Aggregate metrics are reported with 95% confidence intervals obtained by bias-corrected and accelerated bootstrap resampling over submissions, with 10,000 resamples. Because the same submissions are graded by all models, differences between models are tested pairwise with the Wilcoxon signed-rank test on the per-submission absolute errors, with Holm correction for multiple comparisons; effect sizes are reported as the rank-biserial correlation. For models that are not deterministic across repeated runs, the repeat spread is reported alongside the point estimate, since a bootstrap interval over submissions does not capture variability arising from the model answering the same submission differently.
4. Experimental Setup
4.1. Evaluation Workflow
The workflow starts from the reference grades produced by the university auto-grader, which are used as given and cross-checked as described in Section 3.2. Each anonymized submission is then sent to each of the four models using the same prompt template, the same endpoint, and the same decoding parameters. Each model returns a requirement-by-requirement analysis terminated by the grade line defined in Section 3.5. The grade is extracted by the single parsing policy described there, and responses from which no grade can be extracted are counted as compliance failures rather than discarded.
The complete workflow has five stages. First, the dataset is prepared and anonymized. Second, the reference grades are extracted and verified. Third, all four models grade all submissions. Fourth, a stratified subset of 30 submissions is graded five times by each model to measure stability. Fifth, the results are analyzed for compliance, agreement, stability, and resource consumption.
4.2. Inference Configuration
All four models were served by a single local Ollama daemon through its native chat endpoint; no proxy was interposed. Decoding was fixed and identical across models; the full configuration is given in Table 6 and the hardware platform in Table 7. Between models, the resident model was explicitly unloaded and the GPUs verified clear, so that memory measurements are attributable to the model under test. Idle power baselines were captured before and after each model’s batch. Each record stores the completion reason, the number of attempts, and the number of telemetry samples behind its averaged figures.
Table 6.
Inference configuration.
Table 7.
Hardware platform used for local inference.
Two consequences of fixing the temperature at 0 should be stated rather than left implicit. Greedy decoding removes sampling as a source of variation, which is what makes the stability measurement in Section 5.4 interpretable, but it also makes repetition loops more likely. Several responses in this configuration never terminate, and the compliance figures in Section 5.1 are therefore partly a property of this decoding choice rather than of the models alone.
4.3. Latency and Energy Measurement
For each model we measure inference time per submission, generated tokens per second, memory footprint, and energy consumption. Power is sampled on the serving host during generation, an idle baseline measured on the same platform is subtracted, and energy is integrated per submission and then averaged over submissions. The timing window used for the energy calculation covers the successful generation only; where a request required more than one attempt, the additional attempts are accounted separately and reported as retry overhead. Energy in joules is
where is the mean sampled power during the generation, the idle baseline, and t the generation time. The same quantity in watt-hours is .
Two limitations apply. The measurement is at board level rather than per process, so it is an upper bound on the energy attributable to the model if any other workload shares the host, and the host is not exclusively reserved. The number of samples behind each average is recorded per submission, because short generations rest on few samples. Results are reported in Section 5.9.
4.4. Token Usage
Token usage is recorded as an additional efficiency metric, because grading cost depends on the number of tokens processed and generated as well as on time and power. For each model and submission, input, output, and total token counts are taken from the inference framework response metadata. Token counts are model specific, since each model uses its own tokenizer; the underlying prompt text is identical across models.
Output throughput is , and energy is normalized per generated token as and per total token as . These normalizations allow comparison of models with different output lengths and reasoning styles. Results are reported in Section 5.9.
5. Results
This section reports the results of the controlled evaluation. It begins with output-format compliance, because compliance bounds every subsequent metric: a model that returns no grade cannot be scored on the accuracy of a grade. It then reports agreement with the reference grades, degenerate prediction behavior, reproducibility across repeated runs, grading bias, results by concept, resource consumption, and the attempt to reconstruct a declaration-level reference.
Grades are on the 30-point course scale throughout. Of the 271 submissions, 270 carry a reference grade; one submission has no auto-grader output and is therefore excluded from every agreement metric while still counting in every compliance figure, since the models were given it and answered it.
5.1. Output-Format Compliance
Table 8 and Figure 2 report, for each model, the proportion of the 271 submissions for which a well-formed grade could be extracted under the fixed output contract. The differences are large and they do not track model size.
Table 8.
Output-format compliance in the controlled evaluation, out of 271 submissions.
Figure 2.
Submissions graded and not graded by each model, out of 271, with the failure mode distinguished. Percentages are compliance rates.
Every failure except phi4-mini’s three is a non-terminating generation rather than a malformed grade: the response reached the token limit without ever emitting the required line. This diagnosis is possible only because the completion reason is stored per record. Reaching the limit is not itself a failure—17 responses hit it after already emitting their grade, and are counted as compliant.
The failures of qwq:32b are not a budget artifact. When the 81 truncated responses were regenerated with the limit doubled to 16,384 tokens, 51 completed and 30 again ran to the limit without emitting a grade. Non-termination is a property of the model under this prompt and this decoding configuration.
phi4-mini’s three failures are of a different kind. In each case the model invented a 90-point scale and reported a grade of 45. The parsing policy refuses an out-of-range value rather than clamping it. One of the three is worth stating precisely: the model wrote a grade of 45 and then added that the total is capped at 30, so the final grade is 30. The trailing sentence offers no structured reading, so the policy falls back to the earlier out-of-range value and records a failure, where a human reader would take 30. This is the cost of a policy that does not adjudicate between a model’s two contradictory answers, and we report it rather than hand-correcting it.
Compliance under this configuration should be read together with compliance under each model’s own default decoding, measured on the earlier uncontrolled corpus and reported in Table 9. The comparison is indicative only: the prompt also changed between the two settings, from two grades to one, so the two columns differ in more than one respect.
Table 9.
Compliance under default sampling versus the pinned temperature-0 decoding. The two columns differ in decoding and in prompt, so the difference is not attributable to decoding alone.
Greedy decoding removes sampling as a source of variation, which is what makes the reproducibility measurement in Section 5.4 interpretable, but it also makes repetition loops more likely. All 47 non-terminating generations in the controlled run occurred under temperature 0. Part of the failure rate reported here is therefore attributable to our decoding choice rather than to the models alone.
5.2. Agreement with Reference Grades
Table 10 reports agreement between the model grades and the auto-grader reference, computed over the submissions each model completed.
Table 10.
Agreement with the reference grades on the 30-point scale. Brackets are 95% BCa bootstrap confidence intervals over submissions, 10,000 resamples. The and tolerance bands correspond to 3.3% and 10.0% of the maximum grade.
qwen3.6:27b agrees most closely with the reference on every measure. phi4-mini shows almost no linear association, and its rank correlation of 0.058 and kappa of 0.034 indicate that its grades carry essentially no information about the reference ordering. The reasons for this are addressed in Section 5.3.
Pairwise Wilcoxon signed-rank tests on per-submission absolute errors, computed on the submissions each pair of models both completed and corrected with the Holm procedure across all six pairs, find five of the six differences significant at a family-wise level of 0.05. The exception is gpt-oss:20b against qwq:32b: on the 236 submissions both completed, their mean absolute errors are 5.266 and 4.582, with an uncorrected p of 0.051 and a rank-biserial effect size of . That difference does not reach significance either before or after correction, and these two models are therefore not distinguishable in accuracy on this corpus. Every other pairwise difference is significant with after correction.
The values of n differ across models by up to 27 submissions, and the differences are not random: they are the submissions on which a model failed to terminate. qwq:32b is scored on the 89% of submissions it answered, and its position in Table 10 must be read together with its compliance rate.
A sensitivity analysis restricted to high-confidence parses changes only phi4-mini, which loses seven records and moves from an MAE of 10.903 to 10.799. No parsed value in the controlled run rests on a loose reading, so the primary and sensitivity analyses coincide for the other three models.
Figure 3 compares the error metrics across models.
Figure 3.
Mean absolute error, with 95% BCa bootstrap confidence intervals, and root mean squared error of each model against the reference grades.
5.3. Degenerate Predictions
Aggregate agreement statistics assume that a model is producing a varying prediction. For one model in this study it is not. phi4-mini awarded an identical grade of zero to every submission in three of the eight examinations, as reported in Table 11. That is 109 of the 267 submissions it scored, or 41%.
Table 11.
Examinations on which a model produced a constant prediction.
Where the prediction series has zero variance, correlation is undefined rather than zero, and the per-examination correlations for these three groups are reported as undefined. The corpus-wide figures for phi4-mini in Table 10—a Pearson correlation of 0.171 and a mean signed error of points—should be read in this light: on 41% of the submissions it scored, the model is not grading but returning zero, and its remaining error is carried by the other 59%. No other model produces a constant prediction on any examination.
This behavior would be invisible in a study reporting only aggregate error metrics, and it is not the same failure as low accuracy. A model with an MAE of 10.9 that grades badly is usable with human oversight; a model that returns zero for every submission in an examination is not usable at all for that examination, and an instructor could only discover this by inspecting the distribution of its output.
5.4. Reproducibility Across Repeated Runs
Reproducibility is reported at two levels. Table 12 first asks whether a model returns the same grade when the evaluation is repeated with nothing changed at all: the same 30 submissions, in the same order, five times, at temperature 0 with a fixed seed. Three of the four models are exactly reproducible in that sense. gpt-oss:20b is not, as Figure 4 shows. Section Reproducibility Across a Changed Batch Composition then asks the weaker and more practically relevant question of whether a grade survives being computed alongside a different set of submissions, and finds that none of the four models does.
Table 12.
Grade variability across five repeated runs on 30 submissions, at temperature 0 with a fixed seed. The identical count is over submissions for which every repeat produced a grade. The upper block uses the daemon’s configured two request slots; the lower block repeats the measurement for the one model that varied, with a single slot.
Figure 4.
Grades assigned by gpt-oss:20b to the same 30 submissions across five identical repeats at temperature 0 with a fixed seed, under two concurrent request slots (left) and one (right). Each column is one submission; a vertical bar spans the grades it received. Blue points mark submissions on which all five repeats returned the same grade, red points those on which the grade varied. Crosses mark submissions that produced no grade in any repeat.
The denominators differ because a submission on which a model never produced a grade in any repeat is excluded rather than counted as reproducible: qwq:32b failed on 13 of the 30 in every repeat, and qwen3.6:27b on 3. Their reproducibility is therefore the reproducibility of the grades they did produce, and it is exact.
The instability of gpt-oss:20b is not a parsing artifact. Its completion-token counts differ across repeats on 27 of the 30 submissions, while every other model produces identical token counts on all 30. The pattern is bimodal rather than noisy: for a given submission the model either stops early and awards zero, or produces a full analysis and awards a substantive grade. One submission scored 0, 0, 21, 21 and 21 across the five runs, with completion lengths of 528, 528, 1551, 1551 and 1551 tokens. Eight of the twenty-five evaluable submissions move by more than 3 points and five by more than 5. Four submissions produce a grade in some repeats and none in others, so for this model even compliance is not reproducible.
The cause is concurrent batching in the serving layer. Repeating the measurement with the daemon restricted to a single request slot, and changing nothing else, makes the model exactly reproducible: 27 of 27 evaluable submissions identical across five repeats, zero spread, and identical completion-token counts on all 30. The correspondence at submission level is sharper than the aggregate. Under two slots the 17 varying submissions do not scatter: each falls into one of two internally consistent outcome blocks, the first comprising repeats 1–2 and the second repeats 3–5, and the single-slot condition reproduces the second block exactly—17 of 17 outcomes and 30 of 30 token counts—never the first and never a third value. Mean generation time separates the same way, at 19.4 and 19.2 s for the first block against 20.5 s for the second and for the single-slot condition.
Reproducibility Across a Changed Batch Composition
The repeats above hold the batch composition fixed: the same 30 submissions are submitted in the same order five times. That measures whether a model returns the same grade when nothing at all changes. A separate question is whether it returns the same grade when the same submission is graded as part of a different set, which is what happens whenever a grading run is repeated over a different cohort, resumed after an interruption, or split across sessions.
To answer it, a 40-submission sample was graded again under four conditions and compared against the primary sweep, in which those submissions had appeared among all 271. Conditions A1 and A2 are two back-to-back runs of the current client with two request slots; condition B uses the client that produced the primary sweep, which stores only the message content and does not capture reasoning, holding the batch composition of A; and condition C restricts the daemon to one request slot. Table 13 reports the outcome-for-outcome agreement, counting a failure to produce a grade as an outcome.
Table 13.
Agreement with the primary sweep when the same submissions are graded as part of a different set, and agreement between runs that share a batch composition. A1 and A2 are back-to-back runs of the current client; B is the client used for the primary sweep.
Three results follow.
First, no model is reproducible across a changed batch composition. Agreement with the primary sweep ranges from 13 to 33 of 40, and the three models that are exactly reproducible under a fixed composition are not exempt: qwen3.6:27b returns a different outcome on 18 of 40 submissions and qwq:32b on 21. The differences are not confined to marginal adjustments—qwq:32b moves by up to 9 points and gpt-oss:20b by up to 24 on a 30-point scale. phi4-mini changes its outcome on only 7 submissions but by an average of 17.5 points when it does, which is the constant-zero behavior of Section 5.3 switching on or off.
Second, the cause is the batch composition and not our instrumentation. Condition B runs the client that produced the primary sweep, without the reasoning capture added afterwards, over the new composition. If capturing the reasoning field had altered the request, B would track the sweep and A would not. Instead B is identical to A on 40 of 40 for three of the four models, and differs from the sweep by exactly as much. The only remaining difference between these runs and the sweep is the set of submissions each was graded alongside. We note that comparing A1 with A2 alone would not have shown this since those two share both the client and the composition; condition B is what discriminates.
Third, gpt-oss:20b is a special case in which the two effects are superimposed. It disagrees with itself at a fixed composition—A1 against A2 is 17 of 40—so this design cannot separate its within-composition instability from the cross-composition effect. Consistently with the two-state behavior reported above, A2 and B agree on 40 of 40 while A1 differs from both.
The mechanism by which batch composition changes a grade is not identified here and we assert none. Whether restricting the daemon to a single concurrent request removes the effect for the other three models, as it does for the within-run instability of gpt-oss:20b, is a question this design does not answer and a natural next experiment: if it does, single-slot serving would be sufficient for reproducible grading in general, and if it does not, the effect is not attributable to batching inside the daemon alone.
The consequence for this study is that the per-submission grades reported in Section 5.2 are contingent on the composition of the sweep that produced them. The aggregate statistics are stable in a way the individual grades are not: the sample here is 40 submissions, and the models’ mean absolute differences against the sweep, 1.86 to 5.46 points, are of the same order as their mean absolute errors against the reference. For a deployment the consequence is sharper. Two students whose submissions are graded in different batches, or one student re-graded after a resumed run, can receive different marks with nothing in the pipeline recording that anything changed.
The single-slot condition of Table 12 was served by a second daemon instance of the same version on an alternate port, reading the same model store with a verified-identical digest and matching residency, context and device settings, because the system service could not be restarted on the shared host. It therefore differed from the primary condition in the owning user and in being freshly started rather than long-lived, in addition to the request-slot setting. We state this rather than treat the two conditions as differing in one variable only.
5.5. Grading Bias
The mean signed errors in Table 10 are negative for all four models, ranging from to points on a 30-point scale. Every evaluated model grades more strictly than the auto-grader, and the magnitude of the bias tracks overall agreement: qwen3.6:27b is closest to the reference and least biased, while phi4-mini under-grades by more than a quarter of the scale, an effect dominated by the degenerate examinations of Section 5.3.
The most plausible mechanism is structural rather than model-specific. The prompt asks for points where a requirement is demonstrably satisfied, whereas the harness awards points wherever a test passes; a model that cannot execute the code cannot demonstrate that a behavioral requirement is met, and withholds the points. If this is right, the bias is a property of static grading against a dynamic reference rather than of any model, and supplying test outcomes to the model rather than only the compilation status should reduce it. That is a testable prediction and a natural next experiment.
A second observation is consistent with the same account. Within each of the three models that reason at length, the number of generated tokens correlates positively with absolute error: Spearman for qwen3.6:27b, for qwq:32b, and for phi4-mini, all with . For gpt-oss:20b the linear correlation is absent () and the rank correlation weak (). Longer deliberation is associated with worse agreement, not better, which is what one would expect if extended reasoning is mostly spent on submissions whose correctness the model cannot resolve by inspection.
5.6. Results by Task Type and OOP Concept
Every examination in the corpus requires public single inheritance, virtual dispatch through a base-class pointer or reference, access specifiers with const-qualified getters, and constructor chaining, so those concepts do not distinguish groups. The examinations do differ in their remaining requirements, and Table 14 groups them into four disjoint families on that basis. Because every student sitting one examination faced the same requirements, a family is an aggregate over whole examinations rather than an independent sample, and two families contain a single examination each.
Table 14.
Agreement by problem family. Each family is a union of whole examinations; correlation is undefined where a model produced a constant prediction.
The ordering of the models is stable across families, as Figure 5 shows, but the absolute difficulty is not. Every model performs best on the family requiring operator overloading over an STL container and worst on the two families requiring an abstract hierarchy with copy semantics or stateful polymorphic interaction. The gap is large: qwen3.6:27b moves from an MAE of 1.125 to 5.510 between the easiest and hardest family, and gpt-oss:20b from 2.777 to 7.490. Aggregate figures therefore understate the variation an instructor would experience across assignment types.
Figure 5.
Mean absolute error of each model by problem family. The ordering of the models is stable; the difficulty of the families is not.
phi4-mini is negatively correlated with the reference on the operator-overloading family, which together with the degenerate examinations of Section 5.3 indicates that its aggregate correlation of 0.171 is not a weak signal but the average of groups in which there is no usable signal at all.
Four of the concept tags in this corpus—exception handling, manual memory release, an observable destructor side effect, and string-format validation—are required by exactly the same five examinations and are therefore collinear. Their effects cannot be separated here, and we report them as one combined requirement profile rather than as four independent concepts.
5.7. Validation Against Human Grading
Table 15 reports agreement on the 25-submission subset described in Section 3.3, graded independently and blind by two instructors of the course.
Table 15.
Agreement on the human-graded validation subset, submissions, on the 30-point scale. Model rows are computed against the mean of the two instructors’ grades; n is lower where a model produced no grade.
Two results follow, and the first is not the one we expected.
The auto-grader sits inside the range of expert judgement, not outside it. Each instructor agrees with the harness more closely than the two instructors agree with each other: mean absolute errors of 3.93 and 1.25 points against 4.84 between them. Averaging the two instructors brings agreement with the reference to 1.87 points, a twentieth of the scale. The reference used throughout this paper is therefore not a mechanical proxy standing at some distance from human grading; on this subset it is closer to each instructor than the instructors are to one another.
Expert graders disagree substantially with each other. Only 4 of the 25 submissions received the same grade from both instructors, 11 of 25 fell within 3 points, and 4 differed by more than 10, with a maximum disagreement of 16 points out of 30. The disagreement is also systematic rather than symmetric: instructor 1 is 4.52 points stricter on average than instructor 2, and their mean awarded grades are 12.20 and 16.72 against a reference mean of 15.93. Two qualified graders applying the same breakdown to the same code arrive at materially different marks.
This changes how the agreement figures in Table 10 should be read. qwen3.6:27b differs from the reference by 3.23 points on average, which is less than the 4.84 points separating the two instructors on this subset. We do not conclude from this that the model grades better than an instructor: the two quantities are measured against different things, the subset is small, and it was deliberately enriched with the submissions on which models and tests disagree most—8 of the 25—so human disagreement here is likely larger than it would be on a random sample. What the comparison does establish is that expecting a model to agree with a test-based reference more closely than two instructors agree with each other sets a bar that human graders themselves do not meet, and that the residual error of the best model is of the same order as ordinary inter-grader variation rather than distinctly worse than it.
The instructors graded blind, without the compilation output, the test results, or any model output. That the two arrive at such different distances from the harness—one within 1.25 points, the other 3.93 and systematically stricter—also indicates that agreement with an automatic reference is partly a property of the individual grader’s severity, which is a further reason to report the human ceiling alongside model agreement rather than model agreement alone.
The models rank as they do against the auto-grader, and against a harder comparator. Measured against the mean of the two instructors, the ordering of Table 10 is unchanged and the errors are of similar size: qwen3.6:27b at 2.97 points, qwq:32b at 5.35, gpt-oss:20b at 5.72 and phi4-mini at 12.70. All four mean signed errors are again negative, so the systematic strictness reported in Section 5.5 is not an artifact of grading against a test harness; the models grade below human markers as well.
Every model tracks the stricter instructor. Against instructor 1 the errors are 1.58, 3.83, 4.26 and 11.20 points; against instructor 2 they are 5.05, 7.54, 8.04 and 14.28. Since instructor 1 is the stricter of the two by 4.52 points on average, and all four models grade below both, this is the same effect seen from another angle rather than an independent finding. It does, however, make the comparator explicit: which human a model appears to agree with depends on that human’s severity as much as on the model.
The most closely agreeing model reaches an MAE of 1.58 points against instructor 1, well inside the 4.84 points separating the two instructors. On this subset the spread between the human graders, not the accuracy of the models, is the binding constraint on how well any automated grader can be shown to perform.
Two cautions apply. The subset is 25 submissions, deliberately enriched with cases where models and tests disagree, and the model rows rest on fewer: qwen3.6:27b produced no grade for 6 of the 25, so its favorable position is measured on 19 submissions, and its compliance on this subset is markedly worse than its 95.6% over the full corpus. All six drops, and the three for the other models, are generations that reached the token limit without emitting a grade.
5.8. Retention and Auditability of Model Justifications
The grades reported above are accompanied, for two of the four models, by a written assessment. For the other two they are not. gpt-oss:20b and qwq:32b emit their assessment as reasoning tokens rather than in the message content, and the inference framework returns only the content by default: the median stored response for those two models is 9 and 11 characters respectively, that is, the grade line alone. Their reasoning was generated and paid for—it is counted in the completion tokens and therefore in the energy figures of Section 5.9—but not retained. qwen3.6:27b and phi4-mini return their analysis in the message content, with median lengths of 3141 and 2567 characters.
This is not only a limitation of our instrumentation. A grader whose justification is discarded by default cannot be audited by an instructor either: the grade arrives without the reasoning that produced it, and recovering that reasoning requires re-running the model, which for a nondeterministic model does not reliably reproduce the original assessment. For a grade that affects a student, retention of the justification is a deployment requirement rather than a research convenience, and it is not the default behavior of the tooling.
Where the justification is retained, it can be checked against the input the model was given, and one such check was possible without annotation. One examination was supplied with a grading breakdown copied from a different problem, naming the wrong four classes while allocating exactly the right points (Section 5.10). phi4-mini reproduced the wrong class names in 20 of its 27 responses for that examination, grading robot code under headings naming a digital-library hierarchy, while qwen3.6:27b did so in 2 of 27. A defective rubric therefore propagates into the feedback a student would receive, and does so at very different rates for different models, even where it leaves the numerical grade unaffected. For the two models whose reasoning is not retained, whether the same contamination occurred cannot be determined at all, which is the practical cost of the retention gap described above.
5.9. Efficiency
Table 16 reports time, memory, power, and idle-corrected energy per submission, and Table 17 reports token usage. The cost ordering spans two orders of magnitude: phi4-mini consumes 1.35 kJ per submission and qwq:32b 95.54 kJ, a factor of 71.
Table 16.
Efficiency in the controlled evaluation, over all 271 submissions attempted per model. Energy is idle-corrected against a baseline measured with the GPUs clear. No request required a second attempt, so the retry overhead is exactly zero throughout.
Table 17.
Token usage in the controlled evaluation. Token counts are model-specific, since each model uses its own tokenizer; only within-row derivations are comparable across rows.
The last column is the result with the clearest practical consequence. qwq:32b spent 7.73 MJ, 29.9% of its total energy, on the 30 submissions for which it never produced a grade. Nearly a third of the cost of running that model bought nothing: no grade, no partial feedback, and no advance signal about which submissions would fail. For phi4-mini the equivalent figure is 0.9%. Across all four models, 8.53 MJ of the 38.25 MJ consumed by the evaluation produced no grade, and qwq:32b accounts for 7.73 MJ of that.
Figure 6 places accuracy against cost. Peak memory is the maximum over the request window summed across the two GPUs. qwq:32b and qwen3.6:27b are distributed over both devices; gpt-oss:20b and phi4-mini occupy one, with the second device contributing only its resident baseline.
Figure 6.
Grading accuracy against energy cost. Marker area is proportional to the share of each model’s energy spent on submissions that produced no grade.
Two measurement limitations apply. The power sampler polls every 200 ms, so requests shorter than about one second yield fewer than five readings: 99 of phi4-mini’s 271 records and 9 of gpt-oss:20b’s fall in that regime, and phi4-mini’s mean power should be read with that coarseness in mind. Its total energy is less affected, because the short records contribute little to it. The measurement is also at board level rather than per process, so it is an upper bound if any other workload shares the host.
Output length differs by nearly an order of magnitude across models and drives the energy ordering. phi4-mini’s output is strongly right-skewed—a median of 190 tokens against a mean of 733—so its typical response is much shorter than the mean suggests. Energy per generated token varies by a factor of eight across models, so neither time nor tokens alone predicts cost.
5.10. A Rubric Defect and What It Did Not Show
One examination in the corpus was supplied with a grading breakdown copied verbatim from a different examination sat in the same session. The copied file allocates points in exactly the structure the affected problem requires—six points to the base class, three to each of three derived classes, and one through five to the five behavioral requirements—but names the classes of the other problem. Six further examinations were supplied with no explicit breakdown at all and fell back to a generic statement of the 30-point maximum.
The defect is real and it propagates into model output: phi4-mini named the wrong classes in 20 of its 27 responses for that examination. Its effect on the grades, however, is not detectable. The affected examination ranks fourth or fifth of eight by mean absolute error for every model, its error is lower than the pooled error of the other seven for all four models, and a Mann–Whitney test on per-submission absolute errors is non-significant for each (, , , ). The strongest available control is the other examination sat in the same session, for which the same rubric text is correct: the two differ by at most 1.26 MAE points for any model.
We report both facts. The wrong rubric reached the models and shaped the feedback they produced, and no effect on grading accuracy large enough to separate that examination from the rest of the corpus can be demonstrated. The reason is visible in the file itself: only the class names are wrong, while the point allocation is right, and the models appear to have graded against the point allocation and the problem statement rather than against the names.
5.11. Recoverability of a Declaration-Level Reference
A recurring difficulty in assessing OOP assignments is that declared structure and implemented behavior are graded together. We therefore attempted to reconstruct a declaration-level reference from the auto-grader’s per-check output, which records each failed check with its point deduction and a description of the fault.
The attempt succeeded for five of the eight examinations and failed for three. In the three failing examinations, the harness reports a missing declaration and an incorrect return value as alternative causes of a single failed check, so the deduction cannot be attributed to either. These three examinations account for 108 of the 271 submissions, or 40% of the corpus. Table 18 reports the coverage.
Table 18.
Recoverability of a declaration-level reference, per examination.
Two further obstacles apply even where reconstruction succeeds. The recovered declaration-level totals range from 9 to 15 points and differ per examination, so they cannot be pooled without a normalization that would rest on incomplete check rosters: only checks that at least one student failed are visible, so the totals are lower bounds. And a declaration-only reference does not correspond to the grade the models were asked to produce, which covers the complete solution.
We therefore report this as a negative result rather than as a second evaluation tier. It has a constructive implication for assessment infrastructure: a grading harness that recorded declaration checks and behavioral checks as separate components, rather than merging them into single pass/fail items, would make a two-tier evaluation of automated graders possible at no additional cost to the instructor.
6. Discussion
The results support a narrower claim than the one usually made about LLM-assisted grading, and a more practical one. Agreement with a reference grade is not by itself a sufficient basis for choosing a model, because three of the four models evaluated here fail on properties that agreement does not measure at all.
Compliance bounds usefulness. qwq:32b produces the second-best agreement in Table 10, but only across the 89% of submissions on which it terminates. Doubling its generation budget recovered 51 of 81 truncated responses and left 30 unrecoverable, and those 30 consumed 29.9% of the total energy the model spent on the corpus. An instructor deploying it would receive no grade and no feedback for roughly one submission in nine, with no advance indication of which, having paid nearly a third of the running cost for them. A model that is slightly less accurate but answers every submission is the better tool, and this ordering is invisible to any evaluation reporting only error over the submissions a model happened to complete.
Aggregate error can conceal a model that is not grading. phi4-mini returns an identical zero for every submission in three of the eight examinations, 41% of those it scored. Its corpus-wide MAE of 10.9 reads as poor accuracy; the underlying behavior is not poor accuracy but a constant output on some assignments and a varying one on others. The distinction matters for deployment, because a weak grader can be used under human review while a constant one cannot be used at all, and it is only visible if the distribution of a model’s predictions is inspected per assignment rather than pooled. We would encourage reporting per-group prediction variance as a routine check in this literature.
Reproducibility cannot be assumed from the decoding configuration. gpt-oss:20b returns different grades for the same submission across repeated runs at temperature 0 with a fixed seed, differing by up to 21 points, while the other three models are exactly reproducible under the identical configuration. Four submissions produced a grade in some repeats and not in others, so even compliance is not stable for this model. In an educational context this is more serious than a moderate accuracy deficit: two students with equivalent submissions, or the same student on a re-mark, can receive materially different grades for reasons unrelated to their work. The bimodal pattern—short generations awarding zero, long generations awarding a substantive grade—suggests the model sometimes terminates its analysis prematurely rather than varying its judgement continuously, which makes the failure mode easier to detect than a smooth spread would be.
The controlled comparison in Section 5.4 locates the cause in the serving layer rather than in the model’s sampling: restricting the daemon to one concurrent request makes the same model exactly reproducible.
The stronger result is in Section Reproducibility Across a Changed Batch Composition, and it applies to all four models. Grading the same submission as part of a different set changes the grade: agreement with the original run falls to between 13 and 33 of 40 submissions, with differences of up to 24 points, and the three models that are exactly reproducible under an unchanged run are not exempt. A control run using the client that produced the original sweep rules out our own instrumentation, leaving the composition of the batch as the only remaining difference. This is the most directly actionable result in the paper and it generalizes well beyond this study. Local inference frameworks batch concurrent requests by default; batch composition is not part of any experimental configuration a researcher would think to record, and it changes between any two runs over different cohorts. An evaluation that pins temperature and seed, as ours did and as good practice requires, is therefore still not reproducible, and nothing in its methods section would reveal why. For a deployment the consequence is that two students graded in different batches can receive different marks, with no signal anywhere in the pipeline that anything differed.
The reference is closer to expert grading than two experts are to each other. The validation subset shows each instructor agreeing with the auto-grader more closely than the two instructors agree between themselves, and only 4 of 25 submissions receiving identical marks from both. This weakens the usual objection to test-based references—that they are a mechanical stand-in for judgment—at least for assignments of this kind, where the breakdown is explicit and the behavior is testable. It also sets the scale against which model error should be judged: an automated grader within a few points of the reference is operating inside the band in which two instructors already disagree, and further reduction of that error is not obviously meaningful. The subset is small and enriched with hard cases, so we treat this as a bound rather than an estimate.
Two models could not be separated, and we do not separate them. The difference between gpt-oss:20b and qwq:32b does not reach significance before or after correction. Their MAEs differ by 0.68 points on the 236 submissions both completed, and we therefore make no claim about which is the more accurate grader. Their difference in compliance, by contrast, is large and consequential, and it points the other way from the ordering their error metrics suggest.
All four models are strict, in proportion to how weakly they track the reference. Every mean signed error is negative. The most plausible mechanism is structural: the prompt asks for points where a requirement is demonstrably satisfied, whereas the harness awards points where a test passes, and a model that cannot execute the code cannot demonstrate satisfaction of a behavioral requirement. The positive within-model correlation between output length and absolute error is consistent with this: extended deliberation is concentrated on submissions the model cannot resolve by inspection, and does not improve the outcome. If the account is right, the bias is a property of static grading against a dynamic reference, and supplying test outcomes to the model rather than only compilation status should reduce it.
Difficulty varies by assignment type more than the aggregates suggest. Every model performs best on the family requiring operator overloading over an STL container and worst on those requiring copy semantics or stateful polymorphic interaction, with qwen3.6:27b ranging from an MAE of 1.13 to 5.51 across families. The relative ordering of the models is stable, but an instructor choosing a model on aggregate figures would over-estimate its performance on the harder assignment types by a factor of several.
Model choice is not explained by size or by reasoning style. qwen3.6:27b agrees best, but qwq:32b, the largest model and the one emitting the most reasoning, does not reproduce that advantage and fails to terminate most often. phi4-mini is the most compliant model and the least accurate by a wide margin. The four models differ simultaneously in parameter count, architecture, quantization, training, and post-training, so this experiment does not isolate any one of these as the cause. The findings are model-specific and should be read as such.
LLM grading should not replace automatic tests. Test-based grading verifies actual program behavior and detects compilation errors, runtime errors, incorrect outputs, and edge-case failures. These signals are objective and reproducible. What the tests miss are conceptual problems in OOP design, and it is there that a model can add value by inspecting structure and explaining its assessment. The results here suggest a division of labor rather than a substitution: tests establish behavioral correctness, a model supplies structural analysis and explanation, and an instructor reviews the cases where the two disagree.
The measurement infrastructure matters as much as the models. Several results above are visible only because the pipeline records information that is easy to omit. Non-termination could be distinguished from malformation only because the completion reason is stored. Memory could be attributed to a model only because the previous model is explicitly unloaded rather than left resident by the framework’s keep-alive policy. Energy could be attributed to generation only because retries are accounted separately. One gap in our own instrumentation illustrates the same point from the other side: the client stores the assistant message content but not the reasoning field, so for the two models that emit their analysis as reasoning tokens the analysis was paid for in tokens and energy but not retained, and no qualitative assessment of their explanations is possible from the stored artifacts. The defaults of common local-inference tooling do not produce measurements suitable for a model comparison, and they do not retain what an instructor would need in order to audit a grade.
Limitations. The reference grades come from an automatic test harness rather than a complete manual evaluation, so agreement with them is a proxy for grading quality; the human validation described in Section 3.3 bounds this gap on 25 submissions, a subset deliberately enriched with cases where models and tests disagree, so the inter-instructor disagreement it reports is an upper bound rather than a typical value. Six of the eight examinations supplied no explicit grading breakdown, and one supplied a breakdown naming the classes of a different problem; Section 5.10 reports the effect we could and could not detect. The reasoning text of two models was not retained, so no qualitative assessment of their explanations is possible. We attempted a categorization of the disagreements between model and reference grades for the two models whose reasoning is retained, with 80 responses annotated by one rater and 15 double-annotated, but abandoned it: inter-rater agreement was below chance (), and two of the six categories were never assigned. We report this rather than omit it because it indicates that a disagreement taxonomy for this task needs to be developed against data rather than specified in advance. The dataset comes from one educational context and one language, and two of the eight examinations are isomorphic restatements of one design, so the effective number of independent problems is seven. One prompt formulation was used throughout; different prompts may change both agreement and compliance, and the compliance figures are partly a property of temperature-0 decoding. The per-submission grades are contingent on the composition of the batch in which they were produced, as Section Reproducibility Across a Changed Batch Composition shows; the aggregate statistics are stable, but individual grades are reproducible only within a fixed composition. Energy measurements are board-level on a non-exclusive host, and phi4-mini’s power average rests on fewer than five samples for 99 of its records. Finally, the model builds on disk at the time of measurement post-date the original experiments, so quantization is recorded as observed rather than verified for the earlier run.
7. Conclusions
This study evaluated four locally served open-weight language models as graders of C++ object-oriented programming examinations, using 271 student submissions across eight examination problems with references produced by the university auto-grader. All four models were served through one endpoint under identical deterministic decoding, and the evaluation measured output-format compliance, agreement with the reference grades, degeneracy, reproducibility across repeated runs, grading bias, and resource consumption.
On agreement, qwen3.6:27b tracks the reference most closely, with a mean absolute error of 3.23 points on a 30-point scale and a Pearson correlation of 0.851, and phi4-mini carries almost no information about it. The difference between the two intermediate models, gpt-oss:20b and qwq:32b, does not reach statistical significance, and we make no claim about their relative accuracy.
Four findings do not concern accuracy, and they matter more for deployment. First, output-format compliance ranges from 88.9% to 98.9% and does not track model size: qwq:32b fails to return a grade for 30 of 271 submissions even at a doubled generation budget, spending 29.9% of its total energy on submissions that produced nothing. Second, a model can be degenerate rather than merely inaccurate: phi4-mini awards an identical zero to every submission in three of the eight examinations, 41% of those it scored, which no aggregate error metric reveals. Third, deterministic decoding does not guarantee reproducible grades, and the failure has two levels. Under an exactly repeated run, gpt-oss:20b varies by up to 21 points on the same submission while the other three models are reproducible; restricting the serving daemon to one concurrent request removes that variation, locating it in request batching rather than in sampling. Under a changed batch composition—the same submissions graded as part of a different set—no model is reproducible: agreement with the original run falls to between 13 and 33 of 40 submissions, and a control run with the original client excludes our instrumentation as the cause. Reproducible local grading therefore depends on serving configuration and on batch composition, neither of which evaluations normally record. Fourth, all four models grade more strictly than the test harness, by between 2.6 and 8.6 points, which we attribute to the difference between static inspection and execution-based verification rather than to any individual model.
Validation against independent instructor grading supports rather than undermines the reference. On a 25-submission subset graded blind by two instructors, each instructor agreed with the auto-grader more closely (mean absolute errors of 3.93 and 1.25 points) than the two instructors agreed with each other (4.84 points), with only 4 of 25 submissions receiving identical marks and a maximum disagreement of 16 points out of 30. The residual error of the best model is therefore of the same order as ordinary variation between human graders.
We also report a negative result. A declaration-level reference could be reconstructed from the auto-grader output for only five of the eight examinations, and on a scale that does not match the grade elicited from the models, because the harness merges missing declarations and incorrect return values into single checks. This makes a structural evaluation tier unavailable for this corpus, and it identifies a concrete and inexpensive change to grading infrastructure—recording declaration and behavior checks separately—that would enable one.
Taken together, these results argue that an evaluation protocol for automated graders should report compliance, prediction variance, and reproducibility alongside agreement, should record the serving configuration in enough detail to include request batching, and should account for the energy spent on generations that produce no usable output—8.53 MJ of the 38.25 MJ consumed here. A model selected on agreement alone would in this study have been one that fails on one submission in nine, or one that cannot be relied upon to return the same grade twice.
Future work should test whether supplying test outcomes rather than only compilation status reduces the systematic strictness observed here; determine which model properties make numerics sensitive to batch composition since batching is now identified as the trigger but the sensitivity is not explained; extend the dataset to further assignments and cohorts; and evaluate whether LLM-generated explanations improve student learning outcomes, which no agreement metric can establish.
Author Contributions
Conceptualization, A.-G.D. and A.G.; methodology, A.-G.D. and A.G.; software, A.-G.D. and A.-A.U.; validation, A.-G.D. and A.-A.U.; formal analysis, A.-G.D. and A.-A.U.; investigation, A.-G.D., A.G. and A.-A.U.; resources, A.G.; data curation, A.-G.D. and A.-A.U.; writing—original draft preparation, A.-G.D.; writing—review and editing, A.-G.D., A.G. and A.-A.U.; visualization, A.-G.D. and A.-A.U.; supervision, A.G.; project administration, A.G. All authors have read and agreed to the published version of the manuscript.
Funding
This research received no external funding.
Data Availability Statement
The anonymized dataset, the grading prompts, the per-submission model outputs and the analysis scripts will be deposited in a public repository upon acceptance, and the persistent identifier will be added to this statement at that time. Until then they are available from the corresponding author on reasonable request.
Acknowledgments
During the preparation of this manuscript, the authors used large language model assistants for language editing and for drafting and reviewing analysis scripts. The authors have reviewed and edited the output and take full responsibility for the content of this publication. The language models evaluated in this study, listed in Table 4, are the object of the investigation and were not used to prepare the manuscript.
Conflicts of Interest
The authors declare no conflicts of interest.
Abbreviations
The following abbreviations are used in this manuscript:
| CI | Confidence Interval |
| LLM | Large Language Model |
| OOP | Object-Oriented Programming |
| MAE | Mean Absolute Error |
| RMSE | Root Mean Squared Error |
| QWK | Quadratic Weighted Kappa |
| GPU | Graphics Processing Unit |
References
- Bernik, A.; Radošević, D.; Čep, A. A Comparative Study of Large Language Models in Programming Education: Accuracy, Efficiency, and Feedback in Student Assignment Grading. Appl. Sci. 2025, 15, 10055. [Google Scholar] [CrossRef] [Scilit]
- Jukiewicz, M. A systematic comparison of Large Language Models for automated assignment assessment in programming education: Exploring the importance of architecture and vendor. Comput. Educ. Open 2026, 10, 100364. [Google Scholar] [CrossRef] [Scilit]
- Kumar, N.A.; Lan, A.S. Using Large Language Models for Student-Code Guided Test Case Generation in Computer Science Education. In Proceedings of the 2024 AAAI Conference on Artificial Intelligence; Proceedings of Machine Learning Research; PMLR: Cambridge, MA, USA, 2024; Volume 257, pp. 170–179. [Google Scholar]
- Alkafaween, U.; Albluwi, I.; Denny, P. Automating Autograding: Large Language Models as Test Suite Generators for Introductory Programming. J. Comput. Assist. Learn. 2025, 41, e13100. [Google Scholar] [CrossRef] [Scilit]
- Zheng, L.; Chiang, W.-L.; Sheng, Y.; Zhuang, S.; Wu, Z.; Zhuang, Y.; Lin, Z.; Li, Z.; Li, D.; Xing, E.P.; et al. Judging LLM-as-a-Judge with MT-Bench and Chatbot Arena. Adv. Neural Inf. Process. Syst. 2023, 36, 46595–46623. [Google Scholar] [CrossRef] [Scilit]
- Wang, P.; Li, L.; Chen, L.; Cai, Z.; Zhu, D.; Lin, B.; Cao, Y.; Kong, L.; Liu, Q.; Liu, T.; et al. Large Language Models are not Fair Evaluators. In Proceedings of the 62nd Annual Meeting of the Association for Computational Linguistics; Association for Computational Linguistics: Bangkok, Thailand, 2024; Volume 1, pp. 9440–9450. [Google Scholar] [CrossRef] [Scilit]
- Stureborg, R.; Alikaniotis, D.; Suhara, Y. Large Language Models are Inconsistent and Biased Evaluators. arXiv 2024, arXiv:2405.01724. [Google Scholar]
- Wataoka, K.; Takahashi, T.; Ri, R. Self-Preference Bias in LLM-as-a-Judge. arXiv 2024, arXiv:2410.21819. [Google Scholar]
- Gu, J.; Jiang, X.; Shi, Z.; Tan, H.; Zhai, X.; Xu, C.; Li, W.; Shen, Y.; Ma, S.; Liu, H.; et al. A Survey on LLM-as-a-Judge. Innovation 2026, 7, 101253. [Google Scholar] [CrossRef] [Scilit] [PubMed]
- Abbas, N.; Atwell, E. Cognitive Computing with Large Language Models for Student Assessment Feedback. Big Data Cogn. Comput. 2025, 9, 112. [Google Scholar] [CrossRef] [Scilit]
- Jabrw, S.K.; Sarhan, Q.I. A Systematic Survey on Large Language Models for Code Generation. ARO Sci. J. Koya Univ. 2025, 13, 83–99. [Google Scholar] [CrossRef] [Scilit]
- Macedo, M.; Tian, Y.; Cogo, F.R.; Adams, B. Output format biases in the evaluation of large language models for code translation. Empir. Softw. Eng. 2026, 31, 41. [Google Scholar] [CrossRef] [Scilit]
- Garaccione, G.; Calabrese, D.M.; Coppola, R.; Ardito, L. A comparison of different Large Language Models for the generation of UML class diagrams. In Proceedings of the 2025 ACM/IEEE 28th International Conference on Model Driven Engineering Languages and Systems Companion, MODELS-C, Grand Rapids, MI, USA, 5–10 October 2025; pp. 541–545. [Google Scholar] [CrossRef] [Scilit]
- Calamo, M.; Mecella, M.; Snoeck, M. Assessing the Suitability of Large Language Models in Generating UML Class Diagrams as Conceptual Models. In International Conference on Business Process Modeling, Development and Support; Springer: Cham, Switzerland, 2025; pp. 211–226. [Google Scholar]
- Lu, J.; Sun, P.; Ye, P. AUG: An Interactive Tool for Clarifying and Generating UML Models Based on Large Language Models. In Proceedings of the 2025 25th International Conference on Software Quality, Reliability and Security (QRS), Hangzhou, China, 16–20 July 2025; pp. 78–85. [Google Scholar] [CrossRef] [Scilit]
- Su, W.; Wu, X.; Zhao, Y. NL2ACSL: Interactively translating natural language to ANSI C specification language with large language models. Knowl.-Based Syst. 2026, 335, 115177. [Google Scholar] [CrossRef] [Scilit]
- Li, F.; Jiang, J.; Sun, J.; Zhang, H. Hybrid Automated Program Repair by Combining Large Language Models and Program Analysis. ACM Trans. Softw. Eng. Methodol. 2025, 34, 202. [Google Scholar] [CrossRef] [Scilit]
- Fakih, M.; Dharmaji, R.; Bouzidi, H.; Araya, G.Q.; Ogundare, O.; Al Faruque, M.A. LLM4CVE: Enabling Iterative Automated Vulnerability Repair with Large Language Models. In Proceedings of the 2025 28th Euromicro Conference on Digital System Design (DSD), Salerno, Italy, 10–12 September 2025; pp. 592–599. [Google Scholar]
- Gnieciak, D.; Szandala, T. Large Language Models Versus Static Code Analysis Tools: A Systematic Benchmark for Vulnerability Detection. IEEE Access 2025, 13, 198410–198422. [Google Scholar] [CrossRef] [Scilit]
- Chuang, Y.S.; Sarkar, A.R.; Hsu, Y.C.; Mohammed, N.; Jiang, X. Robust privacy amidst innovation with large language models through a critical assessment of the risks. J. Am. Med. Inform. Assoc. 2025, 32, 885–898. [Google Scholar] [CrossRef] [Scilit] [PubMed]
- OpenAI. Introducing Gpt-Oss. Available online: https://openai.com/index/introducing-gpt-oss/ (accessed on 20 May 2026).
- Qwen Team. Qwen3.6-27B Model Card. Available online: https://huggingface.co/Qwen/Qwen3.6-27B (accessed on 3 September 2026).
- Qwen Team. QwQ-32B Model Card. Available online: https://huggingface.co/Qwen/QwQ-32B (accessed on 20 May 2026).
- Microsoft. Phi-4-Mini-Instruct Model Card. Available online: https://huggingface.co/microsoft/Phi-4-mini-instruct (accessed on 3 September 2026).
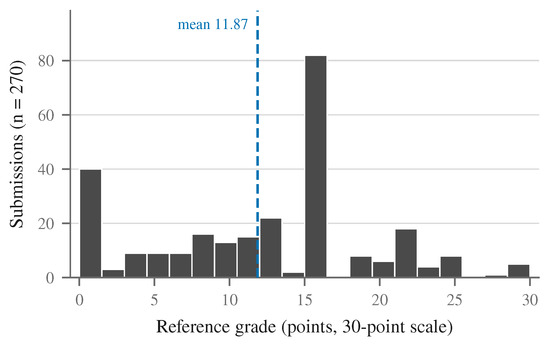
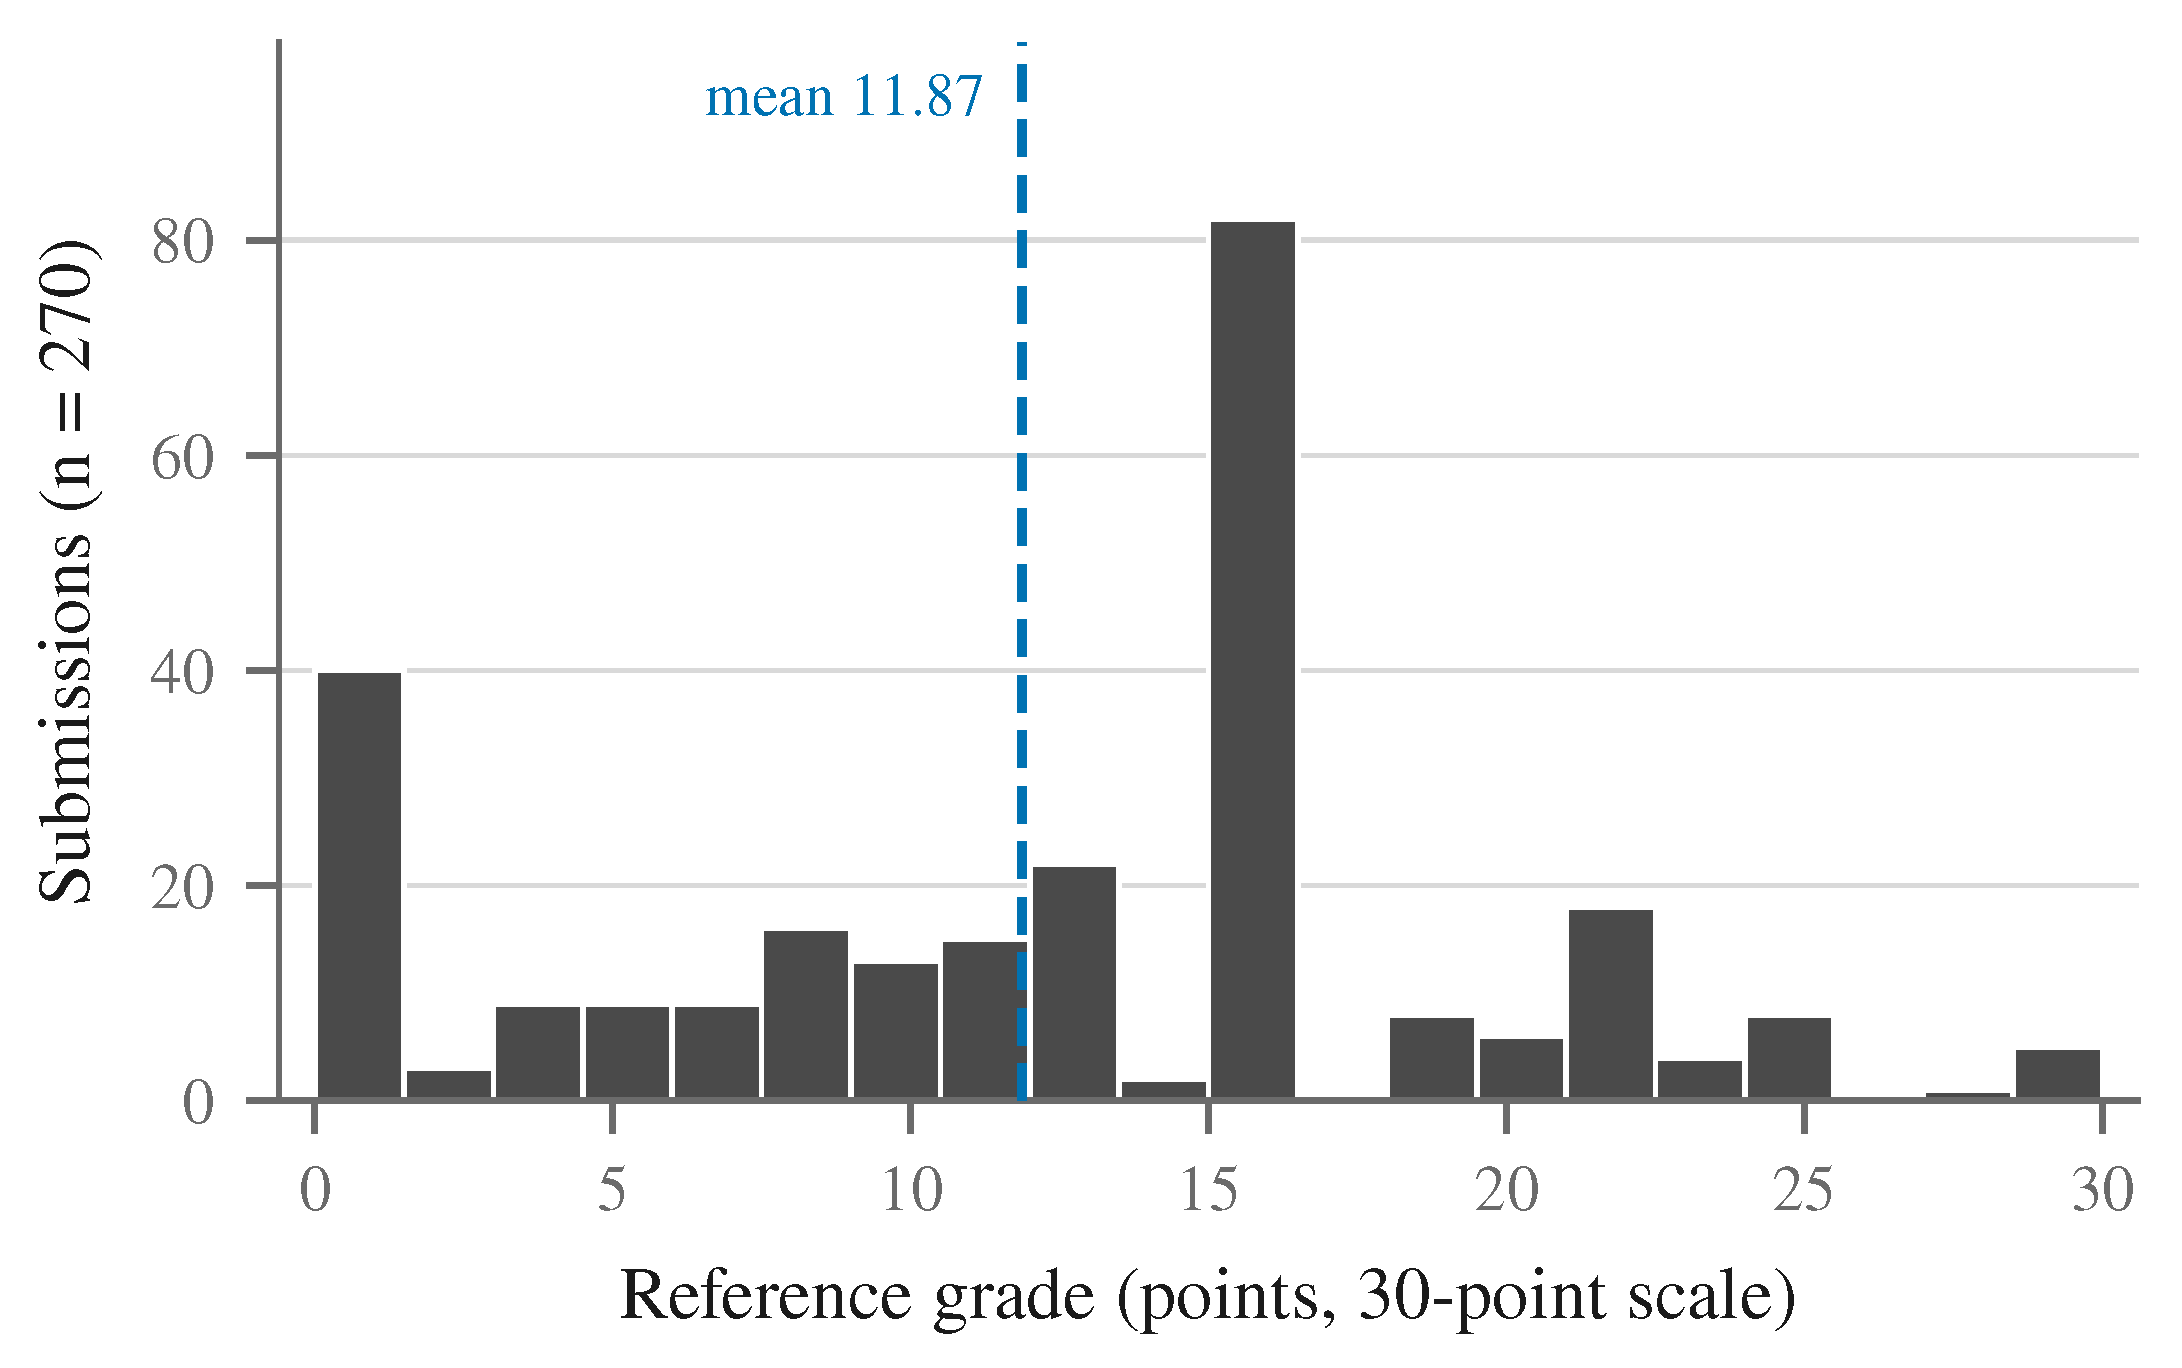
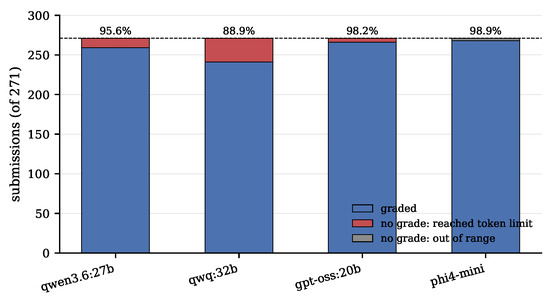
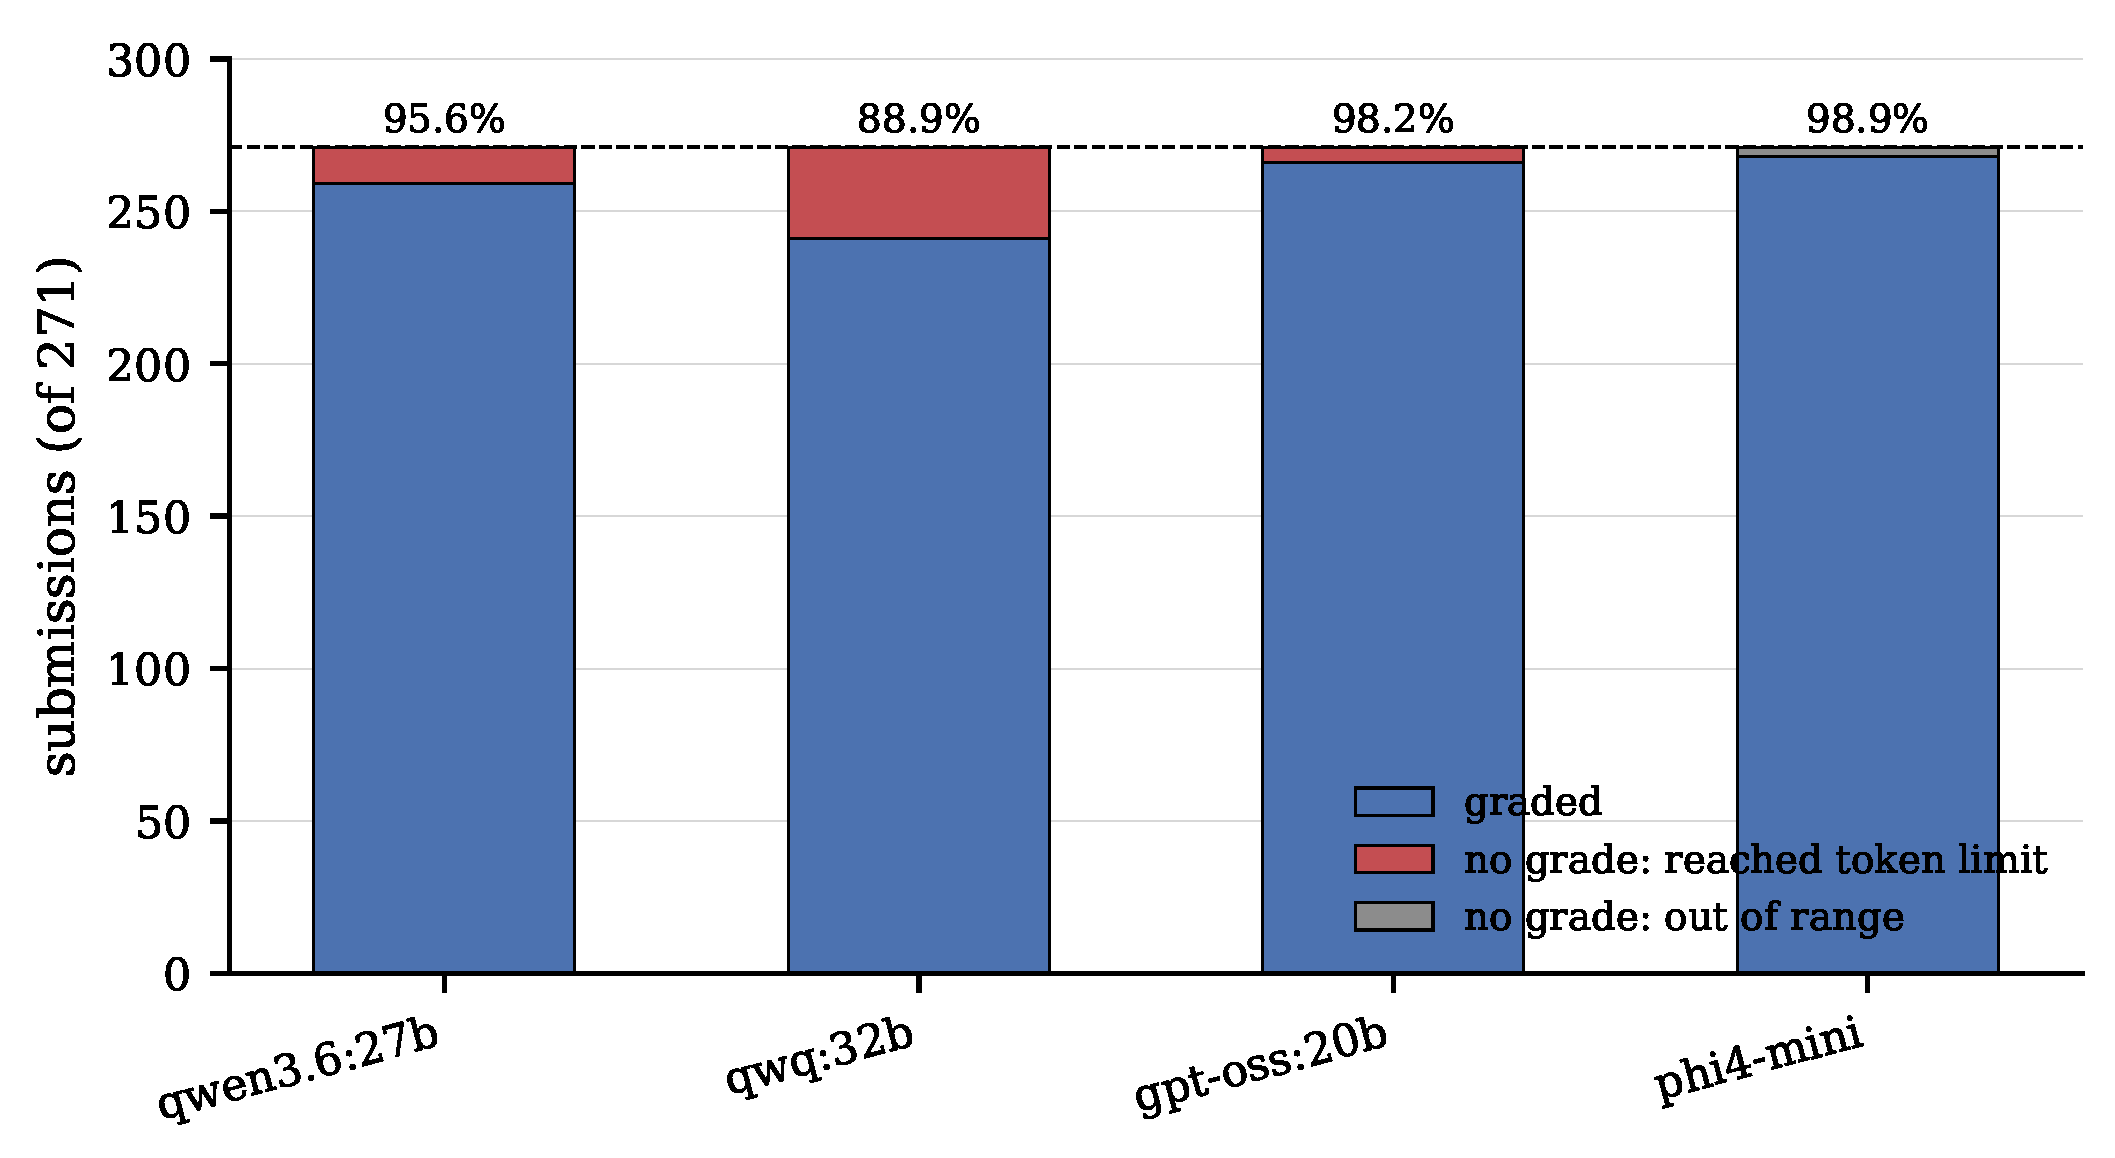
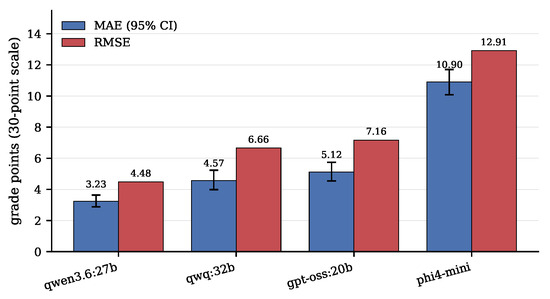
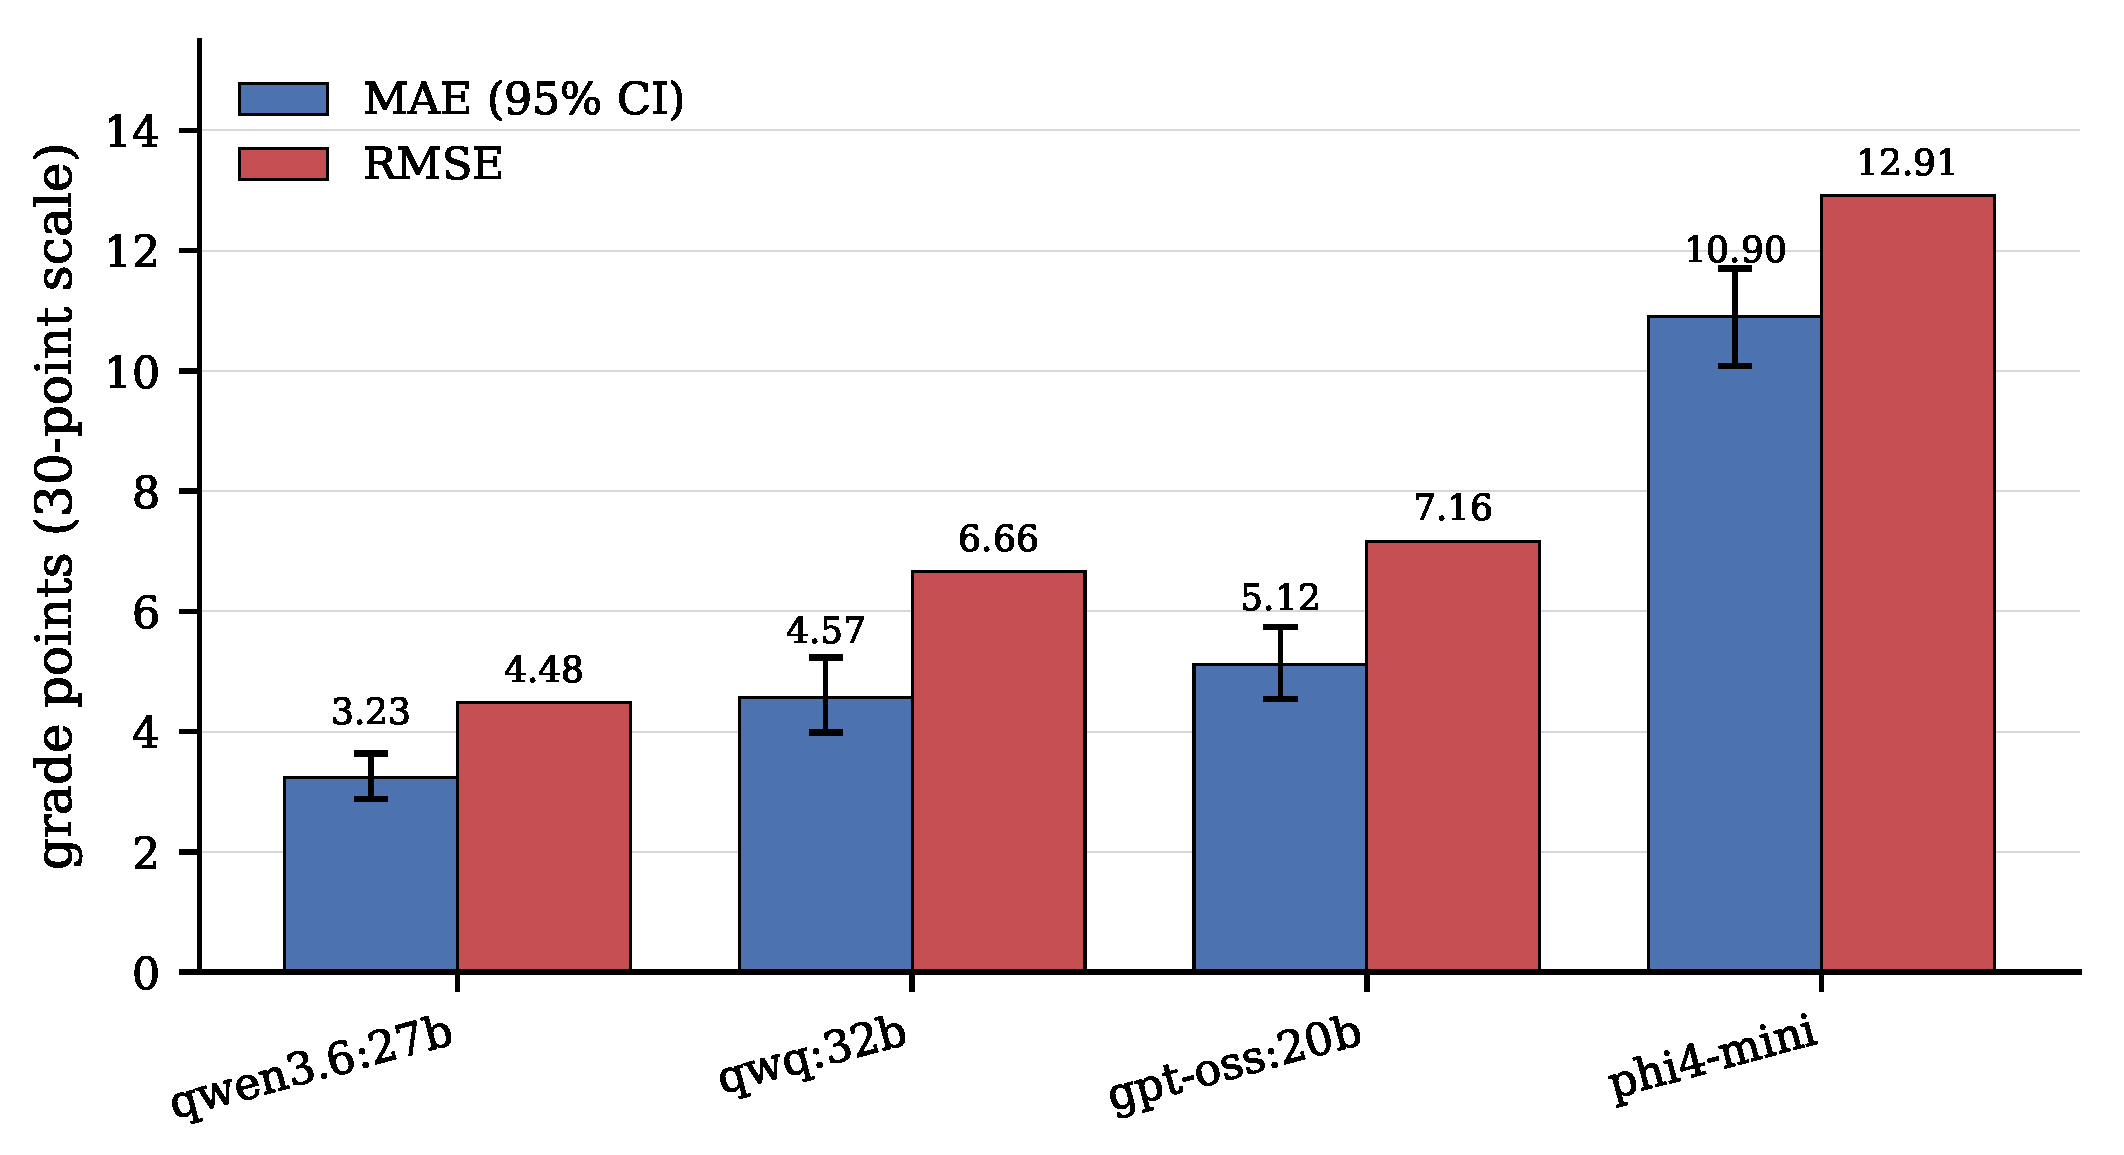
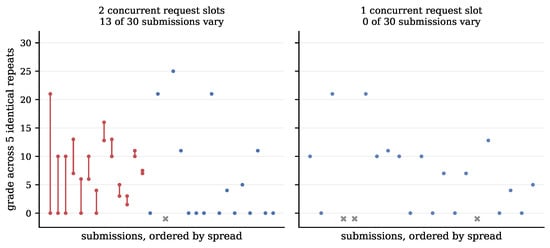
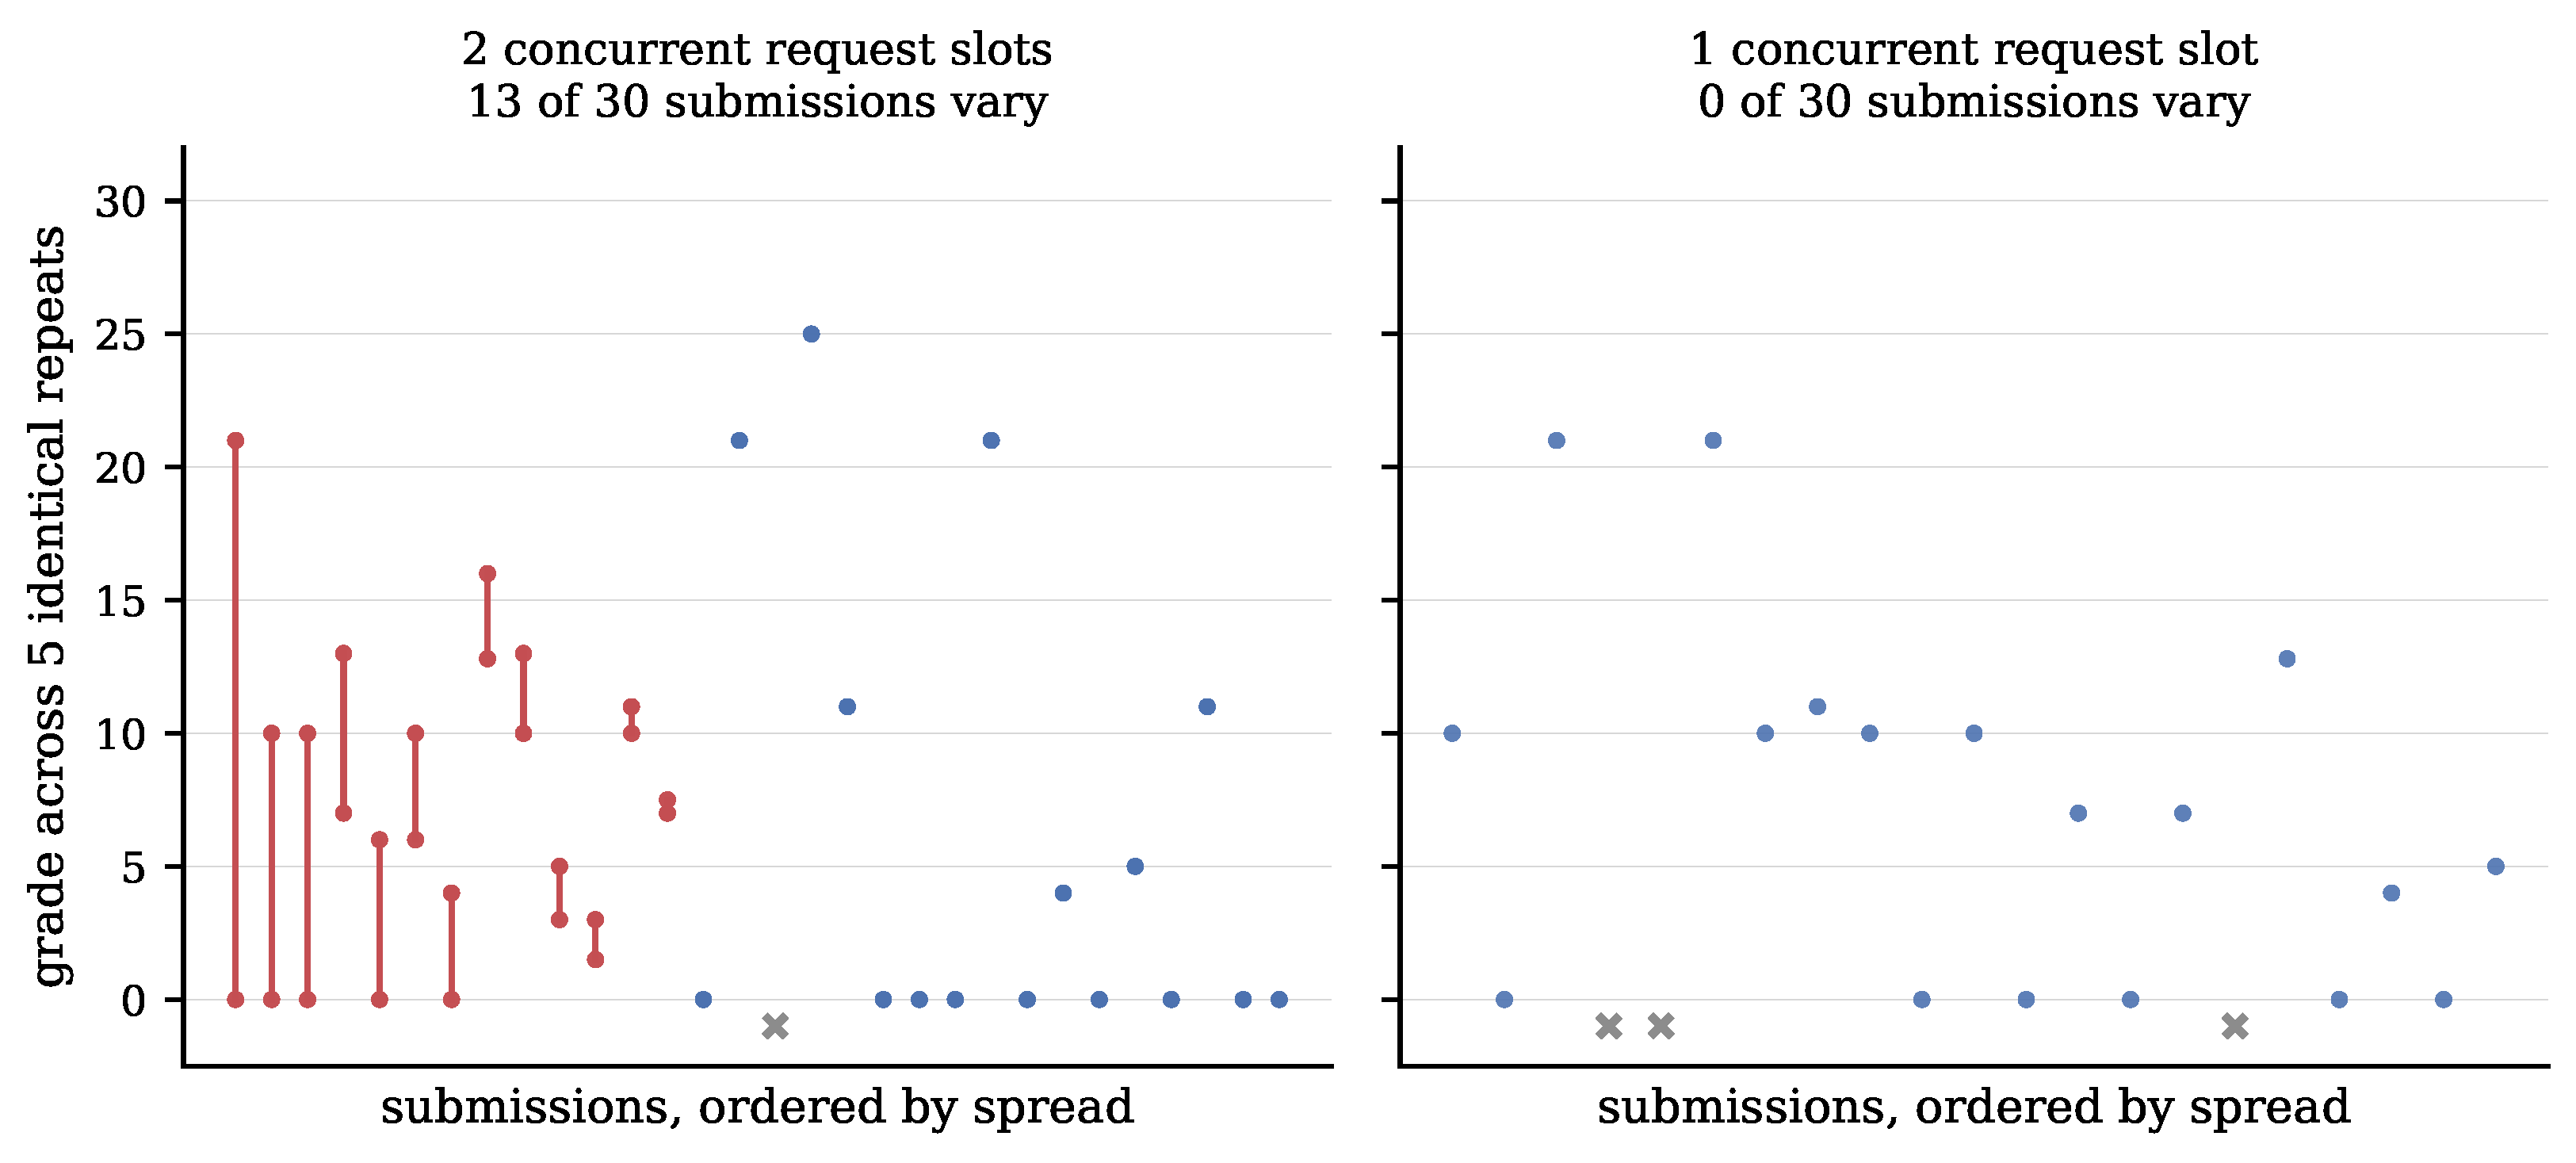
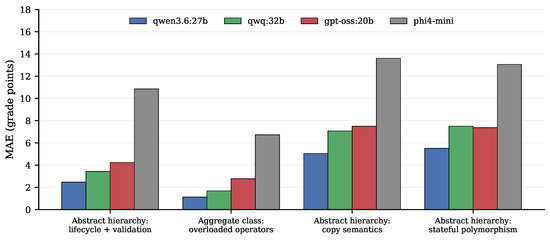
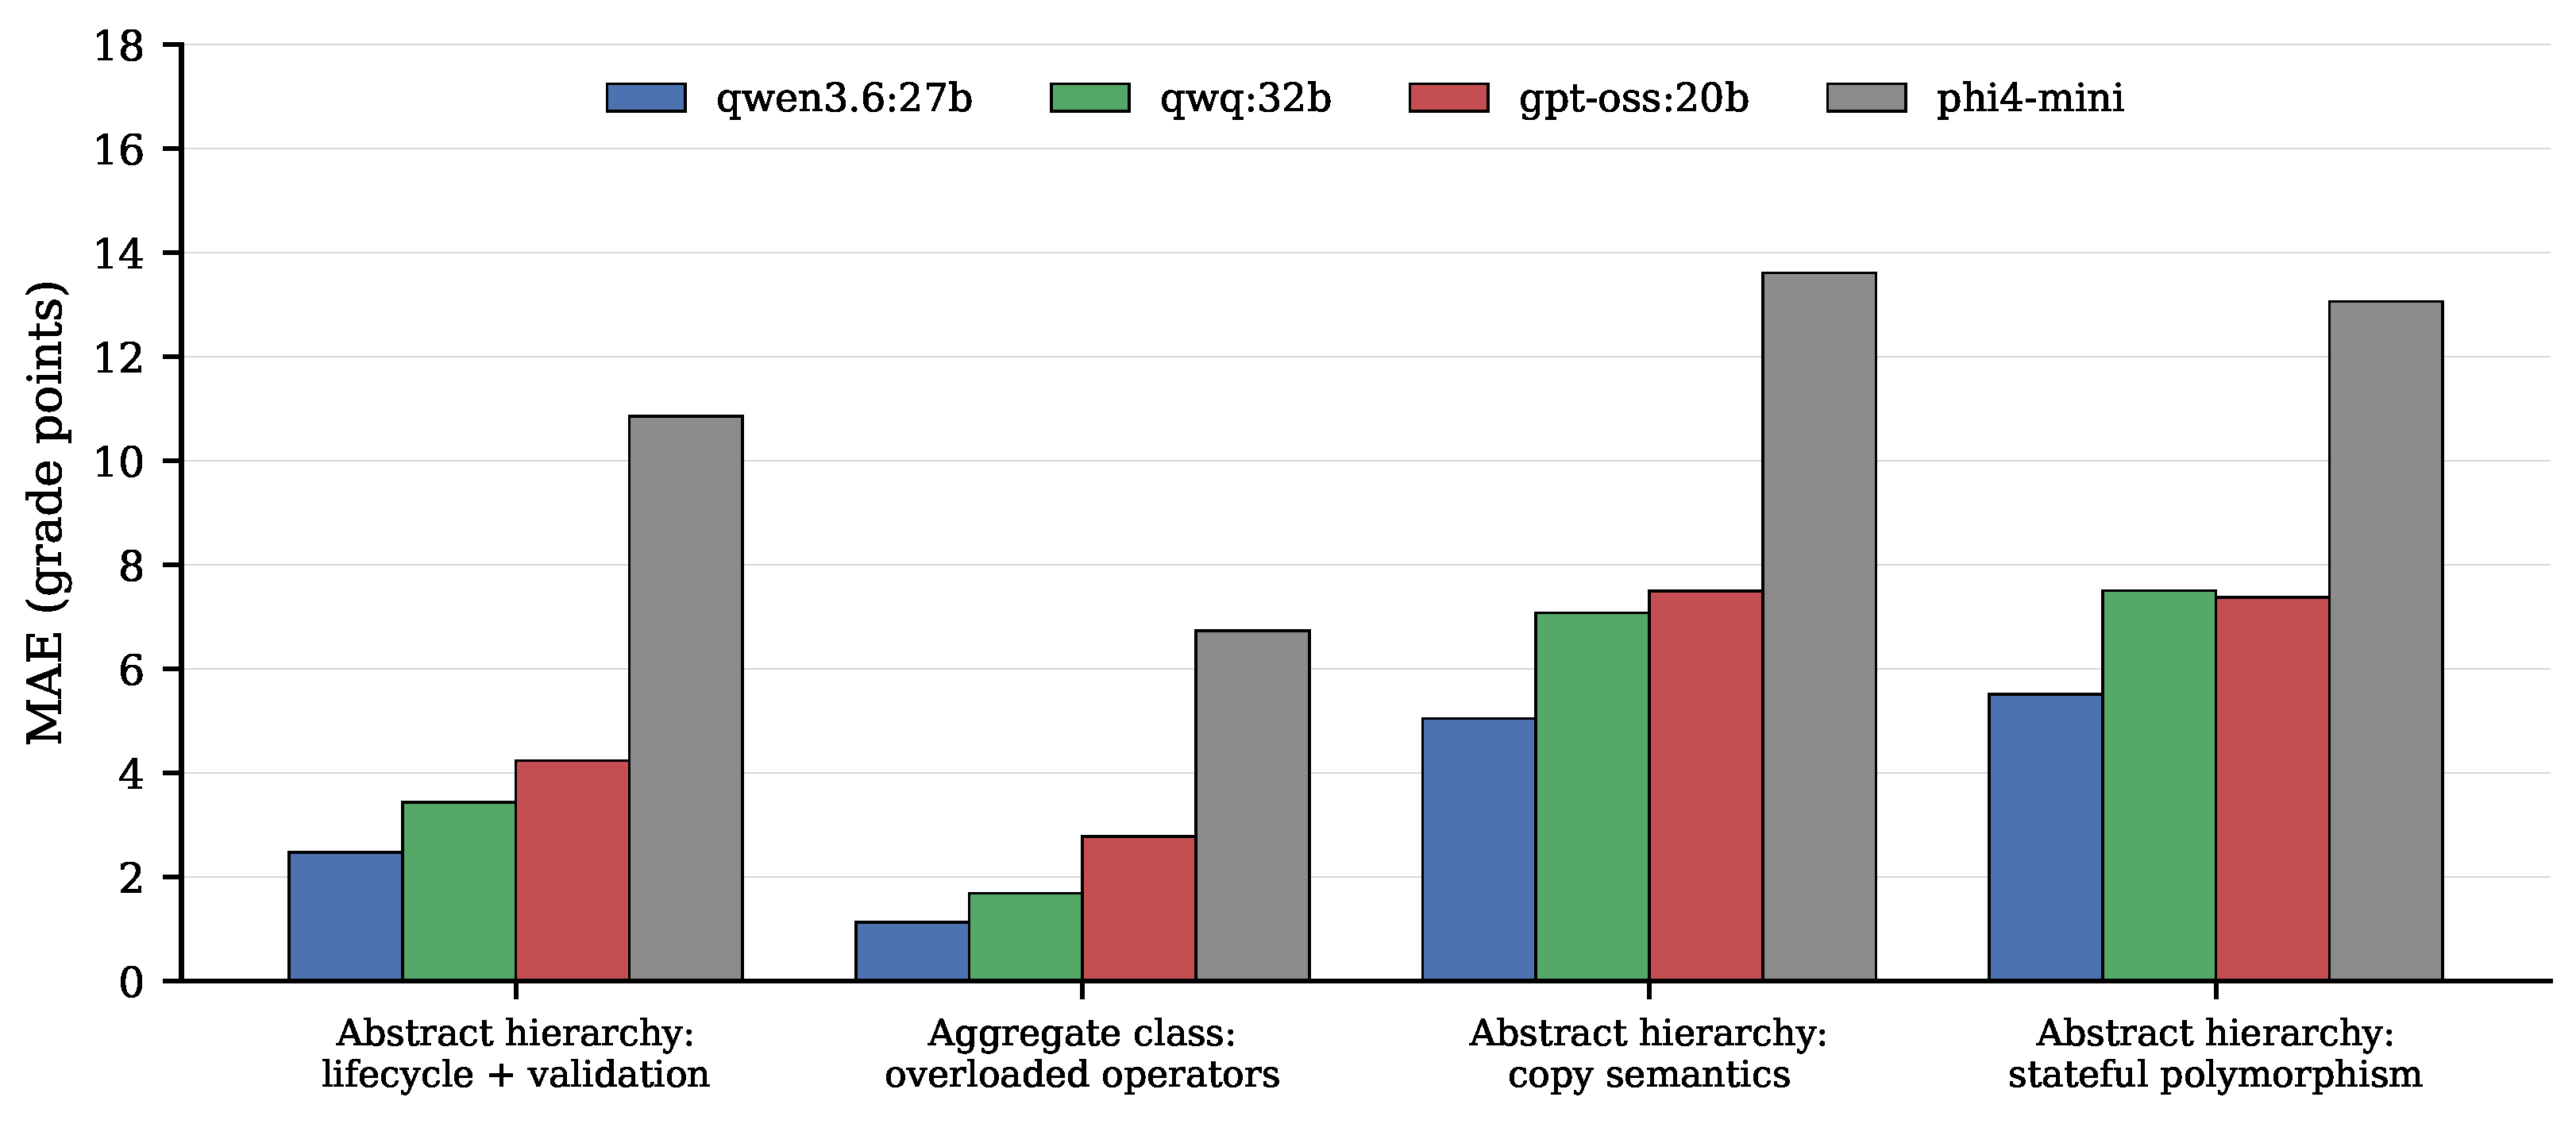
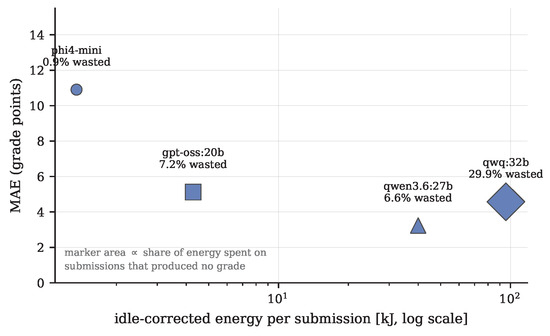
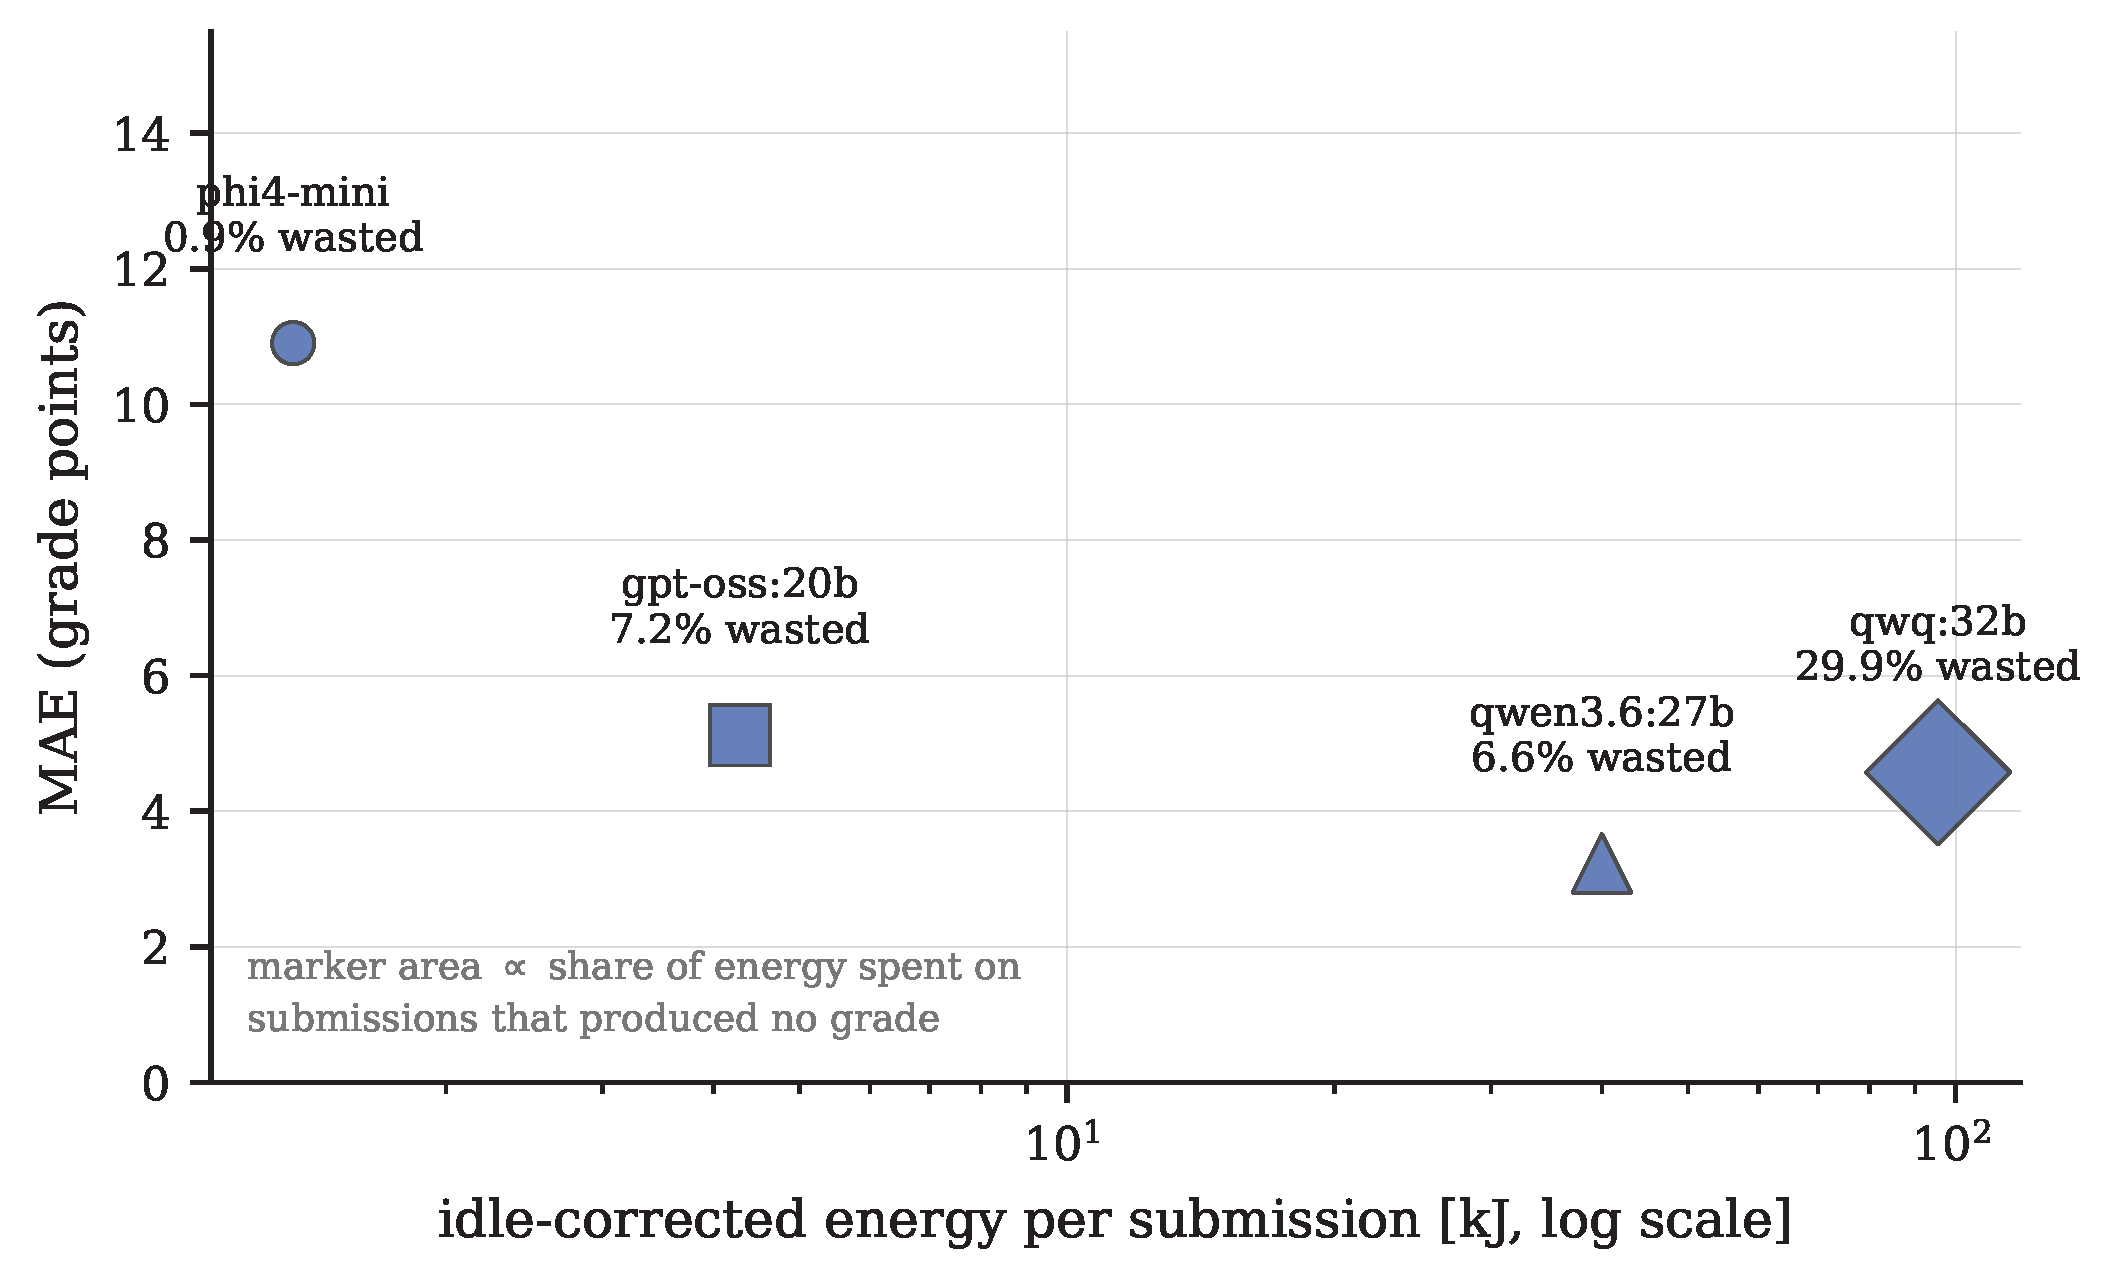

Disclaimer/Publisher’s Note: The statements, opinions and data contained in all publications are solely those of the individual author(s) and contributor(s) and not of MDPI and/or the editor(s). MDPI and/or the editor(s) disclaim responsibility for any injury to people or property resulting from any ideas, methods, instructions or products referred to in the content. |
© 2026 by the authors. Licensee MDPI, Basel, Switzerland. This article is an open access article distributed under the terms and conditions of the Creative Commons Attribution (CC BY) license.