


Abstract
While deep learning has significantly improved the accuracy of visual detection systems, the integration of process semantics with visual perception for industrial assembly tasks remains largely unexplored. This study aims to develop a high-accuracy cable connector detection framework that incorporates process knowledge to enhance feature discrimination under varying industrial imaging conditions. To achieve this goal, we build an enhanced Fully Convolutional One-Stage (FCOS) detector with a ConvNeXt V2 backbone and introduce a Process Feature Linear Modulation (PFNM) module. The proposed module adaptively modulates visual features using encoded process semantics, enabling the detector to align visual perception with assembly logic. Experiments conducted on an industrial connector dataset demonstrate that the proposed method achieves an mAP of 84.7%, outperforming representative state-of-the-art detectors including YOLOv11, RT-DETR, and DINO while maintaining an inference speed of 17.6 FPS. Ablation studies further show that each component contributes to progressive performance improvement, and the complete framework achieves a 5.5% AP gain over the ResNet-50 baseline. These results indicate that integrating process knowledge with visual feature learning effectively improves feature discrimination and provides a promising paradigm for process-aware perception in intelligent manufacturing.
1. Introduction
Inspecting cable connectors is important for maintaining the safety of modern production lines. These components move power and signals between modules. Misalignment or structural flaws lead to equipment failure and costly downtime [1]. As factories automate, visual inspection has become a standard safeguard for operational safety [2], particularly inside edge-based monitoring setups [3].
Industrial connector detection can be challenging because of variations in illumination, viewing angle, camera-to-object distance, and target scale [4]. In addition, different connector categories may exhibit highly similar visual appearances, making fine-grained category discrimination difficult. Sensor noise and surface reflections further complicate image acquisition [5]. Traditional handcrafted features are less robust under these imaging variations, making reliable detection difficult [6]. This limitation motivates more powerful algorithms with multi-scale perception.
Object detection has moved fast with deep learning. Two-stage detectors isolate candidate regions before classifying them. Faster R-CNN [7] and Mask R-CNN [8] follow this paradigm. One-stage detectors combine proposal and prediction into a single step. SSD [9], YOLO [10], and FCOS [11] follow this approach, offering faster inference with minimal accuracy loss. Transformers capture distant pixel relationships across the whole image [12]. ConvNeXt demonstrates that carefully modernized convolutions rival Transformers at lower computational expense [13]. Despite these advances, detectors still rely primarily on visual patterns. Process knowledge from assembly workflows is rarely incorporated into detection models. Connectors that serve distinct functions can appear nearly identical, misleading appearance-only models. Fine details on small or partially occluded connectors fade within conventional feature pyramids.
Recent studies on feature-wise modulation have shown that conditional feature transformation can incorporate auxiliary information into visual representations [14]. We integrate industrial process knowledge into visual feature learning through a Process Feature Linear Modulation (PFNM) module. PFNM uses lightweight linear modulation to highlight process relevant visual patterns while suppressing background interference. This improves discrimination between visually similar connectors and enhances robustness under challenging industrial conditions.
We develop an enhanced FCOS-based detection framework for cable connector inspection. ConvNeXt V2 serves as the backbone for feature extraction. A Feature Pyramid Network aggregates multi-scale information for small-object detection. The PFNM module is inserted after feature fusion to modulate multi-scale features with process-specific cues before prediction by the FCOS detection head.
The main contributions of this work are summarized as follows:
- A Process Feature Linear Modulation (PFNM) module is proposed to integrate industrial process knowledge into visual feature learning through lightweight adaptive modulation.
- An enhanced FCOS detection framework combining ConvNeXt V2, a multi-scale FPN structure, and the PFNM module is developed to improve detection robustness in complex industrial environments.
- Extensive experiments on a cable connector dataset demonstrate that the proposed method consistently outperforms several state-of-the-art detectors in terms of accuracy and stability.
The remainder of this paper is organized as follows. Section 2 reviews related work on industrial object detection and feature modulation. Section 3 introduces the proposed PFNM-enhanced detection framework. Section 4 presents the experimental settings and evaluation results. Section 5 concludes the paper and discusses future work.
2. Related Works
2.1. Cable and Connector Inspection
Reliable cable and connector inspection is essential for industrial automation systems. Early inspection methods relied on rule-based image processing techniques. Edge detection, template matching, and color thresholding located connectors and identified defects. A mixed feature-based vision strategy was adopted in [15]. Handcrafted visual cues were combined to improve connector localization under controlled conditions. These methods offer computational simplicity. Their performance degrades in real assembly environments. Varying illumination, occlusions, and viewpoint changes affect accuracy.
With the development of machine vision, learning-based feature extraction methods gradually replaced purely rule-based pipelines. Gradient-based descriptors such as Histogram of Oriented Gradients (HOG) were introduced to capture structural patterns in industrial components [16]. Texture-based representations modeled local appearance variations. Local Binary Patterns (LBP) were explored for visual inspection [17]. These approaches improved robustness compared to traditional algorithms. They relied on manually designed features. This reliance limited generalization across diverse connector geometries and complex industrial environments.
Deep learning has significantly advanced connector inspection by enabling end-to-end feature learning. Convolutional neural network-based detection frameworks demonstrated strong capability in connector localization and defect recognition by automatically learning discriminative visual representations [18]. Multi-scale convolutional strategies were further introduced to improve the detection of small structural components and fine-grained connector details [19]. Although these approaches improve robustness, most of them rely primarily on visual appearance cues and rarely incorporate process-related knowledge from industrial assembly workflows. Consequently, connectors with similar visual structures but different functional roles may still lead to ambiguous predictions. In industrial cable assembly, visual appearance alone is often insufficient because connectors with similar shapes may correspond to different electrical functions and assembly stages. Manufacturing documents and assembly specifications provide structured process semantics that can complement visual information during detection.
2.2. Backbone Networks
Backbone architectures form the foundation of visual representation learning in modern detection. AlexNet [20] and VGG [21] demonstrated the value of deep hierarchical features, but required substantial computational resources. The Inception architecture addressed this with multi-branch convolutional modules. These capture multi-scale information inside a single layer without sacrificing efficiency [22].
Residual learning improved deep network training. Shortcut connections alleviated the vanishing gradient problem [23]. This enabled very deep architectures with better stability and accuracy. Modern convolutional backbones continue evolving toward stronger representation and improved scalability. ConvNeXt revisits classical convolutional design [13]. It integrates architectural improvements inspired by transformer models. Modernized CNNs provide strong feature representation while maintaining high computational efficiency on large-scale visual recognition tasks. ConvNeXt V2 enhances normalization mechanisms, activation functions, and downsampling strategies [24]. Feature representation capability and generalization performance improve as a result. These advances provide a powerful feature extraction foundation for complex industrial inspection scenarios.
2.3. CNN-Based Object Detectors
CNN-based detection frameworks underpin modern visual inspection. Region-based detectors generate candidate object regions then classify and localize them. Faster R-CNN [7] and Mask R-CNN [8] attain high accuracy through two-stage refinement, though the sequential proposal and refinement overhead constrains real-time industrial deployment.
One-stage detectors formulate detection as direct regression. SSD [9] and YOLO [10] directly predict bounding boxes and categories from image features. This design enables faster inference suitable for real-time applications. Feature Pyramid Networks (FPN) introduce hierarchical feature fusion. This combines high-level semantics with high-resolution spatial information for improved multi-scale detection [25].
Anchor-free detectors eliminate predefined anchors to simplify detection pipelines. FCOS frames object detection as per-pixel prediction, reducing complexity while retaining localization accuracy [11]. Existing detectors mainly rely on visual features and usually do not exploit structured process semantics available during industrial assembly, such as connector categories, assembly stages, mating constraints, and workstation specific operation rules.
Unlike general object detectors, the proposed framework explicitly incorporates industrial process semantics into visual feature learning through the PFNM module. By modulating multi-scale visual representations using process-related cues, the proposed method not only improves discrimination between visually similar connectors but also enhances robustness in complex industrial environments.
3. Method
In this section, we present the proposed ConvNeXt V2 and PFNM-enhanced FCOS framework for high-accuracy cable connector detection under varying industrial imaging conditions. The overall architecture of the proposed model is first introduced (Section 3.1), followed by detailed descriptions of the ConvNeXt V2 backbone with EMA (Section 3.2), the SimAM-enhanced FPN (Section 3.3), and the PFNM fusion strategy (Section 3.4). Finally, the detection head and training objectives are discussed (Section 3.5).
3.1. Overview of the Proposed Architecture
The proposed detection framework, termed PFNM-Enhanced FCOS, employs the ConvNeXt V2 backbone [24] to extract visual features for cable connector detection under varying industrial imaging conditions. As shown in Figure 1, the architecture follows a four-stage pipeline that progressively refines feature representations and semantic consistency.
Figure 1.
Overall architecture of the proposed ConvNeXt V2 and PFNM-enhanced FCOS model.
First, the input connector image is processed by the ConvNeXt V2 backbone integrated with an Efficient Multi-scale Attention (EMA) module [26]. EMA captures spatial–channel dependencies through multi-scale attention, while the adopted variant modifies the original structure to improve feature interaction and maintain strong discriminative capability.
Next, the extracted features are fed into a Feature Pyramid Network (FPN) to enable multi-scale representation learning. To further enhance feature discrimination, the SimAM attention mechanism [27] is embedded within the pyramid structure, improving spatial sensitivity and channel selectivity during feature fusion.
After multi-scale refinement, the proposed Process Feature Linear Modulation (PFNM) layer is applied to the feature maps. This module introduces process-related information and adaptively modulates visual features through a linear transformation, allowing the model to align visual cues with industrial assembly semantics.
Finally, an anchor-free FCOS detection head produces classification scores, bounding box coordinates, and centerness predictions. By combining strong visual representations, multi-scale feature fusion, and process-aware modulation, the proposed architecture achieves robust and accurate cable connector detection in challenging industrial scenarios.
3.2. ConvNeXt V2 Backbone with Improved EMA Integration
Our detection framework adopts ConvNeXt V2 as the backbone due to its strong representation capability in hierarchical convolutional architectures. This capability is particularly beneficial for cable connector detection, where accurate localization relies on subtle geometric structures and fine texture patterns.
As illustrated in Figure 2, the architectural design of the proposed EMA module incorporates a multi-branch framework that processes visual features through complementary computational pathways.
Figure 2.
Structure of the proposed EMA module.
The feature map , output from the preceding stage, is first transformed via a pointwise convolution to obtain a unified representation for the subsequent EMA-enhanced processing stream:
where denotes the learned parameters of the initial projection.
The projected features are processed by two parallel branches. One branch extracts spatial context through global average pooling:
where denotes the input feature map, c indexes the channel dimension, and i and j index the spatial height and width, respectively. The resulting vector represents the global context obtained by averaging each channel over all spatial locations.
The resulting global context vector is then passed through a linear transformation to produce the spatial descriptors. Concurrently, a separate stream operates at finer spatial resolution and captures complementary spatial information through depthwise convolutional operations:
where ⊛ represents depthwise convolution and contains the corresponding filter weights.
The outputs from these parallel spatial processing streams are combined and normalized to generate spatial attention weights:
where denotes the sigmoid activation function and , are learned projection matrices.
Simultaneously, a separate computational pathway focuses on channel-wise feature recalibration. Global spatial information is aggregated through pooling operations:
The resulting vector contains channel-wise statistics obtained by averaging over all spatial locations.
This condensed representation then passes through a compact multi-layer projection that captures non-linear interactions between feature channels:
where represents a non-linear activation function and , are learned weight matrices.
The computed spatial and channel attention weights are applied to the original input features through element-wise multiplication operations:
These enhanced feature representations, each refined according to different criteria, are subsequently integrated through a fusion mechanism:
where denotes channel-wise concatenation of the spatial and channel streams, and is a 1 × 1 convolution that mixes the concatenated features and reduces the channel dimension, producing the fused feature map for subsequent processing.
The integrated representation is then processed to aggregate information across multiple receptive field sizes:
where denotes a multi-scale feature extraction operator implemented as parallel convolutional layers with different kernel sizes, which captures visual patterns at varying spatial extents and enhances the model’s robustness to scale variations.
The ConvNeXt V2 backbone consists of four sequential stages, as shown in Figure 3. The spatial resolution decreases stage by stage, while the channel capacity gradually increases. Based on this hierarchical structure, three feature maps are extracted and forwarded to the feature pyramid network.
Figure 3.
Structure of the improved ConvNeXt V2 backbone.
The output of the third stage is directly used as without attention enhancement. Deeper features are refined by Efficient Multi-scale Attention (EMA) modules before being output. The feature map is obtained by applying an EMA block to the output of stage 3 before stage 4, while is generated by inserting another EMA block after stage 4 before stage 5.
The EMA module is incorporated only into the deeper stages of ConvNeXt V2, where high-level semantic representations benefit more from attention refinement while shallow structural features remain unchanged.
As illustrated in Figure 3, early-stage features mainly preserve geometric structures and edge details that are important for cable connector localization. Applying attention at this stage may weaken fine spatial information. In contrast, deeper features contain richer semantic information and therefore benefit more from spatial and channel recalibration. This design preserves structural details in while improving the representation quality of and , providing balanced multi-scale features for feature pyramid construction.
3.3. SimAM-Enhanced FPN
The feature pyramid network (FPN) receives the backbone outputs and constructs multi-scale feature maps through a top-down pathway with lateral connections. Although this structure effectively combines semantic and spatial information, feature fusion across different pyramid levels may still introduce redundant responses and weaken informative local details.
To improve feature aggregation without increasing computational complexity, we introduce the lightweight SimAM module [27] into the pyramid fusion process. SimAM estimates the importance of each neuron from the feature distribution instead of learning additional attention parameters. It therefore refines multi-scale representations while keeping the original efficiency of the FPN, as illustrated in Figure 4.
Figure 4.
Structure of the lightweight SimAM module. Note: The different colors in the 3D weights and the final feature map conceptually illustrate the varying attention weights assigned to individual neurons.
As illustrated in Figure 4, SimAM estimates the importance of each voxel from its local statistics and generates attention weights without introducing additional learnable parameters.
As defined in the SimAM module, the voxel value is assigned a neuron energy, a task-specific metric designed to quantify the importance of the neuron within its local context:
where and denote the mean and variance within a local region, and is a small constant used for regularization. The final voxel-wise attention is then computed as
where is a small constant added to the denominator to prevent division-by-zero and mitigate numerical instability caused by extremely small variance values. The resulting attention weights modulate the input feature by
yielding an enhanced feature tensor with negligible additional computation. The refined feature tensor is obtained through element-wise multiplication. Since SimAM introduces no convolutional or fully connected layers, the computational overhead remains negligible.
Based on the above formulation, SimAM is embedded into the feature pyramid network to refine feature interaction across different scales. Unlike applying attention only after feature fusion, attention refinement is performed at each pyramid junction so that informative responses are preserved before subsequent feature propagation. The modified FPN structure is shown in Figure 5. Along the top-down path, the high-level feature is first refined by SimAM and then propagated to generate and . Attention refinement before feature transmission suppresses redundant responses and preserves discriminative semantic information during multi-scale fusion.
Figure 5.
Improved FPN structure with lightweight SimAM.
In the bottom-up path, also flows downward through another SimAM module to refine . This enriched is then repeatedly fused with SimAM outputs before arriving at . The entire process can be summarized as:
where denotes the lateral fusion with top-down or bottom-up propagation.
By refining features at multiple pyramid junctions, the proposed design improves the interaction between semantic and spatial information with negligible additional computational cost. The resulting feature maps provide richer visual representations for the process feature linear modulation module described in Section 3.4.
3.4. Process Feature Linear Modulation (PFNM)
To incorporate manufacturing process information into visual representation learning, we introduce a Process Feature Linear Modulation (PFNM) module, as illustrated in Figure 6. PFNM is related to existing conditional feature modulation methods, such as FiLM, AdaIN, and conditional normalization, as it also uses auxiliary information to adapt visual feature responses. However, PFNM is specifically designed to use independently available manufacturing process information as the conditioning signal for industrial connector detection. The process semantics are obtained from manufacturing records and task definitions, including assembly stage, process parameter ranges, contact requirements, and environmental conditions. These descriptors are independently available from the manufacturing or assembly process and do not depend on the ground-truth connector category or detection labels. During online operation, the assembly stage and predefined process parameter ranges are retrieved from the current task specification and process-control interface, while environmental conditions are obtained from the corresponding sensors or monitoring systems. The process metadata are updated according to the current assembly state and are provided to PFNM together with the visual input. They provide contextual constraints that guide feature responses under different assembly states.
Figure 6.
Structure of the PFNM module.
The PFNM module contains three components, including a visual feature branch, a process feature branch, and a parameter generation branch. The visual branch receives the multi-scale feature maps produced by the feature pyramid network after SimAM enhancement. Since different pyramid levels have different spatial resolutions and channel dimensions, each feature map is first flattened along the spatial dimension and then projected into the same embedding dimension. The resulting visual embeddings are expressed as:
The process feature branch converts manufacturing information into learnable embeddings. To avoid potential information leakage, the process descriptors used by PFNM are restricted to information that is independently available during inference and is not derived from the ground-truth connector category or detection labels. Specifically, the revised process descriptors include the assembly stage, allowable process parameter ranges, contact requirements, and environmental conditions. These variables are obtained from the corresponding manufacturing records, task specifications, process-control interfaces, and sensing systems. In an online assembly scenario, the assembly stage and allowable process parameter ranges are retrieved from the active task specification or process-control interface, whereas environmental conditions, such as ambient temperature and humidity, are obtained from connected monitoring sensors. The metadata are synchronized with the current assembly state before being encoded for PFNM. If individual process descriptors are temporarily unavailable, the corresponding embedding is initialized as a zero vector, allowing the remaining available process descriptors to continue guiding feature modulation. Categorical variables are encoded into discrete indices, while numerical parameters are normalized before linear projection. After embedding, the process representation is written as:
where denotes the i-th visual embedding and represents the corresponding process embedding.
The visual embedding and the corresponding process embedding are concatenated and projected into a shared feature space. The projection enables the visual appearance and process semantics to be represented in a consistent feature space before adaptive modulation instead of serving as the final feature representation.
where and denote the projection matrix and bias term, respectively, and ‖ represents vector concatenation. This projection provides an intermediate joint representation of visual appearance and process attributes before process-conditioned modulation, rather than directly using feature concatenation as the final detection representation.
The parameter generation branch estimates modulation coefficients according to key process descriptors. Four process variables are selected, including the process identifier , assembly stage encoding , process parameter representation , and environmental representation . During online operation, and are obtained from the active manufacturing task and process-control interface, is retrieved from the corresponding process specification, and is updated from environmental monitoring sensors. These process variables are synchronized with the current assembly state and provided to the parameter generation branch together with the visual features. Here, denotes the identifier of the manufacturing or assembly process rather than the connector category or detection target. It is independently available during inference and does not encode the ground-truth connector category. After embedding, these descriptors are fed into a lightweight multilayer perceptron to predict channel-wise scaling coefficients and shifting coefficients .
where and denote the modulation parameters corresponding to the i-th feature unit.
The generated coefficients are used to adapt the fused feature representation through channel-wise affine transformation:
where ⊙ denotes element-wise multiplication. This affine transformation adaptively adjusts channel responses according to the current process state while preserving the original visual structure. Unlike direct feature concatenation, PFNM keeps the spatial structure unchanged and modulates only channel responses through the learned scaling and shifting coefficients. Thus, process semantics serve as inference-time contextual conditions for adapting visual feature responses rather than as direct target information. Since the modulation parameters are jointly estimated from multiple process descriptors, occasional inaccuracies in individual process variables have limited influence on the overall modulation, enabling PFNM to remain effective under moderate process uncertainty.
To prevent target leakage, the revised PFNM does not use the connector category, ground-truth detection labels, or any process variable derived from them. All process descriptors provided to PFNM are obtained independently from the manufacturing or assembly process and are available at inference time. Therefore, the process information serves only as contextual guidance for visual feature modulation rather than as a direct indication of the target category. This design ensures that the performance improvement of PFNM is attributed to process-aware feature modulation rather than access to target-derived information.
The modulated embeddings are further refined by a lightweight feature modeling module consisting of a self-attention layer and a feed-forward network.
where models inter-feature dependencies and performs nonlinear feature transformation. The output sequence represents the final process-aware embeddings.
Finally, the refined embeddings are reshaped to their corresponding pyramid levels and converted back into multi-scale feature maps:
The generated feature maps preserve the original spatial resolution while introducing process-aware channel responses for the anchor-free detection head. The effectiveness of this process-conditioned design is further evaluated against representative multimodal fusion and conditional modulation methods in Section 4.3.
3.5. Detection Head and Training Strategy
The final stage of the proposed framework adopts an anchor-free detection head based on FCOS. The head takes the multi-scale feature maps generated by the PFNM module as input and predicts the object category, bounding box offsets, and centerness score for every pixel. This design removes the need for predefined anchors and simplifies label assignment. As shown in Figure 7, the head contains three parallel branches for classification, bounding box regression, and centerness estimation. Each branch consists of four convolutional layers followed by normalization and activation.
Figure 7.
Structure of the FCOS detection head.
For a feature level with spatial resolution , the classification branch predicts the probability map where C is the number of connector categories. The regression branch estimates the distances from each pixel to the four sides of the corresponding bounding box:
where represents the pixel coordinate, and are the left, top, right, and bottom distances to the ground truth box. The centerness branch estimates the relative position of each pixel with respect to the object center:
The centerness score suppresses predictions from locations far from the object center and improves confidence estimation during inference.
During training, the classification, regression, and centerness losses are optimized jointly. The overall objective is defined as:
where is the number of positive samples. denotes the focal loss for classification, is the IoU regression loss, and is the binary cross entropy loss for centerness prediction. The coefficients and balance the contributions of different loss terms. Ground truth variables are denoted by .
The learning rate follows a cosine annealing schedule [28] with a warm-up stage to improve optimization stability, and batch normalization statistics are synchronized across GPUs during training. The PFNM module and the detection head are optimized together so that process information is continuously incorporated into feature learning throughout training.
4. Experiments and Discussions
4.1. Experimental Setup
All experiments were performed on a workstation equipped with an NVIDIA RTX 4070 GPU, an Intel i9-14900HX CPU, and 64 GB RAM. The proposed framework was implemented in PyTorch v2.5.1. Model optimization used the AdamW optimizer [29] with an initial learning rate of .
Two datasets were involved in the experiments. The Microsoft COCO Captions dataset [30] was used only for semantic pretraining before the main detection experiments. Since COCO does not provide manufacturing process metadata, it was not used to evaluate the process-aware capability of PFNM. Instead, it was used to establish a general visual-semantic representation space between images and text descriptions. The dataset contains about 330,000 images with more than 1.5 million human-written captions. Approximately 50,000 training images were randomly sampled to preserve semantic diversity while reducing computational cost [31].
The cable connector dataset was collected in an industrial assembly workshop and contains approximately 8000 images covering 12 connector categories, namely C1-2, C1-4, C1-6, C2-2, C2-4, C2-6, C3-2, C3-4, C3-6, C4-2, C4-3, and C4-6. Metadata describing the physical connector instance, production batch, acquisition sequence, and workstation were recorded during data collection to support group-wise dataset partitioning. The number and proportion of samples for each category, together with their distributions across the training, validation, and test sets, are summarized in Table 1. The dataset contains 5600 training images, 1200 validation images, and 1200 test images, corresponding to 70%, 15%, and 15% of the complete dataset, respectively. The number of images per category ranges from 630 to 730, indicating a relatively balanced category distribution. The original images were acquired with varying resolutions rather than a fixed image size. Before being fed into the detection models, all images were resized while preserving their aspect ratios and padded to a unified input size of pixels.
Table 1.
Distribution of the cable connector dataset across 12 connector categories and data subsets.
To prevent potential data leakage, the dataset was partitioned using a group-wise splitting strategy rather than random image-level sampling. Images acquired from the same physical connector, the same production batch, the same image acquisition sequence, or the same workstation were assigned exclusively to either the training, validation, or test subset. Consequently, no physical connector instance or acquisition sequence was shared across different subsets. This protocol prevents the model from observing highly correlated samples during training and testing, resulting in a more rigorous evaluation of its generalization capability. The same fixed data partition was used for all compared methods to ensure consistent and fair evaluation. No cross-validation was performed because a fixed group-wise partition was adopted throughout all experiments to prevent data leakage between the training, validation, and test sets.
Each image contains one connector instance captured against a plain white background without intentional occlusion. All connector instances were manually annotated with bounding boxes and category labels by trained annotators. The annotations were subsequently reviewed to verify the accuracy of object localization and category assignment, and ambiguous samples were rechecked before dataset partitioning. During image acquisition, the illumination conditions, camera-to-object distance, and viewing angle were varied, resulting in changes in the apparent scale and visual appearance of the connectors. In addition, several connector categories exhibit highly similar visual characteristics, which introduces a fine-grained discrimination challenge for the detector. Representative examples of visually similar connector categories are shown in Figure 8. Therefore, the complexity considered in this study mainly arises from variations in industrial imaging conditions and high inter-class visual similarity, rather than cluttered multi-object scenes or severe occlusion.
Figure 8.
Representative examples from the cable connector dataset. The enlarged views illustrate connector categories with highly similar visual characteristics.
Each sample is associated with structured process metadata describing the assembly stage, process parameter ranges, contact requirements, and environmental conditions. These metadata are obtained from manufacturing specifications, production records, process-control interfaces, and environmental monitoring systems rather than from image labels, providing process information that cannot be directly inferred from visual appearance alone. A typical metadata record includes the current assembly stage, target process parameter range, contact requirements, and environmental conditions. For example, “Crimping stage, target crimping height 2.2–2.4 mm, ambient temperature 28 °C, humidity 65%”. During online operation, the metadata corresponding to the current assembly state are retrieved or updated from the process-control system and monitoring sensors and are provided to the PFNM module together with the visual input [32]. The same process metadata are provided to all methods that incorporate process information, including the proposed PFNM and the multimodal fusion baselines. Baseline detectors that do not model process information are trained and evaluated using only visual images to preserve their original architectures.
To ensure a fair comparison, all baseline models and the proposed method were trained using the same data augmentation pipeline and augmentation hyperparameters. The augmentation pipeline included random scaling, translation, HSV-based color augmentation, horizontal flipping, and Mosaic augmentation. Specifically, the scaling, translation, hue, saturation, and value augmentation parameters were set to , , , , and , respectively. Horizontal flipping was applied with a probability of , while Mosaic augmentation was applied with a probability of . Rotation, shear, perspective transformation, vertical flipping, and MixUp were disabled. The same augmentation configuration was applied only to the training set, whereas the validation and test sets were evaluated without data augmentation.
The detection task in this study focuses on connector type identification and object localization rather than the recognition of asymmetric pin numbering or directional pin identities. For example, a C2-6 connector remains in the same C2-6 category regardless of whether it is oriented toward the left or right. Therefore, horizontal flipping changes only the image orientation and does not alter the semantic category of the connector. During horizontal flipping, the corresponding bounding-box coordinates were transformed together with the image, ensuring spatial consistency between the image and its annotations. Thus, horizontal flipping does not introduce label noise or change the ground-truth category labels in the present task.
Detection performance was evaluated using four standard metrics, including Precision, Recall, F1-score, and mean Average Precision (mAP). In this study, mAP refers to the mAP@[0.50:0.95], which is computed by averaging the Average Precision (AP) over IoU thresholds from 0.50 to 0.95 with a step size of 0.05. Precision and Recall are defined as:
where , , and denote true positives, false positives, and false negatives, respectively. The F1-score is the harmonic mean of Precision and Recall and is calculated as:
Detection accuracy is evaluated using mean Average Precision (mAP), following the COCO evaluation protocol. In this study, mAP is calculated by averaging the Average Precision (AP) over N object categories and 10 IoU thresholds ranging from 0.50 to 0.95 with a step size of 0.05:
where denotes the Average Precision for the ith category at the tth IoU threshold. The IoU thresholds are defined as . Therefore, the reported mAP corresponds to mAP@[0.50:0.95]. All evaluation metrics follow the standard COCO evaluation protocol.
4.2. Comparison with State-of-the-Art Methods
To evaluate the proposed PFNM-Enhanced FCOS, we compare it with representative one-stage, two-stage, and transformer-based object detectors, including Faster R-CNN [7], Cascade R-CNN [33], SSD [9], RetinaNet [34], ATSS [35], CenterNet [36], FCOS (Baseline) [11], HRNet-FCOS [37], YOLOv11 [38], RT-DETR [12] and DINO [39]. All competing models were re-trained and evaluated under the same experimental settings, ensuring a fair and reproducible comparison. Table 2 presents a detailed quantitative comparison between the proposed framework and the representative object detection baselines. All reported detection results are presented as mean ± standard deviation over five independent runs.
Table 2.
Performance comparison on COCO and Connector datasets (mean ± standard deviation over five independent runs).
(1) Experiments on the COCO Dataset: The COCO dataset was used to evaluate the general detection performance of the proposed framework after semantic pretraining, rather than to assess its process-aware capability. As shown in Table 2, the proposed method achieves an mAP of 44.1%, compared with 41.7% for the standard FCOS baseline. It also slightly outperforms HRNet-FCOS, which achieves an mAP of 43.6%, DINO, which achieves 44.0%, and RT-DETR, which achieves 43.8%. These results demonstrate that the proposed framework maintains competitive general detection performance on a standard benchmark after semantic pretraining. The process-aware detection capability of PFNM is further evaluated on the Connector dataset, where independently available manufacturing process metadata are provided during both training and inference.
Inference speed reaches 17.6 FPS on an NVIDIA RTX 4070 platform. Specialized real-time architectures provide higher throughput. YOLOv11 operates at 36.8 FPS. RT-DETR achieves 24.7 FPS. The proposed method exceeds the speed of heavier models. DINO runs at 15.4 FPS. HRNet-FCOS runs at 16.8 FPS. The proposed method prioritizes detection accuracy and fine-grained category discrimination rather than maximizing inference throughput. This design is motivated by industrial connector inspection, where false or missed detections may affect subsequent localization and assembly operations.
For a fair end-to-end comparison, each competing detector was implemented using its native architecture rather than replacing its backbone with ConvNeXt V2. This setting reflects the practical performance of each detector under its established architectural design and avoids modifying the original structure of the compared methods. Since the use of different backbones may affect the overall performance, controlled ablation experiments were further conducted within the FCOS framework to separately evaluate the effects of the ConvNeXt V2 backbone, EMA, SimAM, and PFNM modules.
(2) Experiments on the Connector Dataset: Performance improvements become more evident on the connector dataset, where several connector categories exhibit highly similar visual characteristics and fine-grained structural differences. Variations in illumination, viewing angle, and apparent object scale further increase the difficulty of distinguishing visually similar connector types. Our model achieves a mean Average Precision (mAP) of 84.7%. This represents a 5.3 percentage point improvement over the FCOS baseline, which achieves an mAP of 79.4%. The proposed framework achieves an mAP of 84.7% on the Connector dataset, exceeding DINO by 0.7 percentage points. Although the absolute improvement over DINO is relatively modest, the proposed method achieves a consistent advantage across five independent runs, and the improvement is statistically significant according to the paired Student’s t-test (). The detailed statistical significance analysis is presented in Table 3. In addition, the proposed method achieves this improvement with fewer parameters and higher inference speed than DINO, indicating a favorable balance between detection accuracy and computational efficiency. It also achieves a lead of 2.2 points over the highly-optimized real-time detector YOLOv11.
Table 3.
Statistical significance analysis of the proposed method against DINO on the Connector dataset over five independent runs.
An F1-score of 91.8% is recorded. The improved F1-score indicates that process information helps distinguish connector categories sharing similar visual characteristics but different assembly contexts. Integrating procedural semantics with visual feature maps enables the PFNM module to resolve ambiguities. These ambiguities frequently degrade performance in conventional vision-only detectors such as SSD or RetinaNet. The model maintains a parameter count of 45.8 M. This is more efficient than both HRNet-FCOS (47.8 M) and DINO (47.0 M). These observations indicate that process information complements visual appearance and improves feature discrimination for fine-grained connector detection.
A direct comparison with YOLOv11 further illustrates the practical trade-off between detection accuracy and computational efficiency. The proposed model achieves an inference speed of 17.6 FPS with 45.8 M parameters, whereas YOLOv11 reaches 36.8 FPS with 34.5 M parameters. YOLOv11 therefore provides higher computational efficiency and throughput. On the Connector dataset, however, the proposed method achieves a precision of 92.9%, a recall of 90.8%, an F1-score of 91.8%, and an mAP of 84.7%, compared with 91.0%, 89.1%, 90.0%, and 82.5%, respectively, for YOLOv11. The higher detection accuracy demonstrates the benefit of process-aware feature learning for distinguishing visually similar connector categories, although it requires additional computational resources. In industrial assembly scenarios where detection results support subsequent localization and assembly operations, reducing missed and false detections may be more important than maximizing raw throughput. The proposed method is therefore more suitable for accuracy-oriented inspection and assembly applications where moderate inference latency is acceptable, whereas lightweight detectors such as YOLOv11 remain more suitable when high throughput and computational efficiency are the primary requirements.
To further evaluate the generalization capability of the proposed method, an external test set was constructed using connector images collected from an unseen production line that was not included in the training or validation sets. All compared methods were evaluated on this external test set using the same experimental protocol. As shown in Table 4, the proposed method achieves an mAP of 81.8%, compared with 80.2% for DINO, 79.0% for RT-DETR, 78.1% for YOLOv11, 76.9% for HRNet-FCOS, and 74.2% for the FCOS baseline. Although the performance of all methods decreases on the external test set due to the domain shift, the proposed method maintains the highest detection accuracy and a consistent performance advantage over the compared approaches. These results demonstrate that process-aware feature modulation improves the robustness of connector detection under unseen production conditions, supporting the generalization capability of the proposed framework beyond the original test distribution.
Table 4.
Generalization performance on an external connector dataset from an unseen production line. Results are reported as mean ± standard deviation over five independent runs.
To further analyze these improvements, we compare the baseline FCOS with the proposed PFNM-Enhanced FCOS through qualitative visualizations and curve-based evaluations on the Connector dataset. All corresponding results are summarized in Figure 9 and Figure 10, providing an intuitive comparison of the strengths and limitations of both approaches.
Figure 9.
Comparison of detection results on the connector dataset. (a) Visual comparison of detection results, where the left image shows the baseline output and the right image shows the proposed method. (b) Visual comparison of detection results, where the left image shows the YOLOv11 output and the right image shows the DINO method. (c) Local enlarged views of two pairs of highly similar connector categories: C1-4/C1-6 (left) and C2-4/C2-6 (right), with detection results from YOLOv11, DINO, and the proposed method. (d) P—recall rate curves for both methods, with the baseline curve on the left and the proposed curve on the right. (e) R—recall rate curves for both methods, similarly presented with the baseline on the left and the proposed approach on the right.
Figure 10.
Comparative evaluation of the baseline FCOS and the proposed PFNM-Enhanced FCOS method. (a) Normalized confusion matrices produced by the baseline detector and the proposed model. (b) Result index curves of the baseline approach compared with those of the PFNM-enhanced architecture. (c) Detection accuracy trends over 20 independent runs with mean ± standard deviation (left) and the corresponding FPS curves (right) for the baseline and the proposed methods.
Qualitative results from Figure 9a show clear differences. The baseline FCOS model produces less stable confidence estimates for several connector targets. Example detections show low or fluctuating confidence values, such as 0.3, 0.4, and 0.5. Some bounding boxes also demonstrate slight misalignment. This occurs under conditions like minor occlusion or areas with similar local textures. In comparison, the PFNM-Enhanced FCOS model generates predictions with uniformly high confidence. Most scores approach the maximum value of 1.0. The predicted bounding boxes align more precisely with actual object boundaries. Furthermore, the model successfully suppresses false detections. These are typically triggered by reflective materials or repetitive background patterns. This visual evidence supports the quantitative performance improvements. It confirms that integrating process-aware semantic cues enhances detection stability and fine-grained recognition.
Figure 9b presents visual comparisons with two representative state-of-the-art detectors, YOLOv11 and DINO. Both methods successfully detect most connector instances, but occasional differences in localization and confidence are observed for connector categories with highly similar visual characteristics. These results further illustrate the challenges of fine-grained connector detection.
Figure 9c provides local enlarged views of two representative pairs of highly similar connector categories, C1-4/C1-6 and C2-4/C2-6. The side-by-side comparisons show differences in classification confidence and bounding-box localization among YOLOv11, DINO, and the proposed method. The proposed method provides more reliable classification and more precise localization in these challenging cases, further supporting its fine-grained detection capability.
The curve comparisons in Figure 9d,e provide additional insight into how the two detectors respond as the decision threshold varies. The precision trend in Figure 9d shows a clearer drop in false positives for our model, particularly in the high-confidence regime where the baseline frequently misclassifies connectors with similar external appearance. This behavior suggests that process-aware feature modulation reduces ambiguity among connector categories with similar visual appearance. The ConvNeXt V2 backbone further improves multi-scale feature representation. Similarly, the recall curve in Figure 9e indicates that the proposed detector retrieves a larger portion of true targets without a corresponding rise in erroneous detections. Process-aware information helps the model maintain more reliable decision boundaries and prevents typical confusion cases that arise in industrial settings.
To better understand the classification behavior of different detectors, Figure 10a presents the normalized confusion matrices obtained by the baseline FCOS and the proposed PFNM-Enhanced FCOS. The baseline model exhibits noticeable misclassifications among connector categories with highly similar geometric outlines and surface textures, particularly for variants belonging to the same connector family. These confusions indicate the limitation of relying solely on visual cues when discriminating fine-grained industrial components. In contrast, the proposed method yields a more concentrated diagonal distribution, accompanied by a clear reduction of off-diagonal responses. The confusion matrix shows fewer misclassifications between connector categories with similar appearance, indicating that process information provides complementary cues beyond visual features. As a result, the proposed model demonstrates improved category separability and enhanced robustness against visually induced ambiguities.
Figure 10b presents the training and validation curves of the baseline FCOS and the proposed PFNM-Enhanced FCOS over the entire training process. The first six subplots correspond to the training and validation losses, including box regression loss, classification loss, and distribution focal loss, while the remaining four subplots report the detection metrics, namely Precision, Recall, mAP@0.5, and mAP@[0.50:0.95], as functions of the training epoch. Compared with the baseline, the proposed method converges more smoothly and achieves consistently lower validation losses together with higher Precision, Recall, mAP@0.5, and mAP@[0.50:0.95] throughout training. These observations indicate that the proposed process-aware feature modulation not only improves the final detection accuracy but also leads to a more stable optimization process. Finally, Figure 10c presents the detection accuracy trends over twenty independent runs with mean ± standard deviation. The proposed detector consistently achieves higher detection accuracy with smaller variation across repeated experiments, indicating stable performance under the same evaluation protocol.
4.3. Comparison with Multimodal Fusion and Conditional Modulation Baselines
Since the proposed PFNM incorporates target-independent process information, additional comparisons were conducted with representative multimodal fusion and conditional modulation strategies using the same process metadata. This experiment evaluates whether the performance improvement results from the proposed process-aware modulation design rather than simply from introducing additional process metadata.
Six multimodal fusion and conditional modulation strategies were implemented within the same FCOS framework, including Feature Concatenation, Late Fusion, Cross-Attention Fusion, AdaIN Modulation, Conditional Normalization, and FiLM Modulation. To ensure a fair comparison, all methods used the same ConvNeXt V2 backbone, detection head, training protocol, optimization settings, and target-independent process descriptors. Only the fusion or modulation module was replaced across different configurations.
Table 5 presents the results on the Connector dataset. All multimodal fusion and conditional modulation baselines outperform the image-only FCOS baseline reported in Table 2, indicating that process information provides complementary contextual cues for connector detection. Feature Concatenation, Late Fusion, Cross-Attention Fusion, AdaIN Modulation, and Conditional Normalization achieve mAP values of 81.1%, 81.8%, 83.5%, 82.7%, and 83.1%, respectively. FiLM Modulation achieves an mAP of 84.1% and an F1-score of 91.2%.
Table 5.
Comparison with multimodal fusion and conditional modulation baselines on the Connector dataset.
The proposed PFNM achieves the best overall performance, with 92.9% Precision, 90.8% Recall, 91.8% F1-score, and 84.7% mAP. Compared with Feature Concatenation, Late Fusion, Cross-Attention Fusion, AdaIN Modulation, Conditional Normalization, and FiLM Modulation, PFNM improves the mAP by 3.6, 2.9, 1.2, 2.0, 1.6, and 0.6 percentage points, respectively. These results indicate that the performance gain of PFNM is not solely attributable to the use of additional process metadata. Instead, the proposed process-aware modulation design provides more effective integration of process semantics with visual representations than the compared fusion and conditional modulation strategies.
4.4. Robustness to Imperfect Process Metadata
In practical industrial assembly systems, process metadata may be incomplete, noisy, delayed, or incorrectly recorded. To evaluate the robustness of the proposed PFNM to such imperfections, additional experiments were conducted under four metadata conditions: missing, noisy, delayed, and incorrectly recorded metadata. The visual inputs and detection model were kept unchanged, while only the process metadata provided to PFNM were modified.
In the proposed system, process metadata are collected from manufacturing records, task specifications, and sensors available at the assembly workstation. The assembly stage is obtained from the predefined task sequence, process parameters from the corresponding process specifications, contact requirements from predefined assembly constraints, and environmental conditions such as temperature and humidity from workspace sensors. Before inference, these metadata are retrieved according to the current process identifier and synchronized with the image acquisition time, after which they are provided to PFNM together with the corresponding visual input. To simulate imperfect metadata, randomly selected fields were masked and replaced with a learned mask embedding for the missing condition; Gaussian noise was added to numerical parameters and a small proportion of categorical variables were randomly perturbed for the noisy condition; metadata from the preceding acquisition step were used for the delayed condition; and metadata from another sample were randomly assigned to the current image for the incorrectly recorded condition. The connector category and ground-truth detection labels were excluded from all process metadata. The results are summarized in Table 6.
Table 6.
Robustness of the proposed PFNM-enhanced FCOS to imperfect process metadata on the Connector dataset.
The proposed method maintains relatively stable performance under all four imperfect metadata conditions. With complete metadata, the model achieves an mAP of 84.7%. The mAP decreases to 83.5%, 83.9%, 83.7%, and 83.2% under missing, noisy, delayed, and incorrectly recorded metadata, corresponding to reductions of 1.2, 0.8, 1.0, and 1.5 percentage points, respectively. The model therefore maintains an mAP above 83% under all tested conditions. These results indicate that PFNM can still exploit useful visual representations when process information is partially corrupted or temporally misaligned, although maintaining correct correspondence between process metadata and the current assembly task is particularly important. In practical deployment, reliable process-data interfaces and sensor monitoring are therefore required to ensure timely and accurate metadata acquisition.
4.5. Ablation Study
To quantify the individual contribution of each component, controlled ablation experiments were conducted by evaluating the ConvNeXt V2 backbone, EMA, SimAM, and PFNM both independently and in combination within the FCOS framework. All configurations were trained and evaluated on the Connector dataset under identical experimental settings. For the PFNM-based configurations, the connector category and quality labels were excluded from the process descriptors, and only target-independent process information was used, including the process identifier , assembly stage, process parameter ranges, and environmental conditions. The results are summarized in Table 7.
Table 7.
Ablation study of the proposed PFNM-enhanced FCOS on the Connector dataset.
(1) Effect of Backbone: The transition from the traditional ResNet-50 to the ConvNeXt V2 backbone establishes a stronger baseline for feature extraction. Replacing the backbone improves the mAP from 79.4% to 81.6% (+2.2%), with notable gains in Precision and Recall. Although the increased model capacity leads to a higher parameter count (41.3 M) and a corresponding decrease in inference speed from 28.5 to 21.2 FPS, it provides richer feature representations for connector structures with subtle appearance differences.
(2) Effect of EMA: When introduced independently into the ConvNeXt V2 baseline, the EMA module improves the mAP from 81.6% to 82.9% and the F1-score from 88.5% to 89.7%. The parameter count increases only slightly from 41.3 M to 42.0 M, while the inference speed decreases from 21.2 to 19.8 FPS. These results demonstrate that EMA independently improves feature representation and detection performance with a relatively small increase in computational cost.
(3) Effect of SimAM: When introduced independently into the ConvNeXt V2 baseline, SimAM improves the mAP from 81.6% to 82.5% and the F1-score from 88.5% to 89.2%. Since SimAM does not introduce additional learnable parameters, the parameter count remains unchanged at 41.3 M, while the inference speed decreases slightly from 21.2 to 20.9 FPS. These results confirm that SimAM independently contributes to the detection performance by enhancing feature discrimination with negligible parameter overhead.
(4) Effect of PFNM: When introduced independently into the ConvNeXt V2 baseline using only target-independent process descriptors, PFNM improves the mAP from 81.6% to 82.9% and the Precision from 89.6% to 90.7%. This improvement indicates that process information provides complementary contextual cues beyond visual appearance for connector detection. PFNM performs channel-wise feature modulation according to process descriptors, enabling the visual representation to incorporate information related to the current assembly context. Importantly, the connector category and quality labels are not provided as PFNM inputs, ensuring that the observed performance gain does not result from target-derived information. From a computational perspective, PFNM increases the parameter count from 41.3 M to 44.5 M and the FLOPs from 181.4 G to 187.2 G, while the inference latency increases from 47.2 ms to 53.8 ms and the peak GPU memory from 3.8 GB to 4.0 GB, as shown in Table 8. These results indicate that PFNM introduces a moderate computational overhead while providing complementary process-aware information for connector detection.
Table 8.
Computational complexity analysis of different model configurations on the Connector dataset.
(5) Effect of Combined Modules: The complete model, which combines EMA, SimAM, and the revised PFNM with the ConvNeXt V2 backbone, achieves the best performance, reaching 92.9% Precision, 90.8% Recall, 91.8% F1-score, and 84.7% mAP. Compared with the ConvNeXt V2 baseline, the complete configuration improves the mAP by 3.1 percentage points. The revised PFNM uses only target-independent process information and does not receive the connector category or quality labels as inputs. The results of the individual and combined configurations show that each module contributes to detection performance, while their combination yields further gains. As shown in Table 8, the complete model requires 45.8 M parameters and 187.3 G FLOPs, with an average inference latency of 56.8 ms and peak GPU memory consumption of 4.2 GB, indicating a moderate computational cost for the achieved accuracy improvement. This suggests that the three modules provide complementary rather than redundant improvements to the detector.
4.6. Discussion
The experimental results indicate that process information provides complementary cues for industrial connector detection when visual appearance alone cannot fully distinguish different connector categories. Unlike conventional feature fusion, the proposed framework introduces manufacturing information through channel-wise modulation instead of direct feature concatenation. This design preserves the original spatial representation while allowing process metadata to adaptively adjust channel responses according to the current assembly state. The quantitative and qualitative results show that this strategy is particularly effective for connector categories with similar geometry, illumination variation, viewing-angle variation, differences in apparent target scale, and high inter-class visual similarity. These observations explain the improved detection performance under practical assembly conditions.
The ablation study explains the role of each module. ConvNeXt V2, EMA, and SimAM improve feature representation and multi-scale feature aggregation, whereas PFNM contributes complementary process information that cannot be obtained from visual appearance alone. Structured process metadata, including assembly stage, process parameter ranges, and environmental conditions, are converted into adaptive modulation coefficients that guide feature learning. Process information therefore serves as conditional guidance instead of replacing visual features. This mechanism explains the larger improvement for connector categories with highly similar visual characteristics. The observations are consistent with previous studies showing that contextual information benefits visual representation learning [25,40], while extending contextual information from visual scenes to manufacturing processes.
The proposed framework also illustrates that industrial object detection differs from general object detection because industrial production tasks involve process constraints in addition to visual information. Incorporating these constraints into feature learning improves feature discrimination without modifying the overall anchor-free detection framework. Since PFNM is implemented as a lightweight modulation module, it can be integrated into existing convolution-based detectors with limited architectural changes, making the method suitable for industrial inspection and robotic assembly applications where structured process records are available. The consistent performance across five independent runs, together with the statistically significant improvement over DINO and the results on an unseen production line, further supports the reliability and generalization capability of the proposed framework.
Several limitations remain. The effectiveness of PFNM depends on the completeness and consistency of process annotations, and performance may decrease when process records are incomplete or inaccurate. The current evaluation is limited to cable connector datasets with predefined process descriptions, and additional validation on more diverse industrial products and production environments is still required. Future work will investigate more adaptive process representation learning, visual and process feature interaction [41], and cross-modal attention mechanisms [42] to further improve generalization across industrial scenarios.
5. Conclusions
This paper investigated whether incorporating manufacturing process semantics into visual feature learning can improve cable connector detection in industrial environments where visually similar components are difficult to distinguish. To address this problem, a PFNM-enhanced FCOS framework was developed by combining ConvNeXt V2, EMA, SimAM, and Process Feature Linear Modulation. Instead of directly concatenating process information with visual features, PFNM introduces process descriptors through channel-wise modulation, allowing manufacturing information to guide feature learning while preserving the original spatial representation. Experimental results on the COCO dataset and the custom cable connector dataset indicate that this strategy improves detection performance and provides more reliable predictions in industrial assembly scenarios.
The proposed framework demonstrates that structured manufacturing information can complement visual appearance during feature learning. Process metadata, including assembly stage, process parameter ranges, and environmental information, provide additional constraints for distinguishing connector categories with similar visual characteristics. Since PFNM is implemented as a lightweight modulation module, it can be integrated into existing anchor-free detection frameworks with limited architectural modification, making it suitable for industrial inspection and robotic assembly applications.
Several limitations should be acknowledged. The proposed framework depends on the completeness and consistency of process annotations, and detection performance may decrease when process information is incomplete or inaccurate. The current evaluation focuses on cable connector datasets with predefined process descriptions, and further validation on more diverse industrial products and production environments is still required. In addition, the present framework is limited to static image detection and does not consider temporal information or multimodal perception. Due to confidentiality constraints, the experimental dataset, process annotations, source code, and trained models cannot currently be made publicly available, which may limit the full reproducibility of the reported experiments.
Future work will investigate self-supervised process representation learning to reduce annotation requirements, more adaptive interaction between visual and process features, and cross-modal perception frameworks. Evaluation on larger industrial datasets and robotic assembly systems will further assess the generalization ability of the proposed framework. This study provides a practical reference for integrating manufacturing process information with visual representation learning and offers a useful basis for future research on industrial object detection.
Author Contributions
Conceptualization, Z.W. and X.T.; methodology, Z.W. and X.T.; software, Z.W., Y.C., F.Y. and L.M.; validation, A.G. and E.G.; formal analysis, Z.W.; investigation, Z.W., Y.C., F.Y. and L.M.; resources, A.G. and E.G.; data curation, Y.C., F.Y. and L.M.; writing—original draft preparation, Z.W.; writing—review and editing, X.T., Y.B., A.G. and E.G.; supervision, X.T. and Y.B.; project administration, X.T. and Y.B.; funding acquisition, X.T. All authors have read and agreed to the published version of the manuscript.
Funding
This research was funded by the National Natural Science Foundation of China, Grant No. 52175484, and the China Scholarship Council, Grant No. 202406290079.
Data Availability Statement
The experimental dataset and process annotations used in this study are not publicly available due to confidentiality constraints. The source code and trained models are also not currently available for public release for the same reason.
Acknowledgments
The authors would like to thank all members of the research group for their valuable discussions and technical support during the experiments.
Conflicts of Interest
The authors declare no conflicts of interest.
References
- Xue, C.; Zhu, J.; Cao, H.; Gu, Y.; Chen, S. INFO-RF-based fault diagnosis and analysis method for busbars. Sci. Rep. 2025, 15, 23502. [Google Scholar] [CrossRef] [Scilit] [PubMed]
- Jiao, Q.; Qian, Z.; Dong, Y.; He, B. Hybrid feature-based machine vision method for objective evaluation of textile pilling and fuzzing. PLoS ONE 2025, 20, e0329814. [Google Scholar] [CrossRef] [Scilit]
- De Las Morenas, J.; Moya-Fernández, F.; López-Gómez, J.A. The edge application of machine learning techniques for fault diagnosis in electrical machines. Sensors 2023, 23, 2649. [Google Scholar] [CrossRef] [Scilit] [PubMed]
- Araya-Martinez, J.M.; Matthiesen, V.S.; Bøgh, S.; Lambrecht, J.; Pimentel De Figueiredo, R. A fast monocular 6D pose estimation method for textureless objects based on perceptual hashing and template matching. Front. Robot. AI 2025, 11, 1424036. [Google Scholar] [CrossRef] [Scilit] [PubMed]
- Wang, C.; Zheng, B.; Li, C. Efficient traffic sign recognition using YOLO for intelligent transport systems. Sci. Rep. 2025, 15, 13657. [Google Scholar] [CrossRef] [Scilit] [PubMed]
- Rao, J.; Qiao, Y.; Ren, F.; Wang, J.; Du, Q. A mobile outdoor augmented reality method combining deep learning object detection and spatial relationships for geovisualization. Sensors 2017, 17, 1951. [Google Scholar] [CrossRef] [Scilit] [PubMed]
- Ren, S.; He, K.; Girshick, R.; Sun, J. Faster R-CNN: Towards real-time object detection with region proposal networks. IEEE Trans. Pattern Anal. Mach. Intell. 2016, 39, 1137–1149. [Google Scholar] [CrossRef] [Scilit] [PubMed]
- He, K.; Gkioxari, G.; Dollár, P.; Girshick, R. Mask R-CNN. In Proceedings of the 2017 IEEE International Conference on Computer Vision (ICCV), Venice, Italy, 22–29 October 2017; pp. 2980–2988. [Google Scholar] [CrossRef] [Scilit]
- Liu, W.; Anguelov, D.; Erhan, D.; Szegedy, C.; Reed, S.; Fu, C.Y.; Berg, A.C. Ssd: Single shot multibox detector. In Proceedings of the European Conference on Computer Vision; Springer: Berlin/Heidelberg, Germany, 2016; pp. 21–37. [Google Scholar] [CrossRef] [Scilit]
- Redmon, J.; Divvala, S.; Girshick, R.; Farhadi, A. You Only Look Once: Unified, Real-Time Object Detection. In Proceedings of the 2016 IEEE Conference on Computer Vision and Pattern Recognition (CVPR), Las Vegas, NV, USA, 27–30 June 2016; pp. 779–788. [Google Scholar] [CrossRef] [Scilit]
- Tian, Z.; Shen, C.; Chen, H.; Tong, H. FCOS: Fully Convolutional One-Stage Object Detection. In Proceedings of the 2019 IEEE/CVF International Conference on Computer Vision (ICCV), Seoul, Republic of Korea, 27 October–2 November 2019; pp. 9626–9635. [Google Scholar] [CrossRef] [Scilit]
- Yu, C.; Chen, X. Railway rutting defects detection based on improved RT-DETR. J. Real-Time Image Process. 2024, 21, 146. [Google Scholar] [CrossRef] [Scilit]
- Liu, Z.; Mao, H.; Wu, C.Y.; Feichtenhofer, C.; Darrell, T.; Xie, S. A ConvNet for the 2020s. In Proceedings of the 2022 IEEE/CVF Conference on Computer Vision and Pattern Recognition (CVPR), New Orleans, LA, USA, 18–24 June 2022; pp. 11966–11976. [Google Scholar] [CrossRef] [Scilit]
- Huo, X.; Zhang, Y.; Wu, S. Semi-supervised class-conditional image synthesis with Semantics-guided Adaptive Feature Transforms. Pattern Recognit. 2024, 146, 110022. [Google Scholar] [CrossRef] [Scilit]
- Xia, K.; Lv, Z.; Zhou, C.; Gu, G.; Zhao, Z.; Liu, K.; Li, Z. Mixed receptive fields augmented YOLO with multi-path spatial pyramid pooling for steel surface defect detection. Sensors 2023, 23, 5114. [Google Scholar] [CrossRef] [Scilit] [PubMed]
- Li, J.; Li, K.; Zhang, G.; Wang, J.; Li, K.; Yang, Y. Recognition of dorsal hand vein in small-scale sample database based on fusion of ResNet and HOG feature. Electronics 2022, 11, 2698. [Google Scholar] [CrossRef] [Scilit]
- Ye, X.; Li, Z.; Xu, C. Ghost-free multi-exposure image fusion technology based on the multi-scale block LBP operator. Electronics 2022, 11, 3129. [Google Scholar] [CrossRef] [Scilit]
- Stephen, O.; Madanian, S.; Nguyen, M. A hard voting policy-driven deep learning architectural ensemble strategy for industrial products defect recognition and classification. Sensors 2022, 22, 7846. [Google Scholar] [CrossRef] [Scilit] [PubMed]
- Yang, L.; Honarvar Shakibaei Asli, B. MSConv-YOLO: An improved small target detection algorithm based on YOLOv8. J. Imaging 2025, 11, 285. [Google Scholar] [CrossRef] [Scilit] [PubMed]
- Khan, A.A.; Nauman, M.A.; Shoaib, M.; Jahangir, R.; Alroobaea, R.; Alsafyani, M.; Binmahfoudh, A.; Wechtaisong, C. Crowd anomaly detection in video frames using fine-tuned AlexNet model. Electronics 2022, 11, 3105. [Google Scholar] [CrossRef] [Scilit]
- Zou, J.; Guo, W.; Wang, F. A study on pavement classification and recognition based on VGGNet-16 transfer learning. Electronics 2023, 12, 3370. [Google Scholar] [CrossRef] [Scilit]
- Szegedy, C.; Liu, W.; Jia, Y.; Sermanet, P.; Reed, S.; Anguelov, D.; Erhan, D.; Vanhoucke, V.; Rabinovich, A. Going deeper with convolutions. In Proceedings of the IEEE Conference on Computer Vision and Pattern Recognition, Boston, MA, USA, 7–12 June 2015; pp. 1–9. [Google Scholar] [CrossRef] [Scilit]
- Dentamaro, V.; Giglio, P.; Impedovo, D.; Moretti, L.; Pirlo, G. AUCO ResNet: An end-to-end network for COVID-19 pre-screening from cough and breath. Pattern Recognit. 2022, 127, 108656. [Google Scholar] [CrossRef] [Scilit] [PubMed]
- Islam Sajol, M.S.; M Jahid Hasan, A.S.; Islam, M.S.; Rahman, M.S. A ConvNeXt V2 approach to document image analysis: Enhancing high-accuracy classification. In Proceedings of the 2024 IEEE 3rd Conference on Information Technology and Data Science (CITDS), Debrecen, Hungary, 26–28 August 2024; pp. 1–6. [Google Scholar] [CrossRef] [Scilit]
- Sun, H.; Fu, R.; Kang, D.K. LigTomDet: Knowledge distillation in a new lightweight tomato disease detection model in planting fields. Pattern Recognit. 2026, 172, 112628. [Google Scholar] [CrossRef] [Scilit]
- Ouyang, D.; He, S.; Zhang, G.; Luo, M.; Guo, H.; Zhan, J.; Huang, Z. Efficient multi-scale attention module with cross-spatial learning. In Proceedings of the ICASSP 2023–2023 IEEE International Conference on Acoustics, Speech and Signal Processing (ICASSP); IEEE: New York, NT, USA, 2023; pp. 1–5. [Google Scholar] [CrossRef] [Scilit]
- Yang, L.; Zhang, R.Y.; Li, L.; Xie, X. Simam: A simple, parameter-free attention module for convolutional neural networks. In Proceedings of the International Conference on Machine Learning; PMLR: Cambridge, MA, USA, 2021; pp. 11863–11874. [Google Scholar]
- Zhang, C.; Shao, Y.; Sun, H.; Xing, L.; Zhao, Q.; Zhang, L. The WuC-Adam algorithm based on joint improvement of Warmup and cosine annealing algorithms. Math. Biosci. Eng. 2024, 21, 1270–1285. [Google Scholar] [CrossRef] [Scilit] [PubMed]
- Zhou, P.; Xie, X.; Lin, Z.; Yan, S. Towards understanding convergence and generalization of AdamW. IEEE Trans. Pattern Anal. Mach. Intell. 2024, 46, 6486–6493. [Google Scholar] [CrossRef] [Scilit] [PubMed]
- Chun, S.; Kim, W.; Park, S.; Chang, M.; Oh, S.J. Eccv caption: Correcting false negatives by collecting machine-and-human-verified image-caption associations for ms-coco. In Proceedings of the European Conference on Computer Vision; Springer: Berlin/Heidelberg, Germany, 2022; pp. 1–19. [Google Scholar] [CrossRef] [Scilit]
- Gomez-Villa, A.; Martín, A.; Vazquez-Corral, J.; Bertalmío, M.; Malo, J. On the synthesis of visual illusions using deep generative models. J. Vis. 2022, 22, 2. [Google Scholar] [CrossRef] [Scilit] [PubMed]
- Wang, B.; Wang, Y.; Chu, Y.; Zhang, K.; Liu, L.; Zhang, K.; Zhu, B.; Wang, D.; Jiang, T. AbVLM-Q: Intelligent quality assessment for abdominal ultrasound standard planes via vision-language modeling. BMC Med. Imaging 2025, 25, 344. [Google Scholar] [CrossRef] [Scilit] [PubMed]
- Zhu, Y.; Ma, C.; Du, J. Rotated cascade R-CNN: A shape robust detector with coordinate regression. Pattern Recognit. 2019, 96, 106964. [Google Scholar] [CrossRef] [Scilit]
- Peng, H.; Li, Z.; Zhou, Z.; Shao, Y. Weed detection in paddy field using an improved RetinaNet network. Comput. Electron. Agric. 2022, 199, 107179. [Google Scholar] [CrossRef] [Scilit]
- Zhu, M.; Hu, G.; Li, S.; Zhou, H.; Wang, S.; Feng, Z. A novel anchor-free method based on FCOS+ ATSS for ship detection in SAR images. Remote Sens. 2022, 14, 2034. [Google Scholar] [CrossRef] [Scilit]
- Mao, Y.; Zheng, S.; Li, L.; Shi, R.; An, X. Research on rail surface defect detection based on improved CenterNet. Electronics 2024, 13, 3580. [Google Scholar] [CrossRef] [Scilit]
- Sun, K.; Xiao, B.; Liu, D.; Wang, J. Deep high-resolution representation learning for human pose estimation. In Proceedings of the IEEE/CVF Conference on Computer Vision and Pattern Recognition, Long Beach, CA, USA, 15–20 June 2019; pp. 5693–5703. [Google Scholar] [CrossRef] [Scilit]
- He, L.H.; Zhou, Y.z.; Liu, L.; Cao, W.; Ma, J.H. Research on object detection and recognition in remote sensing images based on YOLOv11. Sci. Rep. 2025, 15, 14032. [Google Scholar] [CrossRef] [Scilit] [PubMed]
- Li, F.; Zhang, H.; Xu, H.; Liu, S.; Zhang, L.; Ni, L.M.; Shum, H.Y. Mask dino: Towards a unified transformer-based framework for object detection and segmentation. In Proceedings of the IEEE/CVF Conference on Computer Vision and Pattern Recognition, Vancouver, BC, Canada, 17–24 June 2023; pp. 3041–3050. [Google Scholar] [CrossRef] [Scilit]
- Wei, X.S.; Xie, C.W.; Wu, J.; Shen, C. Mask-CNN: Localizing parts and selecting descriptors for fine-grained bird species categorization. Pattern Recognit. 2018, 76, 704–714. [Google Scholar] [CrossRef] [Scilit]
- Wu, H.; Li, B.; Tian, L.; Feng, J.; Dong, C. An adaptive loss weighting multi-task network with attention-guide proposal generation for small size defect inspection. Vis. Comput. 2024, 40, 681–698. [Google Scholar] [CrossRef] [Scilit]
- Lee, S.; Park, J.; Park, J. CrossFormer: Cross-guided attention for multi-modal object detection. Pattern Recognit. Lett. 2024, 179, 144–150. [Google Scholar] [CrossRef] [Scilit]
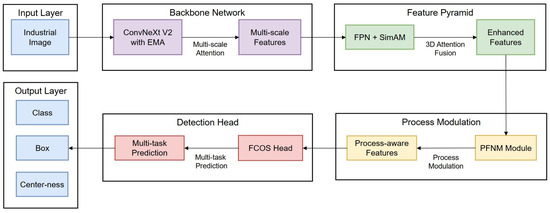
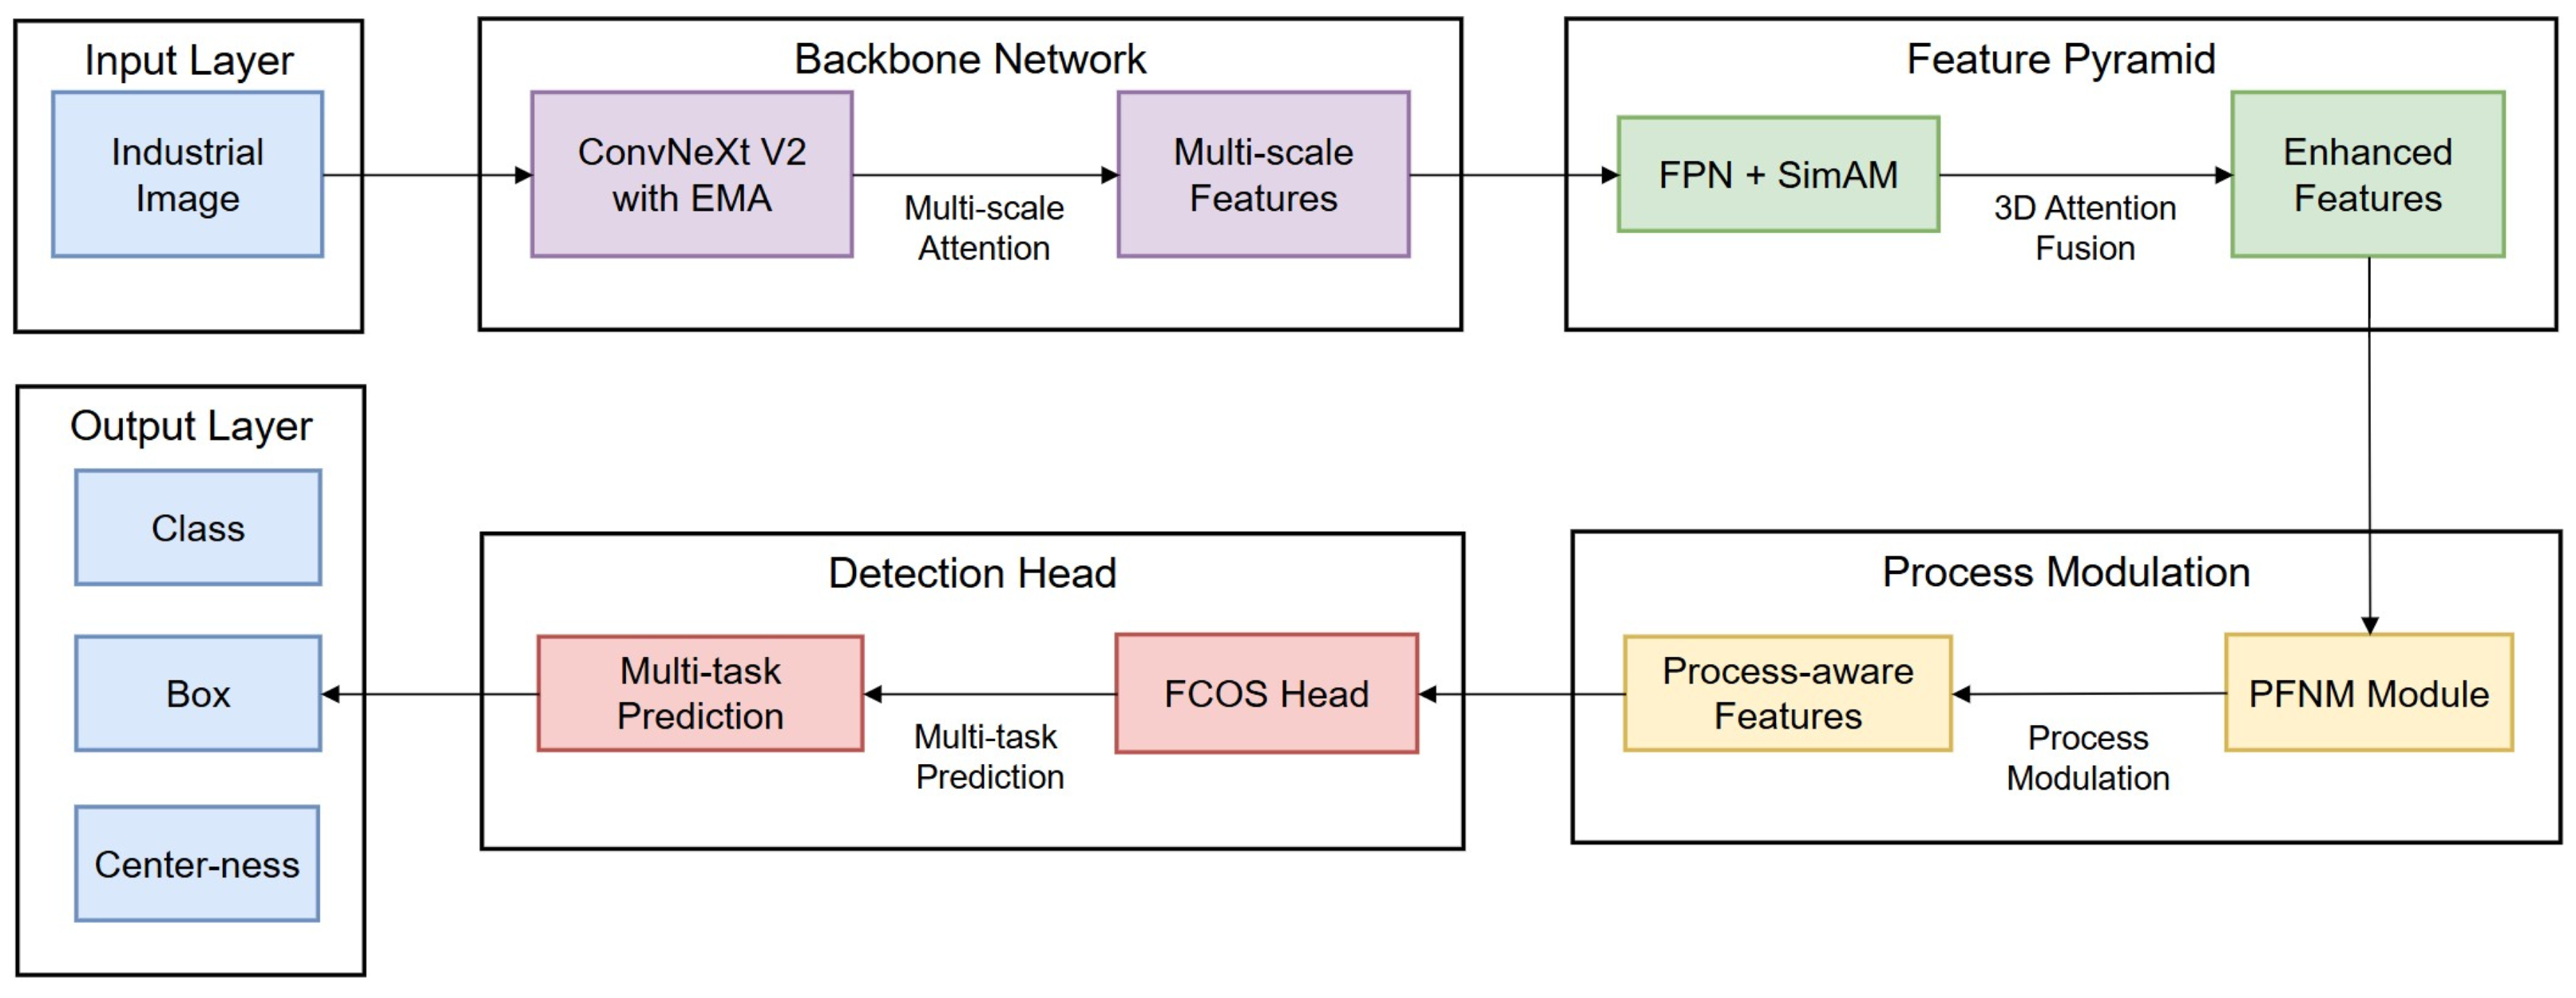
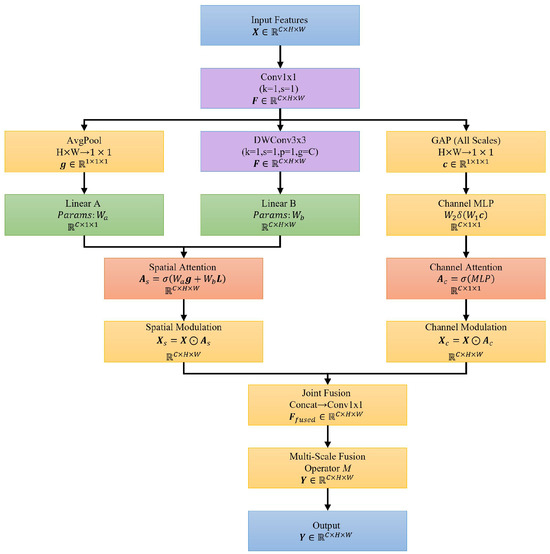
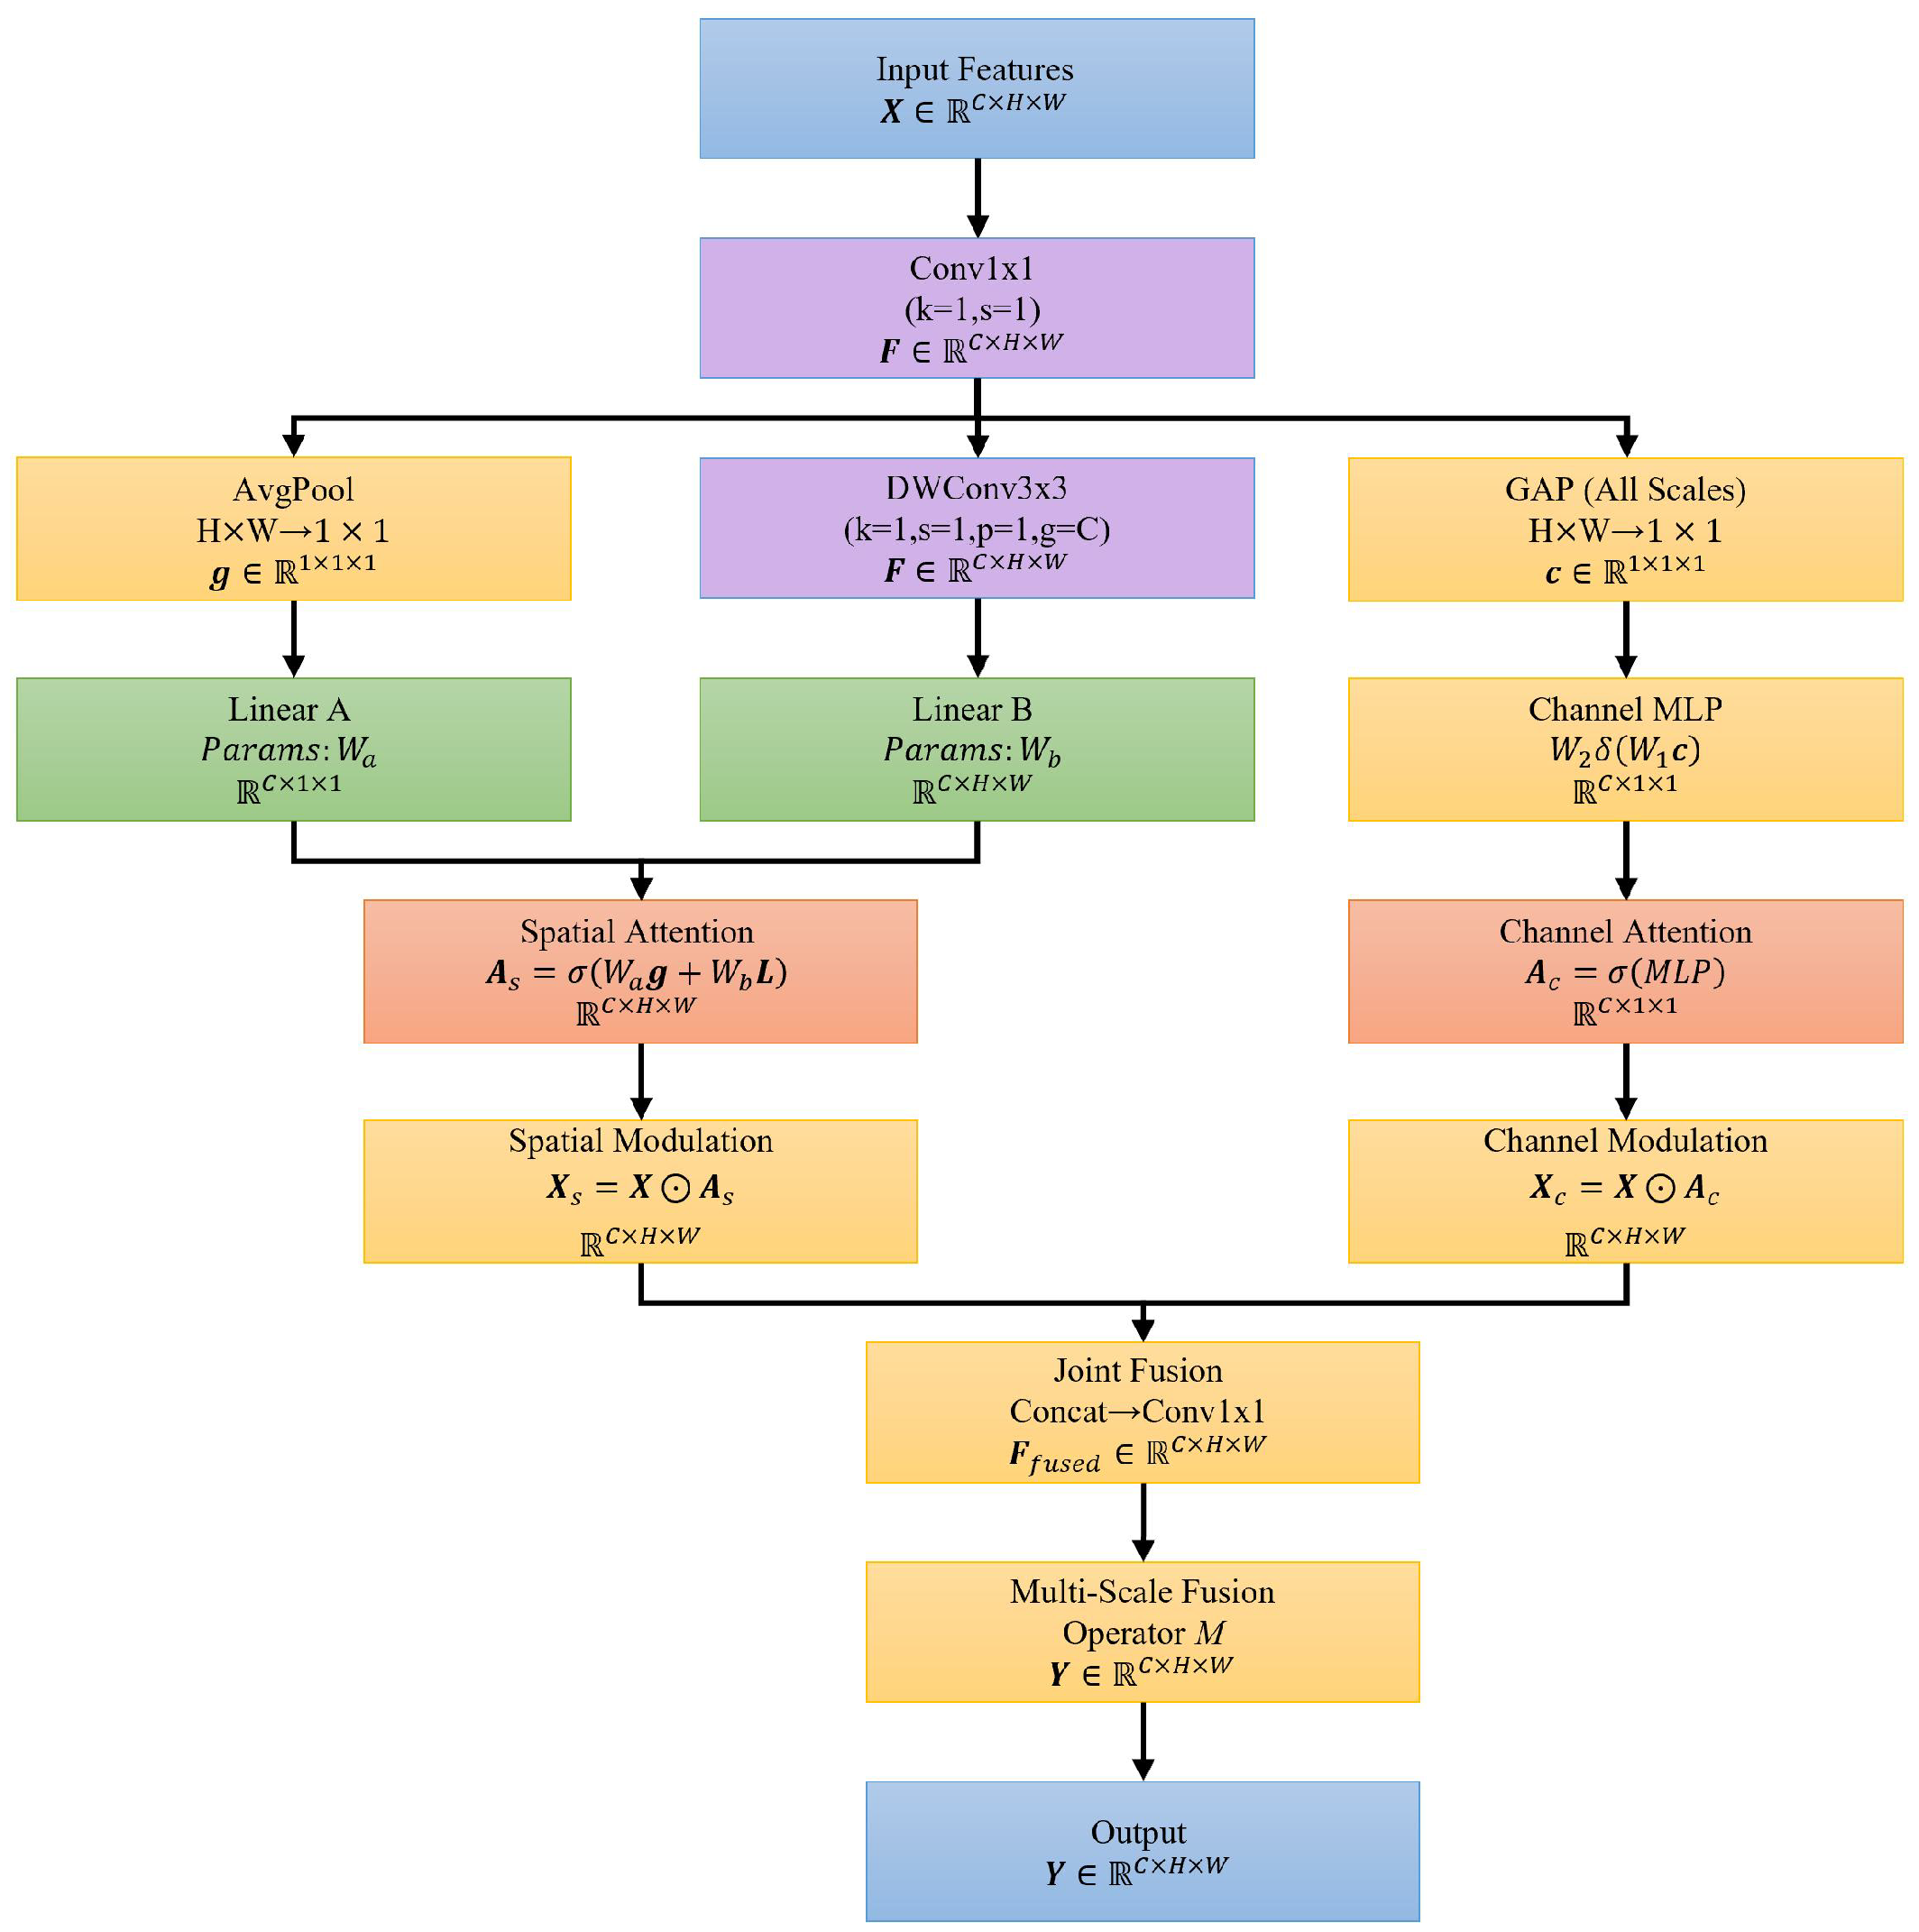
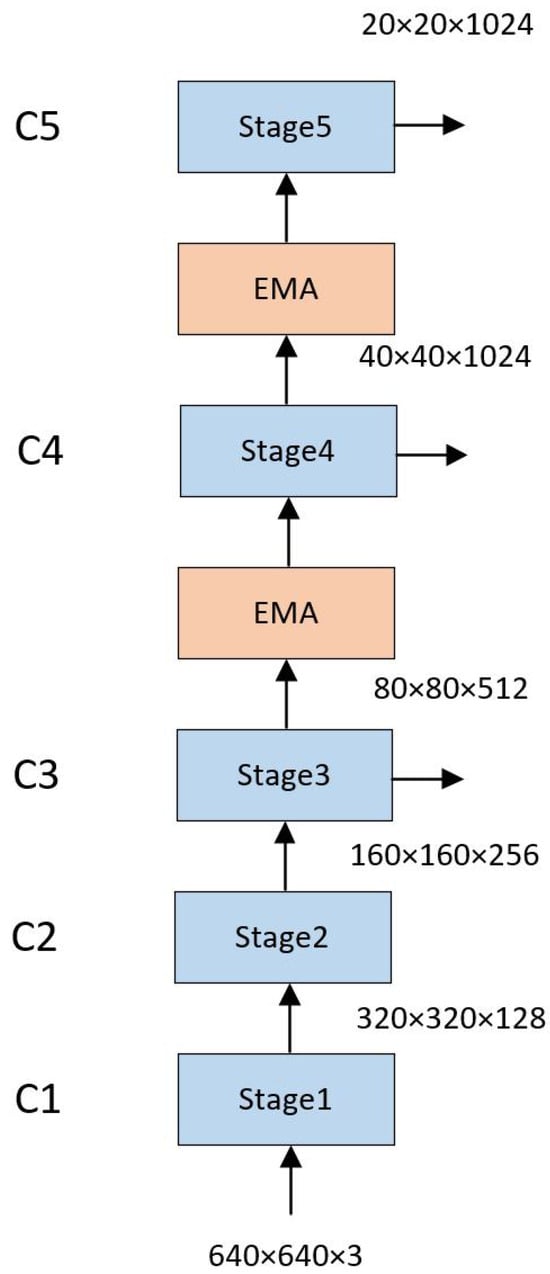
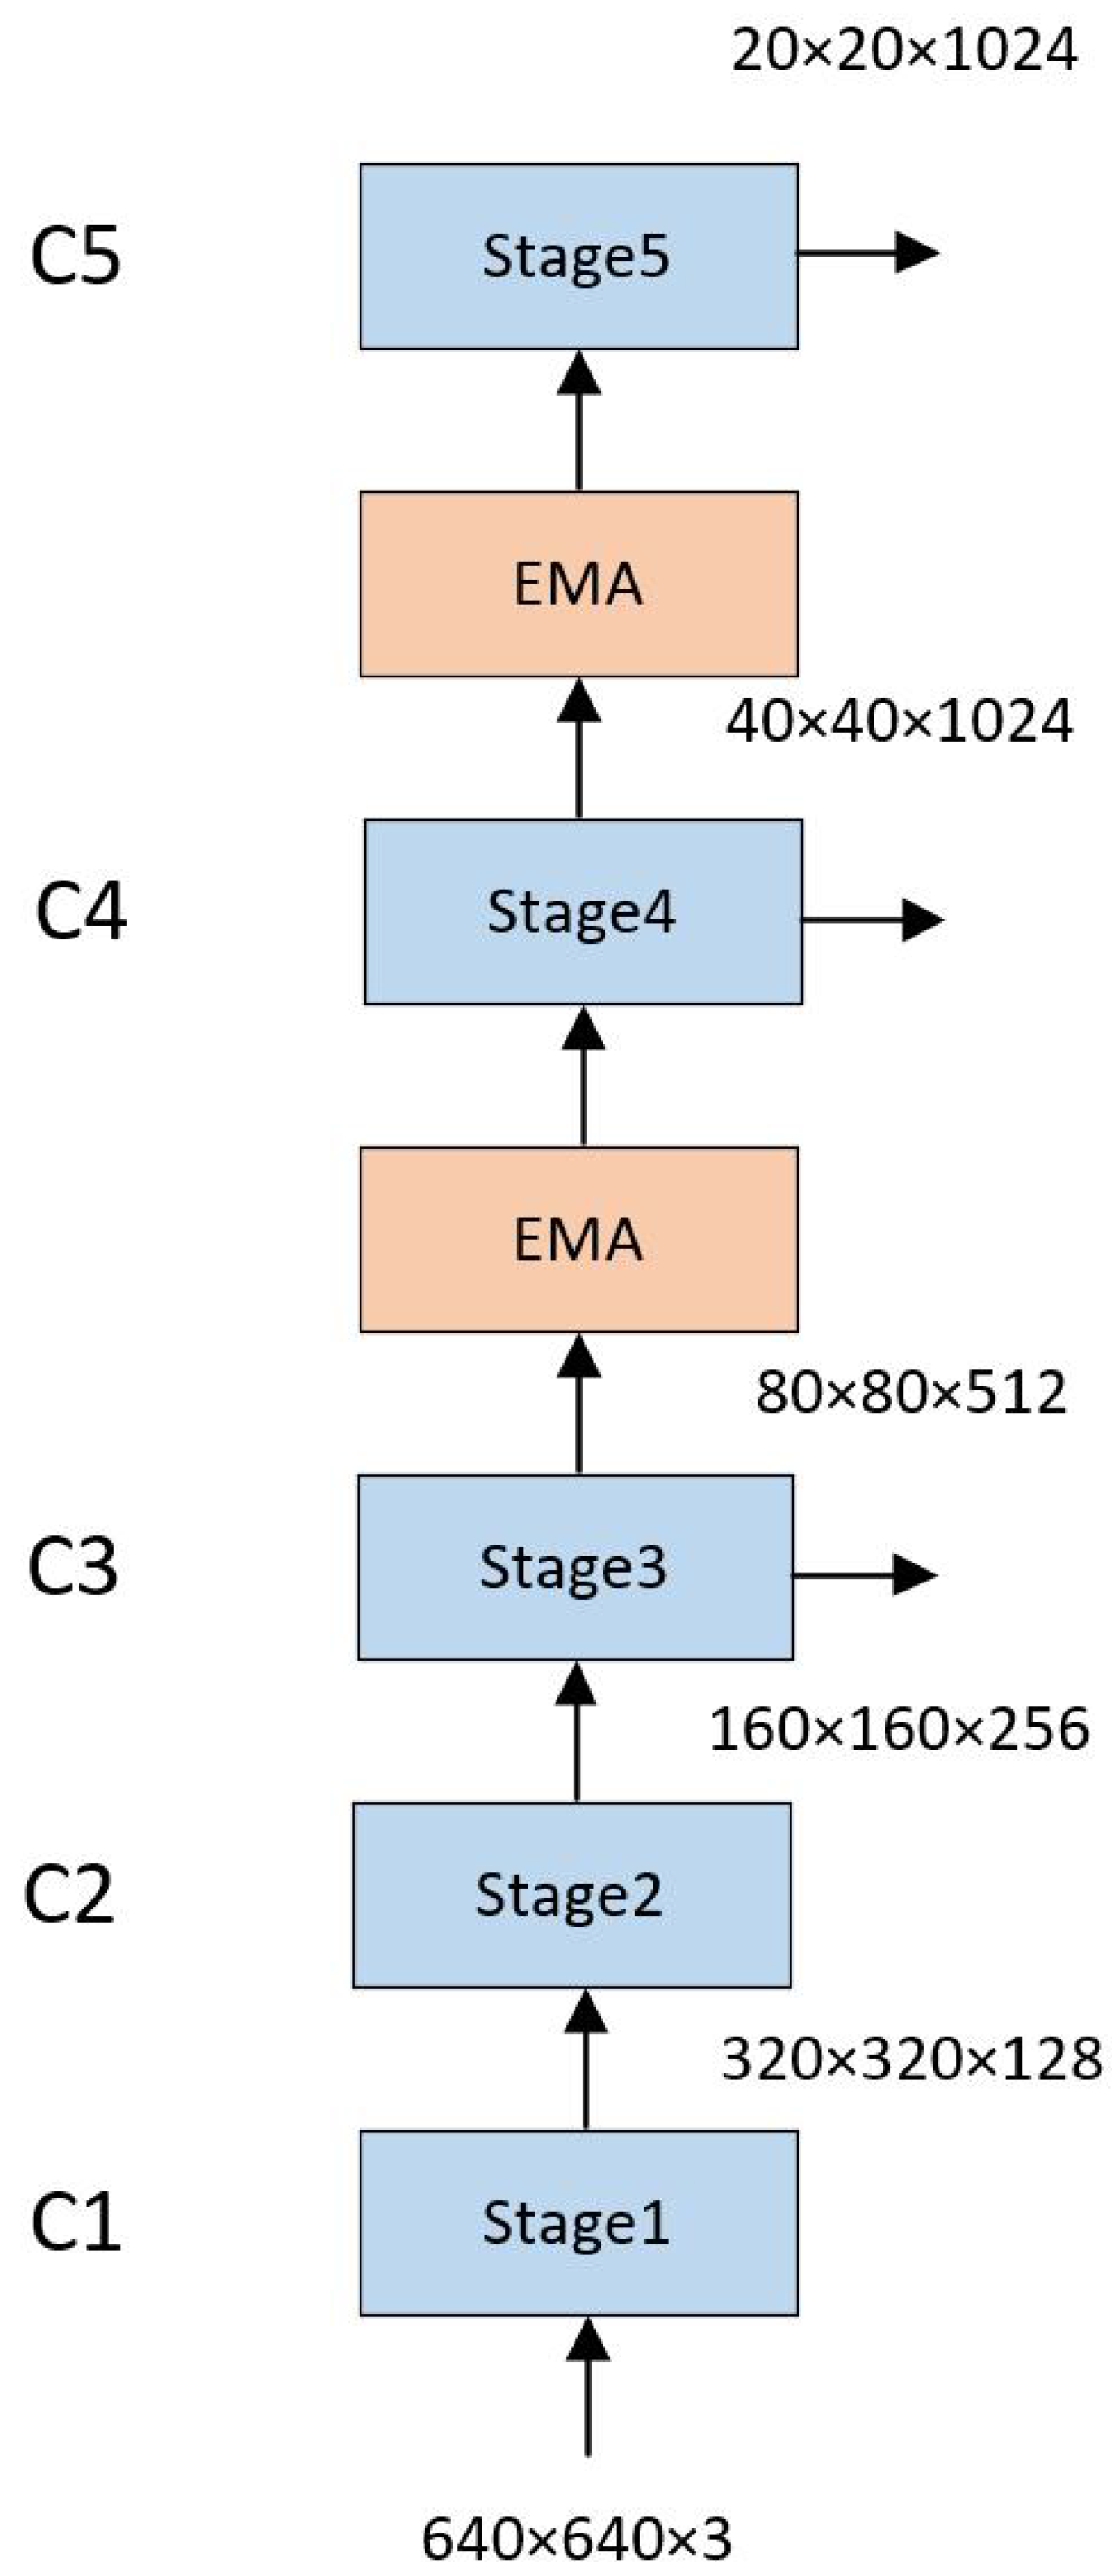
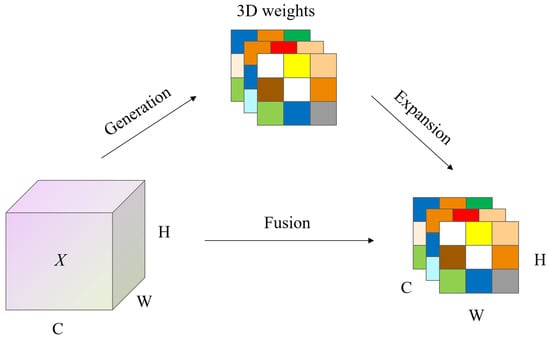
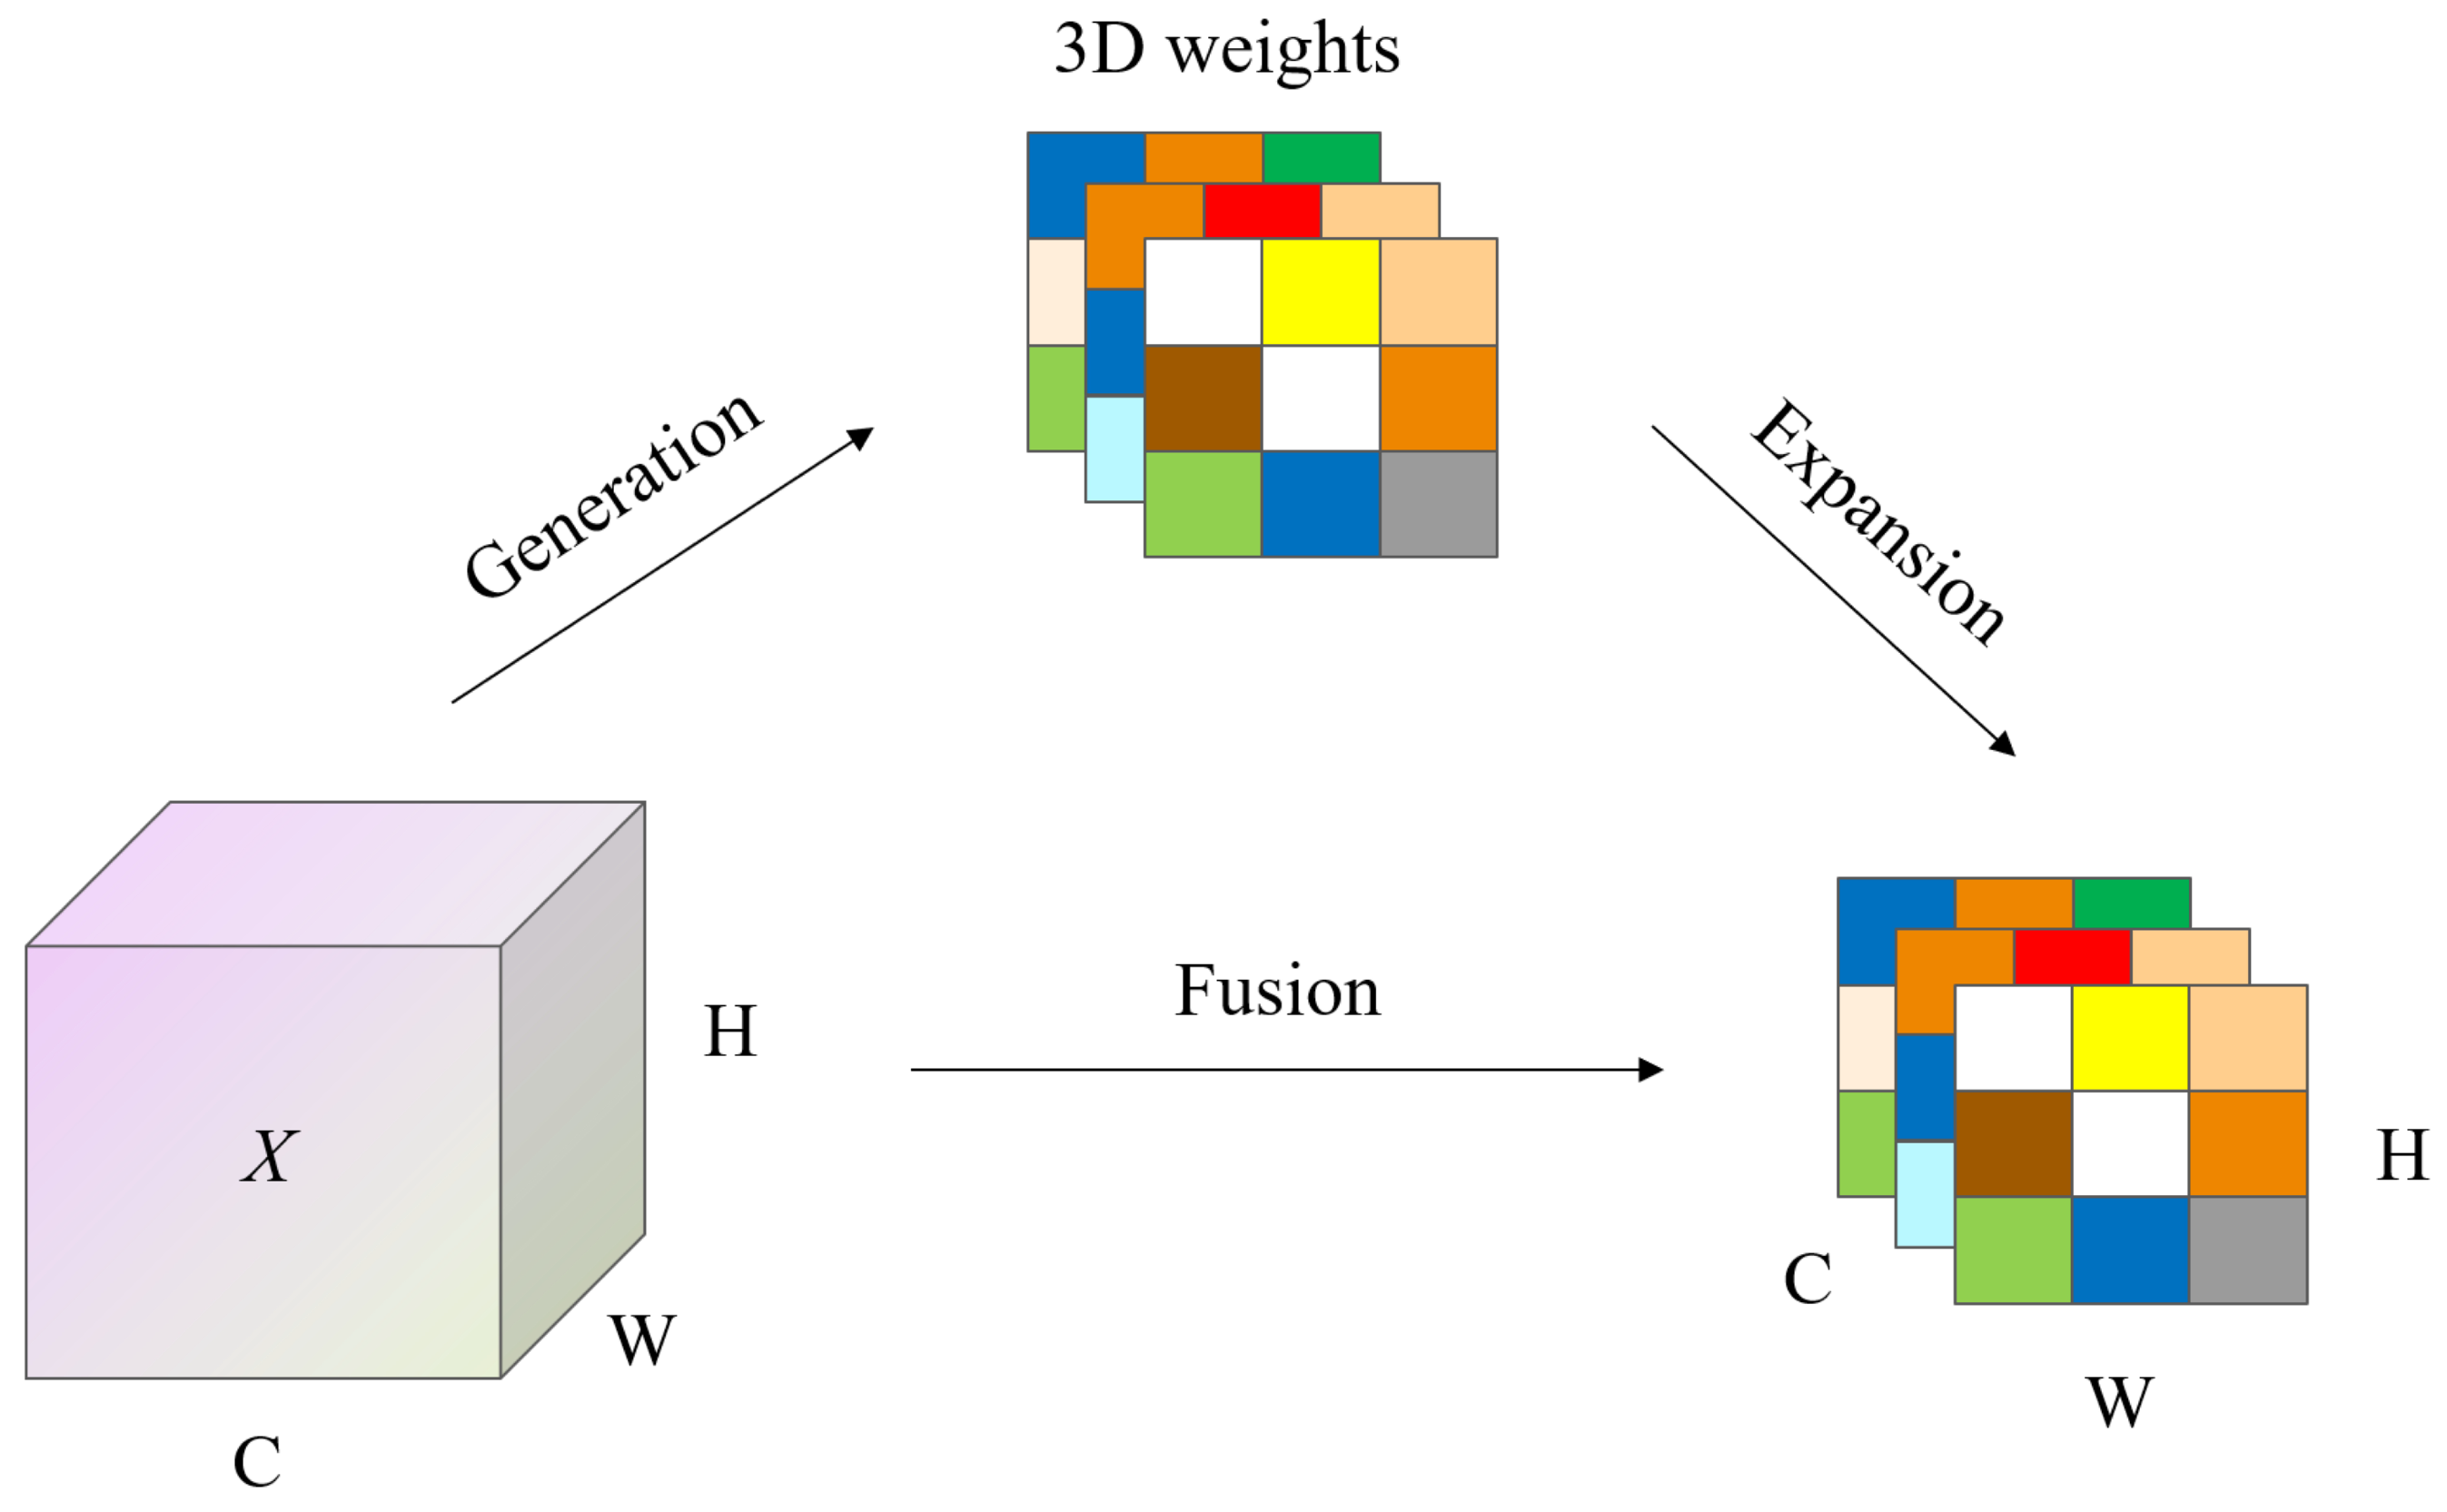
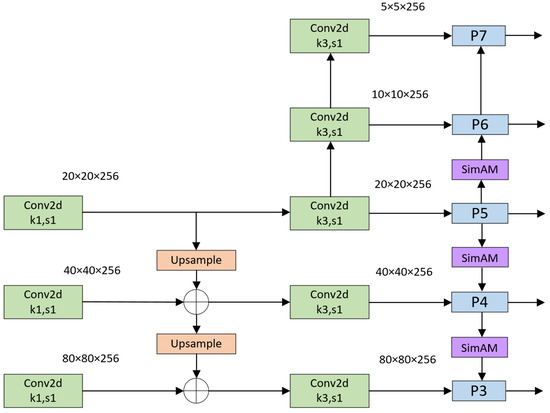
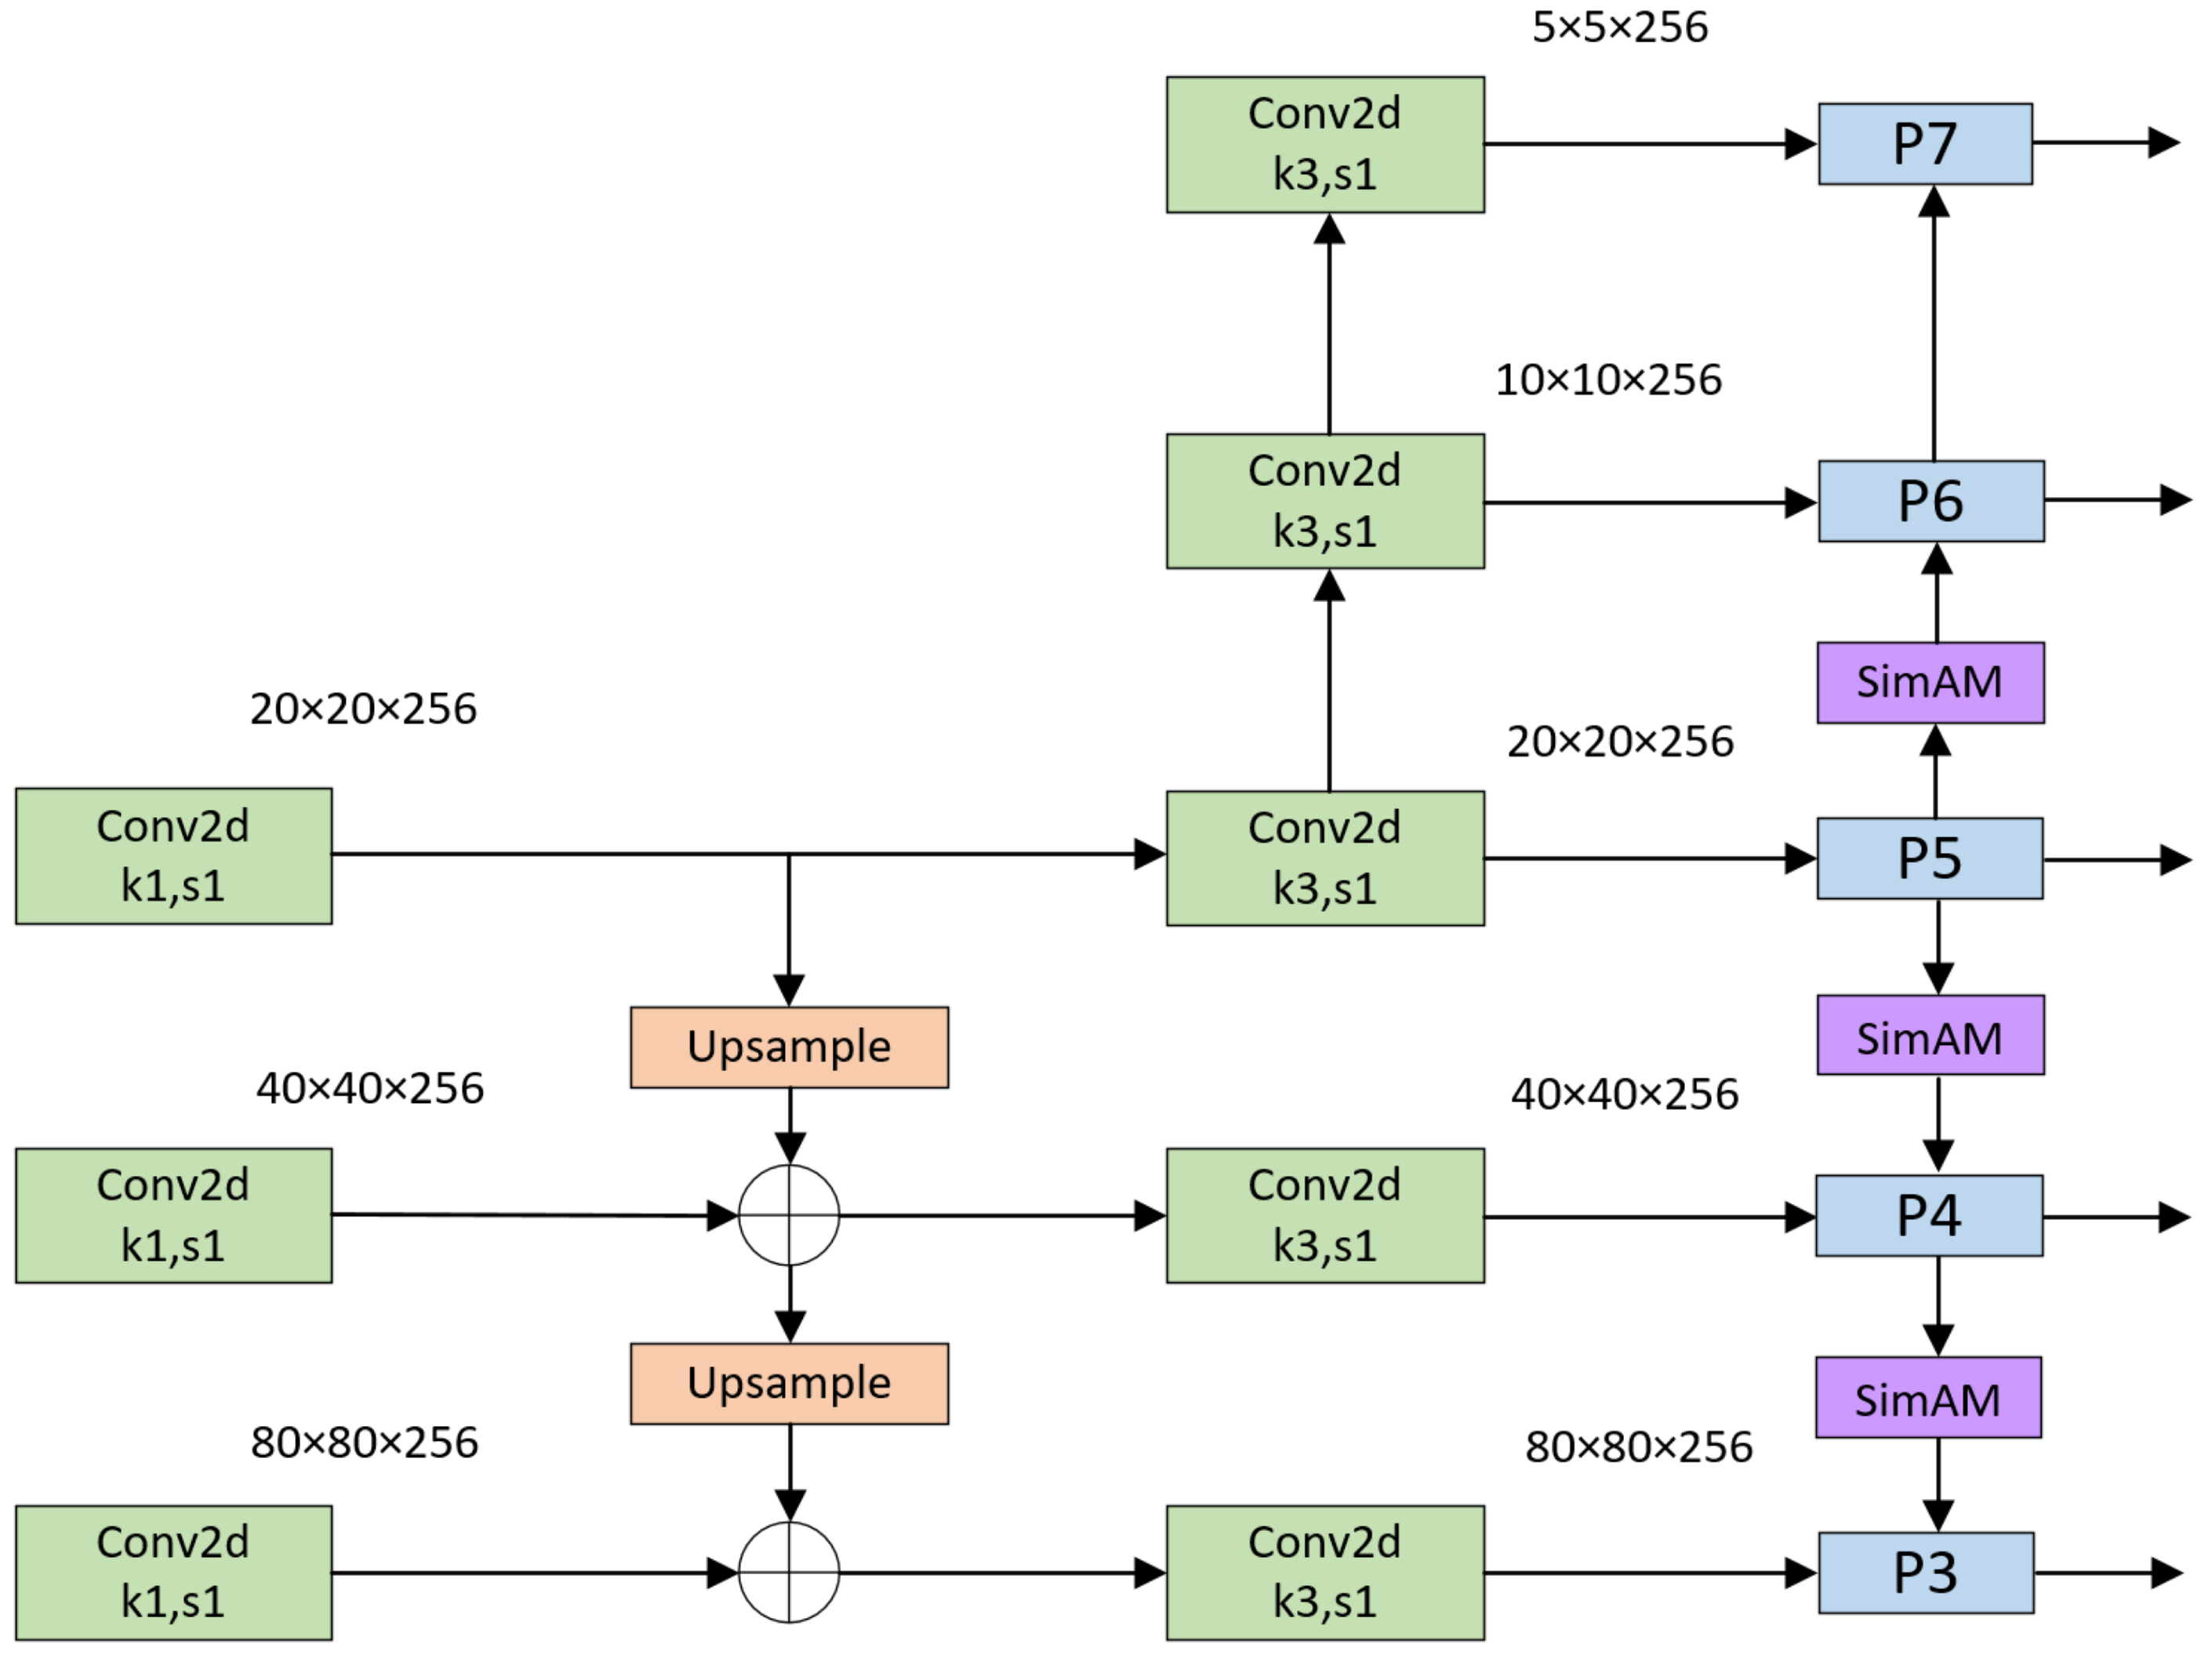
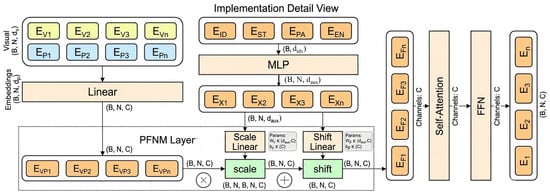
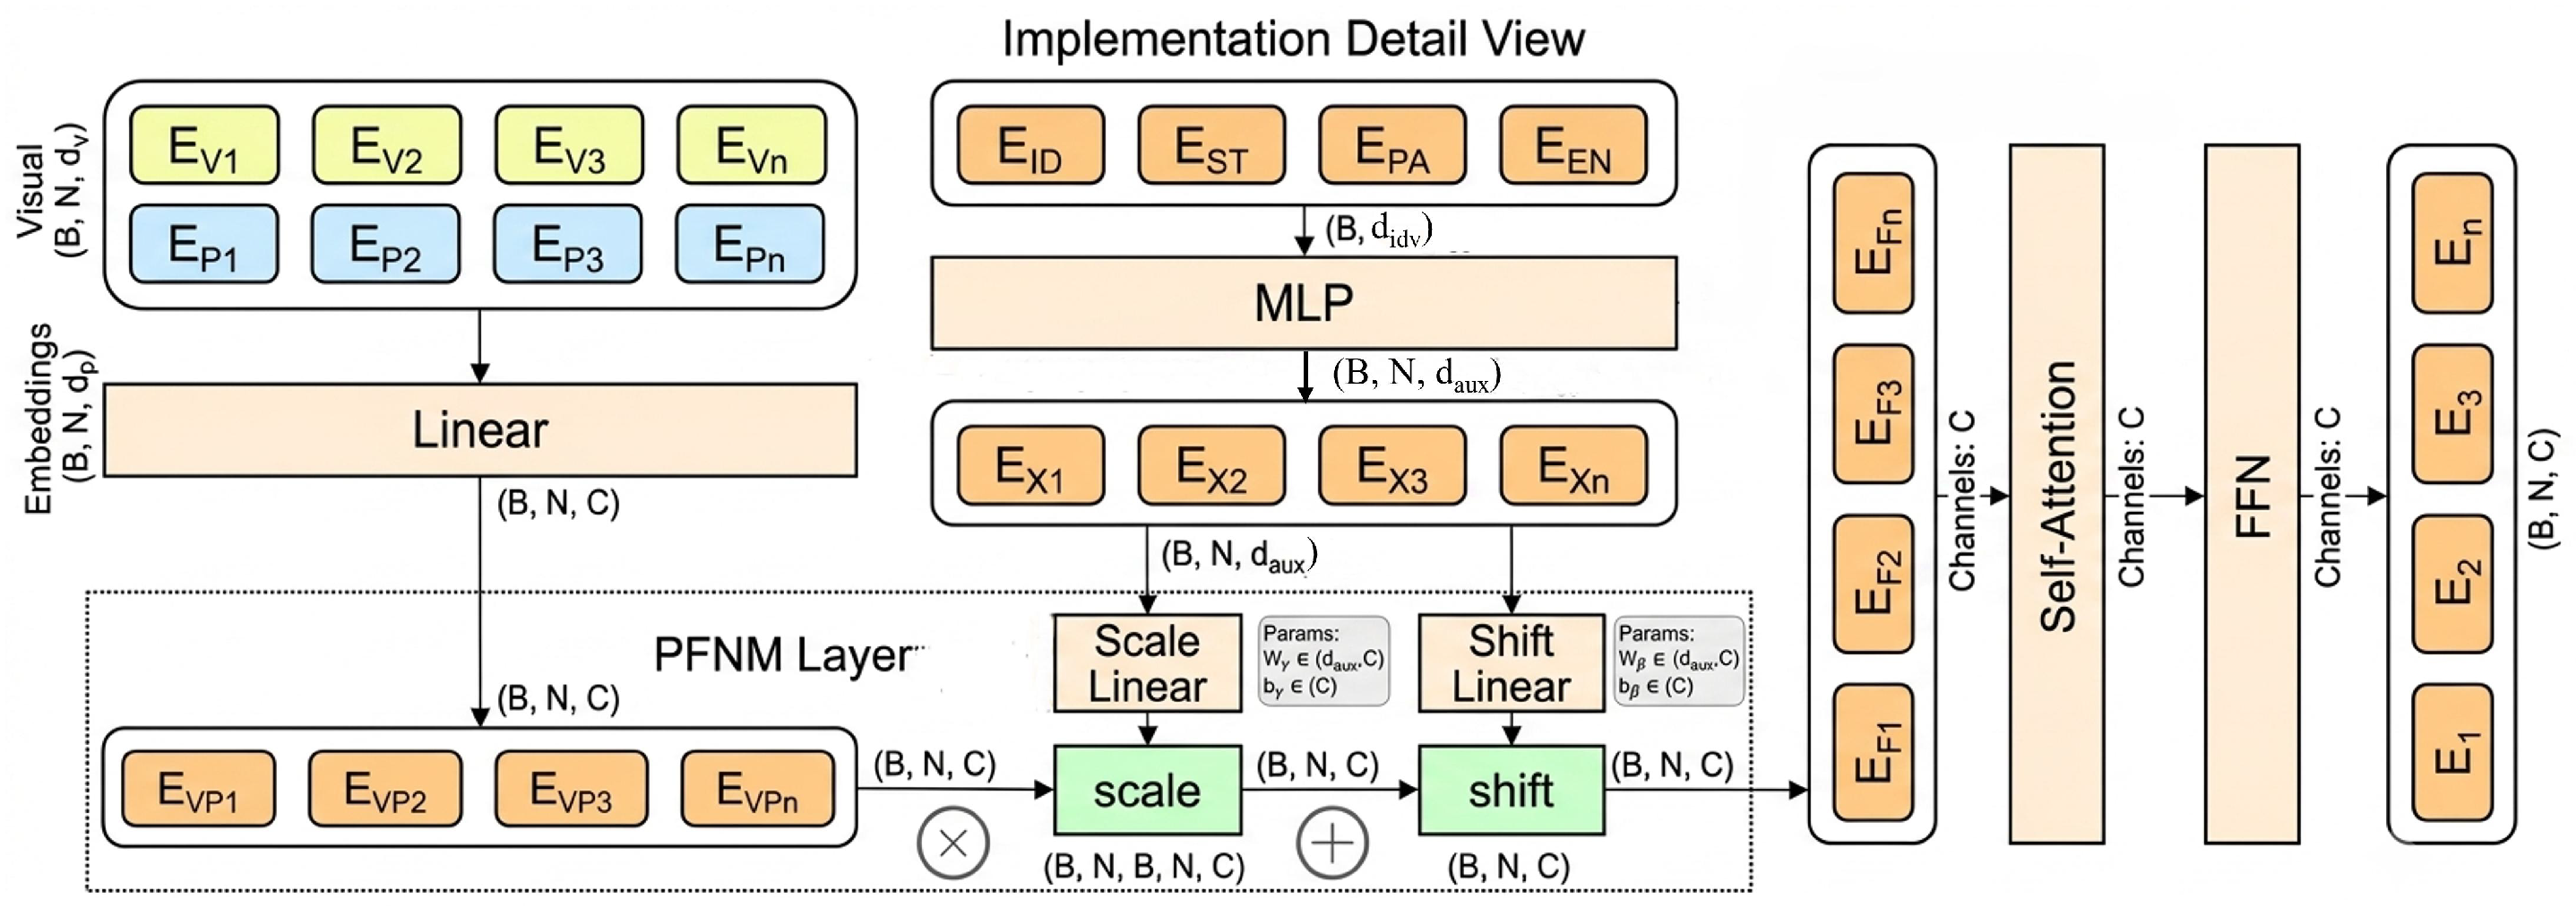
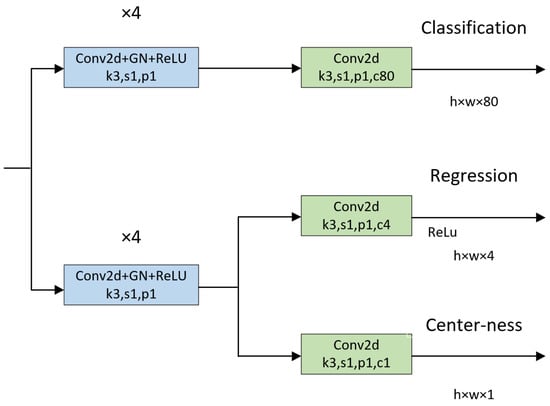
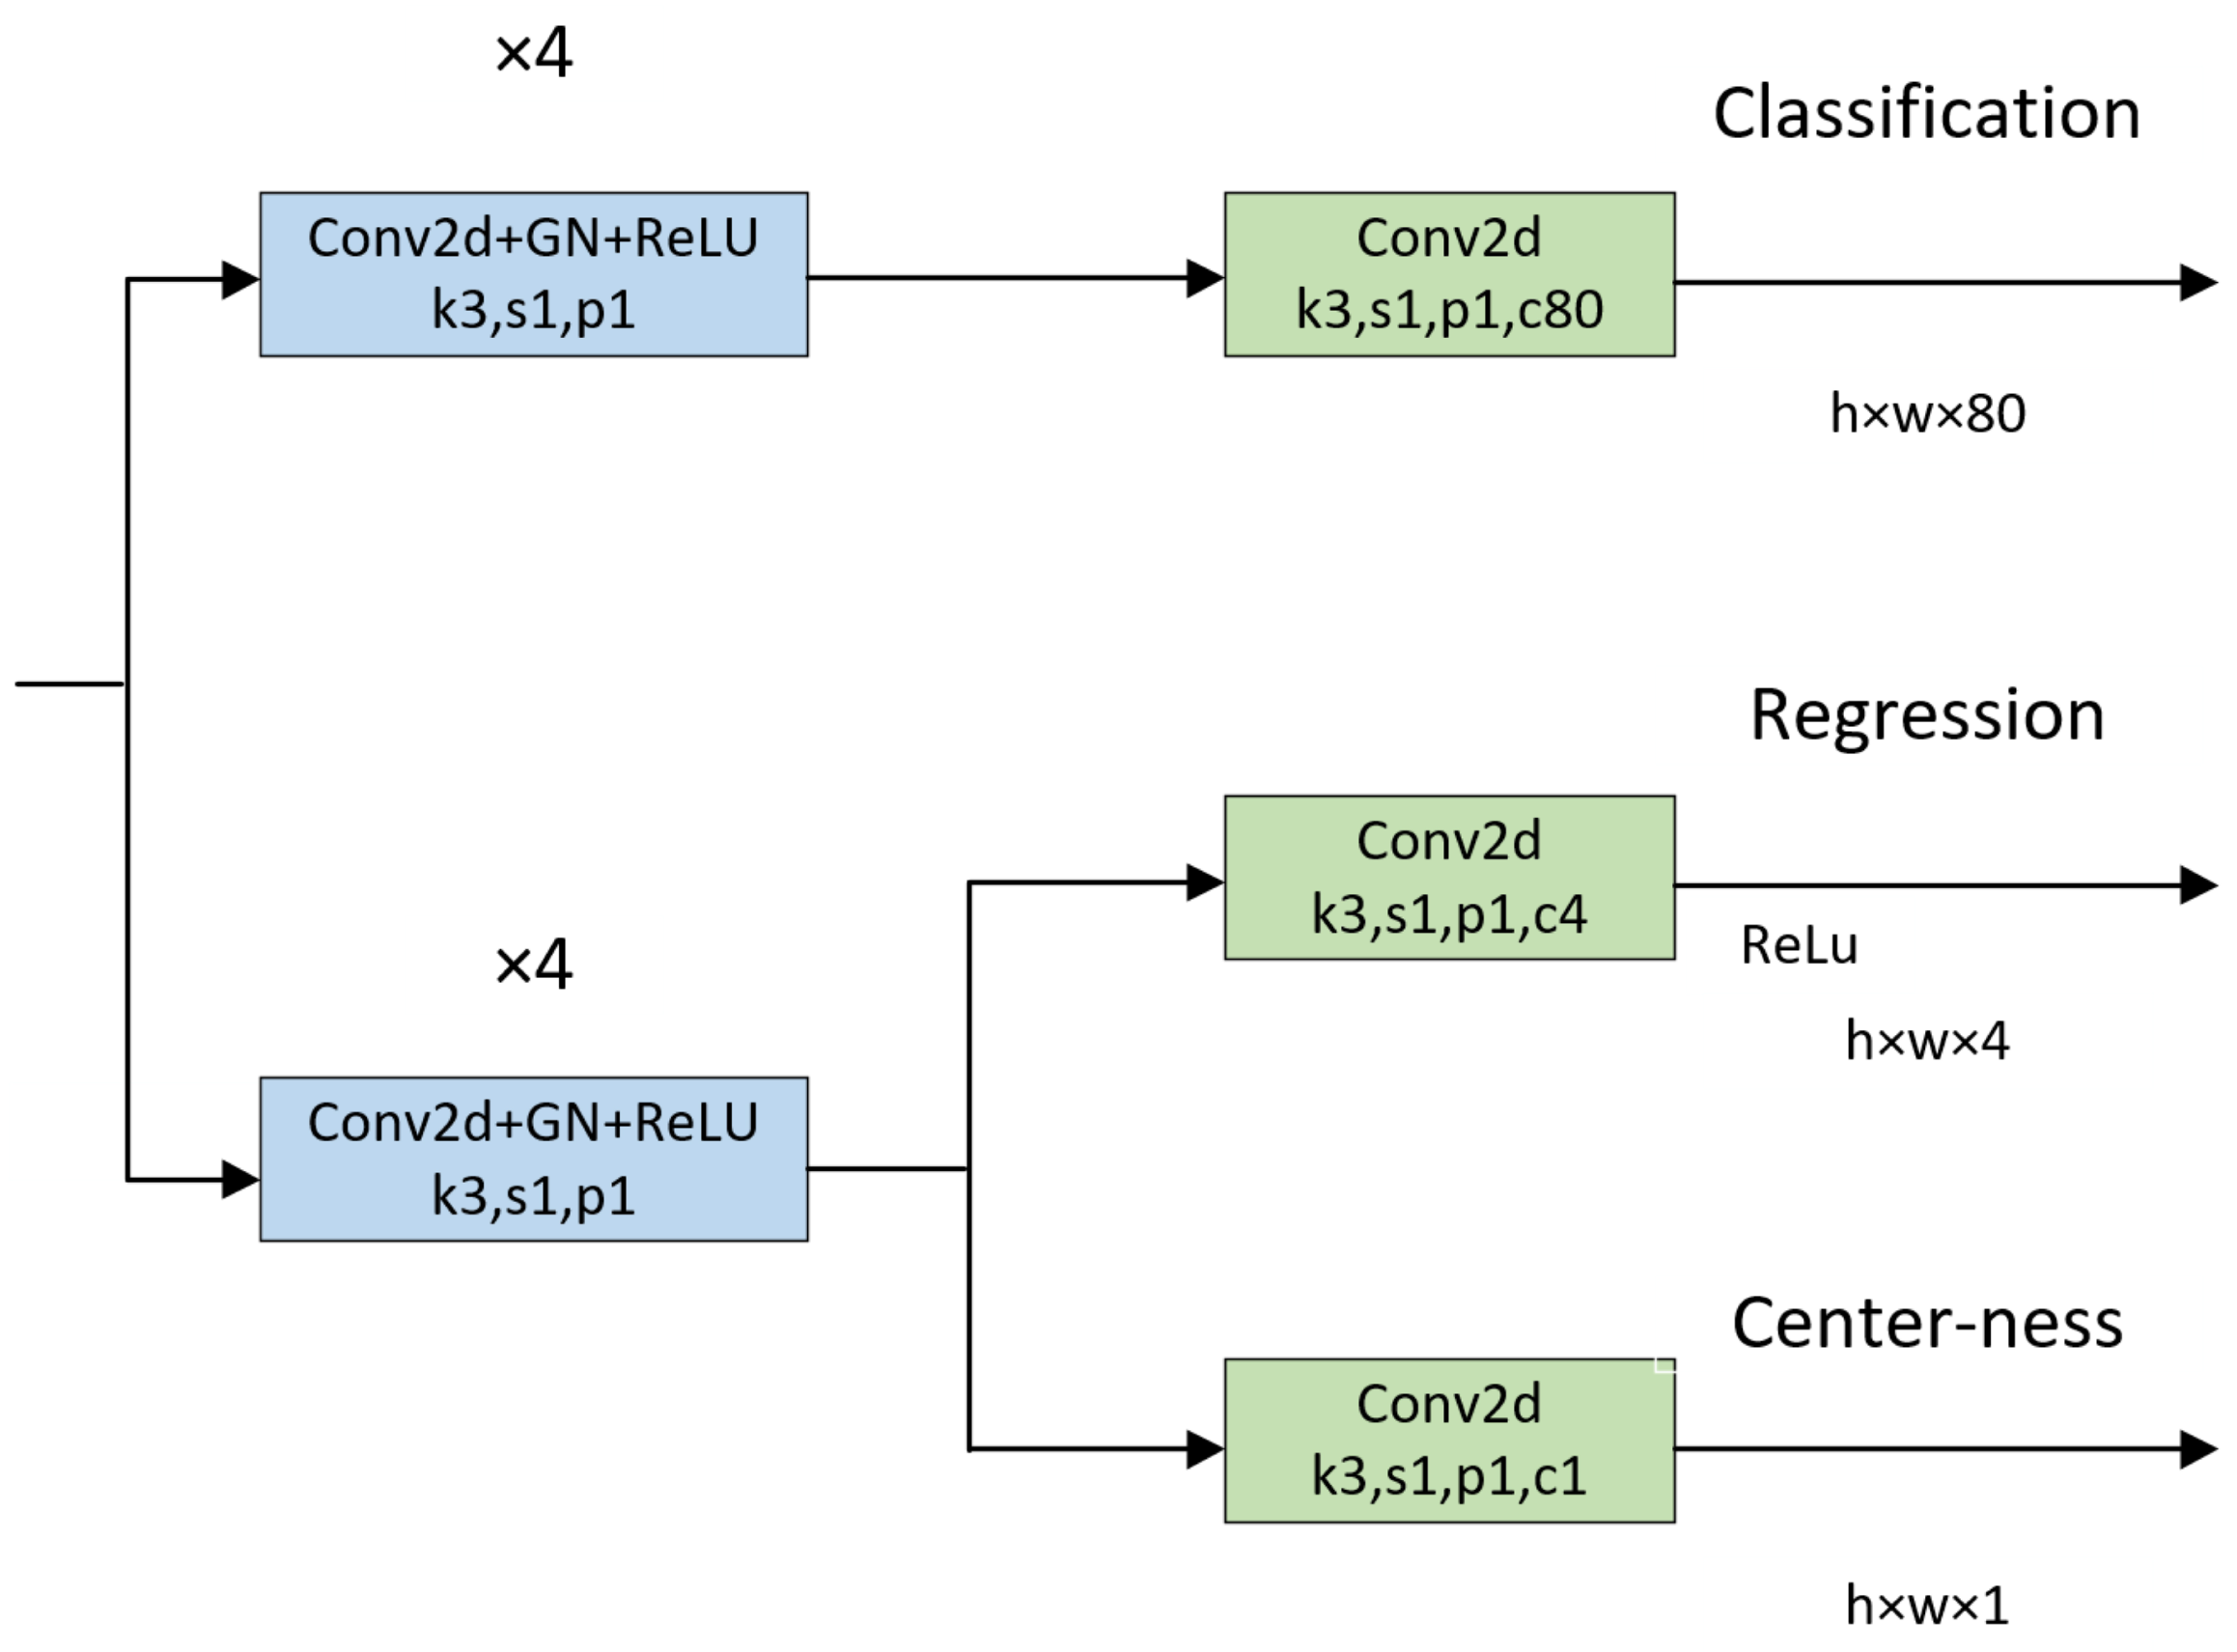
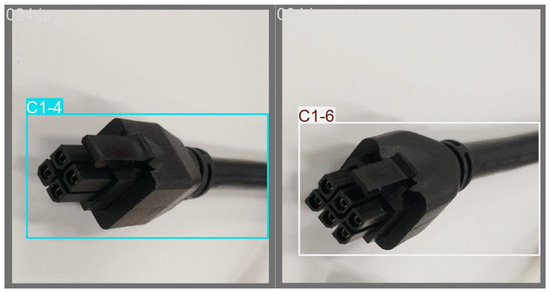
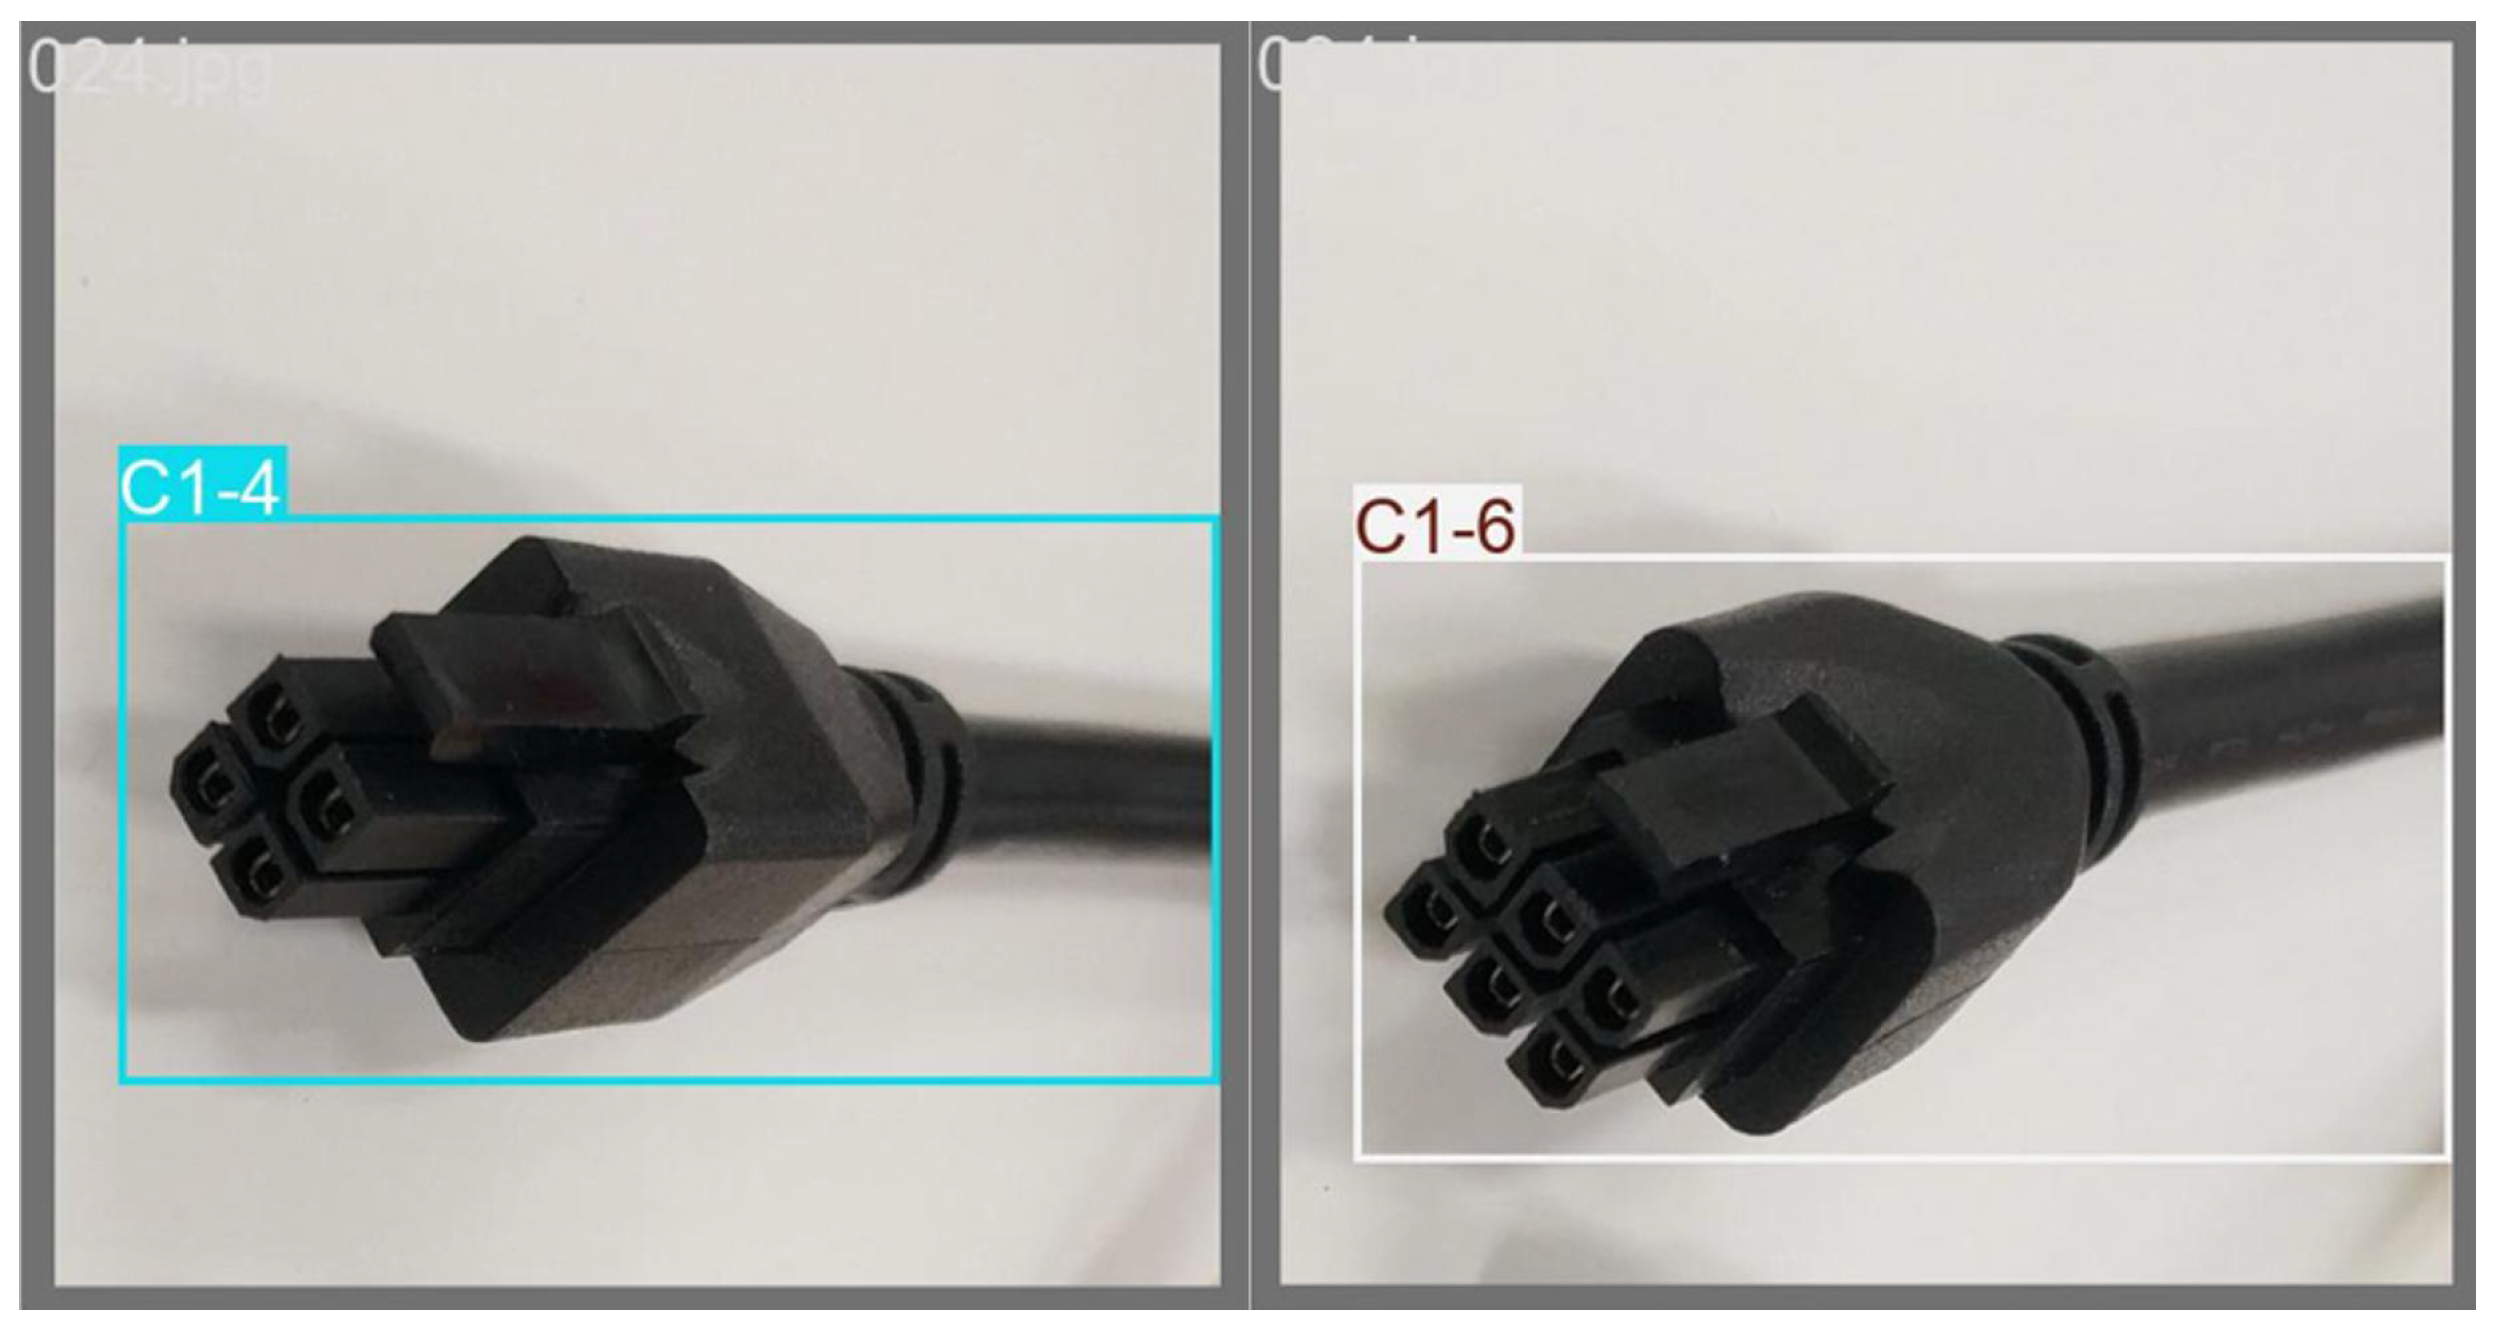
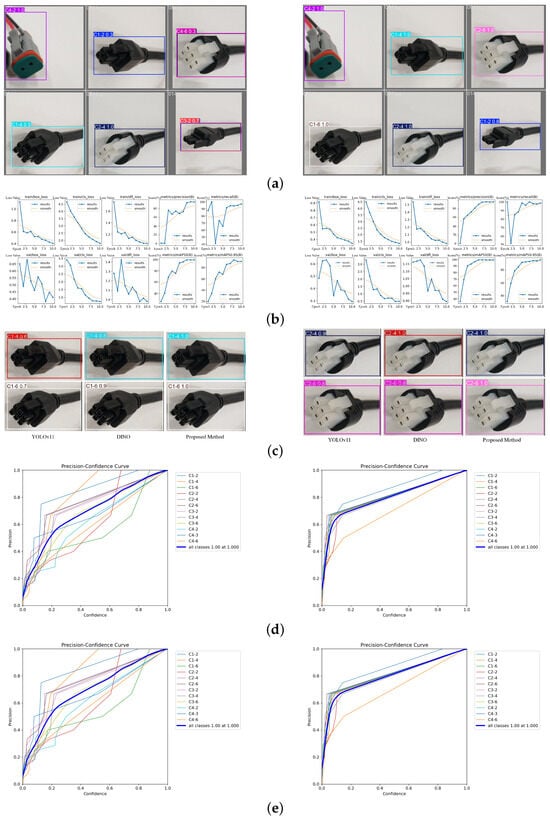
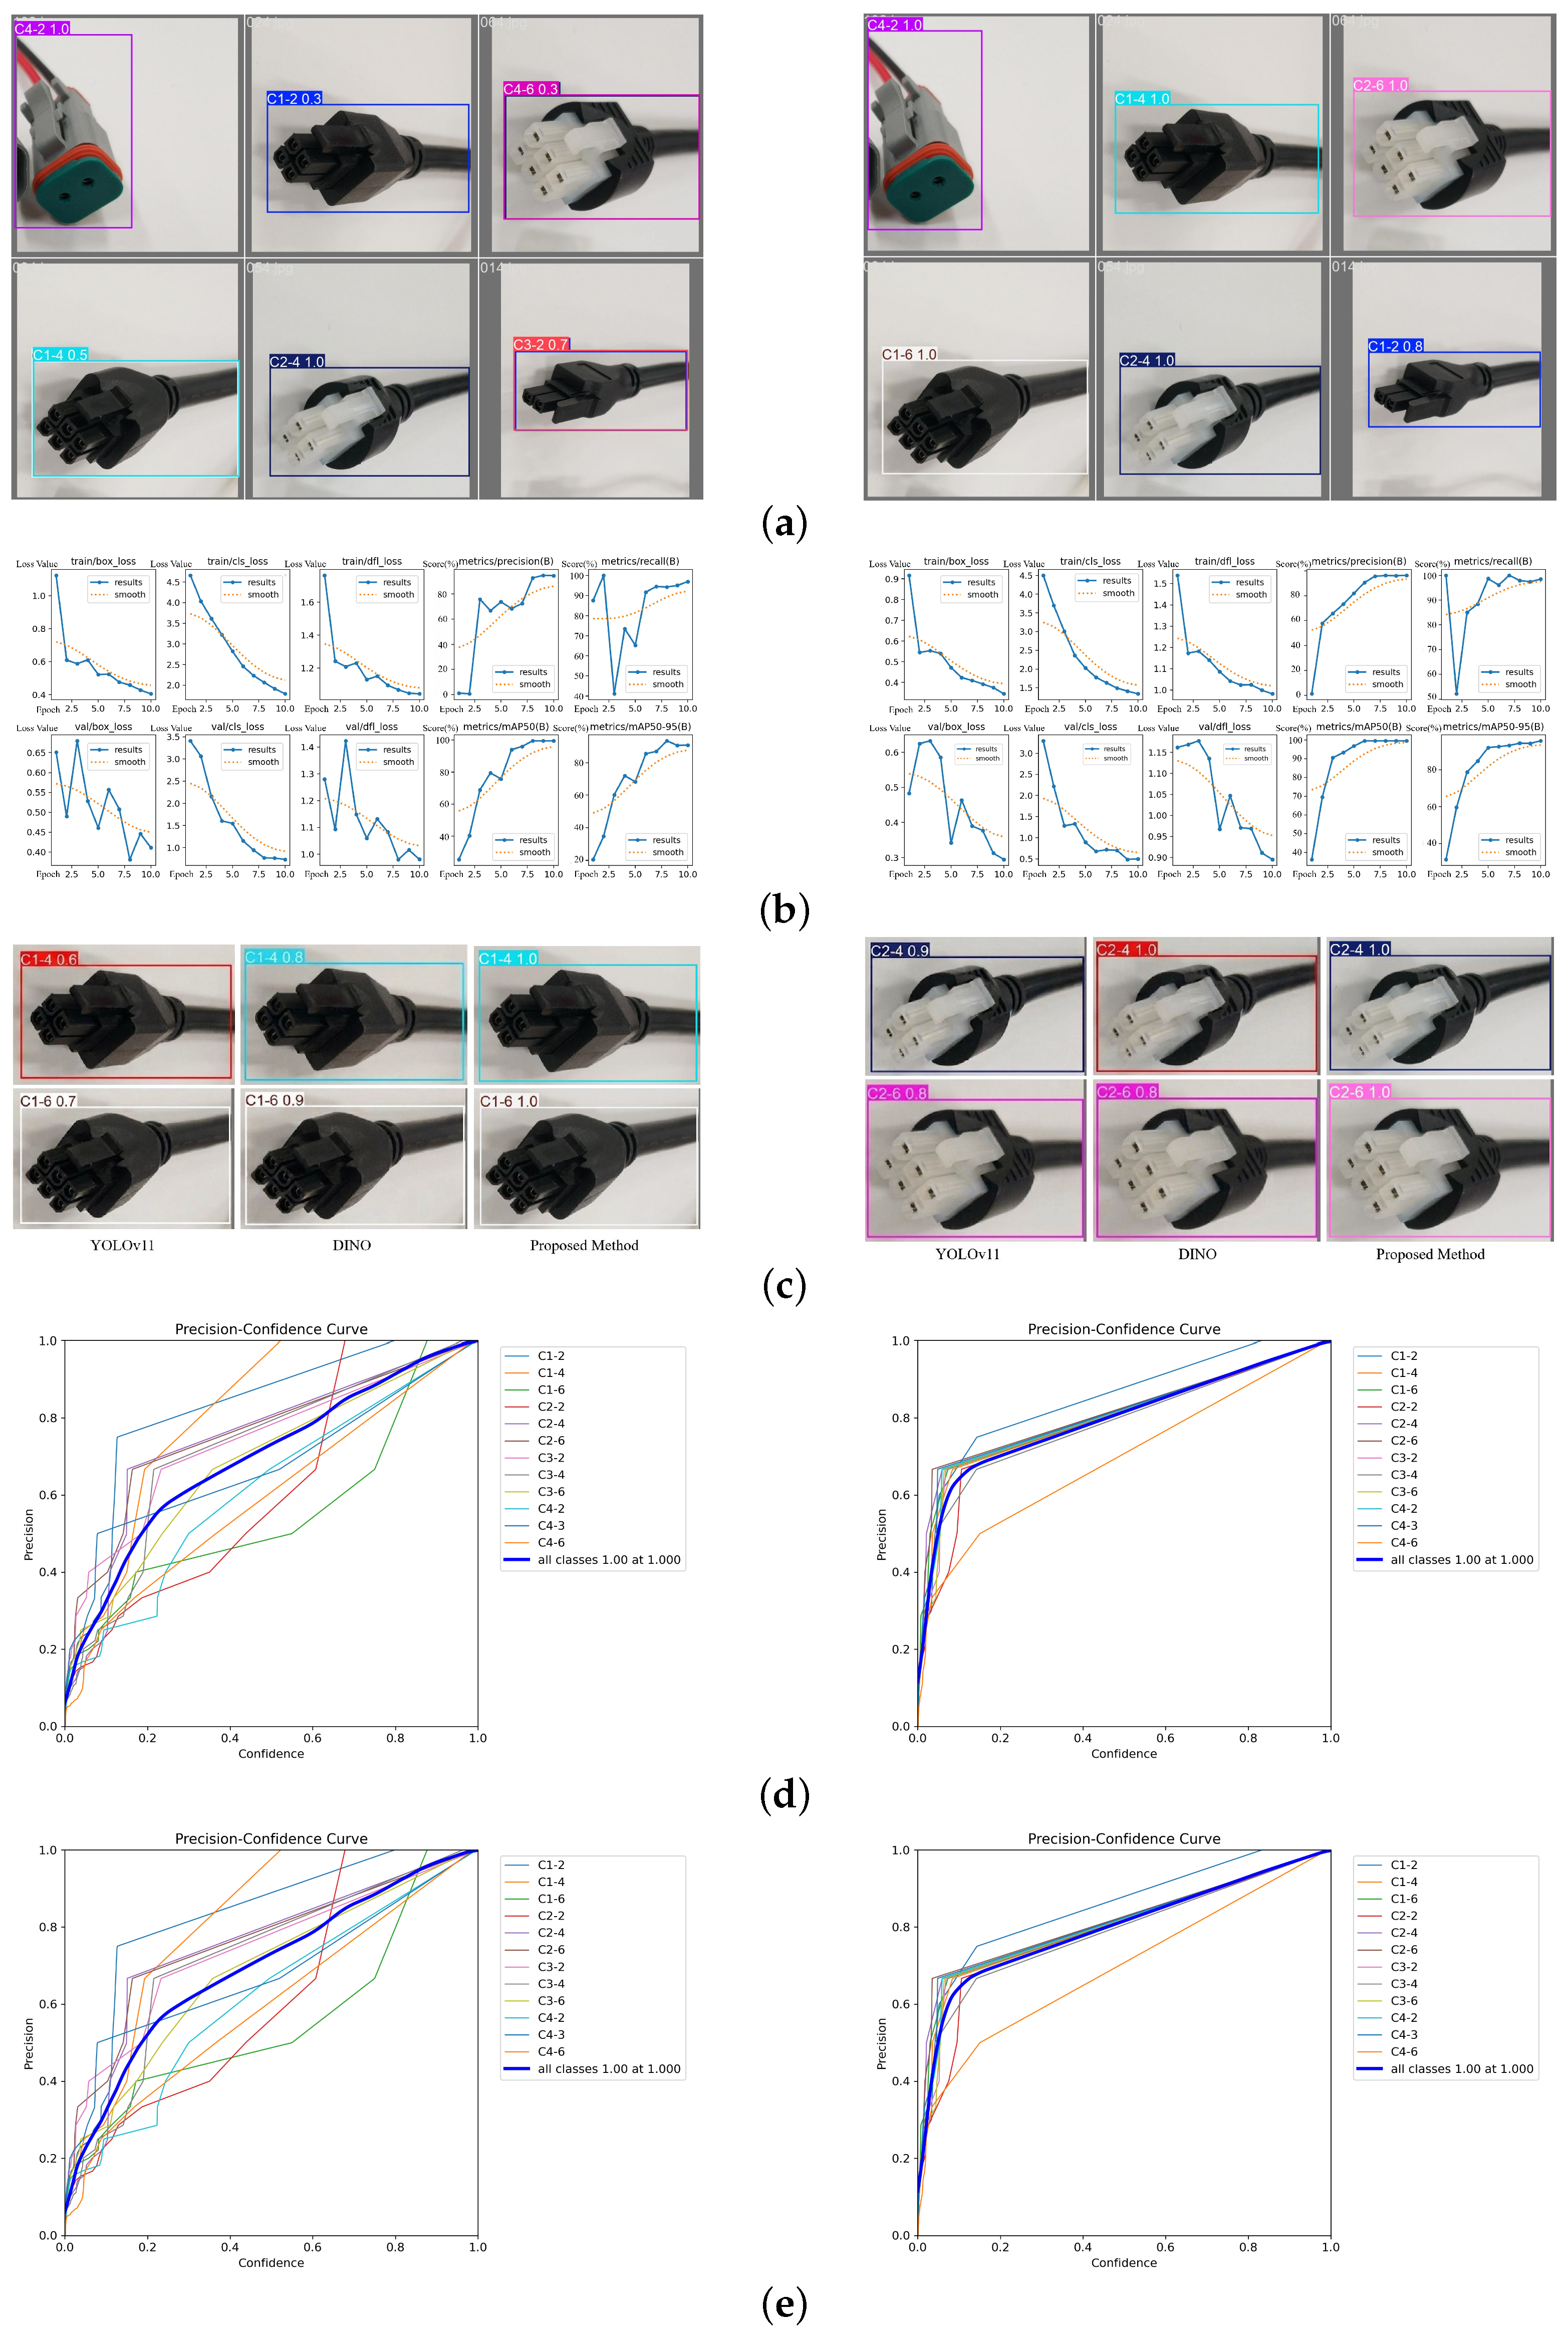
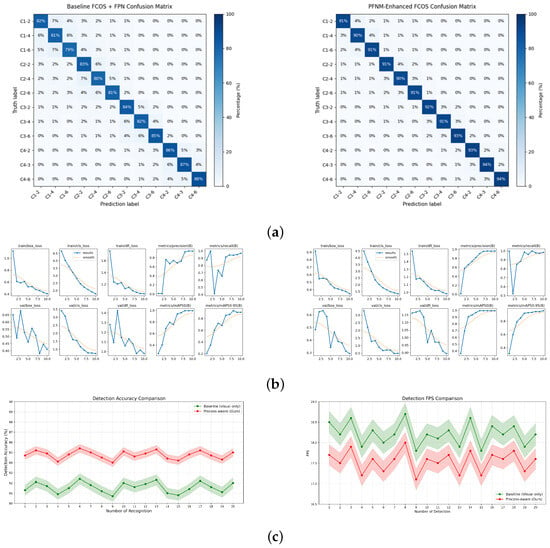
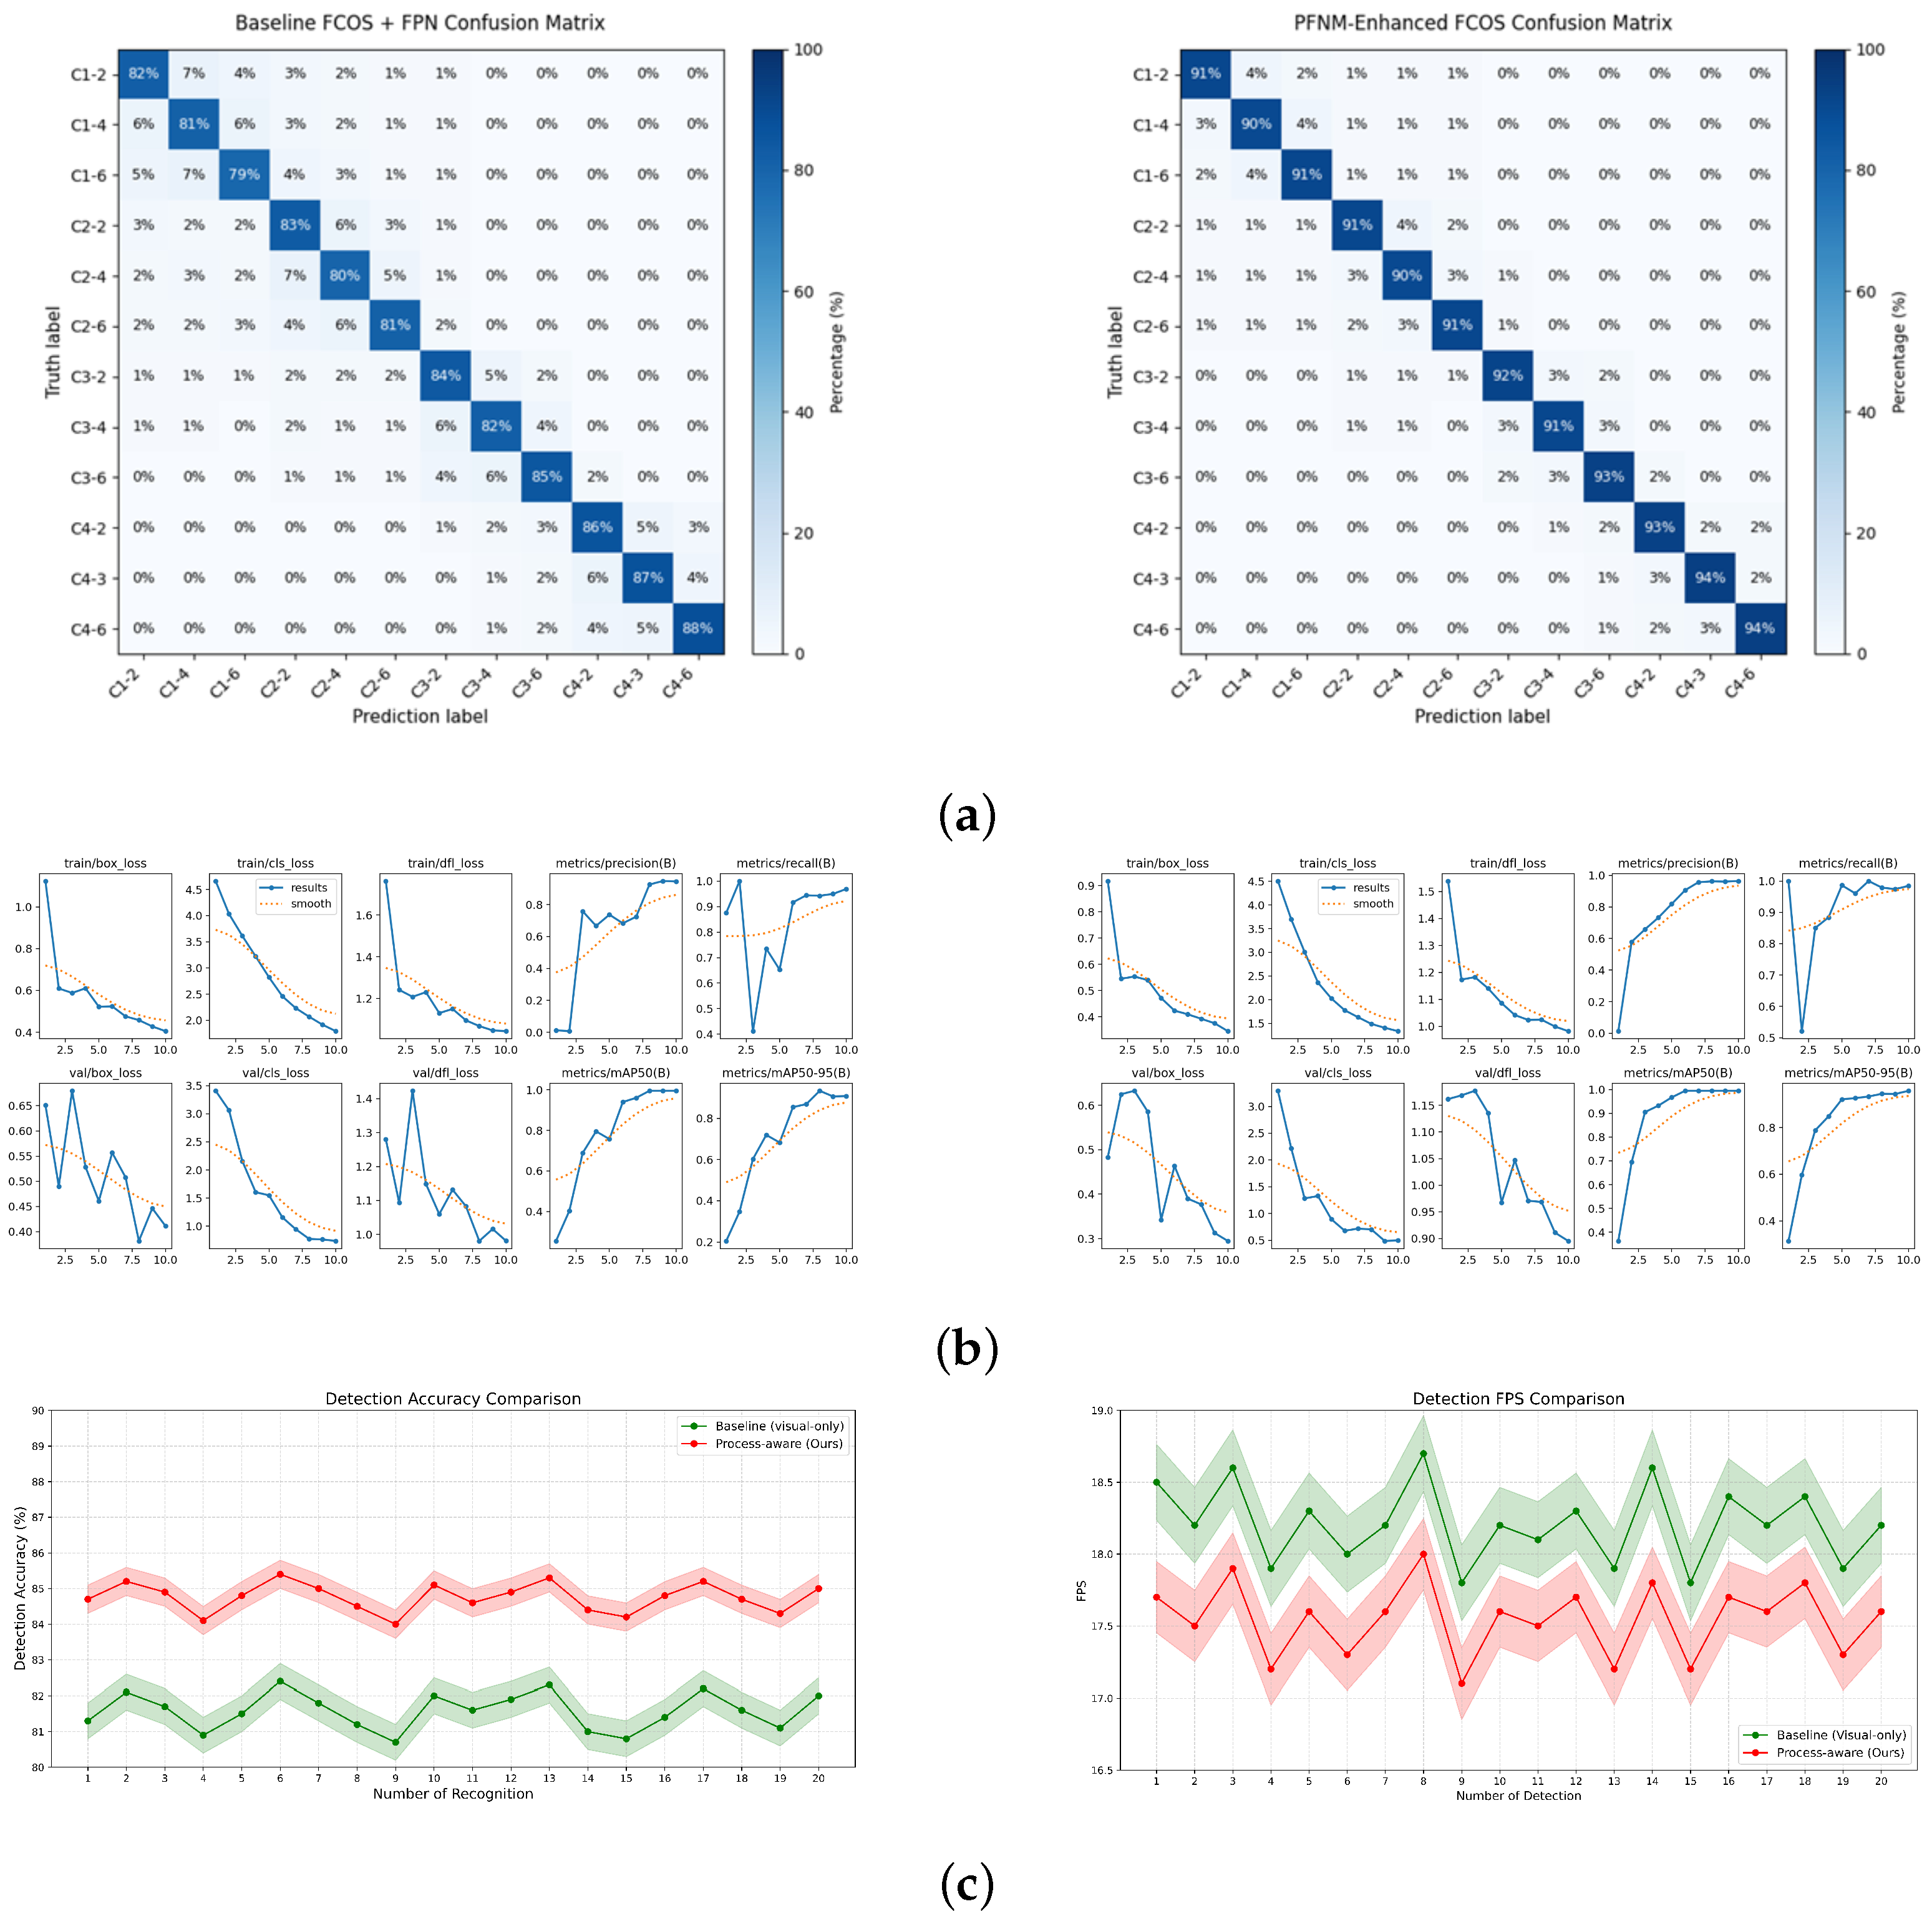

Disclaimer/Publisher’s Note: The statements, opinions and data contained in all publications are solely those of the individual author(s) and contributor(s) and not of MDPI and/or the editor(s). MDPI and/or the editor(s) disclaim responsibility for any injury to people or property resulting from any ideas, methods, instructions or products referred to in the content. |
© 2026 by the authors. Licensee MDPI, Basel, Switzerland. This article is an open access article distributed under the terms and conditions of the Creative Commons Attribution (CC BY) license.