


Abstract
As public electric vehicle (EV) charging networks expand, infrastructure performance increasingly depends on whether occupied charging time is converted into useful energy delivery. This study develops a hybrid data-driven framework to identify, predict, and explain inefficient EV charging sessions for intelligent infrastructure management. Using charging-session data from California, inefficient sessions are defined by the joint condition of a high idle ratio and low energy delivered per occupied hour. K-means clustering and HDBSCAN are applied to examine charging-session typologies, while four machine learning methods are compared for session-level prediction. Model interpretation is conducted using permutation feature importance, partial dependence plots, and rule extraction. The results show that inefficient charging is concentrated in a long-stay, low-output profile distinct from productive long-duration charging. XGBoost provides the strongest overall predictive performance, and pricing conditions, user routines, temporal patterns, and station-utilisation context emerge as key drivers of inefficient charging risk.
1. Introduction
The rapid growth of electric vehicles (EVs) is reshaping urban mobility and energy systems. EVs can reduce operating costs, support renewable energy integration, enable intelligent driving services, and contribute to the transition towards sustainable and zero-emission transport [1]. Public charging infrastructure is central to this transition because it improves the accessibility, convenience, and reliability of EV use, particularly in urban areas where home charging may not always be available [2]. As a result, charging networks are being rapidly expanded to accommodate increasing charging demand. However, the accelerated deployment and use of charging infrastructure also create new operational challenges for electricity systems, charging operators, and EV users [3]. In particular, the disorderly growth of charging demand may increase pressure on local grids, intensify competition for charging resources, and reduce the effective availability of public chargers [4].
A key challenge in public charging operations is that charger occupation and energy delivery are not equivalent. In many EV charging sessions, vehicles remain connected after active charging has ended because drivers often combine charging with parking, commuting, working, shopping, or other destination-based activities [5]. Such behaviour may lead to inefficient charger occupation, where a charging point remains unavailable to other users while delivering little or no additional energy. This can reduce effective network capacity, increase station-level congestion, weaken user experience, and undermine the operational efficiency of charging infrastructure [6]. For charging operators, the problem is not only how many chargers are installed, but also whether the occupied charging time is being converted into useful energy service. Therefore, identifying and managing inefficient charging sessions has become increasingly important for intelligent charging-infrastructure operation and demand-side management.
Existing studies have extensively examined EV charging-demand prediction and grid-responsive charging optimisation. These include charging scheduling, charging-station planning, smart charging, vehicle-to-grid integration, and charging flexibility management [7,8,9]. Much of this literature focuses on forecasting the departure time, charging duration, and energy demand of EV users so that charging needs can be satisfied before vehicle departure. These studies have made important contributions to load coordination and charging-resource allocation. However, comparatively less attention has been paid to what happens after charging demand has been met. In practice, vehicles may remain connected beyond the time required for active charging, which means that high charger utilisation does not necessarily indicate efficient infrastructure use [10]. Several studies have therefore begun to examine operational inefficiency associated with idle occupation, overstay behaviour, and charger hogging [11,12]. Recent evidence further indicates that overstaying can be widespread, with non-charging or post-charging occupation accounting for a substantial share of total connection time in some charging environments [13].
Despite these advances, inefficient EV charging has not been sufficiently studied as a distinct, measurable, and predictable session-level operational outcome. Three gaps remain particularly important. First, many studies describe charger utilisation, station occupancy, charging demand, or connection duration at an aggregate level, but do not explicitly distinguish between productive charger occupation and inefficient occupation with low energy output. As a result, high utilisation or long session duration may be incorrectly interpreted as effective infrastructure use. Second, it remains unclear whether inefficient sessions form identifiable behavioural patterns in real-world charging data, or whether they are merely isolated abnormal events. Existing clustering-based studies can reveal charging typologies, but they rarely connect these typologies to an operational inefficiency label. Third, while machine learning has been widely used for charging-demand forecasting, station-choice prediction, session-duration estimation, and flexibility assessment, limited work has examined whether inefficient charging can be predicted and interpreted using observable temporal, pricing, station-level, connector-level, and user-level factors. Without such evidence, charging operators may continue to prioritise infrastructure expansion while overlooking effective capacity losses within existing charging networks.
From a methodological perspective, existing EV charging prediction approaches are not sufficient to address this problem. Models designed for charging-demand forecasting, load prediction, station-choice modelling, or session-duration estimation mainly estimate when, where, and how much charging demand may occur. However, they do not directly evaluate whether occupied charger time is productively converted into delivered energy. A long charging session predicted by a conventional duration model may represent either productive long-duration charging or inefficient long-stay, low-output occupation. Similarly, clustering alone can identify recurring behavioural profiles, but it does not provide an early prediction mechanism for inefficient-session risk; supervised prediction alone can classify sessions, but it does not test whether inefficient sessions correspond to meaningful behavioural typologies; and black-box prediction models provide limited operational guidance unless their outputs are translated into interpretable management rules. Therefore, a more integrated workflow is needed to define, validate, predict, and explain inefficient charging as a session-level operational risk.
To address these gaps, this study develops a problem-specific hybrid data-driven workflow for identifying, predicting, and explaining inefficient EV charging sessions. The contribution is not the invention of a new standalone machine learning algorithm, but the integration of established learning methods into an operationally interpretable framework tailored to inefficient charging-infrastructure management. Using real-world charging-session data from California, the workflow first defines inefficient charging based on two complementary operational indicators: the idle ratio and energy delivered per occupied hour. This definition captures charging events in which vehicles occupy charging resources for relatively long non-charging periods while delivering low energy output. Second, K-means clustering and Hierarchical Density-Based Spatial Clustering of Applications with Noise (HDBSCAN) are used to examine whether inefficient charging is concentrated within distinct charging-session typologies. Third, four supervised learning models, namely Logistic Regression, Random Forest, XGBoost, and CatBoost, are compared to predict inefficient-session labels under class-imbalanced conditions. Finally, post hoc interpretation methods, including permutation feature importance, partial dependence plots (PDPs), and rule extraction, are used to reveal the pricing, temporal, station-level, connector-level, and user-level conditions associated with inefficient charging risk.
This study makes three main contributions. First, it reframes inefficient EV charging as a distinct session-level operational risk rather than treating charger utilisation, connection duration, or energy demand as separate outcomes. By jointly considering idle occupation and energy productivity, the study provides a measurable basis for distinguishing productive charger occupation from inefficient infrastructure use. Second, it develops a problem-specific hybrid workflow that links inefficient-session labelling, unsupervised charging-session typology analysis, supervised risk prediction, and explainable interpretation. This workflow goes beyond conventional EV charging prediction approaches by examining not only whether charging demand occurs, but also whether occupied charger time is effectively converted into useful energy delivery. Third, it provides operationally interpretable evidence on the conditions associated with inefficient charging risk. By identifying the roles of pricing variables, repeated user behaviour, temporal routines, station-level operating conditions, and connector-level attributes, the study supports differentiated pricing, idle-fee design, user reminders, station-level turnover management, and charging-resource allocation. These contributions align with the broader goal of intelligent EV charging management by supporting more adaptive, data-driven, and operationally interpretable infrastructure strategies.
The remainder of this paper is organised as follows. Section 2 reviews related studies on EV charging behaviour, infrastructure utilisation, operational inefficiency, and machine learning-based charging management. Section 3 describes the data, feature construction, and inefficient-session definition. Section 4 presents the methodological framework. Section 5 reports the empirical results and discusses their operational implications. Section 6 concludes the paper and outlines future research directions.
2. Literature Review
2.1. EV Charging Behaviour and Session-Level Modelling
Understanding EV charging behaviour is essential for intelligent charging-infrastructure planning, energy modelling, load profiling, power-system optimisation, policy design, and consumer-behaviour analysis [14]. Compared with aggregate load studies, session-level records provide detailed information on charging start time, connection duration, delivered energy, and charger occupation. They therefore offer a useful basis for distinguishing effective charging demand from broader charger-occupation behaviour. Existing studies have examined EV charging behaviour mainly from the perspectives of spatiotemporal patterns, economic incentives, station-level contexts, and user heterogeneity [15].
Spatiotemporal studies show that charging behaviour is closely embedded in daily mobility routines. Users often charge near home, workplaces, or frequently visited locations, with station choice influenced by proximity and range anxiety [16]. Seasonal and temperature conditions also affect charging timing, duration, and the state of charge at which users decide to recharge [17]. Residential charging sessions are often concentrated in the afternoon and evening, especially between 16:00 and midnight [18]. These findings indicate that charging sessions are shaped not only by energy demand, but also by spatial accessibility, parking opportunities, and routine travel schedules.
Economic and station-level studies further show that charging behaviour responds to pricing signals and local operating contexts. Price changes can generate spatial spillover effects in charging demand [19], while charging and post-charging parking fees have been shown to reduce both charging volume and post-charging parking time [20]. Connection duration is also closely linked to parking behaviour, as drivers may leave vehicles connected while working or sleeping [21]. In addition, charging-load profiles differ across residential and workplace areas [22], and large-scale session data reveal distinct station-level charging-load patterns [2]. These studies suggest that infrastructure use is shaped by both user decisions and station operating environments.
User-level studies add another layer of behavioural heterogeneity. Charging choices in smart-grid contexts are influenced by target energy, effective charging time, and charging cost [23]. Habitual users may also differ from casual users in electricity consumption and commuting distance, even when their session durations are not substantially different [24]. These findings highlight the importance of repeated user behaviour and charging routines in explaining session-level outcomes.
Overall, existing studies have advanced understanding of charging-location choice, load patterns, arrival and departure behaviour, charging duration, and user typologies. However, most session-level research still focuses on demand, duration, energy consumption, or flexibility potential. It rarely treats inefficient charging, where chargers remain occupied while delivering limited energy, as a distinct operational outcome. This limitation is important because high charger occupation does not necessarily imply efficient infrastructure use. This study addresses this gap by identifying and predicting inefficient charging sessions using real-world charging-session data.
2.2. Charging Infrastructure Utilisation and Operational Inefficiency
Efficient utilisation of charging infrastructure is critical for improving accessibility, reducing congestion, supporting grid coordination, and avoiding unnecessary capacity expansion. Existing studies have examined infrastructure utilisation through indicators such as charging load, station demand, charger occupation, waiting demand, service blocking, and profitability. Public charging-station usage can be characterised by energy consumption, arrival times, occupation, and profitability [25], while large-scale evidence from the U.S. shows substantial heterogeneity in utilisation, with 50% of Level 2 and direct-current fast-charging stations supplying nearly 90% of total charging demand [26]. These findings suggest that network performance depends not only on charger deployment, but also on how effectively existing facilities are used.
Operational studies have further examined how infrastructure characteristics and service conditions affect charging-system performance. Battery capacity has been shown to shape daily charging routines and infrastructure use [27], while station occupancy, charger utilisation, waiting demand, and service blocking provide useful evidence for charging-system planning [28]. However, many utilisation indicators remain station-level or aggregate in nature. They describe how much a station is used, but do not directly reveal whether individual occupied sessions are converted into effective energy delivery.
This limitation is important because charger occupation and energy delivery are not equivalent. Vehicles may remain plugged in after active charging has ended, or may occupy a charging point for a long period while receiving little energy. Such behaviour reduces effective charger availability and can restrict access for subsequent users. Non-charging occupancy has been reported to account for approximately 54% of total station usage time [29], and overstaying after full charge can create bottlenecks in charging-resource availability [12]. Idle connection time has also been identified as a key source of operational inefficiency, with reductions in idle time expected to improve both efficiency and user satisfaction [30]. More broadly, charging-infrastructure inefficiency has been linked to operational disruption, spatial mismatch, poor management, and capacity-performance mismatch [6].
Together, these studies clarify the distinction between utilisation and efficiency. High utilisation may be undesirable if it reflects prolonged idle occupation, whereas moderate utilisation may be efficient if occupied time is largely converted into active charging. Nevertheless, inefficient charging has rarely been modelled as a predictable session-level risk. Previous studies have mainly examined overstay or idle occupation using station-level indicators, aggregate occupancy measures, or policy simulation. Limited attention has been paid to how session-level, temporal, station-level, user-level, and connector-level factors jointly shape inefficient charging. This study therefore conceptualises inefficient charging as a session-level operational problem and investigates both its behavioural structure and predictive determinants.
2.3. Machine Learning for EV Charging Management
Machine learning has become increasingly important for EV charging management because it can capture nonlinear relationships and complex interactions among temporal, spatial, economic, behavioural, and infrastructure-related factors. Existing studies have applied unsupervised and supervised learning to charging-demand prediction, session classification, load profiling, flexibility estimation, and infrastructure planning.
Unsupervised learning, particularly clustering, has been widely used to identify recurring charging patterns without predefined labels. K-means clustering has been applied to UK charging data to identify regional power-demand clusters and reveal spatial heterogeneity in charging behaviour [31]. Other clustering approaches have also been used to identify seasonal charging-load profiles [2], session and user typologies such as daytime office-hour charging, short daytime charging, and overnight charging [32], and driver groups under large-scale charging-demand scenarios [33]. These studies demonstrate the usefulness of clustering for uncovering behavioural heterogeneity, but they mainly describe charging patterns rather than linking them to inefficient charger occupation as an operational risk.
Supervised learning has been used to predict specific charging outcomes, including energy demand, session duration, station demand, and charge-point flexibility. Previous studies have compared methods such as multivariate linear regression, Random Forest, artificial neural networks, and k-nearest neighbours for EV fleet charging forecasting [34], as well as Random Forest, CatBoost, XGBoost, and LightGBM for short-term charging-station demand prediction [35]. Recent work has further combined clustering and prediction. For example, cluster-based modelling with XGBoost and Long Short-Term Memory models has been used to predict charge-point flexibility, showing that user-specific charging behaviour improves prediction accuracy for session duration and energy demand [36]. A dual-layer clustering framework combining DBSCAN and K-means has also been incorporated into LightGBM-based charging-demand prediction [37]. However, these studies primarily aim to predict demand, duration, load, or flexibility, rather than whether occupied charging time is used efficiently.
Interpretability has also become increasingly important because prediction alone is insufficient for charging operators and policymakers. Models need to reveal which factors increase operational risk and under what conditions. Interpretable machine learning methods, including SHapley Additive exPlanations (SHAP), permutation feature importance, and PDPs, have therefore been used to explain model outputs. For example, permutation feature importance and PDPs have been used to rank predictors and quantify marginal effects in battery cycle-life prediction [38], SHAP has been applied to interpret nonlinear and interactive effects in charging-station choice behaviour [39], and Shapley-based spatiotemporal interpretation has been used to analyse feature, temporal, and spatial contributions in multi-task learning models [40].
Overall, existing machine-learning applications in EV charging mainly focus on demand prediction, load forecasting, station choice, session classification, or flexibility estimation. Comparatively little attention has been paid to predicting inefficient charger occupation as a distinct session-level operational risk. In addition, explainability studies have not sufficiently examined whether inefficiency drivers vary across pricing conditions, temporal routines, station contexts, connector attributes, and user behaviours. To address these limitations, this study develops a hybrid data-driven framework that combines clustering, supervised machine learning, and interpretable analysis. To position the present study within the session-based EV charging literature, Table 1 compares representative studies in terms of their modelling objectives, learning methods, interpretability techniques, and whether inefficient charging sessions are examined.
Table 1.
Overview of modelling approaches in session-based EV charging behaviour studies.
3. Data and Variable Construction
3.1. Data Source and Preprocessing
This study uses EV charging-session records obtained from Data.gov, the U.S. Government’s open data platform. The dataset contains 42,801 charging-session records collected in California between 1 January 2024 and 31 December 2024. California provides a suitable empirical context for this study because it is one of the most active EV markets in the U.S. and has been widely used in previous charging-behaviour research [41]. The dataset includes detailed session-level information, including plug-in and plug-out times, charging start and end times, total connection duration, effective charging duration, delivered energy, charging power, fee information, and station-related attributes.
To ensure data quality and analytical reliability, a systematic preprocessing procedure was conducted before variable construction and modelling. First, records with missing values in key analytical fields were removed. These fields include total session duration, charging duration, delivered energy, and session start time, which are necessary for measuring charging efficiency and identifying inefficient charger occupation. Second, duplicate records were examined and removed. Because the plug-in event identifier was not fully unique across the dataset, duplicate sessions were identified using a combination of charger identifier, session start and end timestamps, delivered energy, and charging duration. Third, physically inconsistent or abnormal observations were excluded. These included sessions in which charging duration exceeded total connection duration, records with non-positive duration or energy values, and sessions lasting more than 24 h. After preprocessing, 42,793 valid charging sessions were retained for the empirical analysis.
3.2. Feature Construction
Based on the cleaned charging-session records, a set of session-level, temporal, economic, station-level, and user-level features was constructed to characterise EV charging behaviour and infrastructure utilisation. These features were designed to capture not only when and where charging occurred, but also whether charger occupation was effectively converted into energy delivery.
First, temporal features were extracted from the session start timestamp to capture daily and seasonal charging patterns. These include the session start hour, day of week, weekend indicator, and month. The session start hour was used to represent intra-day variation in charging behaviour, while the day-of-week and weekend indicators were used to distinguish routine weekday charging from more flexible weekend charging. The month variable was retained to capture potential seasonal variation in charging behaviour.
Second, charging-efficiency features were constructed to measure the relationship between charger occupation and actual energy delivery. Total session duration was calculated as the full period during which a vehicle occupied a charging point, while effective charging duration measured the period during which active charging occurred. The effective charging ratio was defined as the ratio of effective charging duration to total session duration, reflecting the share of occupied time used for active energy transfer. Additionally, three indicators were constructed to capture charger underutilisation: energy delivered per occupied hour, idle time, and the idle ratio. These indicators are defined as follows:
For charging session , let denote the total session duration, denote the effective charging duration, and denote the delivered energy. The energy delivered per occupied hour , idle time , and the idle ratio are defined as follows:
where measures the overall productivity of charger occupation, represents the duration for which the vehicle remains connected without active charging, and captures the proportion of occupied time spent in an idle state. These indicators are central to distinguishing efficient charging sessions from sessions that occupy infrastructure while delivering limited energy.
Third, economic features were constructed to examine the role of pricing signals in charging behaviour. The total fee per session was retained as a direct measure of the cost incurred by the user. The fee per kWh was calculated by dividing the total session fee by the amount of energy delivered, thereby capturing the unit cost of charging. A binary free-session indicator was also created to distinguish between free and paid charging sessions. This variable allows the analysis to examine whether the absence of direct charging cost is associated with longer idle occupation or lower charger-turnover efficiency.
Fourth, station-level features were generated to account for heterogeneity across charging locations. The station historical session count was used as a proxy for long-term station utilisation, calculated as the total number of sessions recorded at each station during the study period. The station hourly session count was constructed to capture short-term operating pressure by counting the number of sessions associated with each station during each hour-of-day period. Additional station and connector attributes, including the port type, plug type, session termination type, county, and charging-station model number, were retained to represent differences in infrastructure configuration and local operating context.
Finally, user-level features were constructed for sessions with available user identifiers. Historical visit frequency was calculated as the number of sessions associated with each user, reflecting the extent of user engagement with the charging network. Based on this measure, a repeated-user indicator was created to distinguish repeated users from occasional users. These variables were included because habitual users may develop stable charging routines that affect charger occupation and post-charging behaviour.
Categorical variables, including the day of the week, weekend status, free-session status, port type, plug type, session termination type, county, and model number, were converted into numerical representations for subsequent modelling. The constructed features provide the basis for defining inefficient charging sessions and for the later clustering, prediction, and interpretation analyses.
3.3. Definition of Inefficient Charging Sessions
To support supervised prediction, this study defines inefficient charging sessions as charging events in which a vehicle occupies a charging point for a relatively long non-charging period while delivering relatively low energy per occupied hour. This definition reflects the operational distinction between charger occupation and effective energy delivery. A session may have a long connection duration, but it should not be considered inefficient if most of that time is associated with active charging or substantial energy delivery. Conversely, a session becomes operationally inefficient when the occupied charging time is poorly converted into delivered energy.
Two indicators were used to identify inefficient charging sessions: the idle ratio and energy delivered per occupied hour. The idle ratio measures the proportion of occupied time during which the vehicle remains connected without active charging, while energy delivered per occupied hour measures the productivity of charger occupation. A session was labelled as inefficient only when it simultaneously satisfied two conditions: a high idle ratio and low energy delivered per occupied hour. This dual-condition design avoids classifying sessions as inefficient solely because they are long, and instead focuses on sessions with both prolonged idle occupation and weak energy-output efficiency.
To avoid arbitrary threshold selection, a quantile-based rule was adopted. Specifically, a charging session was classified as inefficient if its idle ratio exceeded the 75th percentile of the sample distribution and its energy delivered per occupied hour was below the 25th percentile. Formally, the inefficient-session label was defined as follows:
where Q75 and Q25 denote the 75th and 25th percentiles, respectively. Based on the empirical distribution of the cleaned dataset, the corresponding thresholds were 0.1296 for the idle ratio and 2.9007 kWh/h for energy delivered per occupied hour. Therefore, sessions above the idle-ratio threshold and below the energy-productivity threshold were assigned a value of 1, indicating inefficient charging, while all other sessions were assigned a value of 0.
A quantile-based rule was adopted for three reasons. First, absolute thresholds for inefficient charging are difficult to define universally because charging duration, idle occupation, and energy delivery vary across charger types, pricing schemes, station contexts, and user routines. Second, the percentile-based rule provides a transparent and reproducible way to identify sessions that are relatively inefficient within the observed operating environment. Third, the dual-threshold design avoids relying on a single indicator: a session is labelled as inefficient only when it simultaneously exhibits both excessive idle occupation and low energy productivity. Therefore, the definition captures the joint condition of poor charger occupation efficiency rather than merely long duration or low energy delivery alone.
The 75th percentile of the idle ratio and the 25th percentile of energy delivered per occupied hour were selected as the baseline thresholds because they identify sessions located in the upper-idle and lower-productivity tails of the sample distribution while retaining a sufficient number of observations for supervised learning under class-imbalanced conditions. To assess whether the empirical conclusions depend on this specific threshold choice, additional sensitivity analyses were conducted using alternative percentile combinations, including 70/30, 80/20, and 90/10 settings.
Using this definition, 7599 sessions were identified as inefficient, accounting for 17.76% of the 42,793 valid charging sessions. Figure 1 illustrates the threshold-based classification in the two-dimensional feature space defined by the idle ratio and energy delivered per occupied hour. The horizontal dashed line represents the 75th percentile threshold of the idle ratio, while the vertical dashed line represents the 25th percentile threshold of energy delivered per occupied hour. Sessions located in the upper-left region (red) satisfy both conditions and are therefore labelled as inefficient. The blue region indicates efficient. This rule-based definition provides a transparent and operationally interpretable target variable for the subsequent prediction task, while the clustering analysis introduced later is used to examine whether these inefficient sessions also form distinct behavioural patterns in the data.
Figure 1.
Rule-based identification of inefficient charging sessions.
3.4. Analytical Variables
The constructed variables were organised into two groups. The first group was used for charging-session typology analysis, where the aim was to identify distinct behavioural patterns in EV charging sessions. The second group was used for supervised prediction, where the aim was to estimate the probability that a session would be classified as inefficient. The variables used in each analytical stage are summarised in Table 2.
Table 2.
Variables used for clustering and prediction.
For clustering analysis, a smaller set of session-level variables was selected to capture the core behavioural characteristics of each charging event, including occupation duration, active charging time, delivered energy, idle occupation, energy productivity, charging cost, and start time. These variables directly describe the operational profile of charging sessions and are therefore suitable for identifying charging-session typologies.
For supervised prediction, the inefficient-session label defined in Section 3.3 was used as the dependent variable. The predictor set included temporal, economic, station-level, connector-level, and user-level variables. Variables directly used to construct the inefficient-session label, such as the idle ratio and energy per occupied hour, were not included as predictors in the supervised models to avoid potential target leakage. The final predictor set therefore focuses on observable contextual and behavioural factors that can support early identification of inefficient charging risk.
This variable organisation supports the two main empirical objectives of the study. The clustering variables are used to examine whether inefficient charging is associated with distinctive session-level behavioural patterns, while the prediction variables are used to identify contextual, economic, station-level, and user-level factors associated with inefficient charging risk.
4. Methodology
This study develops a three-stage modelling framework to identify, predict, and interpret inefficient EV charging sessions. The framework integrates unsupervised learning, supervised classification, and explainable machine learning to support both behavioural understanding and operational decision-making for intelligent charging-infrastructure management. Python 3.10.12 was used for data analysis within the Anaconda distribution (conda 24.5.0).
In the first stage, unsupervised learning is used to identify charging-session typologies. K-means clustering is adopted as the primary method to group sessions according to their operational characteristics, while HDBSCAN is used as a supplementary robustness check. In the second stage, supervised learning is used to predict the inefficient-session label defined in Section 3.3. To address class imbalance, class-weighting strategies are applied during model training. In the third stage, the best-performing model is interpreted using permutation feature importance, PDPs, and rule extraction. To improve the clarity of the proposed analytical procedure, Figure 2 presents the workflow of the data-driven framework.
Figure 2.
Workflow of the proposed data-driven framework.
4.1. Unsupervised Learning for Charging-Session Typology
4.1.1. K-Means Clustering
K-means clustering was used as the primary unsupervised learning method to identify charging-session typologies. The purpose of this step was to examine whether EV charging sessions could be grouped into distinct behavioural patterns according to their operational characteristics. Before clustering, the variables were standardised to ensure that those measured on different scales contributed comparably to the distance calculation.
K-means is a centroid-based clustering algorithm that partitions observations into k clusters by minimising within-cluster variation. Each charging session is assigned to the nearest cluster centroid, after which the centroids are iteratively updated until convergence. The objective function is to minimise the sum of squared errors (SSE), defined as:
where denotes the feature vector of charging session , represents cluster , is the centroid of the cluster , and is the number of clusters [42].
To determine an appropriate number of clusters, alternative K-means solutions were evaluated using inertia and silhouette scores. Inertia measures within-cluster compactness, while the silhouette score reflects both within-cluster cohesion and between-cluster separation. To reduce sensitivity to random initialisation, the algorithm was run multiple times, and the solution with the lowest within-cluster variation was retained. The resulting clusters were then interpreted according to their mean operational characteristics and their relationship with the inefficient-session label defined in Section 3.3.
4.1.2. HDBSCAN Robustness Validation
HDBSCAN was applied as a supplementary robustness check to assess whether the charging-session patterns identified by K-means remained observable under a density-based clustering approach. Unlike K-means, which partitions observations into a predefined number of compact clusters, HDBSCAN identifies clusters according to local density variation and does not require the number of clusters to be specified in advance. This makes it useful for testing whether inefficient charging patterns are robust to a different clustering logic, especially when charging sessions may contain irregular shapes, local density differences, or noise observations.
The same standardised session-level variables used in the K-means analysis were used for HDBSCAN. By using the same feature space, the HDBSCAN results could be compared with the K-means typology to examine whether high-idle and low-output charging behaviour formed a consistent pattern across clustering methods.
HDBSCAN is based on the concept of mutual reachability distance. For a given neighbourhood parameter k, the mutual reachability distance between two observations is defined as:
where denotes the distance from observation to its -th nearest neighbour, and denotes the distance between observations and . Based on the mutual reachability distance, HDBSCAN constructs a hierarchy of density-based clusters and extracts the most stable cluster structure [43].
4.2. Supervised Learning for Inefficient-Session Prediction
After identifying the inefficient-session label, supervised learning was applied to predict whether a charging session was likely to be inefficient. The prediction task was formulated as a binary classification problem, where the dependent variable takes the value of 1 for inefficient sessions and 0 for all other sessions. The aim of this stage was to compare different classification models and select the model with the strongest predictive performance under class-imbalanced conditions.
4.2.1. Model Specification and Training Strategy
Four supervised learning models were compared: Logistic Regression, Random Forest, XGBoost, and CatBoost. These models were selected to represent different levels of model complexity. As the dependent variable is a binary inefficient-session label, Logistic Regression was included as a classical statistical regression benchmark for binary classification. It provides a transparent linear reference model against which more flexible machine learning models can be compared. Random Forest represents a bagging-based ensemble method, while XGBoost and CatBoost represent gradient-boosting approaches that can capture nonlinear relationships and interaction effects among predictors [44]. Their comparison therefore allows the analysis to assess whether inefficient charging behaviour can be adequately represented by a classical linear regression structure or whether more complex nonlinear models are required.
As inefficient sessions accounted for a minority of the dataset, class imbalance was addressed through sample reweighting. Higher weights were assigned to the inefficient-session class to reduce model bias towards the majority class.
The cleaned dataset was randomly divided into an 80% training set and a 20% hold-out testing set. Within the training set, stratified five-fold cross-validation was used for hyperparameter tuning, ensuring that the proportion of inefficient and non-inefficient sessions was maintained across folds. Hyperparameters were optimised using randomised search. Precision-Recall AUC (PR-AUC) was used as the primary tuning metric because it is more informative than accuracy when the positive class is relatively rare. Final model performance was evaluated on the hold-out test set using AUC, PR-AUC, precision, recall, and F1-score.
4.2.2. XGBoost Model
XGBoost was further specified as the core gradient-boosting model for inefficient-session prediction. It is a regularised ensemble learning method that builds a sequence of decision trees, where each newly added tree is trained to correct the residual errors of the existing model. Compared with linear models, XGBoost does not impose a predefined functional relationship between predictors and the target variable. This makes it suitable for modelling inefficient EV charging sessions, as such behaviour may be shaped by nonlinear interactions.
For a given charging session , the prediction at iteration can be expressed as:
where denotes the feature vector of session , represents the regression tree added at iteration , and is the updated prediction [45]. In this study, XGBoost was trained using a binary logistic objective, so that the model estimates the probability that a charging session belongs to the inefficient class.
During hyperparameter tuning, parameters controlling tree depth, learning rate, number of estimators, subsampling, and regularisation were optimised through 5-fold cross-validation [41]. The final tuned XGBoost model was then evaluated on the hold-out test set and compared with other models.
4.3. Explainable Machine Learning Analysis
After model comparison, the best-performing classifier was further interpreted using explainable machine learning methods. The aim of this stage was not only to identify which variables contributed most to inefficient-session prediction, but also to explain how these variables were associated with predicted inefficiency risk. Three complementary interpretation techniques were applied: permutation feature importance, PDPs, and rule extraction. These methods were selected because they support the operational objective of this study by providing global feature ranking, nonlinear effect interpretation, and transparent decision rules. Specifically, permutation feature importance was used to assess the contribution of each predictor to model performance, PDPs were used to examine the marginal effects and threshold patterns of key variables, and rule extraction was used to translate model behaviour into interpretable management conditions. Given the focus on global and management-oriented interpretation rather than local explanation of individual sessions, these methods were prioritised as the main explainability tools.
4.3.1. Permutation Feature Importance
Permutation feature importance was used to evaluate the contribution of each predictor to model performance. This method measures the decrease in predictive performance after randomly permuting the values of a given feature while keeping all other features unchanged. If permuting a feature leads to a large decline in model performance, the feature is considered important because the model relies strongly on that information. Conversely, if the performance change is small, the feature has limited predictive relevance.
Let denote the baseline performance of the trained model on the original dataset with target vector . For feature , let denote the dataset obtained in the -th repetition by randomly permuting only the values of feature , while all other features remain unchanged. The permutation importance score of feature is then calculated as:
where denotes the permutation importance score of feature , is the number of repeated permutations, and represents the selected model-performance metric [44]. In this study, AUC was used as the performance score. A larger value of indicates that permuting feature causes a greater decrease in predictive performance, suggesting that the feature makes a stronger contribution to inefficient-session prediction.
4.3.2. Partial Dependence Plots
PDPs were used to examine the marginal relationship between selected predictors and the predicted probability of inefficient charging. While permutation feature importance identifies which variables are important, it does not show the direction, shape, or threshold behaviour of their effects. PDPs address this limitation by showing how the model prediction changes when a specific feature varies while the remaining predictors are averaged over the observed data distribution.
For a selected feature subset and its complement , the partial dependence function can be expressed as:
where denotes the selected feature or feature pair, represents the remaining predictors, and is the trained prediction model. In this study, one-dimensional PDPs were used to analyse the marginal effects of individual features, while two-dimensional PDPs were used to examine interaction effects between selected variables. This allows the analysis to identify nonlinear patterns, threshold effects, and joint conditions associated with higher inefficient charging risk [38].
4.3.3. Rule Extraction
Rule extraction was applied to translate the prediction behaviour of the trained model into interpretable decision rules. Although feature-importance measures and PDPs provide useful global interpretation, they do not directly express the model logic in a form that can be easily used for operational decision-making. Rule extraction helps address this issue by identifying combinations of feature conditions associated with a higher probability of inefficient charging.
In this study, rule extraction was implemented using a model-agnostic surrogate decision tree. The surrogate tree was trained using the original predictor variables as inputs and the predicted outputs of the selected machine learning model as the target. The purpose was to approximate the decision logic of the trained model with a simpler and more interpretable structure. The resulting IF–THEN rules were then used to identify typical combinations of pricing, temporal, station-level, and user-level conditions under which inefficient charging sessions were more likely to occur [46].
5. Results and Discussion
5.1. Charging-Session Typology and Inefficiency Concentration
K-means clustering was first applied to identify typical charging-session patterns. To determine the appropriate number of clusters, alternative K-means solutions were evaluated using silhouette scores and the elbow method. As shown in Figure 3, the highest silhouette score was obtained when , with a score of 0.289. The silhouette score for was slightly lower at 0.287, while the scores decreased further for larger values of k. The elbow plot also shows that the reduction in inertia became less pronounced beyond , indicating limited additional improvement in within-cluster compactness. Therefore, was retained as it provides a suitable balance between behavioural differentiation and interpretability.
Figure 3.
Selection of the K-means cluster number.
Table 3 summarises the characteristic profiles of the three K-means clusters. Based on their operational characteristics, the clusters are labelled as Long-stay Low-output, High-energy Long-duration, and Efficient Short Top-up. The Efficient Short Top-up cluster is the largest group, containing 24,561 sessions. These sessions are characterised by short occupation duration, a very low idle ratio, and relatively high energy delivered per occupied hour, suggesting rapid charger turnover and efficient infrastructure use. The High-energy Long-duration cluster contains 10,346 sessions and has the longest average session duration and the highest delivered energy. Although these sessions occupy chargers for longer periods, most of the occupation time is associated with active energy transfer rather than idle connection. This indicates that long session duration alone should not be interpreted as inefficient charging.
Table 3.
Characteristic profiles of K-means charging-session clusters.
The Long-stay Low-output cluster contains 7886 sessions and represents the most operationally inefficient charging profile. Sessions in this group have relatively long occupation duration, a high idle ratio, and low energy delivered per occupied hour. This means that vehicles in this cluster tend to occupy chargers for extended periods while delivering limited useful energy. The cluster therefore captures the behavioural pattern most closely associated with inefficient charger occupation.
Figure 4 further shows the relationship between the K-means session typologies and the rule-based inefficient-session labels defined in Section 3.3. Approximately 84.5% of sessions in the Long-stay Low-output cluster are classified as inefficient. By contrast, only 5.4% of sessions in the High-energy Long-duration cluster and 1.5% of sessions in the Efficient Short Top-up cluster are labelled as inefficient. These results indicate that inefficient charging is not randomly distributed across all charging sessions, but is structurally concentrated within a specific behavioural profile characterised by prolonged occupation and low energy productivity.
Figure 4.
Inefficient-session concentration across K-means clusters.
This finding also validates the distinction between charger occupation and effective energy delivery. A session may be long because it involves substantial charging demand, as observed in the High-energy Long-duration cluster, or because the vehicle remains connected with limited energy output, as observed in the Long-stay Low-output cluster. The latter pattern is more problematic from an infrastructure-management perspective because it reduces effective charger availability without providing proportional energy service. This supports previous evidence that overstay behaviour can create bottlenecks in charging-resource availability and that idle connection time is a key source of operational inefficiency [30].
5.2. Robustness Validation Using HDBSCAN
HDBSCAN was further applied as a robustness check to examine whether the high-inefficiency charging pattern identified by K-means could also be observed under a density-based clustering approach. As shown in Figure 5, the HDBSCAN analysis identified a high-inefficiency cluster with an inefficient-session proportion of 83.5%. This result is closely aligned with the K-means Long-stay Low-output cluster, where 84.5% of sessions were classified as inefficient. The similarity between these two proportions suggests that sessions characterised by high idle occupation and low energy productivity form a stable behavioural pattern across different clustering approaches.
Figure 5.
Robustness validation of inefficient-session concentration.
Therefore, the HDBSCAN validation supports the robustness of the main K-means typology. Although K-means is retained as the primary clustering solution because it provides clearer behavioural labels and more direct operational interpretation, the HDBSCAN result confirms that the concentration of inefficient charging sessions is not an artefact of a single clustering method.
5.3. Model Comparison for Inefficient-Session Prediction
After excluding variables that were directly used to construct the inefficient-session label, the supervised prediction models were trained using the final set of analytical predictors described in Section 3.4. Table 4 reports the predictive performance of Logistic Regression, Random Forest, XGBoost, and CatBoost on the hold-out test set.
Table 4.
Model performance for inefficient-session prediction.
Among the four models, XGBoost achieved the strongest overall performance, with the highest AUC of 0.920 and the highest PR-AUC of 0.806. The high PR-AUC is particularly important because it indicates strong predictive ability under class-imbalanced conditions, where the positive class (inefficient sessions) accounts for a smaller share of the sample. XGBoost also achieved a relatively high recall of 0.772 and an F1-score of 0.691, suggesting that it provides a balanced trade-off between detecting inefficient sessions and limiting false positives.
CatBoost achieved the highest recall value of 0.789, suggesting that it was slightly more sensitive in identifying inefficient sessions. However, its lower precision of 0.578 suggests that this sensitivity came at the cost of more false-positive predictions. Random Forest achieved the highest precision of 0.780 and the highest F1-score of 0.709, but its recall was lower than that of XGBoost and CatBoost. This indicates that Random Forest was more conservative in classifying sessions as inefficient, which reduced false positives but missed more inefficient sessions. Logistic Regression performed less favourably across all evaluation metrics, particularly in terms of PR-AUC and F1-score, suggesting that a linear model is less capable of capturing the nonlinear and interactive patterns associated with inefficient charging behaviour. The lower performance of Logistic Regression suggests that inefficient charging is not fully captured by a purely linear decision structure. Instead, the stronger performance of tree-based ensemble and boosting models indicates that nonlinear relationships and interaction effects among the variables play an important role in identifying inefficient charging sessions.
Considering the combined performance, XGBoost was selected as the primary model for subsequent interpretation. Its results indicate that inefficient charging behaviour is not only predictable, but also likely shaped by nonlinear relationships among pricing conditions, temporal routines, station operating contexts, and user-level charging patterns. The following section therefore uses the trained XGBoost model to identify and interpret the main drivers of inefficient charging sessions.
To further examine whether the model comparison results were sensitive to a single random train–test split, an additional repeated validation analysis was conducted. The stratified 80/20 train–test split was repeated 30 times using different random seeds. For each split, the models were trained and evaluated using the same preprocessing, class-weighting, and hyperparameter-tuning procedures. Table 5 reports the mean and standard deviation of the evaluation metrics across repeated runs. The results show that the relative model performance remains stable. XGBoost consistently achieves the strongest overall performance in terms of AUC and PR-AUC. Logistic Regression remains the weakest model across repeated splits, confirming that the main conclusion is not driven by one particular data partition.
Table 5.
Robustness of model performance across repeated random splits.
To examine the robustness of the inefficient-session definition, a sensitivity analysis was conducted using alternative percentile combinations. In addition to the baseline 75/25 rule, three alternative definitions were tested: 70/30, 80/20, and 90/10. The results (see Table 6) show that changing the percentile thresholds affects the number of sessions labelled as inefficient, as expected, but does not change the main empirical conclusions. Across alternative definitions, inefficient sessions remain concentrated in the Long-stay Low-output cluster, while the High-energy Long-duration and Efficient Short Top-up clusters contain only a small proportion of inefficient sessions. This confirms that the identified inefficient-charging pattern is not an artefact of one specific percentile setting.
Table 6.
Sensitivity analysis of inefficient-session definition under alternative percentile thresholds.
The supervised prediction results are also robust across threshold settings. Tree-based ensemble and boosting models consistently outperform Logistic Regression, indicating that inefficient charging is better captured by nonlinear and interaction-based models. Additionally, the key explanatory variables remain broadly stable, with pricing conditions, temporal routines, station-utilisation context, and repeated-user behaviour repeatedly emerging as important predictors. These findings suggest that the proposed definition provides a robust operational basis for identifying inefficient charging sessions.
5.4. Key Drivers of Inefficient Charging Sessions
5.4.1. Global Feature Importance
Figure 6 presents the permutation feature importance results for the XGBoost model. Pricing-related variables were the dominant predictors of inefficient charging sessions. Fee per kWh had the highest importance score of 0.312, followed by fee per session with an importance score of 0.129. This indicates that pricing conditions provide substantial information for distinguishing inefficient sessions from other charging sessions. The stronger importance of fee per kWh suggests that unit-cost signals are especially relevant to inefficient charging behaviour, while fee per session captures the overall cost burden of each charging event. This result is consistent with previous evidence that charging fees and post-charging parking fees can influence charging behaviour and reduce prolonged occupation [20].
Figure 6.
Permutation feature importance of the XGBoost model.
User-related behaviour also contributed to inefficient-session prediction. Historical visit frequency had an importance score of 0.046, suggesting that repeated charging behaviour is associated with inefficient charging risk. This may reflect the role of habitual charging routines, where frequent users become accustomed to occupying chargers for longer periods or using charging spaces as routine parking resources. Temporal and station-level variables, including session start hour, station historical session count, and station hourly session count, showed moderate importance. These variables indicate that inefficient charging is shaped not only by individual session cost, but also by when charging occurs and how charging stations are used over time.
5.4.2. Marginal Effects of Key Predictors
PDPs were used to further examine the effects of highly ranked and operationally interpretable variables. Figure 7 presents the PDPs for fee per session, session start hour, station historical session count, and station hourly session count.
Figure 7.
Partial dependence plots of key predictors.
The PDP for fee per session shows a nonlinear negative association between session-level charging cost and the predicted probability of inefficient charging. When the fee per session is low, the predicted inefficiency risk remains relatively high. As the fee increases, particularly within the low-to-medium fee range, the predicted probability declines sharply. Beyond approximately 3.2, the curve becomes nearly flat, indicating that further fee increases are associated with only limited additional reduction in predicted risk. This pattern suggests that pricing can discourage prolonged charger occupation, but only up to a certain point. Once charging fees exceed a moderate level, remaining inefficient behaviour may be driven more by parking convenience, charging necessity, or fixed travel schedules than by price alone. This finding is consistent with previous evidence that pricing mechanisms can help alleviate charging overstay and inefficient charger occupation [47].
The PDP for session start hour indicates a clear temporal pattern. The predicted probability of inefficient charging increases during the morning and reaches its highest level around 8–9 a.m. It then declines after late morning, while the lowest risk appears in the evening. One possible explanation is that morning charging sessions are more likely to coincide with commuting and workplace-parking routines, which can extend charger occupation after active charging has ended [17]. In contrast, evening sessions may be more time-constrained or linked to return-home travel, reducing the likelihood of prolonged post-charging occupation. This pattern is consistent with previous findings that charging start time, parking context, and daily travel routines are closely related to charging duration and idle connection time [30].
The PDP for station historical session count shows an inverted-U relationship. The predicted probability of inefficient charging initially rises as historical station activity increases, peaking around 700–900 sessions, and then gradually declines. This suggests that inefficient charging is not simply a linear consequence of high demand. At low-activity stations, inefficient occupation may be less likely because overall usage pressure is limited. As station popularity increases, however, growing occupation pressure may increase the likelihood of longer dwell times and reduced turnover efficiency [26]. At very high levels of historical use, the predicted risk declines, possibly because mature or heavily used stations develop more stable user expectations, clearer turnover norms, or stronger demand-management conditions.
The PDP for station hourly session count reveals a fluctuating and non-monotonic relationship. At relatively low levels of short-term station usage, predicted risk remains moderate. As the hourly session count increases, the predicted risk generally rises, suggesting that short-term station load can increase the likelihood of inefficient occupation [48]. A trough appears around 150–160 hourly sessions, followed by a rapid increase around 170–180 sessions. This may indicate a local operating range where short-term demand is temporarily well matched with charger turnover capacity, but once this balance is exceeded, additional arrivals may quickly translate into inefficient occupation. This result supports the view that inefficient charging can emerge when local demand pressure exceeds turnover capacity [25].
5.4.3. Interaction Effects
To examine whether the effects of key predictors vary across operating contexts, two-dimensional PDPs were constructed. Figure 8 presents the interaction effects of session start hour with fee per session and station hourly session count.
Figure 8.
Interaction effects on inefficient charging risk.
The joint PDP of session start hour and fee per session shows that low fees are not uniformly associated with high inefficiency risk. Instead, their effect is amplified during specific time windows. A pronounced high-risk region appears for sessions starting between approximately 6:00 and 12:00 when the fee per session is within a low-to-moderate range of around 1.0–1.6. This suggests that low charging costs are most likely to contribute to inefficient occupation when sessions overlap with morning or daytime activities, such as work-related parking or other long-dwell activities [21]. In contrast, when the fee per session exceeds approximately 3.0, the predicted risk declines substantially across most time periods. Evening sessions, particularly those starting between 18:00 and 22:00, show comparatively lower inefficiency risk under similar fee levels, possibly because evening charging is less strongly linked to long-duration parking routines [15].
The joint PDP of session start hour and station hourly session count further shows that short-term station pressure does not translate into inefficient charging uniformly across the day. A high-risk region appears between approximately 6:00 and 12:00 when station hourly session count reaches around 160–190. This indicates that station load becomes most consequential during early-in-the-day periods, when charging sessions are more likely to be associated with commuting, workplace parking, or longer dwell-time activities. By contrast, evening periods show lower predicted risk across most utilisation levels, suggesting that similar levels of station activity are less likely to result in inefficient charging later in the day.
5.5. Rule-Based Interpretation
The extracted surrogate tree identifies three representative high-risk pathways, as summarised in Table 7. These rules mainly involve fee per kWh, fee per session, and historical visit frequency, which is consistent with the feature-importance results reported in Section 5.4. This indicates that the rule-based approximation captures the dominant decision logic of the XGBoost model.
Table 7.
Representative high-risk rules extracted from the surrogate decision tree.
Rule 1 shows that when fee per kWh is no higher than 0.24 and fee per session is no higher than 1.66, sessions are classified as inefficient only when historical visit frequency exceeds 77.50. This suggests that low-cost charging does not automatically lead to inefficient occupation for all users. Instead, inefficient risk becomes more evident when low-price conditions coincide with frequent charging behaviour. A possible explanation is that repeated users may develop habitual charging routines and become more likely to treat charging spaces as familiar parking resources when the economic cost of prolonged occupation is low.
Rule 2 indicates that when fee per kWh falls within a moderate range between 0.24 and 0.38, sessions with fee per session no higher than 2.93 are also classified as inefficient. This rule suggests that total session cost remains an important behavioural signal even when the unit price is not extremely low. In other words, if the overall cost burden of a session remains modest, users may still have limited incentive to release the charger promptly after active charging has ended.
Rule 3 shows that sessions with fee per kWh above 0.38 are also assigned to the inefficient class. Although this appears counterintuitive, it may reflect charging contexts in which higher unit prices are associated with destination-based or convenience-oriented charging. In such situations, users may remain parked for work, shopping, or other activities, and inefficient occupation may be driven more by dwell-time behaviour than by low charging cost alone [49]. Therefore, the rule-based results suggest that inefficient charging is not governed by a simple linear relationship between price and behaviour. Both low-price habitual use and higher-price destination-based charging contexts may generate inefficient occupation, but through different behavioural mechanisms.
5.6. Operational Implications and Deployable Management Strategies
The empirical results provide several practical implications for intelligent charging-infrastructure management. First, the clustering results show that inefficient charging is not simply a by-product of long charging duration. The High-energy Long-duration cluster also occupies chargers for an extended period, but this occupation is largely associated with substantial energy transfer. By contrast, the Long-stay Low-output cluster is characterised by prolonged occupation, a high idle ratio, and low energy delivered per occupied hour. This distinction suggests that charging operators should not manage infrastructure efficiency using connection duration alone. Instead, operational monitoring should distinguish between productive long-duration charging and inefficient Long-stay Low-output occupation.
Second, the model-interpretation results highlight the importance of pricing design. Pricing-related variables, particularly fee per kWh and fee per session, are the strongest predictors of inefficient charging. The PDP results further suggest that higher session fees are associated with lower inefficient charging risk, although the marginal effect becomes weaker beyond a moderate fee level. This indicates that pricing mechanisms may help improve charger turnover, but uniform price increases are unlikely to fully eliminate inefficient occupation. A more effective approach may involve differentiated pricing or targeted idle-fee policies that respond to local congestion, the time of day, and station utilisation conditions. This is consistent with previous evidence that charging and post-charging parking fees can influence charging behaviour and reduce prolonged occupation [20,47].
Third, inefficient charging appears to be shaped by user routines. Historical visit frequency contributes to model prediction and appears in the extracted high-risk rules, suggesting that repeated users may develop habitual charging and parking behaviours. For operators, this implies that inefficient occupation should not only be addressed through station-level pricing, but also through user-level behavioural interventions. Examples include personalised reminders, repeated-overstay notifications, loyalty-based incentives for timely unplugging, or differentiated warnings for users with a history of prolonged idle occupation. Such interventions may be less disruptive than blanket penalties and can help encourage behavioural change among users most likely to contribute to inefficient occupation.
Fourth, the interaction effects indicate that inefficient charging risk is time-sensitive. Low-to-moderate fees are most strongly associated with higher predicted risk during morning and daytime periods, particularly around commuting and workplace-parking windows. Similarly, station hourly session count becomes more consequential during early-in-the-day periods, suggesting that real-time station pressure does not translate into inefficient charging uniformly throughout the day. Charging operators may therefore benefit from time-sensitive management strategies, such as stronger idle reminders during morning peak periods, dynamic turnover incentives during high-risk windows, or temporary escalation of idle fees when local station pressure rises.
Fifth, the results suggest that infrastructure planning should not focus only on expanding charger supply. If inefficient sessions are concentrated in specific behavioural profiles, adding more chargers may not fully solve local access problems unless charger turnover is also improved. Intelligent infrastructure management should therefore combine capacity expansion with operational efficiency measures. These may include monitoring idle occupation, identifying stations with persistent Long-stay Low-output behaviour, adjusting pricing rules by station context, and using predictive models to flag sessions or locations with elevated inefficient-occupation risk.
To further translate the predictive results into deployable charging-management strategies, Table 8 summarises how the model outputs and empirical findings can be operationalised by charging operators. The proposed strategies are not intended as universal pricing rules, because appropriate fee levels depend on local tariffs, parking regulations, charger types, and user acceptance. Instead, they provide a data-driven management logic that can be calibrated by operators using local operational targets. In particular, the empirical inefficient-session thresholds identified in this study, namely an idle ratio above 0.1296 and energy delivered per occupied hour below 2.9007 kWh/h, can be used as initial monitoring thresholds for detecting Long-stay Low-output behaviour. The prediction model can further be used to prioritise high-risk sessions, stations, or time windows before inefficient occupation becomes persistent.
Table 8.
Translating predictive analytics into charging-management strategies.
These strategies bridge the gap between predictive analytics and operational deployment. For example, the framework can be implemented as a two-stage management system. In the first stage, real-time monitoring identifies sessions approaching the inefficient-occupation profile based on idle ratio, energy productivity, station pressure, and predicted risk. In the second stage, operators apply differentiated interventions, such as reminders, targeted idle-fee escalation, or station-level turnover policies. The expected improvements include reduced non-charging occupation, higher energy delivered per occupied hour, increased effective charger availability, and fewer cases in which charger expansion is used to compensate for inefficient use of existing infrastructure.
6. Conclusions
This study proposed a hybrid data-driven framework for identifying, predicting, and explaining inefficient EV charging sessions. Using charging-session data from California, inefficient charging was defined based on the joint condition of a high idle ratio and low energy delivered per occupied hour. The study then combined K-means clustering, HDBSCAN robustness validation, supervised classification, and post hoc model interpretation to examine whether inefficient charging forms identifiable behavioural patterns and whether it can be predicted using observable session-level, temporal, pricing, station-level, connector-level, and user-level information.
The empirical results provide three main findings. First, inefficient charging is strongly associated with a distinct long-stay, low-output charging profile. The K-means analysis identified three charging-session typologies: Long-stay Low-output, High-energy Long-duration, and Efficient Short Top-up. Importantly, the results show that long connection duration alone is not a reliable indicator of inefficient infrastructure use. High-energy Long-duration sessions may still represent productive charger occupation when the occupied time is converted into substantial energy delivery. By contrast, inefficient sessions are concentrated in the Long-stay Low-output cluster, where vehicles remain connected for relatively long periods while delivering limited energy. The HDBSCAN robustness check further confirms that this high-inefficiency behavioural pattern is not an artefact of a single clustering method.
Second, inefficient charging sessions can be predicted effectively using observable contextual and behavioural features. Among the four supervised models compared, XGBoost achieved the strongest overall performance. This indicates that inefficient charger occupation is not purely random, but is shaped by systematic nonlinear relationships among pricing conditions, user routines, temporal patterns, and station operating contexts.
Third, the interpretation results show that pricing-related variables are the dominant predictors of inefficient charging risk. Fee per kWh and fee per session contribute most strongly to the XGBoost prediction, while historical visit frequency, session start hour, and station-utilisation indicators provide additional explanatory information. The partial dependence results reveal nonlinear effects, suggesting that increasing session-level fees is associated with lower inefficient charging risk, but with diminishing marginal effects beyond a moderate fee level. The rule-extraction results further show that inefficient charging risk can arise under different behavioural pathways, including low-cost frequent-user behaviour and charging contexts where occupation may be driven more by destination-based dwell time than by energy demand alone.
These findings contribute to the literature on EV charging management in three ways. First, the study shifts attention from aggregate charger utilisation and charging-demand forecasting to session-level inefficient charger occupation. This provides a clearer basis for distinguishing between occupied charging time and effective energy delivery. Second, it demonstrates that inefficient charging should be separated from productive long-duration charging, thereby avoiding the misleading assumption that all long sessions are operationally inefficient. Third, it develops an interpretable prediction framework that links machine learning outputs to actionable charging-management evidence. By integrating typology identification, prediction, and model interpretation, the framework supports a more intelligent and operationally meaningful understanding of how effective charging capacity is lost within existing infrastructure networks.
Future research should further examine the transferability and external validity of the proposed framework. This study is based on charging-session data from California, and the results may be influenced by local travel behaviour, pricing rules, parking conditions, and charging-network design. Additionally, the current dataset does not include detailed charging-power variability, weather information, or vehicle-specific characteristics such as battery capacity, state of charge, and vehicle model, which may further affect charging duration and energy delivery. Future studies could integrate these additional variables and test the framework using independent datasets from other regions, charging operators, and pricing environments. Such extensions would help assess whether the inefficient-session definition, prediction model, and operational interpretation remain robust across different charging-network contexts.
Author Contributions
Conceptualization, T.D. and Q.P.; methodology, F.W., J.Z. and Q.P.; software, F.W.; validation, F.W., J.Z. and H.Z.; formal analysis, F.W.; investigation, F.W. and J.Z.; resources, T.D. and Q.P.; data curation, F.W. and H.Z.; writing—original draft preparation, F.W.; writing—review and editing, J.Z., T.D., H.Z. and Q.P.; visualisation, F.W. and H.Z.; supervision, T.D. and Q.P.; project administration, T.D. and Q.P.; funding acquisition, Q.P. All authors have read and agreed to the published version of the manuscript.
Funding
This work was supported by the Shenzhen Science and Technology Program under Grant GJHZ20240218113404009.
Data Availability Statement
The data presented in this study are available on request from the corresponding author.
Conflicts of Interest
The authors declare no conflicts of interest.
Abbreviations
The following abbreviations are used in this manuscript:
| EV | Electric Vehicles |
| HDBSCAN | Hierarchical Density-Based Spatial Clustering of Applications with Noise |
| PDP | Partial Dependence Plots |
| SHAP | SHapley Additive exPlanations |
| SSE | Sum of Squared Errors |
| PR-AUC | Precision-Recall AUC |
References
- Peng, Q.; Liu, W.; Shi, Y.; Dai, Y.; Yu, K.; Graham, B. Multi-objective electricity generation expansion planning towards renewable energy policy objectives under uncertainties. Renew. Sustain. Energy Rev. 2024, 197, 114406. [Google Scholar] [CrossRef] [Scilit]
- Huang, W.; Wang, J.; Wang, J.; Zeng, H.; Zhou, M.; Cao, J. EV charging load profile identification and seasonal difference analysis via charging sessions data of charging stations. Energy 2024, 288, 129771. [Google Scholar] [CrossRef] [Scilit]
- Dimitriadou, K.; Rigogiannis, N.; Fountoukidis, S.; Kotarela, F.; Kyritsis, A.; Papanikolaou, N. Current trends in electric vehicle charging infrastructure; opportunities and challenges in wireless charging integration. Energies 2023, 16, 2057. [Google Scholar] [CrossRef] [Scilit]
- Sone, S.P.; Lehtomäki, J.J.; Khan, Z.; Robles-Medina, J. A Cost-Efficient Approach to Managing Simultaneous Charging Sessions in Large-Scale EV Stations. IEEE Trans. Intell. Transp. Syst. 2025, 27, 579–592. [Google Scholar]
- Brinkel, N.; van Wijk, T.; Buijze, A.; Panda, N.K.; Meersmans, J.; Markotić, P.; van der Ree, B.; Fidder, H.; de Brey, B.; Tindemans, S.; et al. Enhancing smart charging in electric vehicles by addressing paused and delayed charging problems. Nat. Commun. 2024, 15, 5089. [Google Scholar] [CrossRef] [Scilit] [PubMed]
- Seo, D.; Moon, J.; Kwon, H.Y. Electric vehicle charging station recommendation system based on graph neural network and context-aware refinement. Sci. Rep. 2026, 16, 11284. [Google Scholar] [CrossRef] [Scilit] [PubMed]
- Ahmed, M.U.; Qays, M.O.; Lachowicz, S.; Mahmud, P. Optimizing EV Battery Charging Using Fuzzy Logic in the Presence of Uncertainties and Unknown Parameters. Electronics 2025, 15, 177. [Google Scholar] [CrossRef] [Scilit]
- Nishimwe H., L.F.; Song, K.M.; Yoon, S.G. A Framework for the Configuration and Operation of EV/FCEV Fast-Charging Stations Integrated with DERs Under Uncertainty. Electronics 2025, 14, 4113. [Google Scholar] [CrossRef] [Scilit]
- Shen, Y.; Fang, W.; Ye, F.; Kadoch, M. EV charging behavior analysis using hybrid intelligence for 5G smart grid. Electronics 2020, 9, 80. [Google Scholar] [CrossRef] [Scilit]
- Zeng, T.; Zhang, H.; Moura, S. Solving overstay and stochasticity in PEV charging station planning with real data. IEEE Trans. Ind. Inform. 2019, 16, 3504–3514. [Google Scholar]
- Ali, Y.; Monsuur, F.; Morton, C.; Man, C.K. Modelling electric vehicle charging events using a random parameter duration approach. Travel Behav. Soc. 2025, 39, 100989. [Google Scholar] [CrossRef] [Scilit]
- Chen, B.; Chen, Z.; Liu, X.C.; Yi, Z. Bayesian inference-based spatiotemporal modeling with interim activities for EV charging etiquette. Transp. Res. Part D Transp. Environ. 2024, 127, 104060. [Google Scholar] [CrossRef] [Scilit]
- Bayram, I.S.; Saad, A.; Sims, R.; Herron, C.; Galloway, S. Usage analysis of public AC chargers in the UK. In EVI: Charging Ahead (EVI 2023); IET: Stevenage, UK, 2023; Volume 2023, pp. 40–43. [Google Scholar]
- Kamana-Williams, B.; Bishop, D.; Hooper, G.; Chase, J.G. Driving change: Electric vehicle charging behavior and peak loading. Renew. Sustain. Energy Rev. 2024, 189, 113953. [Google Scholar] [CrossRef] [Scilit]
- Roozkhosh, F.; Yao, X.A. Understanding electric vehicle charging behavior: A multidisciplinary review and conceptual framework. Transp. Res. Part D Transp. Environ. 2026, 153, 105227. [Google Scholar] [CrossRef] [Scilit]
- Lee, J.H.; Chakraborty, D.; Hardman, S.J.; Tal, G. Exploring electric vehicle charging patterns: Mixed usage of charging infrastructure. Transp. Res. Part D Transp. Environ. 2020, 79, 102249. [Google Scholar] [CrossRef] [Scilit]
- Yang, X.; Peng, Z.; Wang, P.; Zhuge, C. Seasonal variance in electric vehicle charging demand and its impacts on infrastructure deployment: A big data approach. Energy 2023, 280, 128230. [Google Scholar] [CrossRef] [Scilit]
- Sørensen, Å.L.; Sartori, I.; Lindberg, K.B.; Andresen, I. A method for generating complete EV charging datasets and analysis of residential charging behaviour in a large Norwegian case study. Sustain. Energy Grids Netw. 2023, 36, 101195. [Google Scholar] [CrossRef] [Scilit]
- Kuang, H.; Zhang, X.; Qu, H.; You, L.; Zhu, R.; Li, J. Unraveling the effect of electricity price on electric vehicle charging behavior: A case study in Shenzhen, China. Sustain. Cities Soc. 2024, 115, 105836. [Google Scholar] [CrossRef] [Scilit]
- Luo, S.; Wang, Y. The impacts of rate surge on electric vehicle charging behaviors: Evidence from California. J. Econ. Behav. Organ. 2025, 236, 107048. [Google Scholar] [CrossRef] [Scilit]
- Wolbertus, R.; Kroesen, M.; Van Den Hoed, R.; Chorus, C. Fully charged: An empirical study into the factors that influence connection times at EV-charging stations. Energy Policy 2018, 123, 1–7. [Google Scholar] [CrossRef] [Scilit]
- Huang, P.; Ma, Z. Unveiling electric vehicle (EV) charging patterns and their transformative role in electricity balancing and delivery: Insights from real-world data in Sweden. Renew. Energy 2024, 236, 121511. [Google Scholar] [CrossRef] [Scilit]
- Daina, N.; Sivakumar, A.; Polak, J.W. Electric vehicle charging choices: Modelling and implications for smart charging services. Transp. Res. Part C Emerg. Technol. 2017, 81, 36–56. [Google Scholar] [CrossRef] [Scilit]
- Asensio, O.I.; Lawson, M.C.; Apablaza, C.Z. Electric vehicle charging stations in the workplace with high-resolution data from casual and habitual users. Sci. Data 2021, 8, 168. [Google Scholar] [CrossRef] [Scilit] [PubMed]
- Hecht, C.; Figgener, J.; Sauer, D.U. Analysis of electric vehicle charging station usage and profitability in Germany based on empirical data. iScience 2022, 25, 105634. [Google Scholar] [CrossRef] [Scilit] [PubMed]
- Borlaug, B.; Yang, F.; Pritchard, E.; Wood, E.; Gonder, J. Public electric vehicle charging station utilization in the United States. Transp. Res. Part D Transp. Environ. 2023, 114, 103564. [Google Scholar] [CrossRef] [Scilit]
- Ziras, C.; Thingvad, M.; Fog, T.; Yousefi, G.; Weckesser, T. An empirical analysis of electric vehicle charging behavior based on real Danish residential charging data. Electr. Power Syst. Res. 2024, 234, 110556. [Google Scholar] [CrossRef] [Scilit]
- Al-Dahabreh, N.; Sayed, M.A.; Sarieddine, K.; Elhattab, M.; Khabbaz, M.J.; Atallah, R.F.; Assi, C. A data-driven framework for improving public EV charging infrastructure: Modeling and forecasting. IEEE Trans. Intell. Transp. Syst. 2023, 25, 5935–5948. [Google Scholar] [CrossRef] [Scilit]
- Desai, R.R.; Chen, R.B.; Armington, W. A pattern analysis of daily electric vehicle charging profiles: Operational efficiency and environmental impacts. J. Adv. Transp. 2018, 2018, 6930932. [Google Scholar] [CrossRef] [Scilit]
- Zhou, X.; Cai, Y.; Meng, Q.; Ji, Y. A user behavior and reinforcement learning based dynamic pricing method for idle connection time reduction at charging stations. Transp. Res. Part A Policy Pract. 2025, 192, 104358. [Google Scholar] [CrossRef] [Scilit]
- Xydas, E.; Marmaras, C.; Cipcigan, L.M.; Jenkins, N.; Carroll, S.; Barker, M. A data-driven approach for characterising the charging demand of electric vehicles: A UK case study. Appl. Energy 2016, 162, 763–771. [Google Scholar] [CrossRef] [Scilit]
- Helmus, J.R.; Lees, M.H.; Van Den Hoed, R. A data driven typology of electric vehicle user types and charging sessions. Transp. Res. Part C Emerg. Technol. 2020, 115, 102637. [Google Scholar] [CrossRef] [Scilit]
- Powell, S.; Cezar, G.V.; Rajagopal, R. Scalable probabilistic estimates of electric vehicle charging given observed driver behavior. Appl. Energy 2022, 309, 118382. [Google Scholar] [CrossRef] [Scilit]
- Brinkel, N.; Visser, L.; van Sark, W.; AlSkaif, T. A novel forecasting approach to schedule aggregated electric vehicle charging. Energy AI 2023, 14, 100297. [Google Scholar] [CrossRef] [Scilit]
- Sreekumar, A.V.; Lekshmi, R.R. Electric vehicle charging station demand prediction model deploying data slotting. Results Eng. 2024, 24, 103095. [Google Scholar] [CrossRef] [Scilit]
- Bellizio, F.; Dijkstra, B.; Fertig, A.; Van Dijk, J.; Heer, P. Machine learning approaches for the prediction of public EV charge point flexibility. Sustain. Energy Grids Netw. 2025, 42, 101657. [Google Scholar] [CrossRef] [Scilit]
- Mu, Y.; Zhou, R.; Zhao, K.; Jia, H.; Zu, G.; Yang, Y. A charging demand prediction method for individual electric vehicle users based on dual-layer multisource data clustering and a LightGBM. Energy AI 2025, 22, 100644. [Google Scholar] [CrossRef] [Scilit]
- Zhang, H.; Su, Y.; Altaf, F.; Wik, T.; Gros, S. Interpretable battery cycle life range prediction using early cell degradation data. IEEE Trans. Transp. Electrif. 2022, 9, 2669–2682. [Google Scholar] [CrossRef] [Scilit]
- Ullah, I.; Liu, K.; Yamamoto, T.; Zahid, M.; Jamal, A. Modeling of machine learning with SHAP approach for electric vehicle charging station choice behavior prediction. Travel Behav. Soc. 2023, 31, 78–92. [Google Scholar] [CrossRef] [Scilit]
- Shang, Y.; Li, D.; Li, Y.; Li, S. Explainable spatiotemporal multi-task learning for electric vehicle charging demand prediction. Appl. Energy 2025, 384, 125460. [Google Scholar] [CrossRef] [Scilit]
- Zhang, T.; Peng, Q.; Zeng, S. Predicting EV charging demand in renewable-energy-powered grids using explainable machine learning. Sustainability 2025, 17, 4158. [Google Scholar] [CrossRef] [Scilit]
- Gaon, T.; Gabay, Y.; Weiss Cohen, M. Optimizing electric vehicle routing efficiency using k-means clustering and genetic algorithms. Future Internet 2025, 17, 97. [Google Scholar] [CrossRef] [Scilit]
- Saklani, M.; Saini, D.K.; Yadav, M.; Siano, P. Scalable Data-Driven EV Charging Optimization Using HDBSCAN-LP for Real-Time Pricing Load Management. Smart Cities 2025, 8, 139. [Google Scholar] [CrossRef] [Scilit]
- Peng, Q.; McKillop, D.; Quinn, B.; Liu, K. Modeling and predicting failure in US credit unions. Int. J. Forecast. 2025, 41, 1237–1259. [Google Scholar] [CrossRef] [Scilit]
- Kou, R.; Hunter, R.F.; Cleland, C.; Ferguson, S.; Schipperijn, J.; Peng, Q.; Ellis, G. Built environment influences on park visits for older adults: Insights from a machine learning approach. Cities 2025, 165, 106143. [Google Scholar] [CrossRef] [Scilit]
- Zou, S.; Zhang, J.; Yang, Y.; Zhou, Y.; Liu, Y.; Peng, J.; Feng, X. Rule-based control strategy for a novel dual-motor PHEV improved by dynamic programming. Electronics 2025, 14, 1450. [Google Scholar] [CrossRef] [Scilit]
- Santoyo, C.; Nilsson, G.; Coogan, S. Resource aware pricing for electric vehicle charging. Automatica 2023, 148, 110733. [Google Scholar] [CrossRef] [Scilit]
- Yong, J.Y.; Tan, W.S.; Khorasany, M.; Razzaghi, R. Electric vehicles destination charging: An overview of charging tariffs, business models and coordination strategies. Renew. Sustain. Energy Rev. 2023, 184, 113534. [Google Scholar] [CrossRef] [Scilit]
- Visaria, A.A.; Jensen, A.F.; Thorhauge, M.; Mabit, S.E. User preferences for EV charging, pricing schemes, and charging infrastructure. Transp. Res. Part A Policy Pract. 2022, 165, 120–143. [Google Scholar] [CrossRef] [Scilit]
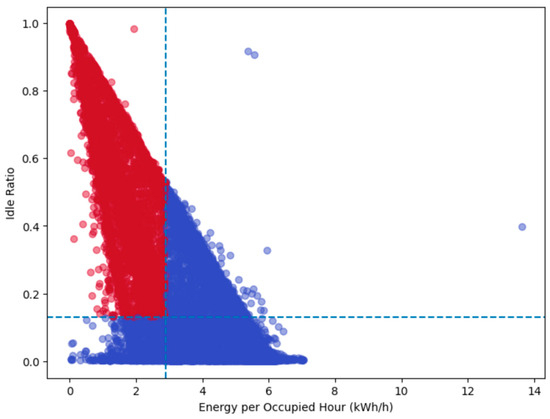
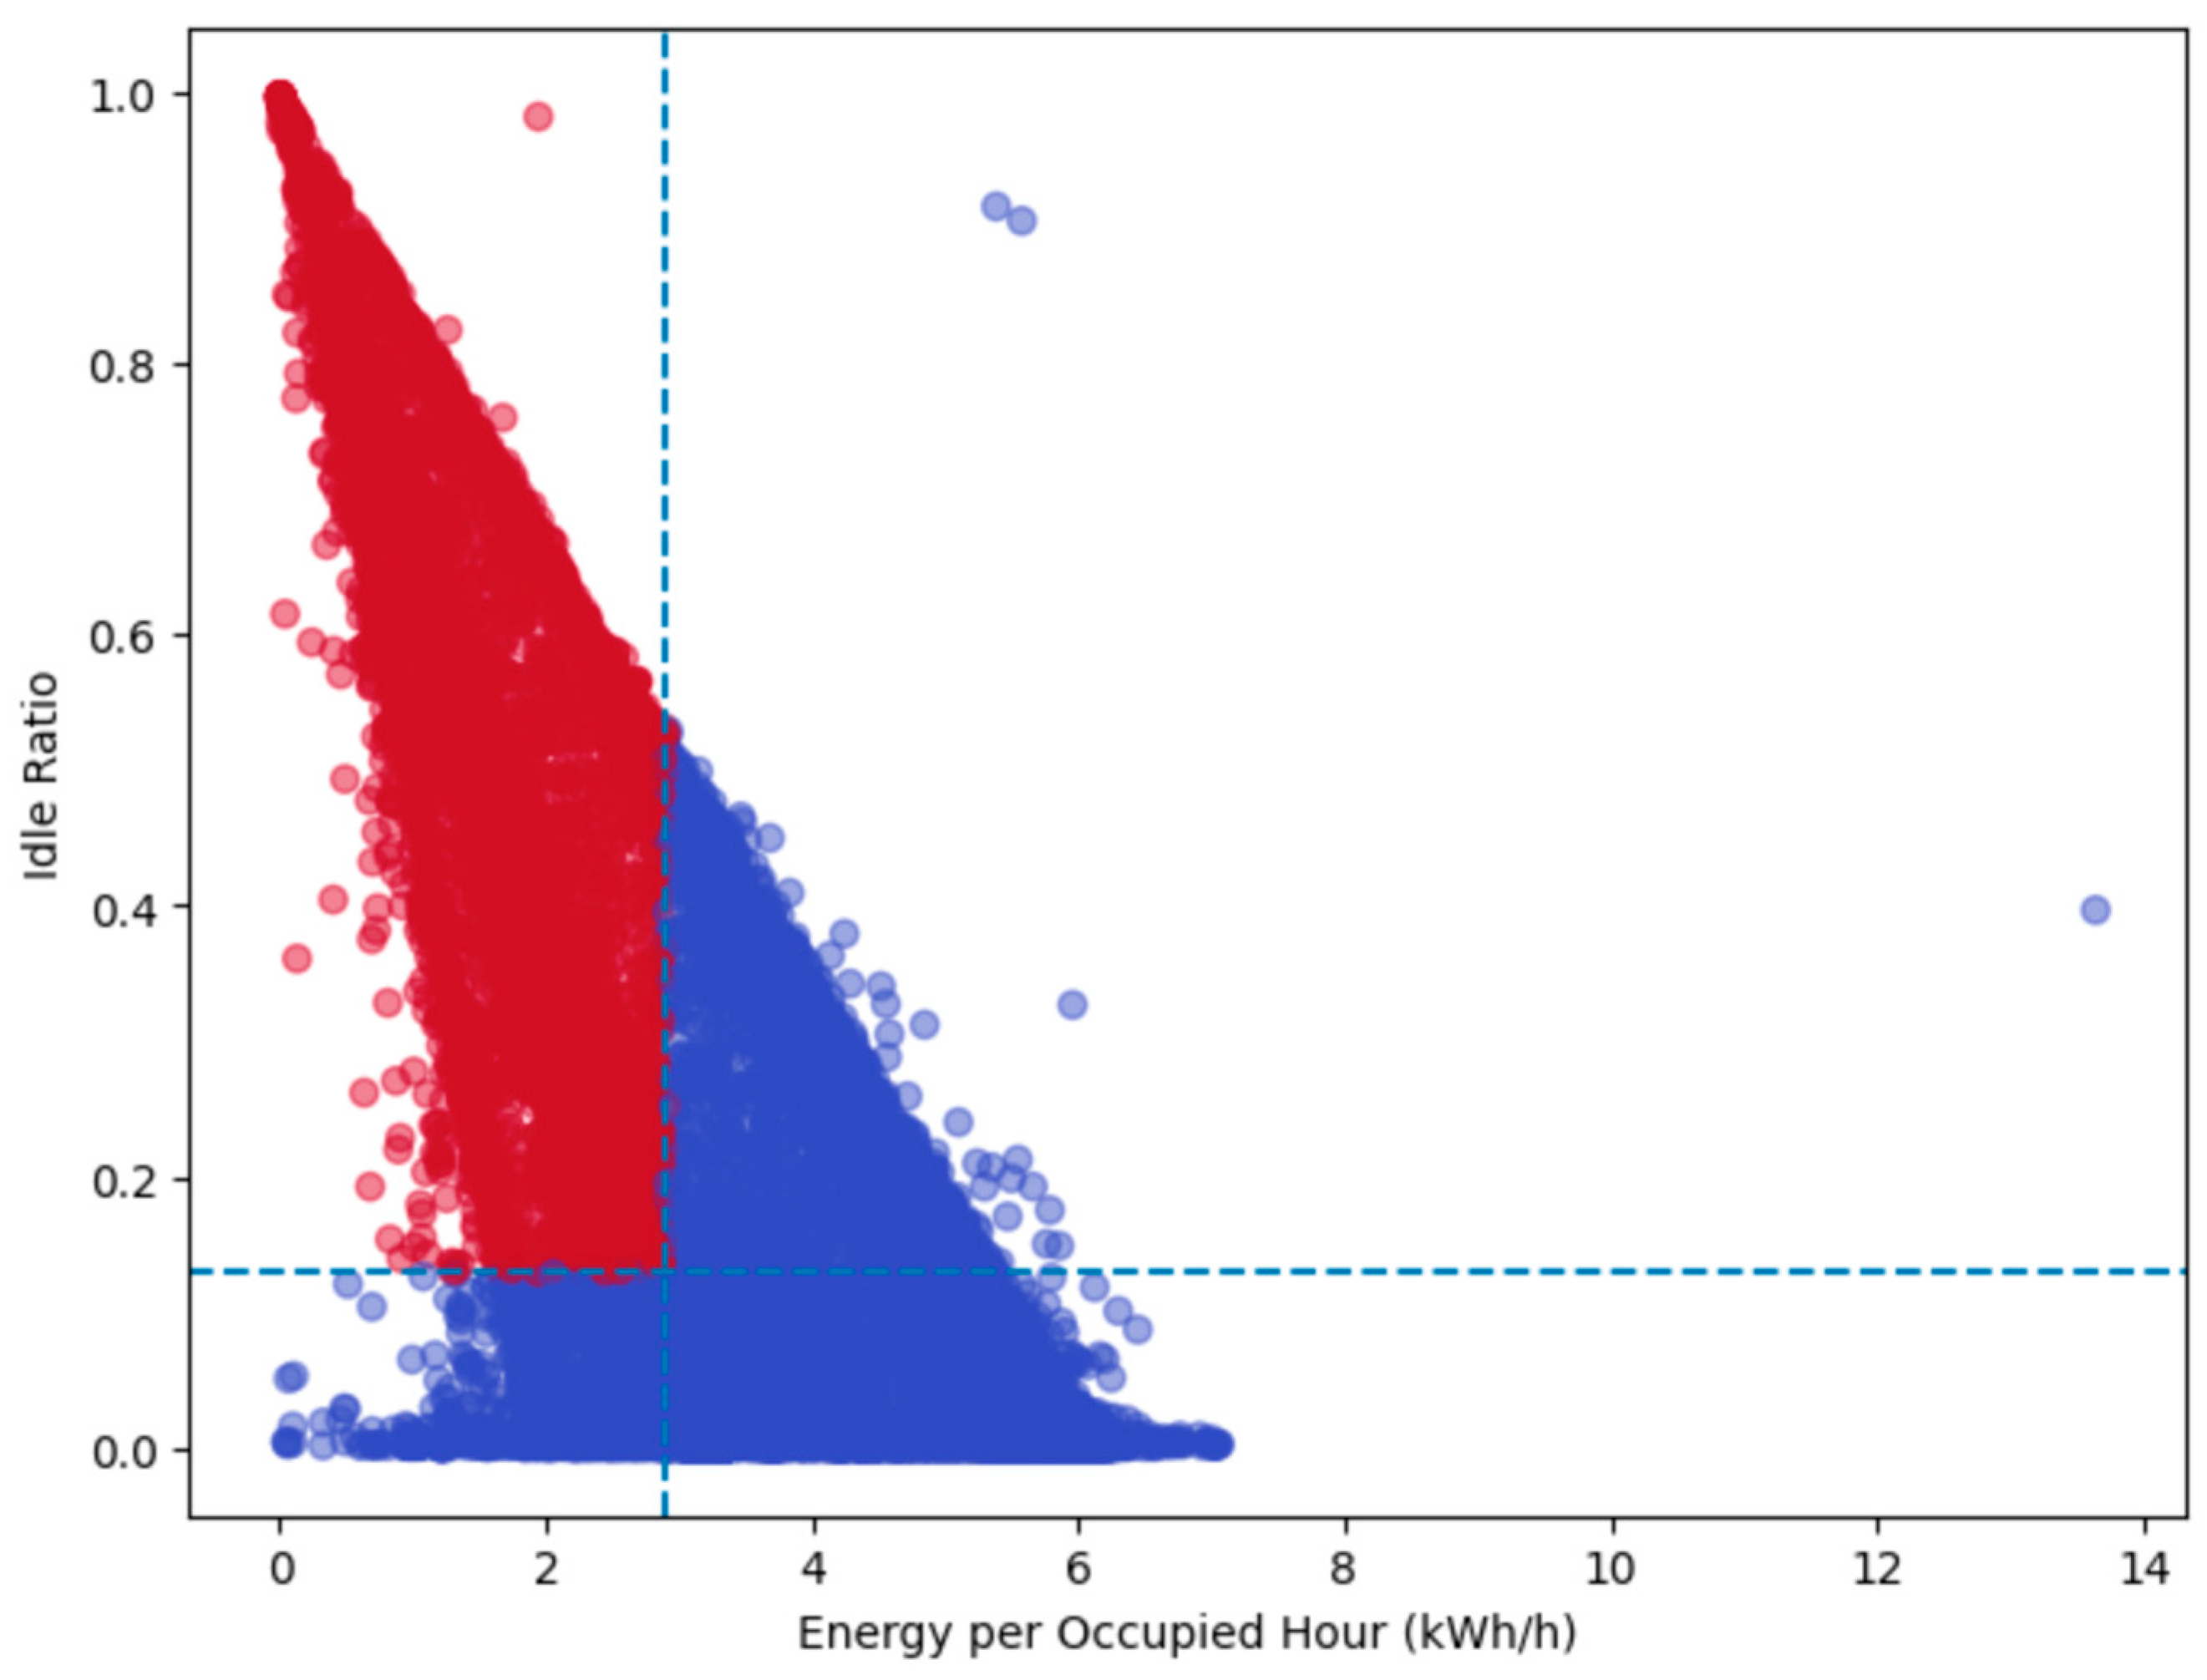
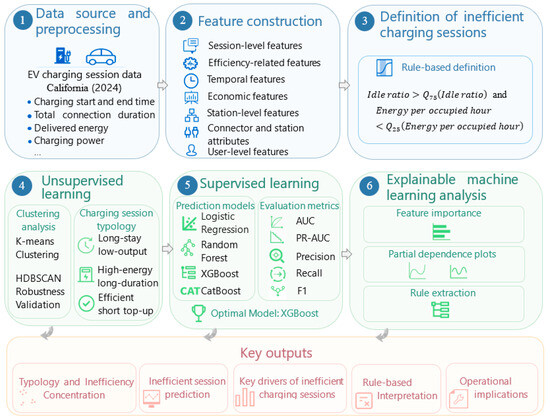
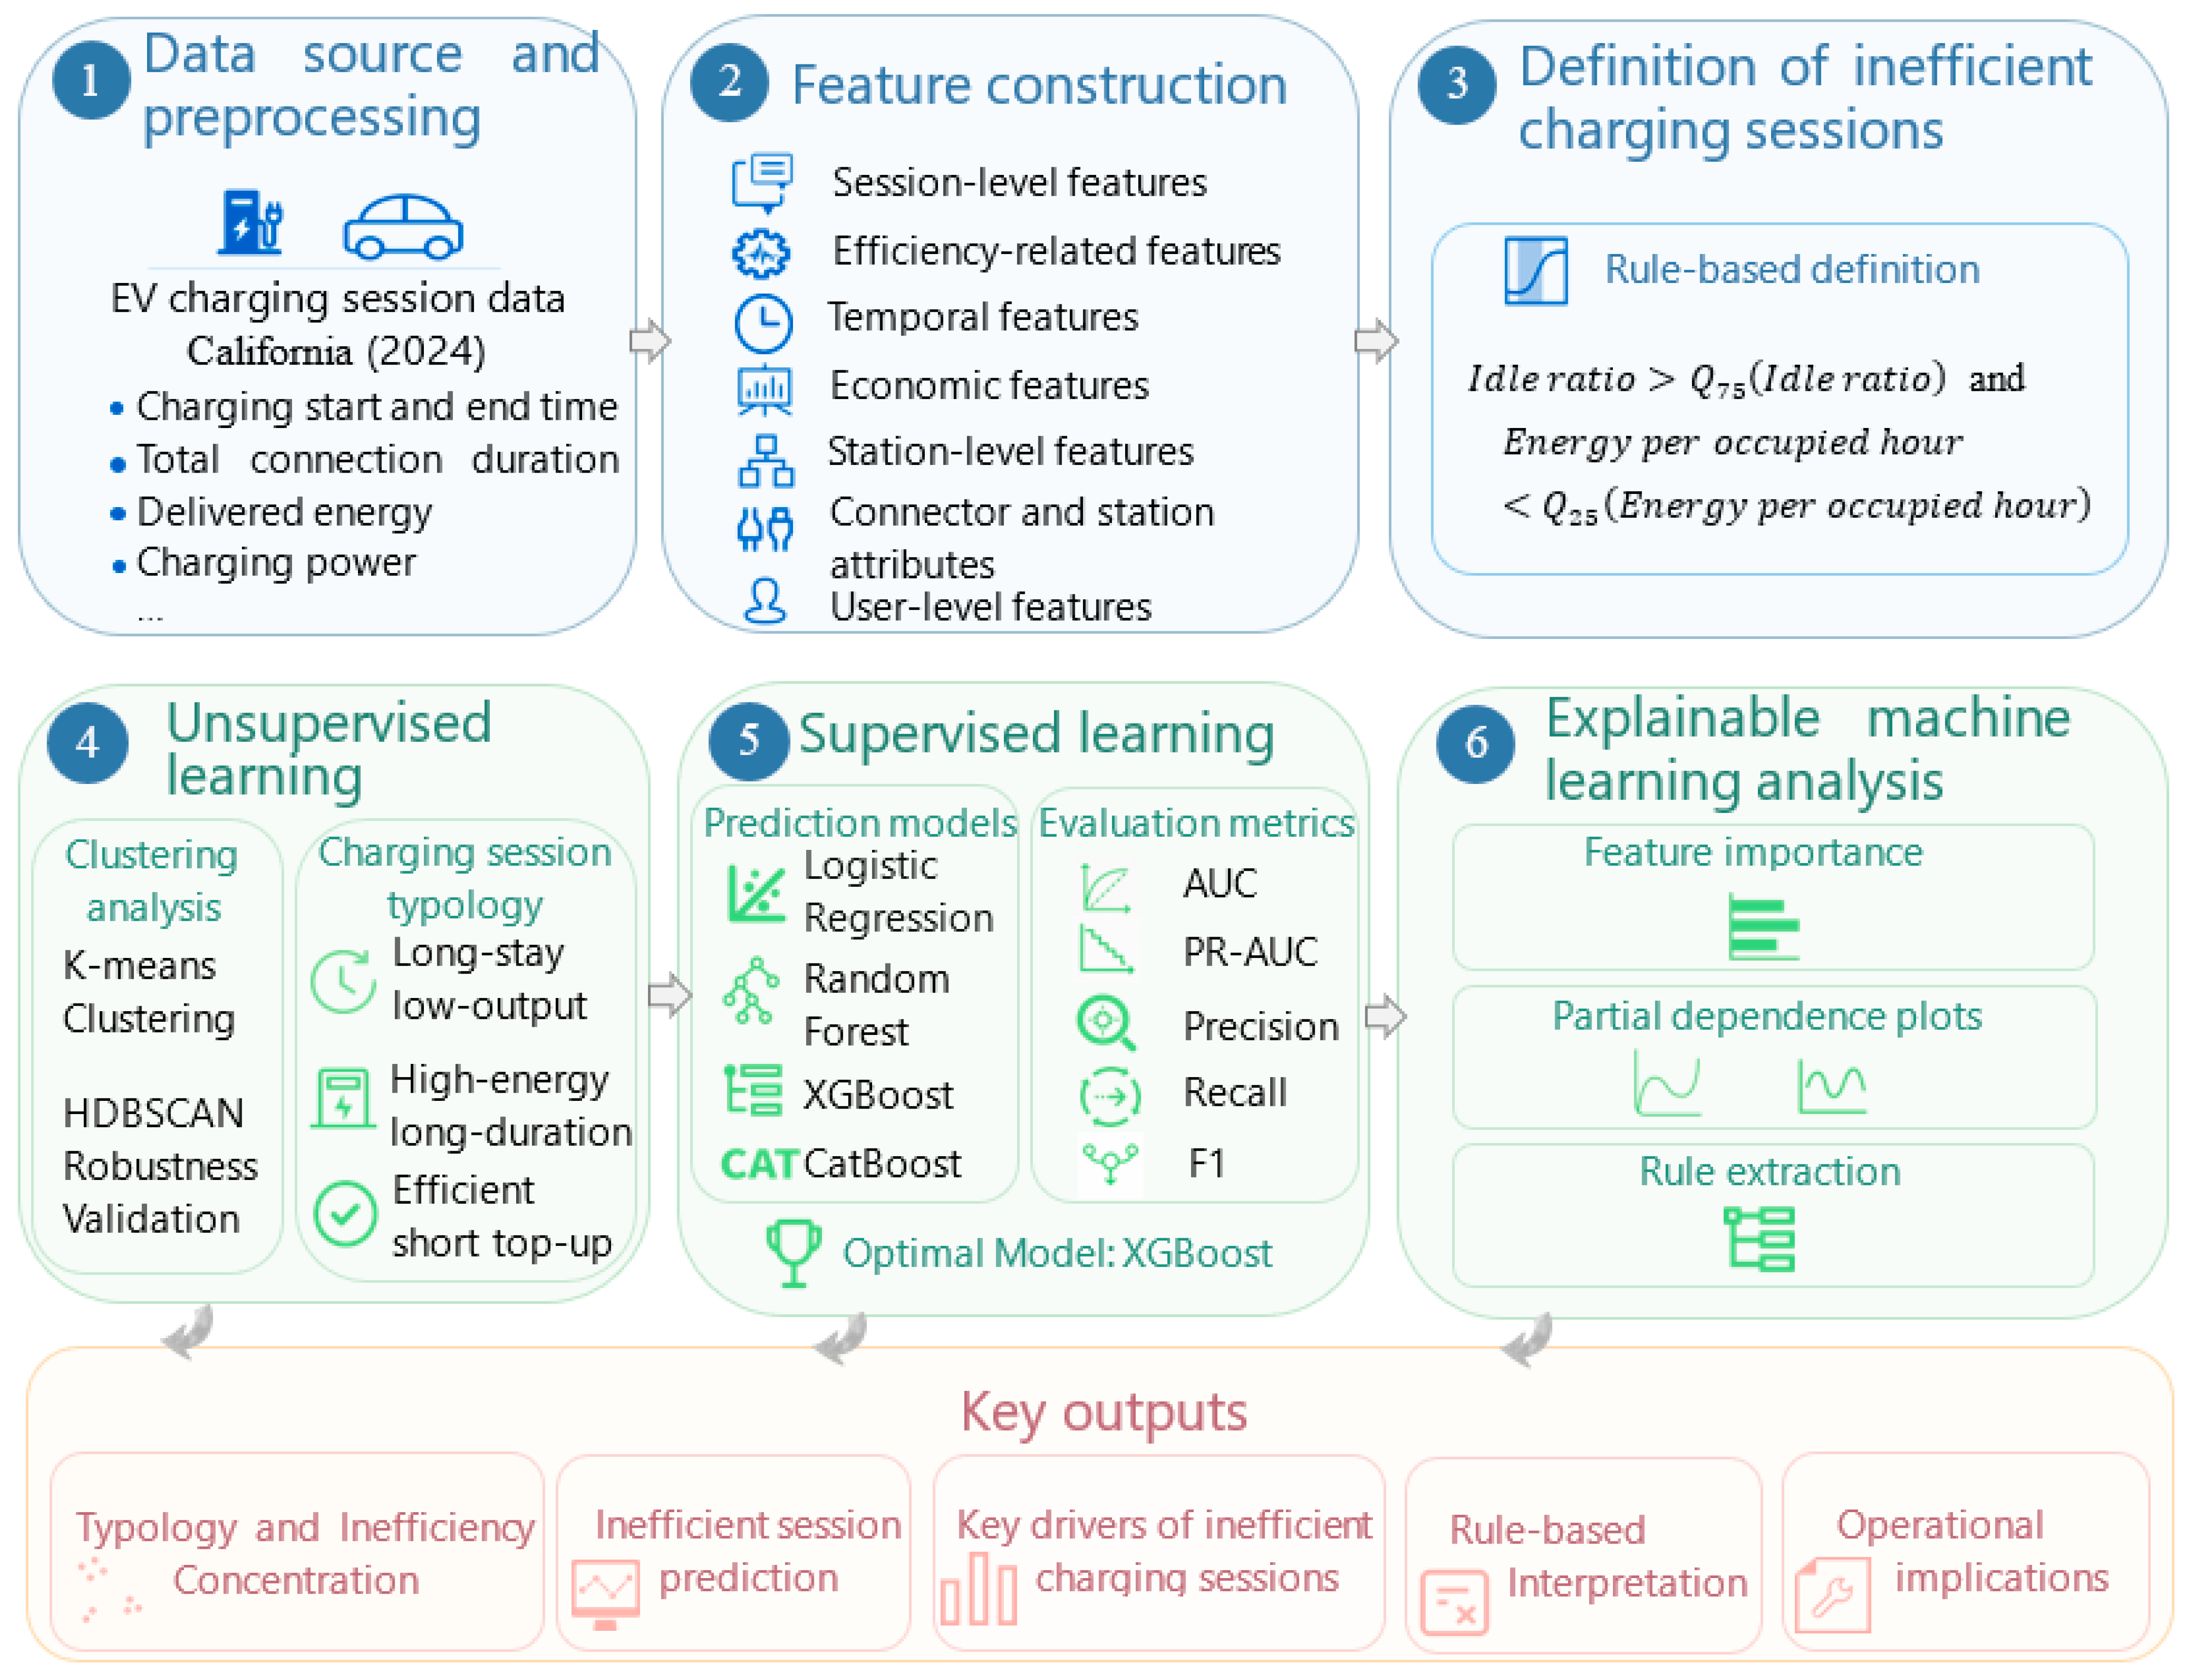
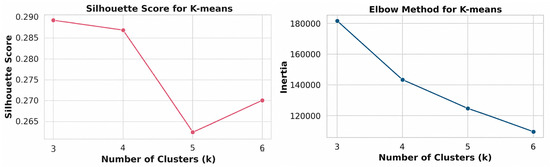
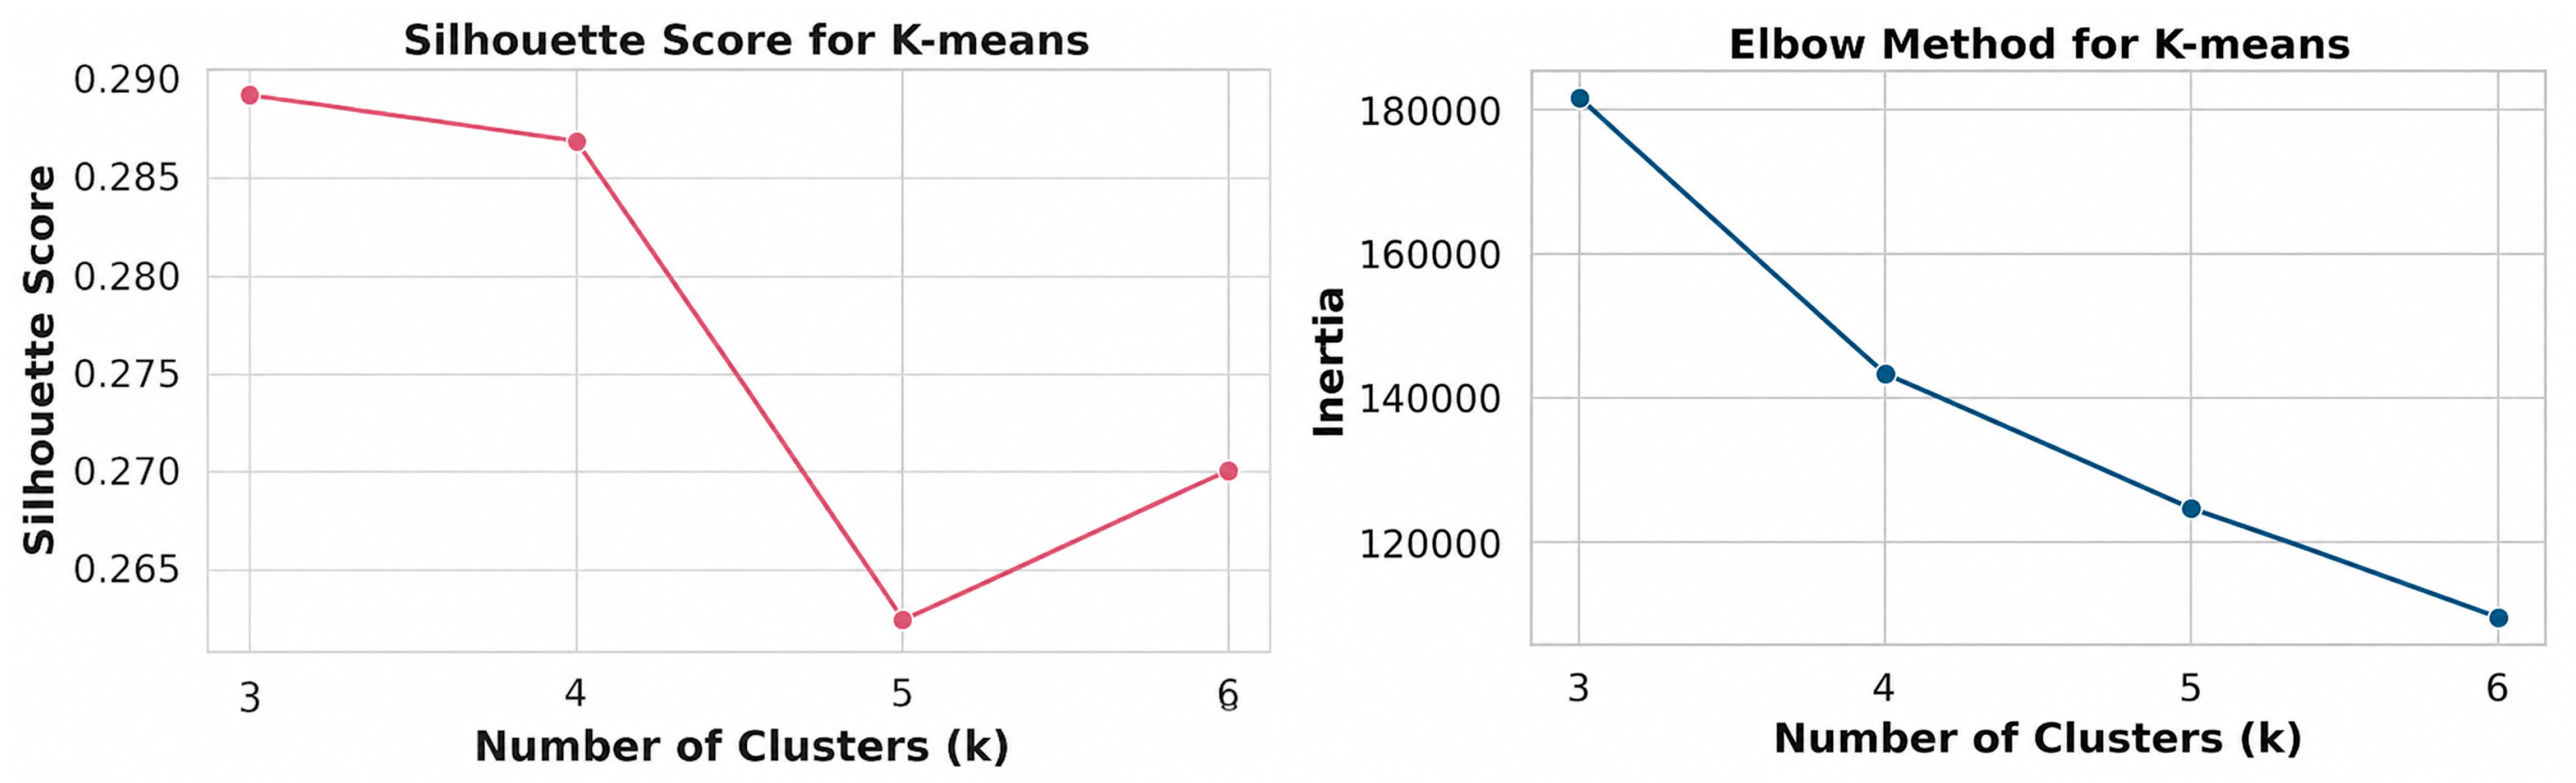
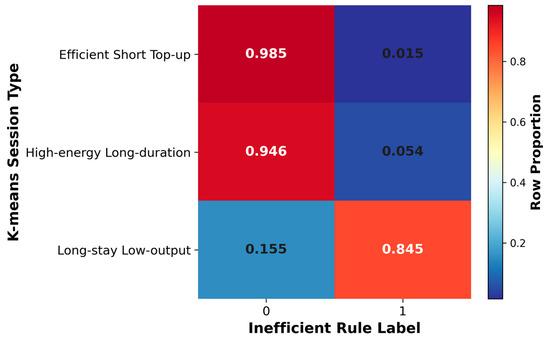
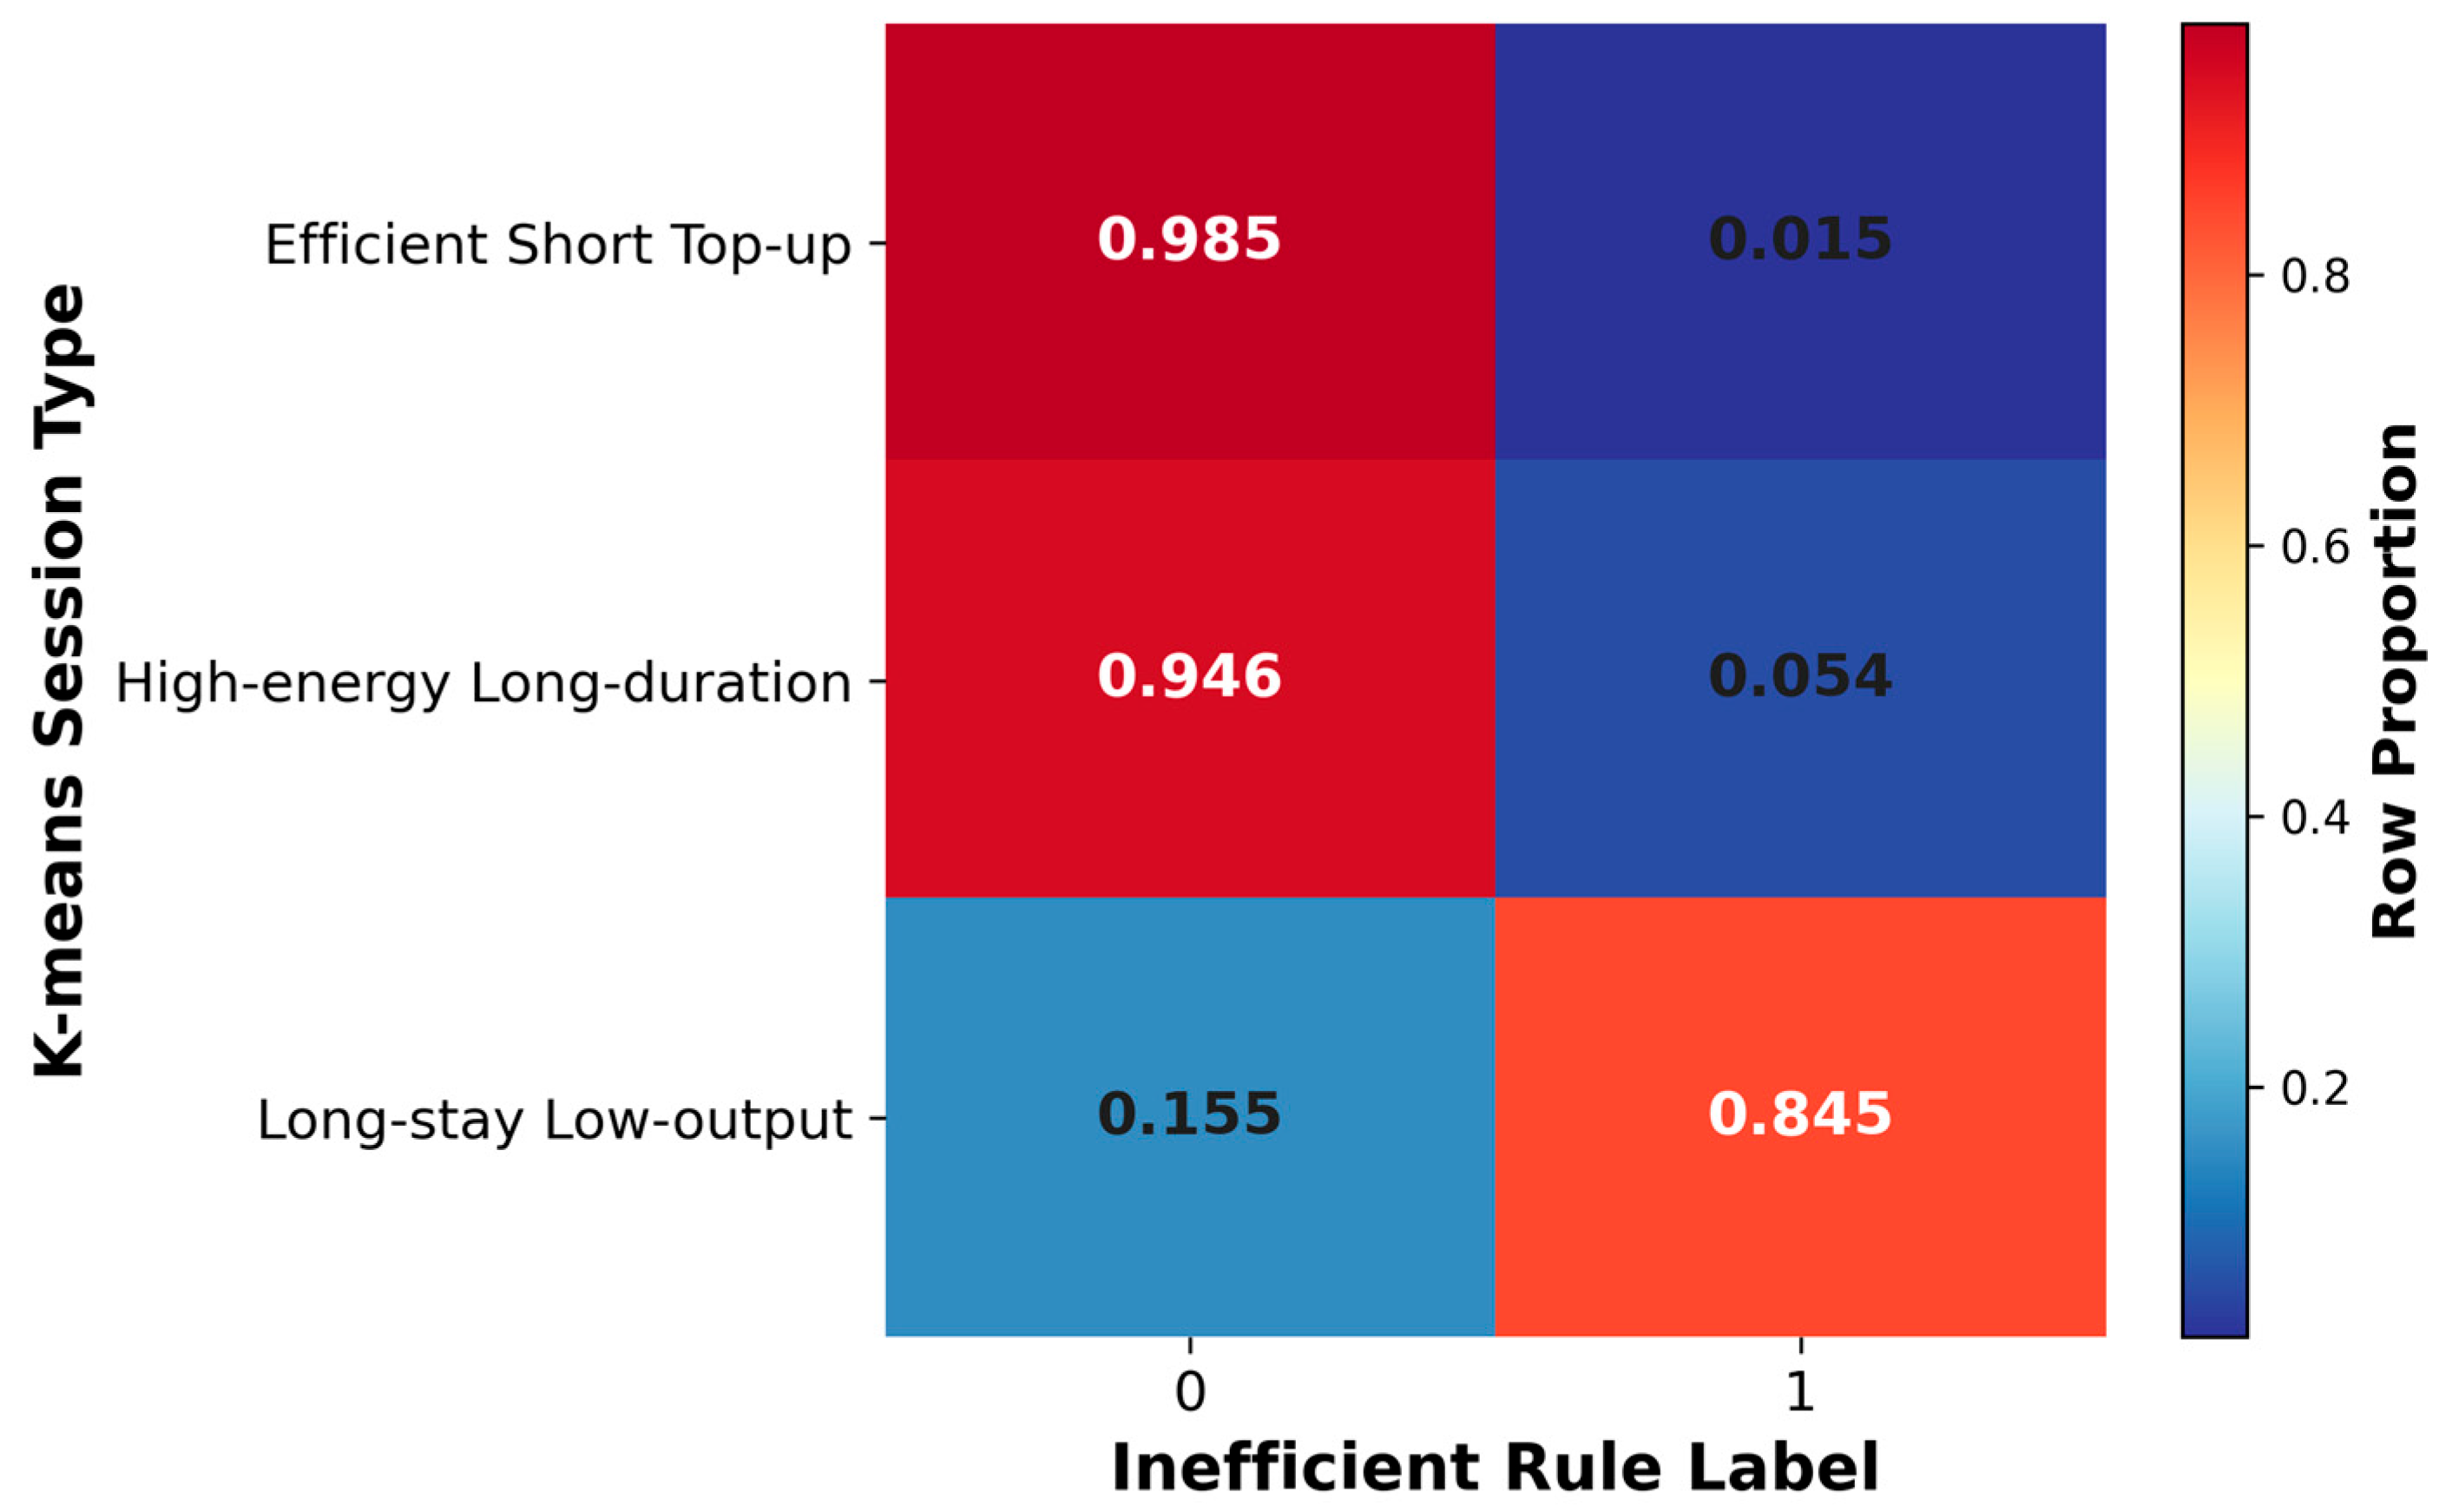
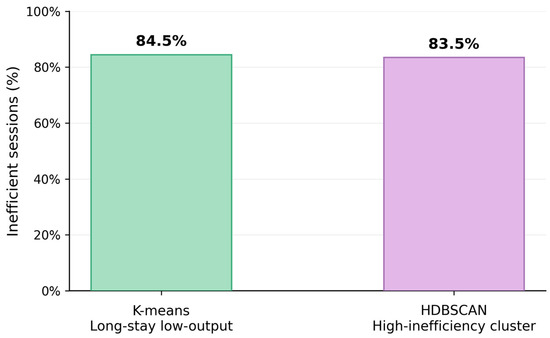
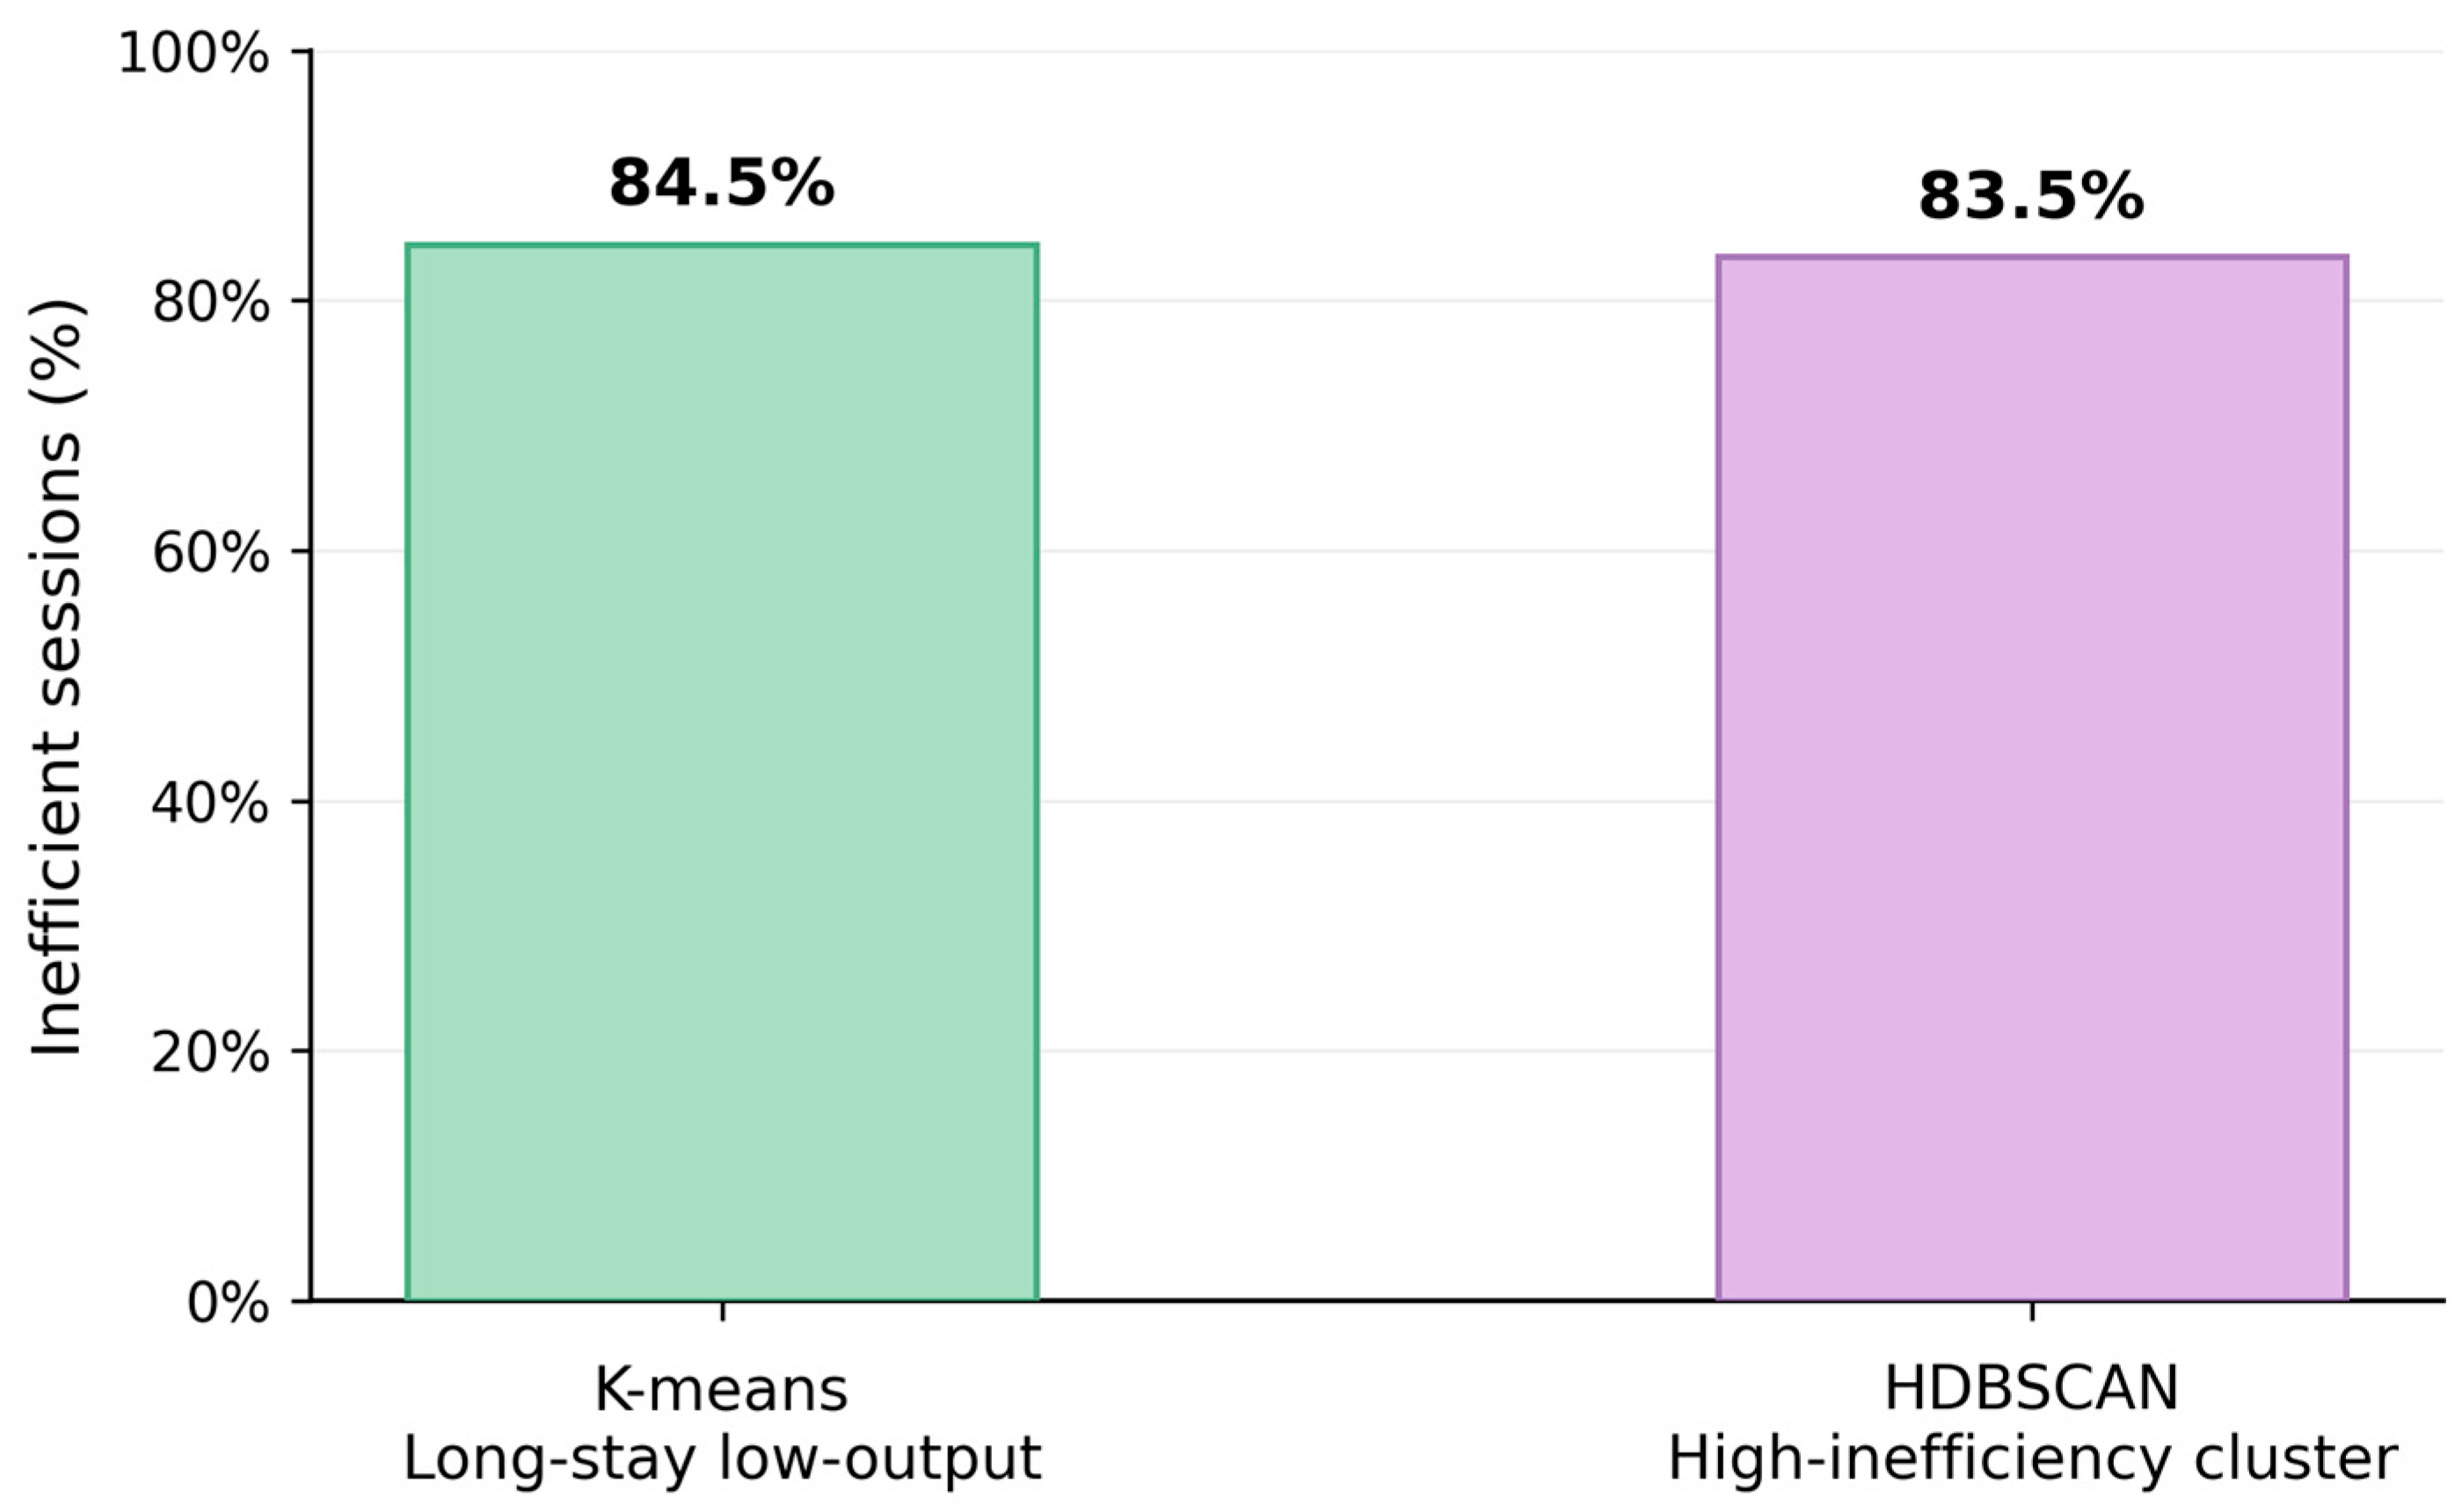
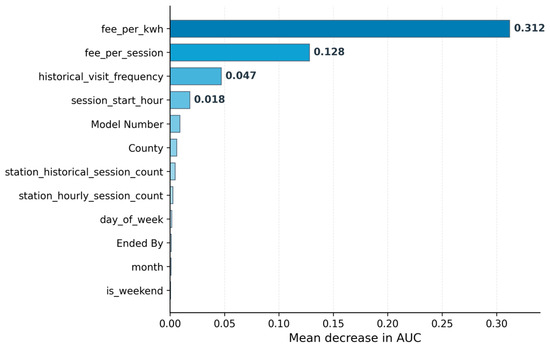
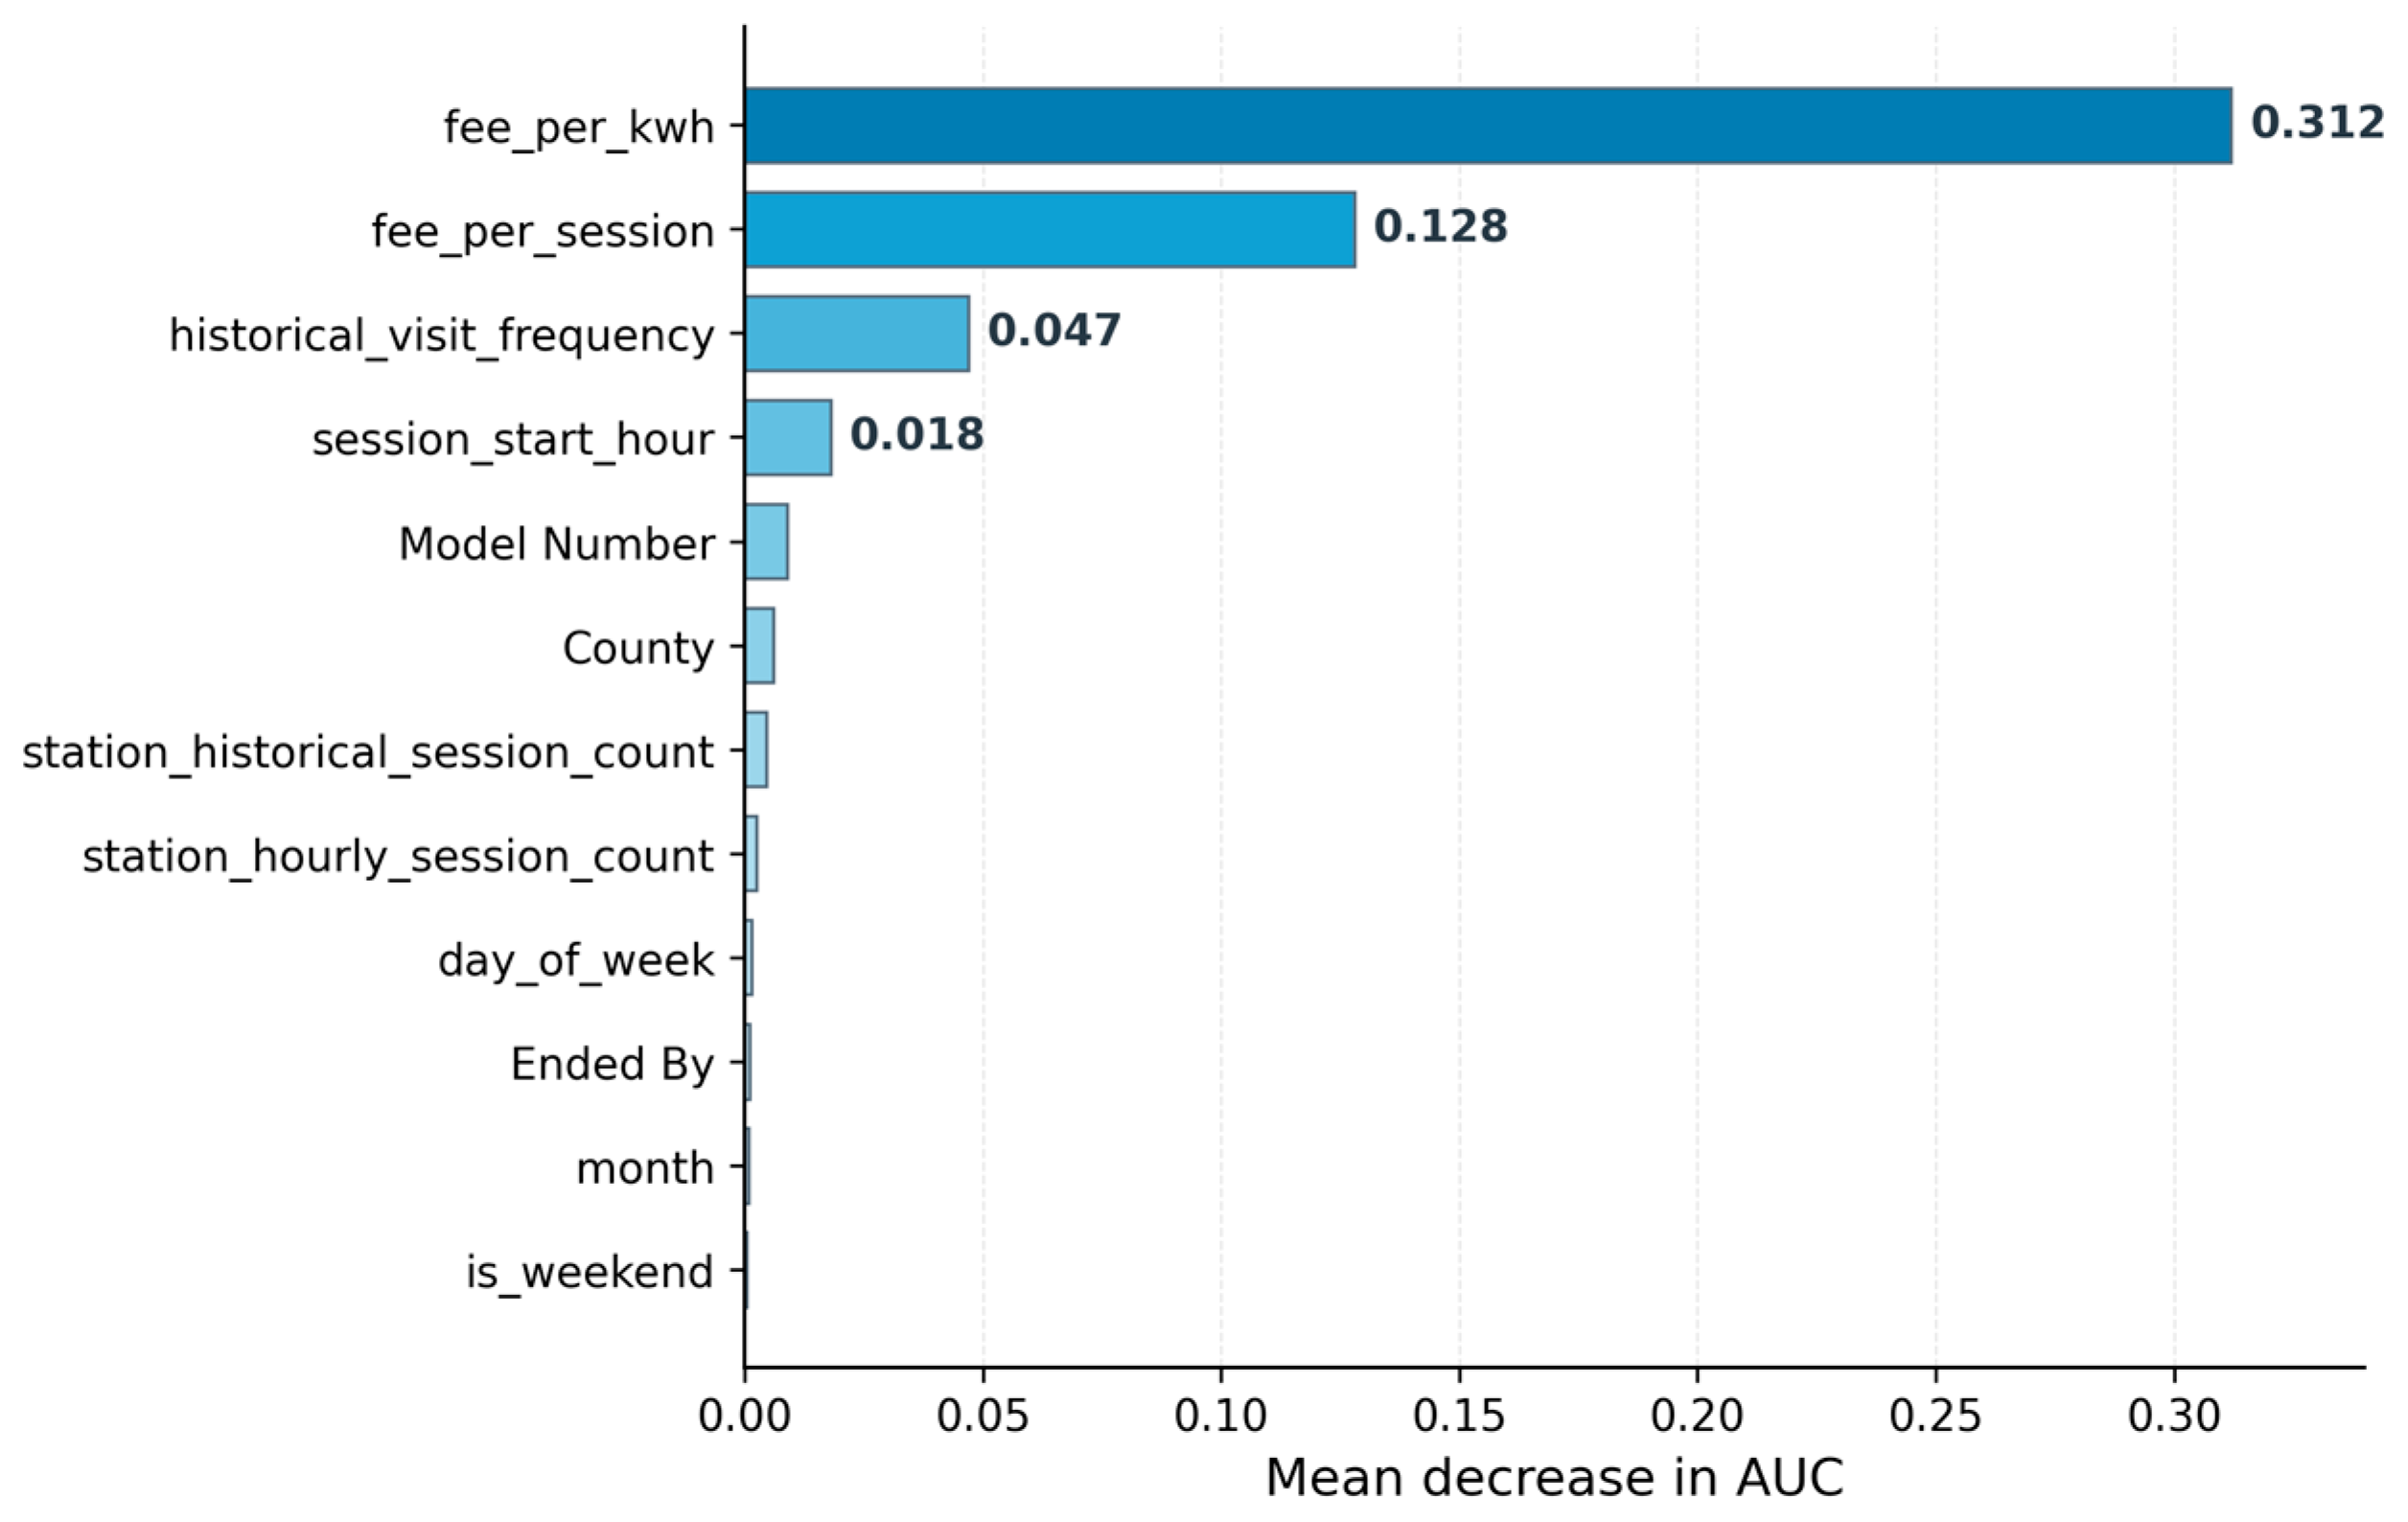
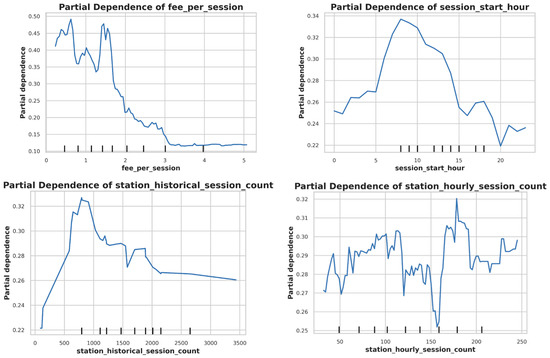
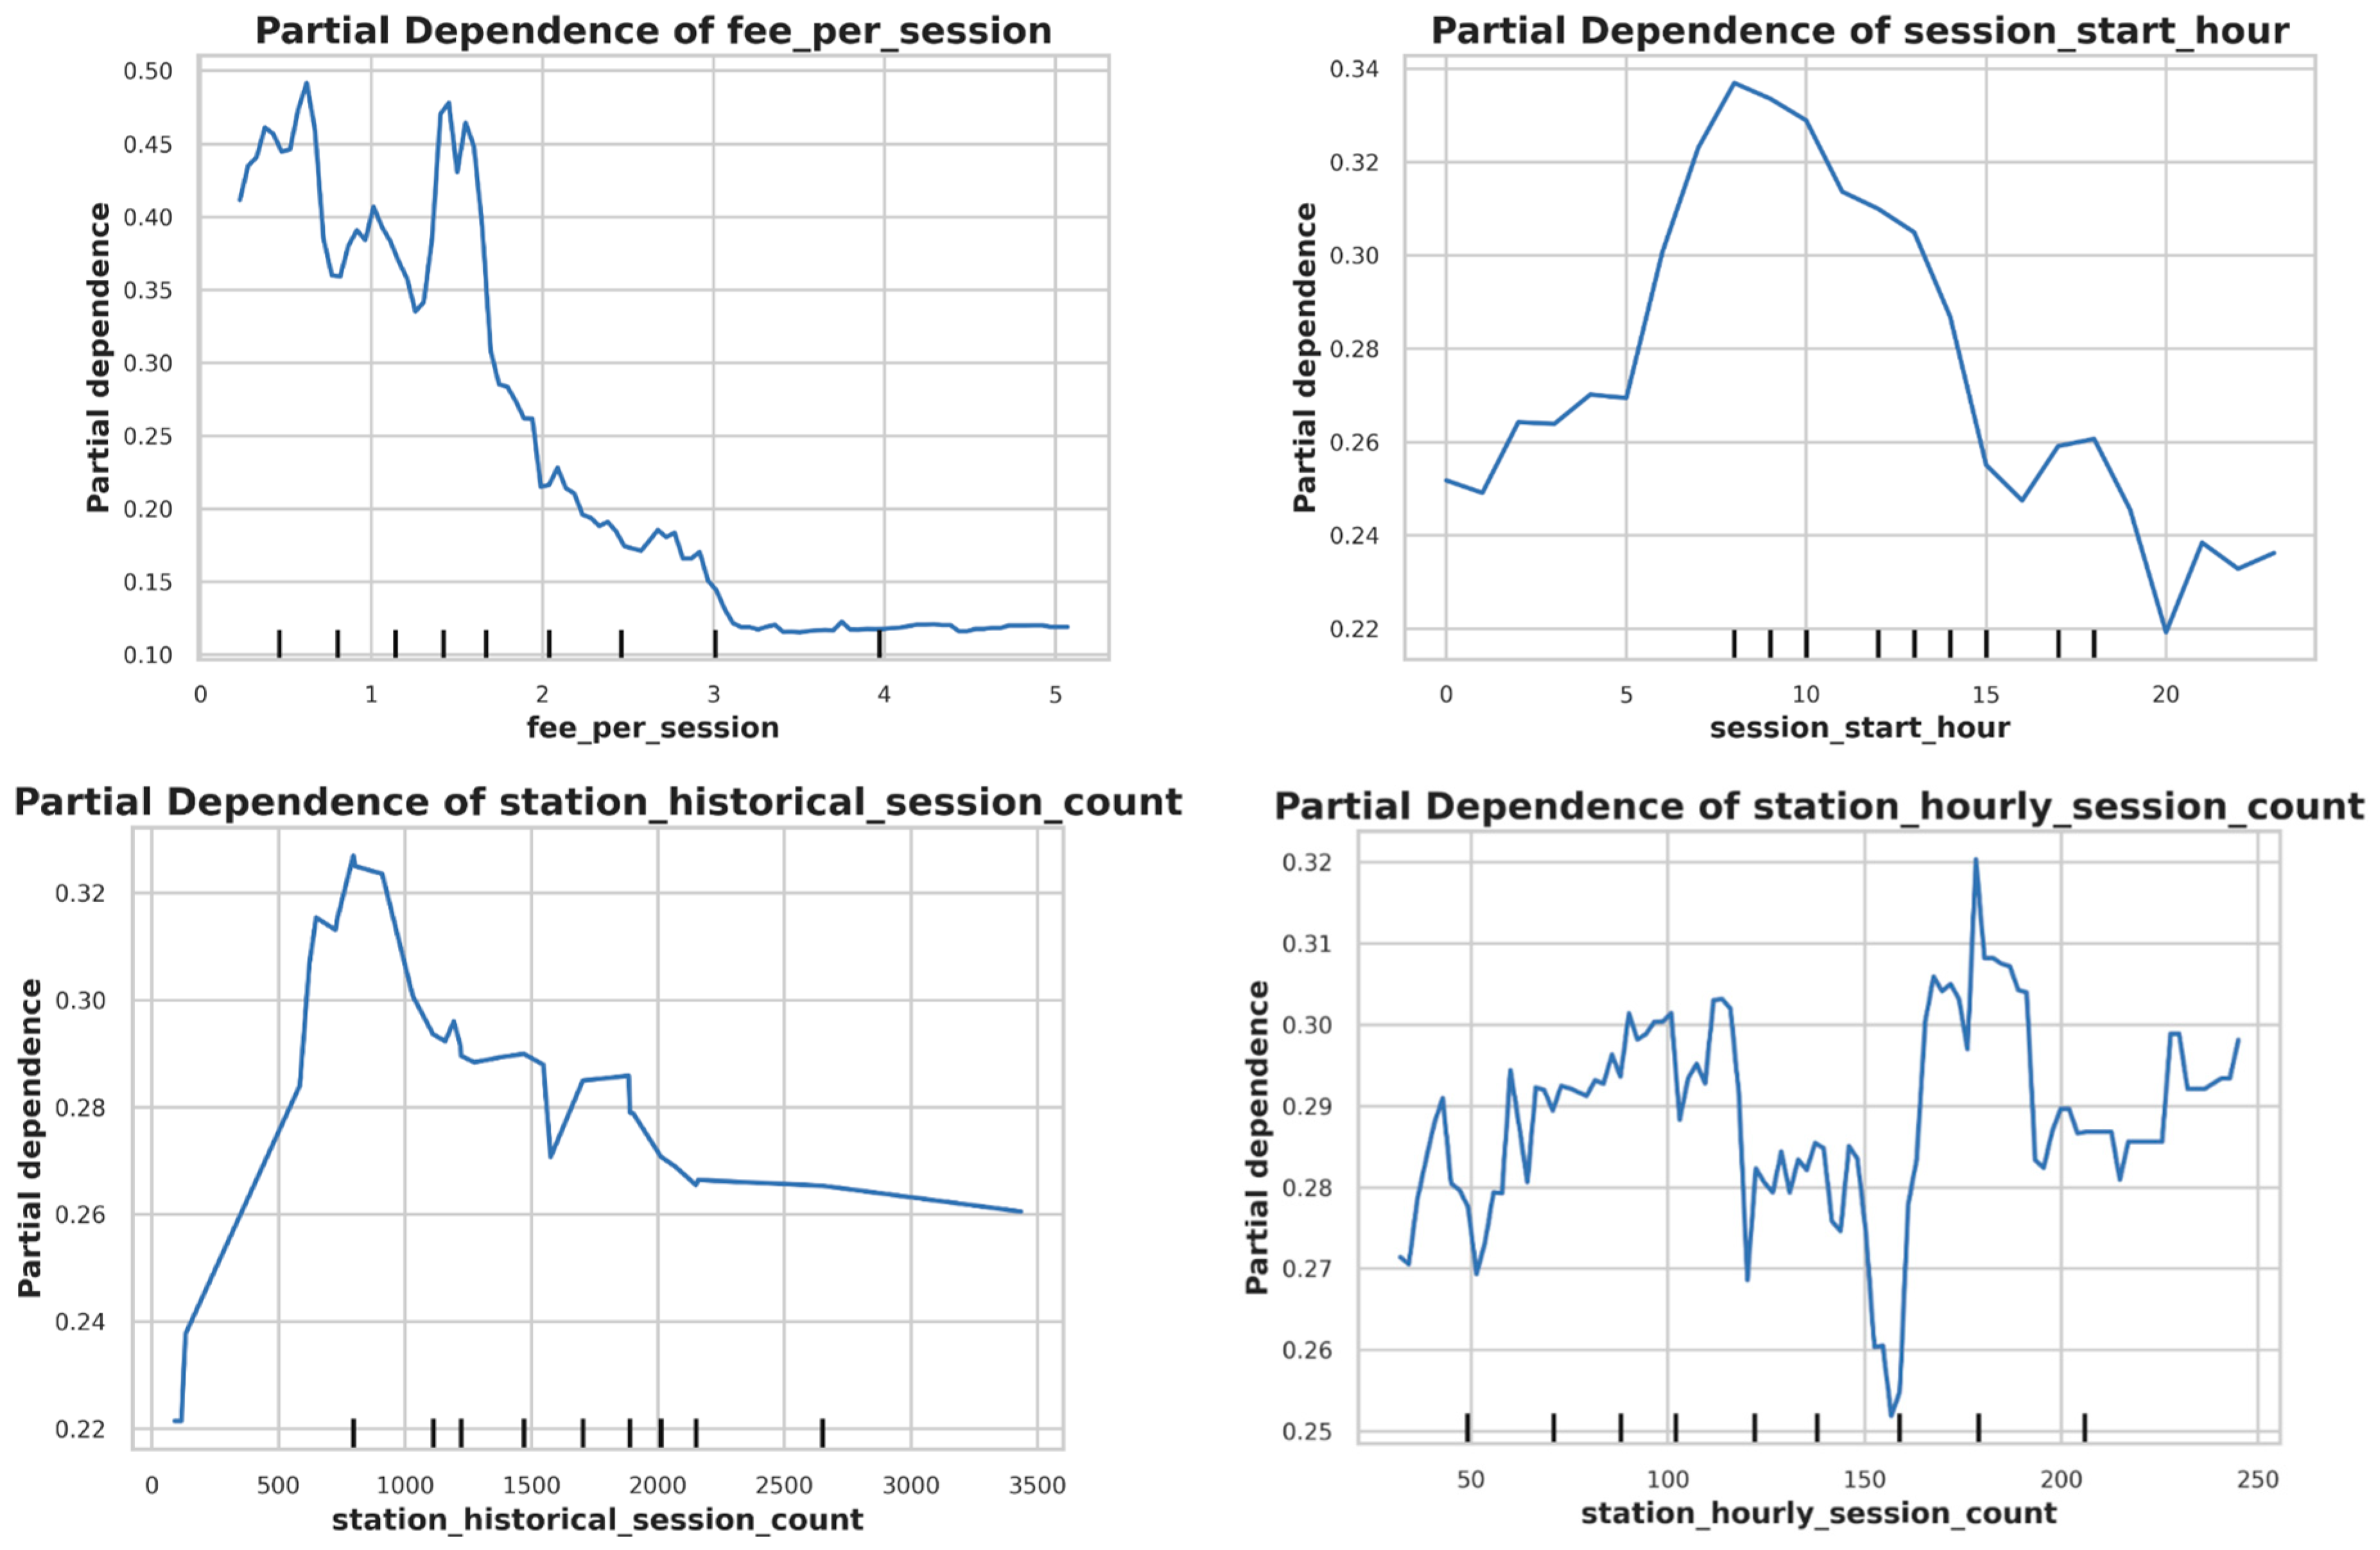
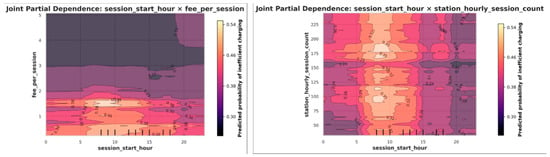
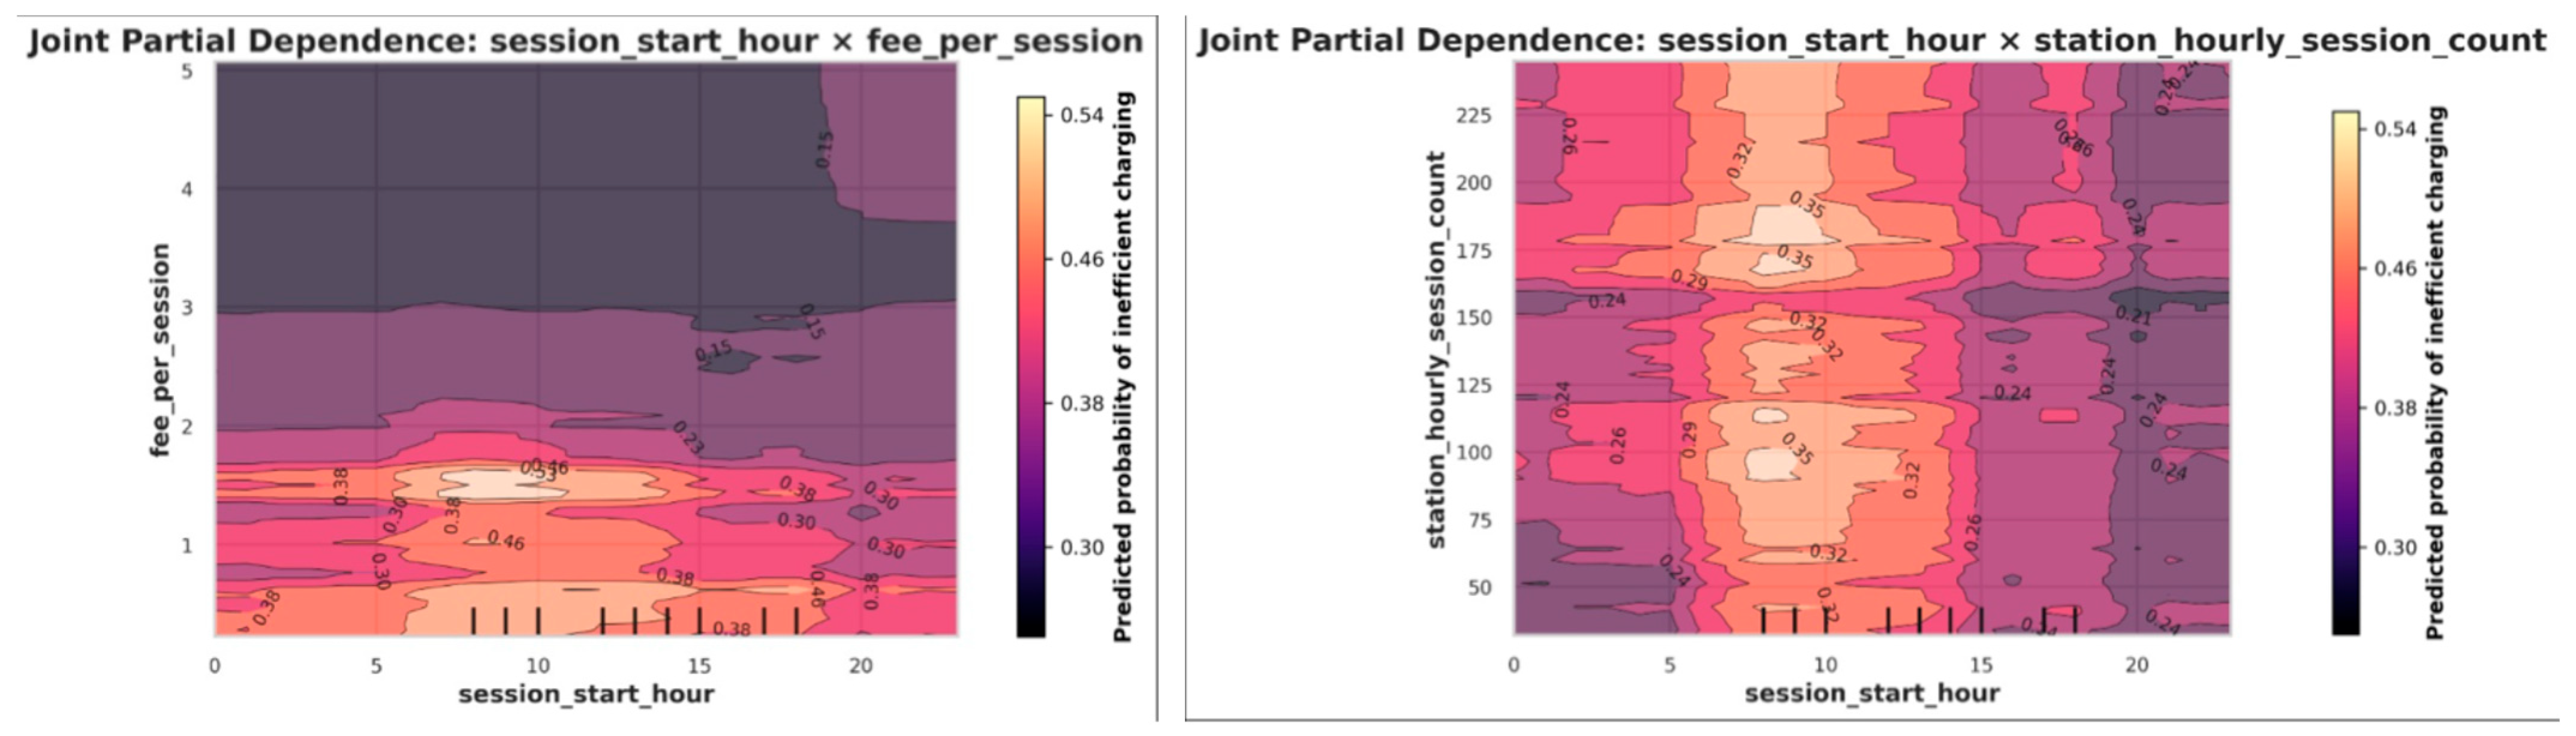

Disclaimer/Publisher’s Note: The statements, opinions and data contained in all publications are solely those of the individual author(s) and contributor(s) and not of MDPI and/or the editor(s). MDPI and/or the editor(s) disclaim responsibility for any injury to people or property resulting from any ideas, methods, instructions or products referred to in the content. |
© 2026 by the authors. Licensee MDPI, Basel, Switzerland. This article is an open access article distributed under the terms and conditions of the Creative Commons Attribution (CC BY) license.