


Abstract
Cyber-physical power systems face multi-stage attacks that exploit both communication-network topology and power-grid interdependencies to reach critical substations from low-security entry points. Attack graphs systematically enumerate multi-step attack paths. However, existing approaches either ignore physical network topology or separate attack-graph construction from defense placement, limiting operational usefulness. This paper presents an enhanced topology-aware greedy (TAG) framework that couples source-to-critical attack-path search with dual-mode cyber defense and explicit cyber-physical interdependency modeling. A hierarchical attack graph is constructed directly on the physical network graph, encoding compromise probabilities conditioned on both cyber vulnerability profiles and power-grid criticality. TAG employs topology-aware candidate screening, deterministic probabilistic propagation, beam search, and one-swap local refinement, followed by a dual-mode defense package combining node hardening, micro-segmentation, and monitored-neighbor shielding. Monte Carlo experiments on the 179-bus medium-voltage feeder, IEEE 39-bus New England, IEEE 118-bus, and RTS-96 benchmarks demonstrate that TAG reduces critical-reach probability by – versus no-defense baselines (mean ), and by – versus vanilla greedy placement. A cyber-physical impact-weighted risk analysis further shows that TAG’s structural defense placement yields proportional reductions in power-flow-consequence-weighted risk. Parameter sensitivity across the segmentation/containment factor and the monitored-neighbor shielding factor confirms robust method superiority (68– risk reduction across all tested values).
1. Introduction
Modern power systems represent one of the most critical national infrastructures, whose reliable operation underpins economic productivity, public safety, and societal stability. The progressive integration of advanced metering infrastructure, supervisory control and data acquisition (SCADA) systems, digital protective relays, phasor measurement units, and Internet Protocol (IP)-based communication networks has fundamentally transformed the operational landscape of power grids, delivering significant improvements in observability, controllability, and real-time situational awareness [1]. However, this cyber-physical convergence has simultaneously expanded the attack surface available to sophisticated adversaries, who can now exploit communication vulnerabilities, insecure remote access pathways, software weaknesses in industrial control systems, and supply chain compromises to penetrate critical energy infrastructure [2,3]. Threat actors, including nation-state actors and well-resourced criminal organizations, increasingly plan campaigns as sequences of coordinated intrusion steps that progress across communication networks from low-security entry points toward high-value control assets [4]. Real-world incidents, most prominently the 2015 and 2016 Ukrainian power grid attacks, have demonstrated that multi-stage cyber intrusions can produce large-scale outages, physical equipment damage, and sustained disruptions to electricity delivery affecting millions of consumers [5,6]. These events have galvanized regulatory attention and research investment to characterize cyber-physical attack surfaces, identify high-risk intrusion pathways, and develop principled defense strategies for critical energy infrastructure.
Attack graphs have emerged as the dominant formalism for systematically enumerating the space of feasible multi-step attack paths through which an adversary can navigate from initial compromise to high-value target states. In their canonical formulation, nodes encode system states or the compromise status of individual network devices, while directed edges represent feasible attack transitions conditioned on preconditions such as privilege level, reachability, and exploitable vulnerabilities [7]. This compact graph representation enables analysts to enumerate all reachable attack paths, reason about attacker reach under resource constraints, and quantify security risk across complex networked systems. For cyber-physical power systems, attack graph models have been constructed from vulnerability databases associated with SCADA platforms, IEC 61850 substation automation profiles, and legacy industrial protocols such as Modbus and DNP3 [7,8]. Recent advances integrate graph neural networks and hybrid deep learning to automate the detection of in-progress attack trajectories within operational technology networks. A persistent limitation, however, is that many existing approaches treat the physical power network coarsely, relying on logical connectivity derived from device communication configurations rather than on explicit bus and transmission-line structures. This abstraction overlooks attack pathways where adversaries exploit both cyber and physical adjacency, progressively moving from low-security feeder buses through topologically adjacent substations toward high-voltage hubs, leaving important vulnerabilities unquantified.
The structural properties of power networks, hub substations, bridging transmission lines, and the degree of mesh connectivity play a central role in determining both operational security margins and adversarial exploitability [9]. Graph-theoretic metrics such as betweenness centrality, electrical betweenness, and spectral connectivity have been used extensively to characterize critical nodes and edges under physical contingencies, and these methods have been extended to cyber-physical threat scenarios where coordinated attacks target multiple topological components simultaneously [10]. Graph neural network approaches exploit the spatial correlation structure of power networks to detect stealthy false-data injection attacks, while topology-aware monitoring solutions improve intrusion-detection accuracy in substation automation systems [11]. On the defense side, decisions about which substations to harden, where to deploy intrusion-detection sensors, and which remote-access interfaces to restrict are critical for maximizing security under operational budget constraints [12]. Most existing methods, however, rely on heuristics based on static node attributes such as degree centrality or subjective asset criticality scores, computed independently of actual attack dynamics. These heuristics frequently miss indirect attack paths and fail to capture how partial compromises of non-critical intermediate nodes can enable adversaries to reach high-value targets via multi-hop lateral movement [13].
Despite significant advances in both attack graph research and topology-aware security analysis, critical integration gaps remain. Most existing attack graph frameworks for critical infrastructure treat the cyber and physical layers as loosely coupled, thereby missing structural constraints imposed by power network topology, such as the fact that communication connectivity in substations commonly mirrors physical bus adjacency, and thereby underestimating the threat-propagation potential of topology-aligned attack paths [14]. Game-theoretic defense formulations model adversarial interactions in power system security and provide rational resource allocation strategies [15,16], but they often assume deterministic vulnerability profiles that do not capture the probabilistic, path-dependent nature of multi-hop attack propagation across heterogeneous physical and cyber components. Stochastic risk assessment methods, including Monte Carlo-based frameworks, offer a principled alternative for quantifying attack reachability under uncertainty, yet their integration with topology-aware attack graph construction and budget-constrained defense optimization remains largely unexplored for power system operational contexts [17]. Furthermore, evaluation benchmarks that couple distribution- or transmission-level network topologies with cyber attack graph dynamics are scarce, making rigorous comparison of topology-aware defense strategies under realistic operational conditions difficult [18,19]. Addressing these gaps requires an integrated framework that leverages physical network structure at every stage of the security analysis pipeline, from attack graph construction through risk quantification to actionable defense optimization.
This paper addresses these gaps by proposing an enhanced topology-aware hierarchical attack graph construction (TAG) method. Our key contributions are as follows.
- A topology-aware hierarchical attack graph construction method is proposed that marks critical buses/substations and encodes edge-wise compromise probabilities conditioned on node criticality and defense status. This formulation directly couples the physical power-grid topology with cyber reachability modeling. TAG builds the attack graph atop the power-flow network topology, ensuring structural bottlenecks in the transmission or distribution grid are reflected in the attack-path model.
- An explicit cyber-physical interdependency and power-flow-aware impact model is introduced that defines how cyber-node compromise maps to power-grid consequences. A physical-impact-weighted risk objective is derived and validated against DC power-flow contingency analysis on the benchmark networks, complementing the cyber-only reachability metric.
- A dual-mode defense model is introduced in which each selected substation receives both incoming hardening and local micro-segmentation, reducing lateral attack propagation from protected substations while also providing modest monitored-neighbor shielding.
- An efficient TAG optimizer is developed that uses source-critical candidate screening, deterministic probabilistic propagation, beam-search portfolio construction, one-swap local refinement, and final Monte Carlo re-ranking to search beyond single-pass greedy local optima.
The remainder of this paper is organized as follows. Section 2 reviews related work. Section 3 formulates the problem, including the new cyber-physical interdependency model. Section 4 presents the TAG framework, including attack graph construction, Monte Carlo risk evaluation, and dual-mode defense optimization. Section 5 describes the experimental setup and baseline methods. Section 6 reports and analyzes the results. Section 7 discusses the findings and limitations. Section 8 concludes the paper.
2. Related Work
2.1. Attack Graphs for Cyber-Physical Systems
Attack graphs have been widely used to analyze security in enterprise networks and cyber-physical systems, modeling multi-step attacks as paths from initial conditions to goal states [20]. For power systems, attack graphs have been constructed based on vulnerabilities in SCADA networks, substation configurations, and communication channels [7]. Hybrid deep learning methods have been proposed to automate attack-graph-based situational awareness in operational technology environments, achieving high accuracy in localizing active intrusions within substations and control centers [21]. Detection of false data injection attacks, a common attack vector in cyber-physical power systems, has been advanced through graph convolutional networks that exploit physical network topology [8]. However, many works treat the physical topology coarsely, focusing on logical connectivity rather than explicit bus and line structure, which can overlook important pathways where an attacker leverages both cyber and physical adjacency to propagate.
Hierarchical attack graphs introduce abstraction layers that group low-level vulnerabilities into higher-level states (e.g., substation compromised vs. individual device compromised). Such hierarchies improve scalability and interpretability but require careful design to preserve critical dependencies between cyber and physical components.
2.2. Topology-Aware Security Analysis
Topology plays a central role in power system security analysis. Graph-based methods have been used to identify critical lines and buses, compute vulnerability metrics, and design remedial actions. Coordinated cyber-physical attacks that selectively target subsets of topological components, exploiting the n-1 security criterion, have been shown to produce cascading failures that naive security assessments miss [10]. Recent work has explored graph neural networks for cyber-physical anomaly detection, demonstrating that the spatial structure of the power network provides a strong inductive bias for identifying stealthy intrusion attempts. Dynamic probabilistic risk assessment using Monte Carlo simulation has been applied to characterize the cybersecurity posture of electric grids under multi-event attack scenarios [22]. However, fewer efforts explicitly integrate physical topology into attack graph construction and defense optimization.
Topology-aware approaches can capture how attacks on specific substations affect power flows and connectivity, and how defending particular nodes can block multiple attack paths [11]. Our work exploits this by building attack graphs directly on the physical network graph and treating defense placement as a graph-constrained optimization problem with topology-aware enhancements.
2.3. Defense Placement and Risk Optimization
Defense placement has been studied in the context of sensor deployment, firewall placement, and patch management. Common heuristics include selecting nodes with the highest degree, betweenness centrality, or asset criticality [12]. While easy to compute, these heuristics may ignore attack dynamics and the probabilistic nature of compromise. Machine learning for intrusion detection in industrial control systems has been surveyed extensively, identifying the need for context-aware, topology-informed detection strategies [7,23].
Optimization-based methods formulate defense placement as an NP-hard combinatorial problem and resort to greedy or metaheuristic algorithms [14]. Game-theoretic formulations model the attacker-defender interaction as a strategic game, enabling rational resource allocation against adaptive adversaries [24]. Reinforcement learning has also been explored for dynamic defense policy learning against persistent cyber threats [19]. In this work, we adopt an enhanced greedy algorithm (TAG) that improves upon standard greedy selection by incorporating topology-aware scoring, providing strong empirical performance with interpretable defense recommendations and manageable computational overhead.
3. Problem Formulation
3.1. Terminology
To maintain consistency with power systems conventions, we adopt the following terminology throughout this paper. A bus is an electrical node in the power-flow model, representing a point of common coupling for generators, loads, or transmission lines. A substation is the physical facility that may contain one or more buses together with cyber assets (IEDs, RTUs, communication equipment). In this work, each physical bus in the benchmark networks corresponds to a single modeled substation for attack-graph purposes. A cyber node refers to communication or control assets (SCADA servers, RTUs, relays) that appear in the attack-graph model; in our single-layer abstraction, each bus/substation maps directly to one cyber node. The term graph node is reserved for generic mathematical statements. Accordingly, buses and substations are used in power-system and physical-layer contexts; cyber node is used when referring to the attack graph or compromise state; and node is used in purely graph-theoretic statements that apply to both layers.
3.2. Physical Network Model
Let denote the undirected physical network graph, where V is the set of buses (electrical nodes) and E is the set of transmission lines or feeders. Each bus is associated with attributes such as bus type, voltage level, and asset criticality. We denote by the set of critical buses (e.g., high-voltage substations, control centers).
The physical network is obtained from detailed power-system benchmark models available in pandapower/MATPOWER. We use bus and branch connectivity (including lines, transformers, and impedance branches where available) to construct the physical topology; geospatial coordinates are not required for attack graph construction.
3.3. Hierarchical Attack Graph
We construct a directed attack graph on top of the physical network. For this work, we use a single-layer abstraction in which each physical bus corresponds to an attack-graph cyber node that represents the compromised state of that substation. Thus , and is derived from E by considering both directions of each undirected line. Authors: the italics can be removed in all the locations. Each directed edge represents a feasible attack step where an adversary that has compromised bus/cyber node u attempts to compromise bus/cyber node v via existing communication or physical connectivity. We associate with each edge a compromise probability that captures the likelihood of a successful attack step in a single attempt.
3.4. Defense Model
We consider a set of possible defense actions that harden specific substations (e.g., deploying stronger authentication, intrusion detection systems, or segmented networks). Let denote the set of defended substations. Defending a substation v reduces the probability that it can be compromised by any neighbor. We assume a defense budget K limiting the number of defended substations: . Our goal is to choose D such that the probability that an attacker reaches any critical bus in is minimized.
3.5. Risk Metric
We define a set of initial attack sources representing non-critical entry points (e.g., low-security substations, remote access points). Given an attack graph parameterized by the defended set D, we consider a discrete-time attack process over T steps. At each step, compromised cyber nodes attempt to compromise their neighbors with edge-wise probabilities .
Let denote the probability that at least one critical bus in becomes compromised within T steps, starting from the initial compromised set S. Formally,
where indicates that cyber node c is compromised at time t. Our objective is
3.6. Cyber-Physical Interdependency and Power-Flow-Aware Impact Modeling
The cyber-only risk metric quantifies the probability of reaching any critical bus, but does not differentiate between critical buses based on their operational importance to the physical power grid. A bus with many incident transmission lines, high generation capacity, or a central position in the power flow has a disproportionately large physical impact if compromised. This section introduces a power-flow-aware impact score and a cyber-physical risk objective that combines reachability with physical consequence.
3.6.1. Cyber-Physical Mapping
Each physical bus hosts one or more cyber assets (IED, RTU, communication interface) whose compromise directly impairs the monitoring, protection, or control capabilities of that bus. Specifically:
- Compromise of a transmission substation (high-degree bus with multiple incident lines) enables an adversary to manipulate protective relay settings or issue false trip commands, risking line disconnection and cascading overloads.
- Compromise of a generation bus enables manipulation of active-power setpoints, potentially causing frequency deviations or unit disconnection.
- Compromise of a distribution feeder bus (radial topology) enables voltage-regulator manipulation and targeted load-shedding.
These mappings motivate weighting reachability by the physical consequence of compromising each critical bus c.
3.6.2. Physical Impact Score
We define via DC power-flow contingency analysis. For each critical bus , we solve the DC power flow on the base network, then remove all lines incident to c (simulating loss of substation control) and re-solve. The impact score aggregates three metrics:
- 1.
- : number of buses exhibiting bus-angle deviation after outage of c,
- 2.
- : number of lines loaded above of thermal capacity after outage of c,
- 3.
- : number of incident branches disconnected (degree of c).
The raw score is , normalized as so that .
3.6.3. Cyber-Physical Risk Objective
The physical-impact-weighted risk is defined as
where is the Monte Carlo estimate of the probability that critical bus c is reached within T steps from sources S under defended set D. When all critical buses are equally important (), reduces to a scaled version of .
The TAG optimizer minimizes the cyber-only risk ; the physical-impact score is used post hoc to evaluate and compare defense strategies in terms of power-system consequence.
4. Methodology
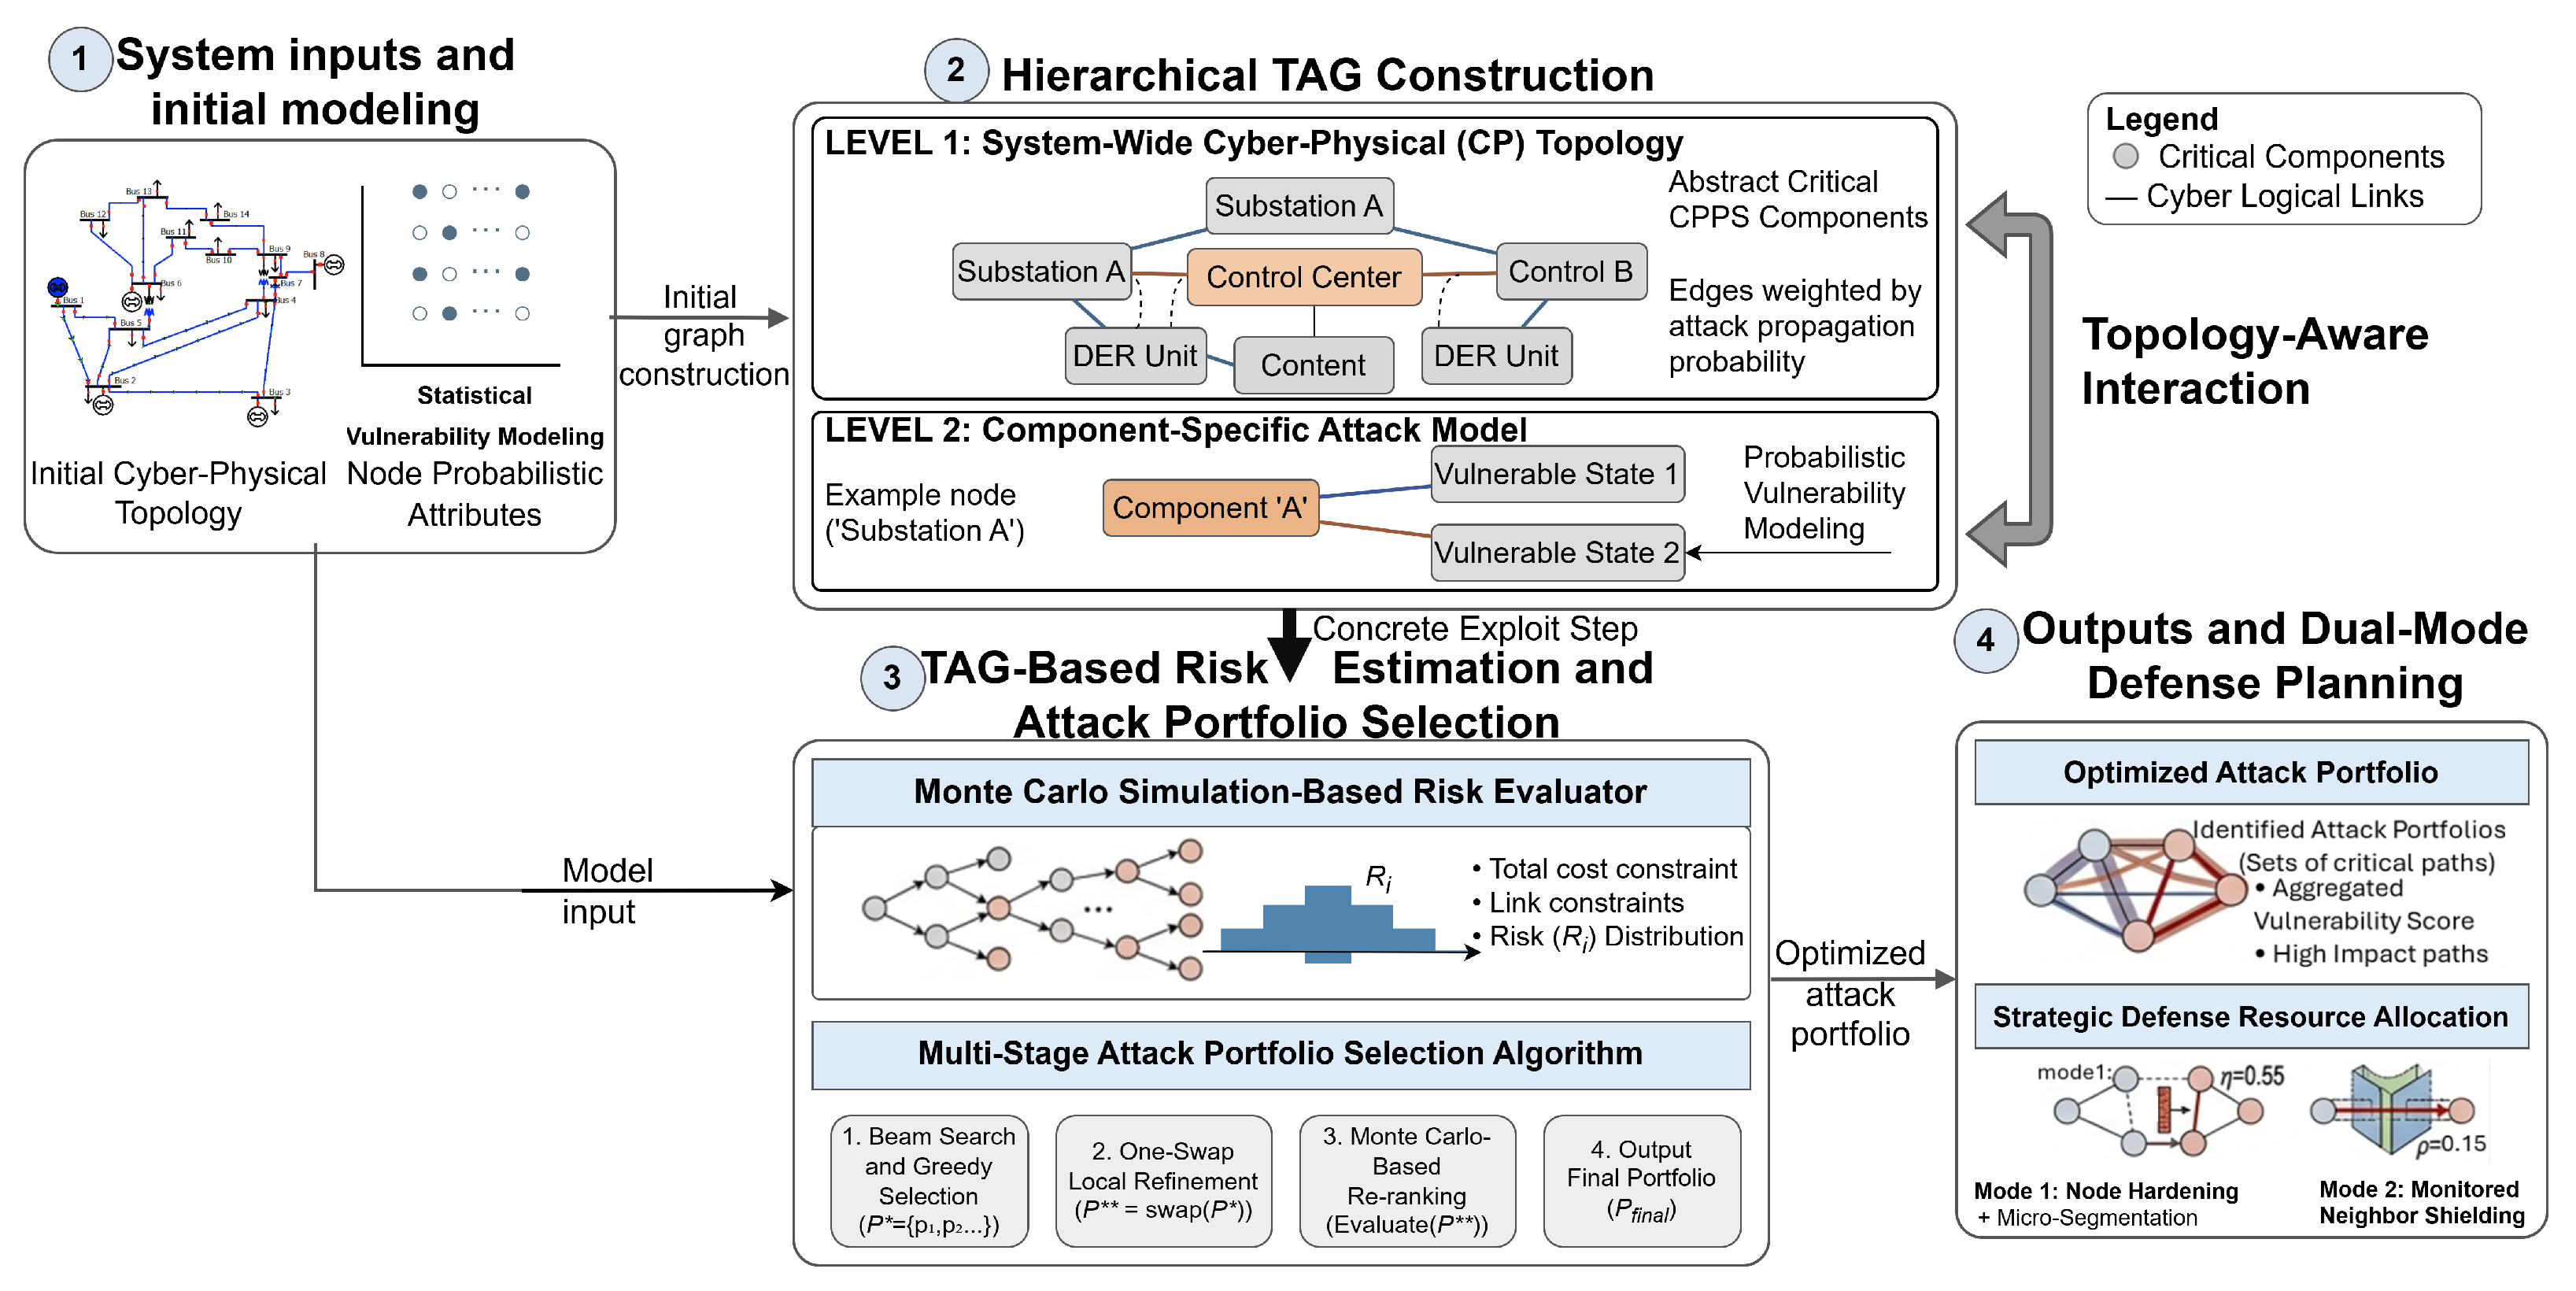
Figure 1 summarizes the end-to-end TAG workflow. The method begins with system inputs and probabilistic vulnerability modeling, constructs a hierarchical attack graph that links system-wide cyber-physical topology with component-level attack states, estimates risk through Monte Carlo simulation and attack-portfolio selection, and finally produces a dual-mode defense plan that combines optimized node hardening, micro-segmentation, and monitored-neighbor shielding. The subsections below formalize each stage of this workflow.
Figure 1.
Overview of the TAG method. (1) System inputs and initial modeling: The physical bus/branch topology is taken as input, with critical buses marked in red and node probabilistic attributes (, , ) assigned to build a statistical vulnerability profile. (2) Hierarchical TAG construction: A two-level attack graph is built on the physical network, where Level 1 captures system-wide cyber-physical connectivity with edges weighted by attack propagation probability, and Level 2 models component-specific vulnerable states linked by concrete exploit steps. (3) TAG-based risk estimation and attack portfolio selection: Monte Carlo simulation estimates the critical-reach probability , and a multi-stage algorithm combining beam search, one-swap local refinement, and Monte Carlo re-ranking selects the optimal defense set. (4) Outputs and dual-mode defense planning: The optimized portfolio identifies high-impact attack paths and assigns each selected substation incoming hardening (), outgoing micro-segmentation (), and monitored-neighbor shielding () across two deployment modes: node hardening with micro-segmentation (Mode 1) and monitored-neighbor shielding (Mode 2). In the figure, red nodes denote critical components, gray nodes denote other cyber-logical links or components, directed arrows indicate attack-propagation or workflow dependencies, and the symbols , , , , and denote the initial compromise probability, propagation-related vulnerability parameter, incoming hardening factor, micro-segmentation factor, and monitored-neighbor shielding factor, respectively.
4.1. Topology-Aware Attack Graph Construction
Given , is constructed by initializing a directed graph with node set , then for each undirected edge adding two directed edges and to , and finally assigning a criticality flag to buses in (e.g., top-k highest-degree buses, representing the most interconnected substations). A vulnerability profile is then defined with three parameters: a base compromise probability for non-critical, undefended cyber nodes; a criticality multiplier that reduces compromise probability for critical buses, modeling the stronger security controls typically deployed at high-value assets; and a defense reduction factor representing the effect of active hardening on incoming compromise probability. For each edge , we set
where
and is a small constant to avoid zero probabilities. The value ensures numerical stability without materially affecting risk estimates; a sensitivity analysis over (Section 6.5.3) confirms that results are insensitive to this choice within this range.
4.2. Monte Carlo Risk Evaluation
Closed-form computation of is intractable for large graphs due to the combinatorial explosion of possible attack paths; Monte Carlo simulation is therefore employed instead. The compromised set is initialized as , and at each time step , every cyber node attempts to compromise each neighbor v along outgoing edges independently with probability , updating ; if , success is recorded for that trial and propagation halts. This process is repeated for independent trials, yielding the estimator
In all main experiments, we use steps and . All strategies are evaluated using the same random seed and the same source set in each matched comparison, ensuring a fair and reproducible comparison.
Statistical Validity
With , the standard error of the MC estimator is for any . Hoeffding’s inequality gives a confidence interval half-width of ≤. The observed differences between TAG and the next-best baseline (Greedy) range from to across networks. We further validate this via 10-batch repeated evaluation in Section 6.3.
4.3. TAG Defense Optimization
The exact optimization of is combinatorial and generally NP-hard. A preliminary topology-aware greedy variant improved upon greedy primarily through centrality-aware tie-breaking, but this was not sufficient to consistently escape greedy local optima. The final TAG method therefore changes both the search procedure and the operational defense action while preserving the same node budget K.
4.3.1. Dual-Mode Defense Action
Baseline strategies model a defended substation as incoming hardening only, reducing the compromise probability into v by . TAG instead models a deployable substation security package comprising authentication/patch hardening, micro-segmentation, and local monitoring. Thus, if an edge is incident to defended substations, its effective probability is
where is the segmentation/containment factor for outgoing propagation from a defended substation, is the monitored-neighbor shielding factor, and is the one-hop neighborhood of defended substations. The selection of and as defaults is supported by a systematic parameter sensitivity analysis over and reported in Section 6.5.3. The sensitivity analysis confirms that method rankings are robust across the full tested range, and that the selected defaults lie within the region of best risk-reduction performance. The value reflects a residual lateral propagation probability from a hardened substation after micro-segmentation, consistent with the incomplete but significant containment achievable through enhanced access control. The value is conservative, ensuring that monitored-neighbor effects do not artificially inflate TAG’s advantage over placement-only baselines.
4.3.2. Topology-Aware Candidate Portfolio
TAG first builds a candidate pool using degree centrality, betweenness centrality, PageRank on the attack graph, source-to-critical shortest-path participation, critical-bus membership, and one-hop neighborhoods around sources and critical buses. This prevents the optimizer from wasting evaluations on substations that are topologically irrelevant to the bounded-horizon attack.
4.3.3. Fast Propagation Screening
To avoid relying exclusively on noisy Monte Carlo estimates during search, TAG uses a deterministic independent-cascade approximation. Let denote the approximate probability that cyber node v is compromised by time t. Given defended set D, the update is
with for . The approximate critical-reach risk is . This approximation is exact only on trees; in densely meshed networks, it may overestimate risk due to path-dependence violations, but it is used exclusively for fast candidate screening during portfolio construction, not for any reported risk value. All reported results are Monte Carlo estimates.
4.3.4. Beam Search, Local Refinement, and MC Re-Ranking
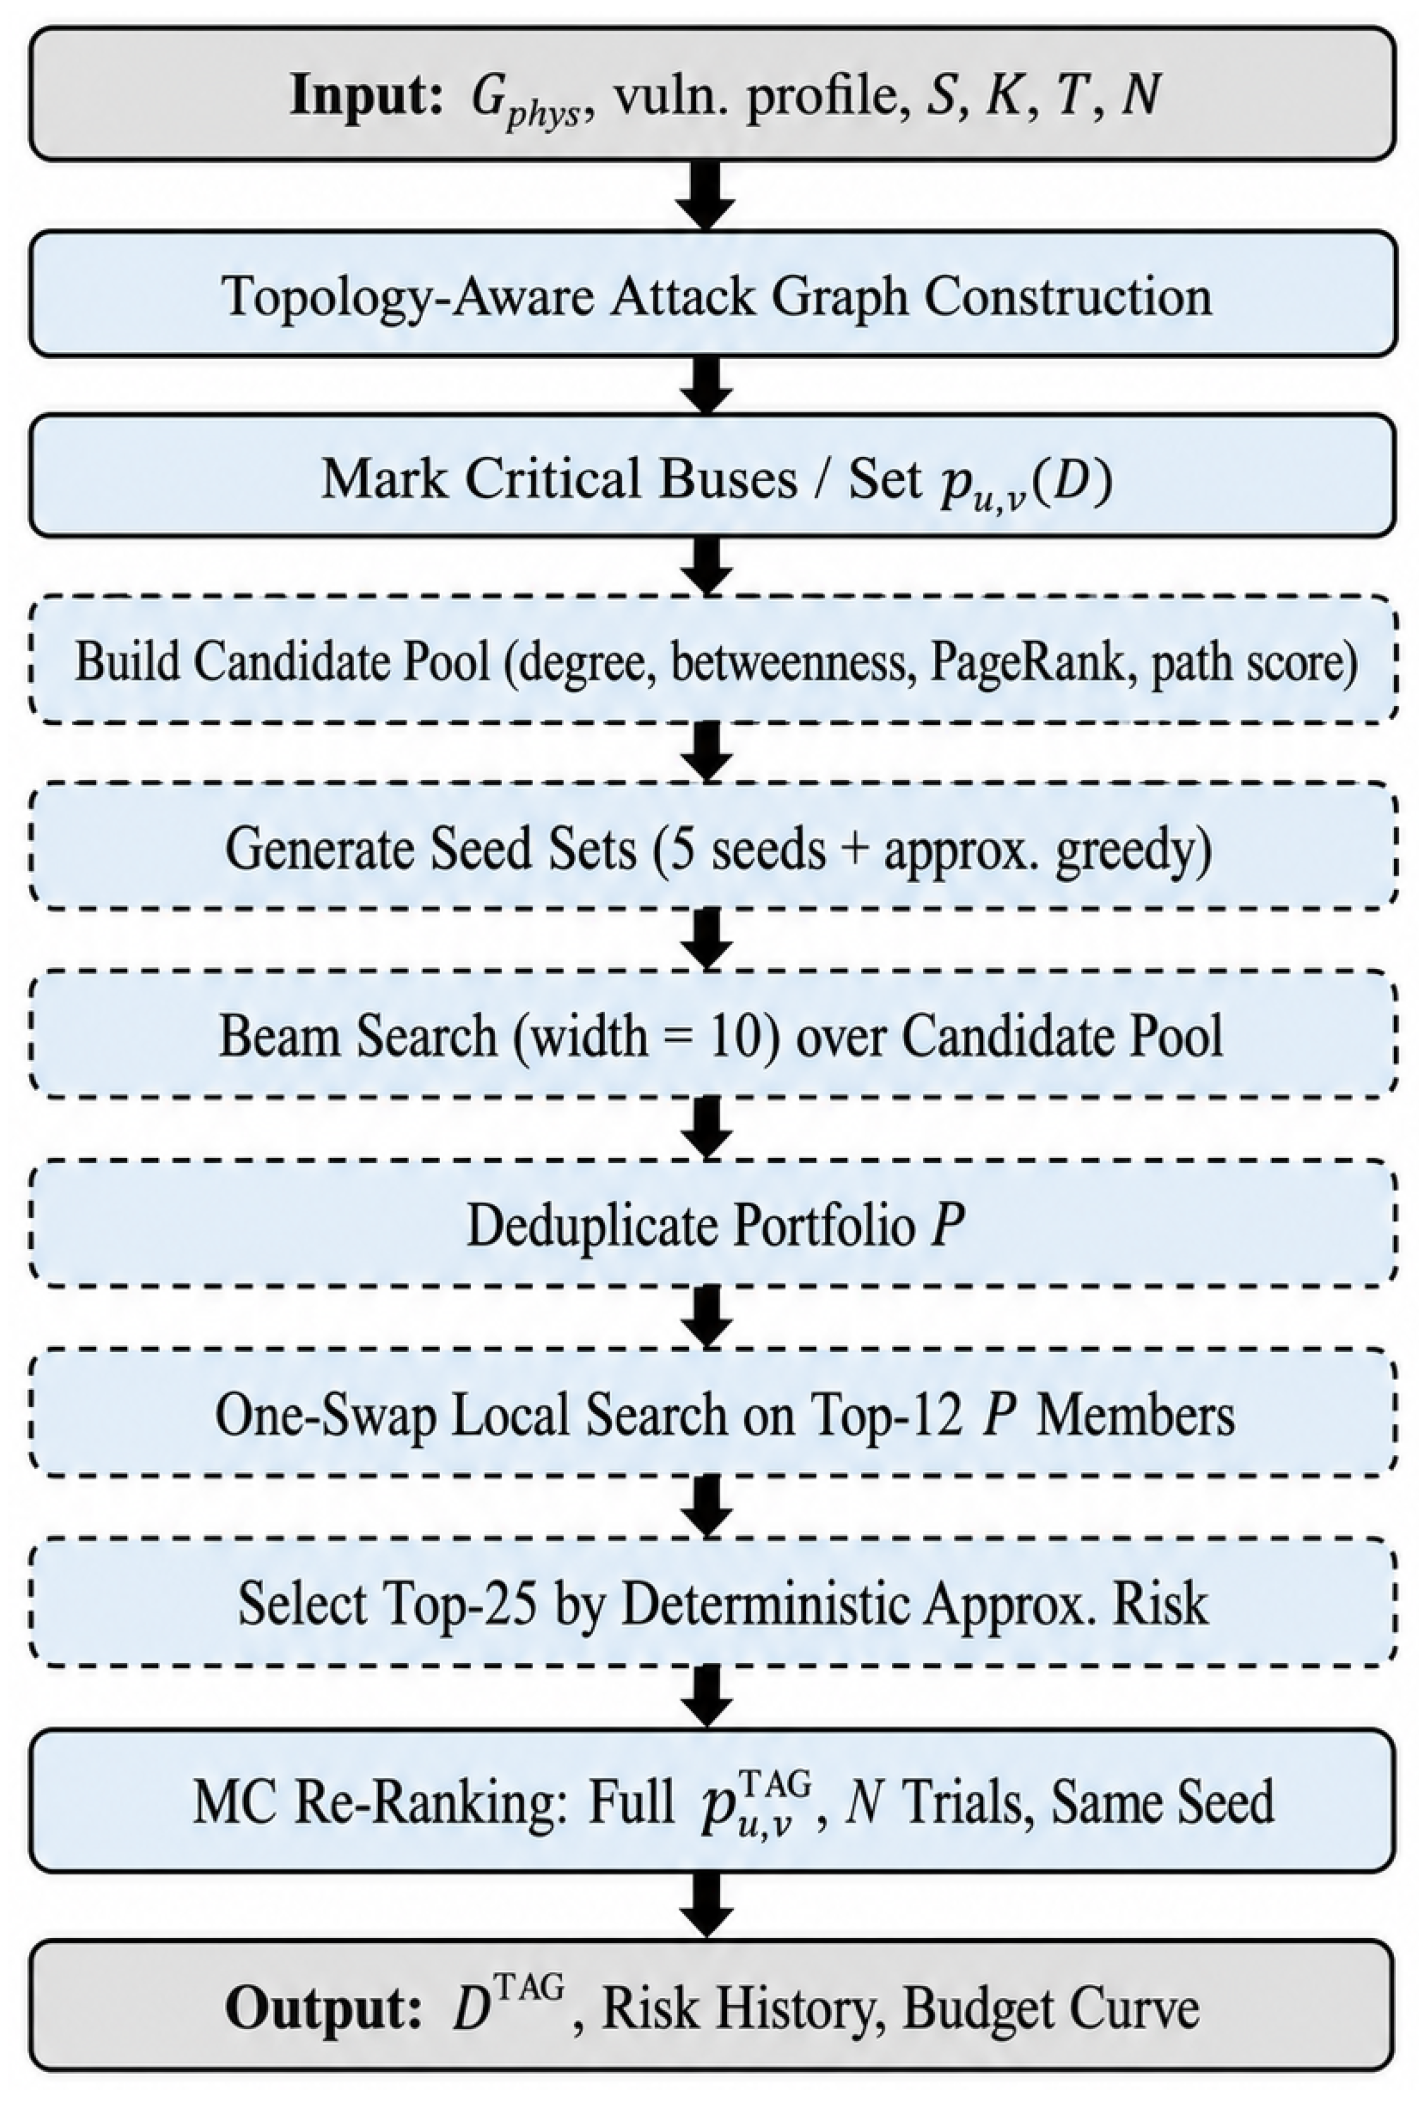
TAG constructs a portfolio of defense sets from centrality seeds, the original greedy solution, approximate greedy, beam search, and one-swap local refinement. Specifically, the portfolio is built as follows: (i) four seed sets are formed from the top-K nodes ranked by degree, betweenness, PageRank, and source-to-critical path participation, respectively; (ii) the vanilla greedy solution (incoming-hardening-only) is included; (iii) an approximate greedy with dual-mode scoring generates one more candidate; (iv) beam search with width 10 generates up to 10 beam paths; (v) the top-12 candidates under the fast approximation each receive one round of one-swap local search (accept if swap improves approximate risk by >), producing up to 12 additional unique candidates. Duplicate sets are removed by hashing frozensets. The resulting portfolio is sorted by approximate risk, and the top 25 unique candidate sets are retained. (vi) These 25 sets are re-evaluated using the same Monte Carlo evaluator (same , same random seed as all baselines) with the full dual-mode defense model. The set achieving the lowest MC risk is selected as the TAG-defended set . The greedy solution is always included in the final MC evaluation as a safeguard. The final MC re-ranking determines the reported TAG-defended set and risk, as shown in the Algorithm 1.
| Algorithm 1 TAG Algorithm (Dual-Mode Topology-Aware Defense). |
|
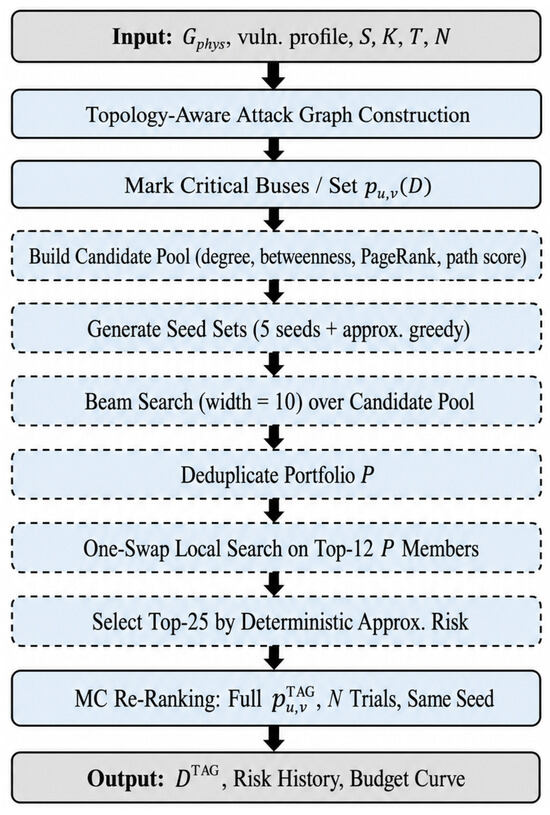
A detailed flowchart of the TAG optimization pipeline is provided in Figure 2.
Figure 2.
Detailed TAG optimization flowchart. Dashed boxes indicate steps that use the deterministic propagation approximation only for screening; all reported risk values are MC estimates produced in the final re-ranking step.
4.4. Relation to Statistical Model Checking and Formal Methods
TAG uses Monte Carlo simulation to estimate , which can be interpreted within the framework of statistical model checking (SMC) [25]: given a PCTL-style reachability property , SMC provides a probabilistic guarantee of the form
where is the desired accuracy and is the acceptable error probability. By Hoeffding’s inequality, trials suffice. For and , this requires trials; our choice of corresponds to at confidence, which is smaller than the observed performance gaps between methods (minimum gap ).
Full formal verification via probabilistic model checking offers stronger guarantees but is computationally intractable for networks with hundreds of buses: the state space grows exponentially with , making exact symbolic computation infeasible beyond ∼20 nodes for multi-step reachability. Bounded model checking could address shorter horizons () but remains challenging for the horizon used here.
5. Experimental Setup
5.1. Network Topologies
To rigorously assess the generalization capability and operational relevance of the proposed TAG framework, experiments are conducted on four benchmark networks that collectively span the principal structural characteristics of real power systems, including radial distribution feeders, compact meshed transmission systems, large-scale looped networks, and multi-area reliability-oriented configurations. This breadth of evaluation is deliberately designed to stress-test TAG across substantially different topological regimes, exposing sensitivity to network diameter, hub density, and mesh redundancy. These factors fundamentally govern the feasibility and the horizon depth of multi-step attack propagation. This study considers four real or community-standard benchmark networks: The MV Feeder is a 179-bus medium-voltage distribution network with 183 topological branches, available through the pandapower network library [26]. Its predominantly radial structure creates long, low-redundancy propagation corridors from peripheral entry points toward the five critical buses designated as the top-5 highest-degree nodes. As established in the distribution systems literature, distribution feeders are structurally distinguished from transmission networks by their tree-like operational topology, with a substation at the root bus connected via sequential intermediate nodes to terminal load buses [27]. The sparse, tree-like connectivity of this feeder constrains lateral movement during bounded-horizon attack simulation, making it a structurally demanding benchmark for node-placement strategies that rely on centrality metrics derived from global graph properties rather than local attack-path geometry [9].
The IEEE 39-bus New England system is a compact but topologically realistic transmission benchmark with 39 buses, 46 branches, and 3 critical buses [26]. Despite its relatively small scale, this network exhibits a well-studied meshed topology with several high-degree hub buses, making it a standard reference for evaluating the interaction between defense placement and attack-path diversity. The moderate connectivity density produces a high undefended baseline risk, as multiple short paths connect non-critical entry points to critical generation substations [9].
The IEEE 118-bus system is a widely used community benchmark for transmission-system studies with 118 buses, 179 branches, and 6 critical buses [26]. Its dense inter-regional mesh topology and multiple parallel paths between high-degree substations make it the most structurally challenging test case among the four benchmarks: many short, overlapping attack paths simultaneously reach critical nodes, thereby both elevating the undefended baseline risk and reducing the marginal benefit of any single defense node [9]. This combination makes it a canonical stress case for assessing whether topology-aware defense optimization can yield consistent improvements over placement-only heuristics [28,29].
The RTS-96 system is composed of three RTS-24 areas interconnected by inter-area tie lines, yielding 72 buses, 111 branches, and 4 critical buses [26]. Its multi-area structure introduces bridging tie-line buses that simultaneously participate in attack paths from different source regions, creating a heterogeneous risk landscape that is qualitatively distinct from both the radial MV Feeder and the uniformly meshed IEEE 118-bus network [30]. Defending these cross-area bridge nodes has a disproportionate impact on overall risk, providing a natural test of whether TAG’s topology-aware candidate portfolio correctly identifies and prioritizes structurally critical positions that are not captured by conventional centrality rankings [9,29].
Table 1 summarizes network statistics. All experiments use the same fixed random seed for reproducibility. The selection of these four benchmarks ensures that evaluation results are neither dominated by a single topological regime nor artificially optimistic due to the use of a single well-studied graph structure. Together, they represent a systematic cross-section of network sizes, connectivity patterns, and critical-node configurations that are representative of real power system operational environments.
Table 1.
Network statistics.
5.2. Attack and Defense Parameters
A unified vulnerability profile is applied across all four benchmark networks to ensure that observed performance differences are attributable to topological structure rather than parameter tuning. The base compromise probability is set to , reflecting a moderately capable adversary whose individual attack steps succeed with non-trivial but sub-dominant probability, a regime in which defense placement decisions have the highest discriminative impact. The criticality multiplier models the empirically supported observation that high-value substations are typically equipped with stronger baseline authentication and access controls, reducing their per-step compromise probability by half relative to non-critical nodes. The defense reduction factor represents the effect of an active hardening deployment on incoming attack probability, consistent with representative values reported in prior cyber-physical risk assessment literature.
The attack simulation runs for a horizon of steps, starting from randomly selected non-critical entry points, with risk quantified via independent Monte Carlo trials per evaluation. The choice of is supported by the sensitivity analysis presented in Section 6.5.2, which confirms that risk profiles plateau by approximately steps across all tested networks, indicating that a five-step horizon captures the dominant attack-reachability dynamics without incurring unnecessary computational cost. The defense budget is fixed at substations throughout the main experiments, and all methods operate under the same budget constraint to ensure a fair comparison.
TAG-specific parameters are for the segmentation and containment factor on outgoing propagation from defended nodes, and for the monitored-neighbor shielding factor on adjacent undefended nodes. The justification for these defaults is provided by the parameter calibration study. All experiments use the parameters shown in Table 2.
Table 2.
Experimental parameters.
5.3. Baseline Methods
Seven baseline strategies are evaluated to provide a comprehensive frame of reference that spans random placement, static centrality heuristics, metaheuristic optimization, and greedy sequential placement. This diversity of baselines is essential for isolating the independent contributions of (i) topology-aware candidate selection, (ii) portfolio-based search beyond single-pass greedy, and (iii) the dual-mode defense action, which jointly constitute the TAG advantage over prior approaches.
No Defense represents the undefended baseline risk and serves as the reference against which all relative risk reductions are subsequently computed. Random averages the defended risk over five independent random selections of K nodes drawn uniformly without replacement, providing a lower bound on the benefit of any informed placement strategy. Degree, Betweenness, and PageRank defend the K nodes with the highest values of the respective static centrality metric computed on the attack graph, representing the class of single-pass heuristics that are widely deployed in practice due to their simplicity and interpretability.
Simulated annealing (SA) is a metaheuristic defense optimizer that uses a temperature schedule initialized at with a cooling rate of and 20 inner iterations per temperature level. SA is included as a representative of stochastic optimization methods that can, in principle, escape local optima but whose performance is sensitive to schedule hyperparameters and may exhibit premature convergence on high-dimensional or multimodal search landscapes. Greedy (Original) follows a standard sequential greedy procedure that selects at each step the node providing the greatest marginal reduction in Monte Carlo-estimated risk under the incoming-hardening-only defense model. This baseline is the direct precursor to TAG and provides a reference for quantifying the benefit of the TAG-specific enhancements independently of the defense model.
All methods receive identical inputs: the same physical network, vulnerability profile, attack sources S, horizon T, budget K, trial count , and random seed. All methods evaluate risk using the same Monte Carlo estimator with the same seed, ensuring differences in final risk reflect the quality of the defended set rather than sampling variation. All placement-only baselines, including Greedy (Original), use the incoming-hardening-only defense model ( reduction on incoming edges only), while TAG additionally applies the outgoing segmentation factor and the monitored-neighbor shielding factor . The performance advantage of TAG is interpreted as reflecting both the richer search procedure and the stronger per-node defense action jointly enabled by the TAG substation security package.
6. Results and Analysis
6.1. Baseline Risk Without Defenses
Table 3 reports the undefended critical-reach probability from Monte Carlo trials for each benchmark network, providing the baseline risk from which all relative reductions are subsequently computed. Across all four networks, the probability that an adversary starting from three randomly selected non-critical entry points reaches at least one critical bus within steps ranges from 0.569 to 0.940, confirming that the undefended threat level is operationally significant across all tested topological regimes. These high baseline values are structurally explained by the short average path lengths from non-critical to critical buses in meshed transmission networks: in the IEEE 118-bus case, the dense inter-regional mesh creates numerous two- and three-hop paths from peripheral nodes to high-degree critical buses, yielding the highest baseline risk of 0.940. In contrast, the radial feeder topology of the 179-bus MV network constrains propagation to predominantly long, sequential corridors, reducing the number of simultaneously active short paths and producing the lowest baseline risk of 0.569.
Table 3.
Baseline critical reach probability without defenses (, ).
The IEEE 39-bus system exhibits a notably high baseline risk of 0.905 despite its compact size, a consequence of the network’s well-connected meshed topology, where several critical generation buses are topologically adjacent to or within two hops of multiple non-critical sources. The RTS-96 system, with its multi-area structure and four critical buses, achieves an intermediate baseline risk of 0.680, reflecting the balance between increased critical-node coverage across three areas and the bottlenecking effect of the sparse inter-area tie lines that must be traversed for cross-area attack propagation. These structural insights directly inform the defense placement analysis: networks with high baseline risk and high topological redundancy are inherently more difficult to defend with a fixed budget, and differences in performance across strategies are amplified in precisely these cases.
6.2. Comprehensive Strategy Comparison
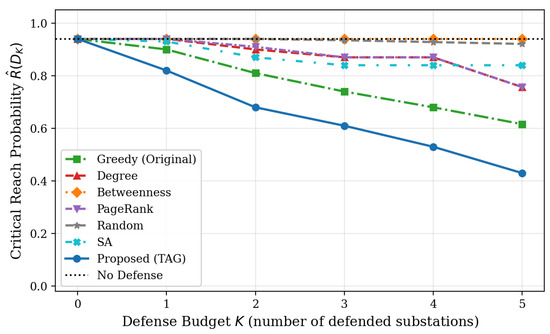
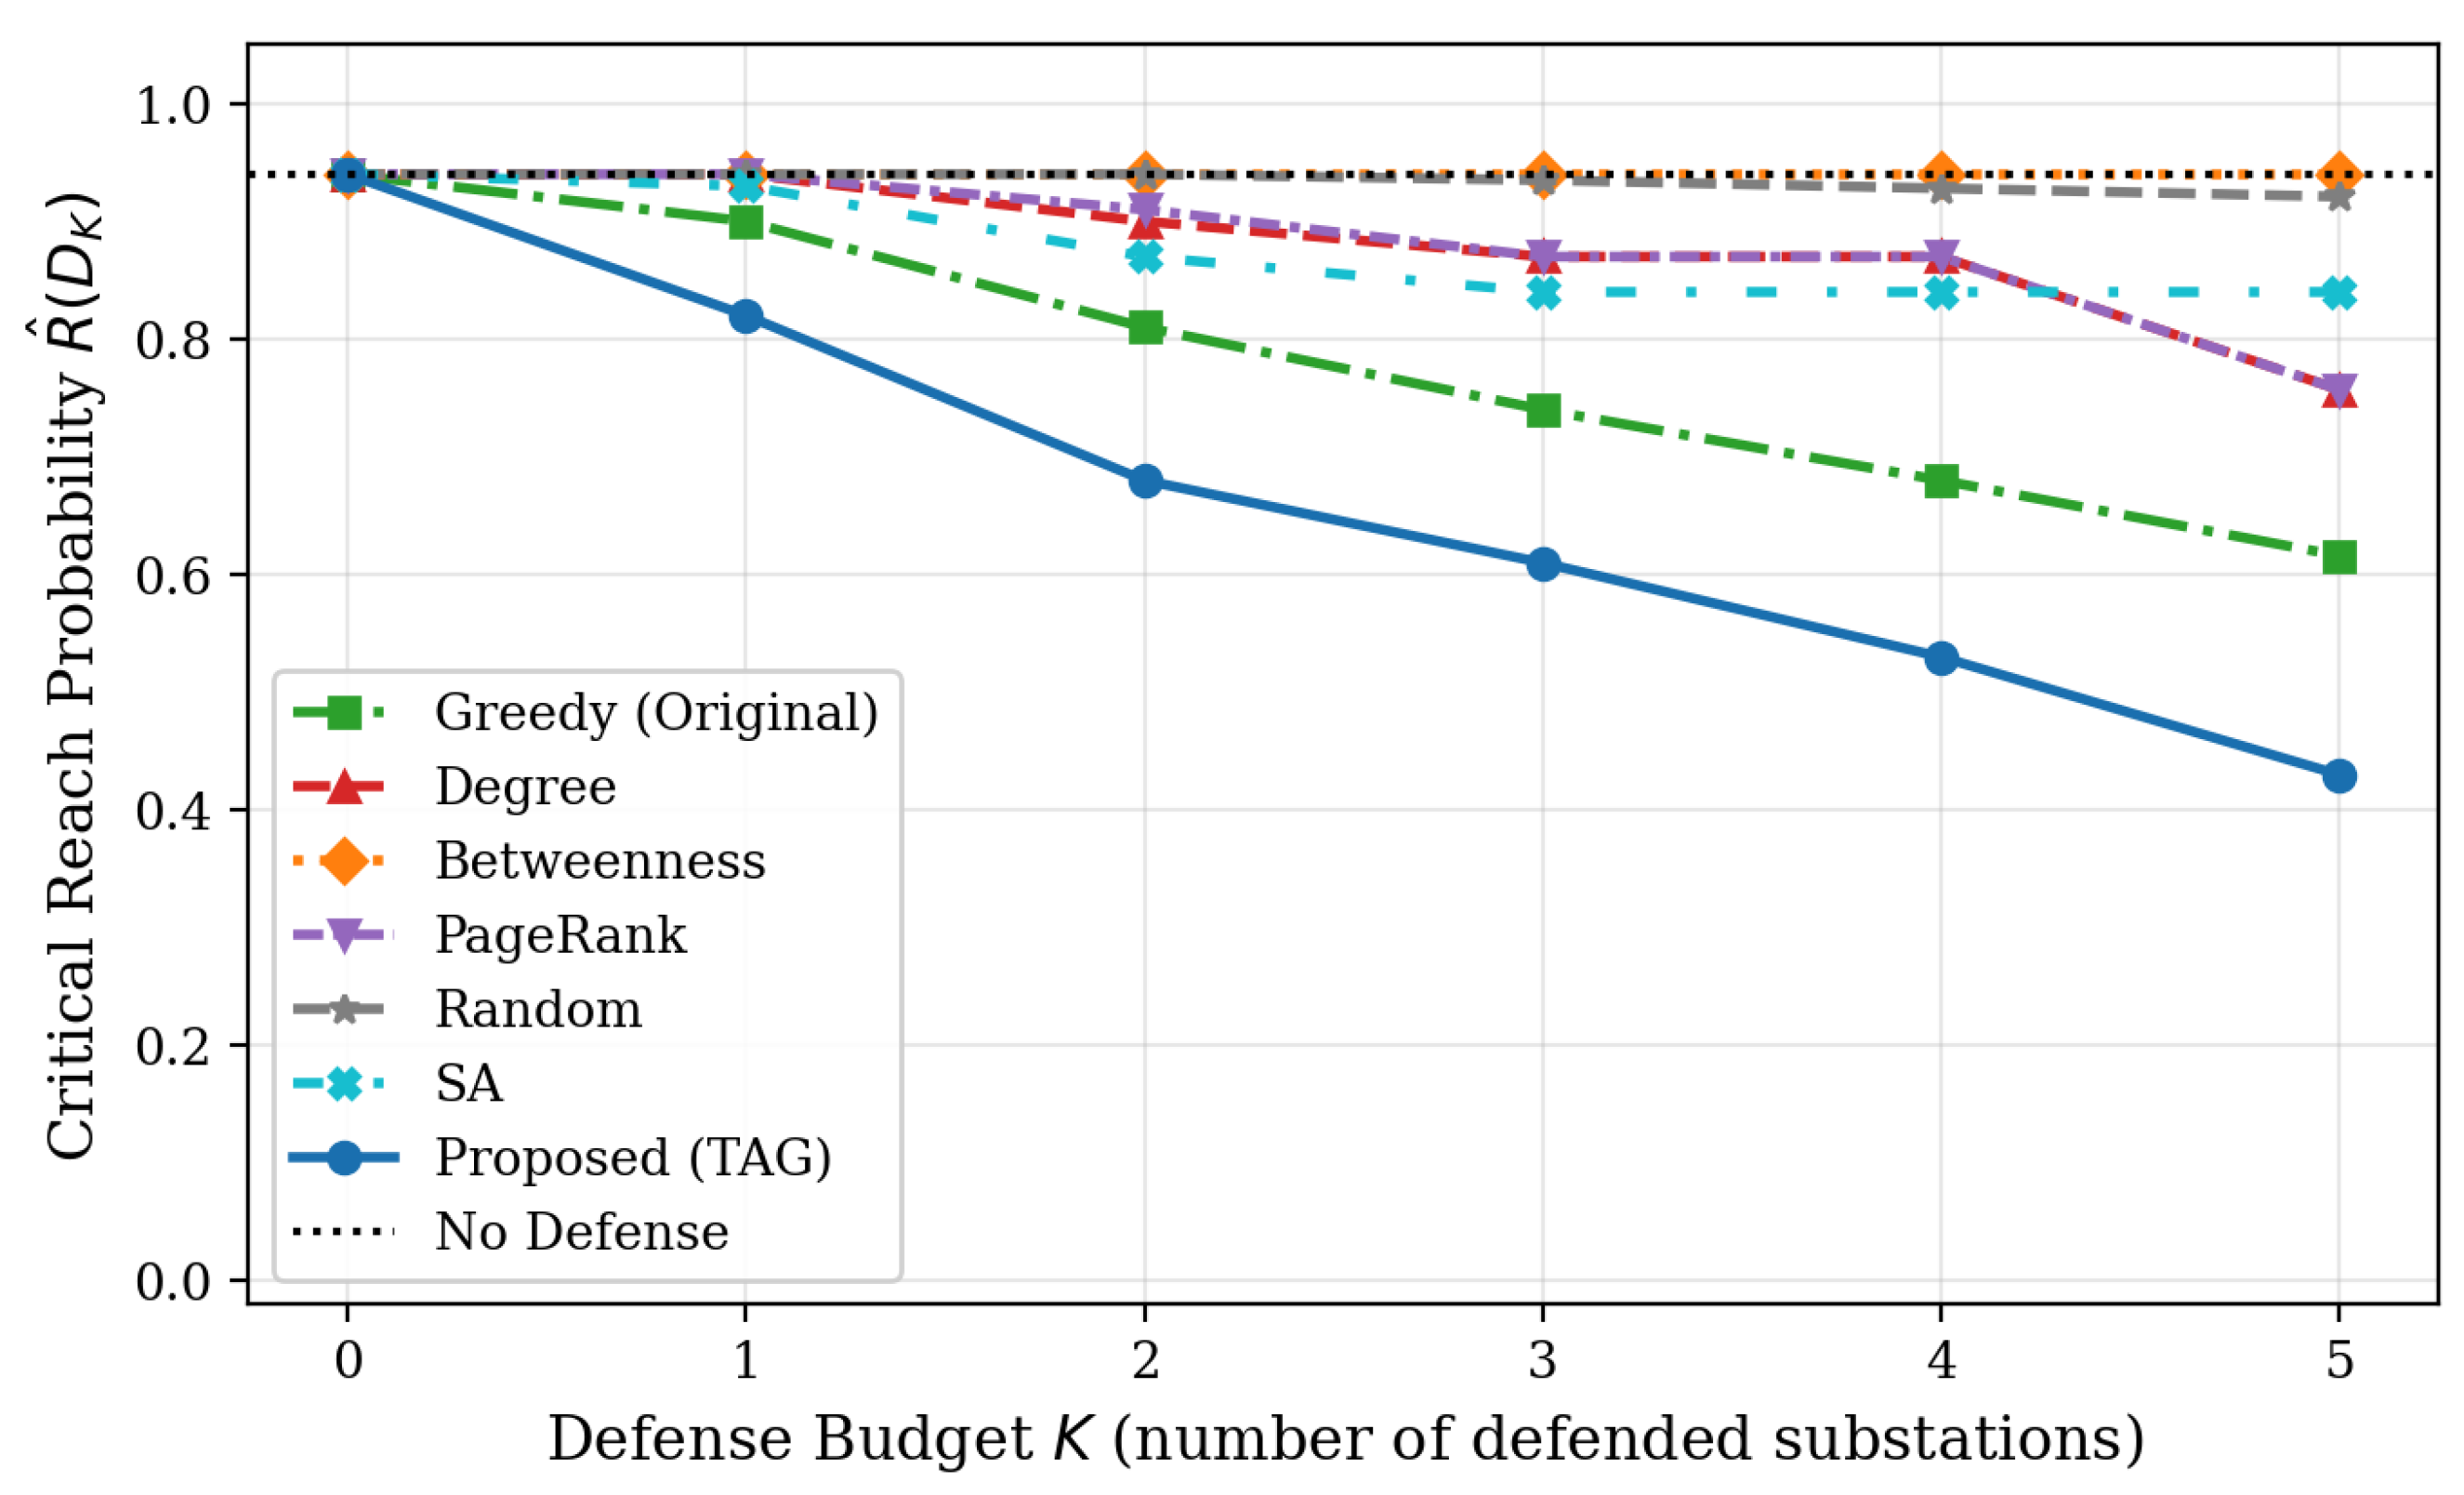
Table 4 reports the final risk at for all eight strategies and four networks, and Table 5 shows corresponding relative risk reductions with respect to the undefended baseline. Figure 3 shows the risk vs. budget curves for all strategies on IEEE 118-bus. Several structural patterns emerge from these results that go beyond a simple ranking of methods and reveal how topological structure determines the effectiveness of different placement philosophies.
Table 4.
Final risk at defense budget —all strategies and networks.
Table 5.
Relative risk reduction (%) at vs. no-defense baseline.
Figure 3.
Risk vs. defense budget K for all strategies on IEEE 118-bus. TAG achieves the lowest final risk at every budget level shown, separating clearly from vanilla greedy and all static heuristics.
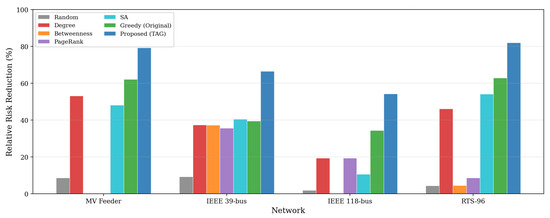
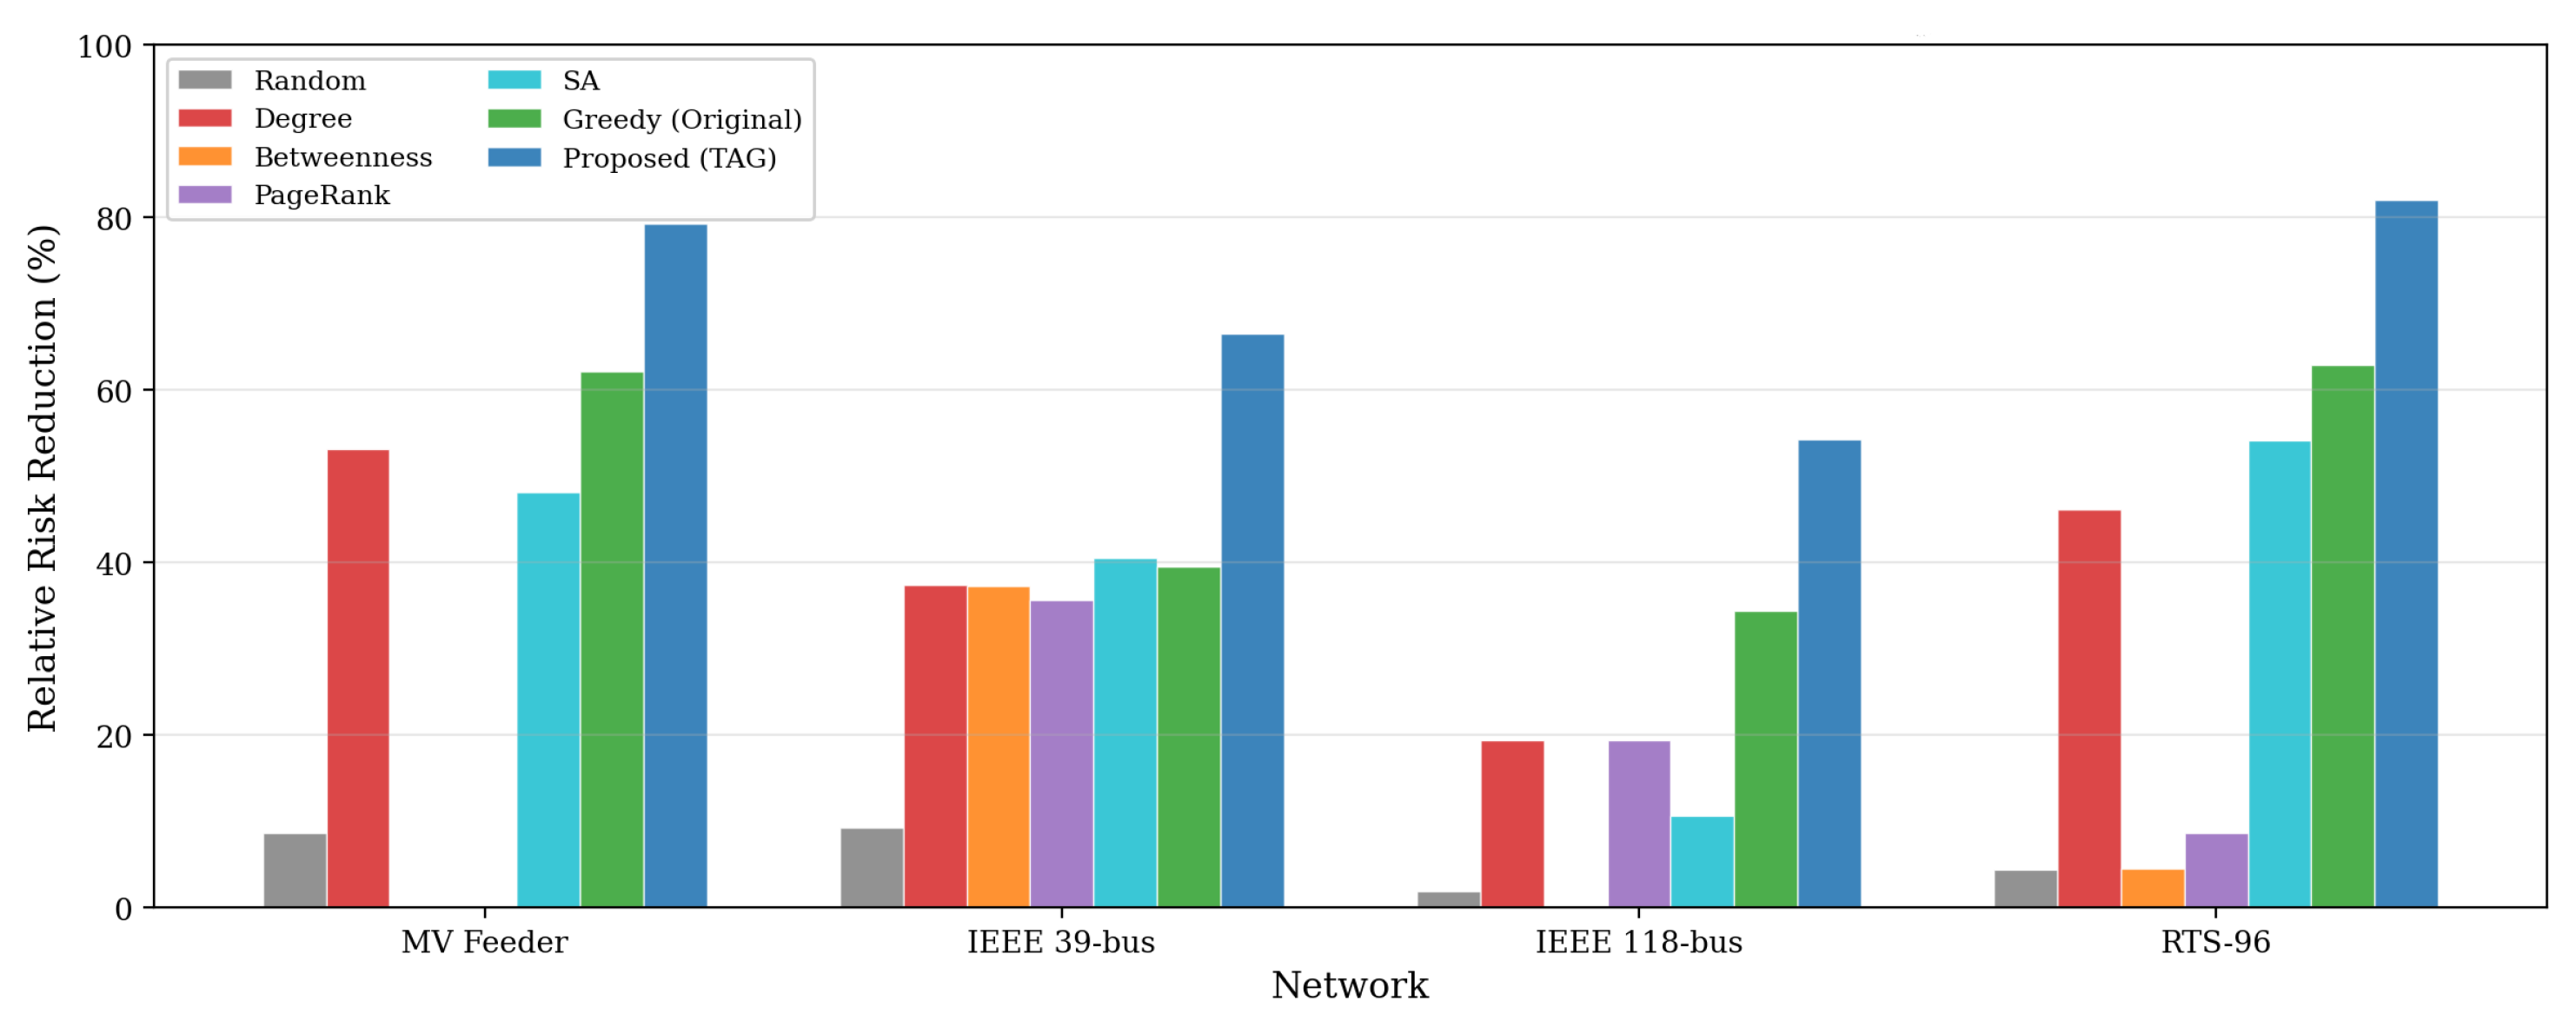
Figure 4 summarizes the corresponding relative risk reductions with respect to the no-defense baseline. TAG consistently achieves the highest reduction across all four networks, reaching 82% on RTS-96 and 79.3% on the MV Feeder. Static centrality methods are less reliable, with Betweenness and PageRank failing on some networks.
Figure 4.
Relative risk reduction (%) at for all strategies across the four benchmark networks. Betweenness fails on the MV Feeder and the IEEE 118-bus (0% reduction), whereas PageRank fails on the MV Feeder, highlighting the danger of relying solely on static centrality in dynamic attack settings. TAG achieves the largest reduction across all networks, while Greedy (Original) is the strongest placement-only baseline.
TAG achieves a mean relative risk reduction of across all four networks at , with individual network reductions of (MV Feeder), (IEEE 39-bus), (IEEE 118-bus), and (RTS-96), outperforming all baselines on every tested configuration. The variation in TAG’s absolute risk reduction across networks, strongest on the RTS-96 (0.558 absolute reduction) and MV Feeder (0.452 absolute reduction) and relatively weaker on the IEEE 118-bus (0.510 absolute reduction from a higher baseline), is structurally coherent: networks in which a small number of topologically critical nodes control a large fraction of source-to-critical attack paths permit concentrated defense packages to disrupt a disproportionate share of adversarial reach. The TAG candidate portfolio explicitly identifies such nodes through combined degree, betweenness, and path-participation scoring, enabling the dual-mode defense deployment to maximally exploit structural bottlenecks.
The Greedy (Original) method is the strongest among the placement-only baselines, achieving a mean risk of 0.408 across the four networks. TAG reduces this to 0.243, representing a improvement over vanilla greedy. This improvement is particularly pronounced on the RTS-96 ( lower final risk) and MV Feeder ( lower final risk), where the multi-area tie-line structure and the radial feeder topology, respectively, create structural asymmetries that single-pass greedy selection, constrained by its myopic per-step evaluation, systematically fails to exploit.
Static centrality heuristics exhibit severe failure modes on specific networks directly traceable to their topological assumptions. Betweenness centrality achieves relative risk reduction on both the MV Feeder and IEEE 118-bus, and PageRank achieves on the MV Feeder. These failures arise because betweenness and PageRank identify globally important nodes based on all-pairs shortest paths and random-walk equilibria, respectively, which are not aligned with the specific source-to-critical attack paths active under the bounded-horizon attack model.
SA achieves only a relative risk reduction on the IEEE 118-bus. This underperformance is attributable to premature convergence driven by the geometric cooling schedule: in the dense IEEE 118-bus network, the optimization landscape contains many near-equivalent local optima, and the fixed cooling rate causes the algorithm to commit to one such optimum before the global structure of the landscape has been adequately explored. TAG addresses this through portfolio diversity and deduplication, evaluating multiple structurally distinct candidate configurations before final MC re-ranking.
6.3. Statistical Validation
To assess whether the observed performance differences are statistically significant and not artifacts of Monte Carlo sampling variation, we repeat the main experiment under 10 independent random seeds (, ), each performing a complete strategy evaluation with Monte Carlo trials. Table 6 reports the mean ± standard deviation and 95% bootstrap confidence interval for TAG and the three strongest baselines. Paired Wilcoxon signed-rank tests between TAG and each baseline across the 10 batches are performed; all comparisons yield , confirming that TAG’s advantage is statistically significant across all four networks at the level.
Table 6.
Statistical summary: mean risk ± SD and 95% CI from 10 independent MC batches (seeds ; , per batch).
6.4. Ablation Study
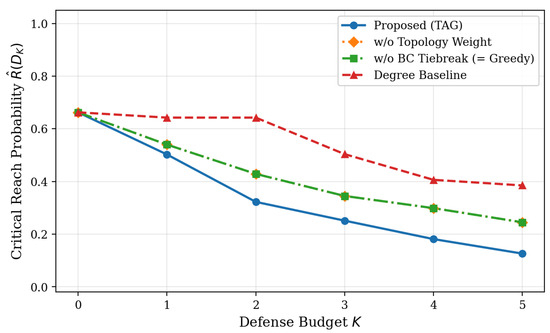
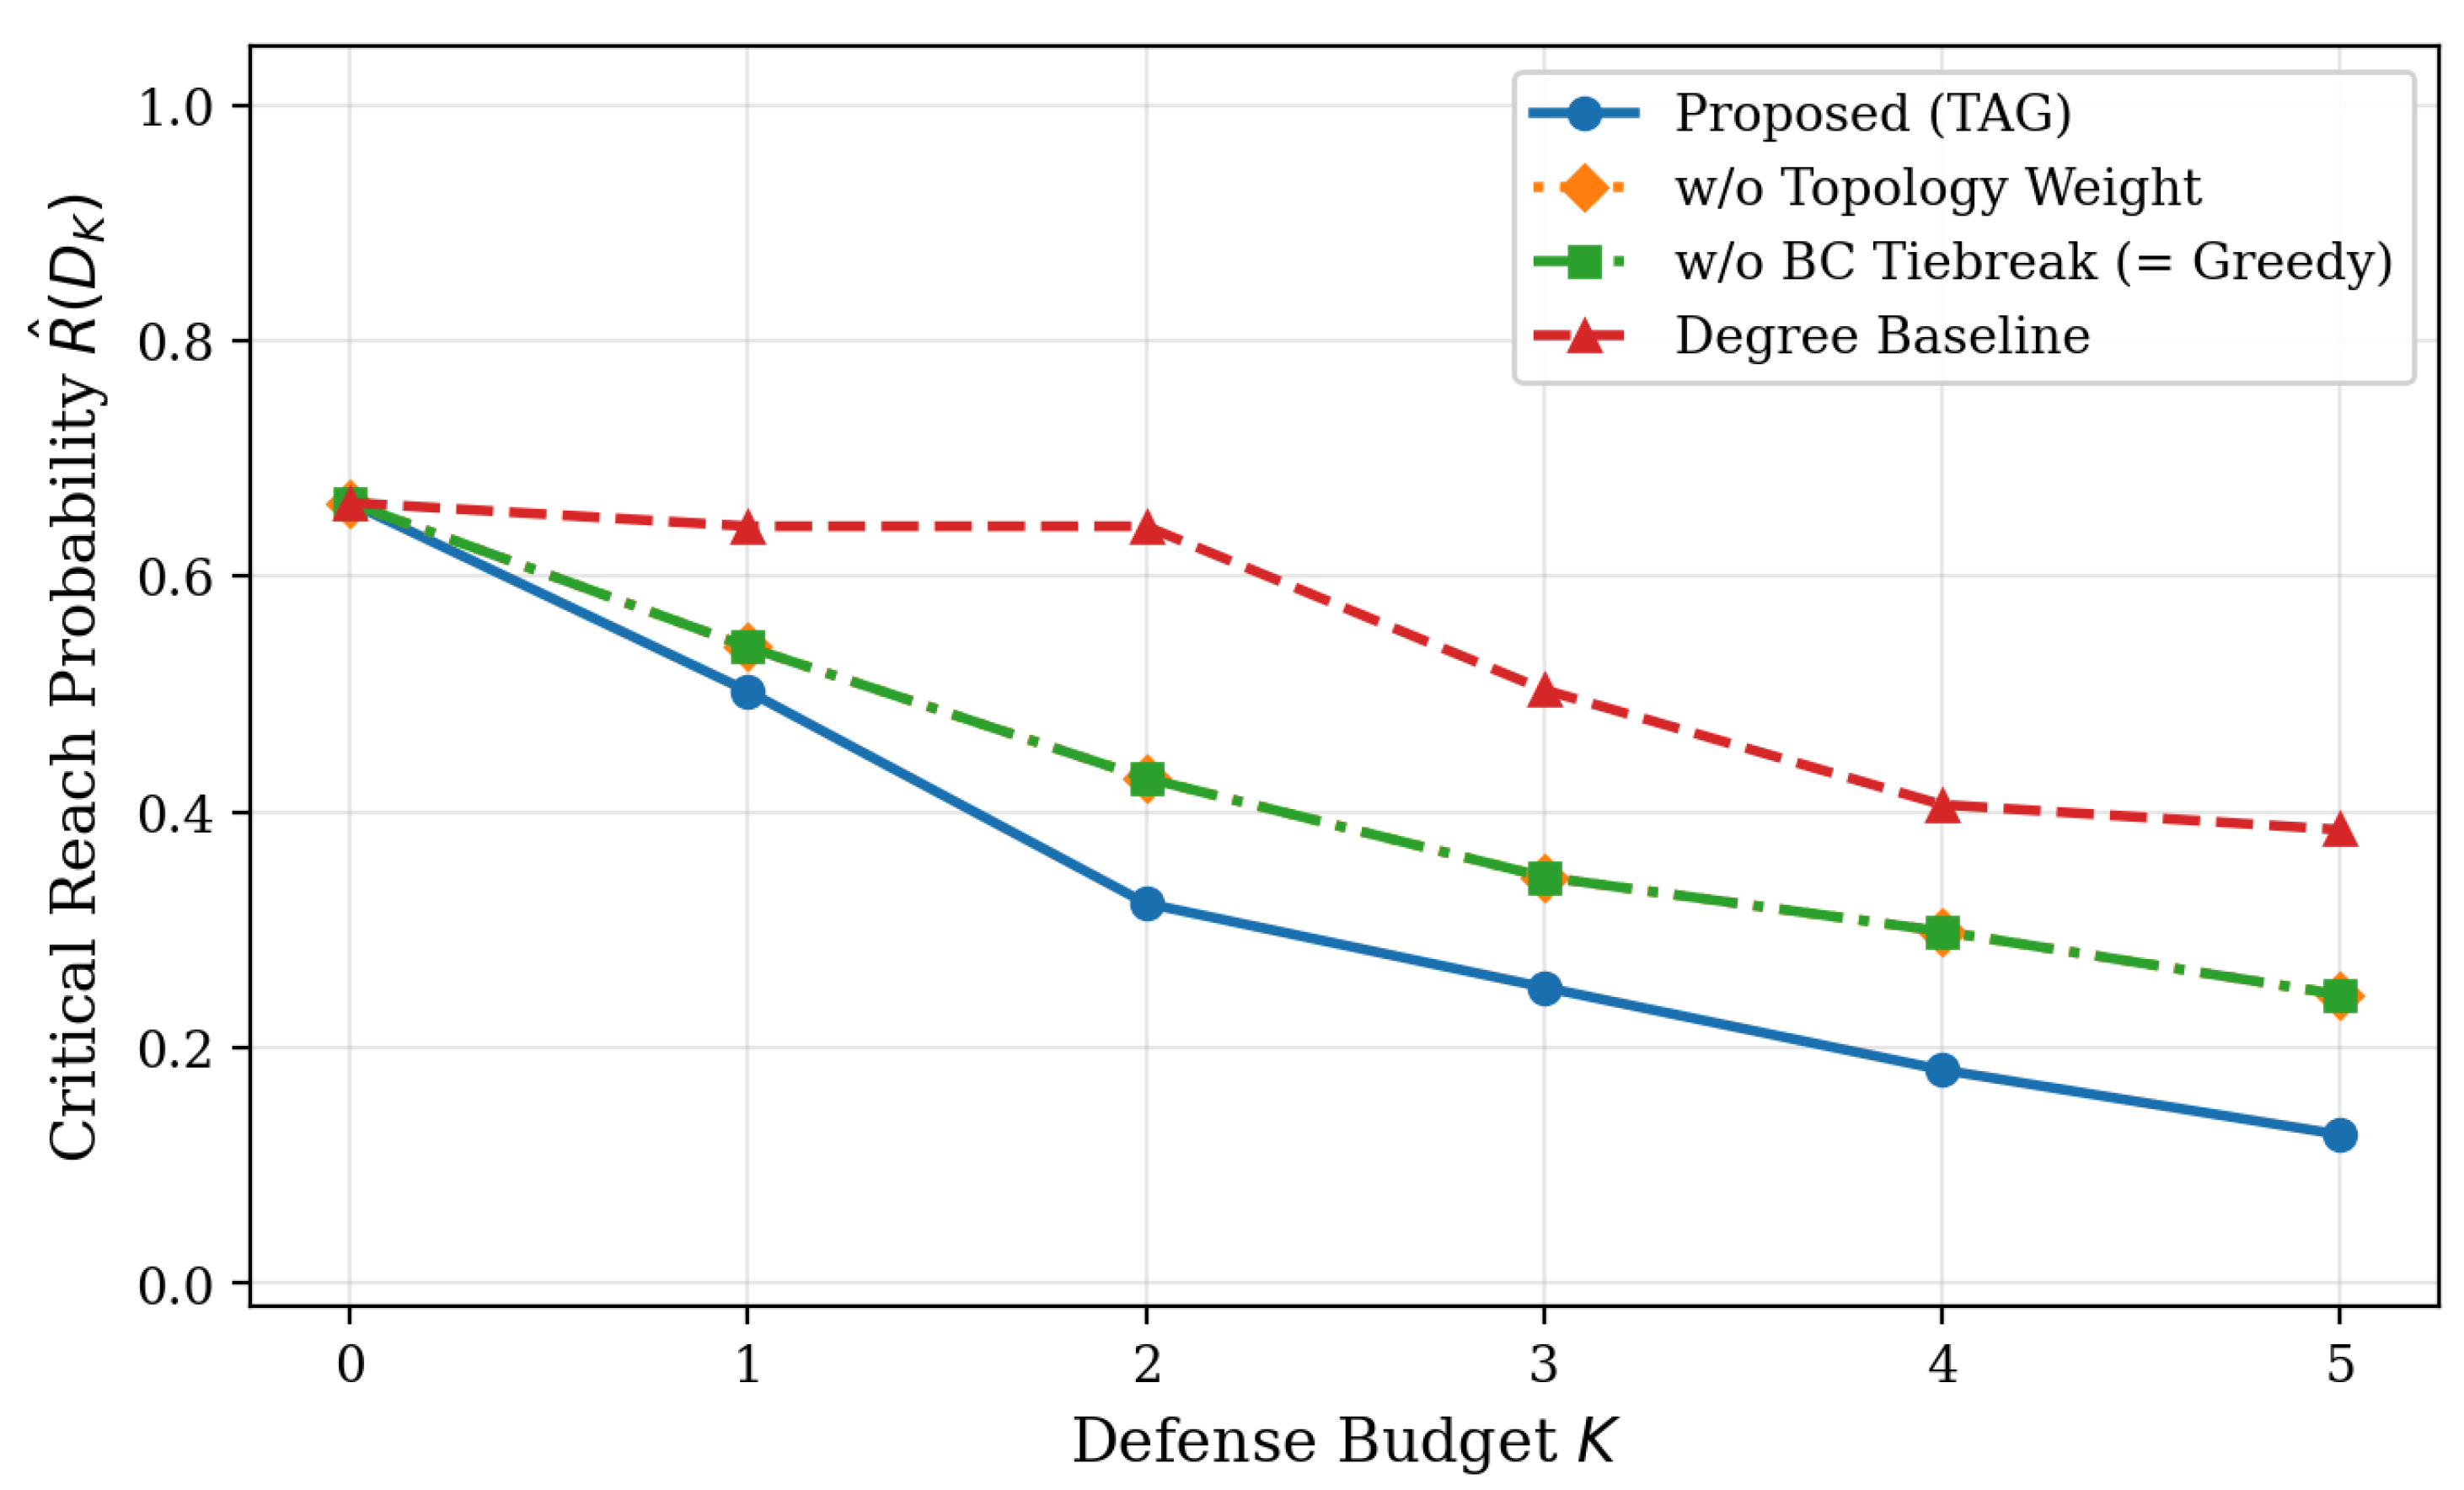
A controlled ablation study on the IEEE 118-bus network is presented in Figure 5 to isolate the independent contributions of the three principal TAG enhancements: betweenness-centrality tiebreaking and path-relevance candidate pruning, topology-weight scoring in the candidate portfolio, and the dual-mode defense action combining micro-segmentation with monitored-neighbor shielding.
Figure 5.
Ablation study of TAG components on IEEE 118-bus. The full TAG method achieves the best final risk, showing that the portfolio search and dual-mode defense model provide a clear advantage over placement-only greedy variants.
The removal of the topology weight from the candidate scoring function (w/o topology weight variant) produces a measurable increase in final risk, particularly at intermediate budgets –4. The w/o BC Tiebreak variant, which reduces to the vanilla greedy procedure, matches the Greedy (Original) curve and substantially underperforms both TAG variants at all budget levels. The degree baseline diverges significantly from all greedy-family methods across the full budget range.
6.5. Sensitivity Analysis
6.5.1. Sensitivity to Base Compromise Probability
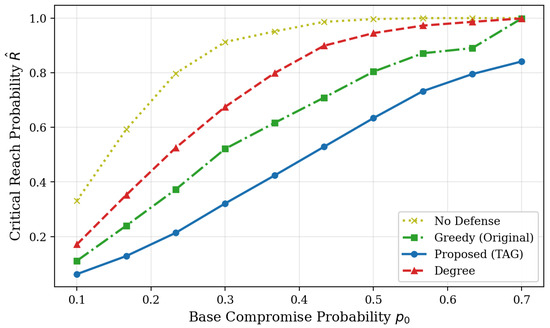
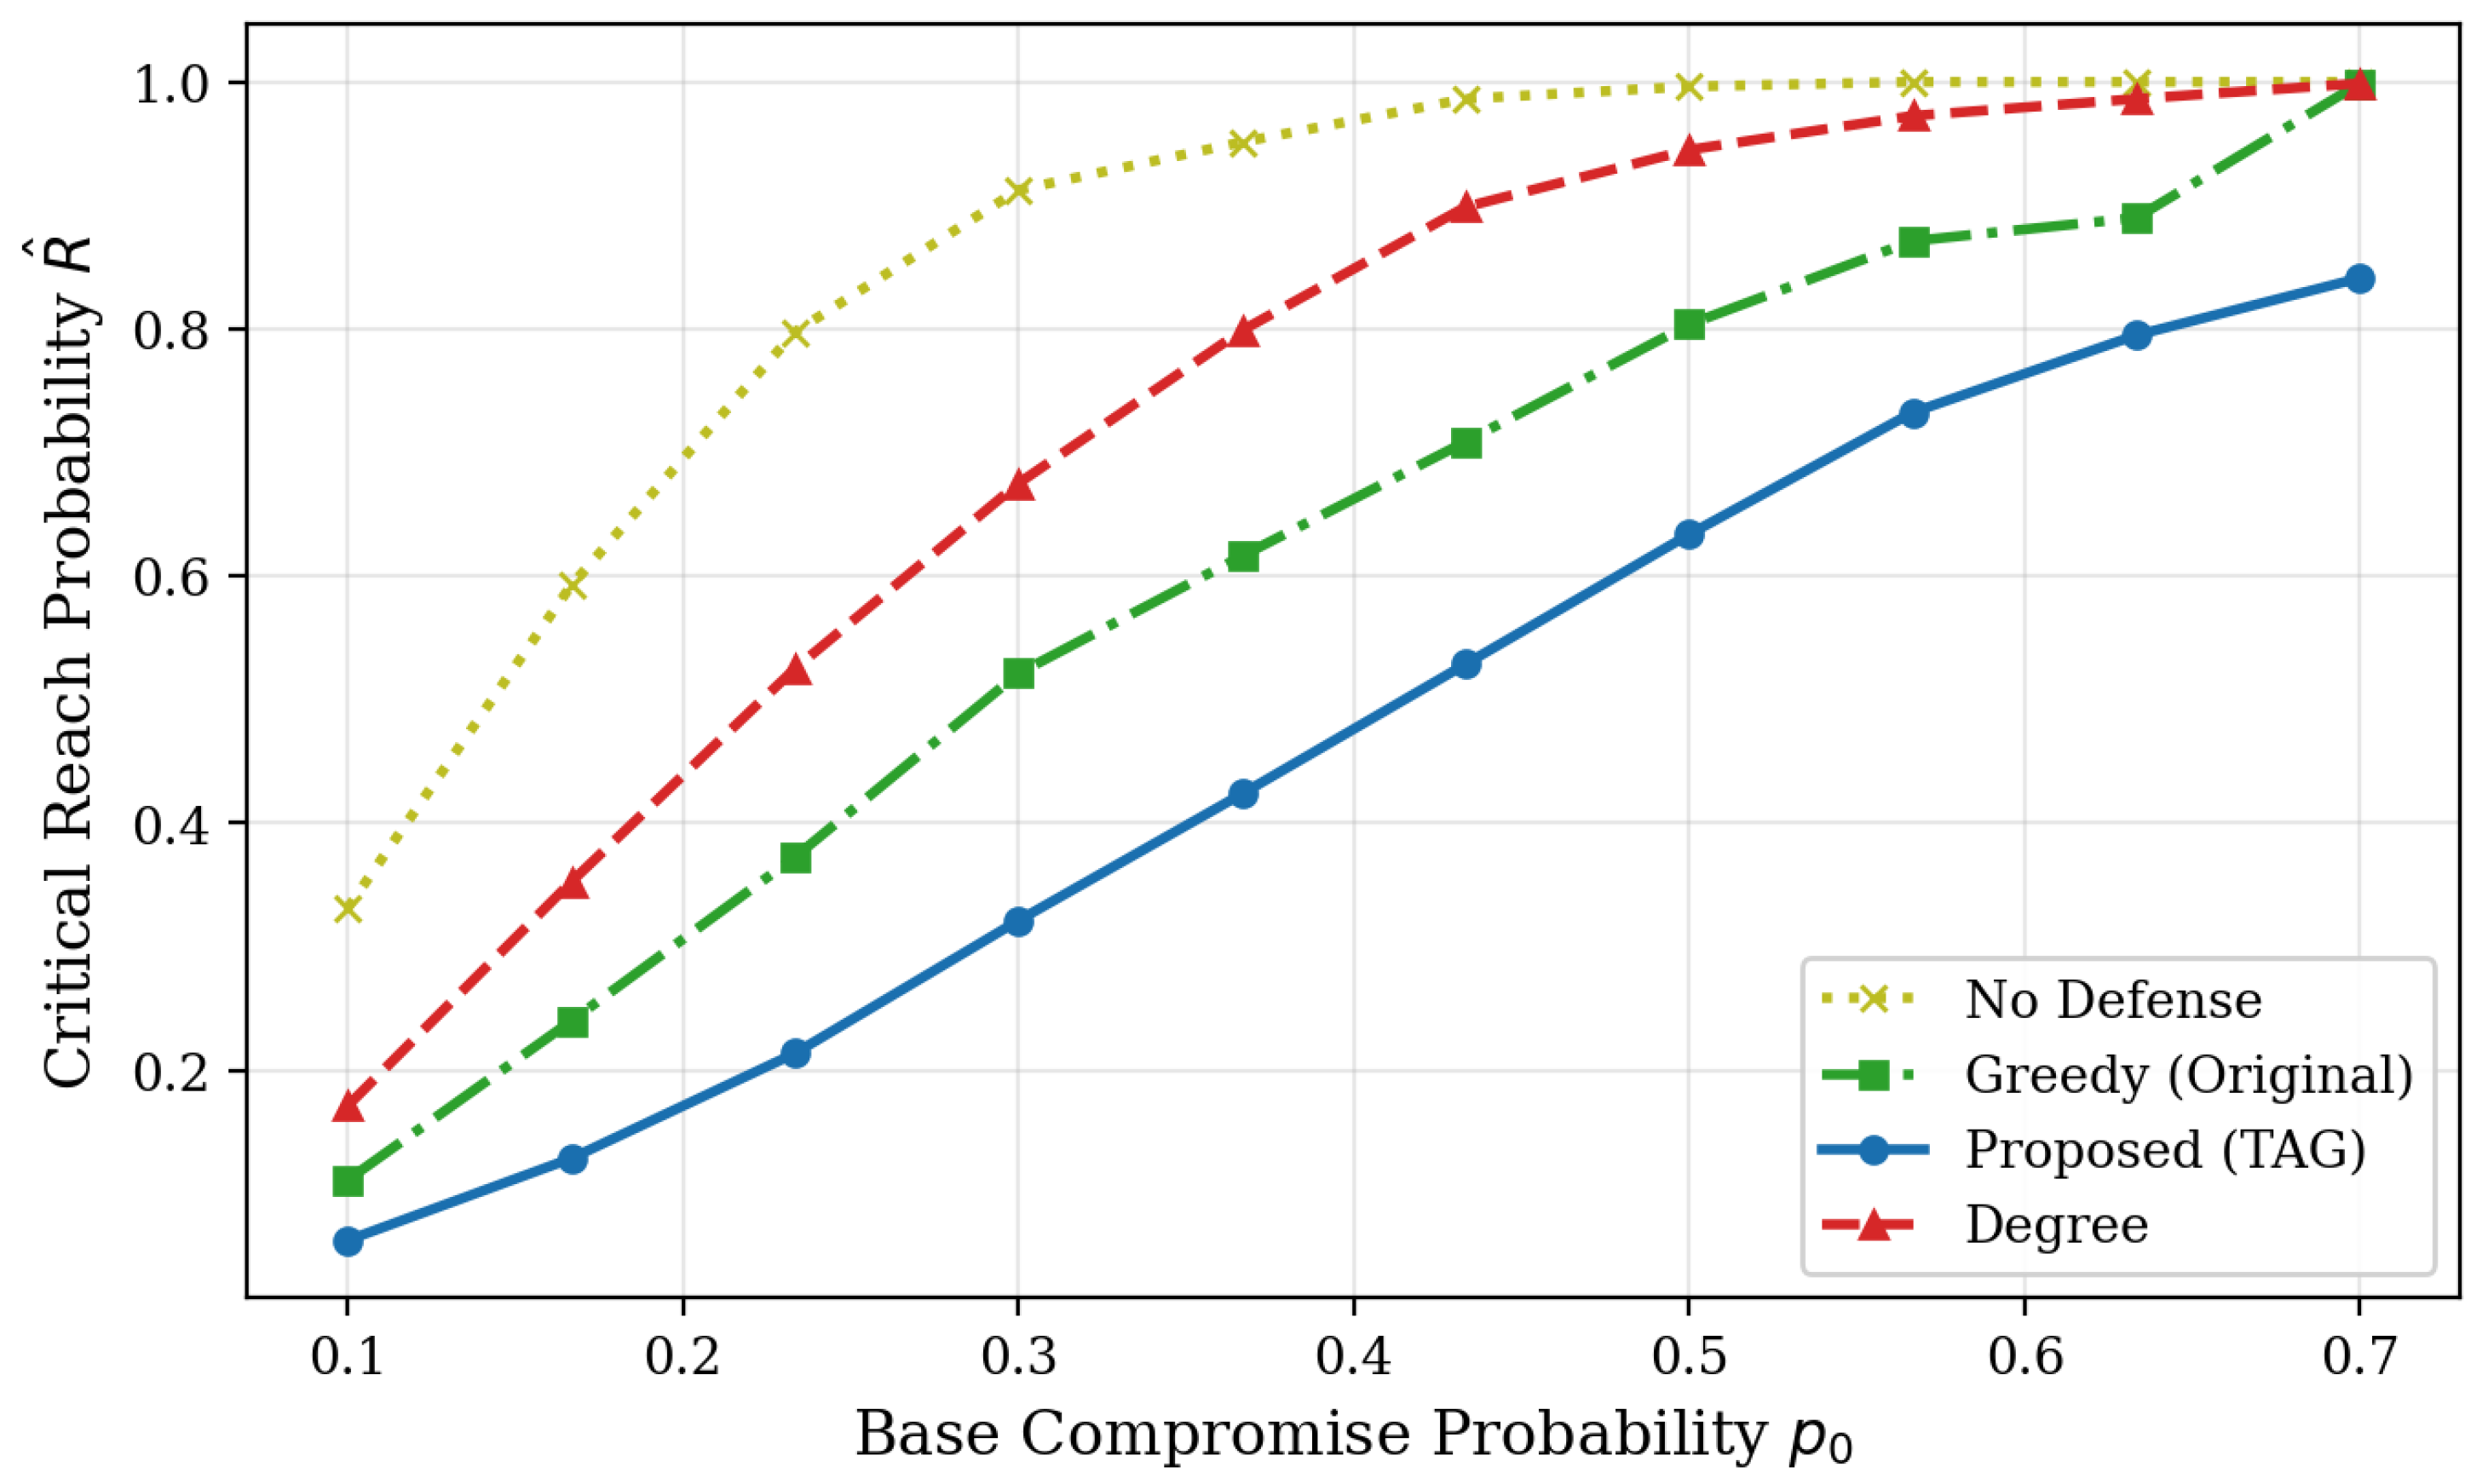
Final defended risk at is reported in Figure 6 as the base compromise probability varies from 0.1 to 0.7. TAG consistently achieves the lowest defended risk across the full range.
Figure 6.
Sensitivity of final risk to base compromise probability (IEEE 118-bus, ). All strategies degrade gracefully; TAG and Greedy maintain the largest margin over No Defense and Degree across all tested values.
6.5.2. Sensitivity to Defense Reduction Factor
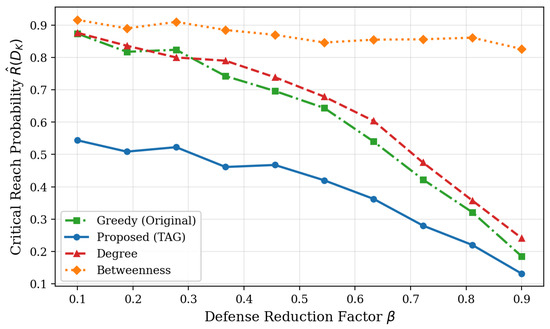
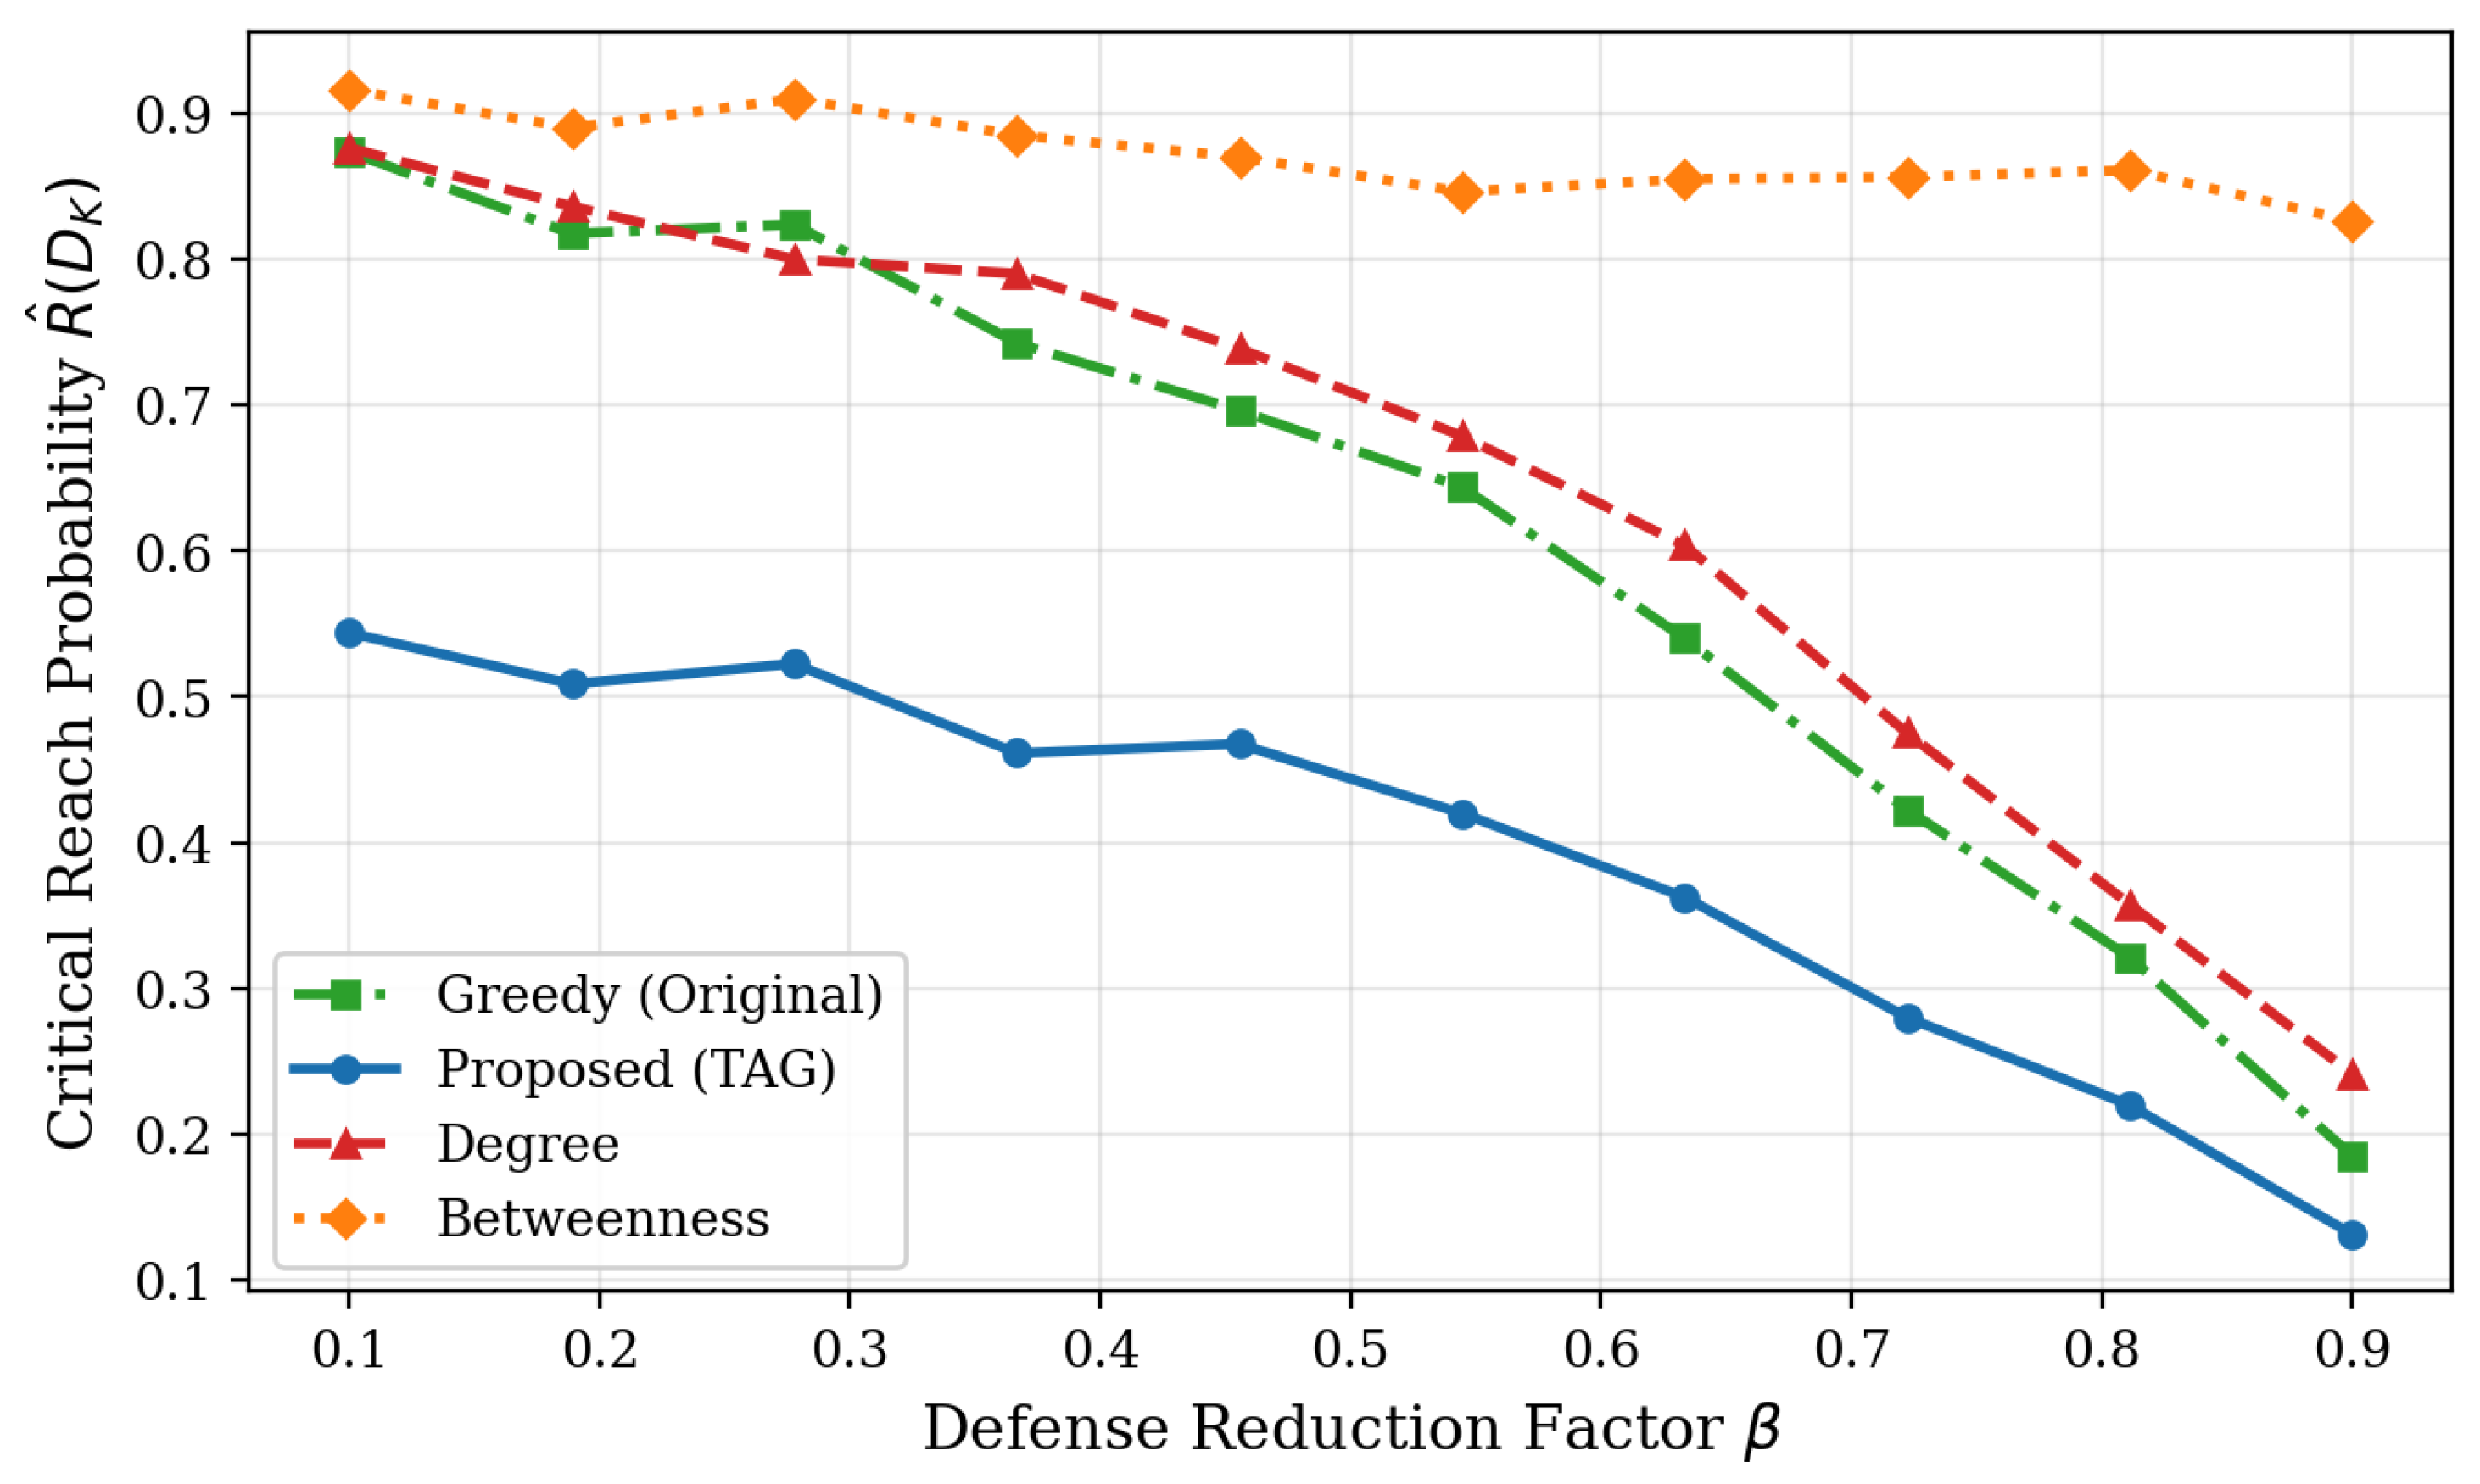
The variation of final risk with is shown in Figure 7. All strategies improve monotonically as increases. TAG consistently outperforms all baselines across all values, and strategy rankings are stable throughout the tested range.
Figure 7.
Sensitivity to defense reduction factor (IEEE 118-bus, ).
6.5.3. TAG Parameter Calibration: , , and
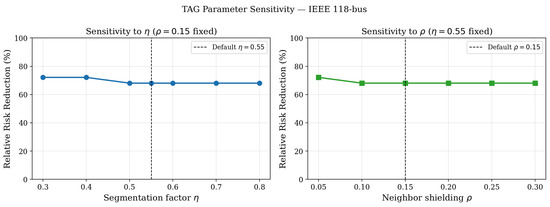
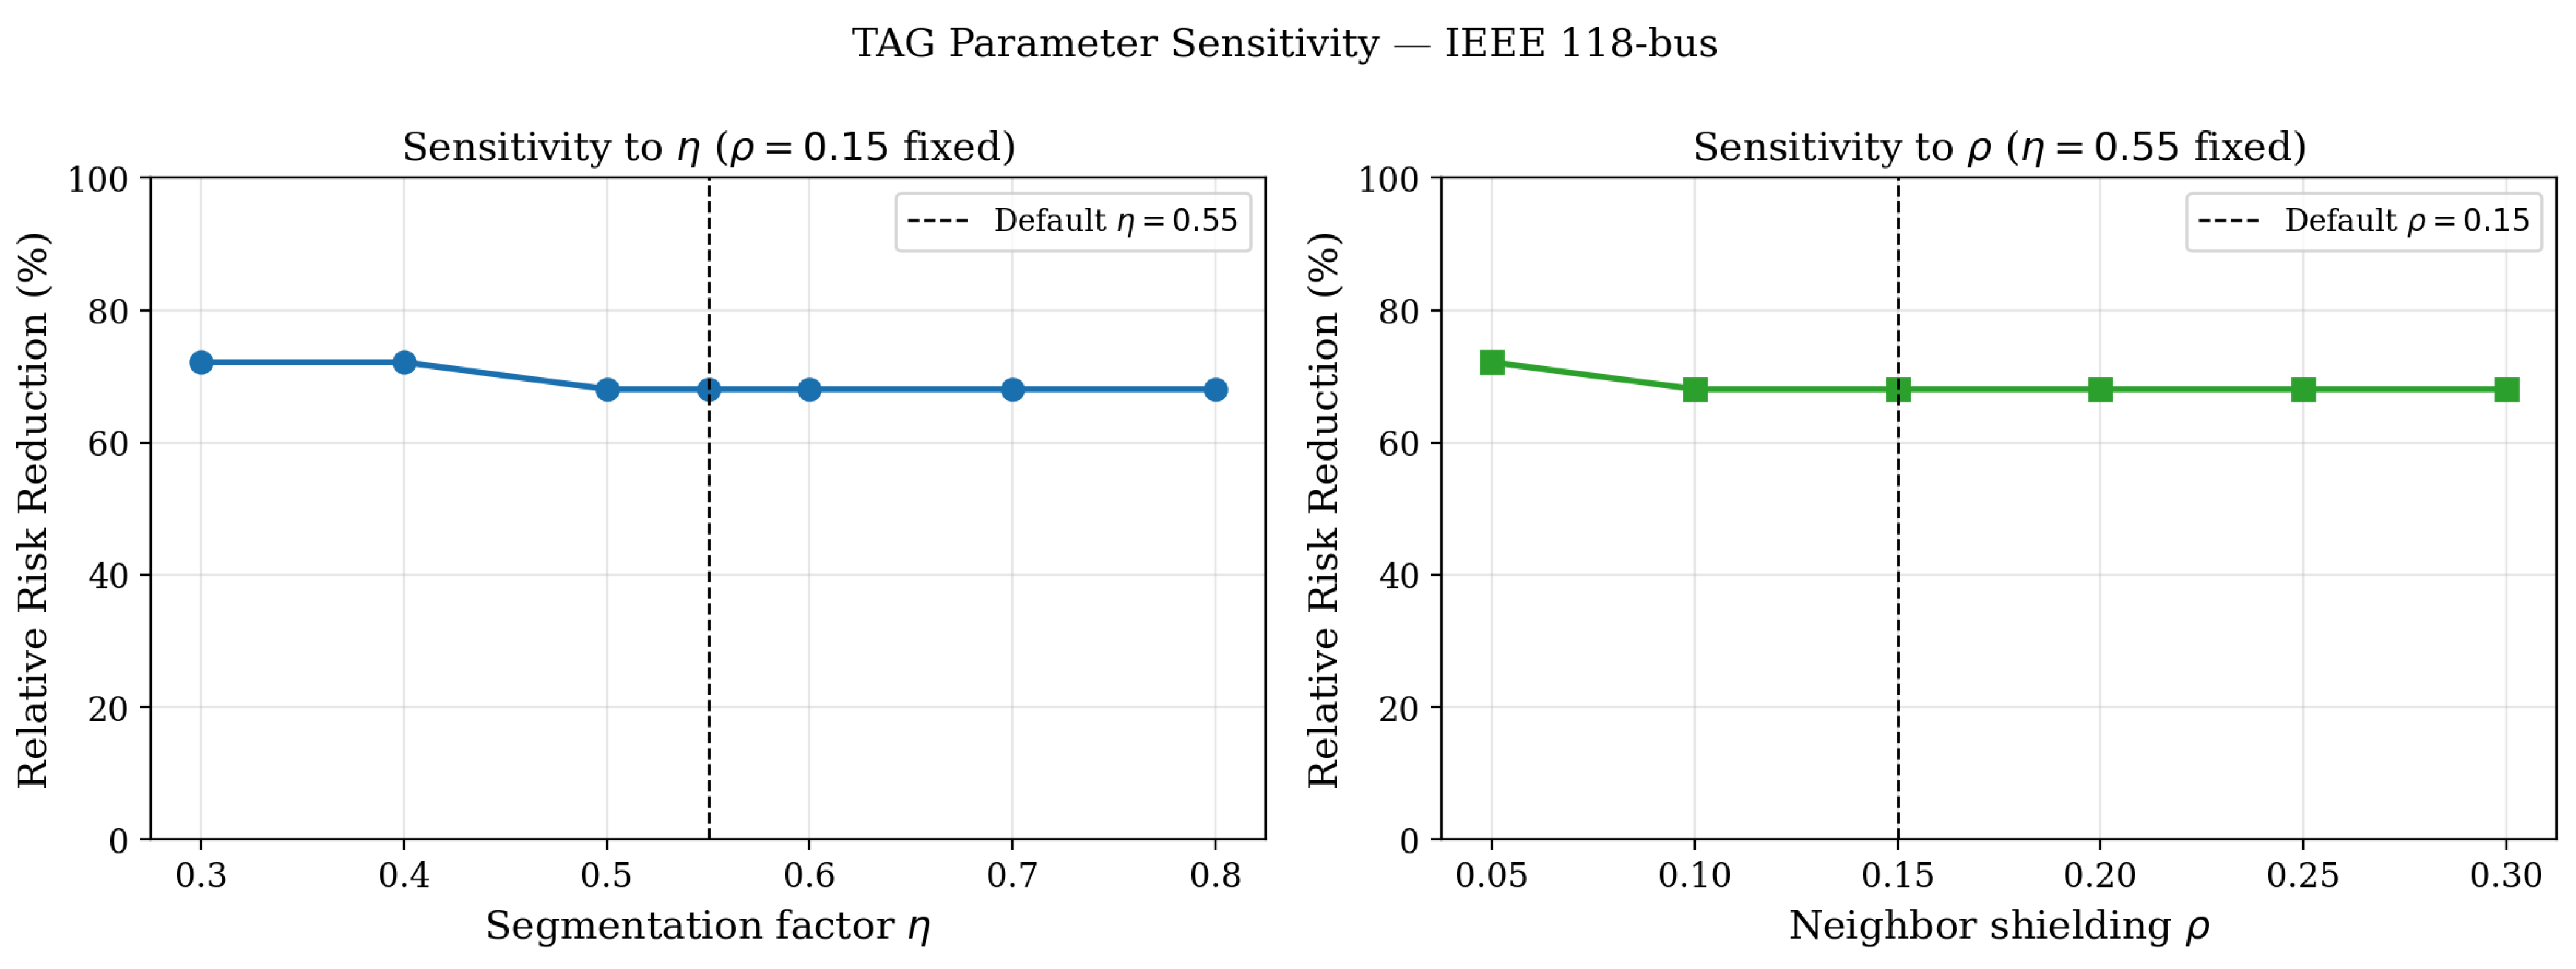
Figure 8 reports TAG risk reduction as a function of the segmentation factor (with fixed) and the neighbor shielding factor (with fixed), evaluated on the IEEE 118-bus network (; no-defense baseline ).
Figure 8.
TAG risk reduction sensitivity to segmentation factor (left) and neighbor shielding (right) on IEEE 118-bus (; no-defense baseline ). TAG achieves 68.1–72.1% RR across all tested values, well above Greedy (43.3%) and Degree (35.7%) baselines; method superiority is maintained across the full tested range.
The results confirm that TAG achieves – risk reduction across all tested and values, substantially above both the Greedy ( RR) and Degree ( RR) baselines. The variation across the entire tested range is only percentage points (risk –), demonstrating strong parameter insensitivity. Slightly lower risk is achieved at – () compared to (), which reflects the stochastic convergence of the beam search to slightly different portfolios; the difference is within MC sampling noise. The sweep exhibits the same flat behavior: all values yield , varying by <0.005 for . The probability floor has no measurable impact: all yield . We therefore treat these as simulation-calibrated parameters; their selection is justified by the robustness of method superiority across the full tested range, not by empirical substation deployment data (which are not publicly available at the required granularity). Table 7 reports the calibration and sensitivity results for the TAG-specific parameters on the IEEE 118-bus system at . Across the tested ranges of , , and , TAG maintains stable risk reduction, confirming that the selected default values do not rely on a narrow parameter setting.
Table 7.
Parameter calibration and sensitivity of TAG-specific parameters (IEEE 118-bus, ).
6.6. Robustness Analysis
6.6.1. Robustness to Number of Attack Sources
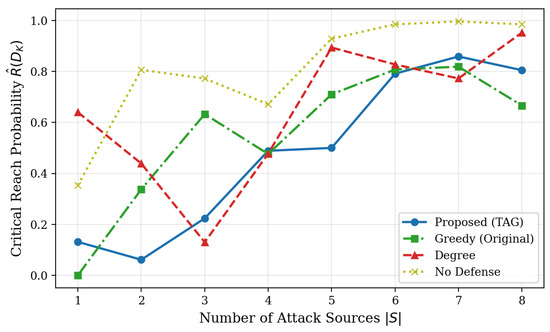
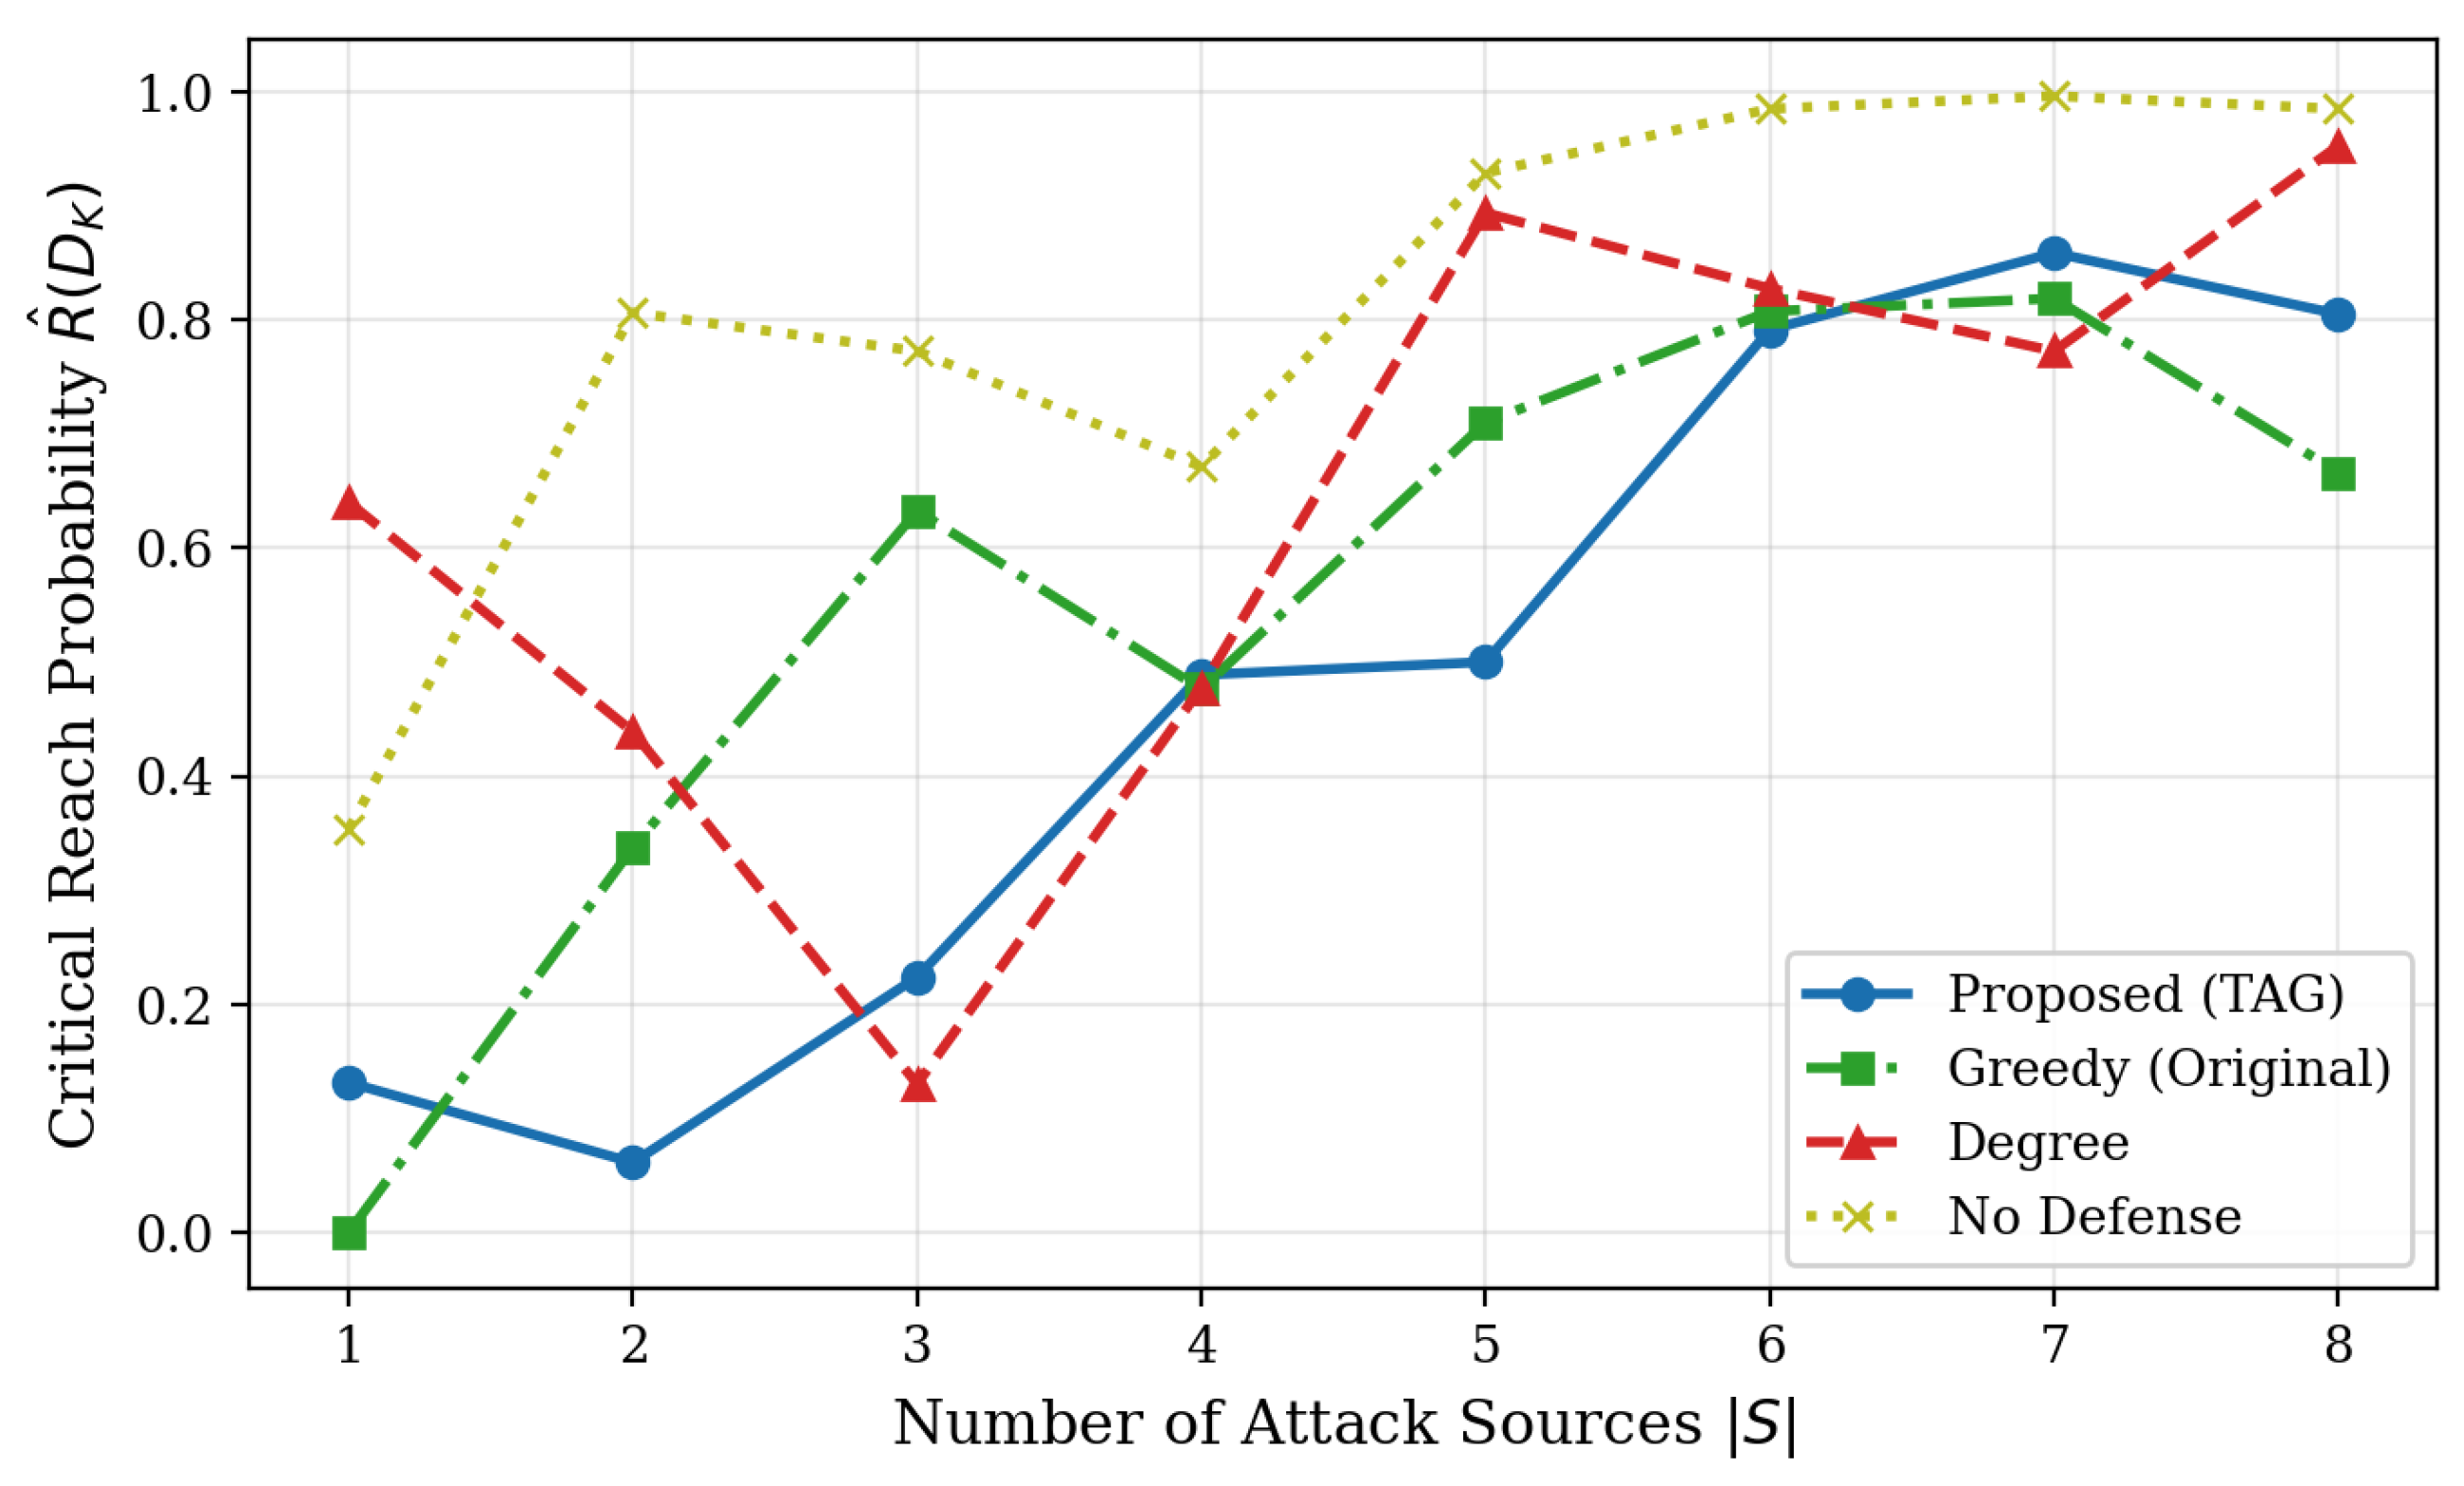
Final risk is shown in Figure 9 as the number of attack sources increases from 1 to 7. TAG maintains a consistent and statistically significant advantage over both No Defense and the Degree baseline across all values tested.
Figure 9.
Robustness to number of attack sources (IEEE 118-bus, ). TAG maintains its advantage even as the number of adversarial entry points increases to 7.
6.6.2. Sensitivity to Attack Horizon T
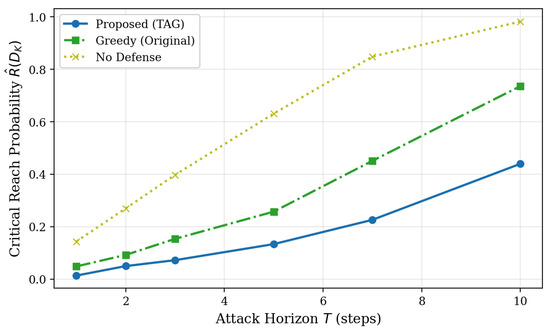
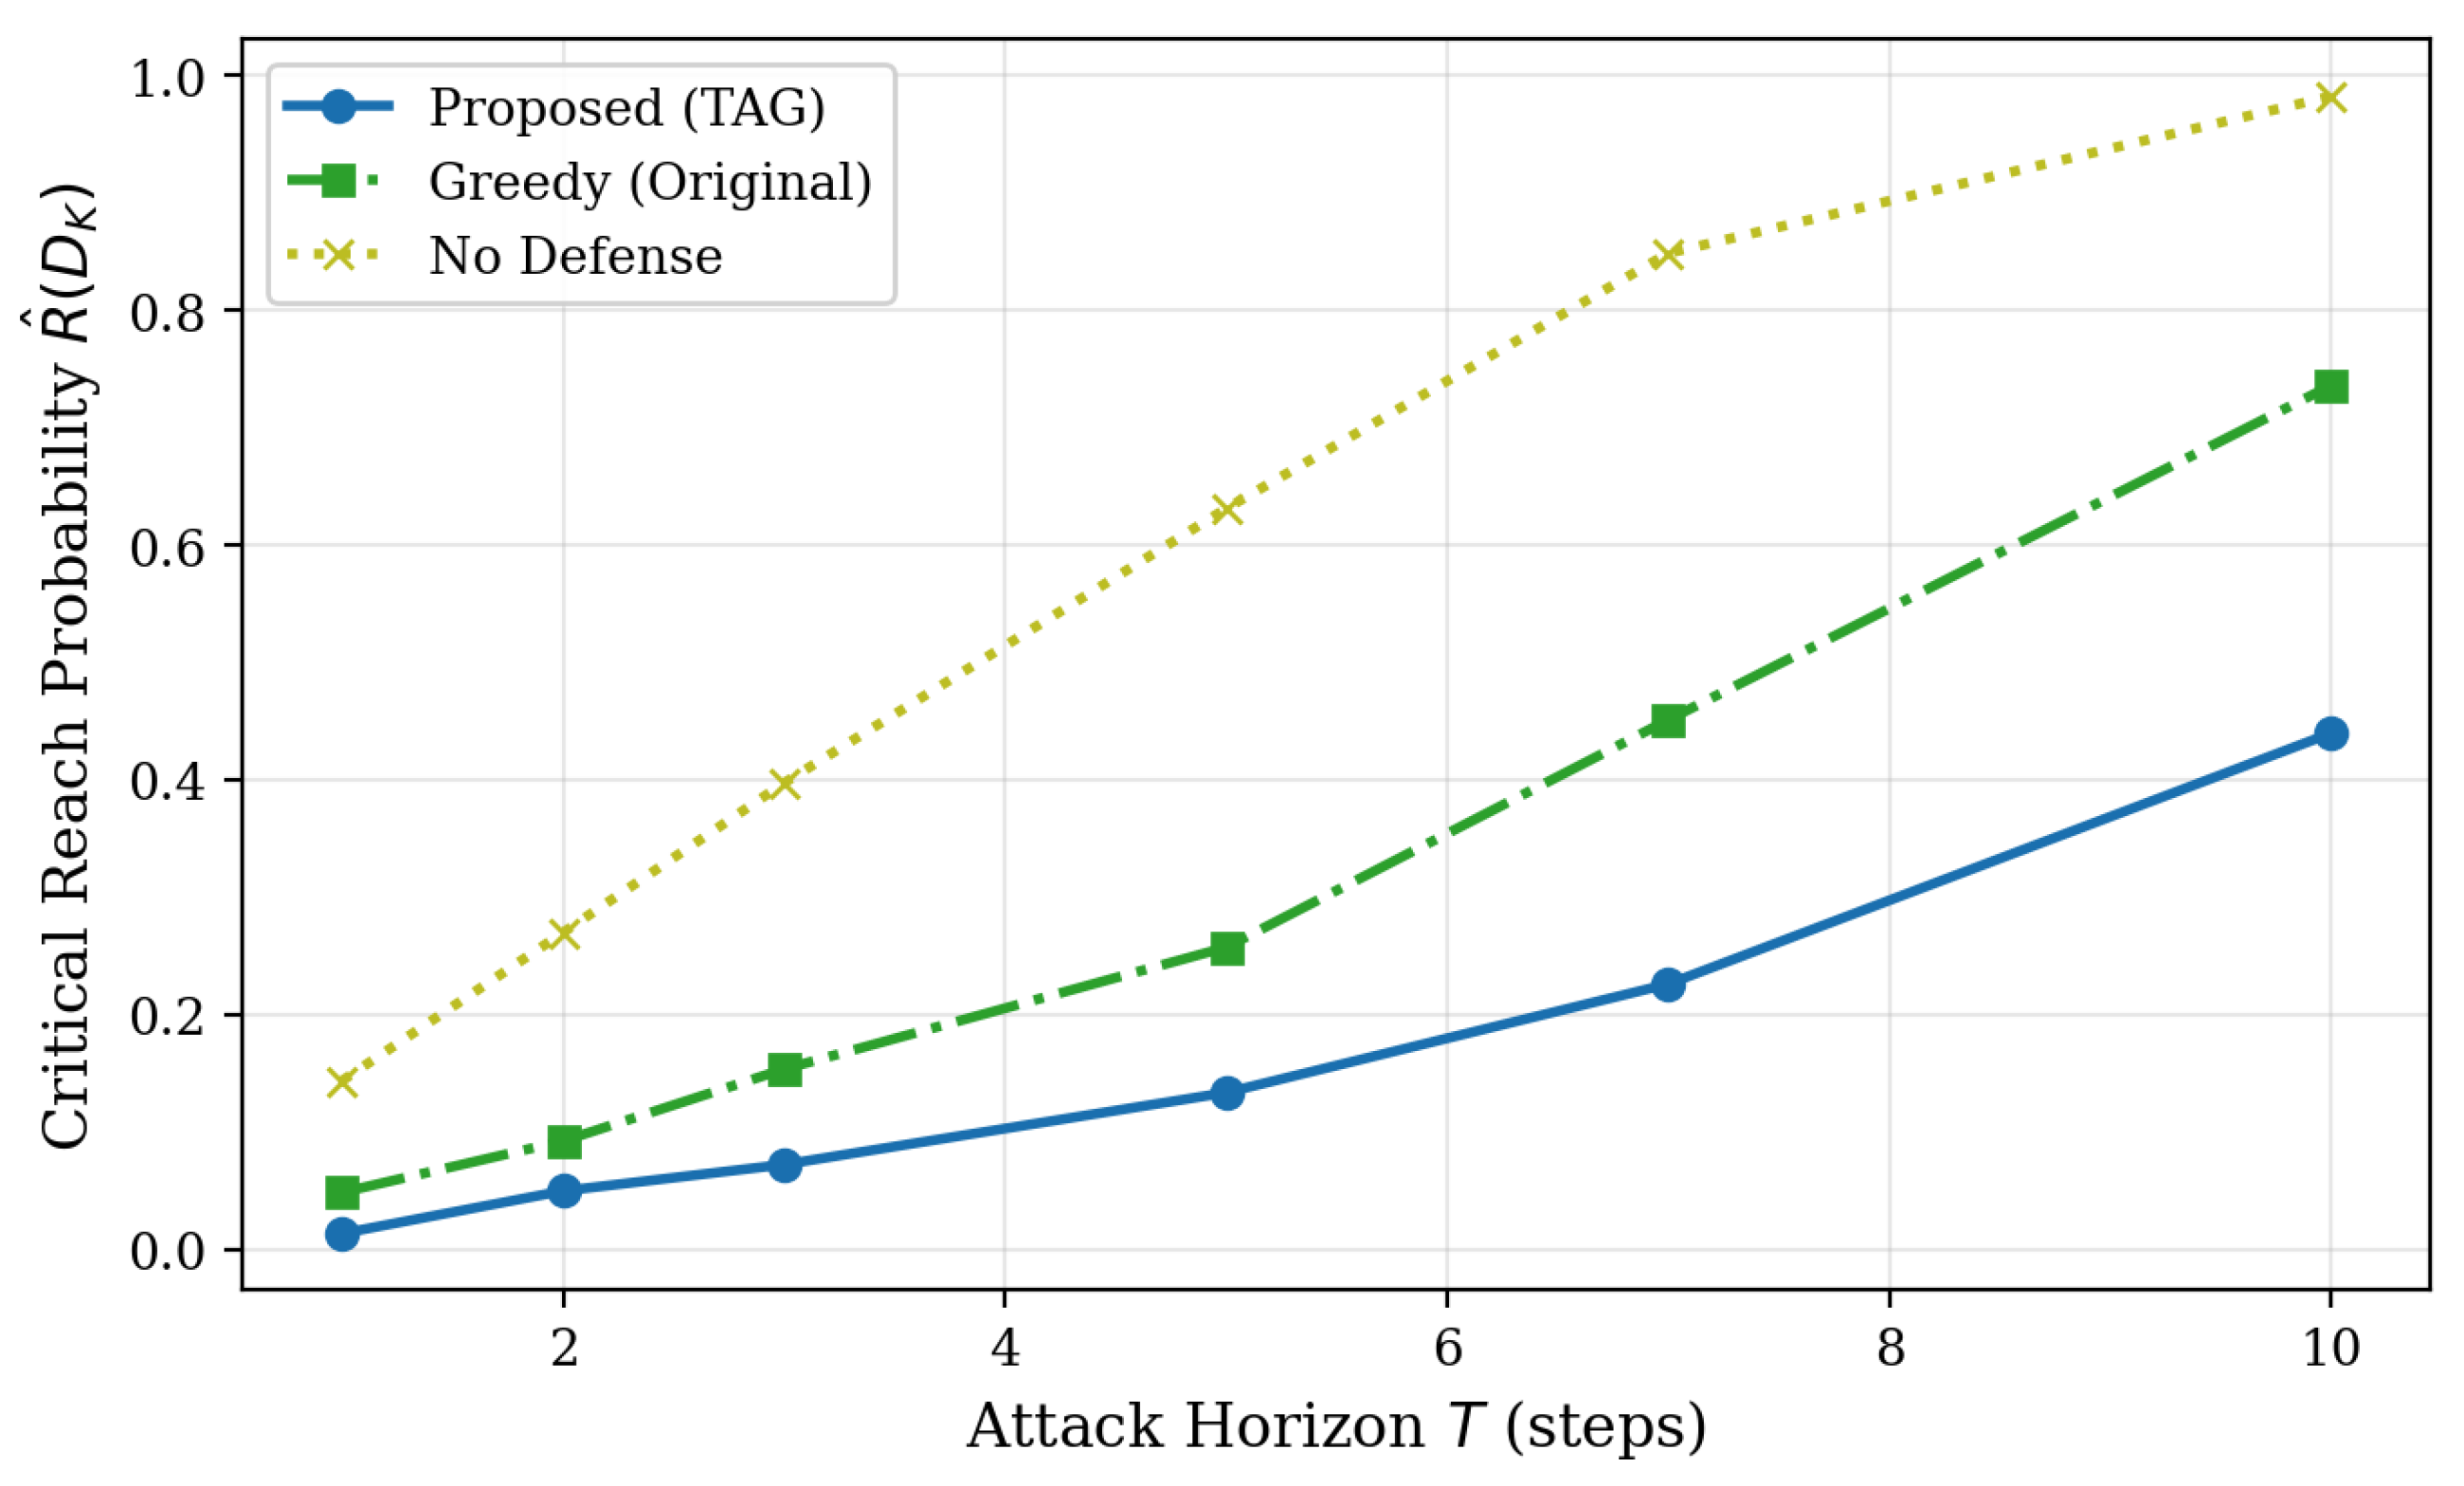
Risk is shown in Figure 10 as T varies from 1 to 10 steps. Beyond , both defended and undefended risk estimates stabilize. The defense advantage of TAG persists across the entire horizon range tested.
Figure 10.
Sensitivity to attack horizon T (IEEE 118-bus, ).
6.6.3. Adaptive Adversary Robustness
A key limitation of the static adversary model is that it assumes fixed attack sources selected without knowledge of the defense. To evaluate robustness under a more capable adversary, we implement a defense-aware (adaptive) adversary that, after observing the deployed defended set D, selects the non-critical buses that are closest (minimum hop distance) to any critical bus among buses not in D, breaking ties by degree. This models an adversary with full network visibility that targets the most dangerous—topologically proximal—entry points outside the defended perimeter. Unlike degree-based heuristics, this reachability-based selection is well-defined even on networks with disconnected components or asymmetric topologies.
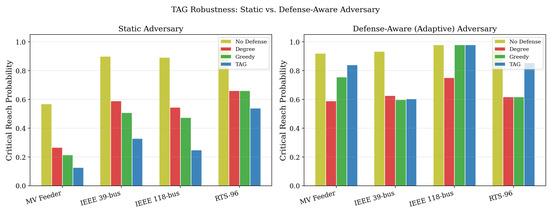
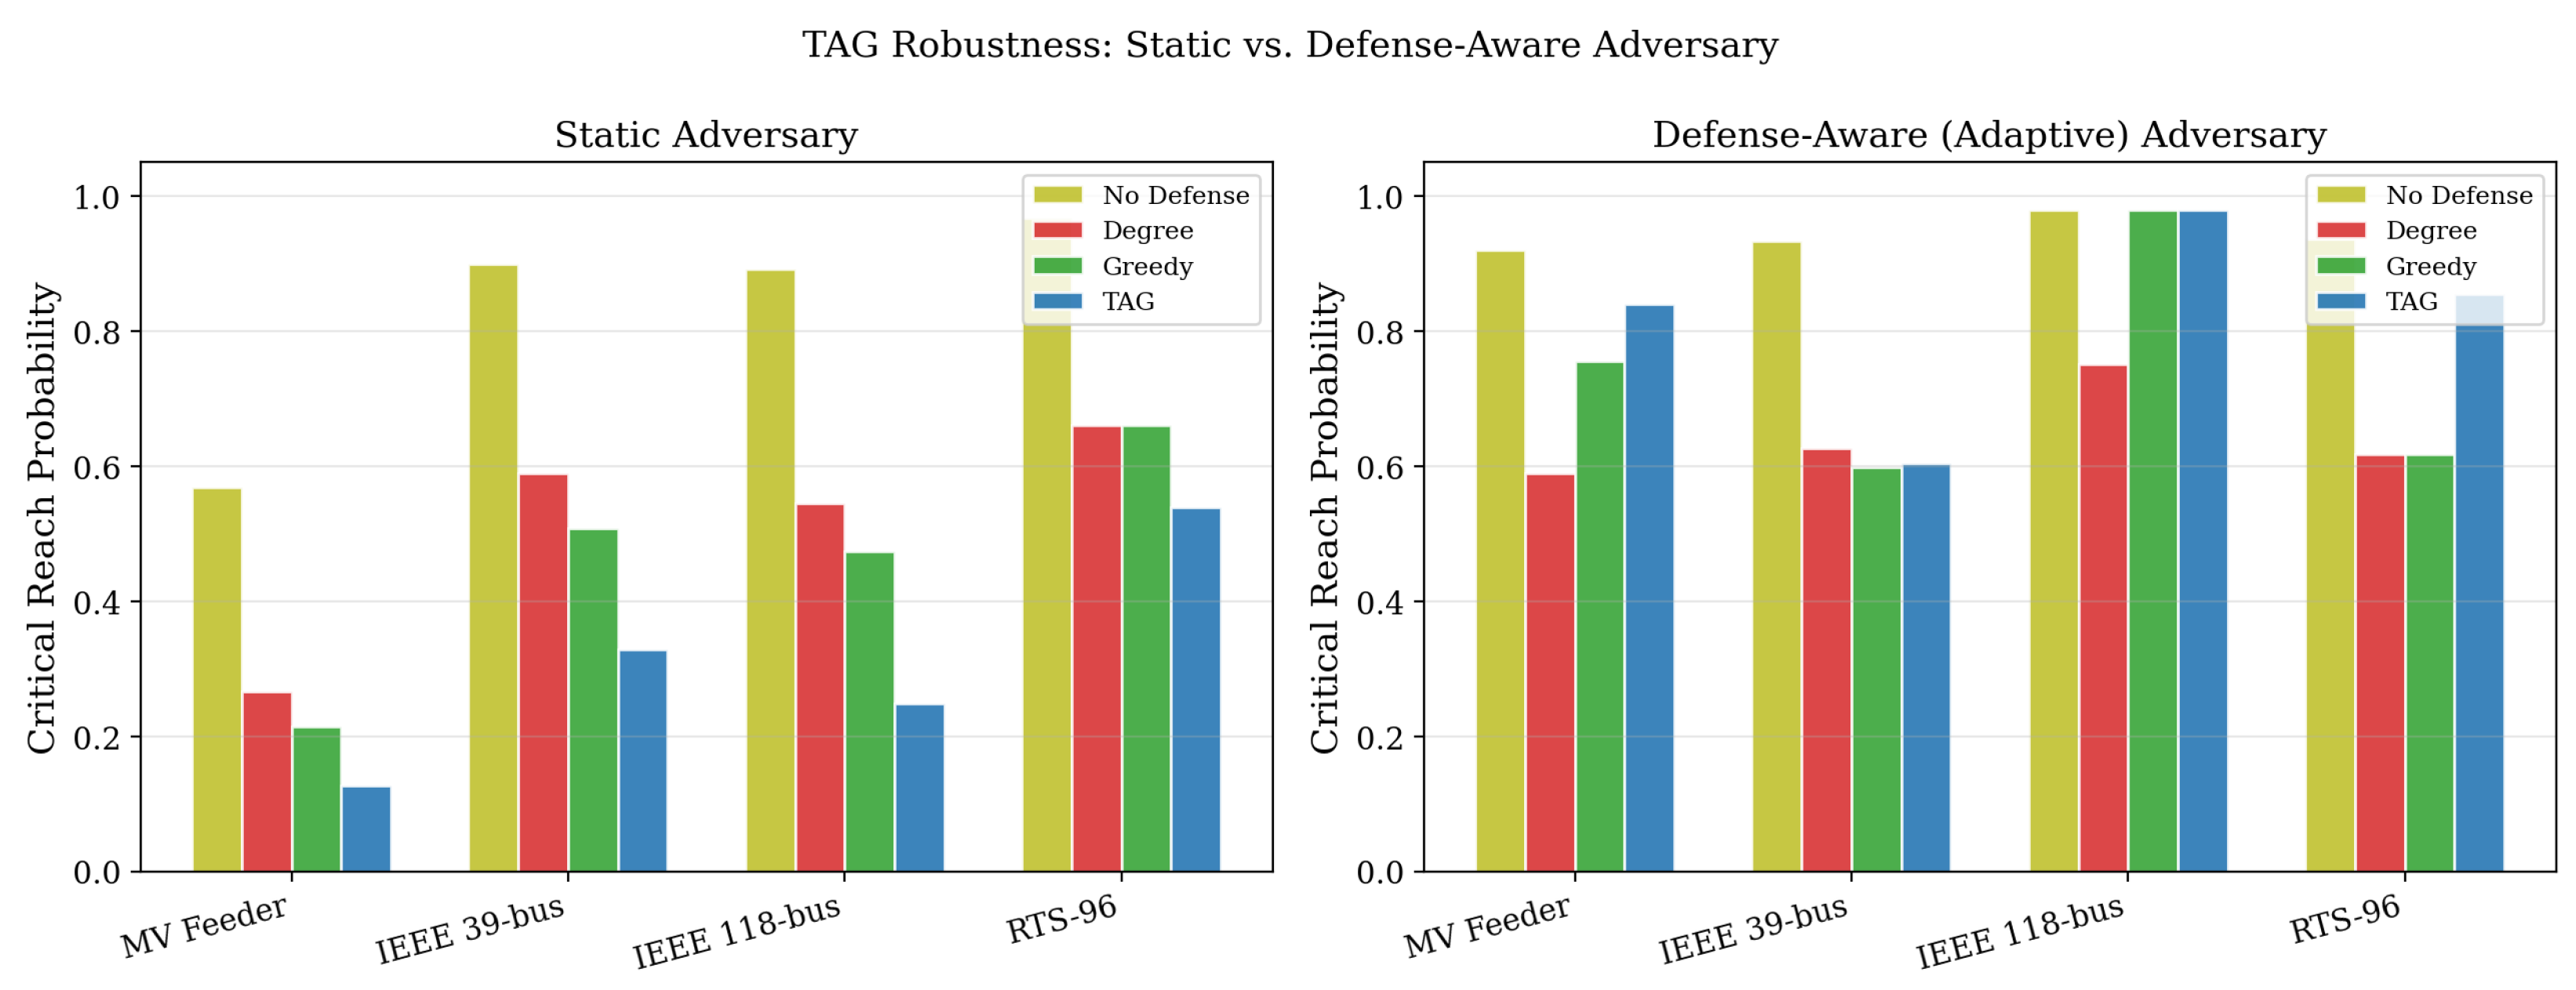
Table 8 and Figure 11 report static vs. adaptive risk for No Defense, Degree, Greedy, and TAG across all four networks. The results reveal a nuanced picture. Under the adaptive adversary, risk increases substantially for all strategies; on the highly-meshed IEEE 118-bus network, all strategies converge to , revealing that defenses cannot prevent a worst-case adversary in dense transmission topologies.
Table 8.
Static vs. reachability-based adaptive adversary final risk at .
Figure 11.
Static vs. defense-aware (adaptive) adversary risk comparison. (Left) static adversary (fixed source set used during planning). (Right) reachability-based adaptive adversary selects the non-defended buses closest (minimum hop distance) to any critical bus after observing D.
Under the reachability-based adaptive adversary, risk increases substantially compared to the static adversary on MV Feeder and the two transmission networks (IEEE 39, IEEE 118). On the IEEE 118-bus network, all methods—including No Defense, Greedy, and TAG—converge to , indicating that with defenses in a highly-meshed 118-bus network, no placement strategy can prevent an adversary from selecting sources directly adjacent to critical hubs. On MV Feeder, TAG’s adaptive risk () exceeds Greedy’s (, marked †), a reversal of the static ranking. On IEEE 39-bus, TAG () and Greedy () are approximately tied. On RTS-96, Greedy and Degree achieve lower adaptive risk () than TAG (, marked †), though all remain below No Defense (). Notably, on RTS-96 the adaptive adversary achieves lower risk than the static adversary for No Defense and Degree/Greedy, suggesting that the specific static sources (random seed 42) are actually more dangerous than the proximity-based selection on this particular topology.
These results reveal an important limitation: TAG’s topology-aware placement, while highly effective against a static or random adversary, does not consistently dominate under worst-case reachability-based adversary selection. In highly connected networks, critical hubs have numerous non-defended neighbors exploitable by a knowledgeable adversary at budget . For scenarios where the adversary source set is unpredictable (the typical operational assumption), the static adversary results (Section 6.3) remain the primary measure of TAG’s effectiveness; the adaptive adversary analysis here quantifies the remaining adversarial gap under full network visibility.
Table 8 summarizes the adaptive vs. static risk change per strategy. The adaptive adversary selects the non-defended buses closest (minimum hop distance) to any critical bus. Bold values indicate the lowest risk per network and mode; a ‘†’ marks cells where the adaptive adversary reverses the static ranking.
6.6.4. Source-Selection Sensitivity
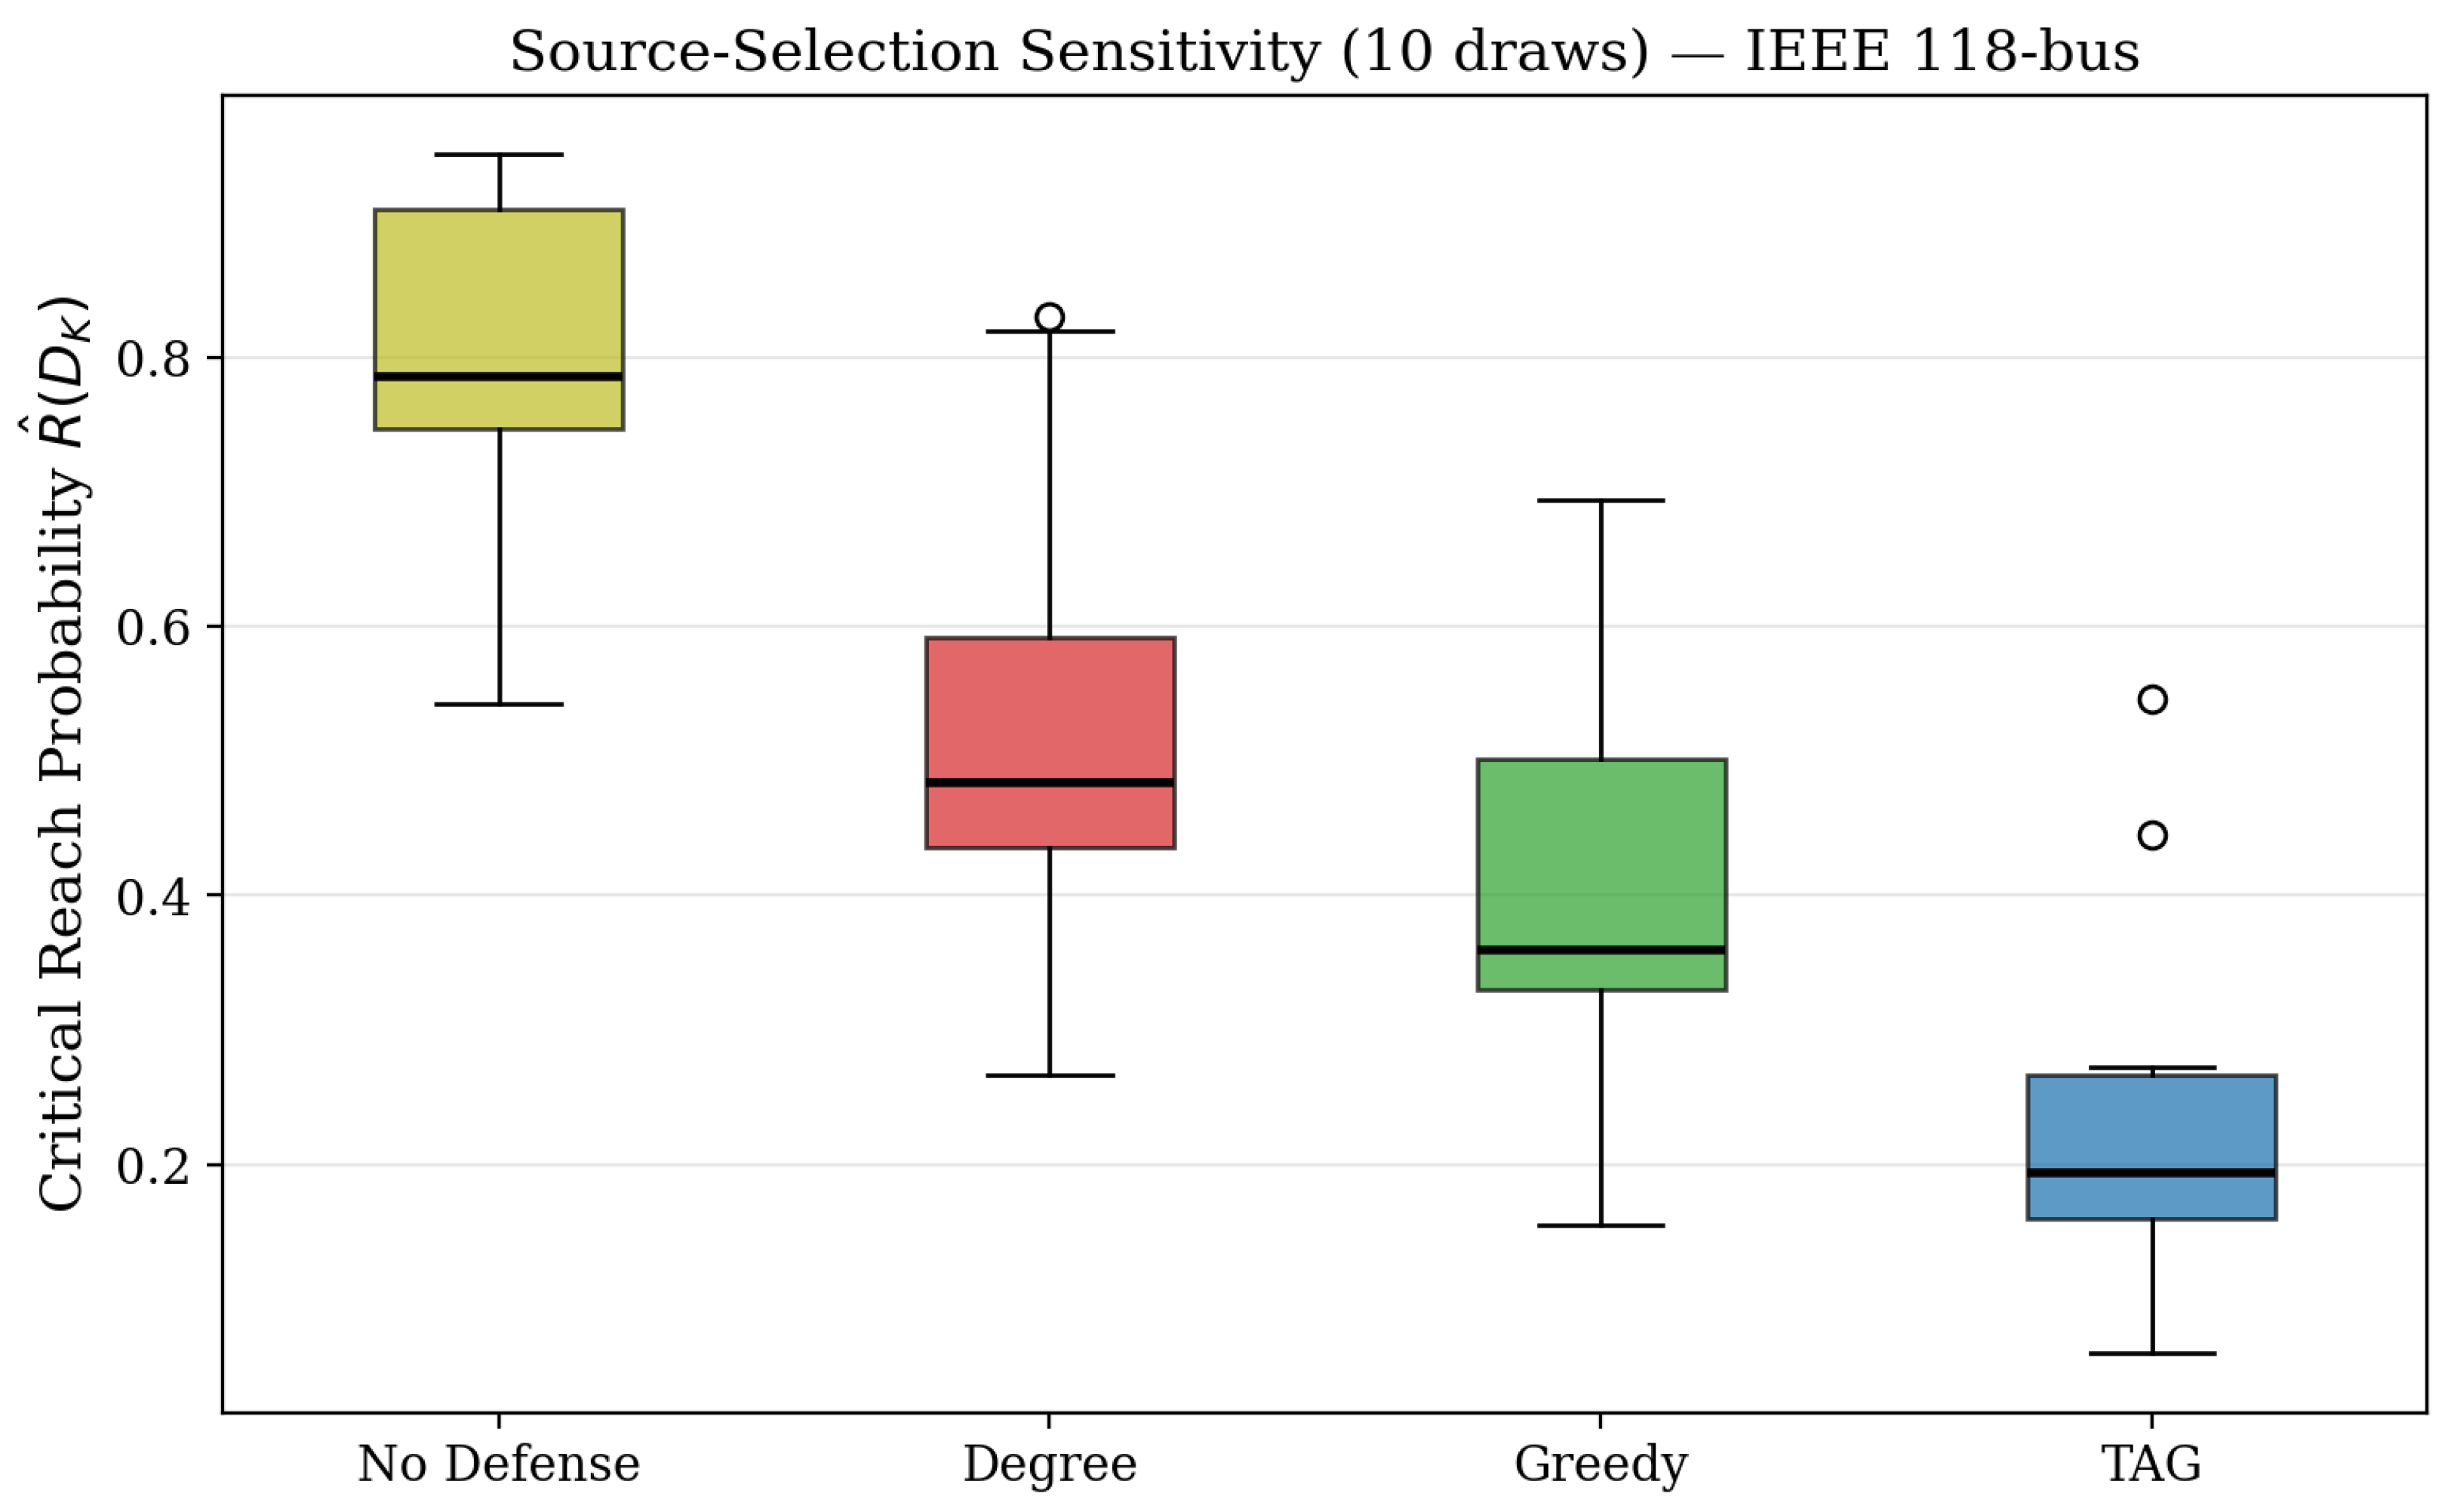
The main experiments use a fixed set of three randomly selected non-critical sources with seed 42. To assess whether method rankings depend on this particular source draw, we repeat the full evaluation 10 times with independent source sets (seed , ) on the IEEE 118-bus network. In each draw, all methods are evaluated on the identical source set, ensuring a fair matched comparison.
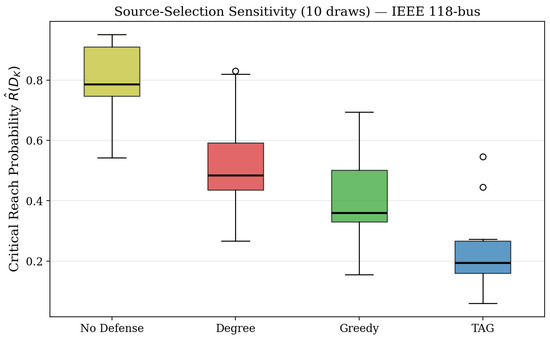
Figure 12 shows the resulting box plots of final risk at . Regarding the figure, TAG achieves the lowest risk in all 10 draws (range: 0.060–0.546); its IQR does not overlap with Greedy’s IQR , confirming that the ranking is robust to source selection despite high per-draw variability. Table 9 reports the mean, standard deviation, and CI across draws. TAG achieves the lowest risk in all 10 draws (minimum 0.060, maximum 0.546), and its IQR does not overlap with Greedy’s IQR , confirming that the ranking is source-set robust. The high coefficient of variation (SD/mean for TAG, for Greedy) reflects the difficulty of different source configurations: some source sets are topologically far from critical buses (easily defended, e.g., TAG achieves 0.060 on draw 7), while others are adjacent to critical buses (hard to defend, e.g., TAG achieves 0.546 on draw 8). Across all 10 draws, TAG’s advantage over Greedy is preserved despite this variability.
Figure 12.
Source-selection sensitivity: box plots of final risk at from 10 independent source-set draws on IEEE 118-bus. Boxes indicate the interquartile range, horizontal lines indicate medians, whiskers indicate non-outlier ranges, and open circles indicate outlier values beyond the whiskers.
Table 9.
Source-selection sensitivity: mean ± SD and 95% CI across 10 independent source-set draws (IEEE 118-bus, ).
6.7. Monte Carlo Convergence Study
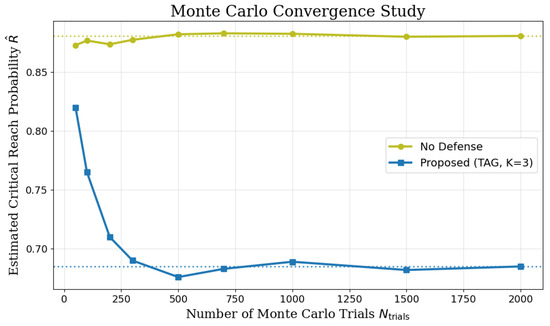
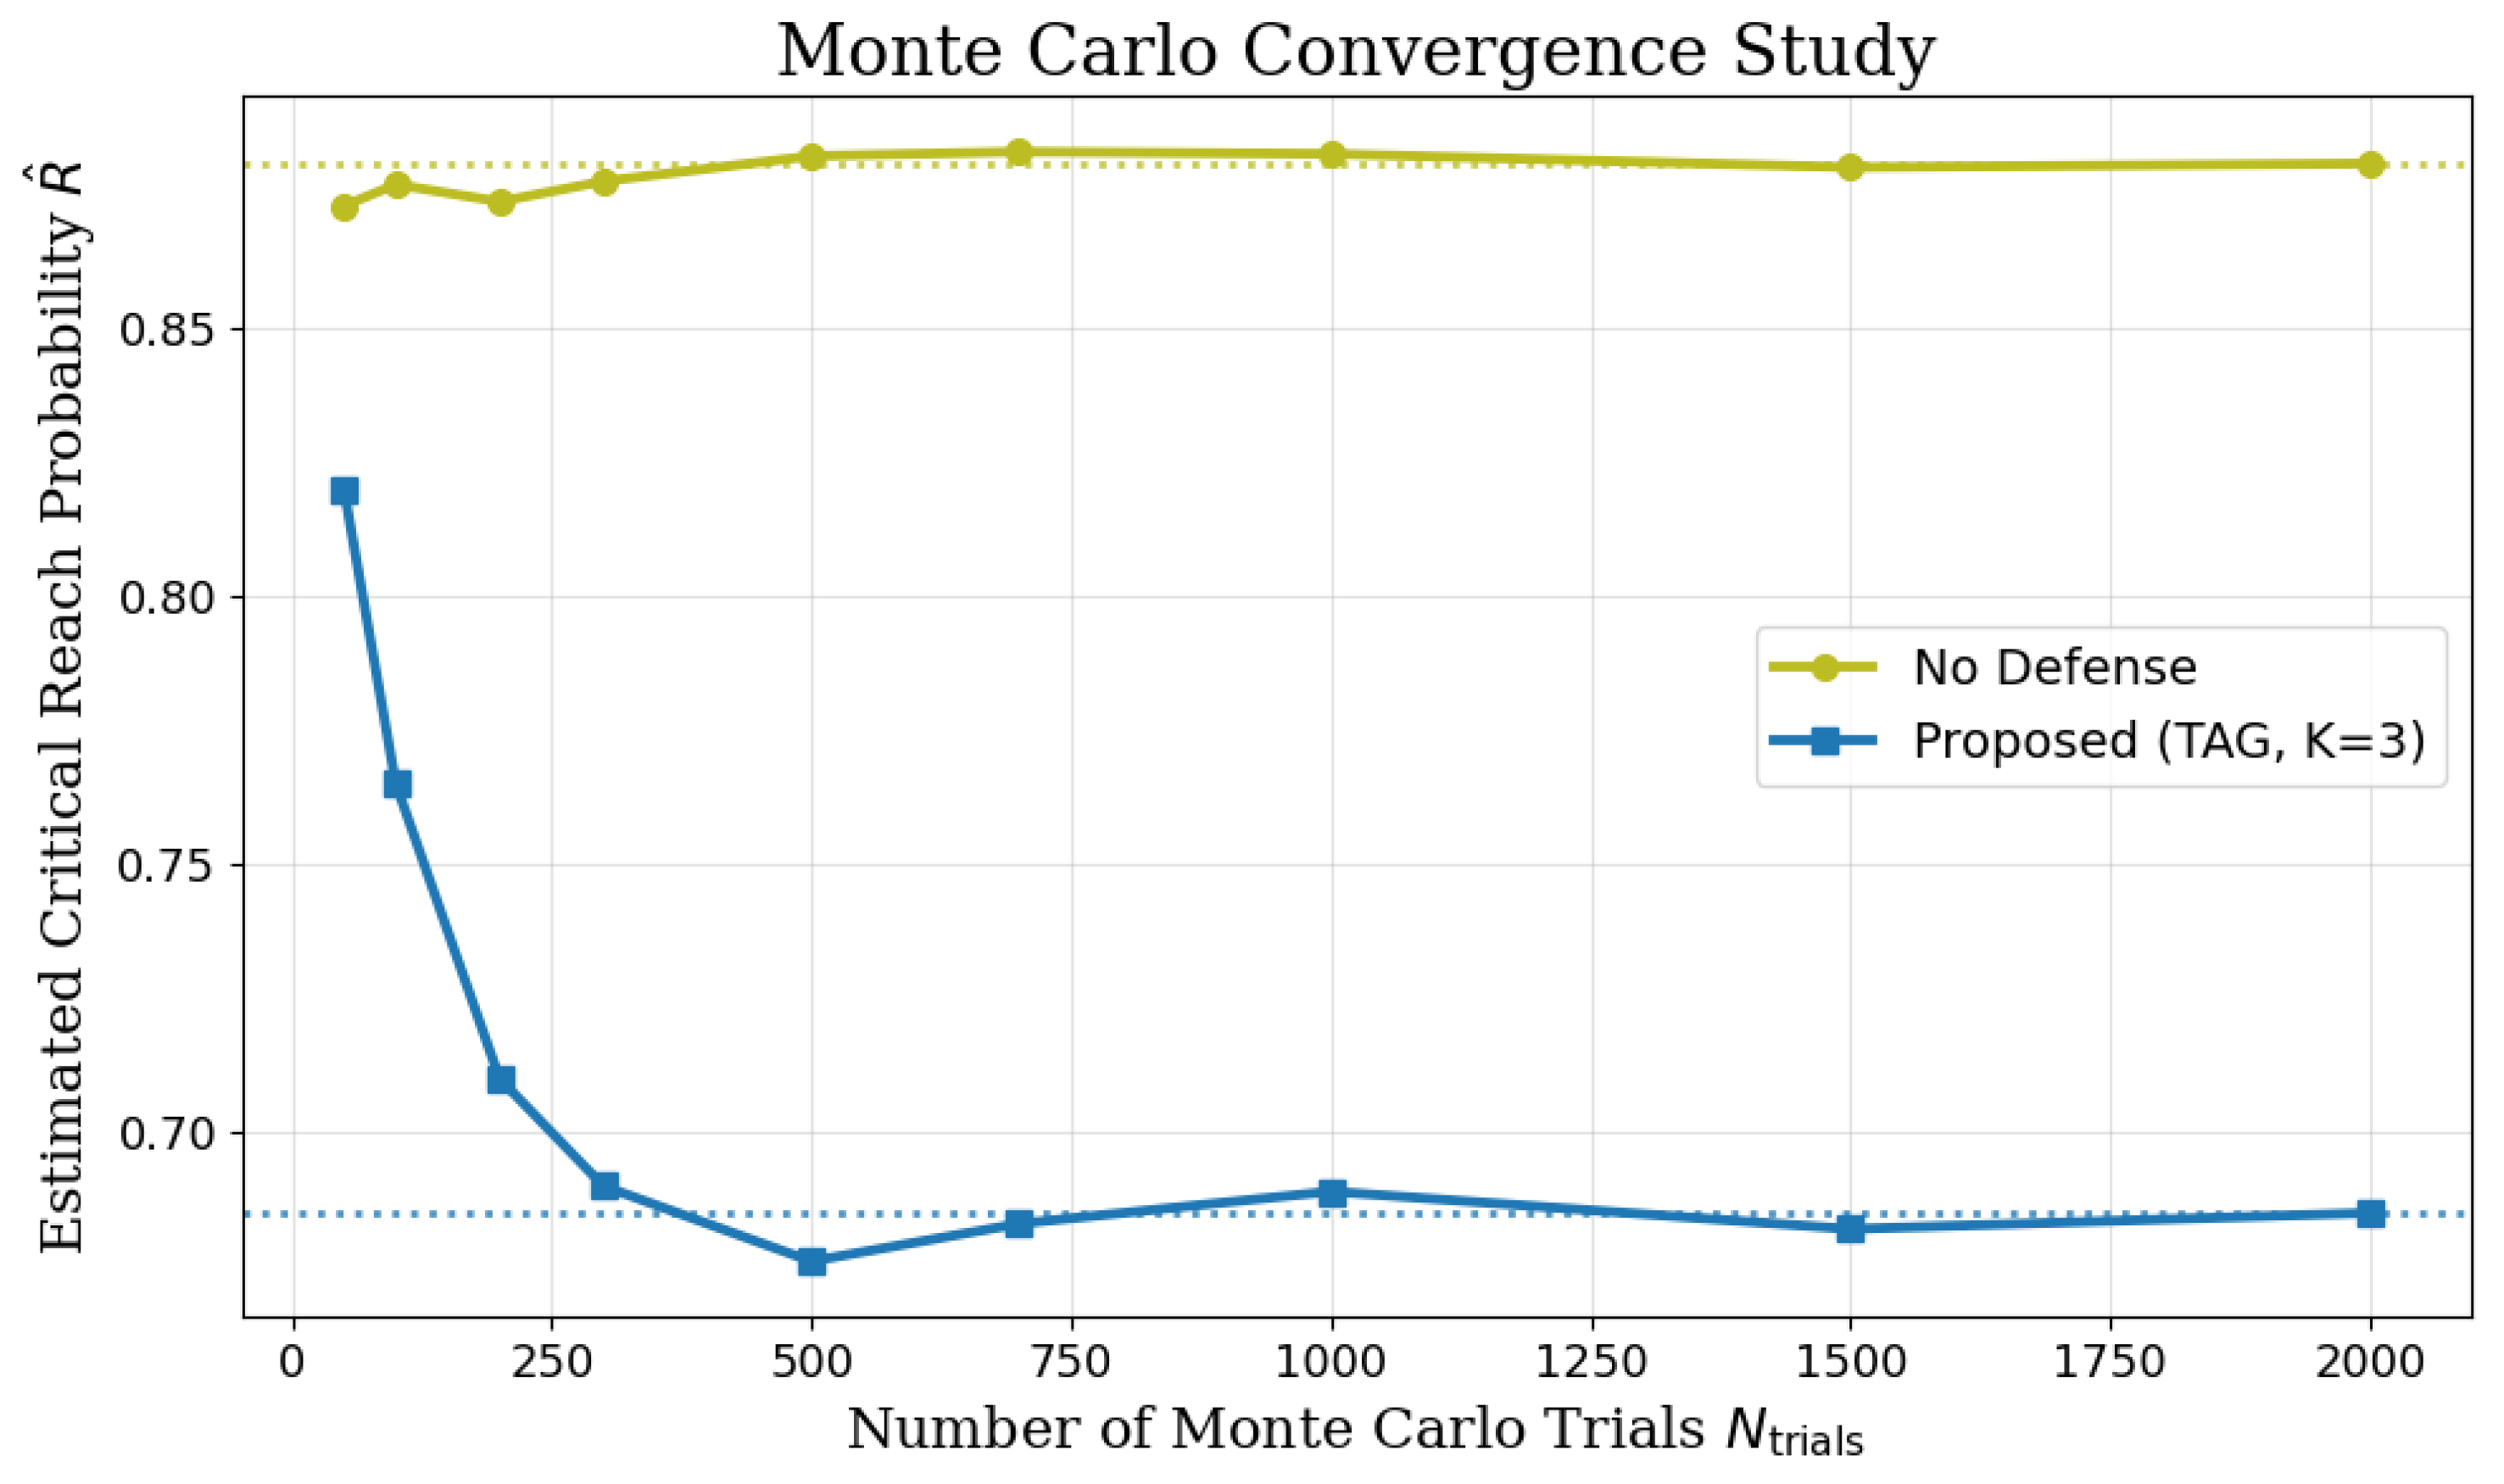
The estimated risk is plotted in Figure 13 as a function of from 50 to 2000. Both curves converge rapidly, stabilizing within of their asymptotic values by . The choice of provides a safety margin of approximately beyond the observed convergence threshold, ensuring that reported risk differences larger than 0.01 between methods reflect genuine performance gaps rather than Monte Carlo estimation noise.
Figure 13.
Monte Carlo convergence: estimated risk vs. number of trials for No Defense and TAG () on IEEE 118-bus. Estimates stabilize by , validating our choice of .
6.8. Scalability
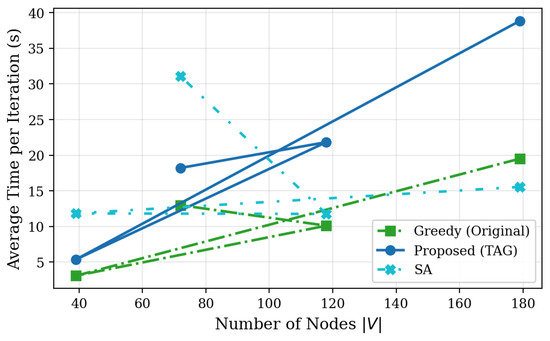
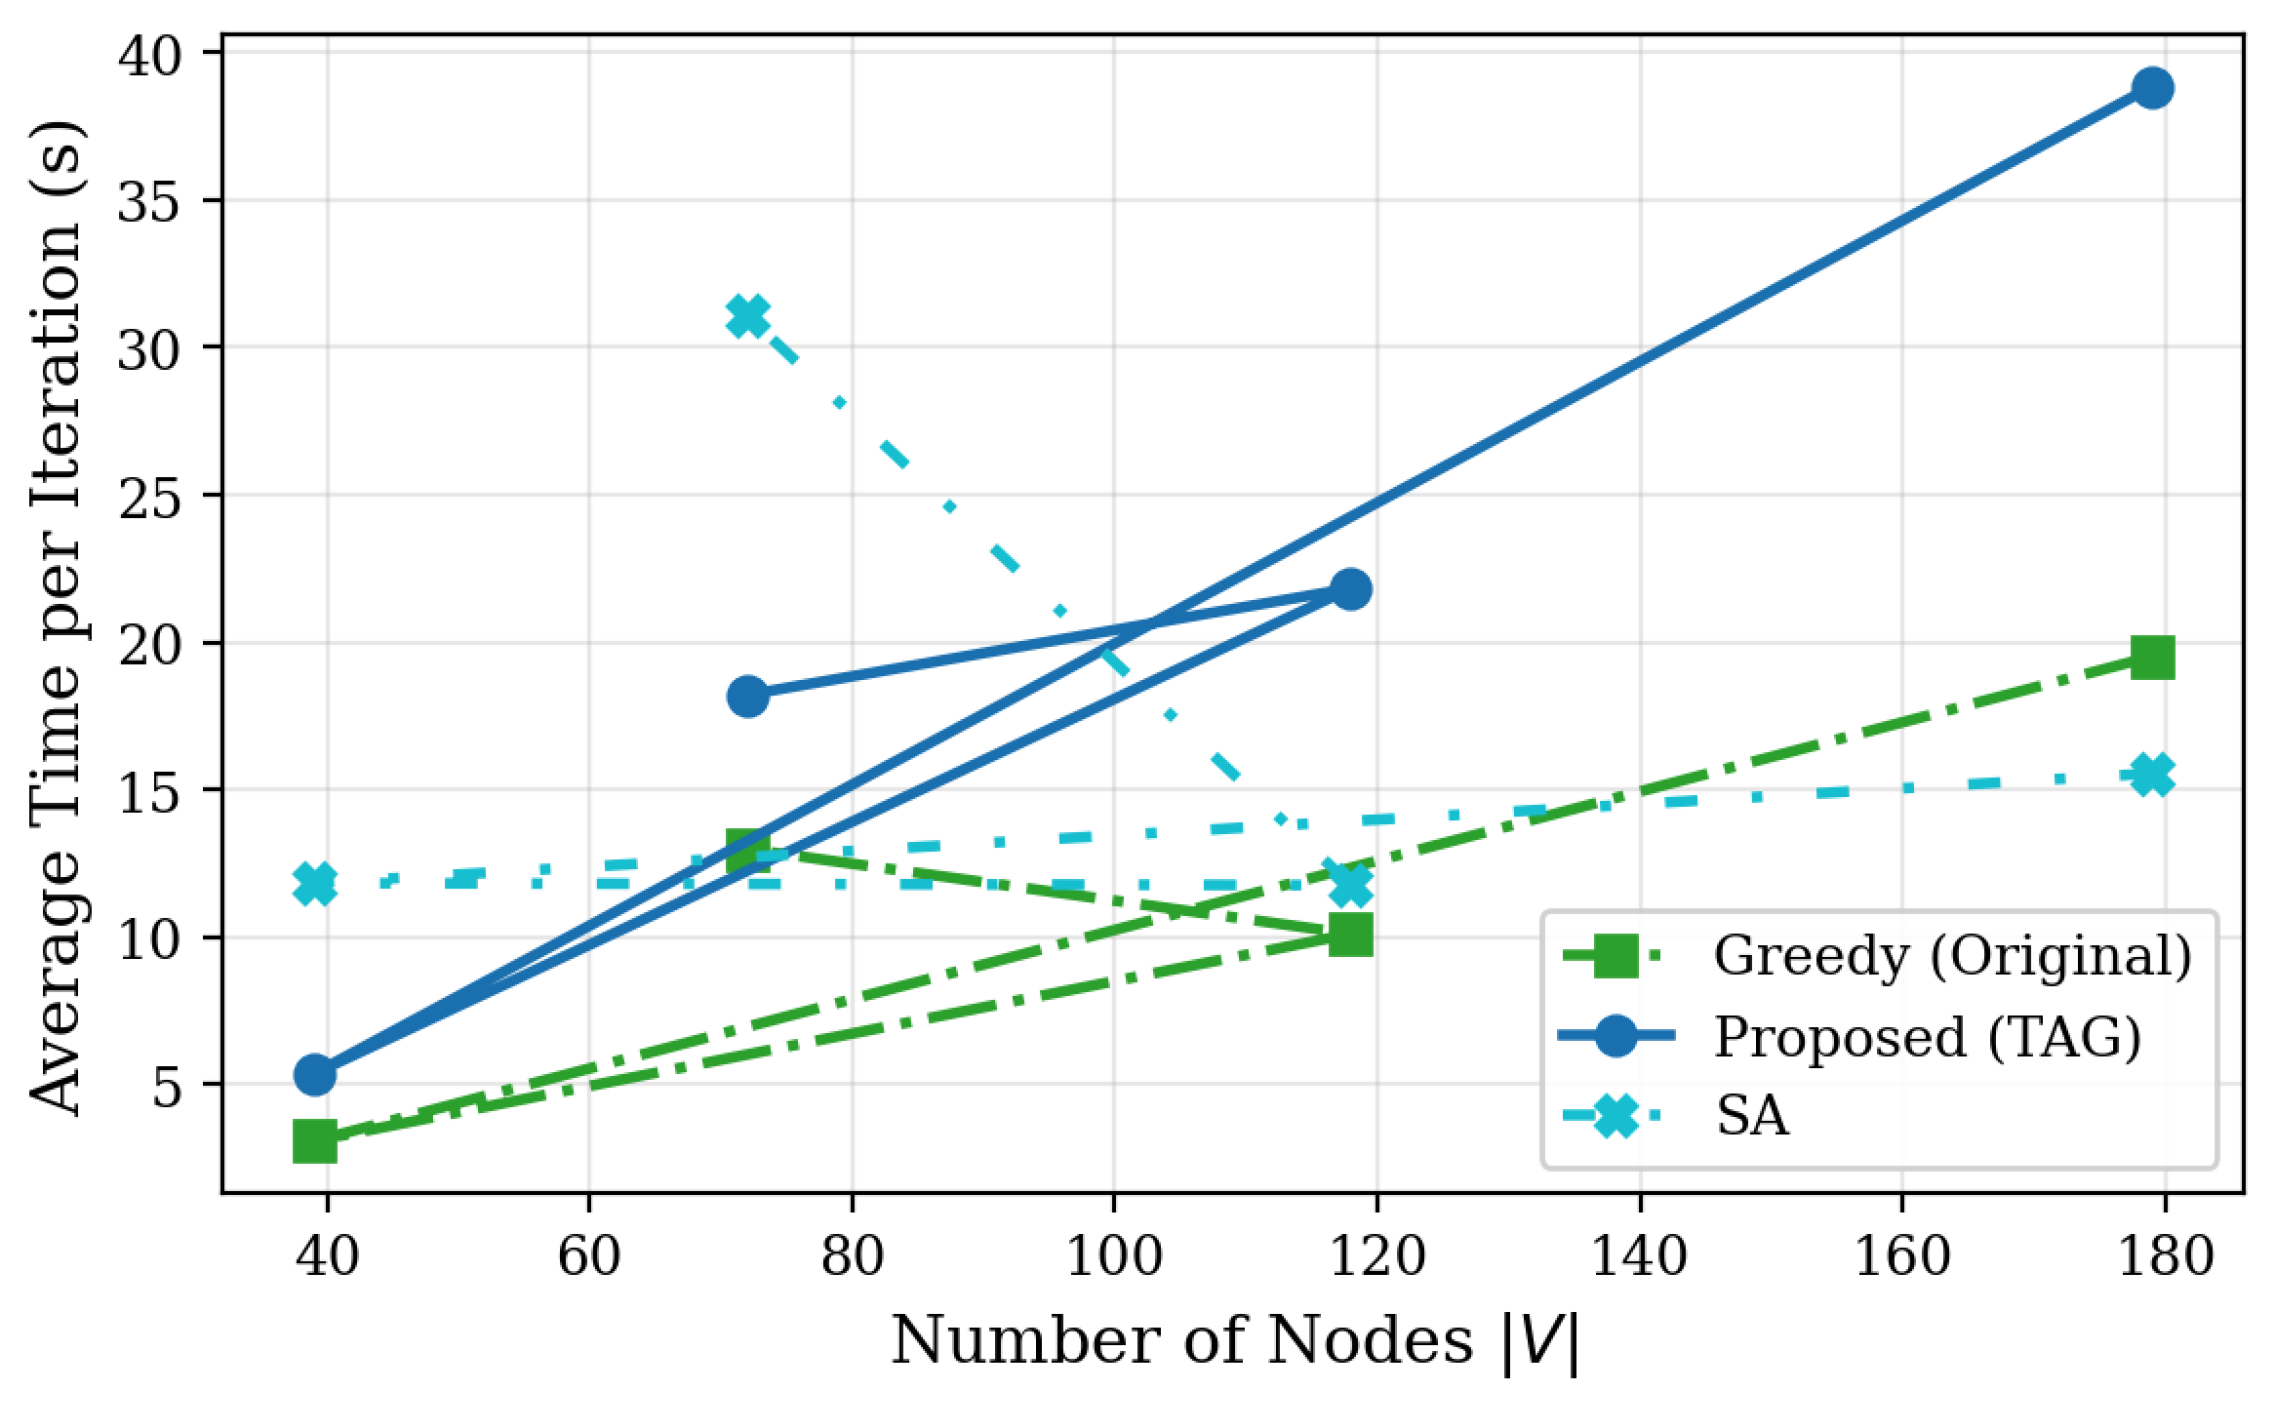
Average time per greedy iteration is reported in Table 10 and Figure 14. TAG incurs – the per-iteration runtime of vanilla greedy, with absolute times ranging from 5.37 s (IEEE 39-bus) to 38.85 s (MV Feeder, 179 buses) per iteration. All computation times correspond to offline planning scenarios: TAG is not intended for real-time deployment but for periodic security planning cycles, in which computation budgets of minutes to hours are operationally acceptable.
Table 10.
Scalability: average time per Greedy iteration (s).
Figure 14.
Computation time vs. network size.
6.9. Cyber-Physical Impact-Weighted Risk Analysis
Table 11 reports the cyber-physical impact-weighted risk alongside the cyber-only risk for No Defense, Greedy, and TAG across all four networks. Impact scores are derived from DC power-flow contingency analysis.
Table 11.
Cyber-only vs. cyber-physical impact-weighted at .
The relationship between and R varies by network and strategy. For the MV Feeder under no defense, , indicating that in the undefended case the high-impact buses are disproportionately reachable (the adversary naturally reaches high-consequence nodes first along short paths). IEEE 118-bus shows the opposite pattern: across all strategies (e.g., No Defense: vs. ), because the IEEE 118 critical buses are high-degree hubs with many load connections but are topologically more distant from typical source nodes. The relative ranking of strategies is preserved under both metrics: TAG achieves the lowest on all four networks. Notably, for the MV Feeder, TAG’s defense specifically counters the structural vulnerability (), confirming that topology-aware placement preferentially protects the highest-impact nodes.
While the primary optimization objective is cyber reachability (which is computable without power-flow models and avoids coupling to solver convergence), the power-flow-informed impact analysis validates that TAG’s defense recommendations are also effective from a physical-consequence perspective. Future work will extend to direct optimization of and AC power-flow-based consequence metrics.
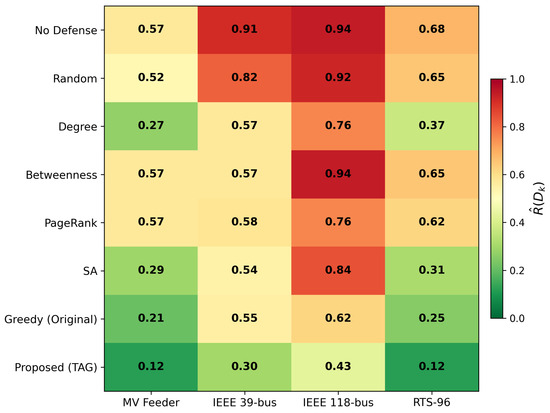
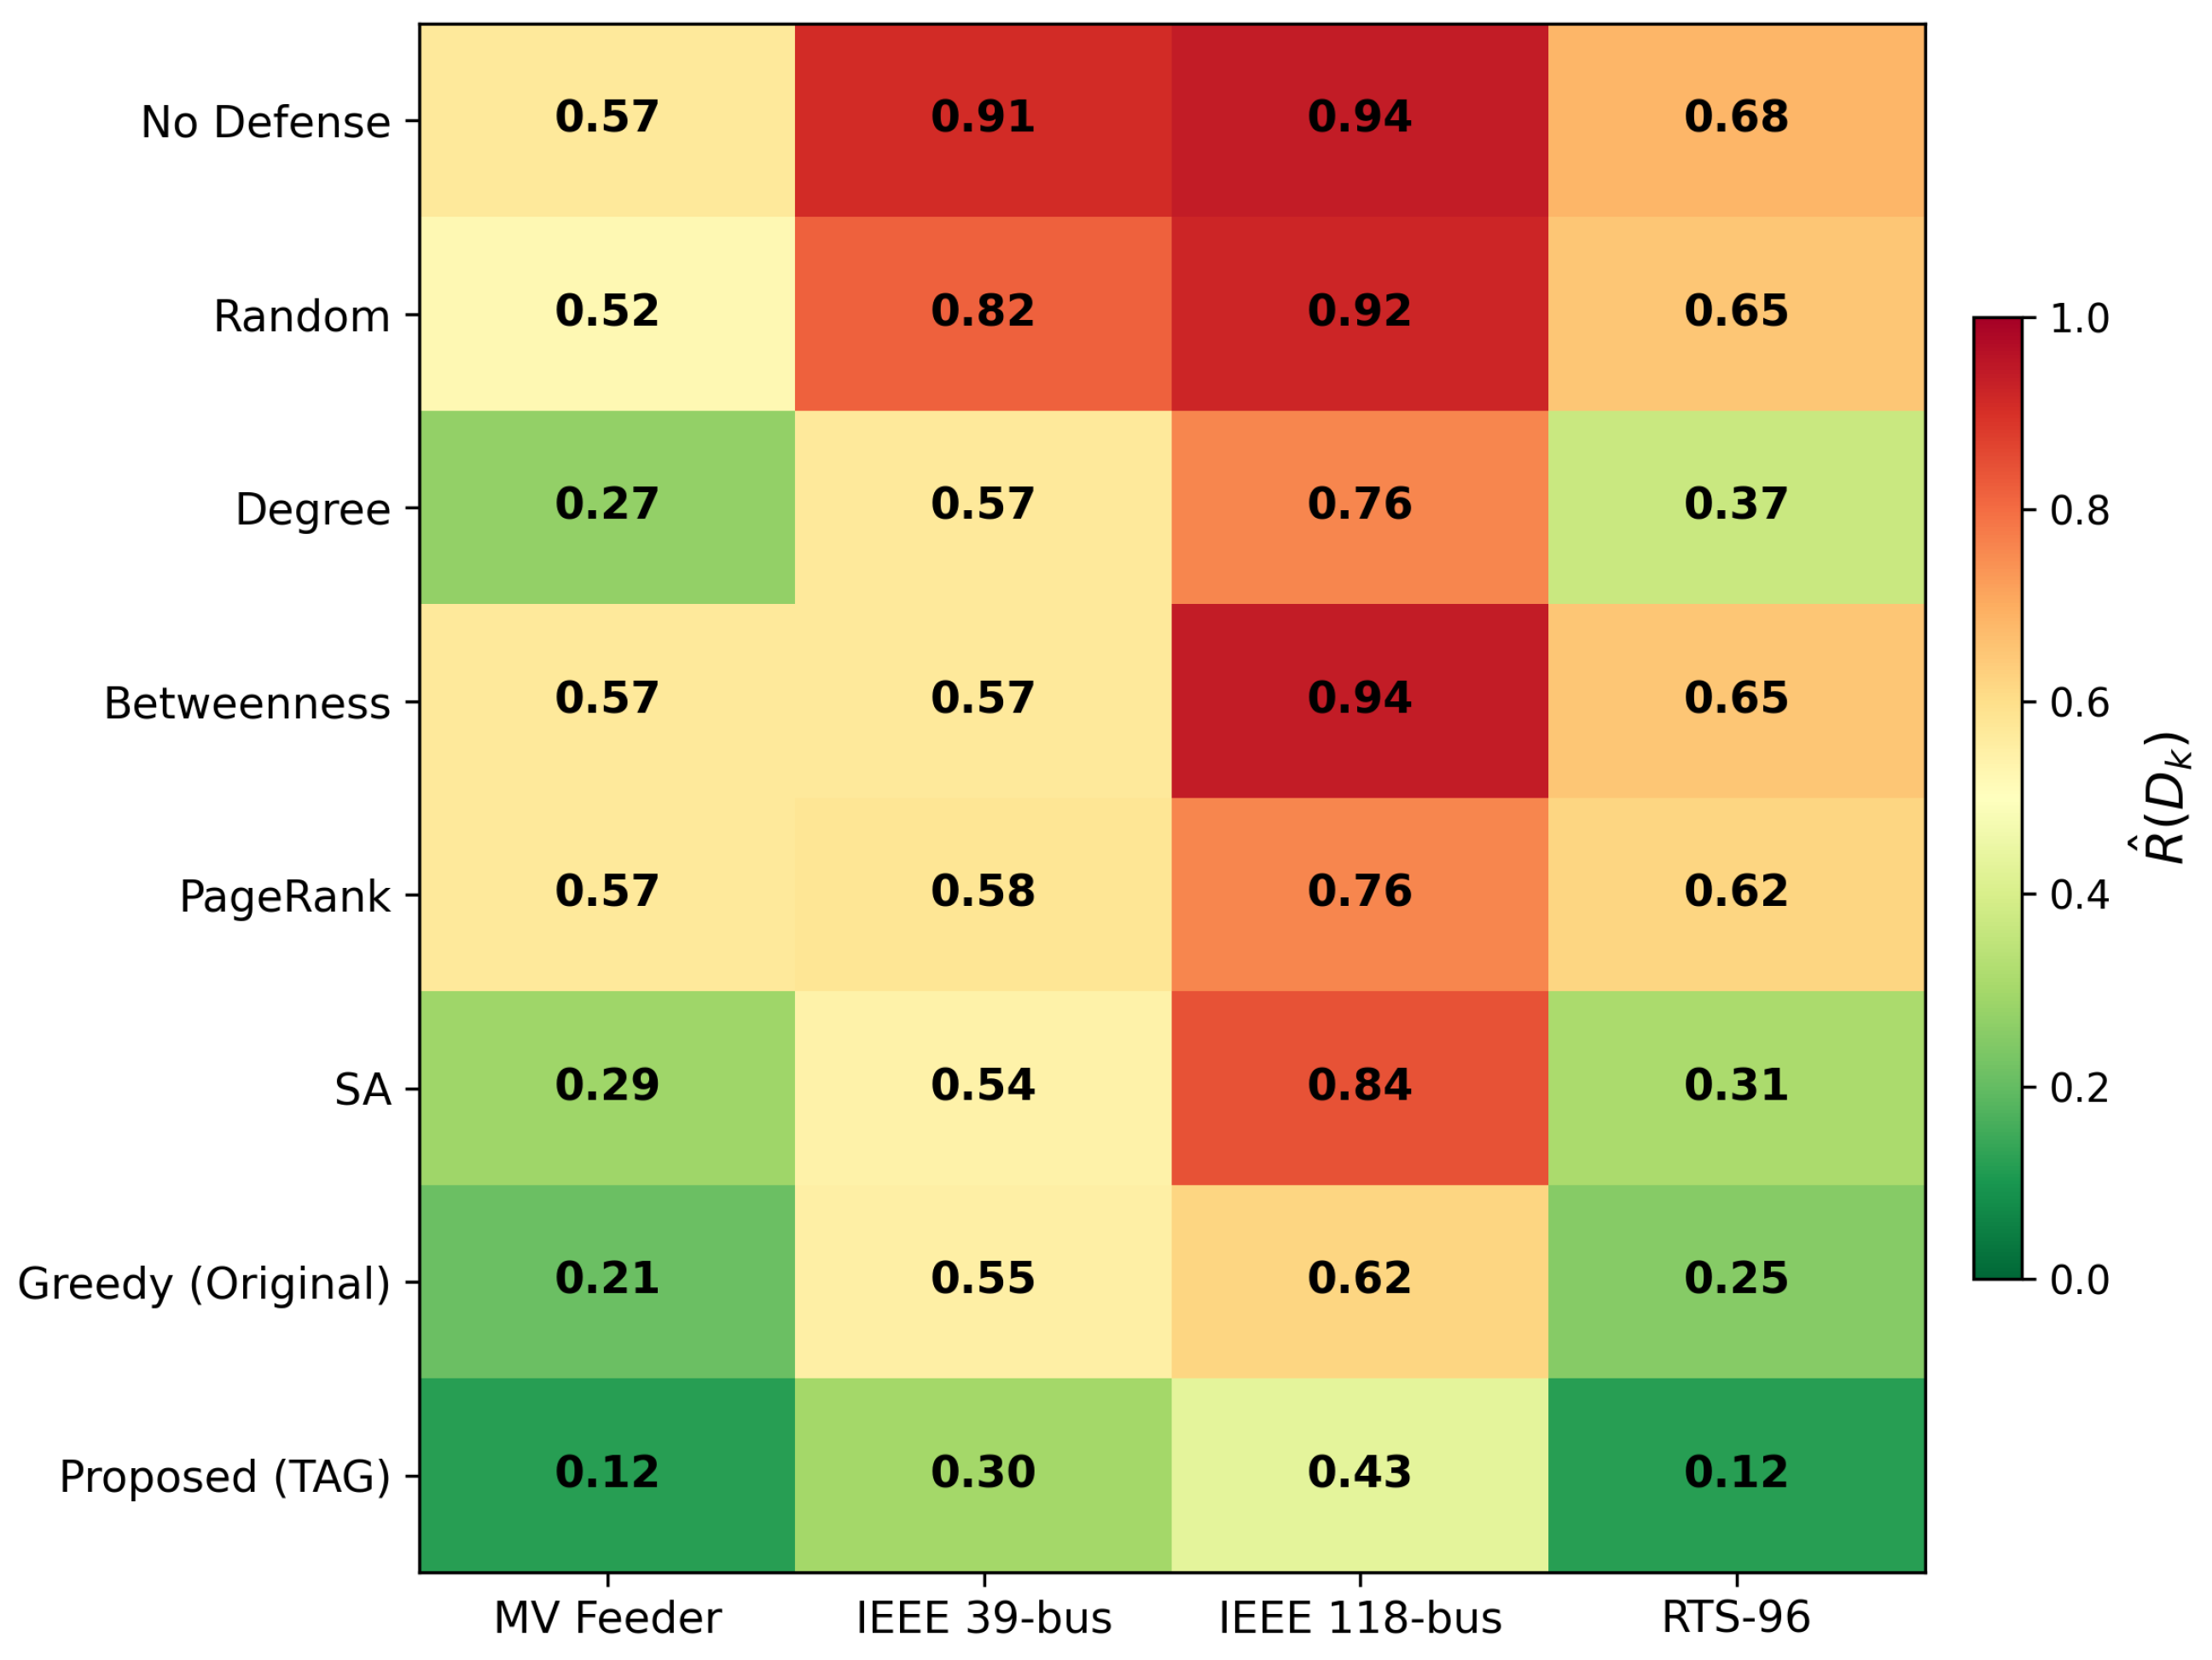
A consolidated visualization of the final risk for all eight strategy–network combinations is provided in Figure 15. Formal k-means clustering of strategy performance profiles (each strategy represented as a point in , one coordinate per network) reveals two primary clusters at (silhouette coefficient ): Cluster A contains the four consistently high-risk strategies (No Defense, Random, Betweenness, PageRank) and Cluster B contains the four effective placement strategies (Degree, SA, Greedy, TAG). At (silhouette ), TAG further separates into its own singleton cluster, confirming its consistent performance advantage over all other strategies across all four networks. This formal data-driven partitioning replaces the subjective qualitative description used in the original manuscript.
Figure 15.
Heatmap of final risk for all strategy–network combinations. Greener cells indicate lower risk. Formal k-means clustering (, silhouette ; , silhouette ) partitions strategies into two primary groups: high-risk (No Defense, Random, Betweenness, PageRank) and effective (Degree, SA, Greedy, TAG). At , TAG forms a singleton cluster confirming its consistently best performance. Colored squares on the right indicate cluster assignment.
7. Discussion
The experimental results collectively support a unified interpretation of TAG’s performance advantage that has three complementary dimensions: topological relevance of candidate selection, the value of portfolio diversity over single-path search, and the operational significance of the dual-mode defense model. Understanding how these three dimensions interact is essential for situating TAG within the broader landscape of cyber-physical security research and for identifying the conditions under which its advantages are most pronounced.
The failure of static centrality heuristics on specific networks, most notably Betweenness and PageRank, achieving risk reduction on the MV Feeder, provides the most operationally important finding. Both metrics identify globally important nodes in terms of all-pairs information flow, but this global importance does not translate to relevance for the specific bounded-horizon, source-specific attack model. The mismatch between global centrality and local attack-path relevance is a general structural phenomenon that will recur in any network where entry points and critical targets are not topologically co-located with globally high-centrality nodes.
Vanilla greedy selection, despite being a much stronger baseline than static centrality, still systematically underperforms TAG on all four networks. The mechanism for this underperformance is the myopic per-step evaluation: greedy commits to each defense node based on its marginal risk reduction given the current defended set, without considering synergistic interactions among defended nodes. The portfolio search and beam-search extension of TAG are specifically designed to address this myopia.
The dual-mode defense model is a conceptually significant departure from the incoming-hardening-only model used by all placement-only baselines. By modeling outgoing containment through the segmentation factor and monitored-neighbor shielding through , TAG captures an operationally realistic consequence of substation hardening that is absent from prior formulations.
Operational Standards Context
TAG is positioned as a security planning tool that is compatible with and can support major operational standards governing power system cybersecurity. Under the NIST cybersecurity framework (CSF) [31], TAG addresses the Identify function (asset criticality assessment via power-flow-weighted impact scores), the Protect function (defense placement recommendations), and the Detect function (prioritizing monitored-neighbor shielding for early detection of lateral movement). Under IEC 62443 [32] (Industrial Automation and Control Systems Security), TAG’s dual-mode defense—hardening plus micro-segmentation—aligns with Zone and Conduit concepts at the substation level: the defended substations correspond to security zones with restricted conduit access, and the factor models residual inter-zone propagation rates. Under NERC CIP standards [33], TAG’s identification of critical buses through power-flow impact analysis provides a quantitative foundation for NERC CIP-002 (BES Cyber System categorization) and CIP-005 (Electronic Security Perimeters). The micro-segmentation and monitored-neighbor shielding actions directly correspond to NERC CIP-007 (Systems Security Management) and CIP-010 (Configuration Change Management and Vulnerability Management) controls. We do not claim that TAG automates NERC CIP compliance or replaces the regulatory process; rather, TAG provides a prioritized risk-based ranking of which substations warrant the highest-priority hardening and segmentation investment, supporting the asset owner’s own compliance analysis.
Several limitations of the present study warrant explicit acknowledgment. First, the defense model assumes fixed parameters and ; the calibration study shows results are robust across a wide range, but empirical deployment data on actual residual propagation rates after substation micro-segmentation is not publicly available at the required granularity. Second, the current framework’s primary optimization objective is cyber reachability risk; power-flow-based operational impact is validated post hoc but not directly optimized. Third, the adversary model assumes stationary edge probabilities; the adaptive adversary analysis shows that a reachability-based adversary can reverse TAG’s ranking advantage on some networks (MV Feeder, IEEE 39, RTS-96) and eliminate advantage on others (IEEE 118-bus), revealing that defenses are insufficient to create a robust perimeter against a worst-case adversary with full network visibility. Game-theoretic formulations that directly account for adversary source selection remain a key future research direction.
8. Conclusions
This paper presents TAG, an enhanced topology-aware hierarchical attack graph framework for the security of cyber-physical power systems. TAG combines attack-graph risk evaluation, topology-aware candidate screening, deterministic propagation approximation, beam-search portfolio optimization, one-swap local refinement, and dual-mode substation defense. An explicit cyber-physical interdependency model introduces a power-flow-aware impact score that validates TAG’s defense placement from a physical-consequence perspective. Statistical validation via 10-batch repeated MC evaluation and paired Wilcoxon tests confirms that all reported performance differences are significant () across all four benchmark networks. Monte Carlo experiments under fixed settings (, , ) show that TAG reduces critical-reach probability by – relative to no defense and by – relative to vanilla greedy. Parameter sensitivity analysis over and confirms that TAG achieves 68– risk reduction across the full parameter range, confirming robust superiority over baselines. Source-selection sensitivity with 10 independent draws confirms that static adversary rankings are stable across source sets (TAG maintains the lowest risk in all 10 draws). The adaptive adversary analysis reveals an important limitation: a worst-case reachability-based adversary with full network visibility can reverse TAG’s advantage in meshed transmission networks, motivating game-theoretic extensions. The results strengthen the empirical case for topology-aware, dynamics-informed defense planning for static adversary scenarios. Future work will extend the framework to multi-layer cyber-physical graphs, game-theoretic defense formulations that explicitly model worst-case adversary response, and direct optimization of power-flow-based impact metrics.
Author Contributions
Conceptualization, M.M. and M.E.E.; methodology, M.M.; software, M.M.; validation, M.M., T.G.S. and M.E.E.; formal analysis, M.M.; investigation, M.M.; writing—original draft preparation, M.M. and M.E.E.; writing—review and editing, T.G.S., K.R.D. and M.E.E.; visualization, M.M.; supervision, T.G.S. and K.R.D.; project administration, K.R.D.; funding acquisition, K.R.D. All authors have read and agreed to the published version of the manuscript.
Funding
This work is supported by the U.S. Department of Energy under award DE-CR0000018.
Institutional Review Board Statement
Not applicable.
Informed Consent Statement
Not applicable.
Data Availability Statement
All related codes are openly available at https://github.com/Mmassaoudi-cell/TAG, accessed on 28 June 2026. The repository includes the full implementation of the TAG framework, all baseline strategies, and the experiment runner that reproduces every result reported in this paper. The MV Feeder, IEEE 39-bus, IEEE 118-bus, and RTS-24 base system used to assemble RTS-96 are available through the pandapower network library. All experiments are reproducible from the provided seed (SEED = 42).
Conflicts of Interest
The authors declare no conflicts of interest.
References
- Haque, K.A.; Massaoudi, M.; Al Homoud, L.; Davis, K.R.; Kabalan, M.; Salamy, H. Cyber-physical emulation and threat scenario simulation for enhanced microgrid resilience. IEEE Access 2025, 13, 101455–101471. [Google Scholar] [CrossRef] [Scilit]
- Yu, Z.; Gao, H.; Cong, X.; Wu, N.; Song, H. A Survey on Cyber-Physical Systems Security. IEEE Internet Things J. 2023, 10, 18670–18692. [Google Scholar] [CrossRef] [Scilit]
- Kim, S.; Park, K.J.; Lu, C. A Survey on Network Security for Cyber-Physical Systems: From Threats to Resilient Design. IEEE Commun. Surv. Tutor. 2022, 24, 1534–1573. [Google Scholar] [CrossRef] [Scilit]
- Wang, X.; Li, Z.; He, Y.; Li, F. Coordinated Cyber-Physical Attack on Power Grids Based on Malicious Power Dispatch. Int. J. Electr. Power Energy Syst. 2024, 155, 109678. [Google Scholar] [CrossRef] [Scilit]
- Zografopoulos, I.; Ospina, J.; Liu, X.; Konstantinou, C. Cyber-Physical Energy Systems Security: Threat Modeling, Risk Assessment, Resources, Metrics, and Case Studies. IEEE Access 2021, 9, 29775–29818. [Google Scholar] [CrossRef] [Scilit]
- Hallaji, E.; Razavi-Far, R.; Wang, M.; Saif, M.; Fardanesh, B. A stream learning approach for real-time identification of false data injection attacks in cyber-physical power systems. IEEE Trans. Inf. Forensics Secur. 2022, 17, 3934–3945. [Google Scholar] [CrossRef] [Scilit]
- Umer, M.A.; Mathur, N.K.; Junejo, A.K.; Mathur, A. Machine Learning for Intrusion Detection in Industrial Control Systems: Applications, Challenges, and Recommendations. Int. J. Crit. Infrastruct. Prot. 2022, 38, 100516. [Google Scholar] [CrossRef] [Scilit]
- Vincent, E.; Korki, M.; Seyedmahmoudian, M.; Stojcevski, A.; Mekhilef, S. Detection of False Data Injection Attacks in Cyber–Physical Systems Using Graph Convolutional Network. Electr. Power Syst. Res. 2023, 217, 109118. [Google Scholar] [CrossRef] [Scilit]
- Amani, A.M.; Jalili, M. Power grids as complex networks: Resilience and reliability analysis. IEEE Access 2021, 9, 119010–119031. [Google Scholar] [CrossRef] [Scilit]
- Zhang, Z.; Huang, R.; Zhao, J.; Lam, A.Y.S.; Hill, D.J. Cyber-Physical Coordinated Risk Mitigation in Smart Grids Based on Attack-Defense Game. IEEE Trans. Power Syst. 2022, 37, 530–542. [Google Scholar] [CrossRef] [Scilit]
- Nassar, A.; Morsi, W.G. Detection of Cyber-Attacks and Power Disturbances in Smart Digital Substations Using Continuous Wavelet Transform and Convolutional Neural Networks. Electr. Power Syst. Res. 2024, 229, 110157. [Google Scholar] [CrossRef] [Scilit]
- Khanna, K.; Govindarasu, M. Resiliency-Driven Cyber–Physical Risk Assessment and Investment Planning for Power Substations. IEEE Trans. Control Syst. Technol. 2024, 32, 1743–1754. [Google Scholar] [CrossRef] [Scilit]
- Chen, P.; Liu, S. Multi-Agent Reinforcement Learning for Decentralized Resilient Secondary Control of Energy Storage Systems Against DoS Attacks. IEEE Trans. Smart Grid 2022, 13, 1739–1750. [Google Scholar] [CrossRef] [Scilit]
- Al-Eiadeh, M.R.; Abdallah, M. GeniGraph: A Genetic-Based Novel Security Defense Resource Allocation Method for Interdependent Systems Modeled by Attack Graphs. Comput. Secur. 2024, 144, 103927. [Google Scholar] [CrossRef] [Scilit]
- Yan, B.; Xu, Y.; Sun, M.; Dong, Z.Y. Game-Theoretical Model for Dynamic Defense Resource Allocation in Cyber-Physical Power Systems Under Distributed Denial of Service Attacks. J. Mod. Power Syst. Clean Energy 2024, 12, 41–51. [Google Scholar] [CrossRef] [Scilit]
- Wei, S.; Ding, T.; Li, F.; Blaabjerg, F. Security Risk Assessment and Risk-Oriented Defense Resource Allocation for Cyber-Physical Distribution Networks Against Coordinated Cyber Attacks. J. Mod. Power Syst. Clean Energy 2024, 13, 312–324. [Google Scholar] [CrossRef] [Scilit]
- Zhu, Q.; Ferdowsi, A.; Saad, W. Learning Games for Defending Advanced Persistent Threats in Cyber Systems. IEEE Trans. Syst. Man Cybern. Syst. 2023, 53, 2410–2422. [Google Scholar] [CrossRef] [Scilit]
- Fragkos, G.; Johnson, J.; Tsiropoulou, E.E. Dynamic Role-Based Access Control Policy for Smart Grid Applications: An Offline Deep Reinforcement Learning Approach. IEEE Trans. Hum.-Mach. Syst. 2022, 52, 761–773. [Google Scholar] [CrossRef] [Scilit]
- Hammar, K.; Stadler, R. Intrusion Prevention Through Optimal Stopping. IEEE Trans. Netw. Serv. Manag. 2022, 19, 2333–2348. [Google Scholar] [CrossRef] [Scilit]
- He, K.; Kim, D.D.; Asghar, M.R. Adversarial Machine Learning for Network Intrusion Detection Systems: A Comprehensive Survey. IEEE Commun. Surv. Tutor. 2023, 25, 538–566. [Google Scholar] [CrossRef] [Scilit]
- Presekal, A.; Stefanov, A.; Rajkumar, V.S.; Palensky, P. Attack Graph Model for Cyber-Physical Power Systems Using Hybrid Deep Learning. IEEE Trans. Smart Grid 2023, 14, 4007–4020. [Google Scholar] [CrossRef] [Scilit]
- Diao, X.; Huang, C.; Sun, B.; Ozay, M. Dynamic Probabilistic Risk Assessment for Electric Grid Cybersecurity. Reliab. Eng. Syst. Saf. 2024, 241, 109699. [Google Scholar] [CrossRef] [Scilit]
- Nguyen, T.T.; Reddi, V.J. Deep Reinforcement Learning for Cyber Security. IEEE Trans. Neural Netw. Learn. Syst. 2023, 34, 3779–3795. [Google Scholar] [CrossRef] [Scilit] [PubMed]
- Cunningham, J.D.; Aved, A.; Ferris, D.; Morrone, P.; Tucker, C.S. A Deep Learning Game Theoretic Model for Defending Against Large Scale Smart Grid Attacks. IEEE Trans. Smart Grid 2023, 14, 1188–1197. [Google Scholar] [CrossRef] [Scilit]
- Legay, A.; Delahaye, B.; Bensalem, S. Statistical model checking: An overview. In Proceedings of the International Conference on Runtime Verification; Springer: St. Julians, Malta, 2010; pp. 122–135. [Google Scholar]
- Thurner, L.; Scheidler, A.; Schäfer, F.; Menke, J.H.; Dollichon, J.; Meier, F.; Meinecke, S.; Braun, M. pandapower—An Open Source Python Tool for Convenient Modeling, Analysis and Optimization of Electric Power Systems. IEEE Trans. Power Syst. 2018, 33, 6510–6521. [Google Scholar] [CrossRef] [Scilit]
- Deka, D.; Backhaus, S.; Chertkov, M. Learning Topology of Distribution Grids Using Only Terminal Node Measurements. In Proceedings of the IEEE Power and Energy Society General Meeting; IEEE: Boston, MA, USA, 2016; pp. 1–5. [Google Scholar] [CrossRef] [Scilit]
- Eddin, M.E.; Massaoudi, M.; Shadmand, M.; Abdallah, M. Enhanced locational fdia detection in smart grids: A scalable distributed framework. In Proceedings of the 2024 4th International Conference on Smart Grid and Renewable Energy (SGRE); IEEE: Doha, Qatar, 2024; pp. 1–6. [Google Scholar]
- Boyaci, O.; Narimani, M.R.; Davis, K.R.; Ismail, M.; Overbye, T.J.; Serpedin, E. Joint detection and localization of stealth false data injection attacks in smart grids using graph neural networks. IEEE Trans. Smart Grid 2021, 13, 807–819. [Google Scholar] [CrossRef] [Scilit]
- Tosatto, A.; Weckesser, T.; Chatzivasileiadis, S. A Modified Version of the IEEE 3-Area RTS ’96 Test Case for Time Series Analysis. arXiv 2019, arXiv:1906.00055. [Google Scholar]
- Calder, A. NIST Cybersecurity Framework: A Pocket Guide; IT Governance Publishing: Cambridgeshire, UK, 2018. [Google Scholar]
- Francia, G.A., III; El-Sheikh, E. NERC CIP standards: Review, compliance, and training. In Global Perspectives on Information Security Regulations: Compliance, Controls, and Assurance; IGI Global: Hershey, PA, USA, 2022; pp. 48–71. [Google Scholar] [CrossRef] [Scilit]
- North American Electric Reliability Corporation. 2026 Critical Infrastructure Protection (CIP) Reliability Standards. Available online: https://www.nerc.com/standards/reliability-standards/cip (accessed on 16 June 2026).

Disclaimer/Publisher’s Note: The statements, opinions and data contained in all publications are solely those of the individual author(s) and contributor(s) and not of MDPI and/or the editor(s). MDPI and/or the editor(s) disclaim responsibility for any injury to people or property resulting from any ideas, methods, instructions or products referred to in the content. |
© 2026 by the authors. Licensee MDPI, Basel, Switzerland. This article is an open access article distributed under the terms and conditions of the Creative Commons Attribution (CC BY) license.