


Abstract
This study proposes VulnPattern-TKG, an end-to-end temporal knowledge graph framework that forecasts the emergence of CVE-derived vulnerability-pattern relations from Common Vulnerabilities and Exposures (CVE) descriptions. The framework does not aim to predict the real-world exploitation of individual CVEs; instead, it models how standardized relations among Weakness Factor (WF), Exploitation Outcome (EO), and Exploitation Prerequisite (EP) categories evolve over time in vulnerability disclosure text. It processes 205,600 National Vulnerability Database (NVD) CVE descriptions from 2014 to 2024 using a hybrid pipeline combining SecureBERT+CRF-based entity extraction, dependency-parsing-based relation rules, and four-stage hierarchical standardization. The resulting compact Knowledge Layer contains 26 standardized category nodes and 48,371 confidence-filtered triples. VulnTEC is a lightweight confidence- and time-weighted Node2Vec graph embedding framework that ranks relation-compatible candidate tails using cosine similarity over shared node embeddings. An internal four-component priority-score framework, integrating prediction confidence, temporal rise, exploitation-prerequisite prevalence-risk proxy, and extraction confidence, supports an analyst-side review of the forecasted relations. Under the novel-only triggers evaluation, VulnTEC achieves a mean MRR of 0.410 ± 0.020; however, the theoretical random baseline already reaches 0.408 because the candidate tail space contains only six EO categories. The results are interpreted as directional ranking evidence, and query-level Top-K results are reported only as descriptive analyst-side review evidence.
1. Introduction
The cybersecurity threat landscape has grown increasingly complex, with the number of newly disclosed vulnerabilities rising steadily each year. The number of CVE entries registered in the National Vulnerability Database (NVD) [1] has averaged approximately 20,000 per year since 2014, placing security operations teams under mounting pressure to process this large volume of vulnerability information with limited resources. In this context, the ability to identify emerging vulnerability-pattern relations and to support analyst-side review has become an important challenge in operational security.
Existing vulnerability assessment methodologies fall broadly into two categories. First, static scoring frameworks such as the Common Vulnerability Scoring System (CVSS) [2] summarize the severity of a vulnerability at the time of disclosure as a single numerical score, but they do not model how vulnerability-pattern relations evolve over time. Second, approaches that use external exploitation or threat-intelligence signals, such as exploit availability or cyber-threat intelligence indicators, provide useful operational context but depend on external observations beyond the CVE description itself [3,4]. These signals are valuable for vulnerability management, but they address a different problem from modeling how Weakness Factor (WF), Exploitation Outcome (EO), and Exploitation Prerequisite (EP) categories are textually associated and evolve across CVE disclosure snapshots.
This study focuses on a more specific and conservative task: forecasting the temporal emergence of CVE-derived vulnerability-pattern relations in vulnerability disclosure text. The goal is not to predict whether an individual CVE will be exploited in the real world. Instead, this study models how standardized relations among WF, EO, and EP categories appear and evolve over annual CVE snapshots. A forecasted relation produced by the proposed framework should therefore be interpreted as a predicted CVE-derived vulnerability-pattern relation, not as confirmed exploitation, exploit availability, or organization-specific exposure.
Knowledge graphs provide a natural representation for this task because they can encode typed entities and typed relations in a structured form. However, applying knowledge graph methods to CVE description text requires addressing several domain-specific challenges. First, CVE descriptions are semi-structured and vary across CVE Numbering Authority (CNA) writing styles. Second, automatically extracted security expressions exhibit severe surface-form fragmentation. Third, after standardization into a compact category-level vocabulary, the resulting graph becomes small and sparse, limiting the number of genuinely novel relation patterns observed in each evaluation period. These characteristics distinguish CVE-derived security graphs from large-scale general-domain temporal knowledge graph completion benchmarks.
To address these challenges, this study proposes VulnPattern-TKG, an end-to-end framework for constructing and analyzing a temporal knowledge graph from CVE description text. The framework extracts WF, EO, and EP entities from CVE descriptions using SecureBERT+CRF-based entity recognition and generates triggers, depends_on, and co_occurs relations using dependency-parsing-based rules [5]. Four-stage hierarchical standardization then maps diverse surface forms into a compact 26-category Knowledge Layer. This design reduces node fragmentation and enables relation-level forecasting, while explicitly acknowledging the information loss and coverage limitations introduced by category compression.
For relation forecasting, this study introduces VulnTEC (Vulnerability Temporal Embedding with Confidence Weighting), a lightweight confidence- and time-weighted Node2Vec graph embedding framework for compact CVE-derived temporal knowledge graphs [6]. VulnTEC does not aim to be a general-purpose temporal knowledge graph embedding architecture. Instead, it incorporates extraction confidence and deterministic temporal recency into edge weights, learns shared node embeddings over the cumulative training graph, and ranks relation-compatible candidate tails using cosine similarity. This design provides a reproducible and interpretable embedding framework for compact security-domain knowledge graphs.
The operational use of forecasted relations is also framed conservatively. The proposed priority-score formulation combines internal signals from VulnPattern-TKG, including embedding-based prediction confidence, temporal activity, EP-related prevalence, and extraction confidence. However, this score is intended as an internal analyst-side review signal, not as an automated remediation order. External exploit intelligence, asset criticality, environmental exposure, and organization-specific risk policy remain necessary for deployment-stage remediation decisions.
The main contributions of this study are as follows. First, it constructs a compact temporal Knowledge Layer from 205,600 NVD CVE descriptions published between 2014 and 2024 through a hybrid pipeline combining SecureBERT+CRF-based entity recognition, dependency-parsing-based relation rules, and four-stage hierarchical standardization, resulting in 26 standardized category nodes and 48,371 confidence-filtered triples. Second, it proposes VulnTEC, a lightweight confidence- and time-weighted Node2Vec graph embedding framework for schema-constrained candidate ranking on compact CVE-derived temporal knowledge graphs. Third, it defines an internal four-component priority-score framework integrating prediction confidence, a temporal rise, exploitation-prerequisite prevalence-risk proxy, and extraction confidence, with all components computed solely from VulnPattern-TKG internal data. Fourth, it conducts a multi-protocol evaluation, including link prediction with a theoretical random candidate-space control, operational Top-K ranking, pipeline ablation, and sensitivity analyses, while interpreting the results cautiously under small candidate spaces and limited novel-only evaluation sets.
Experiments on 205,600 CVE descriptions in the NVD spanning 2014–2024 demonstrate the full pipeline. The hybrid extraction and four-stage standardization process consolidates diverse surface forms into a compact 26-node, 48,371-triple temporal knowledge graph. Under the novel-only triggers evaluation, VulnTEC achieves a mean MRR of 0.410 ± 0.020, providing directional ranking evidence in the compact 6-EO candidate space where the theoretical random baseline already yields MRR = 0.408. The depends_on relation provides a more informative comparison setting because its candidate space is larger and its random baseline is lower. In query-level operational evaluation, VulnTEC shows descriptive Top-K separation for triggers and depends_on; however, these results are reported as analyst-side review evidence rather than a validation of deployment-stage remediation priority. All comparisons are interpreted as directional evidence rather than statistically confirmed superiority.
The remainder of this paper is organized as follows. Section 2 reviews related work on vulnerability assessment, cybersecurity knowledge graphs, temporal knowledge graph forecasting, and security text extraction. Section 3 presents the VulnPattern-TKG construction pipeline, the VulnTEC embedding framework, and the internal priority-score formulation. Section 4 reports the experimental setup, pipeline validation, link-prediction comparison, ablation study, operational Top-K ranking, and sensitivity analyses. Section 5 concludes the paper and discusses limitations and future work.
2. Related Work
Existing research related to this study can be grouped into four streams: vulnerability assessment and exploit-signal-based prioritization, cybersecurity knowledge graph construction, security text extraction and standardization, and temporal knowledge graph forecasting. This section reviews these streams and clarifies how VulnPattern-TKG differs from prior work.
Static vulnerability assessment frameworks such as the Common Vulnerability Scoring System (CVSS) provide standardized severity scores at disclosure time [2]. These scores are useful for describing intrinsic vulnerability characteristics, but they do not model how vulnerability-pattern relations evolve across disclosure snapshots. Exploit-signal-based approaches, including exploit prediction and cyber threat intelligence (CTI) mining, incorporate external evidence such as exploit availability, public discussion, telemetry, or threat-report signals [3,4]. These approaches are important for vulnerability management, but they address a different problem from the one studied here. VulnPattern-TKG does not attempt to predict the real-world exploitation of individual CVEs. Instead, it forecasts the emergence of standardized vulnerability-pattern relations derived from CVE description text. External exploit intelligence remains necessary for deployment-stage remediation decisions.
Cybersecurity knowledge graphs have been used to integrate heterogeneous security entities, including vulnerabilities, weaknesses, attack techniques, and threat intelligence sources [7,8]. Ontology-based approaches have connected structured sources such as the NVD, MITRE ATT&CK, ExploitDB, and Common Weakness Enumeration (CWE) to support security knowledge organization [1,9,10,11]. Other studies have applied knowledge graph embedding methods such as TransE and RotatE to static security graphs for threat analysis, intrusion-path reasoning, or attribution tasks [12,13,14,15,16,17,18,19], while recent vulnerability knowledge-graph construction research has explored multi-source data fusion and LLM-assisted reasoning [20]. These approaches demonstrate the usefulness of structured security representations, but they typically target knowledge-graph construction or static relation modeling and rely on curated or multi-source structured inputs. They therefore do not directly forecast how CVE-derived vulnerability-pattern relations emerge and change over time in CVE description text.
Another line of research focuses on extracting cybersecurity knowledge from unstructured or semi-structured text. Rule-based extraction methods provide interpretability but often suffer from limited coverage when surface expressions vary [21]. Neural named entity recognition and security-domain language models improve contextual extraction, but the extracted expressions can remain fragmented unless they are standardized into a smaller set of reusable concepts [5,22,23,24,25]. In CVE descriptions, this issue is particularly important because the same weakness, outcome, or prerequisite can be expressed through many surface forms. VulnPattern-TKG therefore combines SecureBERT+CRF-based entity extraction, dependency-parsing-based relation rules, and four-stage hierarchical standardization. This design aims to reduce surface-form fragmentation while preserving the WF-EO-EP relation structure needed for relation-level forecasting.
Temporal knowledge graph (TKG) models extend static knowledge graphs by associating facts with temporal information. Tensor factorization and temporal embedding models, including TComplEx and related temporal reasoning frameworks, have been widely studied for temporal knowledge graph completion [26,27,28,29,30,31,32]. However, most benchmark settings in the literature are larger and denser than the compact category-level graph produced from standardized CVE descriptions. In the proposed setting, the Knowledge Layer contains only 26 standardized category nodes, and valid candidate tail spaces are small: six EO categories for triggers and eight EP categories for depends_on. Under such conditions, random candidate ranking can already achieve non-trivial scores, and small novel-only evaluation sets make strong statistical claims difficult. Recent discussions on TKG evaluation also emphasize that the forecasting results should be interpreted in relation to dataset structure, filtering protocol, and evaluation scope [30]. This study therefore reports a theoretical random candidate-space control, separates novel triple-instance evaluation from query-level operational evaluation, and interprets the results as directional ranking evidence rather than statistically confirmed superiority.
VulnPattern-TKG differs from prior work in three respects. First, it defines a CVE-derived vulnerability-pattern relation forecasting task that is distinct from individual CVE exploitability prediction. Second, it constructs a compact temporal Knowledge Layer from CVE text through hybrid extraction and hierarchical standardization. Third, it introduces VulnTEC as a lightweight confidence- and time-weighted Node2Vec graph embedding framework for schema-constrained candidate ranking on compact security-domain temporal graphs. The framework also defines an internal priority-score formulation for analyst-side review, but this score is not intended to replace external exploit intelligence or organization-specific remediation policy. Table 1 summarizes the relationship between related work and the proposed VulnPattern-TKG framework.
Table 1.
Comparison of related work and VulnPattern-TKG.
3. Methodology
3.1. Construction of VulnPattern-TKG from CVE Text
3.1.1. Vulnerability Pattern Definition and Forecasting Task
This section describes the construction of VulnPattern-TKG, a temporal knowledge graph designed to model the temporal emergence of CVE-derived vulnerability-pattern relations. The proposed framework extracts three types of security entities from CVE description text: Weakness Factor (WF), Exploitation Outcome (EO), and Exploitation Prerequisite (EP). These entities represent, respectively, the weakness that introduces a vulnerability, the security impact described as its exploitation outcome, and the exploitation-context condition such as authentication state, access scope, privilege level, or required user interaction.
A temporal fact in VulnPattern-TKG is represented as
where and are standardized Knowledge Layer entities, is a relation type, and is the temporal snapshot index. Let denote the standardized triple set observed in snapshot , and let denote the cumulative training-history triple set up to the last training snapshot . The forecasting target is defined as follows:
Thus, novelty is determined at the standardized triple level, and the target snapshot index is attached after the triple is identified as absent from the training-history triple set. The task is therefore relation-level pattern-emergence forecasting, not individual CVE exploitability prediction. A forecasted relation such as or indicates that a standardized CVE-derived vulnerability-pattern relation is expected to appear in future vulnerability disclosure text. It should not be interpreted as direct evidence of confirmed exploitation, exploit availability, or organization-specific exposure. Confirmed real-world exploitation requires external evidence such as Cybersecurity and Infrastructure Security Agency Known Exploited Vulnerabilities (CISA KEV) catalog, ExploitDB, Exploit Prediction Scoring System (EPSS), telemetry, or asset-exposure data, none of which is used as a target label in this study.
VulnPattern-TKG separates CVE-level provenance and category-level forecasting through a dual-layer design. The Instance Layer preserves individual CVE entries and their extracted mentions, whereas the Knowledge Layer contains standardized WF, EO, and EP categories and their inter-category relations. All embedding training and relation-level forecasting are performed in the Knowledge Layer. Figure 1 illustrates this dual-layer construction pipeline, distinguishing the CVE-level Instance Layer from the standardized Knowledge Layer in which all relation-level forecasting is performed.
Figure 1.
Overview of the VulnPattern-TKG construction pipeline. The Instance Layer preserves CVE-level provenance, whereas the Knowledge Layer represents standardized WF, EO, and EP categories and their triggers, depends_on, and co_occurs relations. Forecasting is performed only over Knowledge Layer relations and does not assign exploitability labels to individual CVEs. WF, weakness factor; EO, exploitation outcome; EP, exploitation prerequisite; TKG, temporal knowledge graph.
3.1.2. Schema Design and Hybrid Knowledge Extraction
VulnPattern-TKG uses three entity types and three relation types. The entity schema is designed to capture the core semantic dependency structure expressed in the CVE description text. A WF represents the weakness factor, an EO represents the described exploitation outcome, and an EP represents an exploitation-context condition. This WF–EO–EP decomposition is broadly aligned with established security taxonomies, including CWE-based weakness terminology and ATT&CK-oriented descriptions of adversarial behavior, while remaining tailored to the relation structure observable in CVE descriptions. Importantly, these relations are textually derived semantic dependencies rather than externally verified causal mechanisms.
The Knowledge Layer defines three relation types. The triggers relation represents that a weakness factor is textually described as giving rise to an exploitation outcome. The depends_on relation represents that an exploitation outcome is textually associated with an access, authentication, privilege, or interaction condition. The co_occurs relation captures non-causal co-observation of multiple weakness factors within the same CVE description. Because the embedding models operate on directed triples, each co_occurs edge is represented as two directed triples. Table 2 presents the relation definitions and representative syntactic patterns used in the Knowledge Layer.
Table 2.
Relation definitions and representative syntactic patterns in the Knowledge Layer.
Knowledge extraction proceeds in two stages. First, SecureBERT [5] with a Conditional Random Field (CRF) layer identifies WF, EO, and EP spans from the CVE description text [33]. The CRF marginal probability is retained as span-level confidence. Second, dependency-parsing rules based on spaCy’s en_core_web_trf generate candidate relations among the extracted entities [34]. The rules are organized into three confidence tiers according to the explicitness of the syntactic evidence: direct grammatical relations, indirect modifiers or clauses, and weak noun–phrase juxtapositions.
The extraction rules are intentionally conservative. They are applied only when explicit lexical or syntactic cues are observed. Ambiguous or stylistically atypical expressions are left unassigned rather than forced into the schema. This design reduces false-positive relation generation but may lower recall for implicit or non-standard CVE descriptions. Manual validation of entity extraction, relation extraction, and standardization quality is reported in Section 4.2.
The extraction rules rely on the structurally consistent style of NVD CVE descriptions written under MITRE CNA guidelines [35]. Generalization to noisier or non-CNA-conformant security text sources, such as raw vendor advisories, mailing-list disclosures, exploit write-ups, or unstructured threat-intelligence reports, is not directly evaluated in this study and is identified as a deployment limitation in Section 5. Table 3 lists the dependency-parsing-based relation extraction rules used in the hybrid extraction pipeline.
Table 3.
Dependency-parsing-based relation extraction rules.
The rule-tier weight is assigned according to the extraction rule tier , which reflects the explicitness of syntactic evidence: direct grammatical evidence, indirect modifier or clausal evidence, and weak juxtaposition evidence, respectively. It represents extraction confidence rather than ground-truth semantic certainty.
3.1.3. Hierarchical Entity Standardization and Confidence Scoring
CVE descriptions often express the same security concept using diverse surface forms. Without standardization, these variants produce severe node fragmentation and weaken relation-level forecasting. VulnPattern-TKG therefore applies four-stage hierarchical entity standardization. S1 performs surface normalization through lowercasing and lemmatization. S2 consolidates synonyms using CWE-based terminology. S3 clusters semantically similar expressions in the SecureBERT embedding space. S4 maps standardized expressions to fixed Knowledge Layer categories.
The resulting Knowledge Layer contains 26 category nodes: 12 WF categories, 6 EO categories, and 8 EP categories. This inventory is not intended to be a complete vulnerability ontology. Rather, it is a forecasting-oriented abstraction layer designed to reduce surface-form fragmentation while preserving the minimum WF–EO–EP distinctions required for relation-level forecasting. In the current standardization output, 429 distinct surface forms are mapped to the 26-category inventory, yielding an average mapping density of approximately 16.5 surface forms per category. The clustering quality is moderate, with silhouette scores of 0.291 for WF, 0.245 for EO, and 0.264 for EP. Figure 2 presents a t-SNE projection of the standardized WF, EO, and EP categories, providing a qualitative view of the 26-node inventory that complements these clustering metrics.
Figure 2.
t-SNE visualization of standardized WF, EO, and EP categories. The visualization provides a qualitative view of the 26-node category inventory. Cluster boundaries should be interpreted together with the quantitative clustering metrics and manual validation results in Section 4.2. Colors denote clusters within each entity type and are used only for visual distinction.
Four nodes—Injection, Configuration_Error, Logic_Error, and High_Privilege—have no inter-node edges during the training period (degree centrality of zero); they are therefore treated as isolated nodes in the link-prediction evaluation. These observations indicate that the 26-node setting provides a compact and usable abstraction for forecasting, while also introducing information loss and coverage limitations that are analyzed in Section 4.2 and Section 4.7.2; the propagation of extraction and standardization choices to downstream link prediction is further examined in Section 4.5. Table 4 summarizes the fixed category inventory used in the Knowledge Layer after hierarchical entity standardization.
Table 4.
Fixed category inventory used in the Knowledge Layer after hierarchical entity standardization. DoS, denial of service.
Confidence scores are assigned at two levels. At the instance level, the confidence of a triple extracted from a CVE combines the CRF confidence of the entity spans and the rule-tier confidence of the dependency pattern:
Here, and denote the CRF marginal probabilities of the head and tail entity spans in CVE , respectively. The term denotes the rule-tier weight assigned to the extraction rule tier that generated the triple. Thus, is determined by the explicitness of syntactic evidence, not by the relation type itself.
At the snapshot level, all CVE instances that generate the same standardized triple are aggregated into . Let denote the set of CVE instances at snapshot that generate the standardized triple . The aggregated confidence is computed as
Equation (4) computes the per-snapshot aggregated confidence as the unweighted mean of the per-instance confidence over all CVE descriptions in . This averaging treats each supporting CVE instance equally, and the resulting aggregated confidence is subsequently filtered using the global confidence threshold . Triples whose aggregated confidence falls below are removed from the corresponding snapshot. The empirical effect of is analyzed in Section 4.7.2.
We use a single global confidence threshold as a conservative default rather than relation-specific thresholds, because relation-specific thresholds may over-amplify rare or low-support relation types in this compact graph. The effect of on graph density and downstream MRR is examined in Section 4.7.2.
3.2. TKG-Derived Graph Embedding for Pattern-Emergence Forecasting
3.2.1. VulnTEC: Lightweight Confidence- and Time-Weighted Graph Embedding
VulnTEC is designed as a lightweight graph embedding framework for the compact Knowledge Layer of VulnPattern-TKG. It does not aim to be a general-purpose temporal KGE architecture. Instead, it incorporates extraction confidence and temporal recency into edge weights and then applies Node2Vec to the weighted cumulative graph.
Let denote the weighted cumulative Knowledge Layer graph constructed from training-period snapshots. For each standardized triple , the edge weight is defined as
Here, is the cumulative confidence of the triple over the training period, computed as the sum of its snapshot-level confidence over the training snapshots in which it is observed, and denotes a deterministic temporal weighting term computed only from training-history information. In this study, is defined as the average normalized recency of the training snapshots in which the triple is observed:
where is the set of training snapshots in which is observed, is the final training snapshot, and prevents older but reliable relations from receiving near-zero temporal weight. This deterministic formulation assigns larger weights to relations supported by more recent training snapshots while using no future test-period facts.
Node2Vec is applied to to obtain one shared embedding vector for each Knowledge Layer node. The score of a candidate relation-level triple is computed by cosine similarity:
The relation type constrains the candidate tail space. Candidate tails for triggers are ranked over EO nodes, candidate tails for depends_on are ranked over EP nodes, and candidate tails for co_occurs are ranked over WF nodes. Thus, relation awareness is introduced through schema-constrained candidate ranking, rather than through separate relation-specific embedding vectors.
VulnTEC does not learn relation-specific embeddings or timestamp embeddings. It should therefore be interpreted as a TKG-derived confidence- and time-weighted graph embedding framework, not as a general-purpose temporal KGE model. This design prioritizes reproducibility and robustness on a small category-level security graph rather than maximizing expressiveness through deep temporal architectures. Figure 3 summarizes the overall VulnTEC embedding procedure, from confidence- and time-weighted edge construction to schema-constrained candidate ranking over shared node embeddings.
Figure 3.
VulnTEC graph embedding procedure. Triple confidence and deterministic temporal weighting are encoded as edge weights, and shared Node2Vec embeddings are used for schema-constrained candidate ranking.
The default Node2Vec configuration uses embedding dimension and walk length 30. Because long random walks on a 26-node graph may revisit the same nodes and amplify local structural patterns, these settings are treated as practical defaults rather than theoretically optimal choices. The empirical robustness of the proposed configuration against alternative walk lengths and search-bias parameters is examined in Section 4.7.3. Table 5 summarizes the model groups and scoring strategies used for comparison.
Table 5.
Model groups and scoring strategies used for comparison.
Alternative temporal graph models such as RE-NET and CyGNet are not considered incompatible, but applying them to a compact annual category-level graph would require non-trivial adaptation. This limitation is discussed as future work in Section 5.
3.2.2. Training, Ranking, and Leakage Control
VulnTEC uses weighted Node2Vec learning on the cumulative training graph . Confidence and temporal information affect random-walk transition probabilities through edge weights. The model does not rely on explicit margin-ranking loss, learnable temporal attention, or a separate temporal smoothing objective. This design is intentionally lightweight, reflecting the small size and sparsity of the Knowledge Layer.
For each query context , candidate tails are selected from the relation-compatible entity type and ranked by . Evaluation is conducted under a time-filtered protocol: triples already observed in the training history are filtered when assessing novel relation-level triples, and test-period triples are not used to construct the graph, train embeddings, or determine edge weights.
This design prevents graph-level leakage from future test-period facts. However, SecureBERT is a pretrained cybersecurity language model and may encode lexical or contextual knowledge from its pretraining corpus that was not available at all historical timestamps. This representation-level temporal prior is distinct from using future graph labels, but it may still influence entity extraction and standardization. We acknowledge this limitation and discuss fully time-isolated language-model training as future work in Section 5.
Prediction performance is measured using Mean Reciprocal Rank (MRR) and Hits@K under the time-filtered evaluation protocol. Because the valid tail spaces are small—six EO nodes for triggers and eight EP nodes for depends_on—Hits@K can saturate at large values of the ranking cutoff K. Therefore, the main results report MRR, Hits@1, and Hits@3. The distinction between novel triple instances and operational ranking queries is defined in Section 3.3 and operationalized in Section 4.6.
3.3. Internal Priority Scoring for Forecasted Vulnerability-Pattern Relations
This section describes how relation-forecasting results are converted into internal decision-support indicators for analyst-side review. The purpose of this scoring step is not to determine whether an individual CVE will be exploited in the real world, nor to produce a standalone remediation priority for deployed systems. Instead, the score ranks forecasted CVE-derived vulnerability-pattern relations according to evidence available inside VulnPattern-TKG.
Accordingly, the priority score should be interpreted as an internal pattern-review priority signal. It can support analysts by highlighting forecasted relations that combine high embedding confidence, increasing temporal activity, historically prevalent exploitation-context conditions, and reliable extraction evidence. However, it does not replace external exploit intelligence, asset criticality, environmental exposure, or organization-specific risk policy.
3.3.1. Priority Score Design
For each candidate triple , the internal analyst-side priority score integrates four normalized components: prediction confidence, temporal rise, EP prevalence-risk proxy, and extraction confidence:
The default setting uses equal weights as a neutral configuration, not as a calibrated organizational policy. A priority-score weight-sensitivity framework for deployment-stage calibration is described in Section 4.7.4.
The prediction-confidence component is defined as
where is the sigmoid function. Because is monotonic, ranking by is equivalent to ranking by .
The temporal-rise component captures whether the support or confidence of a candidate pattern increases toward the end of the training period:
For an observed training triple, is computed from its snapshot-level confidence. For a genuinely novel triple, is computed using a head-and-tail activity proxy:
Here, and denote the min–max normalized outgoing activity of and incoming activity of under relation , respectively. This allows the score to capture recent activity momentum without treating the exact novel triple as observed evidence.
The EP-related component estimates an internal exploitation-context prevalence signal associated with the predicted outcome. For a triggers candidate , let be the set of EP categories connected to outcome through depends_on relations in the training history. Each EP category receives an internal prevalence score , computed from confidence-weighted historical depends_on support and min–max normalized across EP categories:
The component is then
with when no associated EP category exists. This score is an internal prevalence-risk proxy, not an externally validated severity score.
The extraction-confidence component reflects the reliability of evidence supporting a candidate relation. If the candidate triple has appeared in the training history, the component uses the time-aggregated confidence of that triple. For a genuinely novel triple, a node-level proxy is used:
where is the average confidence of training-history triples incident to node :
Here, is the set of training snapshots in which node is active, and is the set of triples incident to at snapshot . This proxy assigns an evidence-quality signal to novel candidates while acknowledging that direct extraction confidence is unavailable for unobserved relations. Table 6 summarizes the priority-score components used for internal decision-support ranking.
Table 6.
Priority-score components for internal decision-support ranking.
3.3.2. Top-K Reporting and Evaluation Scope
Candidate tails are ranked for each operational query context . In the current retrospective evaluation, the operational Top-K results reported in Section 4.6 are computed using alone, which is equivalent to -based ranking under the monotonic sigmoid transformation. This setting isolates the ranking effect of the embedding-based forecasting component. The full priority score , which integrates all four components, is presented as an internal scoring framework for possible deployment-stage calibration, not as a validated remediation policy. The potential role of , , and beyond -only ranking is discussed through the weight-sensitivity framework in Section 4.7.4.
The Top-K output should be interpreted as a ranked set of forecasted vulnerability-pattern relations for analyst-side review, not as a verified remediation order or a prediction of real-world exploitation.
Two evaluation units are distinguished. Link-prediction performance in Section 4.4 is measured at the level of novel triple instances. In contrast, the operational Top-K evaluation in Section 4.6 is measured at the query level, where each distinct forms one operational ranking query and candidate tails are compared against the novel tails observed in the prediction-target snapshots. This distinction explains why the link-prediction evaluation may contain more novel triple instances than the number of operational ranking queries.
Precision@1 and Precision@3 are reported under the query-level operational protocol. Average Rank Gain (ARG) and Pattern Success Rate (PSR) are used only as supplementary ranking-quality indicators and are interpreted cautiously because the number of operational ranking queries is small.
4. Experiments and Results
4.1. Experimental Setup
4.1.1. Dataset
CVEs published in the NVD from 2014 to 2024 were collected and assigned to annual snapshots according to the NVD publication year. The NVD publication year is used as the snapshot assignment rule because it indicates when vulnerability information became publicly available for analysis. CVE records with RESERVED or REJECT status, empty descriptions, duplicate CVE identifiers, or non-English descriptions were excluded before extraction. The resulting 205,600 CVE descriptions were processed by the proposed pipeline to construct VulnPattern-TKG. Annual snapshots are used in this study because category-level CVE-derived pattern relations are sparse after standardization into the 26-node Knowledge Layer; finer-grained quarterly or monthly snapshots are discussed as a future extension in Section 5. The data are partitioned into a training period (2014–2020; seven snapshots), a validation period (2021; one snapshot), and a test period (2022–2024; three snapshots). The prediction target is defined at the Knowledge Layer as novel relation-level triples that are absent from the training history but first appear in the prediction-target test snapshots. Link-prediction performance is evaluated at the novel triple-instance level, whereas the operational Top-K evaluation in Section 4.6 is evaluated at the query level, where each distinct head-relation context forms one operational ranking query.
TR, DO, and CO denote triggers, depends_on, and co_occurs, respectively. Table 7 reports raw extracted triple counts before confidence filtering; the split-wise counts sum to 54,293 triples. After applying the default confidence-filtering threshold , the Knowledge Layer used in the main experiments contains 48,371 confidence-filtered triples and 26 category nodes (WF: 12, EO: 6, EP: 8). Thus, 54,293 denotes the raw extracted graph size before confidence filtering, whereas 48,371 denotes the filtered Knowledge Layer used for link prediction, ablation, and sensitivity analyses. Four categories—Injection, Configuration_Error, Logic_Error, and High_Privilege—have no inter-node edges during the training period and are treated as isolated-node coverage limitations in the link-prediction evaluation.
Table 7.
Raw extracted triple counts by temporal split before confidence filtering.
4.1.2. Implementation Details
Entity recognition is performed using SecureBERT+CRF, and relation generation uses spaCy’s en_core_web_trf. VulnTEC is implemented as a confidence- and time-weighted Node2Vec graph embedding framework over the cumulative Knowledge Layer graph. Candidate triples are scored by cosine similarity over shared node embeddings, and candidate tails are restricted according to the relation schema. The main Node2Vec hyperparameters are embedding dimension and walk length 30; the effects of search-bias parameters and alternative walk lengths are examined in Section 4.7.3. The experiments are implemented in Python 3.10 using PyTorch 2.0, spaCy 3.8.7, scikit-learn 1.5.1, and Gensim 4.3.3. Experiments were conducted on a workstation equipped with an NVIDIA GeForce RTX 3070 GPU with 8 GB memory, 64 GB RAM, and a 12th Gen Intel Core i9-12900K CPU running at 3.20 GHz. Unless otherwise specified in the corresponding table caption, main link-prediction results are reported over five independent runs using seeds , whereas ablation, operational Top-K, and sensitivity analyses may use single-seed settings as explicitly indicated.
All link-prediction results are evaluated under a time-filtered protocol. Candidate triples already observed in the training history are filtered when measuring novel-only performance, and test-period triples are not used to construct the training graph, train embeddings, or determine edge weights. For each head-relation query context , the candidate tail set is constructed from schema-compatible nodes, and tails already linked to in the training history are excluded when computing novel-only metrics.
To avoid ambiguity, this study distinguishes three related evaluation units. A novel triple instance refers to one forecasted quadruple evaluated in link prediction. An all-triples instance refers to any test-period triple, including recurring triples. An operational ranking query refers to a distinct head-relation context for which at least one novel tail appears in the prediction-target snapshots. The first unit is used in Section 4.4, the second in split-robustness analysis, and the third in Section 4.6. The preprocessing rules, category mappings, confidence fields, temporal split definitions, and evaluation protocol are specified to support reproducibility. The source CVE descriptions are obtained from the public NVD data, and the study-specific processed artifacts and evaluation helper scripts are provided as Supplementary Materials, while additional implementation scripts are available from the corresponding author, as detailed in the Data Availability Statement.
4.2. Pipeline Quality Evaluation
Section 4.2 evaluates the quality of the extraction and standardization pipeline before reporting downstream forecasting results. CRF marginal probabilities, rule-tier weights , and clustering metrics are useful confidence indicators, but they do not directly measure whether extracted spans, generated relations, and standardized category mappings are correct. We therefore complement the automatic statistics with precision-oriented manual validation on stratified samples of system-extracted spans and triples. This section reports extraction statistics, manual precision validation, confidence-bin precision, and clustering boundary analysis.
4.2.1. Extraction and Standardization Statistics
A total of 99,950 WF spans, 82,092 EO spans, and 80,345 EP spans were extracted from 205,600 CVE descriptions covering 2014–2024. At the CVE level, 47.8% of CVEs contain at least one WF span, 35.6% contain at least one EO span, and 33.3% contain at least one EP span; 6.9% of CVEs contain all three entity types and can directly contribute to complete WF-EO-EP pattern paths. The mean CRF marginal probabilities were 0.983 for WF, 0.980 for EO, and 0.981 for EP, indicating span-level model confidence across the three entity types. These probabilities should be interpreted as confidence indicators rather than direct extraction accuracy; manual precision validation is therefore reported in Section 4.2.2. Table 8 summarizes the distribution of extracted triples by dependency-parsing rules and extraction-confidence tiers.
Table 8.
Distribution of extracted triples by dependency-parsing rules and extraction-confidence tiers.
For the triggers relation, R1, which corresponds to direct grammatical evidence, accounts for the largest share of extracted triples, 65.2%. For depends_on, R7 accounts for 97.2%, reflecting that adjectival attack-context expressions such as “unauthenticated attacker” and “remote attacker” are frequently used to describe exploitation prerequisites in NVD descriptions. These distributions show which rule types dominate the automatically constructed graph, but they do not by themselves validate extraction correctness. Manual precision validation of representative extracted spans and triples is therefore reported in the next subsection. Figure 4 shows the annual growth of extracted triple counts by relation type, where triggers and depends_on relations increase steadily across the study period while co_occurs remains comparatively small.
Figure 4.
Annual growth of extracted triple counts by relation type from 2014 to 2024. The counts correspond to raw extracted triples before confidence filtering; co_occurs remains smaller because it reflects within-CVE co-observation of multiple WFs. The vertical dotted lines indicate the boundaries between the training period (2014–2020), validation period (2021), and test period (2022–2024).
4.2.2. Manual Precision Validation of Extraction and Standardization
To complement automatic confidence indicators, we conducted precision-oriented manual validation on 270 sampled system outputs, including 90 entity spans, 90 relation triples, and 90 surface-form-to-category mappings. The sample covers all three entity types (WF, EO, EP) and all three relation types (triggers, depends_on, and co_occurs). Because the validation items are system-extracted outputs rather than exhaustive gold annotations of full CVE descriptions, we report manual precision and standardization mapping accuracy rather than recall or F1. This sampled validation protocol is intended to assess the reliability of system outputs, not to provide an exhaustive, recall-oriented annotation set.
For each sampled entity span, the annotator checked whether the extracted span represents the intended entity type and whether the standardized category assignment is semantically appropriate. For each sampled relation triple, the annotator checked whether the source CVE description provides sufficient textual evidence for the predicted relation type and its participating entities. Error types were recorded only for incorrect or ambiguous cases to reduce annotation burden while preserving representative error information.
The manual validation results show that the extraction and standardization pipeline provides usable but non-uniform precision across output types. WF and EP span extraction achieve relatively high precision values of 0.933 and 0.900, respectively, and the surface-form-to-category standardization mapping achieves an accuracy of 0.911. These results support the use of the compact 26-category Knowledge Layer for relation-level forecasting. In contrast, EO span extraction shows lower precision of 0.600, mainly due to boundary truncation in outcome expressions such as partially extracted denial, leakage, injection, or arbitrary-execution phrases; category-level abstraction partially mitigates but does not remove this boundary issue. Relation extraction shows moderate precision, with 0.767 for triggers, 0.633 for depends_on, and 0.800 for co_occurs. The lower precision of depends_on is mainly associated with implicit prerequisite cues and false positives involving user-interaction or access-condition expressions. These findings indicate that the pipeline can be used for constructing the compact Knowledge Layer while motivating the error-propagation analysis in Section 4.5. The structured sample-level manual-validation annotations underlying Table 9 and Table 10, including the 270 sampled outputs and their manual judgments, are provided as Supplementary Materials to support replication of the precision and confidence-bin analyses. Table 9 summarizes the manual precision validation results for extracted spans and relation triples, and Table 10 reports manual precision by aggregated-confidence bin.
Table 9.
Manual precision validation of extracted spans and relation triples.
Table 10.
Manual precision by aggregated-confidence bin.
To examine whether the aggregated confidence score behaves as an empirical reliability signal, we also group manually validated relation triples by the aggregated confidence score , as defined in Equation (4). The bins are defined as low [0, 0.4), medium [0.4, 0.7), and high [0.7, 1.0], where the lower boundary of the medium bin corresponds to the default confidence-filtering threshold . This analysis evaluates whether higher-confidence triples are more likely to be manually correct, while recognizing that bin sizes follow the natural distribution of extracted relation triples.
The confidence-bin analysis shows that aggregated confidence is useful as a coarse reliability signal, but it should not be interpreted as a strictly monotonic correctness estimator. The low-confidence bin contains only three validated triples and shows no correct cases under conservative evaluation; this estimate is based on a sample too small for quantitative claims and is reported only to illustrate that very-low-confidence triples are unreliable. The sampled triples follow the natural confidence distribution of the extracted relation triples, which is right-skewed toward medium and high confidence. Medium- and high-confidence triples show substantially higher precision values of 0.800 and 0.742, respectively. The high-confidence bin does not exceed the medium bin, partly because high-confidence triples can still include semantic boundary ambiguity or implicit relation-cue errors, such as false positives involving user-interaction conditions. These results support the use of confidence filtering to remove weak evidence while showing that confidence weighting cannot fully eliminate linguistic ambiguity in CVE descriptions.
4.2.3. Clustering Quality and Boundary Ambiguity
Table 11 reports intrinsic clustering quality metrics for the standardized WF, EO, and EP categories. The silhouette scores range from 0.245 for EO to 0.291 for WF, indicating moderate rather than strong cluster separation. This result is expected in the security domain because several vulnerability concepts share overlapping linguistic realizations in CVE descriptions. For example, prerequisite expressions may combine network access, authentication state, privilege level, and user interaction in a single phrase, which partially explains the lower EP purity.
Table 11.
Intrinsic clustering quality metrics for standardized WF, EO, and EP categories.
The clustering results should therefore be interpreted as evidence that the 26-node inventory provides a usable abstraction for forecasting, not as proof of complete semantic separation. Boundary ambiguity may introduce near-category mapping errors, especially for EP expressions and closely related WF categories. The manual precision validation and confidence-bin analyses in Section 4.2.2 assess these errors directly, while the downstream effect of extraction and standardization choices is examined in the pipeline ablation study in Section 4.5.
4.3. Knowledge Layer Structure and Pattern Emergence
The Knowledge Layer is constructed over the 26-category inventory introduced in Section 3.1.3 and remains compact across the eleven annual snapshots covering 2014–2024. The number of distinct edges in each snapshot ranges from 60 in 2014 to a maximum of 117 in 2020. After confidence filtering, it contains 48,371 triples and 26 standardized category nodes over the full study period. Among these categories, Injection, Configuration_Error, Logic_Error, and High_Privilege have no inter-node edges and a degree centrality of zero in the training graph. They are therefore treated as isolated-node coverage limitations in link-prediction evaluation, as discussed in Section 3.1.3. The annual snapshot granularity is adopted to balance graph density and temporal resolution on this compact inventory; deployment implications and finer-grained snapshot construction are discussed in Section 5. Figure 5 provides a structural overview of the training-period Knowledge Layer, showing the connected category nodes and their relation types together with the four isolated nodes.
Figure 5.
Structural overview of the VulnPattern-TKG Knowledge Layer constructed from the training period (2014–2020). (a) The static Knowledge-Layer network visualizes the 22 connected category nodes among the 26 standardized categories, with edge color indicating relation type (triggers, depends_on, co_occurs); the four isolated nodes (Injection, Configuration_Error, Logic_Error, High_Privilege) appear without incident edges. (b) The connection-density view summarizes how WF, EO, and EP categories participate in the standardized relation structure; EO categories exhibit the highest mean degree centrality (0.66), consistent with their bridging role between WF and EP in the WF → EO → EP pattern structure.
Table 12 summarizes the frequency and mean confidence of major vulnerability-pattern relations during the training period.
Table 12.
Frequency and mean confidence of major vulnerability-pattern relations during the training period.
P1_MemorySafety, with 7164 triples, is the most dominant pattern among the major WF → EO combinations observed during the training period. P2_InjectionChain has zero triples in the training period because the Injection category does not form incident triggers edges after four-stage standardization and confidence filtering. This does not imply that injection-related CVE descriptions are absent from the corpus; rather, it indicates that this category does not obtain sufficient standardized inter-node support under the current 26-node inventory and the filtering configuration. The same coverage limitation applies to the three remaining isolated categories: Configuration_Error, Logic_Error, and High_Privilege. Section 5 discusses possible extensions of this fixed-vocabulary design, including dynamic vocabulary expansion or open-vocabulary mapping for genuinely novel threat categories that do not align with the current 26-node inventory.
4.4. Link Prediction Performance Comparison
4.4.1. Main Results
Table 13 reports the link-prediction performance for the triggers relation under the novel-only evaluation protocol. In addition to embedding-based baselines, we include a theoretical random baseline that ranks relation-compatible candidate tails uniformly at random. Because the triggers relation has only six EO candidate tails in the Knowledge Layer, the random baseline provides an important candidate-space control.
Table 13.
Link prediction performance comparison on the triggers relation under novel-only evaluation for the 2022–2024 test snapshots. denotes distinct novel triggers-relation instances, not operational query contexts; values are mean ± standard deviation over five random seeds where applicable. The depends_on comparison uses a separate eight-category EP candidate space and is therefore reported in the text rather than in this table.
Novel triple instances are individual quadruples evaluated as separate ranking queries in link prediction. The reported corresponds to the number of such triggers instances in the 2022–2024 prediction-target test snapshots. This instance-level evaluation is distinct from the query-level operational Top-K evaluation in Section 4.6, where each distinct head-relation context forms one operational ranking query.
VulnTEC shows a slightly higher mean MRR of 0.410 ± 0.020 under the triggers novel-only evaluation. However, the theoretical random baseline over six EO candidates already yields MRR = 0.408, Hits@1 = 0.167, and Hits@3 = 0.500. Therefore, the margin between VulnTEC and the random candidate-space baseline is very small for the triggers relation. This result indicates that the compact EO tail space limits the discriminative room available to all ranking models. Accordingly, the triggers result should be interpreted as directional ranking evidence, not as statistically confirmed model superiority.
For the depends_on relation, the candidate tail space consists of eight EP categories. The theoretical random baseline yields MRR = 0.340, whereas VulnTEC achieves MRR = 0.381. TComplEx obtains a comparable MRR of 0.377, while TransE and RotatE achieve 0.317 and 0.258, respectively. Although the margin remains modest, the depends_on relation provides a more informative setting for evaluating learned structural ranking because the random baseline is lower and the EO → EP subgraph contains richer prerequisite-context variation.
The ablation results suggest that confidence- and time-weighted edge construction provides a small improvement over unweighted or confidence-only Node2Vec variants. This interpretation is consistent with the revised VulnTEC formulation in Section 3.2, where temporal information is incorporated through deterministic time-weighted edge weights rather than learnable temporal attention. Because the novel-only evaluation set is small, all comparisons in this subsection are interpreted cautiously.
Because only five seed-level observations are available, formal significance testing has limited statistical power. In particular, a two-tailed Wilcoxon signed-rank test with five paired observations has a structural lower bound of approximately even under perfect directional agreement. Therefore, the seed-level statistics are reported as descriptive robustness checks rather than as a basis for strong hypothesis testing. Additional seed-level robustness analysis is reported in Section 4.7.1.
4.4.2. Split Robustness via Multi-Window Evaluation
To assess robustness beyond a single temporal split, we additionally report performance across four alternative train/test split boundaries. Table 14 summarizes this multi-window robustness analysis using the all-triples evaluation protocol. Unlike the novel-only evaluation in Table 13, the all-triples protocol includes both novel and recurring relations in the test-period snapshots.
Table 14.
Multi-window robustness of VulnTEC across four temporal split boundaries using the all-triples evaluation protocol (single seed = 42).
The all-triples MRR values in Table 14 should not be directly compared with the novel-only results in Table 13, because recurring triples correspond to patterns that have already appeared in the training history and are easier to rank. The purpose of this analysis is not to strengthen claims of novel-pattern forecasting superiority, but to assess whether the learned graph structure remains stable under different temporal split boundaries.
Across the tested split configurations, TR MRR remains within the range 0.482–0.594. Under the all-triples protocol, this stability indicates that VulnTEC’s embedding-based ranking is not highly sensitive to the exact train/test boundary. However, the later splits show lower or more variable performance, indicating that more recent CVE patterns may introduce additional structural diversity. Because each split trains on all snapshots before the test-start year, the test ≥ 2022 row trains on 2014–2021—including the 2021 snapshot— unlike the 2014–2020 training window used for the main link-prediction results, and should be read as a sliding-window stability point rather than a replication of the main all-triples result. These results support a cautious interpretation of the novel-only evaluation and motivate future evaluation under larger or finer-grained temporal windows.
4.5. Pipeline Ablation and Error-Propagation Analysis
Section 4.5 evaluates how upstream design choices in extraction, standardization, confidence filtering, and deterministic time-weighted graph construction affect downstream link-prediction performance. This analysis serves as a pipeline error-propagation study: changes in upstream representation quality are measured by their impact on triggers (TR) and depends_on (DO) MRR under the novel-only evaluation protocol. All variants are evaluated under a single seed setting () to isolate component-level effects from random-initialization variance; the multi-seed stability of the full model is reported separately in Section 4.7.1. The effect of these upstream choices on deployment-stage priority scoring is considered in the priority-score weight-sensitivity framework in Section 4.7.4. Table 15 reports the pipeline ablation and error-propagation results under the novel-only evaluation protocol.
Table 15.
Pipeline ablation and error-propagation results under novel-only evaluation.
The embedding ablations clarify the role of domain-specific representation. Replacing SecureBERT with general-purpose BERT-base (V1) reduces TR MRR by 0.032 and DO MRR by 0.004. This result suggests that the domain-specific encoder contributes more strongly to WF → EO trigger ranking than to EO → EP prerequisite ranking. The V1 result does not eliminate the possibility of representation-level temporal priors in SecureBERT, but it suggests that the overall ranking behavior is not solely driven by SecureBERT-specific pretraining knowledge. The term frequency–inverse document frequency (TF-IDF) variant (V2) yields an apparent TR MRR gain of +0.037 but a substantial DO MRR decrease of −0.079. This result is not treated as evidence that TF-IDF is preferable, because the gain in one relation coincides with a loss of balanced relation-level behavior. The cluster purity values of V1 and V2, both 1.000 compared with 0.692 for V0, should also be interpreted cautiously because they may reflect over-concentration rather than better semantic separation.
The parsing ablations show how relation-extraction choices propagate to downstream ranking. Replacing dependency-parsing rules with keyword matching (V3) reduces the number of retained triples from 48,371 to 1074, a 97.8% reduction, but the resulting MRR penalties are limited to −0.024 for TR and −0.023 for DO. This indicates that the Knowledge Layer retains a degree of structural robustness even under severe extraction degradation, likely because high-frequency WF → EO and EO → EP patterns preserve the core connectivity needed for ranking. Restricting the graph to high-confidence rules only (V4, ) reduces the graph to 18,689 triples and produces a small TR decrease but a DO increase. This suggests that weak-evidence rules contribute additional coverage for TR, whereas DO relations benefit more from stricter syntactic evidence.
The filtering ablations further illustrate the density–fidelity trade-off. Removing confidence filtering (V5, ) increases the graph to 54,293 triples but decreases both TR and DO MRR, indicating that low-confidence triples introduce structural noise. In contrast, strict filtering (V6, ) improves MRR in this small evaluation setting, especially for DO, but it removes 61.4% of retained triples relative to V0 and therefore increases coverage bias. For this reason, is retained as a practical density–fidelity trade-off, with additional threshold sensitivity reported in Section 4.7.2.
The temporal ablation evaluates the role of deterministic time-weighted edge construction. V7 removes and treats the graph as static. This produces a TR MRR decrease of −0.035 but a DO MRR decrease of only −0.002. The asymmetric effect suggests that recency-weighted edges are more useful for ranking WF → EO trigger relations, where recently emerging weakness-outcome patterns matter more, while EO → EP prerequisite relations are relatively more stable across snapshots. This result should not be interpreted as evidence for learnable temporal attention, because VulnTEC does not use a learnable temporal-attention module.
Overall, the ablation study shows bounded but non-negligible error propagation across the pipeline. The largest single MRR change across all variants is +0.083 for the DO relation in V6, indicating that no individual variant produces an absolute MRR change exceeding 0.085. The results indicate that VulnPattern-TKG’s ranking behavior is shaped jointly by domain-specific representation, conservative relation extraction, confidence filtering, and deterministic temporal weighting, rather than by a single dominant component. These findings complement the manual precision validation in Section 4.2, the candidate-space analysis in Section 4.4, the operational priority evaluation in Section 4.6, and the robustness analyses in Section 4.7.1, Section 4.7.2 and Section 4.7.3.
4.6. Operational Top-K Ranking Evaluation
The operational Top-K evaluation is conducted at the query level. Each query corresponds to a distinct head-relation context for which at least one novel relation-level triple appears in the prediction-target snapshots . The evaluation contains nine distinct (h, triggers) query contexts and six distinct (h, depends_on) query contexts. For each query, all relation-compatible candidate tails are ranked under the time-filtered protocol described in Section 4.1. The rankings in this section are computed using alone, which is ranking-equivalent to the embedding score under a monotonic sigmoid transformation. Therefore, the reported Top-K results evaluate the operational separability of the embedding-based forecasting signal, not the full internal four-component priority score. The present Top-K evaluation therefore reflects -only ranking; the use of , , and for calibrated priority scoring is discussed in Section 4.7.4. is the proportion of Top-K candidates that match observed novel tails, ARG summarizes rank improvement over the theoretical random baseline, and PSR expresses the achieved average rank gain as a proportion of the maximum possible gain relative to the theoretical random baseline (0% for random ranking, 100% for ideal top-rank placement). ARG and PSR are retained as supplementary descriptive indicators rather than as primary evidence of deployment readiness.
For the triggers relation, VulnTEC achieves over nine operational query contexts, while the theoretical random baseline reaches . This result indicates that the -based ranking differs descriptively from random ordering. However, because the query set is small and the candidate tail space is compact, the result should not be interpreted as statistically validated operational readiness. The PSR of 77.78% reflects the normalized rank gain achieved over the theoretical random baseline across the nine triggers query contexts. Six query contexts achieved , two achieved partial coverage and one query context, Resource_Management, failed to place any observed novel tail within the Top-3 list. ARG and PSR are therefore used only as supplementary indicators of analyst-side review efficiency. Figure 6 summarizes the operational ranking behavior under -only evaluation, reporting the cumulative detection rate across review depth K, the average ranking gain, and the pattern success rate as descriptive analyst-side indicators that do not validate deployment-stage remediation priority.
Figure 6.
Operational ranking performance under -only evaluation: (a) cumulative detection rate across candidate-review depth , (b) average ranking gain (ARG), and (c) pattern success rate (PSR), a baseline-normalized rank-gain indicator (0% for random ranking). These descriptive indicators summarize analyst-side Top-K review behavior and do not validate deployment-stage remediation priority. In panel (a), the symbol “#” denotes the number of candidates reviewed.
A secondary query-level analysis for the depends_on relation shows a larger descriptive separation from random ranking. VulnTEC achieves over six (h, depends_on) query contexts, compared with the theoretical random baseline of . This suggests that EO → EP prerequisite ranking provides a more informative operational setting than the highly constrained triggers tail space. Nevertheless, this result is also reported descriptively because the number of query contexts remains limited. It should not be interpreted as validation of a deployment-stage remediation priority policy.
The query-level operational metrics in Table 16 should not be directly compared with the instance-level MRR results in Table 13. In Section 4.4, each novel triple instance is evaluated as a separate ranking query. In contrast, Table 16 aggregates results by distinct head-relation context , and each query may contain multiple relevant novel tails. A query-level Top-K success therefore reflects whether at least one relevant tail is placed within the candidate shortlist, whereas instance-level MRR measures the average reciprocal rank of individual triple instances. The larger apparent separation in Table 16 should therefore be understood as analyst-side shortlist utility, not as per-triple ranking superiority.
Table 16.
Top-K operational ranking results using -only scoring. Query contexts: n = 9 for triggers and n = 6 for depends_on.
From a deployment perspective, the operational Top-K ranking is intended as an analyst-side review aid rather than an automated remediation order. Given a new CVE description, the pipeline can produce ranked candidate tails for relation-level review, allowing analysts to inspect a small Top-K shortlist instead of the full relation-compatible candidate space. However, because the retrospective evaluation contains only nine triggers query contexts and six depends_on query contexts, the deployment implication is limited to analyst-side review potential under a small-scale retrospective setting. Calibration with external exploit intelligence, organization-specific risk appetite, and weight-sensitive priority scoring is discussed in Section 5 and examined through the priority-score weight-sensitivity framework in Section 4.7.4.
4.7. Sensitivity Analysis and Stability Verification
Section 4.7 reports robustness and sensitivity analyses for the main design choices of VulnPattern-TKG. Because the novel-only evaluation set is small, these analyses are intended as descriptive robustness checks rather than formal statistical evidence of model superiority. The section examines four aspects: seed-level stability, confidence-threshold sensitivity, Node2Vec hyperparameter sensitivity, and deployment-stage priority-score weight sensitivity. The first three analyses evaluate the embedding-based forecasting component, whereas Section 4.7.4 formalizes the priority-score weight-sensitivity framework introduced in Section 3.3.
4.7.1. Seed-Level Stability and Descriptive Uncertainty
To assess the sensitivity of VulnTEC to random seed initialization, five independent runs with seeds were conducted under both the novel-only and all-triples evaluation protocols. Table 17 reports the novel-only seed-level comparison with TComplEx and the all-triples stability results for VulnTEC.
Table 17.
Seed stability under five random seeds for novel-only and all-triples evaluation protocols.
Under the novel-only protocol which matches the evaluation conditions of Table 13, VulnTEC achieved a mean triggers MRR of , compared with TComplEx’s . VulnTEC showed the highest mean MRR among the compared learned models, but the seed-level comparison is reported only as descriptive robustness evidence because of the small number of paired observations . As discussed in Section 4.4, a two-tailed Wilcoxon signed-rank test with five paired observations has a lower bound of approximately even under perfect directional agreement.
Under the all-triples protocol, the evaluation set contains 4063 triggers instances and 7421 depends_on instances, yielding 11,484 combined TR+DO instances. The mean MRR increases to 0.561 for triggers and 0.361 for depends_on, because recurring relations whose patterns have already appeared during training are inherently easier to rank. The higher standard deviation reflects the sensitivity of Node2Vec random-walk initialization on the compact 26-node Knowledge Layer. The bootstrap 95% confidence interval over the five seeds is [0.474, 0.649] for triggers and [0.294, 0.428] for depends_on. The all-triples intervals are reported only as within-model stability indicators and should not be directly compared with the novel-only TComplEx results. Because retained per-seed raw rankings differ by evaluation protocol, the novel-only interval is reported from seed-level summary statistics, whereas the all-triples interval is estimated by bootstrap resampling over the retained seed-level results.
4.7.2. Confidence-Threshold Sensitivity
To examine how the confidence-filtering threshold affects downstream ranking, the all-triples MRR is reported across nine threshold values . Because each setting modifies the upstream graph density, and are reported alongside the resulting MRR. Adjacent threshold values produce identical retained graph structures in this compact category-level graph; therefore, the thresholds are grouped into three plateaus. Table 18 reports the performance and graph scale under different confidence-threshold plateaus.
Table 18.
Performance and graph scale under threshold plateaus.
Three plateaus are observed corresponding to the three distinct values of produced by the filtering threshold. The default configuration achieves the highest balanced performance across both relations under the all-triples protocol. The no-filter setting yields slightly lower triggers MRR and substantially lower depends_on MRR than the default, indicating that low-confidence triples introduce noise that disproportionately affects prerequisite ranking. The strict setting improves depends_on MRR but loses 61.4% of retained triples relative to the default, increasing coverage bias and reducing graph density. This behavior is consistent with the V5 and V6 filtering variants discussed in Section 4.5. The default is therefore retained as a practical density–fidelity trade-off, with threshold-induced isolation effects discussed further in Section 5.
4.7.3. Node2Vec Hyperparameter Sensitivity
This subsection reports the sensitivity of VulnTEC to three Node2Vec hyperparameters: embedding dimension , walk length , and the return and in–out parameters . All results are produced under a single-seed setting and using the all-triples evaluation protocol. The default configuration is , , and , yielding and .
For the embedding dimension, TR MRR converges from onwards and remains stable at . Therefore, is retained as a conservative default that ensures convergence with limited additional cost. For walk length, longer walks yield a slightly higher TR MRR but substantially lower DO MRR than the default. On a compact 26-node graph, longer random walks are also more likely to revisit the same local neighborhoods repeatedly, especially in the presence of bidirectional co_occurs edges. Thus, is retained as a practical balance between structural coverage and the risk of echo-chamber-like over-repetition. For the parameters, no setting simultaneously dominates both relations. We do not select the setting despite its high TR MRR because it substantially reduces DO MRR and therefore over-specializes the walk behavior to one relation type. The default provides the most relation-neutral random-walk configuration and is retained as the practical default. These results also indicate that the deterministic time-weighted edge construction described in Section 3.2 is compatible with a range of random-walk configurations rather than depending on a single fine-tuned setting. Figure 7c extends the exploration to a 5 × 5 grid covering ; Table 19 reports the 3 × 3 sub-grid within for compactness.
Figure 7.
Node2Vec hyperparameter sensitivity of VulnTEC under the single-seed all-triples evaluation protocol. (a) Embedding dimension d, (b) walk length L, and (c) TR MRR heatmap for search-bias parameters . TR and DO denote the triggers and depends_on relations, respectively. The selected default configuration (d = 64, L = 30, p = q = 1.0) is marked in each panel. The default setting is chosen as a balanced configuration across TR and DO rather than as the single-metric optimum for TR MRR; DO values for are reported in Table 19. In panels (a,b), the red dashed lines indicate the selected default values used in the main experiments. In panel (c), the red frame highlights the selected default (p, q) configuration used in the main experiments.
Table 19.
Node2Vec hyperparameter sensitivity under single-seed all-triples evaluation.
4.7.4. Priority-Score Weight Sensitivity Framework
The operational Top-K evaluation in Section 4.6 uses -only ranking to isolate the embedding-based forecasting signal. However, the internal priority score defined in Section 3.3 integrates four components: , , , and . This subsection characterizes how the priority ranking may change when the four-component weights are varied around the neutral equal-weight setting.
Because is a convex combination of four bounded components, increasing a component weight increases the contribution of the corresponding component to each candidate score. The resulting rank order depends on the component-level correlation structure across candidates. Two boundary cases are therefore informative. First, -only weighting coincides with the embedding-based ranking analyzed in Section 4.6. Second, the equal-weight default makes each component contribute equally, representing a calibration-neutral compromise across forecasting confidence, temporal rise, EP prevalence-risk proxy, and extraction reliability.
Table 20 lists representative weight configurations and their role in the present study. The -only and equal-weight settings are directly used or defined in the current manuscript, whereas the four component-emphasis configurations are identified as future deployment-stage calibration targets. Full empirical sensitivity analysis, including Kendall’s across a fine-grained weight grid, requires the operational deployment of , , and at the candidate level and is therefore left to future work in Section 5.
Table 20.
Representative priority-score weight configurations.
In the present retrospective evaluation, the equal-weight default is adopted as a calibration-neutral configuration that does not embed any specific organizational preference. Weight calibration based on organizational risk appetite, external exploit intelligence, or historical breach data is discussed in Section 5 as an adaptive priority learning direction.
The four sensitivity analyses together support a cautious interpretation of VulnTEC’s performance. The seed analysis provides descriptive uncertainty estimates, the threshold analysis identifies as a density–fidelity trade-off, the hyperparameter analysis supports , , and as balanced defaults, and the priority-weight framework clarifies that the operational Top-K results in Section 4.6 correspond to the -only boundary case rather than the full four-component priority score.
5. Conclusions
This study proposed VulnPattern-TKG, an end-to-end temporal knowledge graph framework for forecasting CVE-derived vulnerability-pattern relation emergence from CVE description text. The framework is designed to support analyst-side review of forecasted vulnerability-pattern relations, not to predict the real-world exploitation of individual CVEs or to replace external exploit intelligence, asset criticality, or organization-specific risk policy.
First, the proposed pipeline extracts Weakness Factor (WF), Exploitation Outcome (EO), and Exploitation Prerequisite (EP) entities, together with triggers, depends_on, and co_occurs relations, from CVE description text. By combining SecureBERT+CRF-based entity extraction, dependency-parsing-based relation rules, and four-stage hierarchical standardization, the pipeline maps diverse surface forms into a compact 26-category Knowledge Layer. From 205,600 NVD CVE descriptions published between 2014 and 2024, the final confidence-filtered graph contains 48,371 triples. This compact representation reduces surface-form fragmentation and enables relation-level forecasting, while also introducing coverage limitations for rare or isolated categories.
Second, VulnTEC was introduced as a lightweight confidence- and time-weighted Node2Vec graph embedding framework for compact CVE-derived temporal knowledge graphs. VulnTEC incorporates extraction confidence and deterministic temporal weighting into edge weights and ranks relation-compatible candidate tails using cosine similarity over shared node embeddings. Under the novel-only triggers evaluation, VulnTEC achieved a mean MRR of 0.410 ± 0.020, but the theoretical random baseline already reached 0.408 because the EO candidate space contains only six categories. Therefore, this result should be interpreted as directional ranking evidence under a compact candidate space rather than as statistically confirmed model superiority. The depends_on relation provides a more informative comparison because its candidate space is larger and the corresponding random baseline is lower, with a theoretical random MRR of 0.340.
Third, the ablation and sensitivity analyses show that the framework’s ranking behavior is shaped jointly by domain-specific representation, conservative relation extraction, confidence filtering, and deterministic temporal weighting. No single component dominates performance. The confidence-threshold analysis supports as a practical density–fidelity trade-off, and the Node2Vec sensitivity analysis supports , walk length , and as balanced defaults rather than single-metric optima. Seed-level and split-robustness analyses provide descriptive uncertainty estimates, but they should not be interpreted as formal evidence of statistical superiority.
Fourth, this study defined an internal four-component priority-score framework for analyst-side review, integrating , , , and . The retrospective operational Top-K evaluation used -only ranking to isolate the embedding-based forecasting signal. VulnTEC showed descriptive Top-K separation from random ordering, reaching Precision@3 = 0.778 for triggers and Precision@3 = 1.000 for depends_on under nine and six operational query contexts, respectively. However, these results are based on small query sets and should not be interpreted as validation of deployment-stage remediation priority. The equal-weight priority configuration is treated as a calibration-neutral reference, while empirical weight calibration remains for future work.
This study has several limitations. First, the fixed 26-category inventory limits coverage for emerging vulnerability types that do not align with the current vocabulary, and four categories remain isolated during the training period. Second, the novel-only evaluation set is small, which limits statistical power and prevents strong claims of model superiority. With only five paired seed-level observations, the two-tailed Wilcoxon signed-rank test has a structural lower bound of approximately even under perfect directional agreement. Third, the study uses CVE description text only and does not evaluate against external exploitation evidence such as CISA KEV, ExploitDB, EPSS, telemetry, or asset-exposure data. Fourth, SecureBERT may contain representation-level temporal priors from its pretraining corpus, although graph-level test leakage is controlled by the time-filtered evaluation protocol. Fifth, the annual snapshot granularity may obscure finer-grained vulnerability-pattern dynamics. Manual validation further shows that EO boundary truncation and implicit prerequisite cues, especially user-interaction-related expressions, remain important sources of extraction error. Finally, the extraction rules are designed for structurally consistent NVD CVE descriptions and may not directly generalize to noisier CTI sources.
Future work should address these limitations by exploring dynamic vocabulary expansion and open-vocabulary mapping, integrating external exploit intelligence and asset-context signals, calibrating priority-score weights for organization-specific risk profiles, evaluating quarterly or monthly snapshots, and expanding baseline comparisons with sparse-TKG models and temporal heuristic baselines. Fully time-isolated language-model training could also be investigated to reduce representation-level temporal prior effects.
Overall, these limitations clarify the appropriate scope within which the findings of this study should be interpreted. VulnPattern-TKG should be read as a conservative relation-level forecasting framework over CVE-derived vulnerability-pattern categories, rather than as an exploitability predictor for individual CVEs or a deployment-stage remediation prioritization system. In particular, for the triggers relation, the margin over the theoretical random baseline is very small in the compact six-EO candidate space; the novel-only evaluation set is small , which precludes strong claims of statistically significant model superiority; SecureBERT may introduce a representation-level temporal prior with respect to the evaluation timeline; and applying Node2Vec to a compact 26-node graph limits the discriminative structure that can be encoded. Within this scope, however, the study contributes to the research debate in three ways. First, it demonstrates how large-scale CVE description text can be transformed into a standardized temporal knowledge graph for relation-level vulnerability-pattern emergence forecasting. Second, it shows how confidence- and time-weighted graph embeddings can be applied to compact security temporal knowledge graphs while explicitly accounting for compact candidate-space effects and theoretical random baselines. Third, it provides a transparent evaluation and reporting framework that distinguishes novel triple-level evidence, query-level ranking evidence, and methodological limitations. Thus, despite the restricted candidate space, small novel-only evaluation set, fixed vocabulary, and absence of external exploitation labels, this study provides a reproducible and cautiously interpreted framework for analyst-supporting vulnerability-pattern relation emergence forecasting.
Supplementary Materials
The following supporting information can be downloaded at: https://www.mdpi.com/article/10.3390/electronics15132874/s1, Supplementary Reproducibility Package for VulnPattern-TKG, including standardized category mappings, confidence-filtered snapshot-level triples, aggregated extraction confidence scores, temporal split definitions, manual validation annotations underlying Table 9 and Table 10, a supplementary manifest, and lightweight evaluation helper scripts.
Author Contributions
Conceptualization, H.K. and J.C.; methodology, H.K.; software, H.K.; validation, H.K., P.K. and J.C.; formal analysis, H.K.; investigation, H.K.; data curation, H.K.; writing—original draft preparation, H.K.; writing—review and editing, P.K. and J.C.; visualization, H.K.; supervision, J.C.; project administration, J.C. All authors have read and agreed to the published version of the manuscript.
Funding
This research was supported by research funding from Chosun University, 2022 (Grant No. K206934008).
Data Availability Statement
The raw CVE description data used in this study are publicly available from the National Vulnerability Database (NVD) at https://nvd.nist.gov/ (accessed on 10 March 2026). The derived artifacts generated in this study, including standardized category mappings, confidence-filtered snapshot-level triples comprising 48,371 triples, aggregated extraction confidence scores, temporal split definitions, and the human-verified manual validation annotations underlying Table 9 and Table 10, are provided as Supplementary Materials. Evaluation helper scripts are included to support reproducibility checks of the released artifacts. Additional implementation scripts for preprocessing, graph construction, and full experiment reproduction are available from the corresponding author upon reasonable request.
Conflicts of Interest
The authors declare no conflicts of interest.
Abbreviations
The following abbreviations are used in this manuscript:
| ARG | Average Rank Gain |
| CRF | Conditional Random Field |
| CVE | Common Vulnerabilities and Exposures |
| EO | Exploitation Outcome |
| EP | Exploitation Prerequisite |
| KG | Knowledge Graph |
| KGE | Knowledge Graph Embedding |
| MRR | Mean Reciprocal Rank |
| NVD | National Vulnerability Database |
| PSR | Pattern Success Rate |
| TKG | Temporal Knowledge Graph |
| VulnTEC | Vulnerability Temporal Embedding with Confidence Weighting |
| WF | Weakness Factor |
References
- National Institute of Standards and Technology (NIST). National Vulnerability Database (NVD). Available online: https://nvd.nist.gov/ (accessed on 10 March 2026).
- FIRST. Common Vulnerability Scoring System Version 3.1: Specification Document. Available online: https://www.first.org/cvss/v3.1/specification-document (accessed on 10 March 2026).
- Jacobs, J.; Romanosky, S.; Edwards, B.; Roytman, M.; Adjerid, I. Exploit Prediction Scoring System (EPSS). Digit. Threat. Res. Pract. 2021, 2, 1–17. [Google Scholar] [CrossRef] [Scilit]
- Sun, N.; Ding, M.; Jiang, J.; Xu, W.; Mo, X.; Tai, Y.; Zhang, J. Cyber Threat Intelligence Mining for Proactive Cybersecurity Defense: A Survey and New Perspectives. IEEE Commun. Surv. Tutor. 2023, 25, 1748–1774. [Google Scholar] [CrossRef] [Scilit]
- Aghaei, E.; Niu, X.; Shadid, W.; Al-Shaer, E. SecureBERT: A Domain-Specific Language Model for Cybersecurity. In Proceedings of the 18th EAI International Conference on Security and Privacy in Communication Networks (SecureComm), Virtual, 17–19 October 2022; Springer: Cham, Switzerland, 2023; Volume 462, pp. 39–56. [Google Scholar]
- Grover, A.; Leskovec, J. node2vec: Scalable Feature Learning for Networks. In Proceedings of the 22nd ACM SIGKDD International Conference on Knowledge Discovery and Data Mining, San Francisco, CA, USA, 13–17 August 2016; Association for Computing Machinery: New York, NY, USA, 2016; pp. 855–864. [Google Scholar] [CrossRef] [Scilit] [PubMed]
- Liu, K.; Wang, F.; Ding, Z.; Liang, S.; Yu, Z.; Zhou, Y. Recent Progress of Using Knowledge Graph for Cybersecurity. Electronics 2022, 11, 2287. [Google Scholar] [CrossRef] [Scilit]
- Sikos, L.F. Cybersecurity Knowledge Graphs. Knowl. Inf. Syst. 2023, 65, 3511–3543. [Google Scholar] [CrossRef] [Scilit]
- Offensive Security. Exploit Database. Available online: https://www.exploit-db.com/ (accessed on 10 March 2026).
- Strom, B.E.; Applebaum, A.; Miller, D.P.; Nickels, K.C.; Pennington, A.G.; Thomas, C.B. MITRE ATT&CK: Design and Philosophy; Technical Report MP-19-01; The MITRE Corporation: McLean, VA, USA, 2020. [Google Scholar]
- MITRE Corporation. Common Weakness Enumeration (CWE). Available online: https://cwe.mitre.org/ (accessed on 10 March 2026).
- Bordes, A.; Usunier, N.; Garcia-Duran, A.; Weston, J.; Yakhnenko, O. Translating Embeddings for Modeling Multi-relational Data. In Proceedings of the 26th International Conference on Neural Information Processing Systems (NIPS), Lake Tahoe, NV, USA, 5–10 December 2013; Curran Associates Inc.: Red Hook, NY, USA, 2013; pp. 2787–2795. [Google Scholar]
- Sun, Z.; Deng, Z.-H.; Nie, J.-Y.; Tang, J. RotatE: Knowledge Graph Embedding by Relational Rotation in Complex Space. In Proceedings of the International Conference on Learning Representations (ICLR), New Orleans, LA, USA, 6–9 May 2019. [Google Scholar]
- Sun, L.; Li, Z.; Xie, L.; Ye, M.; Chen, B. APTKG: Constructing Threat Intelligence Knowledge Graph from Open-Source APT Reports Based on Deep Learning. In Proceedings of the 5th International Conference on Data Science and Information Technology (DSIT), Shanghai, China, 22–24 July 2022; IEEE: Piscataway, NJ, USA, 2022; pp. 1–6. [Google Scholar]
- Li, Z.; Zeng, J.; Chen, Y.; Liang, Z. AttacKG: Constructing Technique Knowledge Graph from Cyber Threat Intelligence Reports. In Proceedings of the European Symposium on Research in Computer Security (ESORICS), Copenhagen, Denmark, 26–30 September 2022; Springer: Cham, Switzerland, 2022; pp. 589–609. [Google Scholar]
- Ferrari, I.; Frisoni, G.; Italiani, P.; Moro, G.; Sartori, C. Comprehensive Analysis of Knowledge Graph Embedding Techniques Benchmarked on Link Prediction. Electronics 2022, 11, 3866. [Google Scholar] [CrossRef] [Scilit]
- Rastogi, N.; Dutta, S.; Gittens, A.; Zaki, M.J.; Aggarwal, C. TINKER: A Framework for Open Source Cyberthreat Intelligence. In Proceedings of the IEEE International Conference on Trust, Security and Privacy in Computing and Communications (TrustCom), Wuhan, China, 9–11 December 2022; IEEE: Piscataway, NJ, USA, 2022; pp. 1345–1352. [Google Scholar] [CrossRef] [Scilit]
- Li, H.; Shi, Z.; Pan, C.; Zhao, D.; Sun, N. Cybersecurity Knowledge Graph Construction and Quality Assessment. Complex Intell. Syst. 2024, 10, 1201–1217. [Google Scholar] [CrossRef] [Scilit]
- Ren, Y.; Xiao, Y.; Zhou, Y.; Zhang, Z.; Tian, Z. CSKG4APT: A Cybersecurity Knowledge Graph for Advanced Persistent Threat Organization Attribution. IEEE Trans. Knowl. Data Eng. 2023, 35, 5695–5709. [Google Scholar] [CrossRef] [Scilit]
- Liu, R.; Xie, Y.; Dang, Z.; Hao, J.; Quan, X.; Xiao, Y.; Peng, C. Dynamic Vulnerability Knowledge Graph Construction via Multi-Source Data Fusion and Large Language Model Reasoning. Electronics 2025, 14, 2334. [Google Scholar] [CrossRef] [Scilit]
- Sarhan, I.; Spruit, M. Open-CyKG: An Open Cyber Threat Intelligence Knowledge Graph. Knowl.-Based Syst. 2021, 233, 107524. [Google Scholar] [CrossRef] [Scilit]
- Zheng, S.; Yin, C.; Cao, Y.; Li, B. A Survey on Cybersecurity Knowledge Graph Construction. Comput. Secur. 2023, 136, 103524. [Google Scholar] [CrossRef] [Scilit]
- Alam, M.T.; Bhusal, D.; Park, Y.; Rastogi, N. CyNER: A Python Library for Cybersecurity Named Entity Recognition. In Proceedings of the IEEE International Conference on Intelligence and Security Informatics (ISI), Virtual, 2–3 November 2022. [Google Scholar]
- Sun, S.; Huang, C.; Wu, T.; Shen, Y. SecTKG: A Knowledge Graph for Open-Source Security Tools. Int. J. Intell. Syst. 2023, 2023, 4464974. [Google Scholar] [CrossRef] [Scilit]
- Yu, J.; Lu, Y.; Zhang, Y.; Xie, Y.; Cheng, M.; Yang, G. A Unified Model for Chinese Cyber Threat Intelligence Flat Entity and Nested Entity Recognition. Electronics 2024, 13, 4329. [Google Scholar] [CrossRef] [Scilit]
- Lacroix, T.; Obozinski, G.; Usunier, N. Tensor Decompositions for Temporal Knowledge Base Completion. In Proceedings of the International Conference on Learning Representations (ICLR), Virtual, 26 April–1 May 2020. [Google Scholar]
- Jin, W.; Qu, M.; Jin, X.; Ren, X. Recurrent Event Network: Autoregressive Structure Inference over Temporal Knowledge Graphs. In Proceedings of the Conference on Empirical Methods in Natural Language Processing (EMNLP), Virtual, 16–20 November 2020; Association for Computational Linguistics: Stroudsburg, PA, USA, 2020; pp. 6669–6683. [Google Scholar] [CrossRef] [Scilit]
- Han, Z.; Chen, P.; Ma, Y.; Tresp, V. DyERNIE: Dynamic Evolution of Riemannian Manifold Embeddings for Temporal Knowledge Graph Completion. In Proceedings of the Conference on Empirical Methods in Natural Language Processing (EMNLP), Virtual, 16–20 November 2020; Association for Computational Linguistics: Stroudsburg, PA, USA, 2020; pp. 7301–7316. [Google Scholar] [CrossRef] [Scilit]
- Cai, B.; Xiang, Y.; Gao, L.; Zhang, H.; Li, Y.; Li, J. Temporal Knowledge Graph Completion: A Survey. In Proceedings of the International Joint Conference on Artificial Intelligence (IJCAI), Macao, China, 19–25 August 2023; International Joint Conferences on Artificial Intelligence Organization: Marina Del Rey, CA, USA, 2023; pp. 6545–6553. [Google Scholar]
- Gastinger, J.; Sztyler, T.; Sharma, L.; Schuelke, A.; Stuckenschmidt, H. Comparing Apples and Oranges? On the Evaluation of Methods for Temporal Knowledge Graph Forecasting. In Proceedings of the European Conference on Machine Learning and Principles and Practice of Knowledge Discovery in Databases (ECML-PKDD), Turin, Italy, 18–22 September 2023. [Google Scholar]
- Li, T.; Wang, W.; Li, X.; Wang, T.; Zhou, X.; Huang, M. Embedding Uncertain Temporal Knowledge Graphs. Mathematics 2023, 11, 775. [Google Scholar] [CrossRef] [Scilit]
- Xu, H.; Bao, J.; Li, H.; He, C.; Chen, F. A Multi-View Temporal Knowledge Graph Reasoning Framework with Interpretable Logic Rules and Feature Fusion. Electronics 2024, 13, 742. [Google Scholar] [CrossRef] [Scilit]
- Lafferty, J.; McCallum, A.; Pereira, F.C.N. Conditional Random Fields: Probabilistic Models for Segmenting and Labeling Sequence Data. In Proceedings of the 18th International Conference on Machine Learning (ICML), Williamstown, MA, USA, 28 June–1 July 2001; Morgan Kaufmann Publishers Inc.: San Francisco, CA, USA, 2001; pp. 282–289. [Google Scholar]
- Explosion AI. spaCy: Industrial-Strength Natural Language Processing in Python. Available online: https://spacy.io/ (accessed on 10 March 2026).
- MITRE Corporation. CVE Numbering Authority (CNA) Rules, Version 3.0. Available online: https://www.cve.org/ResourcesSupport/AllResources/CNARules (accessed on 10 March 2026).
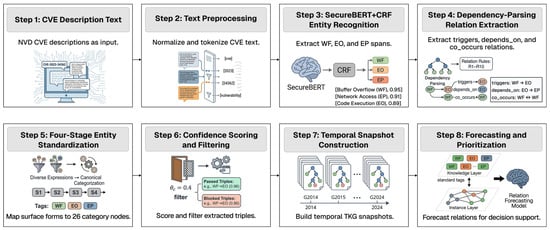
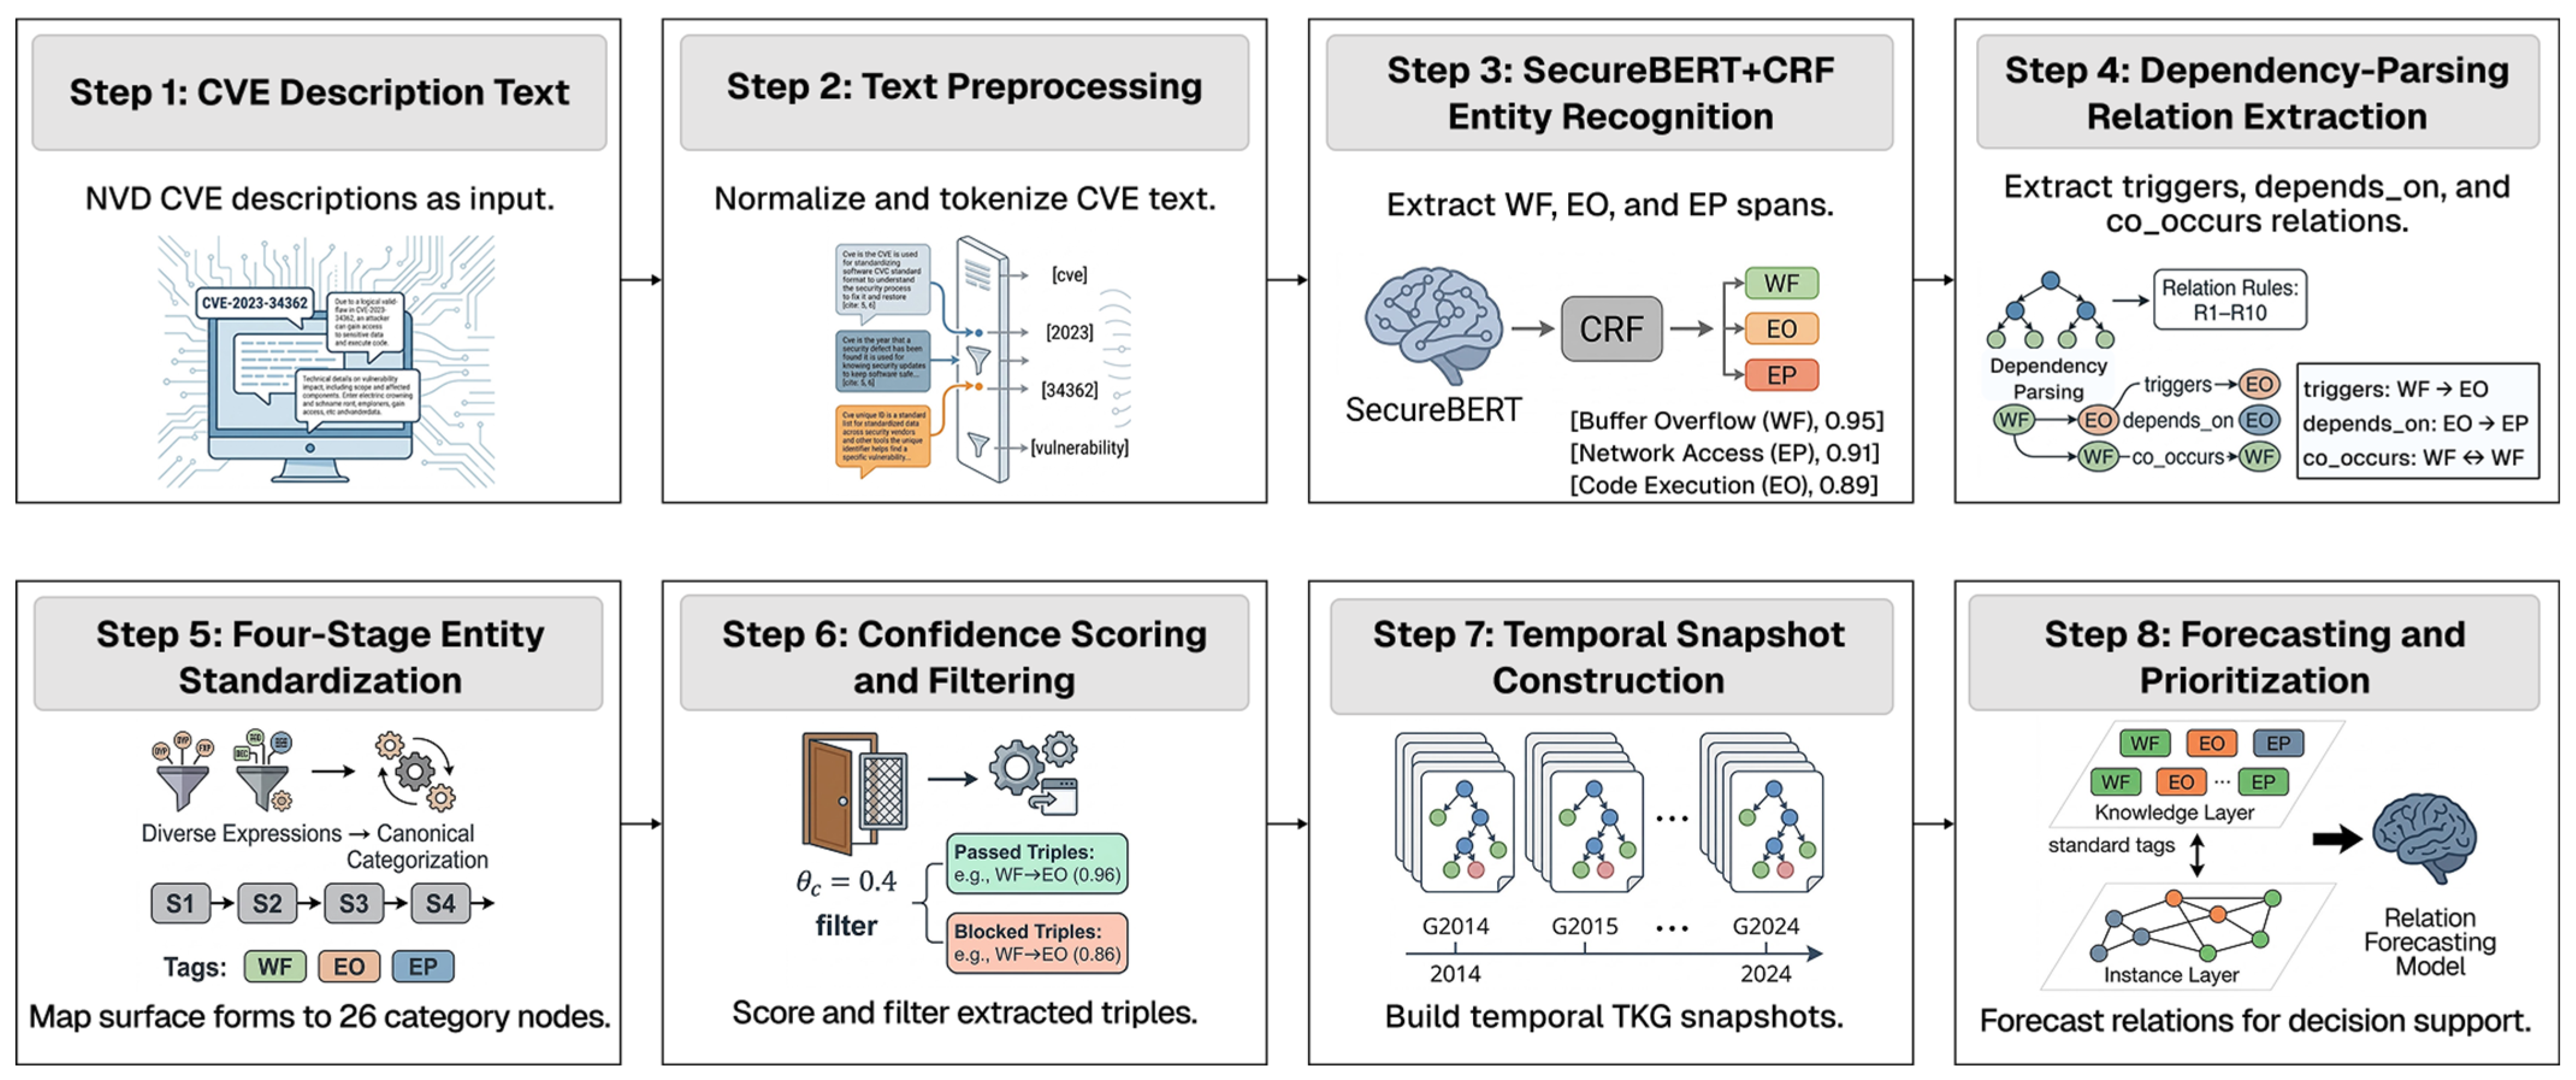
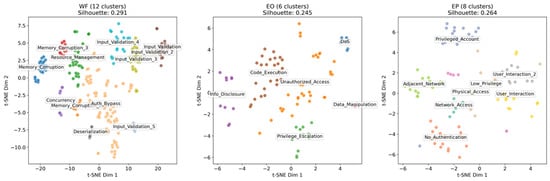
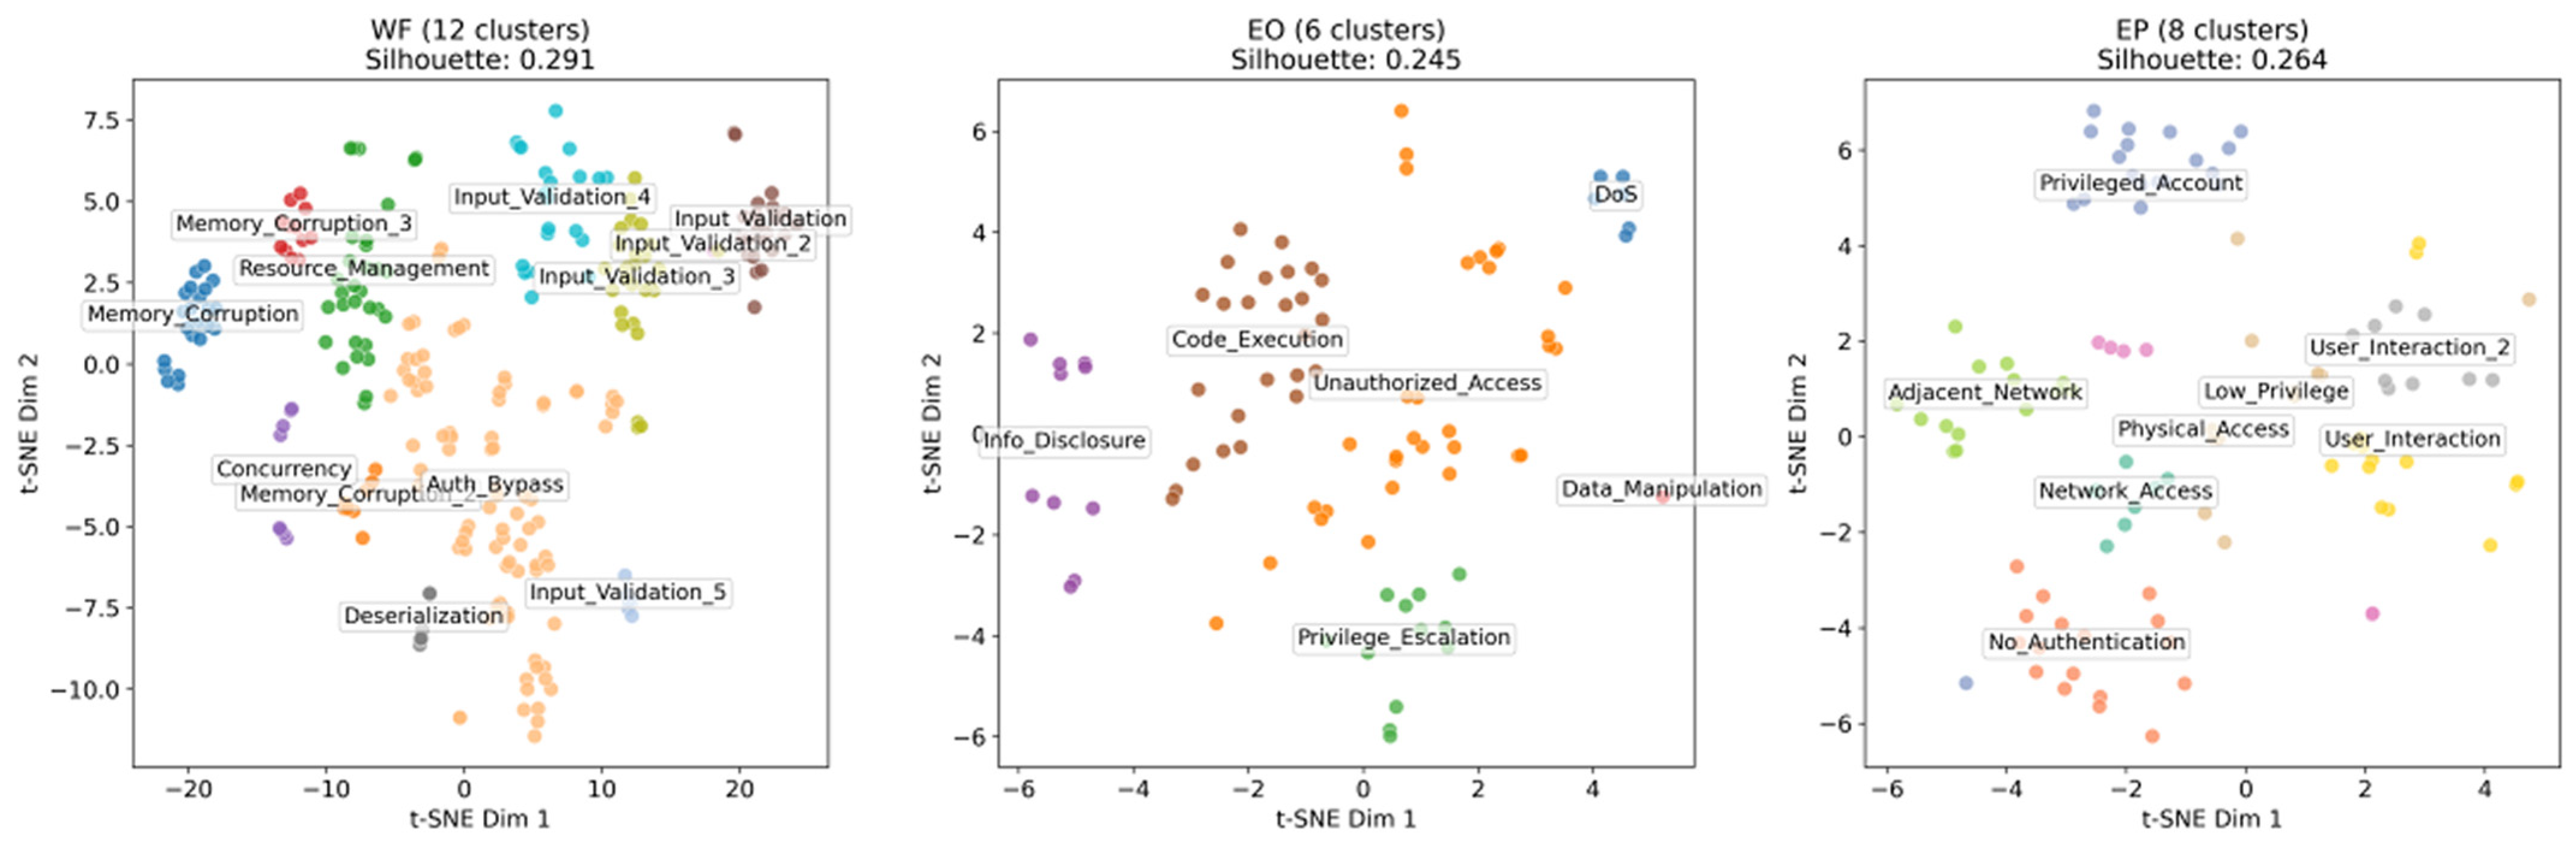
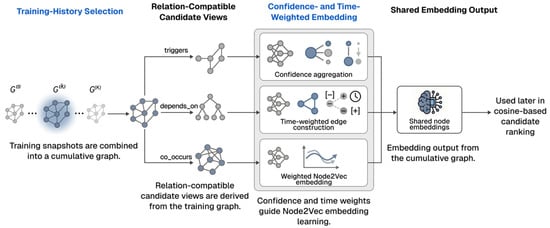
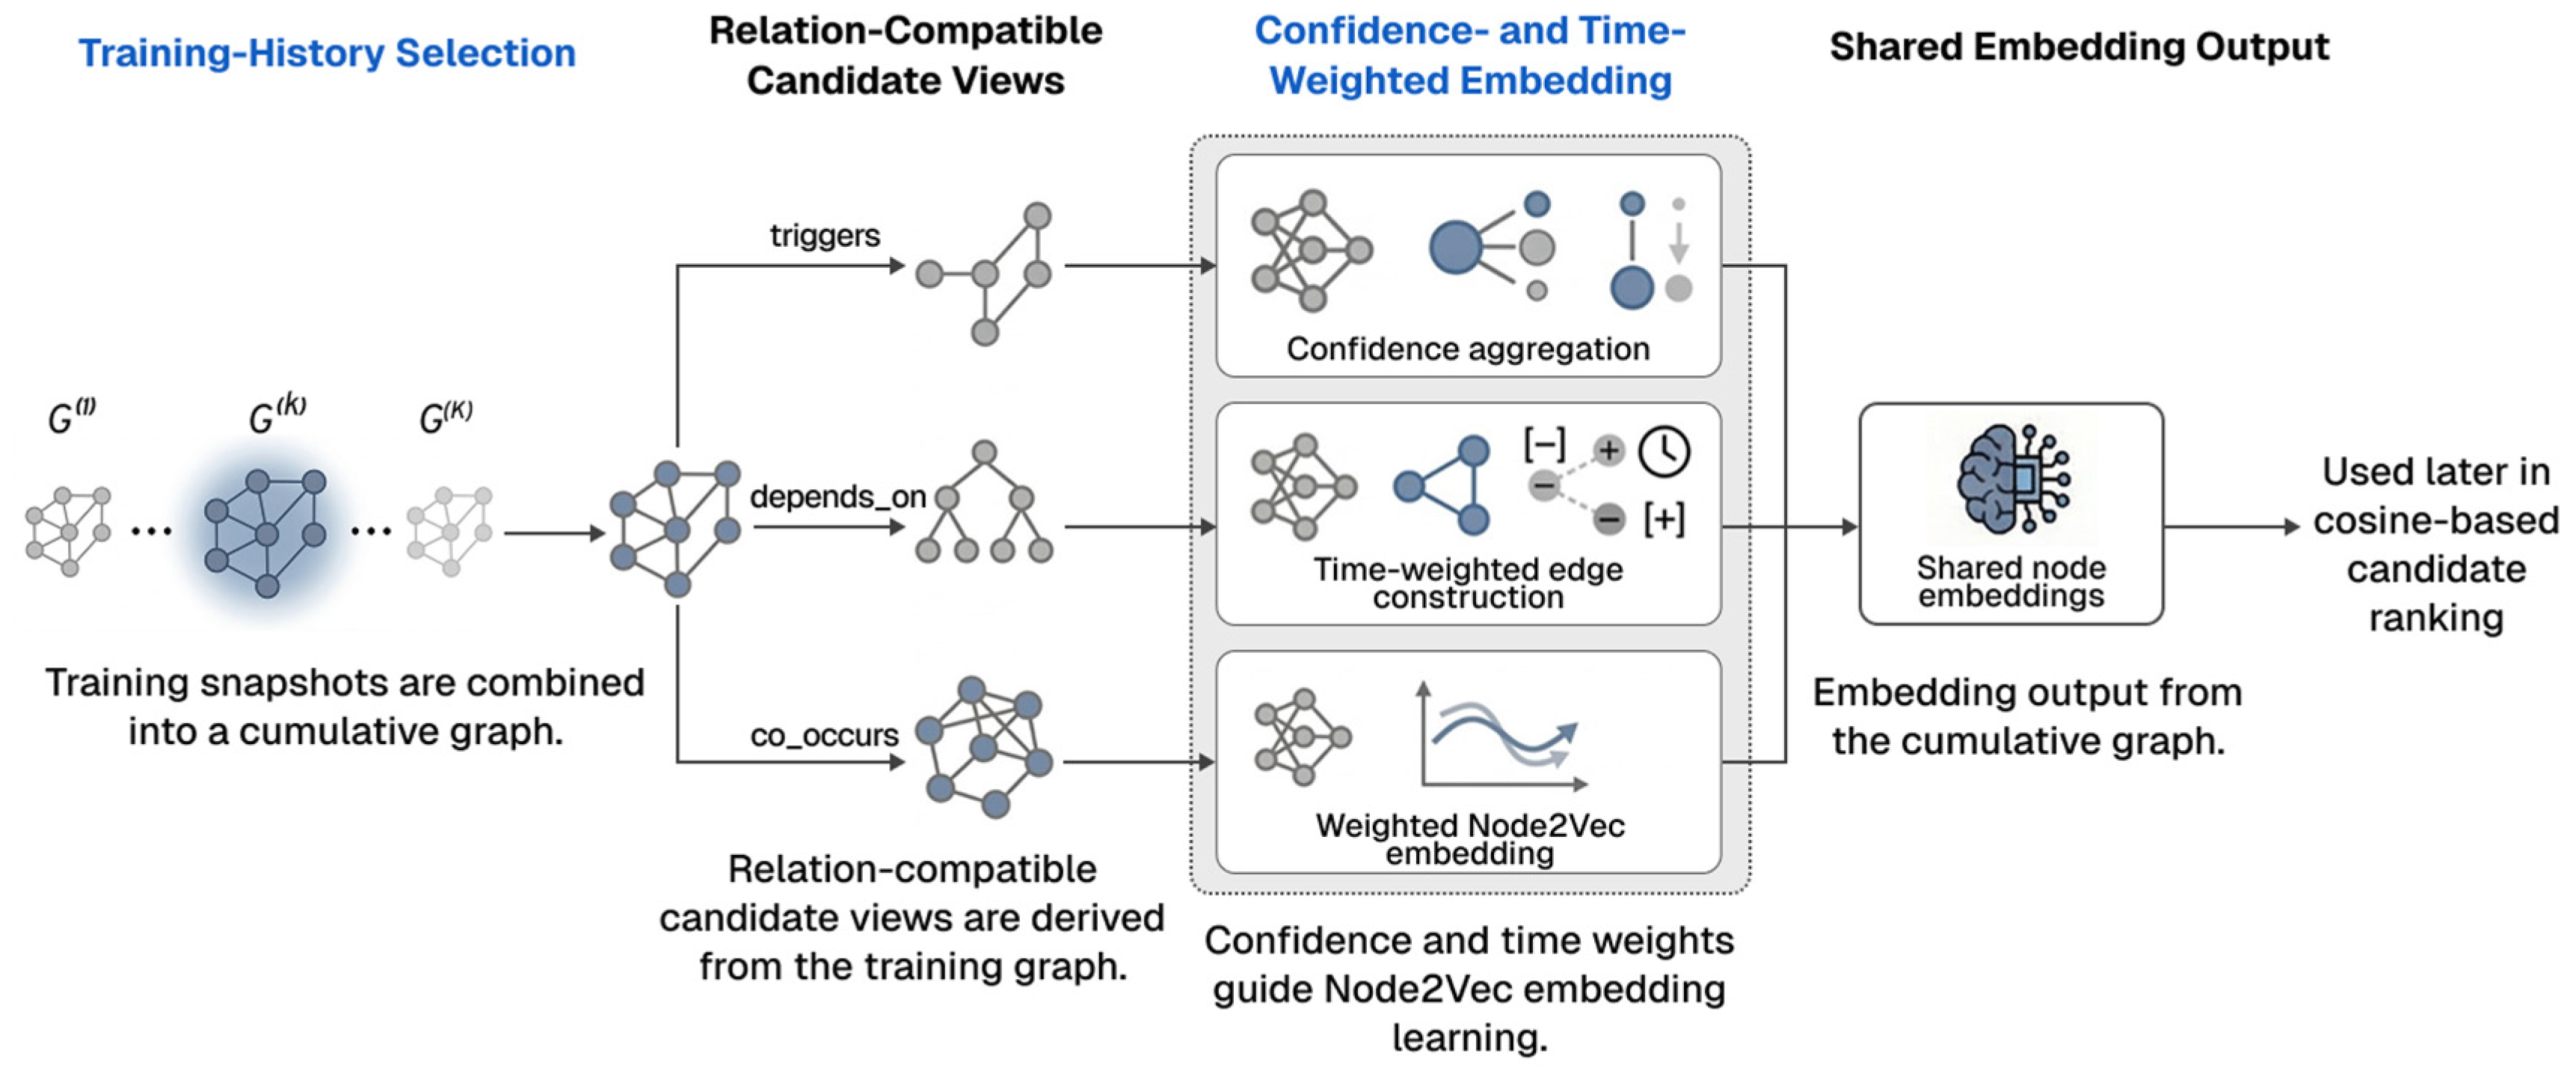
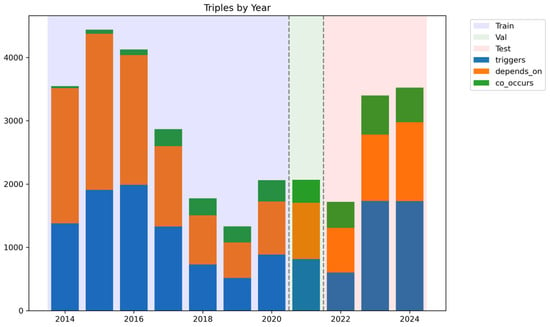
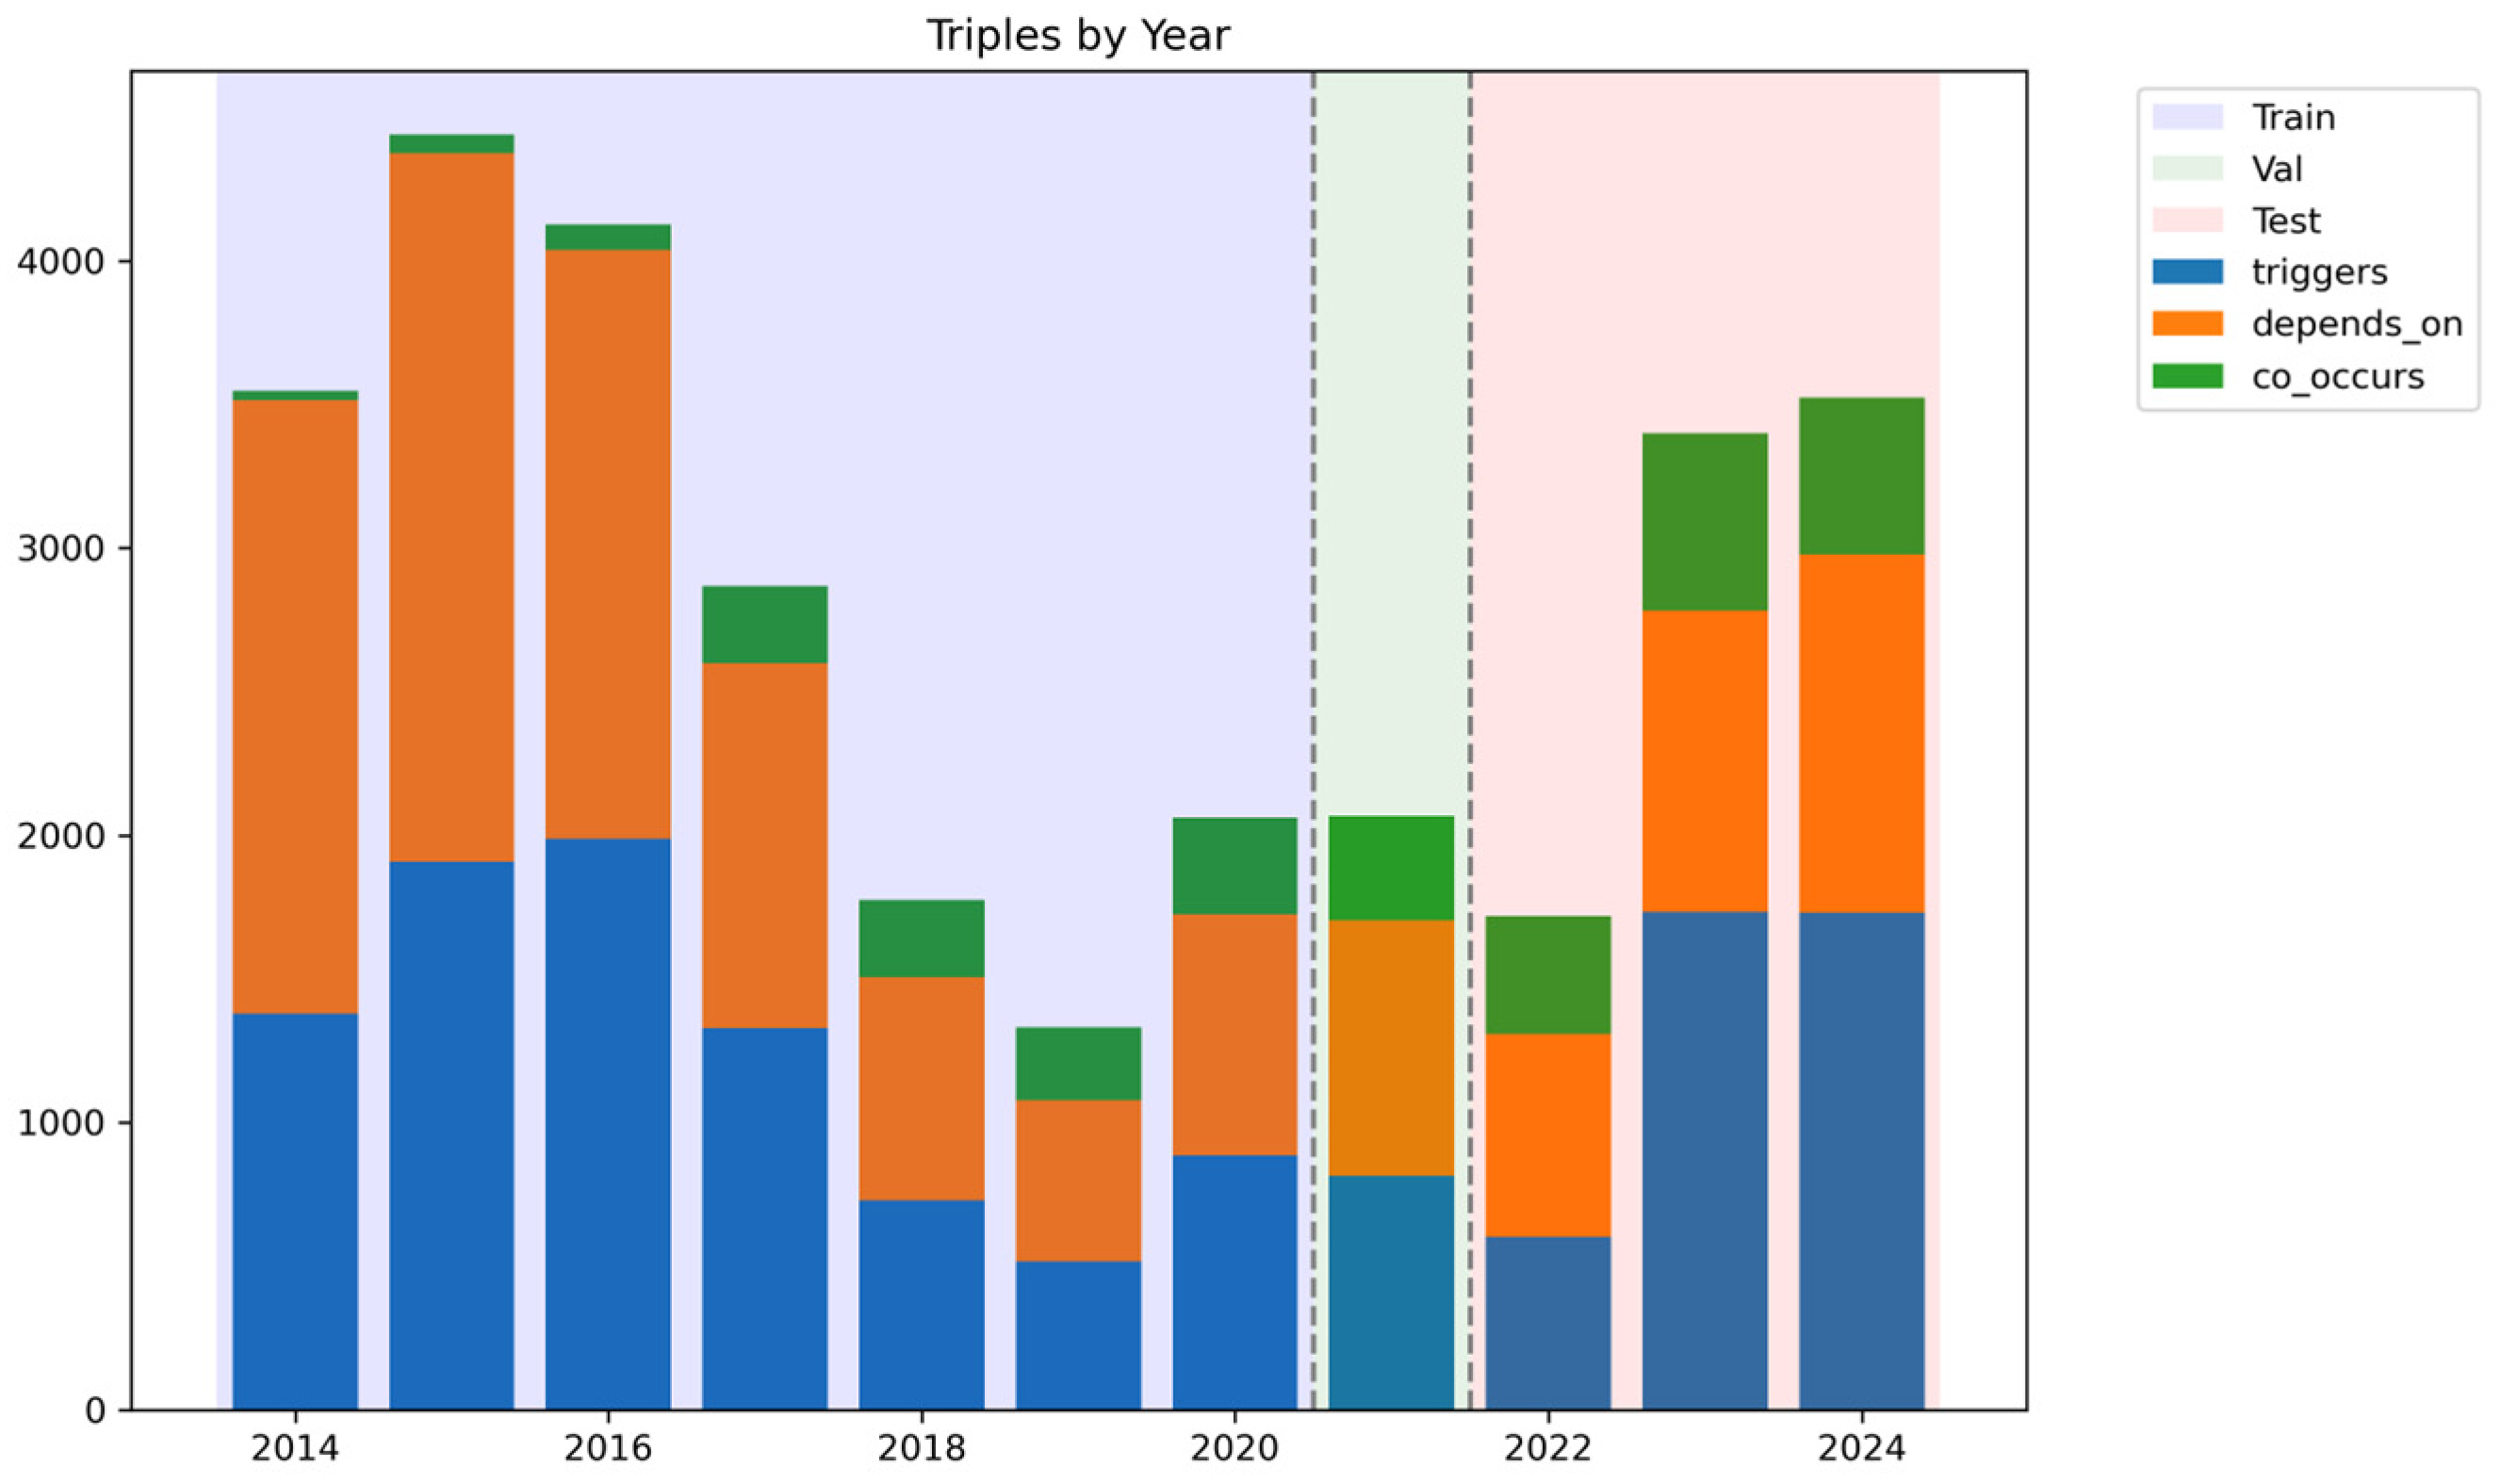
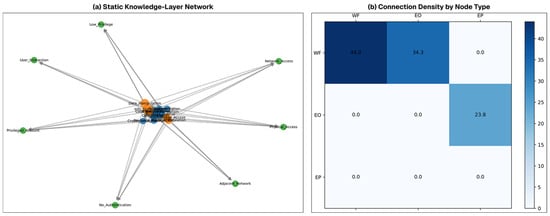
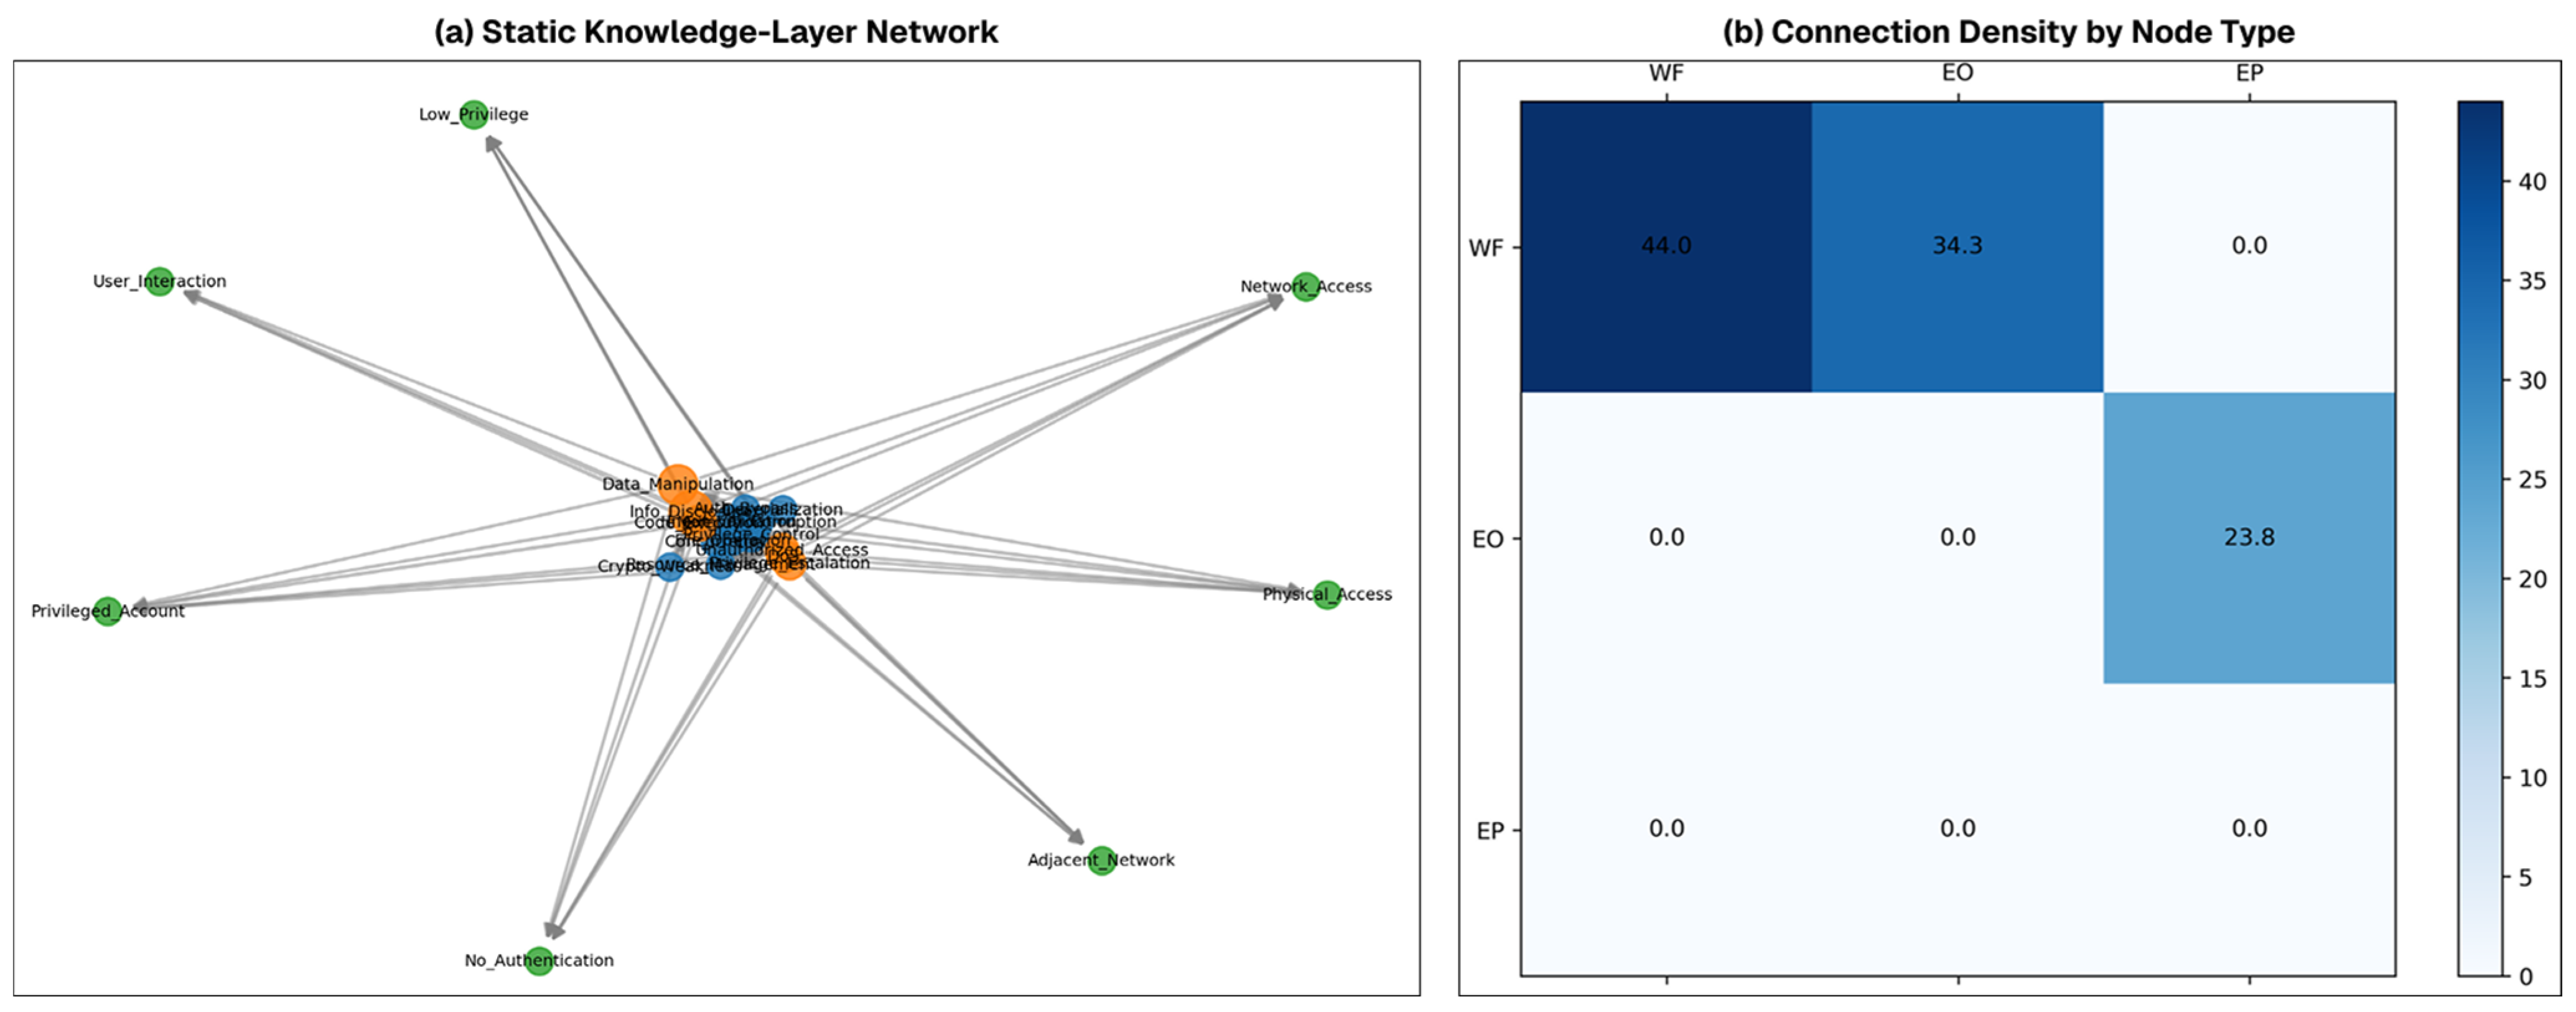
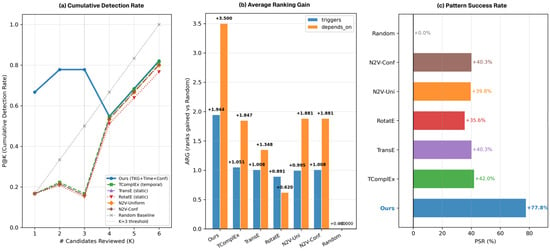
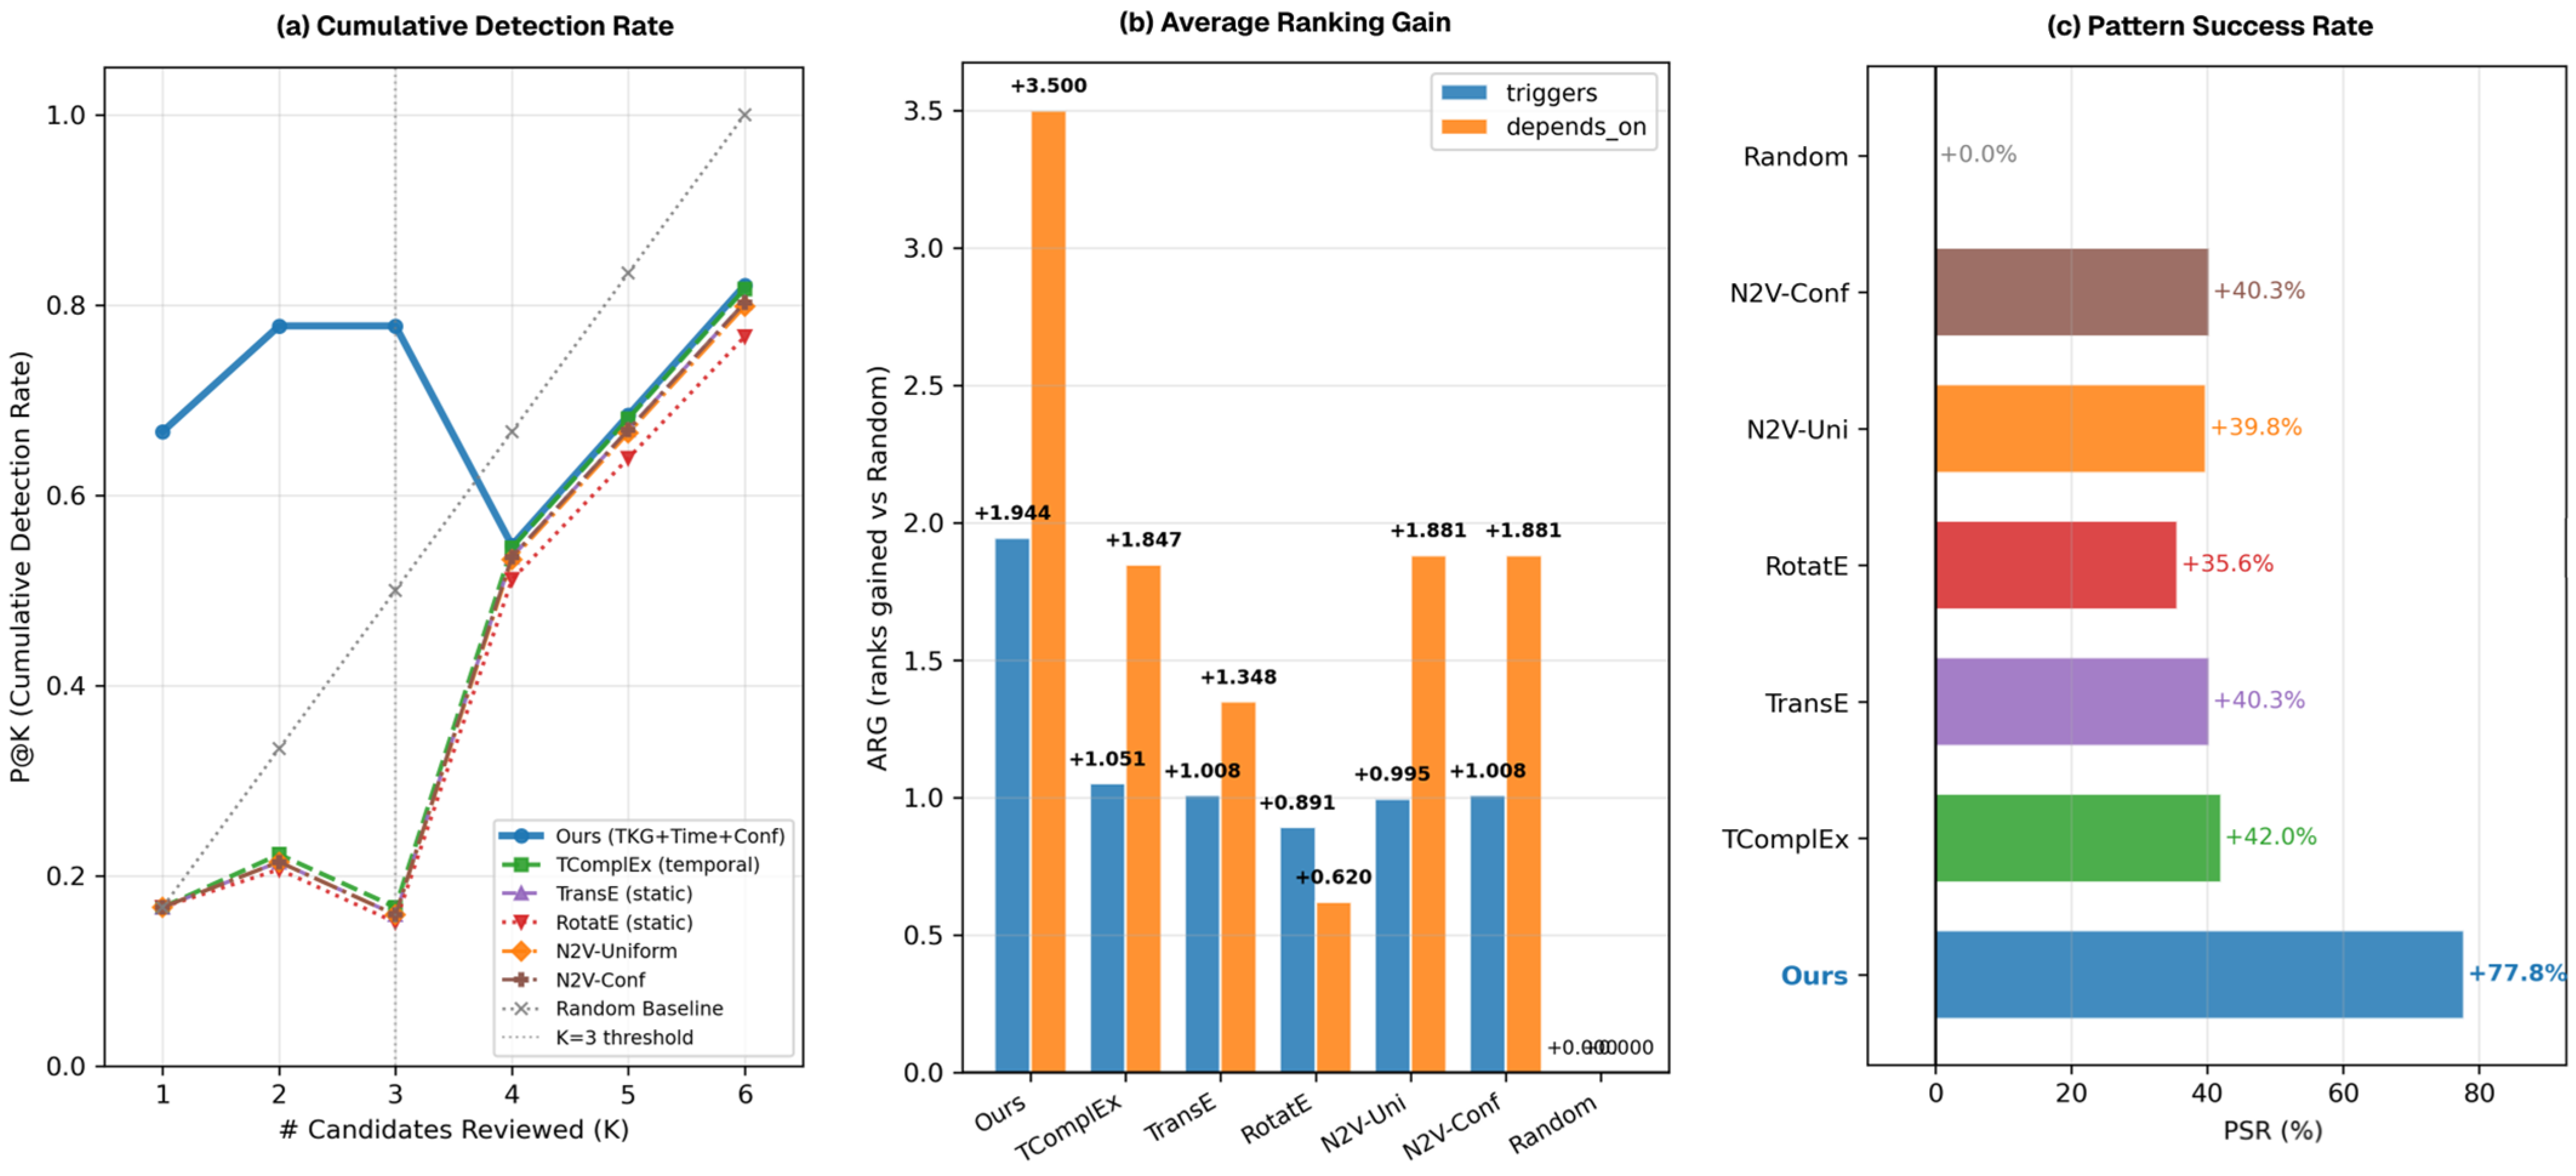
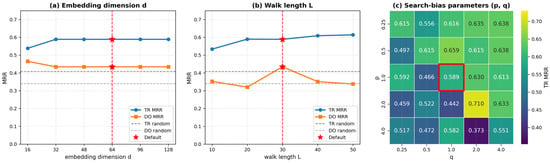
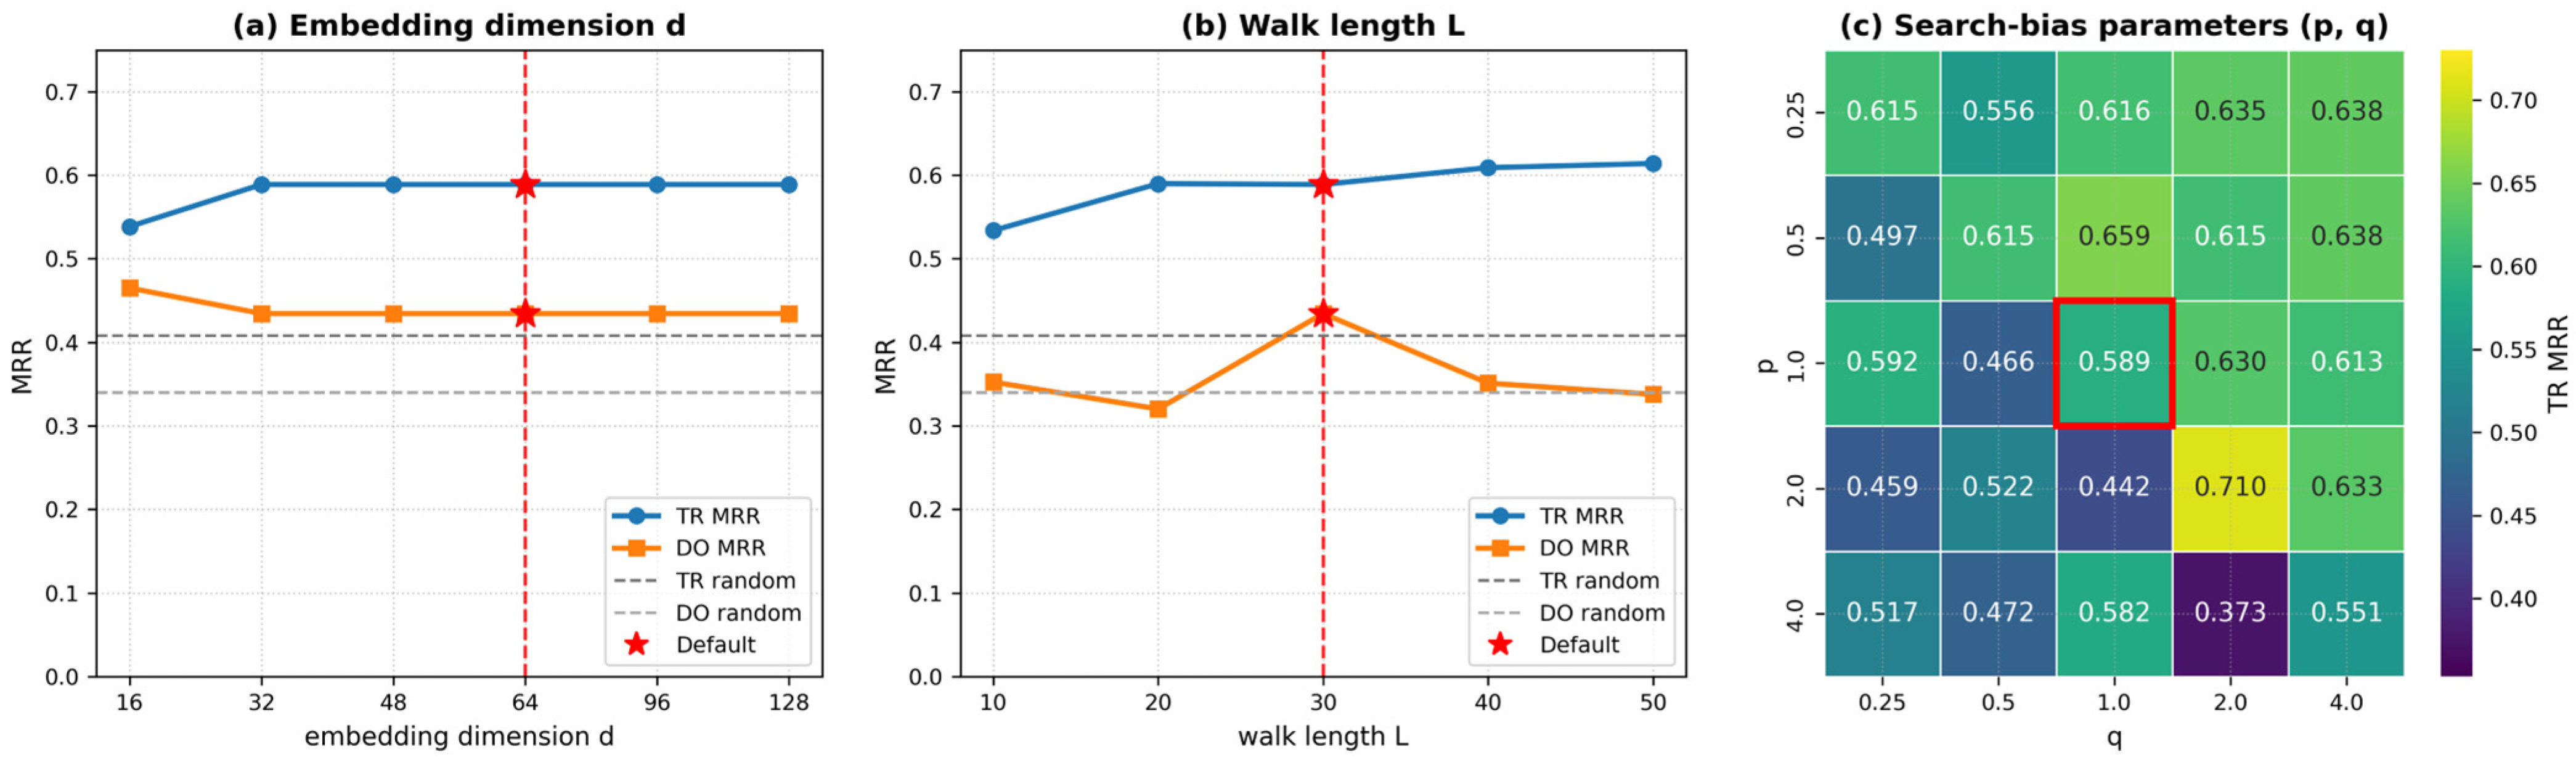

Disclaimer/Publisher’s Note: The statements, opinions and data contained in all publications are solely those of the individual author(s) and contributor(s) and not of MDPI and/or the editor(s). MDPI and/or the editor(s) disclaim responsibility for any injury to people or property resulting from any ideas, methods, instructions or products referred to in the content. |
© 2026 by the authors. Licensee MDPI, Basel, Switzerland. This article is an open access article distributed under the terms and conditions of the Creative Commons Attribution (CC BY) license.