


Abstract
Long and narrow shielded confined spaces, represented by traffic tunnels and underground utility tunnels, constitute critical application scenarios for indoor and underground positioning services. Despite their relatively simple geometric configurations, such environments suffer from severe spatial distortion of geometric dilution of precision (GDOP). Coupled with pervasive low-elevation signal propagation and intensive multipath reflection effects, conventional BeiDou Navigation Satellite System (BDS) positioning services are unable to provide continuous and reliable coverage in these scenarios. To date, existing research on high-precision pseudolite positioning for narrow confined spaces remains largely confined to theoretical analysis and laboratory experimental verification, while systematic studies on application-oriented signal atlas feature network design are significantly insufficient, forming a prominent gap that restricts the practical engineering deployment of relevant technologies. To address the aforementioned technical bottlenecks, this paper proposes a novel BDS pseudolite signal atlas network design method to improve the continuity, stability and comprehensive positioning performance in spatially distorted narrow shielded environments. Field vehicular tests were carried out in actual engineering tunnels and underground utility tunnels to systematically analyze the variation characteristics of raw BDS pseudolite observation data, including pseudorange, carrier phase, carrier-to-noise ratio (C/N0) and Doppler shift. The test results verified that kinematic Doppler parameters exhibited outstanding stability in complex shielded environments with strong multipath interference. On this basis, a spatial feature model based on kinematic Doppler measurements was constructed, and wavelet denoising technology was adopted to extract effective typical spatial feature parameters. Combined with the deterministic one-to-one mapping relationship between Doppler peak characteristics and spatial positions, a multi-peak kinematic Doppler atlas was established, which eliminates the dependence on pre-deployment data collection, dedicated database construction and offline model training. Furthermore, comprehensively considering multi-dimensional constraints such as spatial environment scale, carrier dynamic characteristics and terminal output rate, the atlas network scheme was optimized to achieve a balanced trade-off among positioning detection accuracy, absolute positioning precision and suppression of the pseudolite near-far effect. Comparative experimental results demonstrate that the proposed BDS pseudolite atlas network effectively resolves the inherent GNSS positioning difficulty in long and narrow shielded spaces. Benefiting from the rational spectral peak configuration strategy, the system can satisfy the continuous and stable positioning requirements of multiple carrier types including motor vehicles and railway locomotives under variable motion speeds and terminal output rates. This study provides a robust and feasible technical solution for high-precision BDS positioning services in long and narrow shielded confined spaces, and holds favorable engineering application prospects for underground navigation scenarios.
1. Introduction
Urban underground space represents a critical territorial spatial resource, an essential carrier underpinning the green, low-carbon, and healthy development of cities, and a strategic spatial foundation for urban evolution. The conservation and scientific utilization of urban underground space constitute a vital pathway for optimizing urban spatial structures, improving urban spatial functions, and enhancing the comprehensive urban carrying capacity. Following the issuance of national land and resource development planning guidelines, major Chinese cities including Nanjing, Hangzhou, Shenzhen, and Chengdu have promulgated corresponding regulatory documents to advance the development of local underground space resources. The scope of these documents covers multiple dimensions: development objectives and strategies, horizontal and vertical spatial regulation, development layout guidelines, facility classification specifications, disaster prevention and mitigation, and implementation guarantee mechanisms.
With the continuous advancement of the national integrated Positioning, Navigation and Timing (PNT) system, the technological development of BeiDou-enabled positioning equipment for underground spaces is of critical importance for the optimization and upgrading of national security monitoring and early warning systems, emergency rescue and management capabilities, and public indoor location services. This technological progress also possesses substantial practical application value for establishing a BeiDou location service system characterized by a unified full-domain network covering above-ground and underground, as well as indoor and outdoor scenarios, a core chip supporting diversified application services, and a unified standard system enabling diversified development. As a fundamental space-time reference system, the BeiDou Navigation Satellite System (BDS) has witnessed relatively limited research attention devoted to high-precision location services in long-narrow shielded spaces such as underground utility tunnels and highway tunnels. In the late 1990s, Galijan et al. verified through simulations of a 150 m tunnel scenario that pseudolite positioning accuracy could reach approximately 5 cm. Michalson et al. further incorporated multipath effects and other interference factors into simulation experiments and achieved comparable positioning performance in simulated underground environments. Nevertheless, Galijan, Michalson, and subsequent scholars overlooked numerous non-ideal influencing factors and lacked further validation via field measurements [1,2,3,4]. Since that period, research on pseudolite positioning for long-narrow spaces has entered a prolonged phase of stagnation. To address the positioning requirements of high-speed trains in tunnel environments, Jiang Yun, Zhang Wenyu et al. proposed an optical fiber-connected BeiDou signal regeneration and extension system for tunnel environments [5]. This system acquires authentic navigation signals outside tunnels through satellite receivers to obtain real-time GNSS time, navigation messages, ephemeris data, and other auxiliary information. Such information is transmitted to distributed GNSS signal regenerators inside tunnels via optical fiber links. Corresponding satellite navigation signals are generated in real time at locally preset positions, coupled into leaky coaxial cables in each tunnel section, and uniformly radiated into the tunnel space through the cables, thereby achieving full GNSS signal coverage within tunnels. The system has been verified to satisfy the positioning and timing requirements of trains operating in both uplink and downlink directions; however, no specific quantitative performance indicators were provided. The research team led by Song Maozhong from Nanjing University of Aeronautics and Astronautics proposed a relay positioning method using simulated-source pseudolites for tunnel scenarios. By establishing a signal propagation model, navigation signals mimicking low-elevation satellites along the tunnel extension direction are transmitted from both ends of the tunnel, and are subsequently received and processed inside the tunnel to enable positioning [6]. Meanwhile, a signal delay control approach was adopted to pre-compensate for pseudorange errors. The proposed system only requires the deployment of leaky cables or antennas inside tunnels to transmit navigation signals, enabling real-time one-dimensional positioning in straight tunnels and maintaining compatibility with conventional commercial GPS receivers. Simulation experiments in a laboratory corridor demonstrated centimeter-level positioning accuracy. Nevertheless, this method failed to account for the environmental characteristics of actual tunnels, lacking error correction for ranging information and consideration of the influence of vehicle motion states in experimental validation. Wang Xuanxi et al. developed a pseudolite-based positioning method for tunnel scenarios. By adjusting the Doppler frequency of pseudolite carrier signals, this method enables rapid and accurate variation in location fingerprints, constructs dedicated fingerprint databases for tunnel environments, and provides a feasible positioning solution for tunnel applications [7]. However, constrained by the narrow and elongated geometric properties of tunnels, the layout of pseudolite antennas faces severe limitations, accompanied by high fingerprint construction costs and poor matching robustness under environmental disturbances. Based on differentiated positioning requirements in typical tunnel scenarios, Xu Peining et al. classified application demands into four accuracy grades: millimeter-level, centimeter-level, decimeter-level, and meter-level [8,9,10]. For the three high-precision application scenarios, advanced high-precision outdoor satellite navigation technologies were adopted as references: decimeter-level positioning was realized based on Real-Time Differential (RTD), a real-time processing technique; centimeter-level positioning employed Real-Time Kinematic (RTK), a real-time processing method based on the carrier phase differential principle; millimeter-level positioning was implemented via short-baseline resolution, a post-processing technique. Engineering experimental verification demonstrated that this technology could theoretically meet the application requirements of various scenarios. Nevertheless, the scheme overlooks practical engineering challenges, including rapid signal interval switching for moving targets in dynamic operating environments and measurement information distortion under severe multipath interference, which restricts its practical engineering deployment.
To summarize the state-of-the-art research, despite the relatively simple physical geometric characteristics of long-narrow spaces, existing pseudolite-based tunnel positioning technologies remain confined to theoretical analysis and experimental verification stages due to inherent spatial constraints. Current research outcomes lack comprehensive consideration of practical engineering challenges, including severe geometric distortion and poor dilution of precision (DOP) in real scenarios, rapid linear signal switching, and the design of low-cost and feasible positioning schemes. To date, no mature and stable positioning solution has been established to support continuous location services in long-narrow spaces. Accordingly, in-depth research on the characteristics of raw BeiDou pseudolite observation data adapted to practical long-narrow scenarios remains urgently needed.
Against this research background, this paper focuses on enriching positioning feature parameters for distorted long-narrow spaces and improving positioning continuity, reliability, and overall positioning performance, and conducts systematic research on the construction of motion atlas networks adapted to typical scenarios. The main research contents are summarized as follows:
(1) The operating mechanism of existing GNSS navigation micro-base station networks is elaborated. On this basis, typical GNSS signal broadcasting modes for tunnel and utility tunnel scenarios, as well as network deployment principles for long-narrow spaces, are proposed.
(2) The quality of field-collected BeiDou pseudolite measurement data in tunnel scenarios is analyzed based on available observation datasets. Motion characteristic parameters suitable for high-speed moving targets are extracted, and a feature model is constructed by correlating location recognition performance with data feature characteristics.
(3) Focusing on the construction process of motion atlas networks, key network elements adapted to diverse scenarios and carrier types are determined from multiple perspectives, including environmental adaptability, detection accuracy, positioning precision, and near-far effect suppression.
2. System Overview
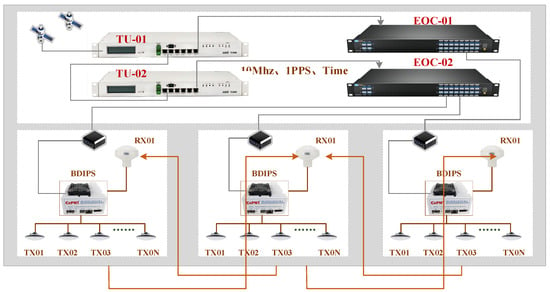
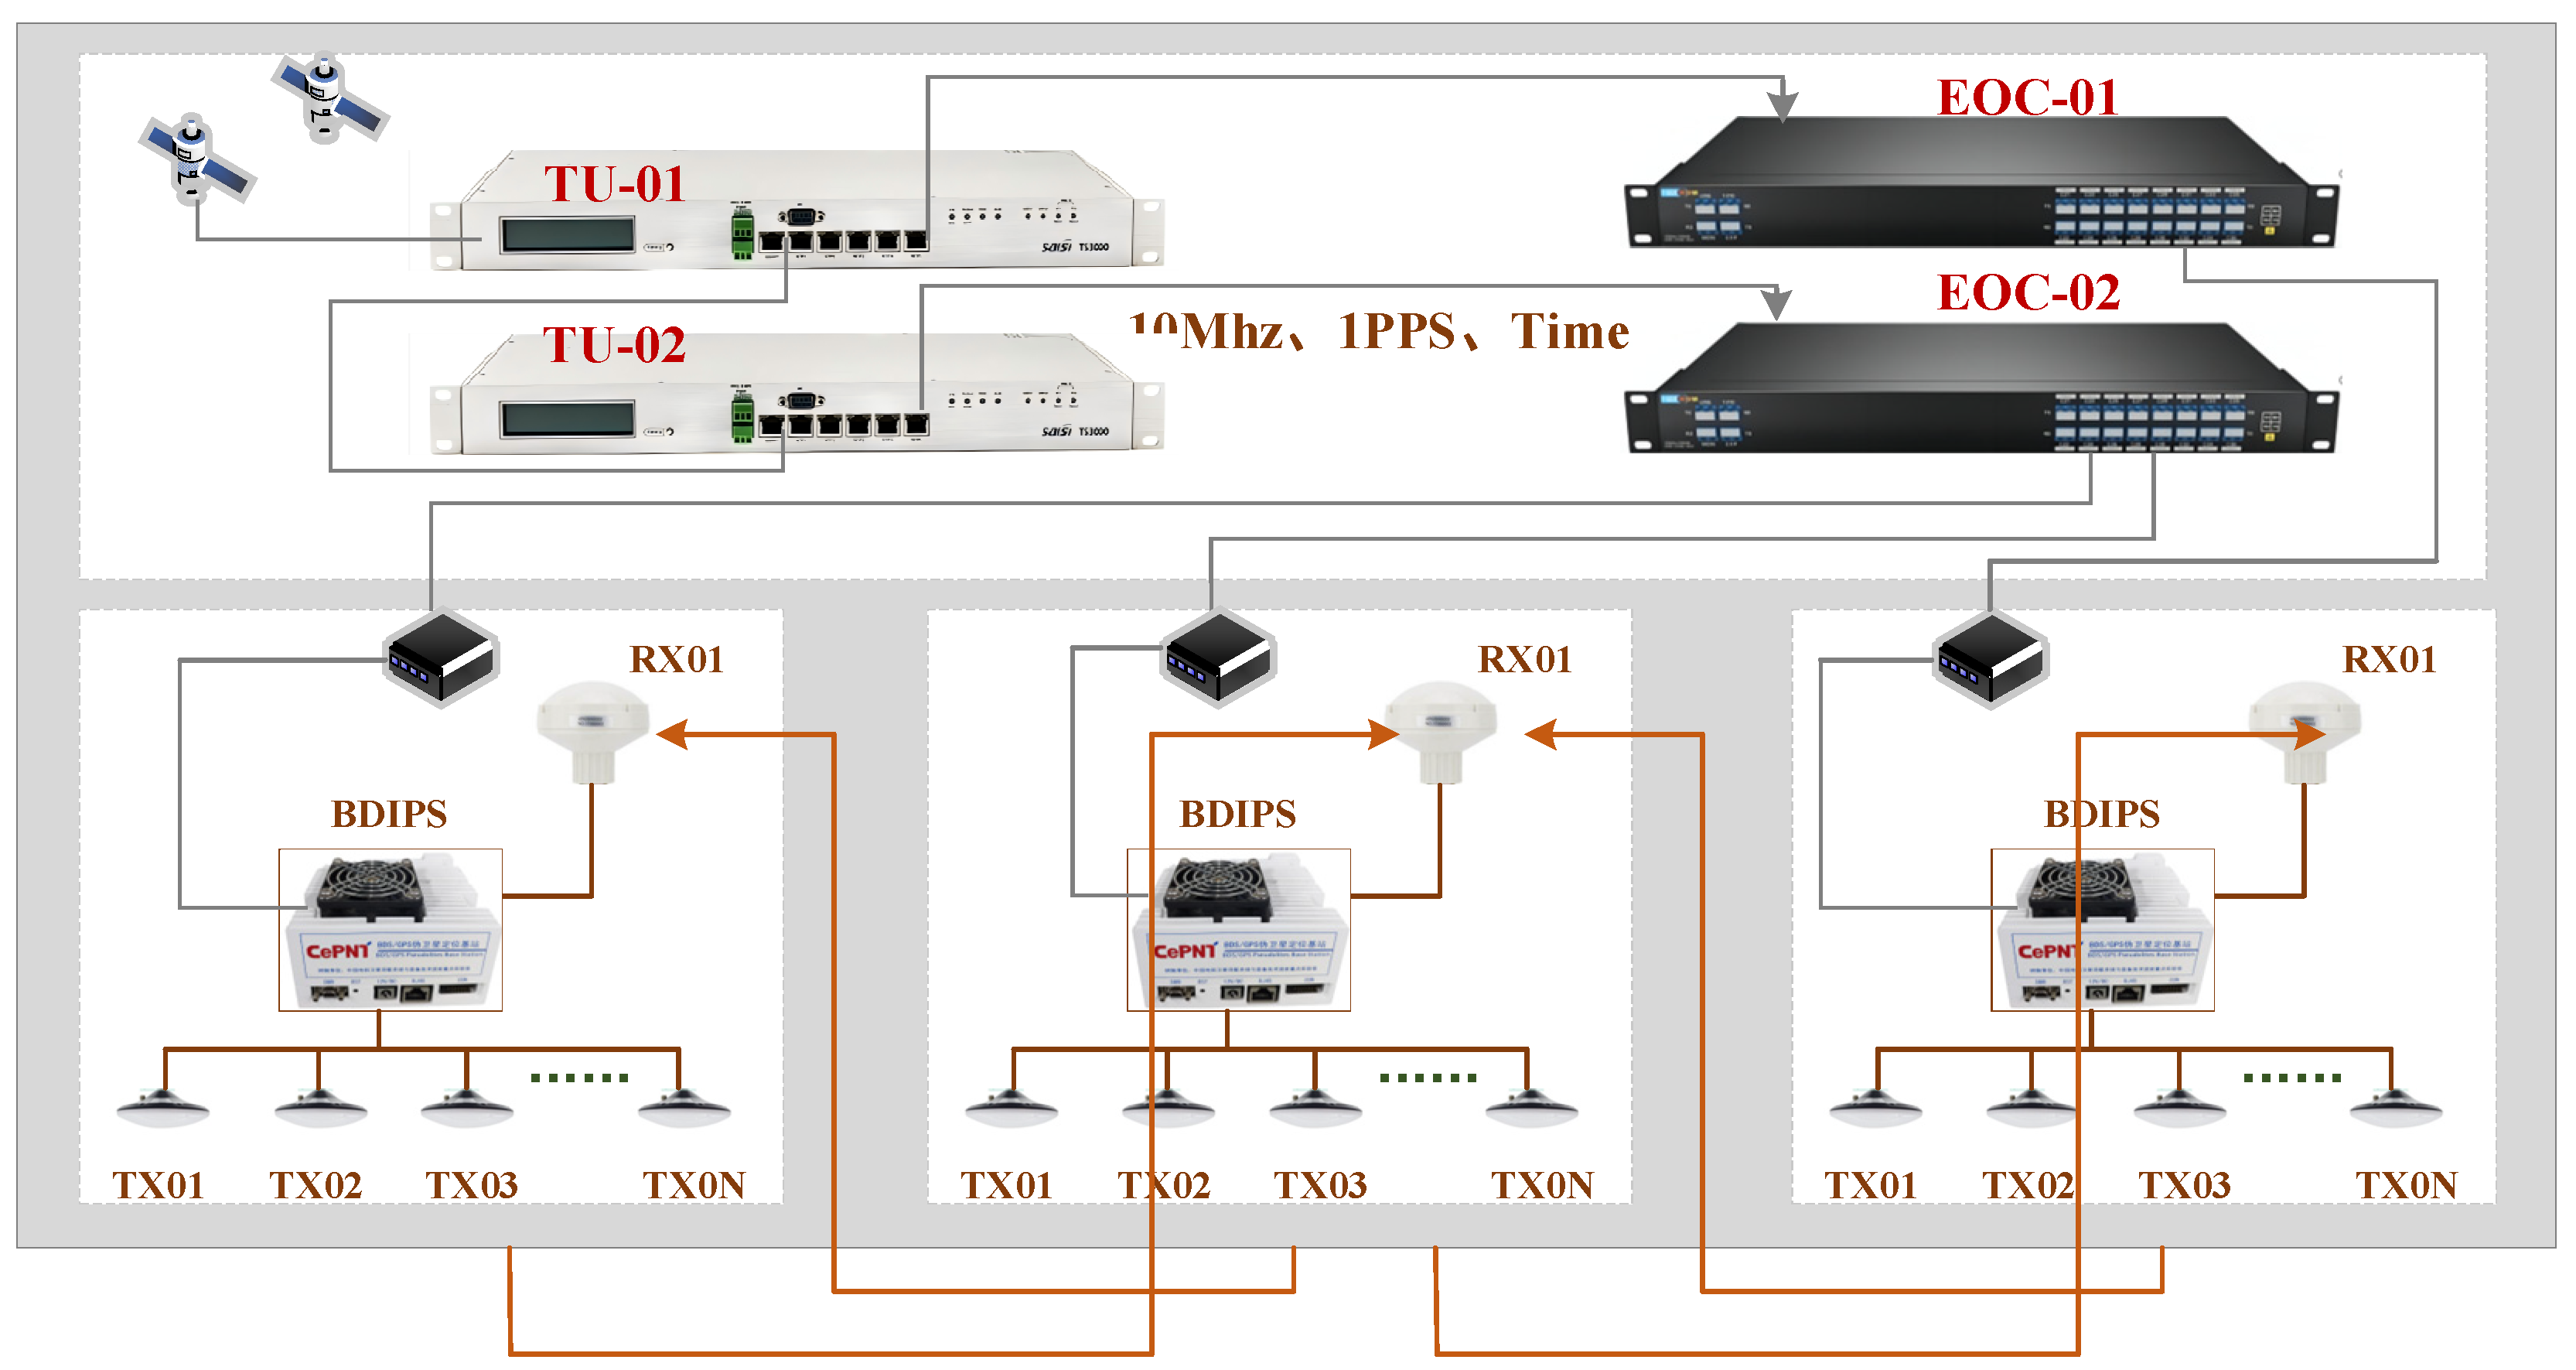
In the course of this research, a Beidou array pseudolite base station independently developed by the research unit was utilized. This base station adopts a signal system compatible with the Beidou Navigation Satellite System (BDS), enabling user terminals to receive signals without any hardware modifications. As a standalone indoor positioning system, the Beidou array pseudolite base station can achieve independent indoor networking without dependence on any external conditions. With a homologous multi-array-element design, the time-frequency reference parameters of multiple pseudolite signals are generated under the control of a common clock source, which ensures that all pseudolite signals have strictly consistent time-frequency characteristics. As a result, the satellite clock bias information generated by each pseudolite is identical. The research on positioning in narrow and elongated spaces in this paper is mainly carried out based on the aforementioned basis. Coarse synchronization in narrow and elongated spaces is achieved via optical fiber or wireless two-way synchronization, and the specific configuration of the base station network is presented in Figure 1.
Figure 1.
Base Station Network Schematic.
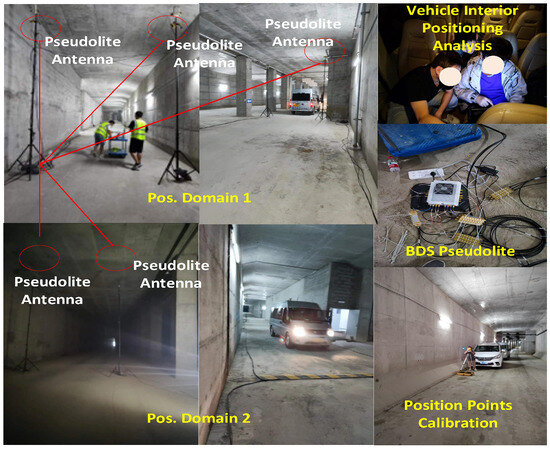
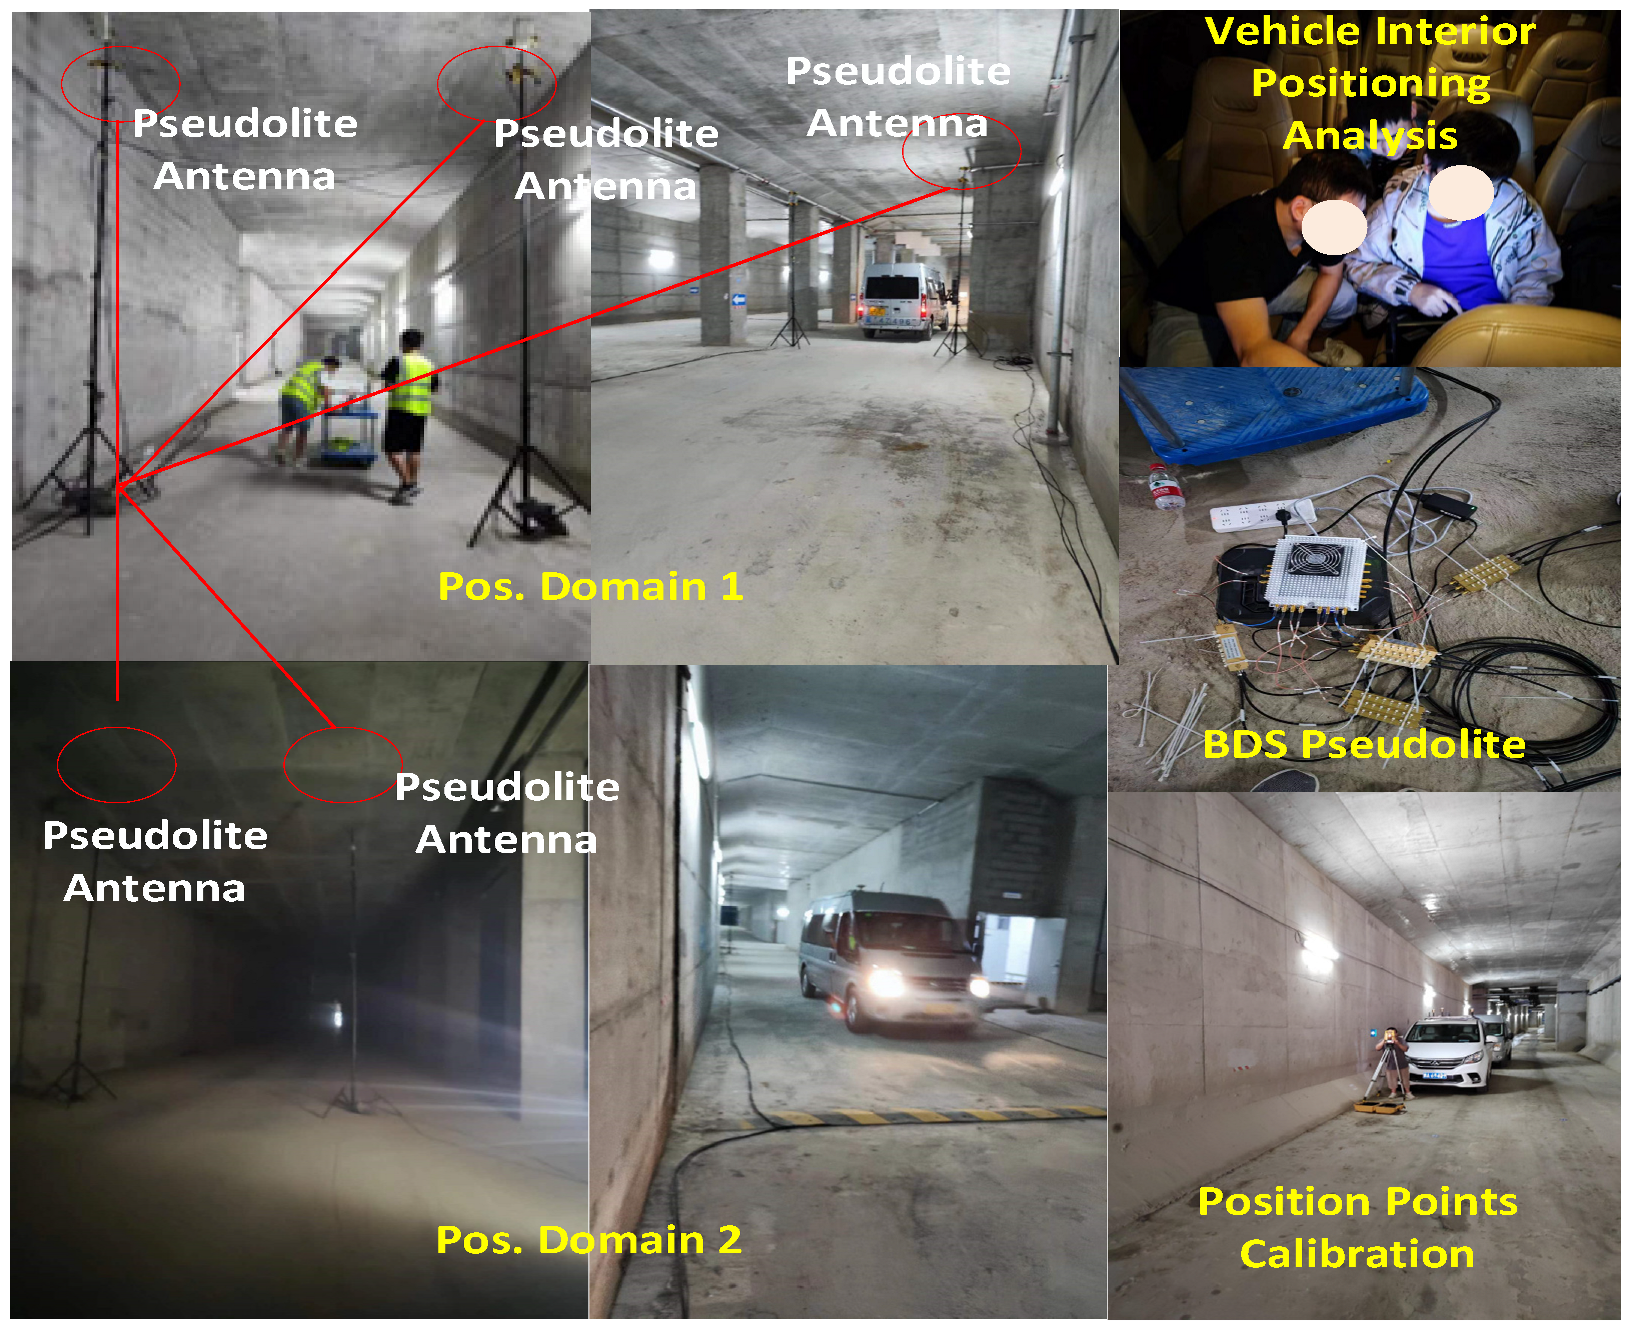
All the test and analysis data are obtained from an underground utility tunnel. The selected section of the tunnel is 1 km in length, 4.5 m in width and 6.1 m in height. The height of the test vehicle is 2.2 m. A commercial navigation antenna is installed on the roof, with a clearance of 20 cm above the vehicle roof. The test terminal uses the u-blox F9P commercial module, which supports raw data output at 1~20 Hz. The reference inertial navigation unit accuracy is better than 0.01 m/km. The 400 m test section has its two end control points calibrated with a total station. The INS is aligned and calibrated prior to every test. With the unified data acquisition software, the terminal timestamp is used for time synchronization to collect navigation and INS data simultaneously. The test scenario is shown in Figure 2.
Figure 2.
Test and Verification Scenario.
3. Feature Extraction and Modeling
3.1. Raw Measurement Data Analysis
At present, the raw observations available from navigation and positioning terminals mainly consist of four categories: pseudorange, carrier phase, carrier-to-noise ratio, and Doppler frequency shift. Pseudorange and carrier phase are primarily employed for range estimation, whereas Doppler measurements are utilized to derive velocity information. The carrier-to-noise ratio (CN0) is defined as the logarithmic ratio of instantaneous signal strength to noise level, from which the signal propagation distance can be approximately inferred based on the temporal variation in signal intensity. These four types of raw observations serve as the core parameters of navigation and positioning systems, and are also the fundamental research variables for the scenario of narrow and long spaces in this work. To further explore the reception characteristics and data distribution features of BeiDou pseudolite signals in narrow and long space environments, multiple dynamic field tests were conducted in typical scenarios, including underground pipe corridors and tunnels. On this basis, the collected raw observations, including CN0, pseudorange, carrier phase and Doppler data, are comprehensively analyzed.
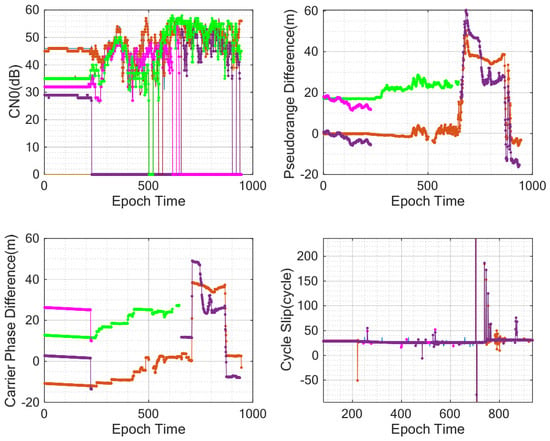
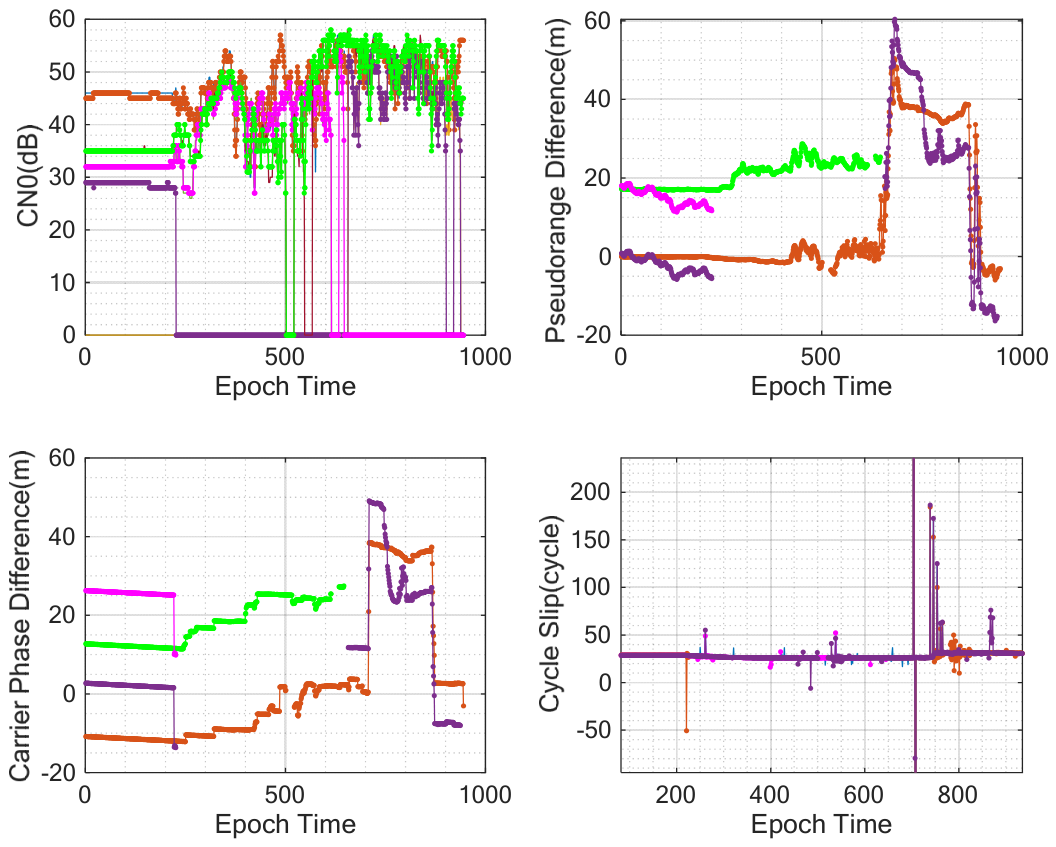
Figure 3 presents the test results of one group randomly selected from multiple sets of vehicle dynamic measurement data. It can be observed from the figure that obvious fluctuations and data outages occur frequently in the measured observations. In terms of the carrier-to-noise ratio (CN0), the CN0 remains stable under static conditions with a fluctuation range of ±1 dB. However, it exhibits irregular fluctuations in the dynamic moving state, and its variation law cannot be well correlated with distance changes deduced by the spatial signal attenuation formula. For the pseudorange difference characteristics, two typical behaviors can be summarized: a fixed measurement bias and a random offset error. The fixed bias is mainly caused by the hardware delay of signals from different propagation links. Under an unchanged hardware configuration, this bias generally maintains a constant value and can be obtained through calibration. The random offset error originates from the noise of spatial wireless propagation links. Affected by noise interference, the code tracking loop of the pseudorange measurement produces biased deviations, which introduce superimposed errors into pseudorange observations. Such errors differ among different signal channels and also vary in different vehicle dynamic tests. As shown in the figure, the fluctuation error of pseudorange difference is within 2 m in the static state, while it fluctuates around 10 m under dynamic conditions. Deviations of 20 m to 60 m even appear at some intermediate epochs. In narrow and long space environments with limited signal coverage range, the introduced dynamic measurement errors make it difficult for the receiver to realize reliable position estimation using such ranging observations. In terms of carrier phase difference characteristics, its ranging performance is similar to that of pseudorange. Nevertheless, frequent cycle slips occur in each signal channel under dynamic conditions, with an average cycle slip rate of 0.3 times per second. It can be concluded from the experimental results that three types of observation quantities of each signal channel suffer frequent signal interruptions. The four types of navigation observation characteristics in narrow and long spaces can hardly provide effective ranging values, failing to meet the basic requirements of receiver single-point positioning and RTK positioning. Moreover, the classical positioning methods such as TOA, TDOA and AOA are difficult to solve the positioning problem of GNSS signals in such complex scenarios.
Figure 3.
Quality Analysis of GNSS Pseudolite Raw Measurements in Narrow Long Spaces.
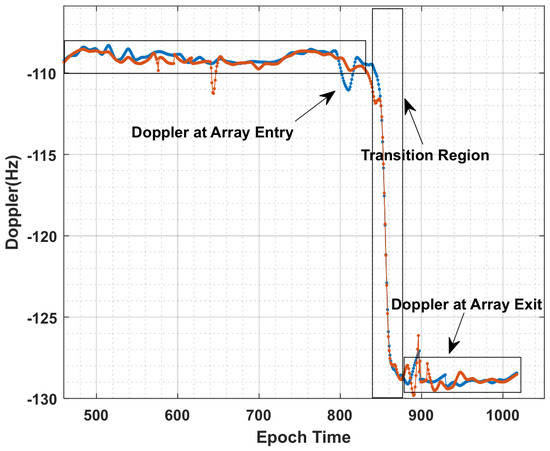
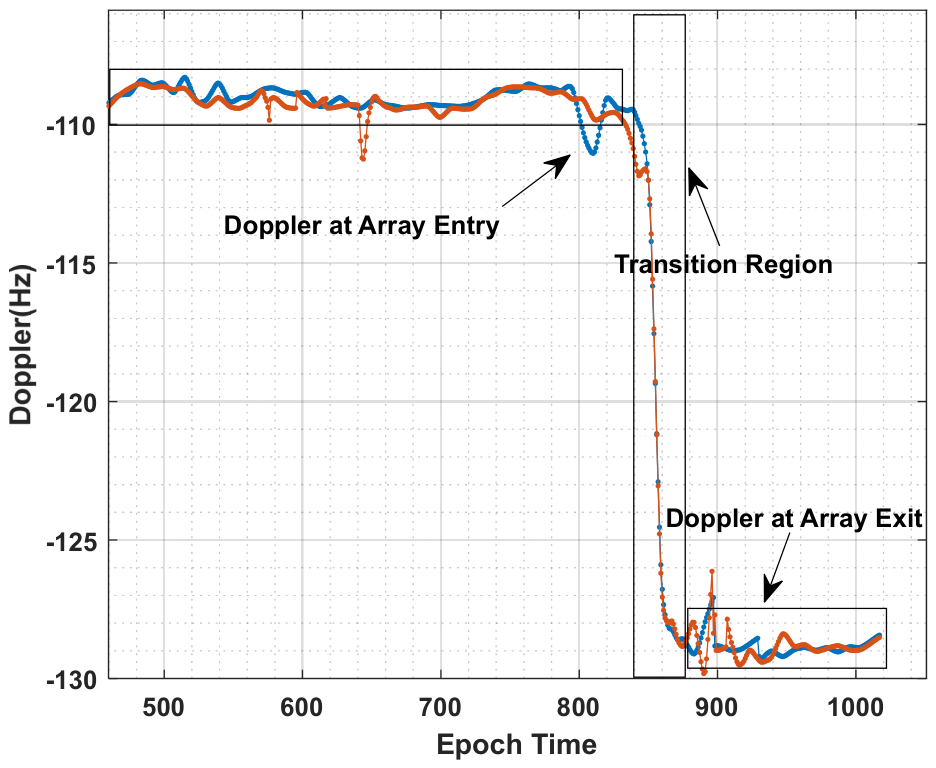
In view of the harsh and variable environmental constraints on the application of GNSS signals, it is necessary to further explore the characteristics of GNSS signals in tunnel scenarios. By extracting more effective data features from GNSS measurements, we can improve positioning accuracy and enhance the availability of GNSS in narrow and elongated spaces. Doppler parameters generally reflect the velocity characteristics of user receivers. As shown in Figure 4, the Doppler data output by the receiver is immune to cycle slips and multipath effects. According to the analysis on the variation characteristics of two sets of motion Doppler data, the average fluctuation of motion Doppler is approximately 2 Hz. The data availability rates of the first group of dynamically collected data reach 97.925% and 98.264%, while those of the second group are 98.1% and 99.273%. The Doppler data presents evidently better continuity and stability compared with other observation data. Traditionally, motion Doppler information is mainly used to estimate vehicle velocity. If spatial position information can be acquired from Doppler parameters, continuous positioning based on both position and velocity data can be realized.
Figure 4.
Dynamic Characteristics of Doppler Variation.
3.2. Motion Doppler Based Spatial Feature Model
3.2.1. Characteristics of Kinematic Doppler Observations
Doppler frequency shift refers to the frequency deviation of the signal received by the receiver relative to the transmitted frequency of the signal source, which is caused by the relative motion between the moving carrier receiving wireless signals and the signal source. When the signal source and the receiver move close to each other, the received frequency increases; when they move away from each other, the received frequency decreases. Assume that the velocity of the moving platform is , and its current coordinate is . The antenna coordinate of the transmitting base station is set as . Accordingly, the Doppler frequency shift generated by the moving platform relative to the antenna of the transmitting base station at this moment can be expressed as:
where denotes the moving velocity of the carrier, represents the speed of light, and is the transmitted frequency of the navigation signal, .
- Characteristics of Single-Element Motion Doppler
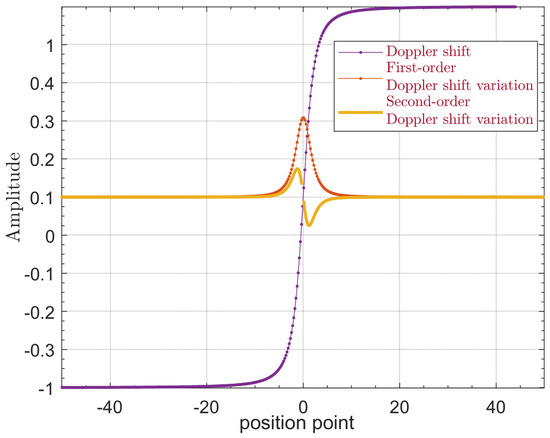
According to the above formula, the variation law of the Doppler shift is independent of its magnitude. When the moving carrier travels perpendicularly to the antenna line-of-sight direction, the Doppler shift along the antenna direction is zero. The Doppler observation is related to the instantaneous position and velocity of the moving carrier, while the velocity magnitude is weakly correlated with spatial position. Accordingly, the Doppler characteristic can be transformed into the relationship between Doppler variation and carrier position. To further analyze the Doppler feature under a single array element, the first-order and second-order variation characteristics of Doppler are investigated in this paper.
The first-order and second-order variation equations of the Doppler shift are given as:
Here, y and y1 are known quantities. We mainly analyze the variation characteristics of x in the one-dimensional direction.
As illustrated in Figure 5, the relationship between Doppler shift and spatial position of the moving carrier exhibits the following characteristics:
Figure 5.
Single-element Motion Doppler Characteristics.
- (1)
- Zero-value characteristic
During the movement of the carrier, regardless of the variation in moving speed, the Doppler shift always equals zero when the carrier reaches the position with a line-of-sight angle of 90° relative to the antenna.
- (2)
- First-order extremum characteristic
At the position where the line-of-sight angle between the carrier and the antenna is 90°, the first-order variation rate of Doppler presents an extremum. When the carrier moves from the positive position to the negative position, the first-order derivative of Doppler reaches the maximum value; when the carrier moves from the negative position to the positive position, it reaches the minimum value.
- (3)
- Second-order extremum characteristic
On both sides of the reference position with a 90° line-of-sight angle, the second-order variation rate of Doppler shows an odd-symmetric distribution feature.
- 2.
- Inter-element Motion Doppler Characteristics
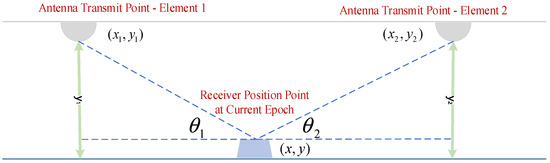
This section further explores the signal characteristics among different pseudolite array elements, as illustrated in Figure 6.
Figure 6.
Inter-element Doppler Characteristics.
As analyzed in the previous section, the Doppler parameters actually acquired by the user terminal consist of two components: clock error Doppler and motion Doppler. Based on the homologous characteristics of the BeiDou pseudolite array, adjacent array elements exhibit consistent clock error Doppler characteristics. Doppler difference and the carrier position, which is specifically expressed as follows:
T
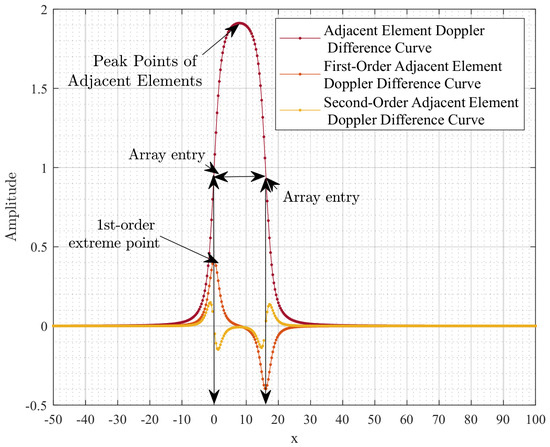
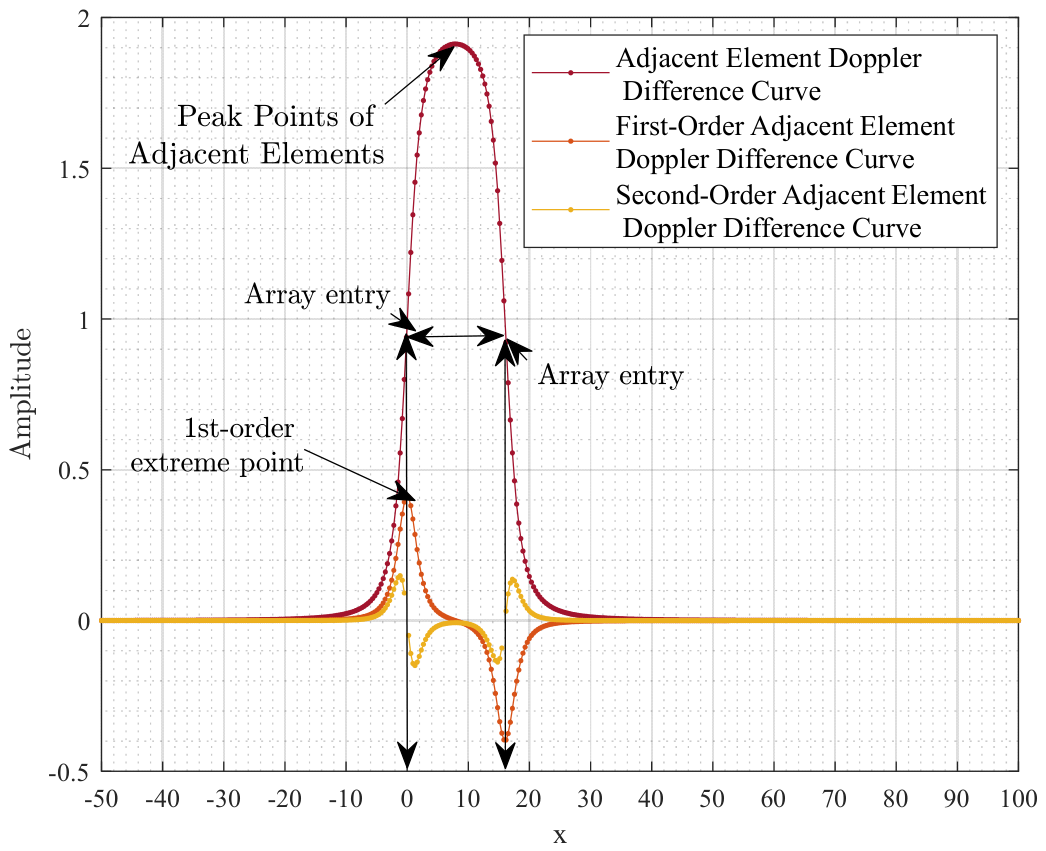
It can be seen from the above formula that the differential Doppler characteristic is an equation associated with velocity, position, and base station antenna height. Among them, y y1 and y2 are generally constant values. The magnitude of velocity only affects the amplitude characteristics of the single differential Doppler. Therefore, position is the only parameter that causes variations in the single differential Doppler. Combined with Figure 7, the single differential Doppler and its first-order and second-order characteristics are analyzed as follows:
Figure 7.
Adjacent Element Doppler Characteristic Variation Curve.
(1) At the center of the dual-element array, obvious extremum characteristics can be observed. When the Doppler difference is defined as the value of the incoming side minus the outgoing side, a minimum point appears at the array center; when defined as the outgoing side minus the incoming side, a maximum point occurs. Regardless of the specific velocity magnitude, the dual-array Doppler difference is close to 1 at the vertical projection point compared with the single-element scenario, and a smaller height value makes the result closer to 1.
(2) First-order characteristic of the dual-element Doppler single difference. It can be observed from the figure that obvious feature recognition regions exist beneath the transmitting antennas on the incoming and outgoing sides. If the Doppler difference is defined as incoming side minus outgoing side, a maximum point appears under the incoming side and a minimum point under the outgoing side. When defined as outgoing side minus incoming side, a minimum point occurs under the incoming side and a maximum point under the outgoing side. On the premise that no instantaneous mutation exists in the moving velocity, the curve variation in the maximum and minimum points presents an odd symmetry about the array center.
(3) Second-order characteristic of the dual-element Doppler single difference. It can be concluded that the second-order characteristic curve exhibits odd symmetry with respect to each array element beneath the array center on both the incoming and outgoing sides.
3.2.2. Analysis of Measured Data
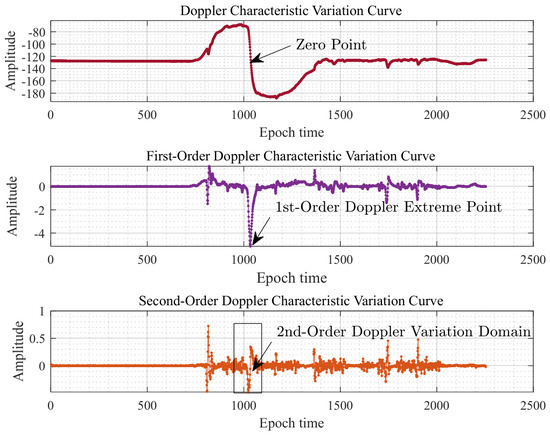
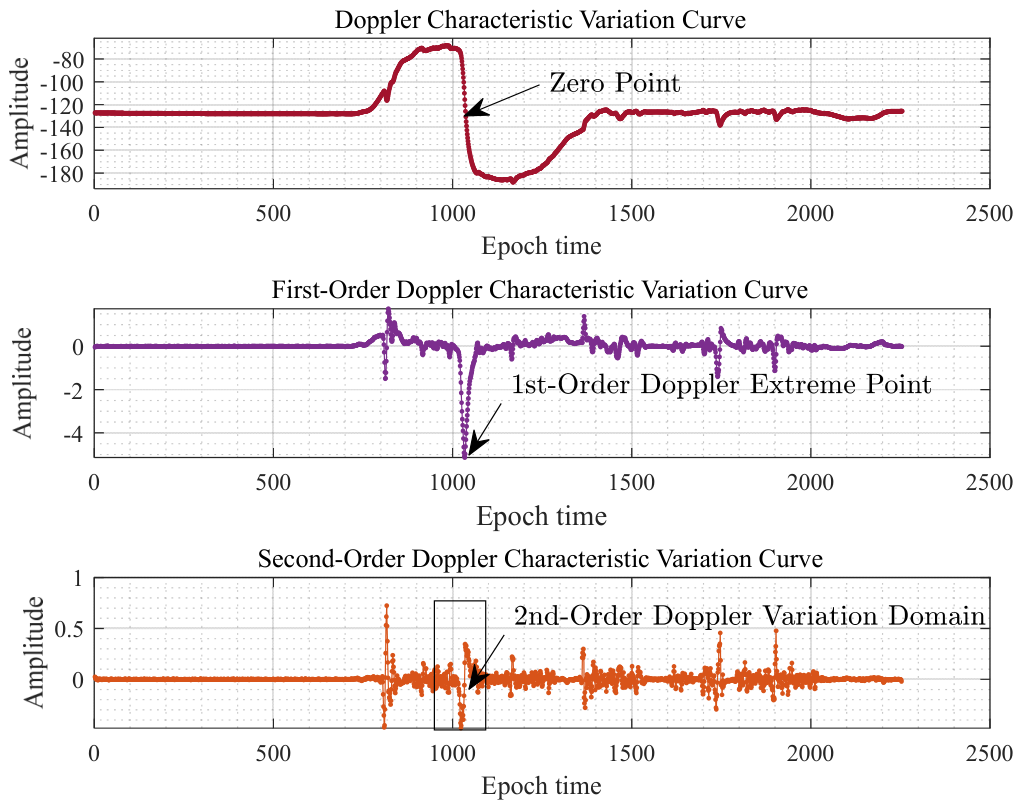
Under the single array element scenario, the three feature points are strongly correlated with the vertical projection position of the base station antenna. By extracting and analyzing the three characteristic parameters, the current position of the moving carrier can be accurately identified. In this section, randomly collected measured data in a tunnel environment are adopted for preliminary analysis. The variation characteristics of multiple groups of observation data beneath the single-element pseudolite antenna are presented in Figure 8. Near the feature points, the Doppler parameter as well as its first-order and second-order derivatives can be extracted in real time. It can be observed from the figure that the measured curve of Doppler versus position is not symmetric about the zero point. This is mainly because the acquired Doppler observations contain both motion-induced Doppler and clock-bias Doppler components. When the user terminal moves directly beneath the antenna, the motion Doppler component approaches zero, and thus the curve presents an odd symmetry with respect to the clock-bias Doppler. As indicated by the second-order Doppler variation curve, abnormal fluctuation points exist in the measured data, which are mainly distributed around the actual detection positions. Such fluctuations are highly likely to cause false alarms during feature detection. Therefore, in practical processing, only the Doppler observation and its first-order derivative are selected as feature parameters for subsequent position point detection.
Figure 8.
Characteristics of Measured Doppler Data.
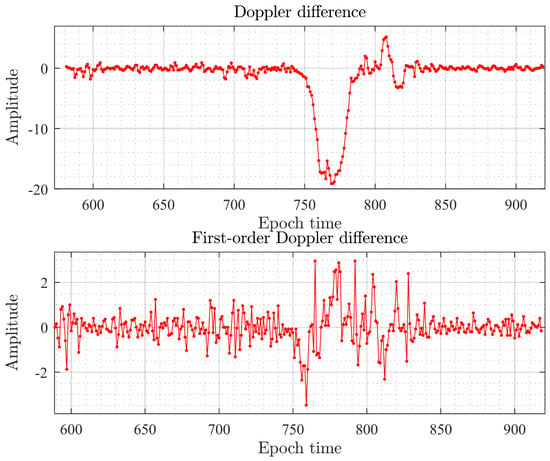
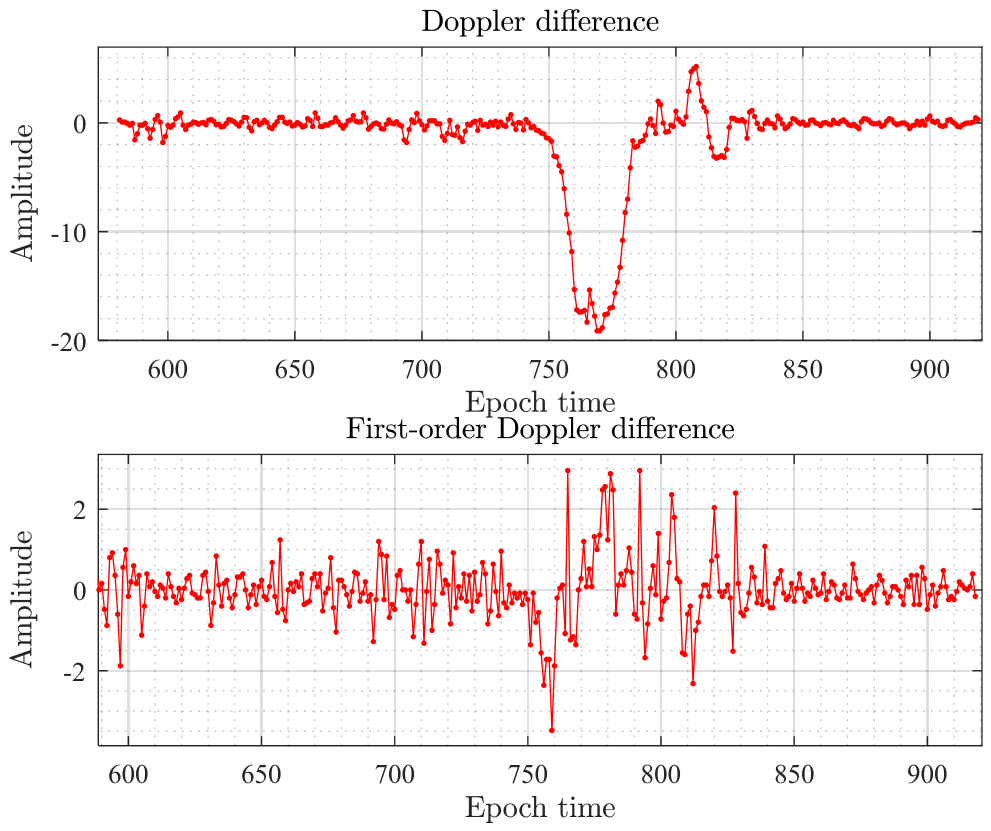
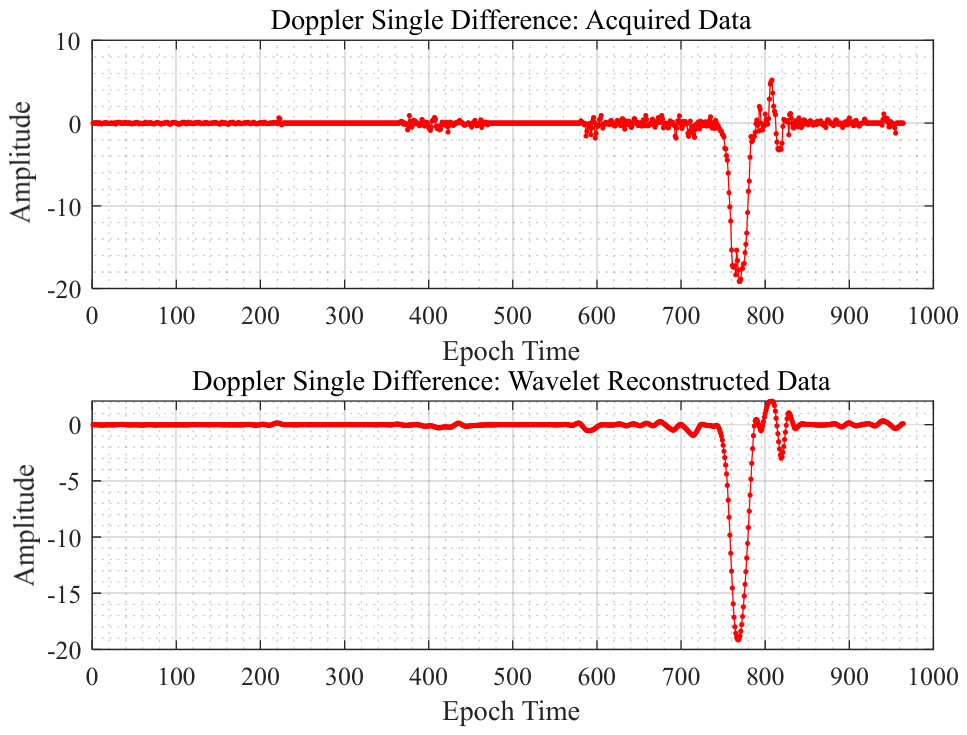
As shown in Figure 9,the amplitude characteristics of the Doppler single difference are consistent with the theoretical results. The first-order feature of the Doppler single difference can reflect the variation trend between the two array elements. However, affected by spatial noise, the actual output observations are severely contaminated by noise interference. Furthermore, since the amplitude of the second-order feature of the Doppler single difference is much smaller, its inherent characteristics are basically submerged in background noise and cannot be effectively extracted. Therefore, in practical application, only the Doppler single difference and its first-order characteristic are adopted for subsequent processing.
Figure 9.
Measured Doppler Difference Variation Characteristic.
3.2.3. Typical Feature Extraction Combined with Wavelet
According to the above measured data, although the motion Doppler presents certain regular characteristics, the pseudolite radio signals received by users in narrow and long physical spaces are usually contaminated by co-channel interference noise, multipath superposition interference errors, environmental noise, and inherent antenna errors under low elevation angles. These interferences directly lead to large instantaneous amplitude fluctuations of pseudolite Doppler parameters output by the receiver, frequent abnormal instantaneous jumps, and short-term data missing epochs.
The feature extraction process adopts appropriate filtering processing to suppress interference and anomalies, mine the variation characteristics of Doppler parameters, and thereby obtain accurate feature points. In this paper, the random error interference of Doppler is equivalent to the spatial noise superposition of the original signal. From the perspective of signal processing, the Doppler processing problem is transformed into a signal denoising and filtering task. Wavelet analysis is a time–frequency localization analysis method with a fixed window size but adjustable window shape, in which both the time window and frequency window can be adaptively adjusted. It is capable of characterizing the local features of signals in both the time domain and frequency domain. The specific data processing procedure is described as follows:
1. With the observation data adopted, the feature parameters presented in the previous subsection are fed into CC, whereby
d
Where n represents the current epoch, while i and j denote the two Doppler values derived from two pseudolite signals at the same epoch.
2. Wavelet denoising. The Coiflet function is selected as the wavelet basis function. Numerous experimental verifications show that Coiflet3 with a filter length of 18 in the Coiflet wavelet family is sensitive to the noise of motion parameters. Coiflet3 possesses good regularity and exhibits superior filtering performance compared with other basis functions. The decomposition level is set to 7.
The soft threshold denoising method is adopted as the threshold function, and its formula is given as follows: if the absolute value of the wavelet coefficient is less than the given threshold, the coefficient is set to zero; if it is greater than or equal to the threshold, the threshold is subtracted from the wavelet coefficient.
Li
Where , denotes the signal length, is the standard deviation of noise, j represents the wavelet decomposition scale, and median denotes the median function. N is the variable of decomposition level, and is a proportional coefficient greater than the constant zero.
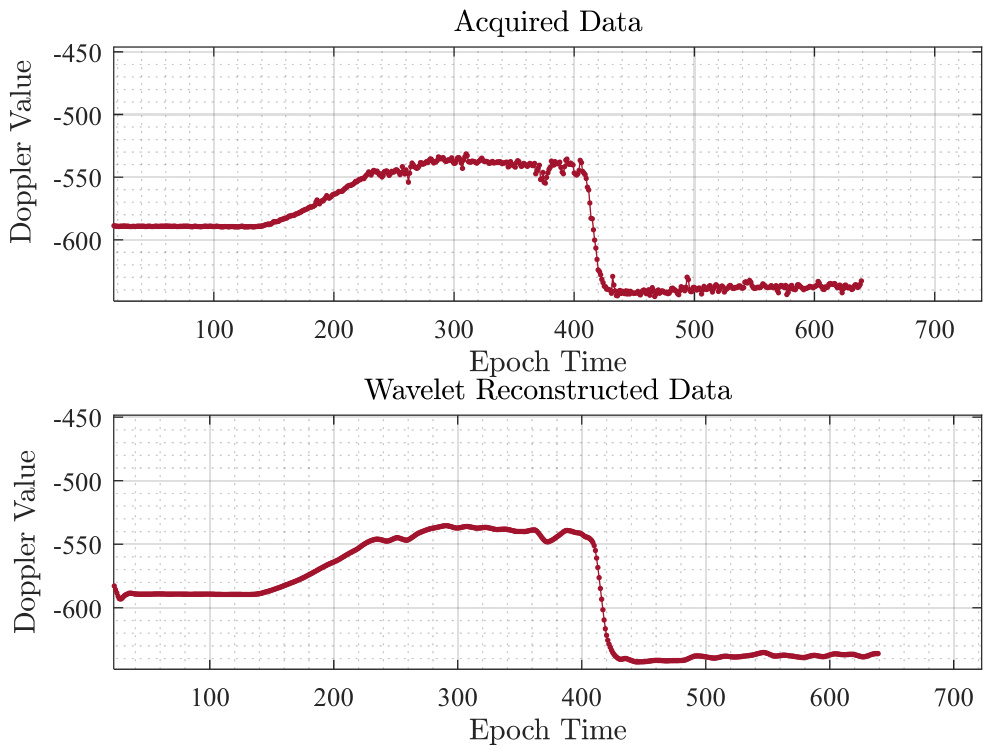
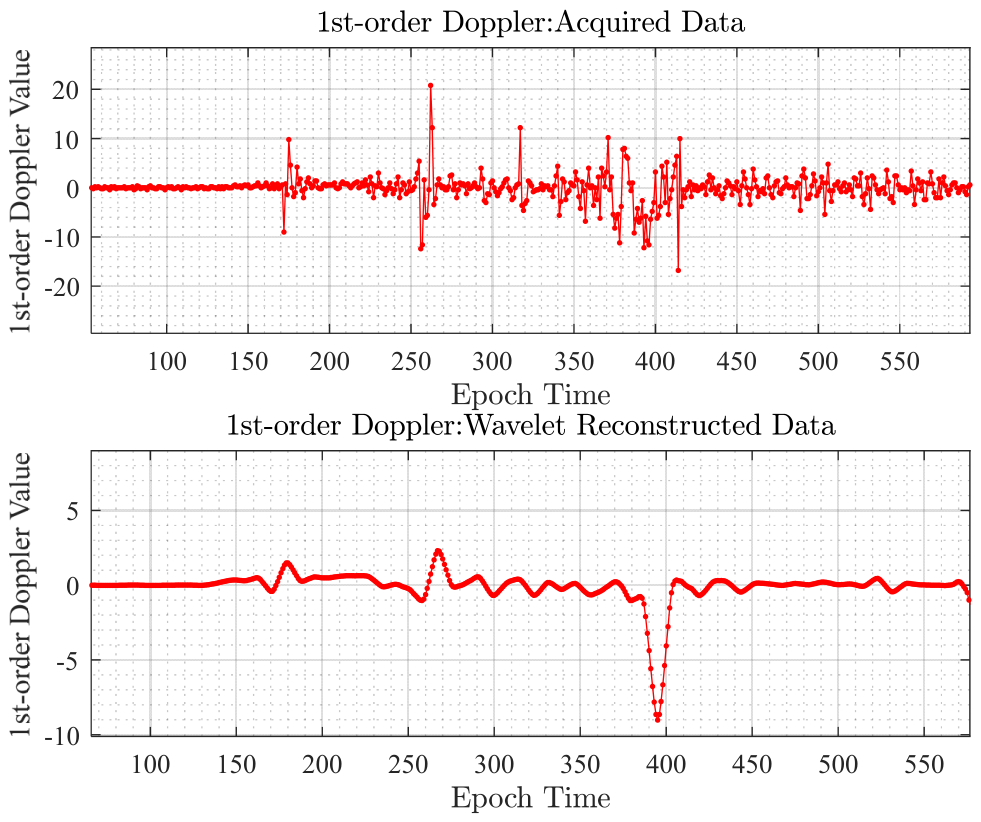
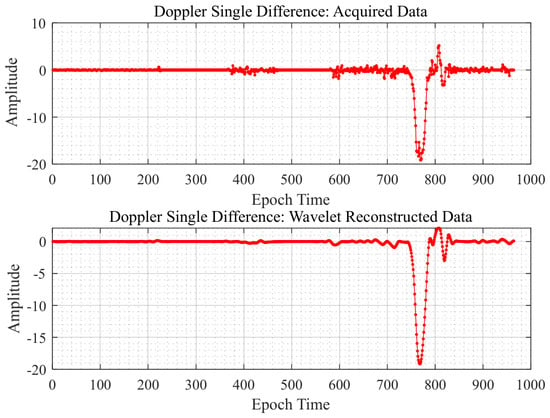
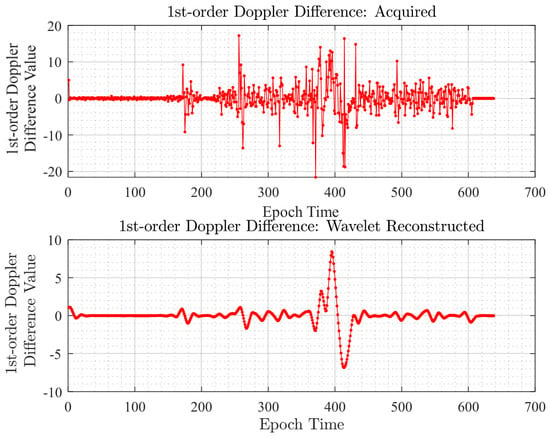
Based on the above process, wavelet denoising is, respectively, performed on the Doppler parameter, the first-order Doppler parameter, the Doppler difference parameter, and the first-order Doppler difference parameter. By comparing the data before and after processing, it is found that the data after wavelet denoising can retain the characteristic information related to Doppler well.
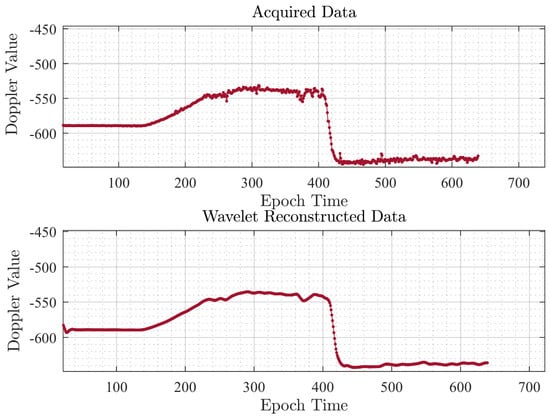
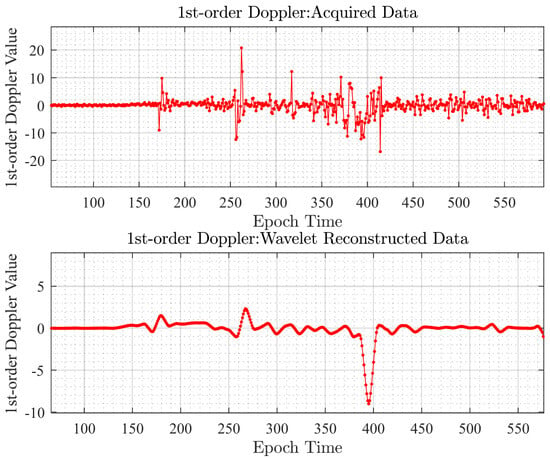
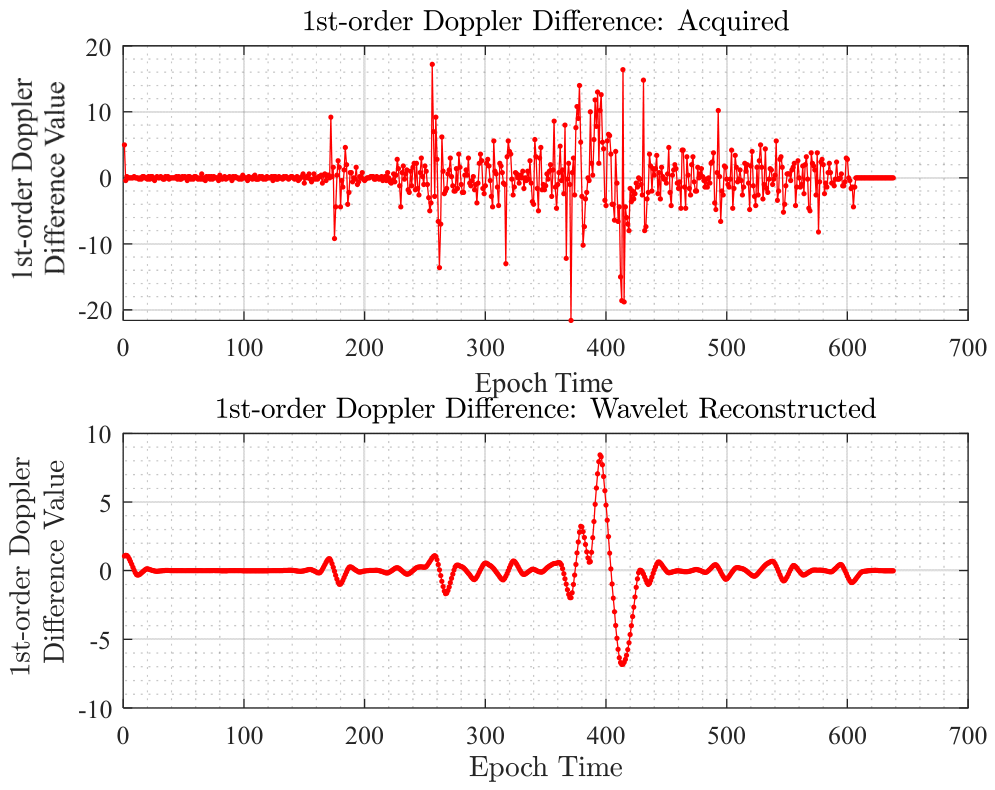
Figure 10 presents the comparison of real-time wavelet reconstruction results for the motion Doppler parameters. It can be seen that after denoising, the random fluctuation error of the Doppler parameter between adjacent epochs is significantly reduced, reaching approximately 0.2 Hz. After the reconstruction of the first-order Doppler signal, the amplitude characteristics of the first-order feature become more distinct, which effectively improves the detection accuracy of the first-order Doppler quantity in feature detection.
Figure 10.
Denoising of a Single Doppler Feature.
Figure 11 shows the comparison of the Doppler single-difference signal before and after reconstruction. The reconstructed signal exhibits distinct and unique amplitude characteristics at the extreme points. After reconstruction of the first-order Doppler single-difference signal, the signal noise is significantly suppressed. The reconstructed signal presents obvious extremum features on both the incoming and outgoing sides of the array. Combined with the vehicle moving speed and data output frequency, it can be seen that the reconstructed signal can well characterize the spacing between adjacent array elements.
Figure 11.
Processing of Doppler Characteristics of Adjacent Array Elements.
4. Analysis on Map Network Construction of Elongated Distorted Space
Before the analysis in this section, the concept of the atlas is specially explained. Different from the traditional indoor beacon feature atlas technology, the atlas adopted in this paper does not require prior data collection, database establishment or data model training. Although the traditional feature database construction method is technically feasible and can achieve satisfactory positioning accuracy through sufficient feature extraction and training, it involves an enormous workload of pre-deployment testing when applied to large-scale, long and narrow environments such as tunnels and underground utility corridors, making it impractical for widespread popularization. The signal features adopted in this section are derived from the signal peak characteristics analyzed in the previous sections. Such features do not need advanced calibration. Once the deployment positions of GNSS pseudolite antenna array elements are calibrated, the corresponding relationship between feature peaks and spatial positions can be determined directly.
4.1. Construction Principle of Moving Doppler Multi-Peak Atlas
Based on the feature model established in the previous section, the Doppler feature recognition problem is uniformly transformed into the correspondence between peak detection and spatial position. The single Doppler peak is associated with the position of a single Beidou pseudolite antenna array element, while the peak characteristic of Doppler single difference is simultaneously related to the inter-element spacing L, the antenna height h of array elements, and the real-time longitudinal coordinate x of the user. The inter-element spacing L determines the sharpness of the peak feature of the Doppler single-difference signal. Meanwhile, the longitudinal translation of dual array elements with fixed spacing L will also generate peaks at new positions. The antenna height h of the array elements determines the position of signal peaks within the coverage area of the dual array elements. When the antenna spacing between array elements remains unchanged, the signal peak appears at the center of the dual array elements. As the antenna heights of the dual array elements change, the signal peak will shift toward the array element with the smaller height h.
According to the correlation characteristics between Doppler signal peaks and spatial positions, the model is established as follows in this paper. Suppose there are m horizontal array elements and n vertical array elements. The antenna coordinate matrix of the m horizontal array elements is denoted as SSP, and the antenna coordinate matrix of the n vertical array elements is denoted as SV, as expressed in the following formulas.
sts loo
Thus, the total number of array elements on each side is m + n, corresponding to m + n groups of single Doppler peaks. Based on the single-difference and single-peak characteristics of array elements, groups of peaks can be obtained. By adjusting the translation value and height value, a series of peaks with determined interval relationships between peaks can be acquired. Accordingly, the peak atlas can be expressed as
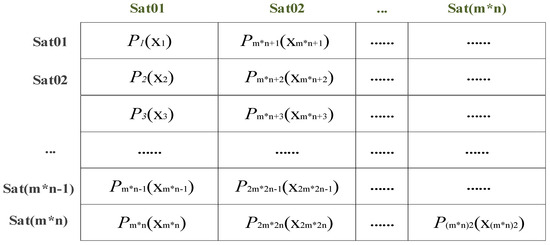
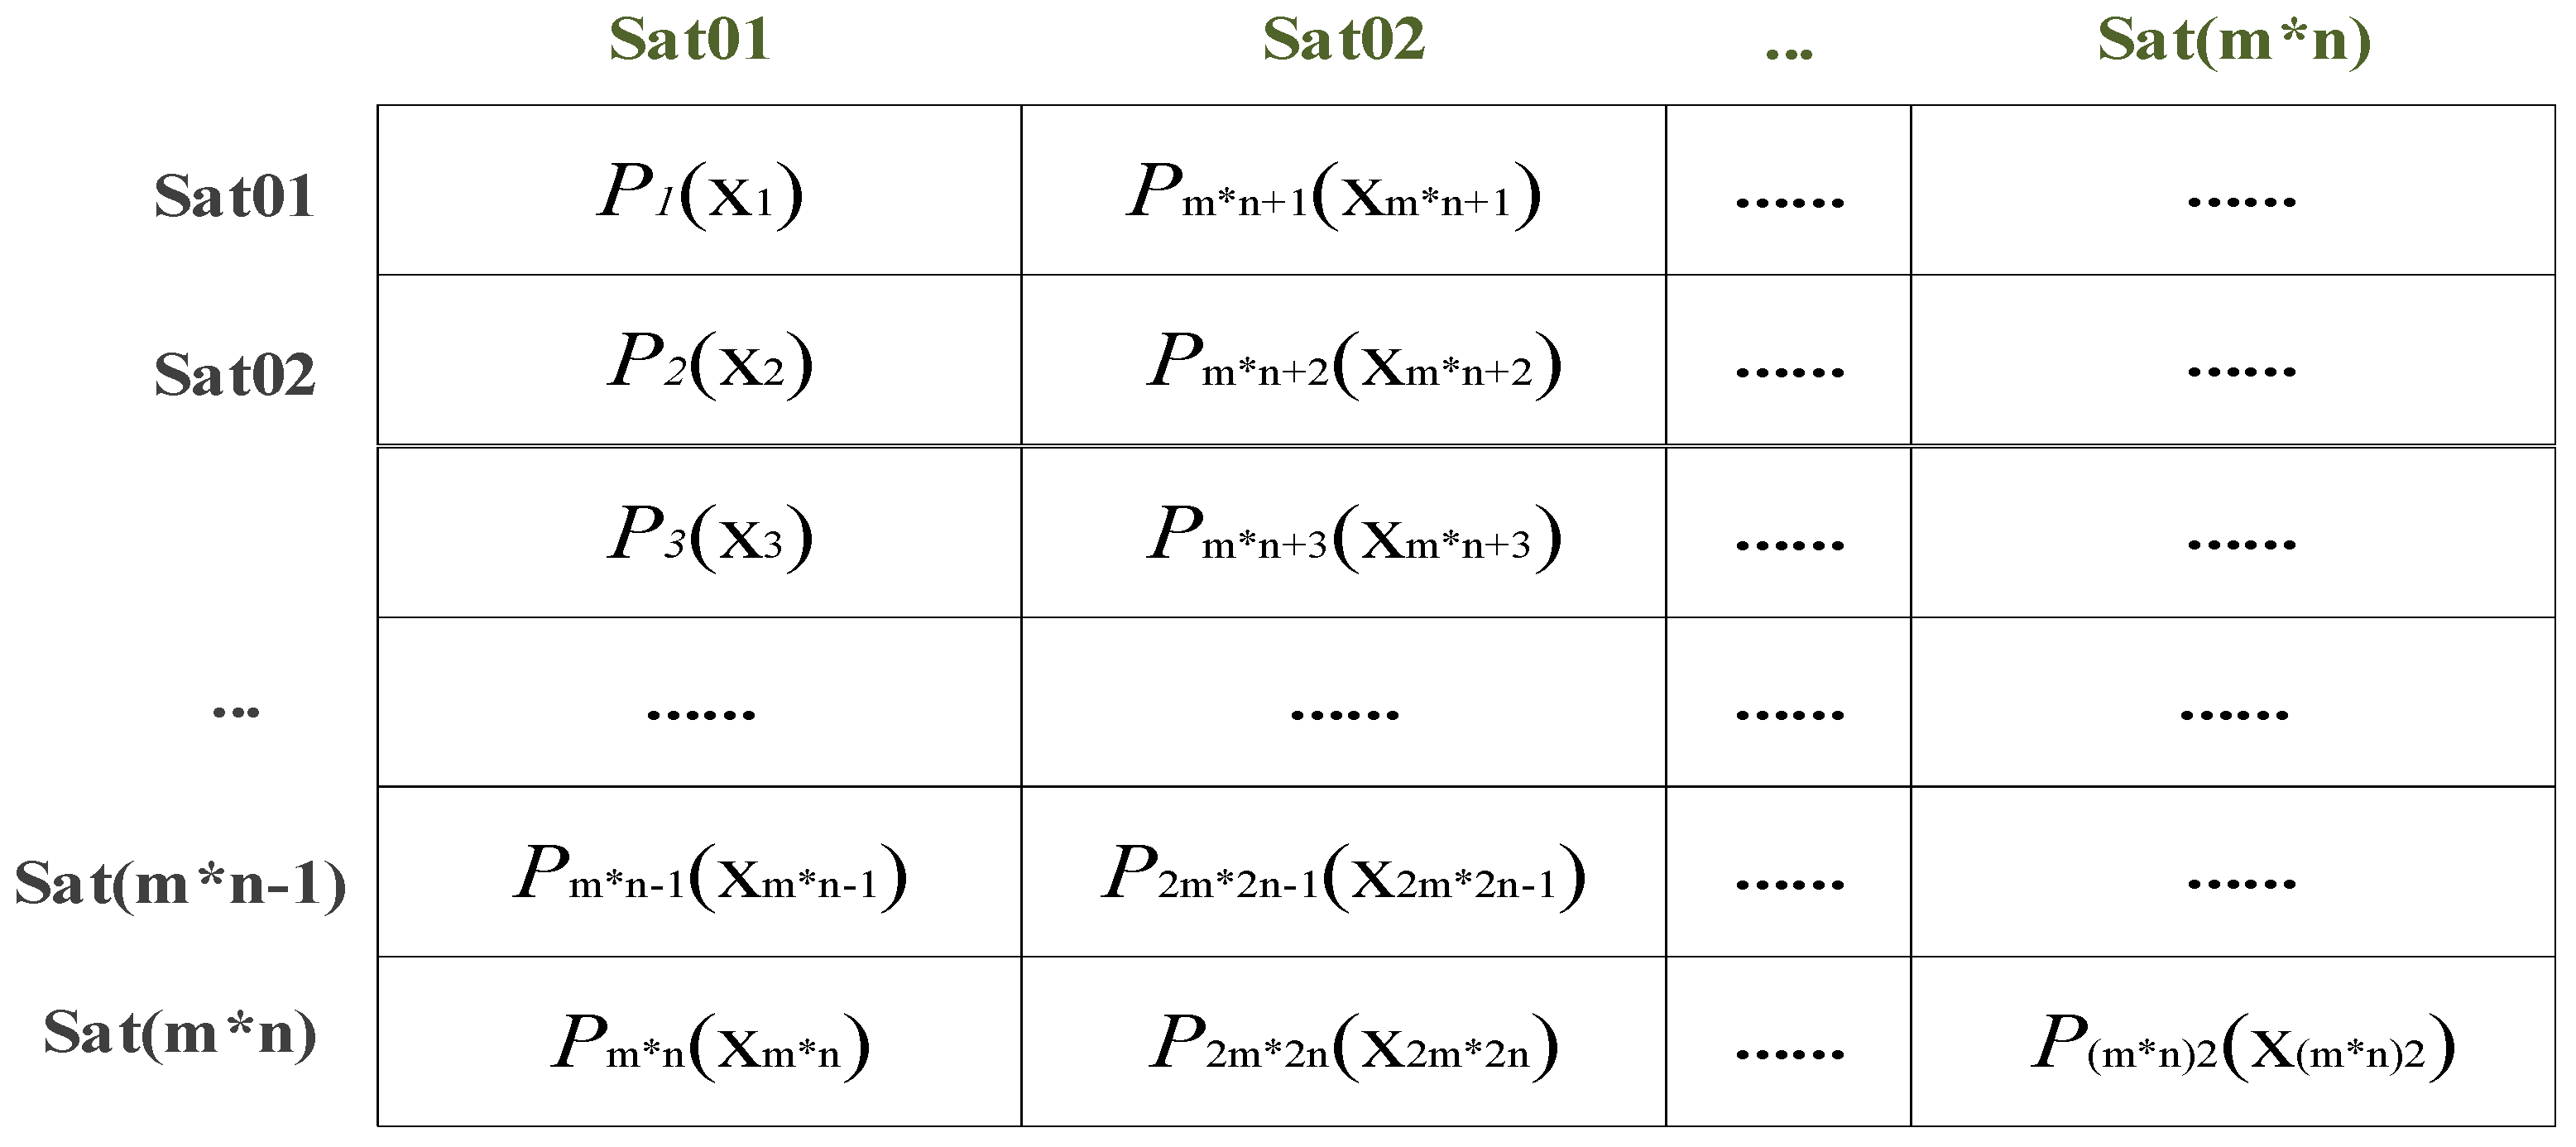
Within the coverage area between array elements, reasonable longitudinal translation and height layout design are adopted to realize full-domain coverage of multi-peak distribution in the inter-element space. Consequently, the position information between array elements is transformed into a position set composed of a series of peak points. Continuous absolute positioning in the elongated space can be achieved by real-time detection of each peak point. To facilitate position detection, a corresponding detection atlas feature database is constructed by combining location information, peak characteristics, and Beidou pseudolite signal information, as illustrated in Figure 12. Herein, Sat denotes the satellite number, and P represents the absolute position of each sampling point. For the convenience of expression, frequency differences are characterized by different satellite numbers in this paper.
Figure 12.
Processing of Doppler Characteristics of Adjacent Array Elements.
4.2. Analysis on Influencing Factors of Environmental Multi-Parameter Information
Limited by the spatial constraints of actual long and narrow scenarios, it is usually difficult to achieve uniform full-domain coverage of the peak spectrum through parameter adjustment in practical measurement and application. Therefore, it is essential to design the peak spectrum according to the actual environment and data features, while ensuring effective detection of peak characteristics and real-time positioning accuracy. For this purpose, the design specifications of typical long and narrow scenarios in China are reviewed and analyzed.
- Spatial environmental scale factor
For highway tunnels, the design height is generally 6–7 m. According to the provisions on tunnel height clearance specified in Code for Design of Urban Road Engineering (CJJ37-2012) in China, the clear height of expressways, first-class highways and second-class highways is 5 m, while that of third-class and fourth-class highways is 4.5 m. In terms of vehicle contour dimensions, the total height of large buses is designed as 4 m, and that of passenger cars is 3.5 m.
For railway tunnels, they can be classified by traction mode: the internal height is 6 m and the width is 12.88 m for diesel traction; the internal height is 6.55 m and the width remains 12.88 m for electric traction. The above values are only typical reference cases. In practical engineering, the design of railway tunnels comprehensively considers the aerodynamic wind resistance effect, and the design standard is mainly based on the cross-sectional area. The body height of railway EMUs is approximately 4.49 m.
In underground utility corridors, in accordance with the general height standards for fire trucks and transport vehicles in China, the clear height above the ground for traffic lanes, fire lanes and maintenance passages inside the corridor is no less than 4.5 m. Actual tests show that the height of logistics passage areas is generally between 4.5 m and 6 m.
It can be concluded from the above design scales that the spatial height of typical long and narrow spaces is basically within the range of 4.5–7 m. According to the height standard of large buses, the vertical clearance between the vehicle roof and the tunnel ceiling is 0.5–3 m in highway tunnels; in railway tunnels, the clearance between the EMU roof and the tunnel top is 1.51–2.06 m; and in underground utility corridors, the clearance ranges from 0.5 to 2 m. Therefore, the relative height relationship between the moving carrier and the space ceiling should be fully considered in practical design. Taking account of the spatial reflection characteristics of GNSS signals, the transmitting antenna should be kept at least 0.3 m away from adjacent reflective walls. Considering the antenna pitch angle characteristics under limited height, it is difficult to expand the vertical layout of antennas. Accordingly, the layout optimization is mainly realized through a reasonable horizontal arrangement in practical environments.
- 2.
- Motion characteristic factor of moving carriers
As illustrated in the previous section, the moving speed is correlated with the amplitude of the peak atlas. Meanwhile, under a fixed data output rate, the moving speed also affects the positioning accuracy. This section analyzes the characteristic differences for typical tunnel and underground utility corridor scenarios.
- (1)
- Direction characteristic
In long and narrow spaces, the degree of freedom of carrier movement is relatively limited. Restricted by environmental constraints and safety regulations, high-speed moving targets are divided into upbound and downbound lanes. Most tunnel environments prohibit temporary parking, reverse driving and overtaking. Consequently, the motion of moving carriers generally presents one-dimensional unidirectional movement.
- (2)
- Speed characteristic
Tunnel scenarios are mainly divided into highway tunnels and railway tunnels. Highway tunnels are dominated by motor vehicles. Affected by the tunnel black hole effect, drivers usually require 7–8 s to adapt to darkness when entering a tunnel from an open area, which necessitates speed reduction. Speed limit signs are generally set before tunnel entrances: the speed limit is 80 km/h for expressway tunnels, 60 km/h for urban road tunnels, and 40 km/h for pedestrian–vehicle mixed tunnels or bidirectional tunnels.
Railway locomotives are less restricted by tunnel speed limits. The current operating speed covers 80 km/h for freight lines, 100–160 km/h for ordinary passenger lines, 160–200 km/h and 200–250 km/h for mixed passenger–freight lines, and 350 km/h for high-speed passenger dedicated lines.
The underground utility corridor is an underground tunnel space constructed for the unified planning, design, construction and management of transportation, power, communication, gas, heating, water supply and drainage systems, serving as the infrastructure network for urban normal operation. The design speed in such spaces is generally set to 60 km/h.
For the convenience of subsequent analysis, moving carriers in typical long and narrow spaces are classified by speed: motor vehicles correspond to a speed no more than 80 km/h, while railway locomotives correspond to a speed higher than 80 km/h.
- 3.
- Output rate factor of user terminals
The data output rate of common navigation user terminals is 1 Hz in standard positioning mode. According to diverse application requirements, the raw data output rate can be configured as 2 Hz, 5 Hz, 10 Hz, 20 Hz and other options, and some high-precision chips even support a data output rate up to hundreds of hertz. While ensuring positioning timeliness, a higher output rate enables dense sampling of the motion process within unit time and acquires more characteristic parameters.
Therefore, the construction of GNSS positioning in long and narrow spaces needs to fully take the above influencing factors into account. Detailed analysis will be presented in the following sections.
4.3. Multi-Peak Spectral Gap Design Considering Detection Accuracy
The multi-peak spectral gap generally refers to the peak interval between adjacent multi-peak points, and its design is mainly related to the array configuration of the Beidou Pseudolite Array Positioning System (BDAPS). A reasonable spectral gap design can not only improve the peak detection accuracy under strong noise environments, but also effectively reduce the networking deployment cost. As analyzed above, the single-array Doppler peak characteristic is only related to individual array elements, so the spectral gap design is mainly dominated by the Doppler single-difference peak characteristic. According to the foregoing relational equations, the Doppler single-difference peak is associated with the inter-element spacing L and array element antenna height h. The antenna height h determines the position of the signal peak within the coverage of dual array elements. When the horizontal spacing between array elements remains constant, the signal peak appears at the geometric center of the two array elements. As the antenna heights of the two array elements vary, the signal peak will shift toward one side of the array element. The inter-element spacing L governs the sharpness of the Doppler single-difference peak characteristic. Meanwhile, longitudinal translation of dual array elements with a fixed spacing L will generate new peaks at different positions; hence, the configuration of L is equivalent to setting the spectral gap interval.
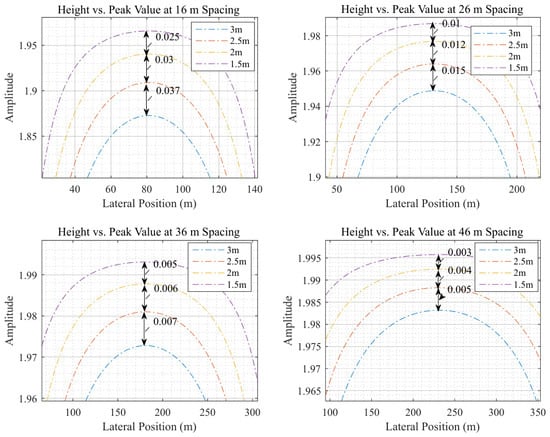
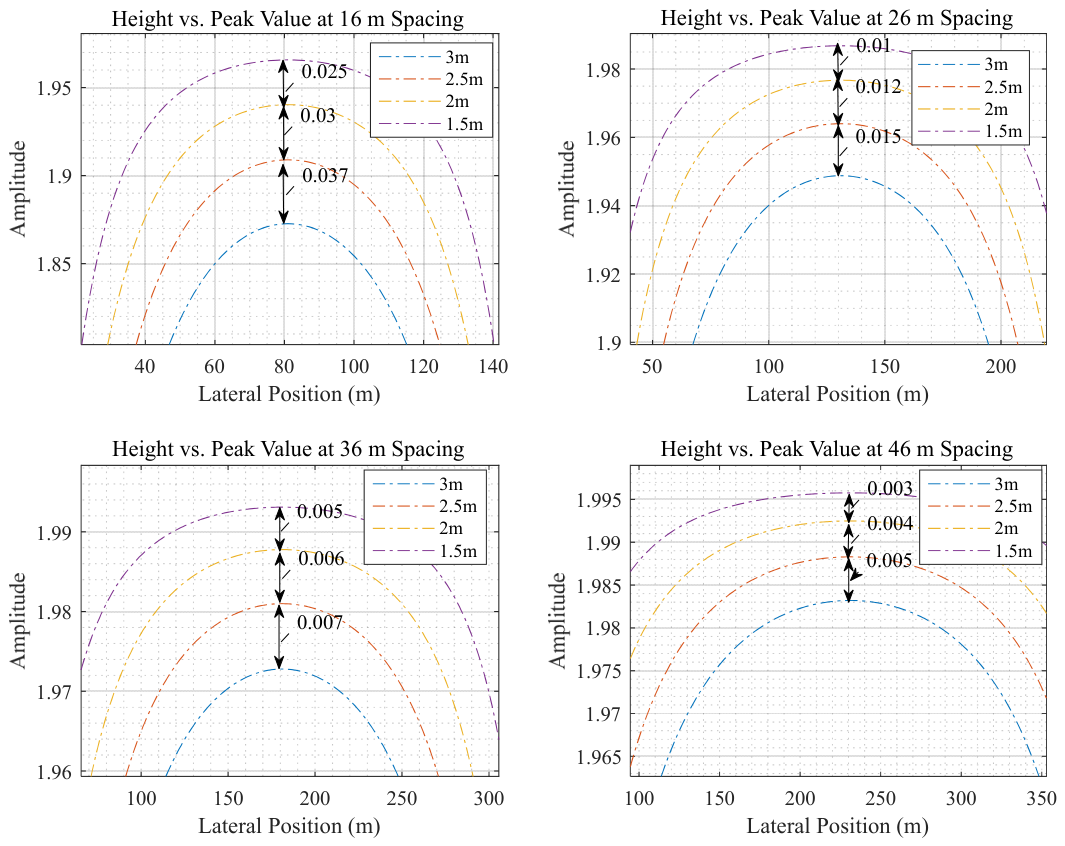
To further analyze the coupling influence of inter-element spacing, antenna height and peak characteristics, combined with the environmental parameters analyzed previously, four inter-element spacings of 16 m, 26 m, 36 m and 46 m are selected, together with antenna heights of 3 m, 2.5 m, 2 m, and 1.5 m. The amplitude characteristics under different spacings are analyzed in Figure 13. It can be observed that the smaller the inter-element spacing, the more significant the amplitude difference caused by different antenna heights. When the spacing is 16 m, the amplitude differences are approximately 0.025, 0.03 and 0.037. When the spacing increases to 36 m or larger, the amplitude difference decreases to the order of magnitude of 10–3. It is evident that, restricted by the actual spatial height of the elongated environment, the influence of antenna height on amplitude characteristics can be approximately neglected. For the convenience of subsequent research, the following analysis mainly focuses on the horizontal spacing design of array elements.
Figure 13.
Peak Variation with Different Spacings and Heights.
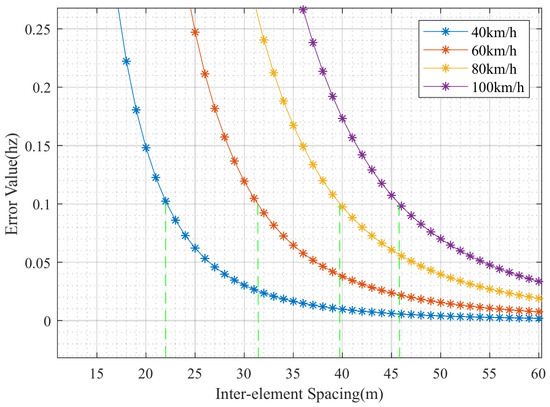
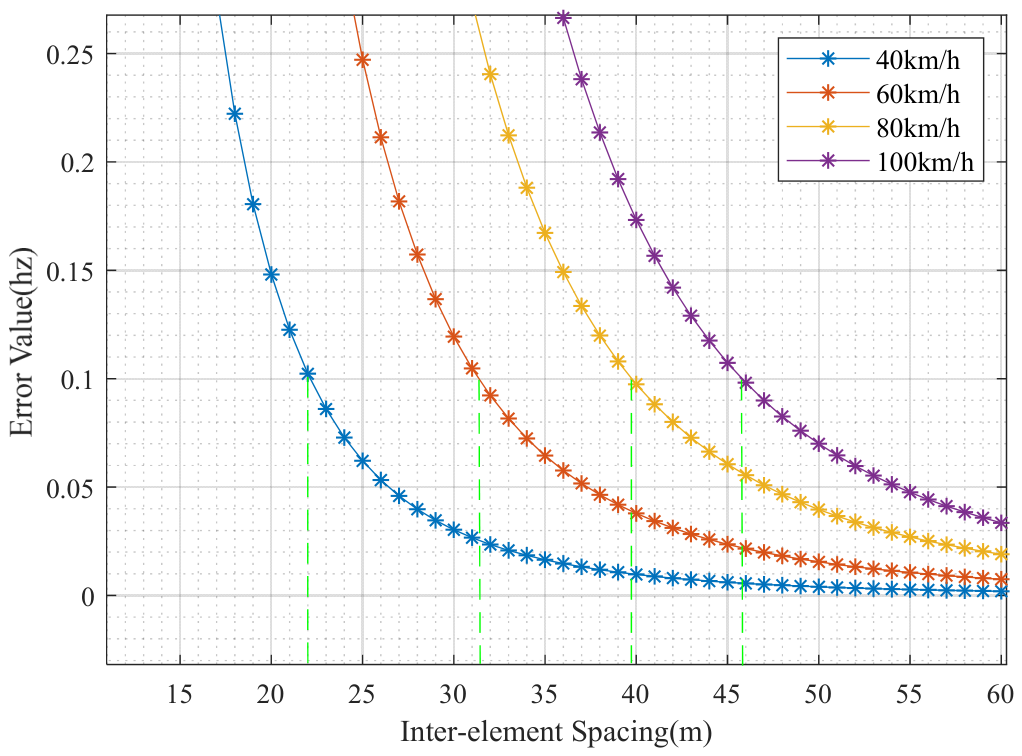
Further, the antenna height is set as a fixed value, and simulation analysis of the inter-peak spectral gap is carried out for different ranges of inter-element spacing. Considering the influence of moving speed on signal amplitude, the amplitude characteristics at speeds of 40 km/h, 60 km/h, 80 km/h and 100 km/h are analyzed respectively. Meanwhile, the moving speed is closely related to the variation in signal amplitude between adjacent epochs. Combined with the error factors in the previous section, it is determined that the peak can be accurately detected when the actual epoch error reaches 1.5 times the noise interference level. On this basis, the simulation results are presented in Figure 14. It can be seen that the allowable inter-element spacing is no more than 22 m at a speed of 40 km/h; no more than 31 m at 60 km/h; no more than 40 m at 80 km/h; and no more than 46 m at 100 km/h.
Figure 14.
Relationship Between Velocity and Inter-element Spacing.
4.4. Multi-Peak Atlas Design Considering Positioning Accuracy
Atlas design mainly establishes the corresponding relationship between the peak spectrum and the spatial position. According to the environmental factor analysis in Section 4.2, the improvement of positioning accuracy is related to both the output rate of the receiver terminal and the moving speed. This section focuses on the analysis of these two influencing factors.
First, to verify the influence characteristics between moving speed and peak detection, field tests are carried out in an underground utility corridor. Due to the lack of available reference benchmarks, a high-precision vehicle-mounted inertial measurement unit is adopted as the reference. When a peak is detected, the position information output by the inertial unit is compared with the theoretical coordinate value corresponding to the actual peak point. The vehicle traveling speeds are set to 40 km/h, 60 km/h and 80 km/h, and the user terminal output rate is fixed at 20 Hz. Table 1 presents the actual test errors under forward and reverse driving conditions of the vehicle.
Table 1.
Analysis of positioning accuracy.
By analyzing the above measured data, it is found that the positioning errors differ under the three driving speeds. At 40 km/h, the mean error (ME) of position estimation is 25.78 cm and the root mean square error (RMSE) is 10.76 cm. At 60 km/h, the ME is 31.59 cm and the RMSE is 17.8 cm. At 80 km/h, the ME reaches 45.65 cm with an RMSE of 15.97 cm. It can be seen from the table that the mean and variance of positioning errors vary significantly at different speeds.
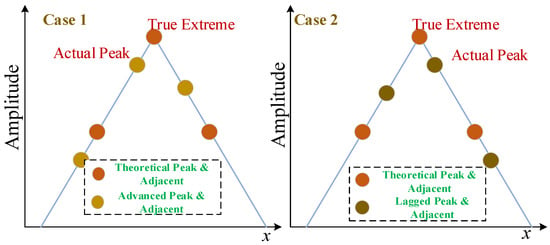
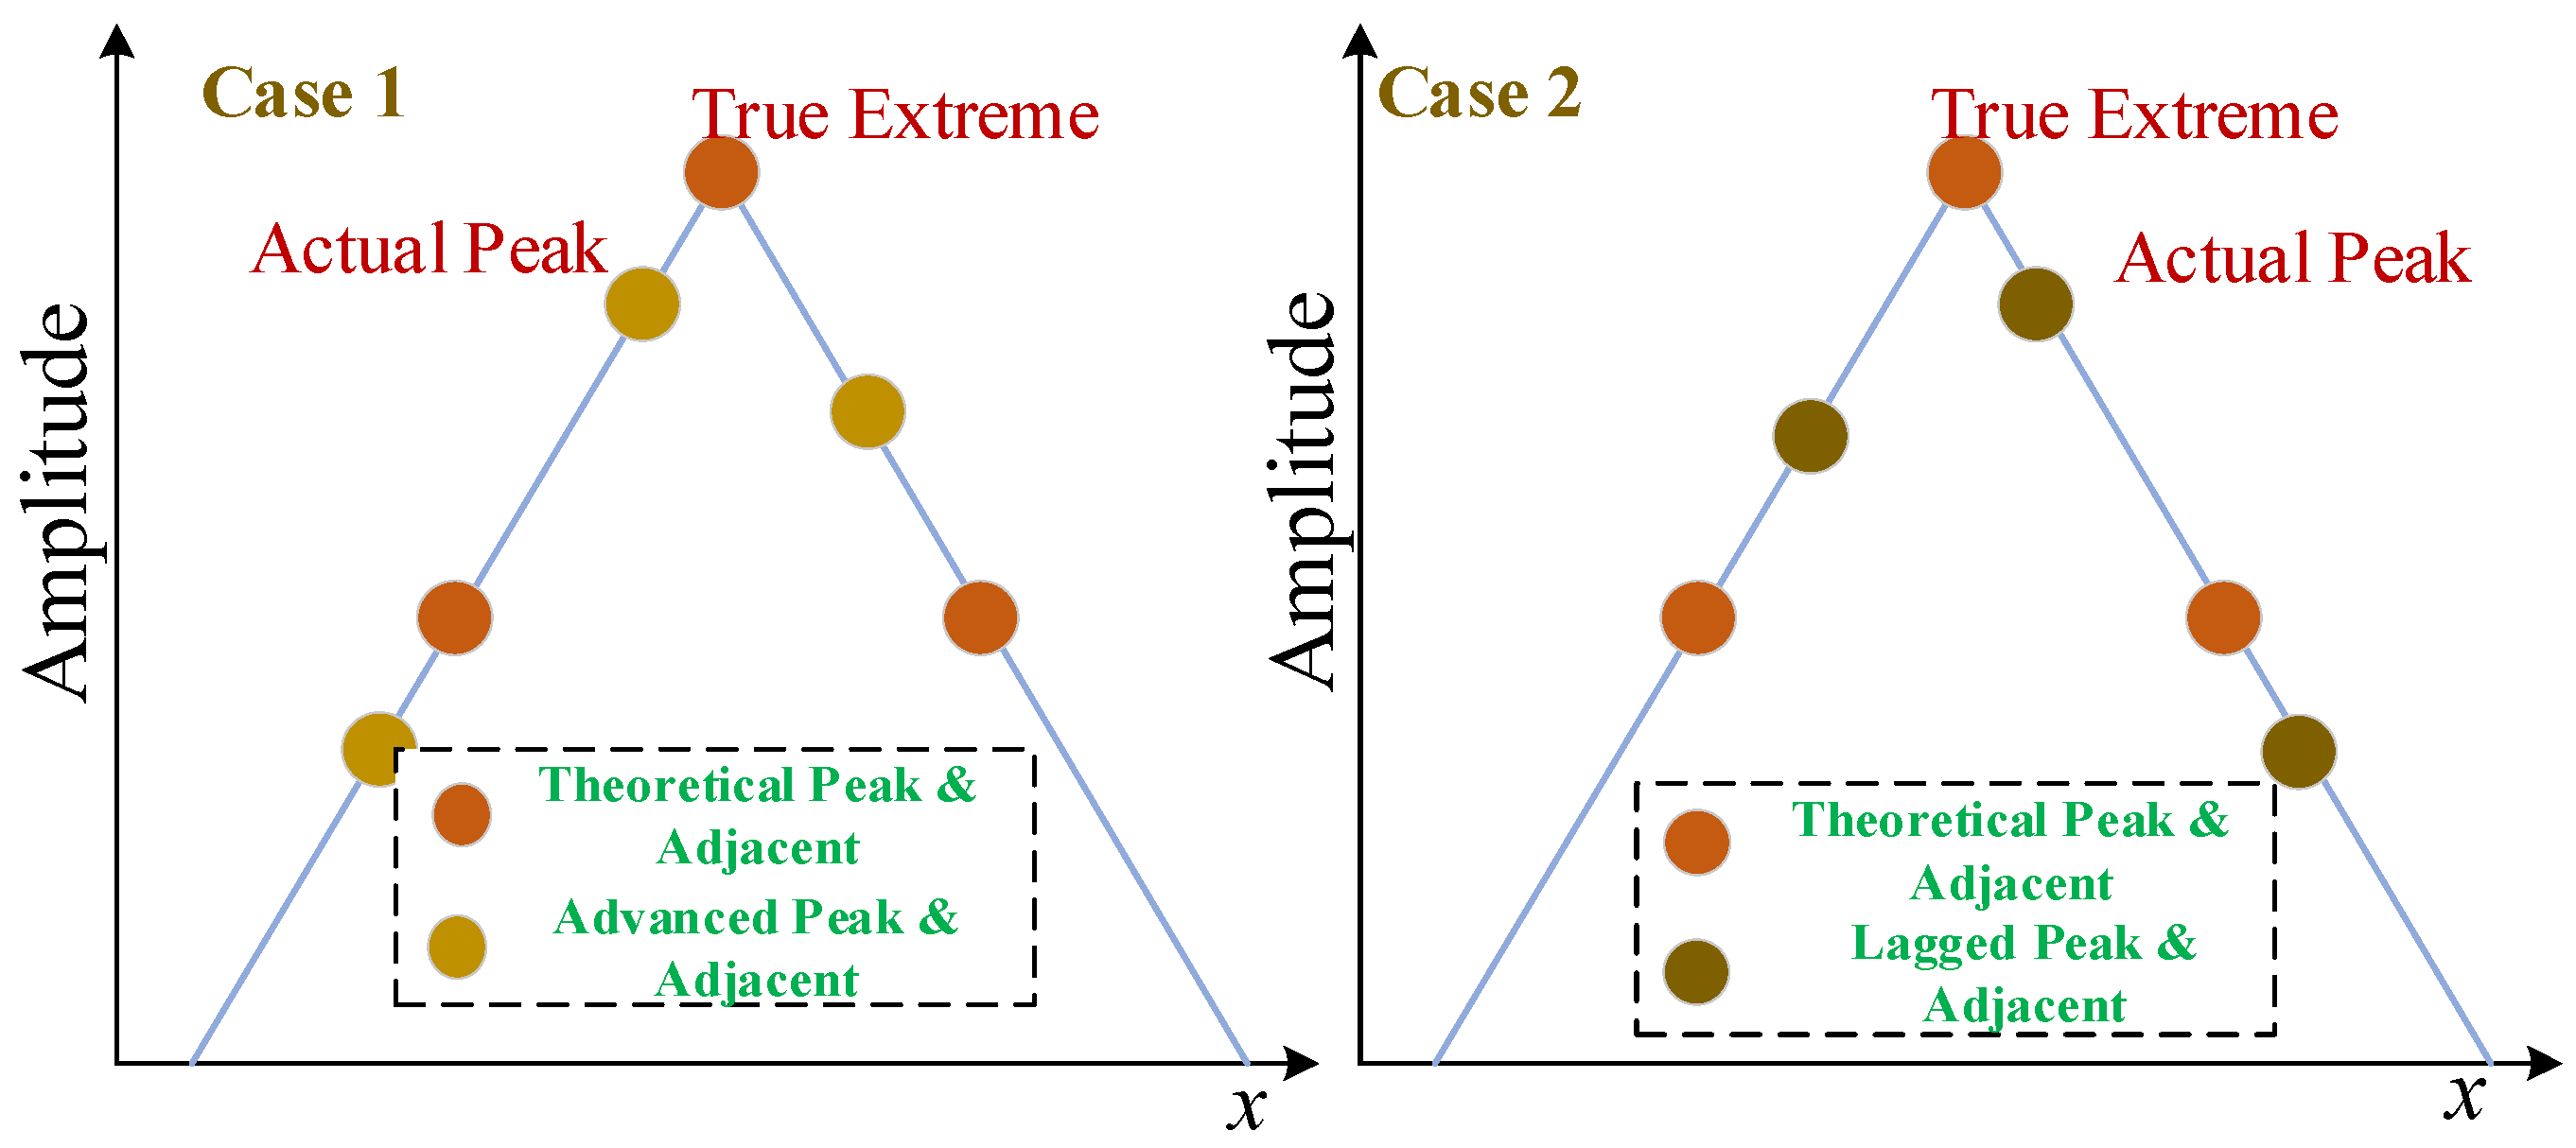
The positioning measurement error mainly originates from the offset between the detected peak moment at the data output epoch and the true peak position. Two typical offset scenarios are illustrated in Figure 15 for clearer interpretation. The first is peak advance: under the given receiver data output rate, the sampled Doppler value closest to the true peak appears earlier than the actual peak moment, leading to an advance deviation in the extracted positioning result. The second is peak lag: the sampled Doppler value closest to the true peak occurs after the real peak moment, resulting in a time-delay offset of the positioning solution.
Figure 15.
Theoretical Analysis-Positioning Error.
In general, the positional deviation between the sampled output point and the true peak position ranges from 0 to , where denotes the instantaneous moving speed and represents the time duration of a single epoch. As the moving speed increases, the range of speed-induced positioning error increases correspondingly.
With a fixed moving speed, a lower data output rate leads to poorer positioning accuracy. Different output rates of the user terminal correspond to the sampling process of the vehicle’s position over time. A higher output rate provides denser real-time position sampling points, making the detected position closer to the true value. Therefore, it is necessary to analyze the displacement interval of a single sampling epoch combined with the moving speed. The relationship among single-epoch displacement interval, moving speed and data output rate is expressed as follows:
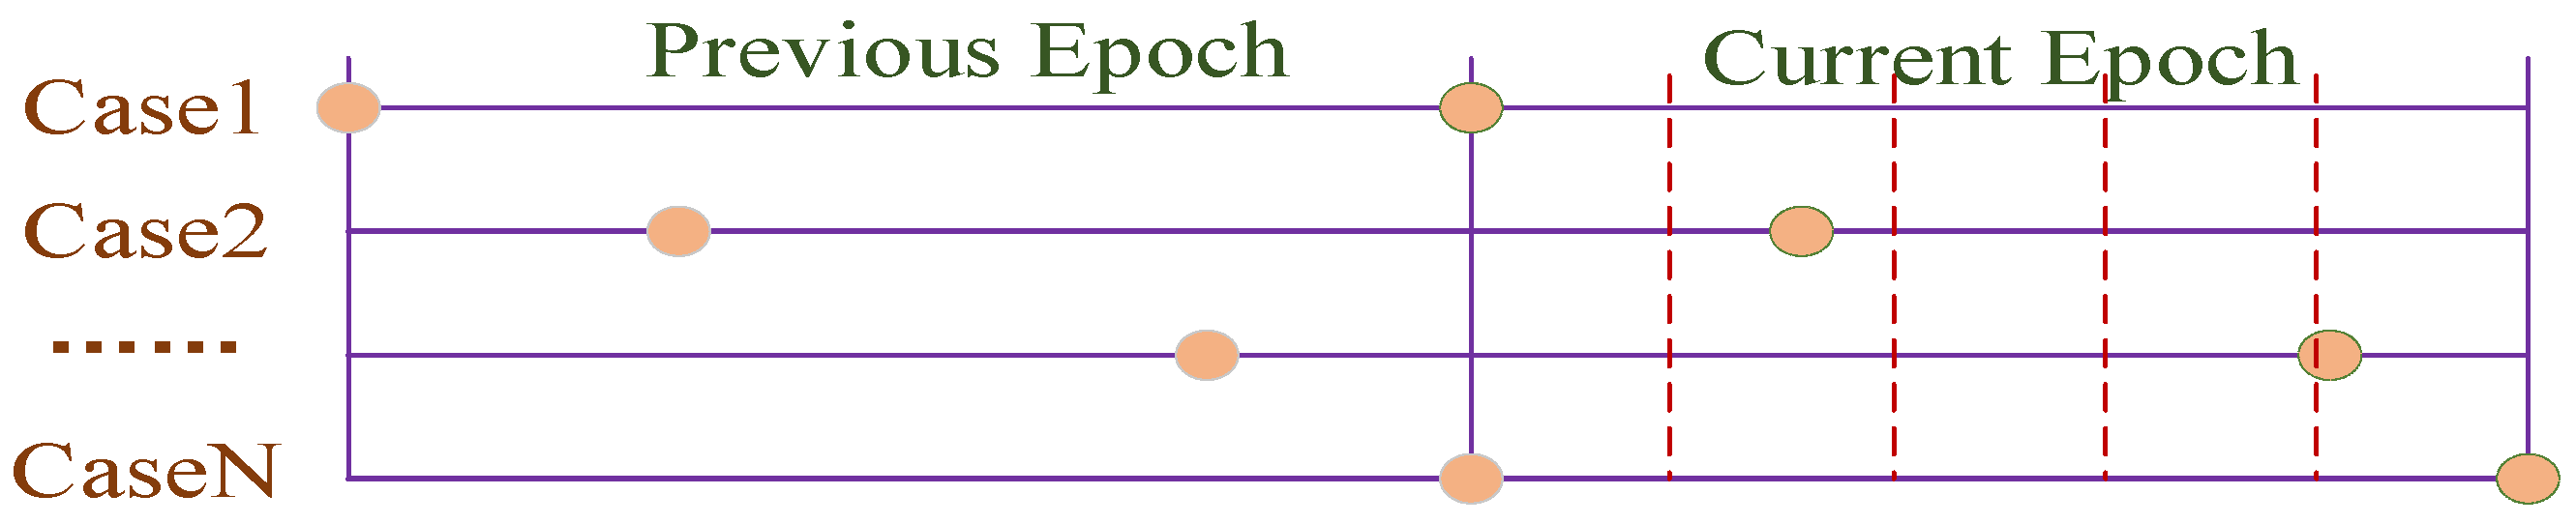
Since the position of the previous epoch cannot be determined exactly, the position at the current epoch after a single epoch interval remains unfixed. As shown in Figure 16, the current position may be any point within the single-epoch displacement interval. To realize effective position detection, the effective coverage range of the peak atlas should be no less than the width of one single-epoch displacement interval, and the solved position is represented by the optimal adjacent peak point. If the position information at the dashed line in Figure 15 can be acquired, the positioning accuracy at the current epoch will be further improved. Accordingly, designing a multi-peak spectrum within the width of the single-epoch displacement interval and increasing the detection density of spectral peaks can effectively enhance the accuracy of position recognition.
Figure 16.
Relationship of Positioning Accuracy.
Taking the output frequencies of positioning terminals (1 Hz, 5 Hz, 10 Hz, 20 Hz) as examples, this paper analyzes the positioning errors corresponding to different driving speeds and different numbers of spectral peaks. The epoch intervals under various motion states are presented in Table 2 below.
Table 2.
Epoch Intervals under Different States.
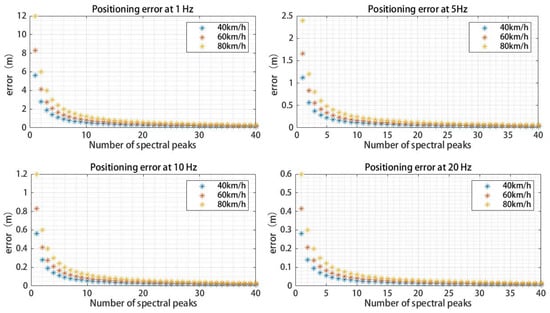
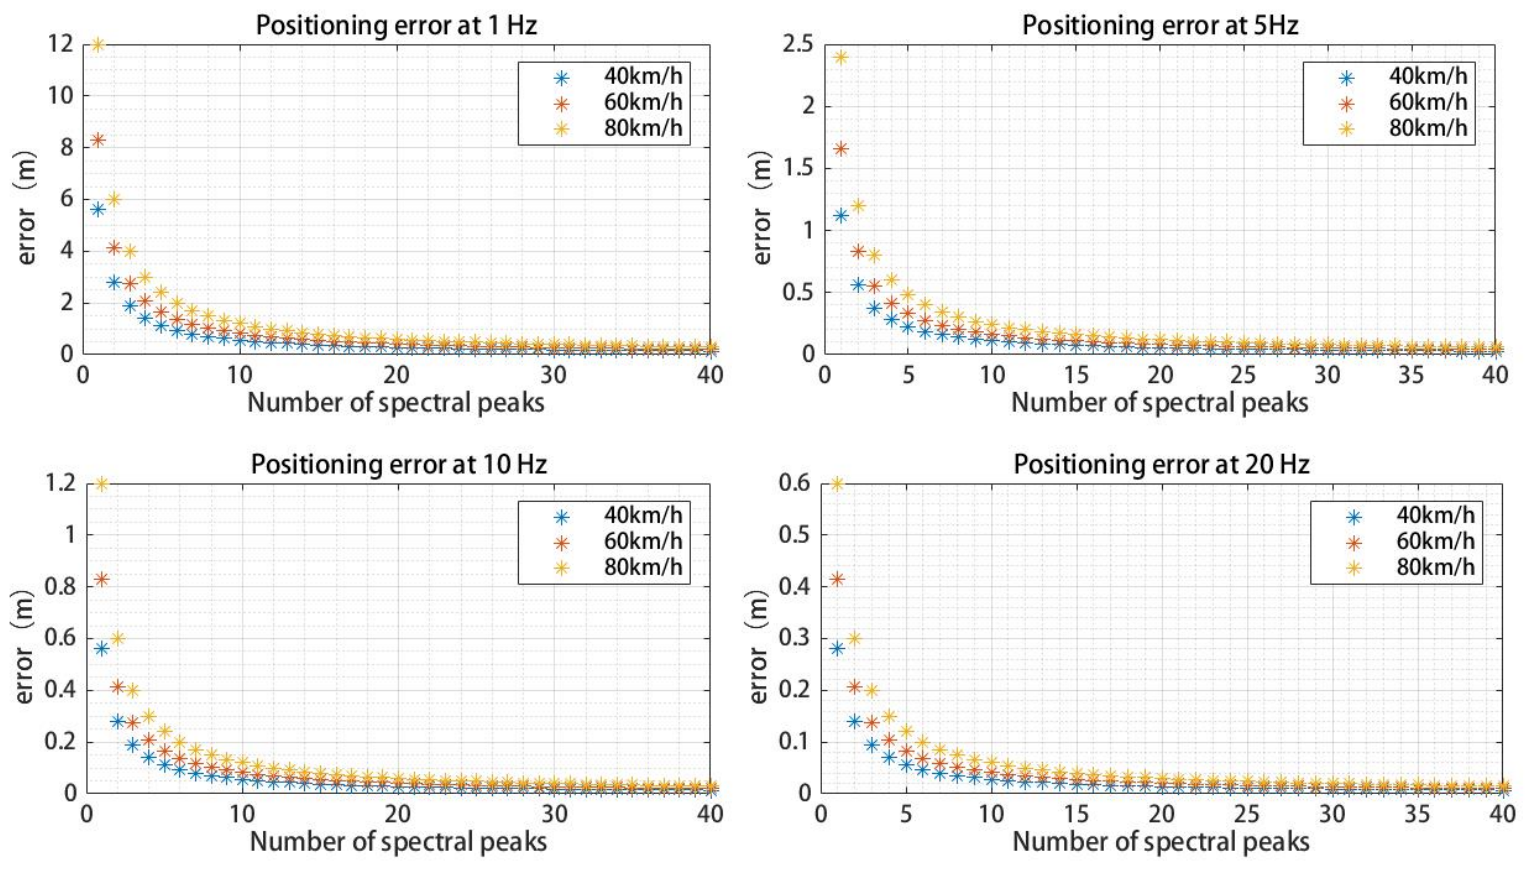
Figure 17 presents the analysis results of the relationship between spectral peak number and positioning error. When the output rate of the space-time box terminal is 1 Hz, sub-meter positioning accuracy can be achieved if the number of spectral peaks exceeds 12. At an output rate of 5 Hz, sub-meter positioning capability is available when the number of spectral peaks is more than 3. For output rates of 10 Hz and 20 Hz, positioning accuracy within 1 m can be realized with only 2 spectral peaks.
Figure 17.
Positioning Error Analysis of Moving Carrier.
4.5. Array Element Spacing Design Considering Near-Far Effect
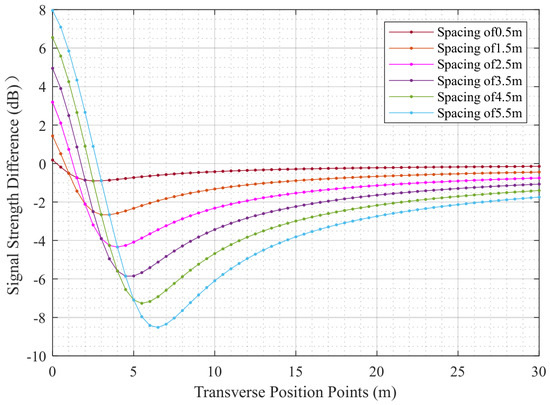
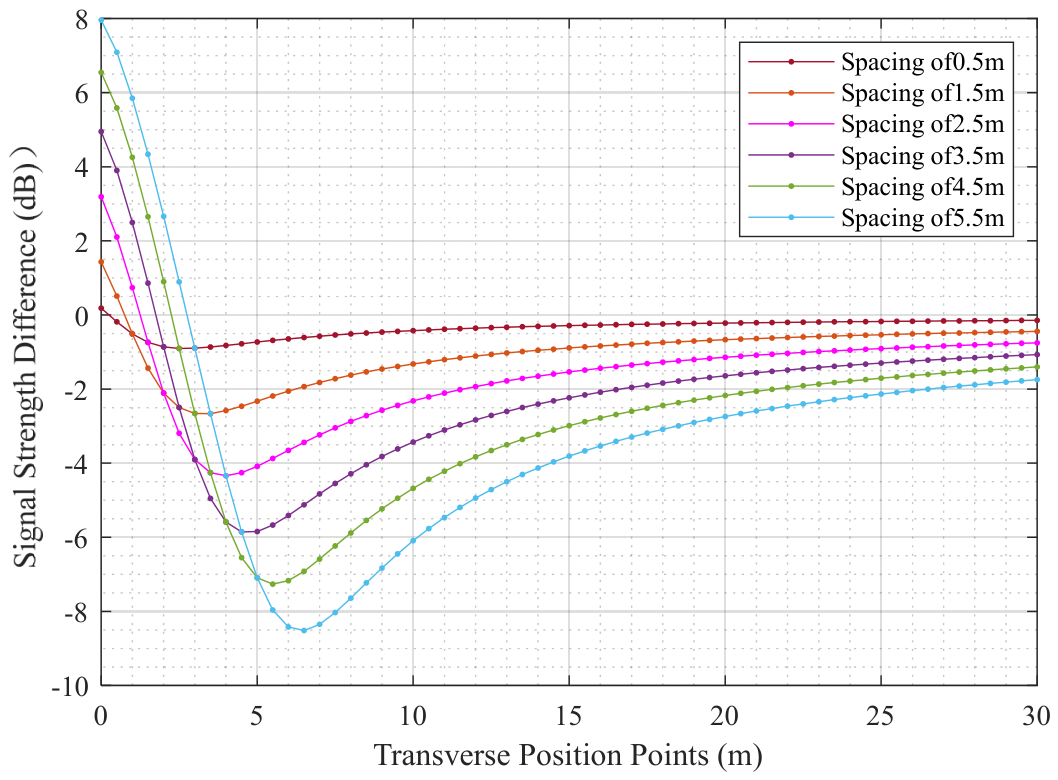
In the above analysis, the influence of spectral peak number is first investigated. Since the actual design of spectral peaks is closely related to the array configuration of GNSS antenna elements around position nodes, it is necessary to further consider the coupling effect of array element spacing and the near-far effect. References [11,12,13,14,15,16] have analyzed the characteristics and suppression methods of the near-far effect for pseudolites. In general, when the power difference between strong and weak signals received by the receiver exceeds 20 dB, the strong signal will severely interfere with the weak one, and even make it impossible to capture the desired signal. During the vehicle dynamic test in the underground utility corridor, actual measurements show that when the signal power difference between adjacent channels reaches approximately 6–8 dB, the vehicle-mounted terminal suffers frequent signal loss-of-lock and difficult signal acquisition. According to the propagation path loss formula of wireless signals, the signal strength differences under different element spacings are shown in Figure 18. For single-site array layout design, the spacing between array elements should be controlled within 5 m as far as possible, so as to avoid the influence of the near-far effect on receiver signal reception.
Figure 18.
Influence of Inter-element Spacing on Near-Far Effect.
5. Discussion
This paper systematically analyzes the key influencing factors of the Beidou micro-base station atlas network. Through rational network configuration design, continuous and stable positioning requirements for different moving carriers (motor vehicles ≤ 80 km/h and railway locomotives > 80 km/h) are satisfied, relying on a single feature parameter, with positioning accuracy ranging from the sub-meter level to the centimeter level. Specifically, at a traveling speed of 40 km/h, the mean error (ME) is 25.78 cm and the root mean square error (RMSE) is 10.76 cm. By integrating the absolute position positioning domain and the rate domain of kinematic Doppler, the concepts of the positioning domain and transition domain are proposed in this study. Benefiting from regionalized deployment and the advantage of dispensing with prior data collection and model training, the network deployment cost is greatly reduced. Compared with inertial navigation and LiDAR technologies, the proposed method effectively avoids the irreversible accumulation of long-term positioning errors. It guarantees continuous and stable positioning accuracy in narrow and long shielded spaces via continuous position correction. In future work, the research team will focus on the optimization of the kinematic Doppler atlas network and multi-source fusion positioning algorithms to improve the technical robustness and promote the development of high-precision positioning technology for unmanned carriers in ultra-long, narrow and long spaces.
Author Contributions
All authors together developed the idea that led to this paper. H.Z. proposed the idea of applying the kinematic Doppler effect to absolute positioning and the method of network map design based on kinematic Doppler. B.Y., C.S. and S.P. provided critical comments and contributed to the final revision of the paper. S.D., S.L. and J.C. supported the design and analysis of the relevant map network. All authors have read and agreed to the published version of the manuscript.
Funding
This research was funded by Xiongan New Area Science and Technology Innovation Special Project (No. 2023XAGG0081) and Hebei Natural Science Foundation (No. F2024523004).
Data Availability Statement
The data presented in this study are available on request from the corresponding authors.
Conflicts of Interest
Author Heng Zhang Baoguo Yu Shiyuan Liu Jianqiang Cheng and Shitong Du was employed by the company The 54th Research Institute of China Electronics Technology Group Corporation. The remaining authors declare that the research was conducted in the absence of any commercial or financial relationships that could be construed as a potential conflict of interest.
References
- Progri, I.F.; Michalson, W.R. An Underground System of Stationary Pseudolites. J. Geolocation Geoinf. Geointell. 2020, 2020, 38–47. [Google Scholar] [CrossRef] [Scilit]
- Ma, E.S.; Li, J.K.; Xiu, C.D.; Liao, C.P. Review of tunnel positioning methods. In Proceedings of the 15th National Conference on Signal and Intelligent Information Processing and Application; China High-Tech Industrialization Research Association, Intelligent Information Processing Industrialization Branch: Beijing, China, 2022; pp. 186–190. [Google Scholar]
- Zhang, H.T. Application of Beidou-Based Navigation Enhancement System in Tunnels. China Transp. Informatiz. 2019, 124–125, 138. [Google Scholar]
- Hu, R. Design and Implementation of Beidou/GPS Satellite Simulation Signal Transmission System for Train Positioning. Ph.D. Thesis, Beijing Jiaotong University, Beijing, China, 2020. [Google Scholar]
- Jiang, Y.; Zhang, W.Y.; Lian, C.M.; Ma, Z.D. Research on Navigation and Positioning Extension System Based on Beidou Satellites in High-Speed Railway Tunnels. Railw. Signal. Commun. 2020, 56, 48–51. [Google Scholar]
- Yan, F.; Song, M.Z. Virtual Relay Positioning Algorithm in Tunnels Using Simulator Pseudolites. Comput. Meas. Control 2022, 30, 186–191+198. [Google Scholar]
- Wang, X.; Li, Z.; Xiao, W.; Wen, Z. A Tunnel Internal Positioning Method Based on Pseudolites. China Patent CN109031377A, 18 December 2018. [Google Scholar] [PubMed]
- Xu, P.N.; Cao, X.C.; Zhang, J.; Li, Z.H.; Li, N.; Zhang, B. Research on Performance Improvement of Beidou Pseudolites in Tunnels. Highway 2023, 68, 279–284. [Google Scholar]
- Kang, Y. Application of Beidou Satellite Navigation Technology in Tunnel Positioning. Digit. Commun. World 2023, 5, 8–10. [Google Scholar]
- Zhang, X.G.; Li, Y.J.; Zhou, H.; Wang, G.; Li, L. Experiment of Tunnel Positioning Based on Multi-Frequency Carrier Phase. Res. Explor. Lab. 2023, 42, 11–16+20. [Google Scholar]
- Ye, H.J.; Wei, B.G.; Zhou, B.L. Optimization Study on Pulse Modulation Scheme of Galileo Pseudolites. Radio Eng. 2008, 38, 40–42+46. [Google Scholar]
- Ye, H.J. Analysis and Research on Pseudolite Near-Far Effect. Radio Eng. 2010, 40, 31–33+61. [Google Scholar]
- Zhang, L.; Wang, J.Y.; Dai, N. Analysis and Research on Pseudolite Near-Far Effect Based on TDMA Technology. Comput. Technol. Dev. 2007, 17, 167–170. [Google Scholar]
- Madhani, P.H.; Axelrad, P.; Krumvieda, K.; Thomas, J. Application of Successive Interference Cancellation to the GPS Pseudolite Near-Far Problem. IEEE Trans. Aerosp. Electron. Syst. 2003, 39, 481–488. [Google Scholar] [CrossRef] [Scilit]
- Ai, S.F.; Yu, A.Q.; Feng, J.N. Research on Pseudolite Receiver for Suppressing Near-Far Interference. Acta Electron. Sin. 2010, 38, 1837–1839. [Google Scholar]
- Wang, J.; Lian, B.W.; Zhang, Z.P. Research on GPS Pseudolite Anti-Near-Far Effect Method Based on Interference Cancellation. Meas. Control Technol. 2008, 27, 43–48. [Google Scholar]

Disclaimer/Publisher’s Note: The statements, opinions and data contained in all publications are solely those of the individual author(s) and contributor(s) and not of MDPI and/or the editor(s). MDPI and/or the editor(s) disclaim responsibility for any injury to people or property resulting from any ideas, methods, instructions or products referred to in the content. |
© 2026 by the authors. Licensee MDPI, Basel, Switzerland. This article is an open access article distributed under the terms and conditions of the Creative Commons Attribution (CC BY) license.