1. Introduction
Thermal power generating units are increasingly required to provide flexibility services in power systems with high renewable penetration. In current ancillary-service management, frequency-regulation-related services are treated as an important part of power-system operation, which means that thermal units are assessed not only by steady-state economy but also by their ability to support grid frequency [
1]. Fan et al. established and verified a dynamic model of a 1100 MW supercritical coal-fired power plant with high–low position shafts and showed that coal-fired units remain important primary frequency regulation (PFR) resources in systems with high renewable penetration [
2]. Kang et al. optimized the PFR performance of coal-fired units under boundary operating conditions and demonstrated that PFR response is constrained by the operating state and control strategy of the unit [
3]. Hong et al. proposed an assessment mechanism for the PFR capability of a supercritical thermal power plant under deep peaking, indicating that the available PFR capability changes with the load level and operating condition [
4]. Tang et al. studied frequency-regulation enhancement of a combined heat and power unit using energy stored in the steam distribution system, showing that steam-side stored energy can be mobilized to support short-time active-power response [
5].
From the perspective of boiler–turbine modeling and control, Mohamed et al. reviewed modeling and control methods for supercritical and ultra-supercritical power plants and emphasized that coordinated-control-oriented models are essential for flexible operation [
6]. Fan et al. developed a dynamic nonlinear model for ultra-supercritical once-through boiler–turbine units over a wide load range, which is directly relevant to the dynamic modeling of coal-fired units under renewable-integration requirements [
7]. Zhang et al. established a dynamic model of supercritical once-through circulating fluidized bed boiler–turbine units, further showing that high-fidelity boiler–turbine models are necessary for controller-oriented simulation [
8]. Liu et al. proposed a dynamic model used for controller design of coal-fired once-through boiler–turbine units, which remains an important reference for coordinated boiler–turbine control studies [
9]. Earlier foundational work, including the simplified nonlinear drum-boiler–turbine model of Åström and Eklund [
10] and the boiler model for power-system dynamic performance studies proposed by de Mello [
11], provides the theoretical basis for describing pressure, flow, stored energy, and control–action coupling in thermal generating units.
From the perspective of thermodynamic and exergy assessment, Adibhatla and Kaushik [
7] compared constant-pressure and pure sliding-pressure operation of a supercritical thermal power plant and showed that control valve throttling is closely related to turbine-side exergy destruction under part-load operation [
12]. Agrež et al. directly investigated steam passing through a turbine inlet control valve assembly and quantified the associated entropy generation and exergy loss, which provides a physical basis for analyzing the thermodynamic consequence of valve throttling [
13]. Wang et al. analyzed the transient thermodynamic behavior of a 660 MW supercritical unit during cycling operation and demonstrated that transient flexibility processes can change the distribution of energy and exergy losses in a coal-fired power plant [
14]. Zhao et al. investigated the exergy effects of several operational-flexibility regulation measures in supercritical coal-fired power plants during transient processes and emphasized that flexibility improvement and thermodynamic economy are not independent objectives [
15].
Several recent studies further show that throttling-based or stored-energy-based flexibility measures generally involve an efficiency–flexibility trade-off. Zhang et al. analyzed condensate throttling and explicitly reported the contrast between flexibility enhancement and thermal efficiency during the condensate throttling process [
16]. Wang et al. optimized a coordinated control strategy assisted by high-pressure extraction steam throttling to improve flexible and efficient operation of thermal power plants [
17]. Liu et al. further optimized the control schemes of throttling high-pressure extraction steam and showed that extraction steam throttling affects both flexibility and operational stability [
18]. Wang et al. proposed a flexibility improvement method based on multi-scale utilization of steam turbine energy storage, showing that different time scales of stored energy can be used to support load regulation [
19]. Wang et al. considered detailed and time-varying boiler heat storage characteristics in control strategy improvement, demonstrating that boiler-side stored energy can be used to co-enhance flexibility and efficiency [
20]. Chen et al. developed digital twin modeling and operation optimization for the steam turbine system of thermal power plants, reflecting the recent trend toward data-informed operation and performance optimization [
21].
Thermal energy storage has also been widely investigated as an alternative route for improving coal-fired power plant flexibility. Zhang et al. designed and evaluated a new thermal energy storage system integrated within a coal-fired power plant, indicating that storage integration can reshape the operating boundary of the unit [
22]. Miao et al. performed energy, exergy, and economic analyses of coal-fired power plants integrated with a power-to-heat thermal energy storage system [
23]. Miao et al. also evaluated a thermal energy storage system with hybrid heat sources integrated within a coal-fired power plant, showing that the heat-source selection affects system performance [
24]. Xu et al. compared thermodynamic performance when a coal-fired power plant is integrated with a molten-salt thermal storage system [
25]. Li et al. optimized the operation strategy of a coupled molten-salt energy storage system for a coal-fired power plant from a thermodynamic perspective [
26]. Ma et al. analyzed a deep peak-shaving scheme based on high-temperature molten-salt heat storage for thermal power units [
27]. Zhang et al. developed a dynamic model of a coal-fired power plant integrated with molten-salt thermal energy storage and evaluated its dynamic characteristics and economic performance for improving peaking capacity [
28]. Mu et al. studied the dynamic characteristics and real-time control of a flue gas–molten salt heat exchanger for flexibility transformation of coal-fired power plants [
29]. Wang et al. investigated how the integration mode and hot-storage temperature of a molten-salt heat storage system affect the flexibility of a subcritical coal-fired power plant [
30]. Polski et al. proposed an electric-feedwater-heater-based flexibility concept for steam power plants, further showing that auxiliary thermal equipment can be used to modify the load-regulation boundary of steam power systems [
31].
The above literature demonstrates that coal-fired and supercritical thermal power units can improve PFR and flexibility through dynamic control, boiler heat storage, steam turbine stored energy, extraction steam throttling, condensate throttling, steam distribution system energy, digital twin optimization, electric feedwater heating, and thermal energy storage. However, most existing studies focus on the dynamic response after a load or frequency event, the control strategy during the response process, or the energy/exergy consequences of a broader flexibility measure. The narrower pre-disturbance question remains insufficiently isolated: at a fixed electrical output and fixed upstream main-steam condition, what steady-state fuel and heat-rate penalty is paid when a unit reserves additional control valve opening margin by operating at a smaller steady valve opening?
In this paper, the term “steady-state valve-margin efficiency trade-off” refers to the relationship between the reserved control valve opening margin and the same-load thermodynamic penalty caused by the associated throttling state before a frequency disturbance occurs. This distinction is important because the reserve is prepared before the frequency event, whereas the dynamic PFR response is delivered after the event. The valve-throttling mechanism is physically connected to the entropy and exergy generation described for turbine inlet control valves [
13]. The need to evaluate flexibility and efficiency together is also consistent with the condensate-throttling analysis of Zhang et al. [
16]. The high-pressure extraction steam throttling studies of Wang et al. [
17] and Liu et al. [
18] further indicate that throttling-based flexibility measures should not be assessed only by their dynamic response benefit. Nevertheless, these studies do not specifically quantify the same-load steady-state efficiency penalty of reserving control valve opening margin for valve-based PFR preparation.
Accordingly, the present study focuses on a same-load steady-state comparison with fixed upstream main-steam pressure and temperature. The contribution of this study lies in three aspects. First, it establishes a clear same-load comparison principle for valve-margin reservation, thereby separating the pre-disturbance reserve-setting cost from the post-disturbance frequency-response benefit. Second, it formulates a compact boiler–valve–turbine coupled calculation chain in which the valve flow relation and the turbine power equation are solved together to determine the valve-downstream pressure and the required main-steam flow rate. Third, it converts the calculation workflow into an interpretable thermodynamic framework that links valve opening, throttling state, downstream entropy, effective specific work, required steam flow, fuel demand, heat rate, and equivalent efficiency. Therefore, this study does not claim to replace full dynamic PFR assessment; rather, it quantifies the steady-state thermodynamic price of valve-margin reservation under fixed upstream steam conditions and fixed electrical output, thereby providing a baseline for subsequent dynamic PFR benefit and multi-objective operation studies.
3. Calculation Logic and Governing Equations
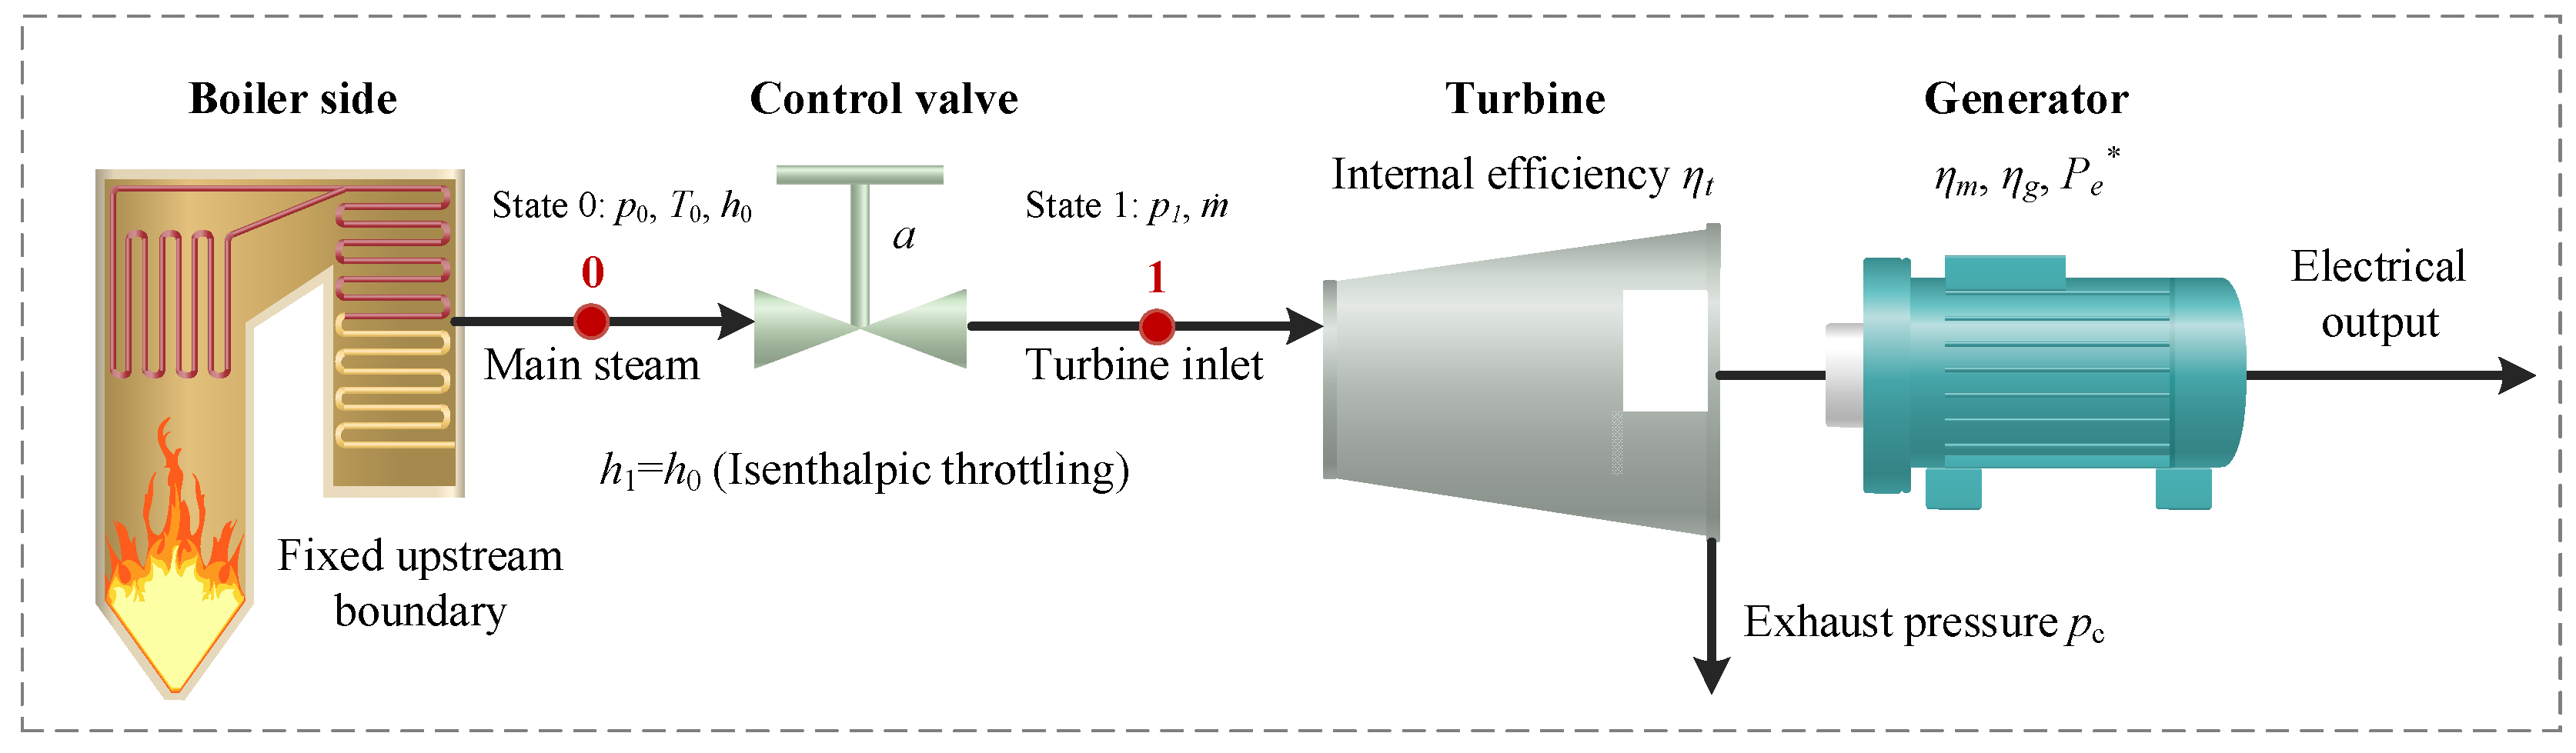
For a specified upstream condition (p0, T0), steady valve opening a, and target electrical power Pe*, the unknown downstream pressure p1 and the required main-steam flow rate ṁ are solved simultaneously. The logic is the same for all valve-margin cases; only a changes from one case to another.
3.1. Upstream Steam State
The upstream state is obtained from the fixed boiler-side boundary condition. In the present workflow, the required steam properties are calculated using the IAPWS Industrial Formulation 1997 for the Thermodynamic Properties of Water and Steam, namely IAPWS-IF97 [
32,
33]. IAPWS-IF97 is used only as the thermodynamic property calculation basis; the physical simplification of the present work remains a same-load steady-state model with fixed boiler-side upstream boundary conditions rather than a dynamic boiler model.
where
h0,
s0, and
ρ0 are the upstream specific enthalpy, entropy, and density, respectively;
p0 is the upstream main-steam pressure; and
T0 is the upstream main-steam temperature.
3.2. Control Valve Relation
A calibrated simplified flow-capacity relation is adopted for the control valve. For the current data set, a linear characteristic is used, i.e., f(
a) =
a.
where
ṁ is the main-steam mass flow rate through the control valve;
Kmax is the calibrated valve coefficient; f(
a) is the valve characteristic function;
a is the steady control valve opening; and
p1 is the valve-downstream pressure. The factor 10
6 converts MPa to Pa.
The valve coefficient Kmax was calibrated using the baseline operating point, Case A0.90. At this operating point, the steady control valve opening is a0 = 0.90, the upstream pressure is p0 = 16.670 MPa, the valve-downstream pressure is p1 = 16.062 MPa, the upstream density is ρ0 = 50.164 kg/m3, and the required main-steam flow rate is ṁ0 = 273.427 kg/s. For the linear valve characteristic f(a0) = a0, Kmax is calculated as 0.055 kg/s·(Pa·kg/m3)−0.5. After calibration, Kmax is kept constant for all valve opening cases. The self-consistency of the calibration is checked by substituting the calculated downstream pressures and valve openings back into the valve flow equation. The resulting main-steam flow rates are consistent with those required by the turbine power equation within rounding accuracy. Therefore, Kmax is not treated as an adjustable parameter for each case, but as a fixed flow-capacity coefficient calibrated at the baseline operating point.
The linear valve characteristic is used as the baseline effective valve opening relation in the present calculation. In this study, a denotes the steady control valve opening used in the plant-level calculation rather than a manufacturer-specific inherent valve characteristic curve. Therefore, f(a) = a is adopted as a transparent baseline approximation for the main calculation.
To evaluate the influence of the assumed valve characteristic, additional sensitivity calculations are performed using equal-percentage characteristics and a representative quick-opening approximation. In control valve theory, the inherent flow characteristic describes the relationship between valve opening and flow capacity under constant-pressure-drop conditions, and commonly used characteristic types include linear, equal-percentage, and quick-opening characteristics. The equal-percentage characteristic is commonly defined such that equal increments of valve travel produce equal percentage changes in flow capacity. A standard form of the equal-percentage characteristic can be written as Q/Qmax = Ra−1, where R is the valve rangeability and a is the normalized valve opening.
Because the valve-capacity function used in the present model is normalized as f(0) = 0 and f(1) = 1, the following normalized equal-percentage form is used in the sensitivity calculation: fEP(a) = (Ra − 1)/(R − 1).
In this study, R = 30, 50, and 100 are tested to represent different equal-percentage curve steepness levels. The quick-opening characteristic generally denotes a concave characteristic that produces a large flow-capacity increase at small valve openings. Therefore, a normalized concave function, fQO(a) = a0.5, is used here only as a representative quick-opening approximation for sensitivity analysis. For each alternative characteristic, Kmax is recalibrated at the baseline Case A0.90 so that the baseline operating point remains unchanged. The sensitivity comparison therefore focuses on how the assumed valve characteristic affects the penalty from Case A0.90 to Case A0.70, rather than mixing the valve-characteristic effect with a shifted baseline condition.
3.3. Turbine-Side Thermodynamic Relations
The valve is treated as an ideal throttling element, so the throttling process is assumed to be isenthalpic. The downstream valve state then becomes the turbine inlet state. Under fixed exhaust pressure pc and fixed turbine internal efficiency
ηt, the effective specific work is calculated by the following sequence. This interpretation is consistent with the throttling-entropy mechanism reported for turbine inlet control valves [
13].
where
h1 is the valve-downstream specific enthalpy, which is equal to
h0 under the ideal-throttling assumption.
where
s1 is the valve-downstream specific entropy.
where
h2s is the isentropic exhaust specific enthalpy at the given exhaust pressure
pc;
h2 is the actual exhaust specific enthalpy;
ηt is the turbine internal efficiency; and
pc is the exhaust pressure or back pressure.
where
wt is the effective specific work delivered by the turbine per unit mass of steam.
3.4. Coupled Solution Under the Same-Load Condition
The electrical power equation closes the model. Because both the valve flow relation and the turbine work relation contain
p1, the downstream pressure and the required flow rate must be solved simultaneously rather than step by step.
where Pe is the electrical power output in MW when ṁ is in kg/s and wt is in kJ/kg; ηm is the mechanical efficiency; and
ηg is the generator efficiency.
where Pe* is the specified target electrical power, and wt (p1) emphasizes that the effective specific work depends on p1 through Equations (4)–(6). Equation (8) is the reduced one-variable form obtained after eliminating ṁ from Equation (7) by using Equation (2).
3.5. Fuel-Demand and Efficiency Indicators
Once the required main-steam flow is determined, the steam-side heat duty, fuel flow, specific fuel consumption, heat rate, and equivalent electrical efficiency are obtained from first-law bookkeeping. The resulting indicators quantify the steady-state thermodynamic cost of reserving valve opening margin. Related energy- and exergy-based interpretations for thermal power units can be found in [
12,
14,
15].
where
Qsteam is the steam-side heat duty, and
hfw is the feedwater specific enthalpy.
where
mf is the fuel mass flow rate;
ηB is the boiler efficiency; and LHV is the lower heating value of the fuel.
where
b is the specific fuel consumption in g/kWh when
mf is in kg/s and
Pe is in MW.
where HR is the heat rate in kJ/kWh, and
ηe is the equivalent electrical efficiency.
4. Discussion
The calculated operating cases are named according to the steady control valve opening. In this notation, Case A0.95, Case A0.90, Case A0.85, Case A0.80, Case A0.75, and Case A0.70 correspond to a = 0.95, 0.90, 0.85, 0.80, 0.75, and 0.70, respectively. The prefix “A” is used only as a case-label prefix for the valve opening series and does not represent an additional physical parameter. In the following discussion, “Case A0.xx” refers to the case identifier, whereas “a = 0.xx” refers to the numerical value of the steady control valve opening. Case A0.90, corresponding to a = 0.90, is treated as the baseline operating point.
Table 2 summarizes the key calculated quantities.
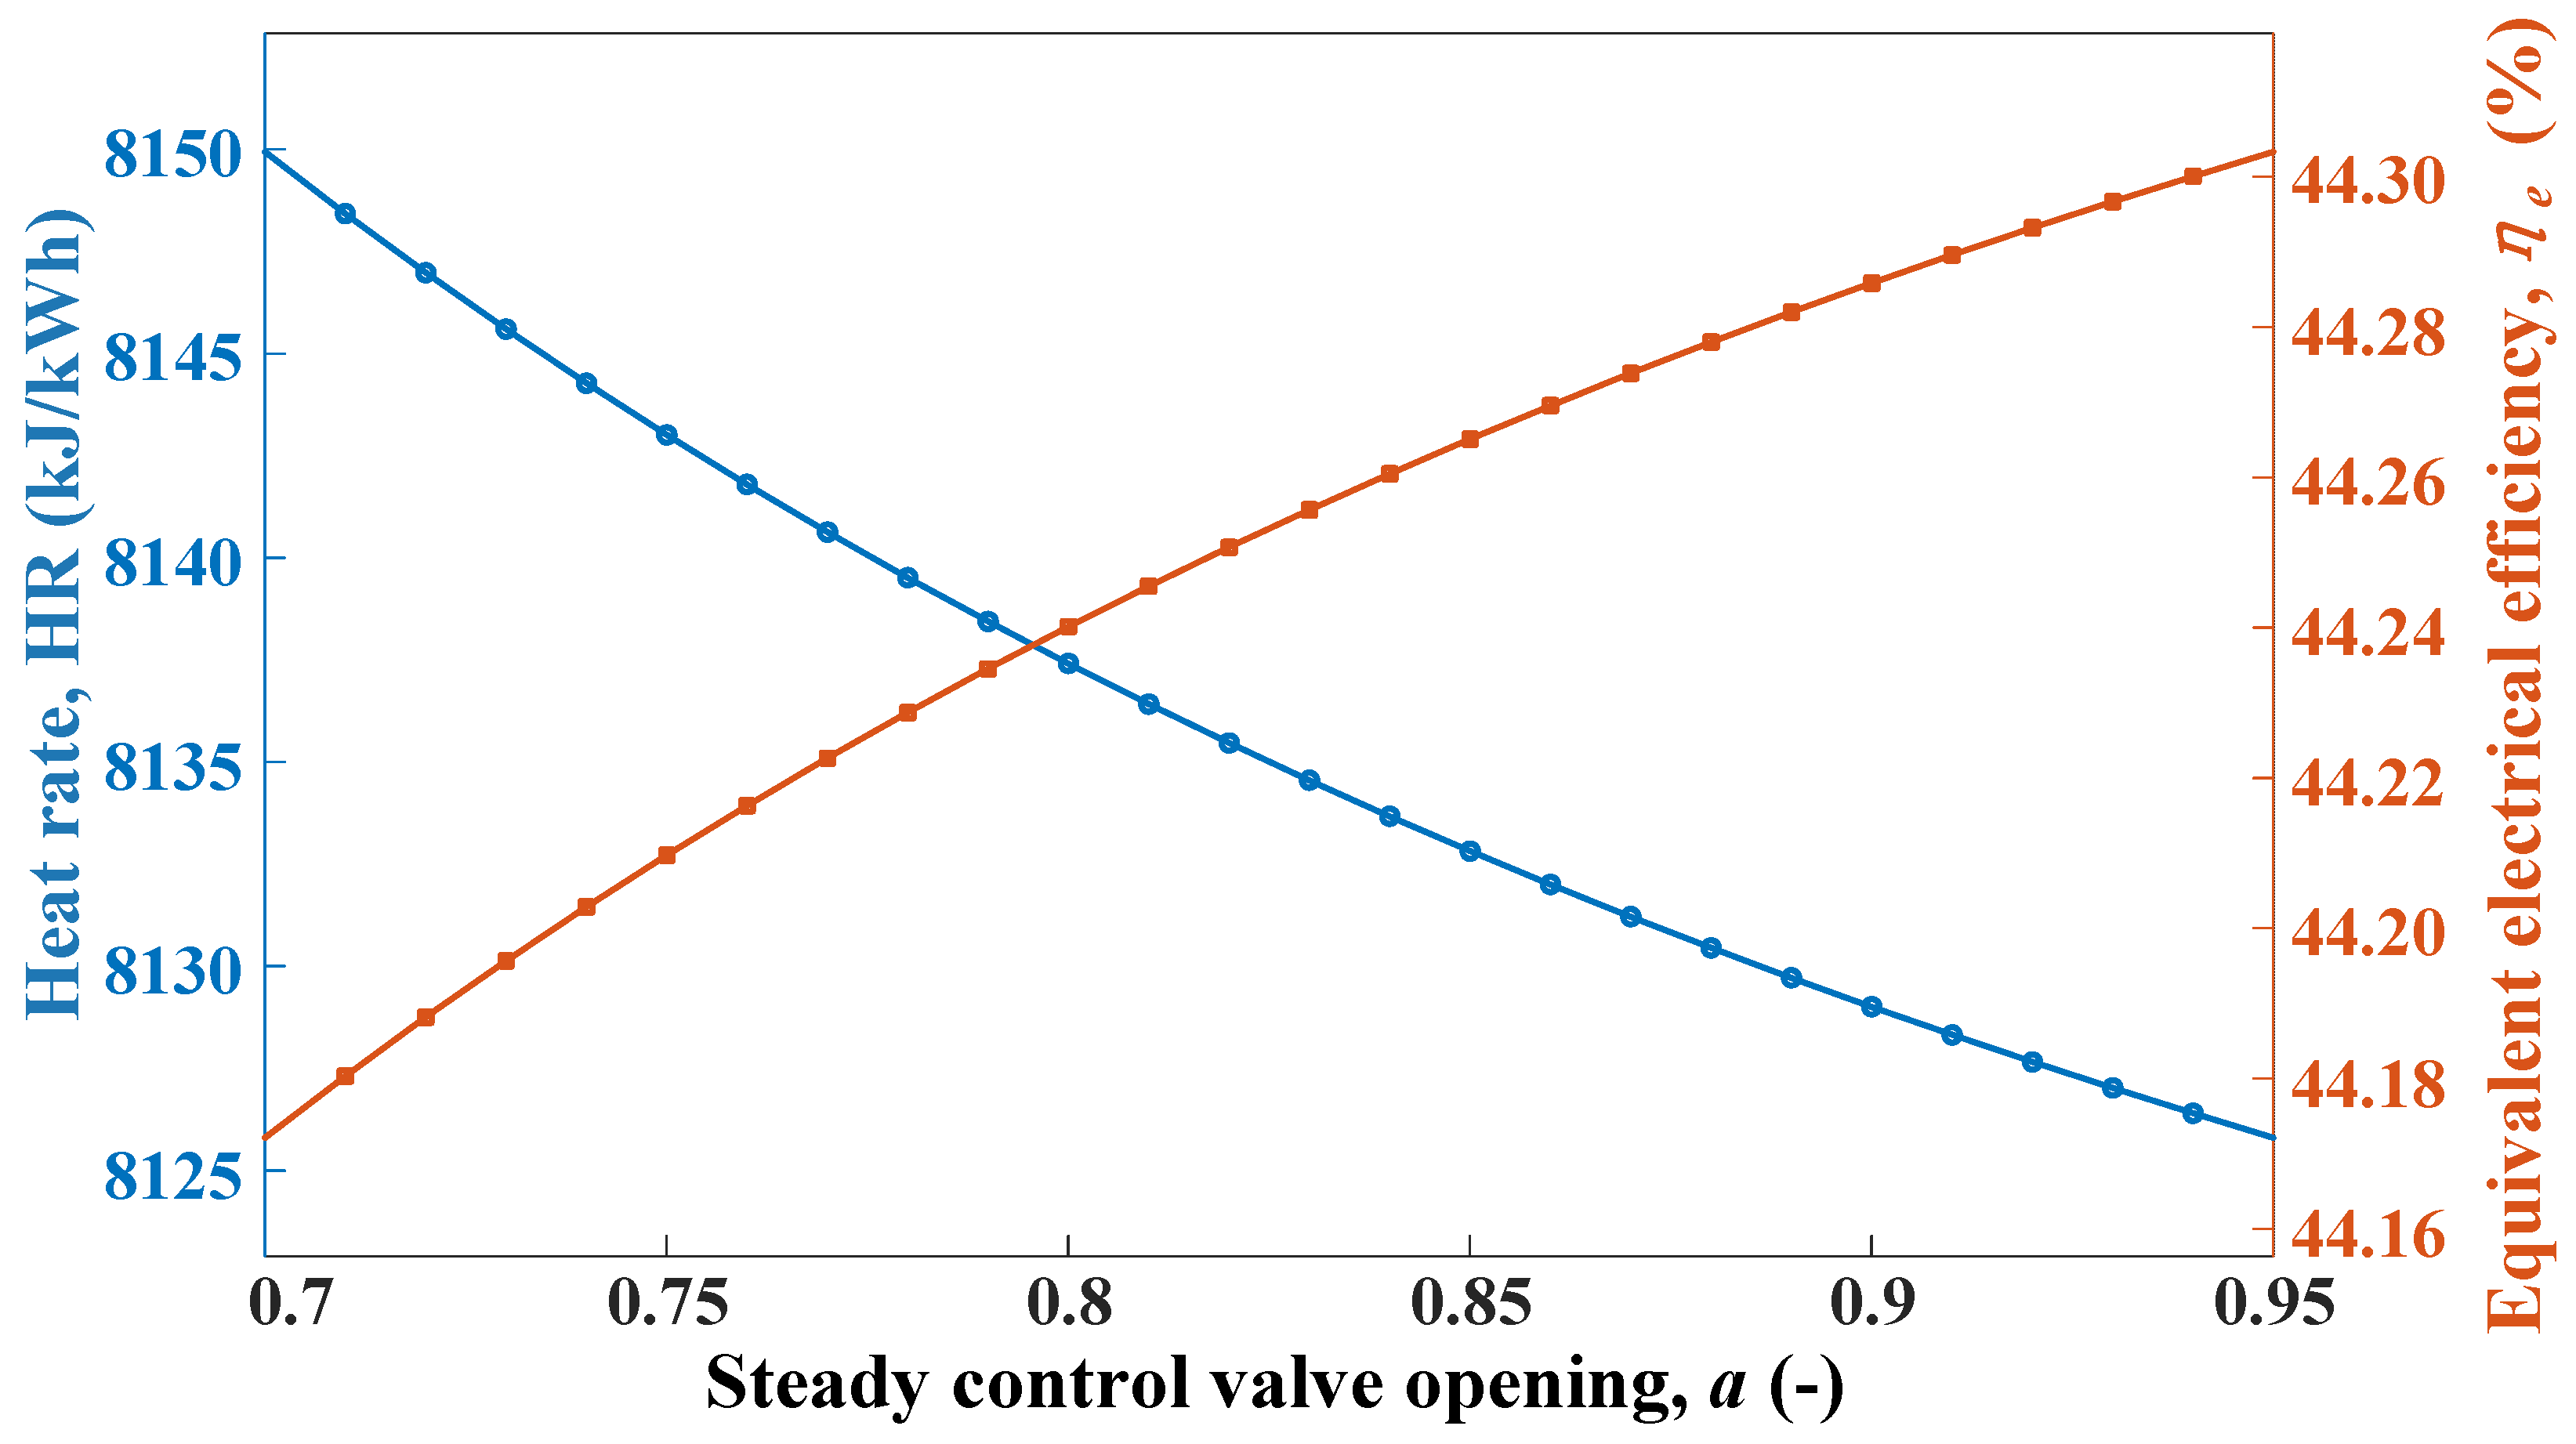
To improve the numerical coverage of the simulation-based analysis, the valve opening calculation was further extended from the six representative cases to a dense grid. The steady control valve opening a varied from 0.70 to 0.95 with a step of 0.01, resulting in 26 operating cases. The six representative cases are retained in
Table 2 for readability, while the dense-grid results are used to verify the monotonic trend and are summarized in
Figure 2.
The dense-grid calculation confirms that the trends observed in the representative cases are not caused by sparse sampling. As the steady control valve opening decreases, the valve-downstream pressure and effective specific work decrease monotonically, whereas the required main-steam flow, fuel flow, and heat rate increase monotonically. Therefore, in the present same-load and single-variable steady-state problem, the efficiency-oriented operating choice is the largest valve opening that still satisfies the required reserve condition. Artificial-intelligence-based optimization is not introduced in this work because the present problem is a deterministic one-dimensional steady-state calculation. However, AI-based or multi-objective optimization can be further used when valve opening, main-steam pressure, load level, dynamic PFR benefit, and fuel-cost penalty are optimized simultaneously.
To improve readability, the relative changes of the main quantities are further calculated with respect to the baseline Case A0.90. As shown in
Table 3, decreasing the steady valve opening from Case A0.90 to Case A0.70 reduces the valve-downstream pressure by 2.509% and increases the downstream entropy by 0.155%. The effective specific work decreases by 0.257%, while the required main-steam flow, fuel flow, and heat rate increase by 0.257%, 0.255%, and 0.257%, respectively. The equivalent electrical efficiency decreases by 0.256% relative to the baseline. These consistent percentage indicators show that the thermodynamic penalty is small in magnitude but systematic across the main performance metrics.
4.1. Throttling-State Change Caused by Valve-Margin Reservation
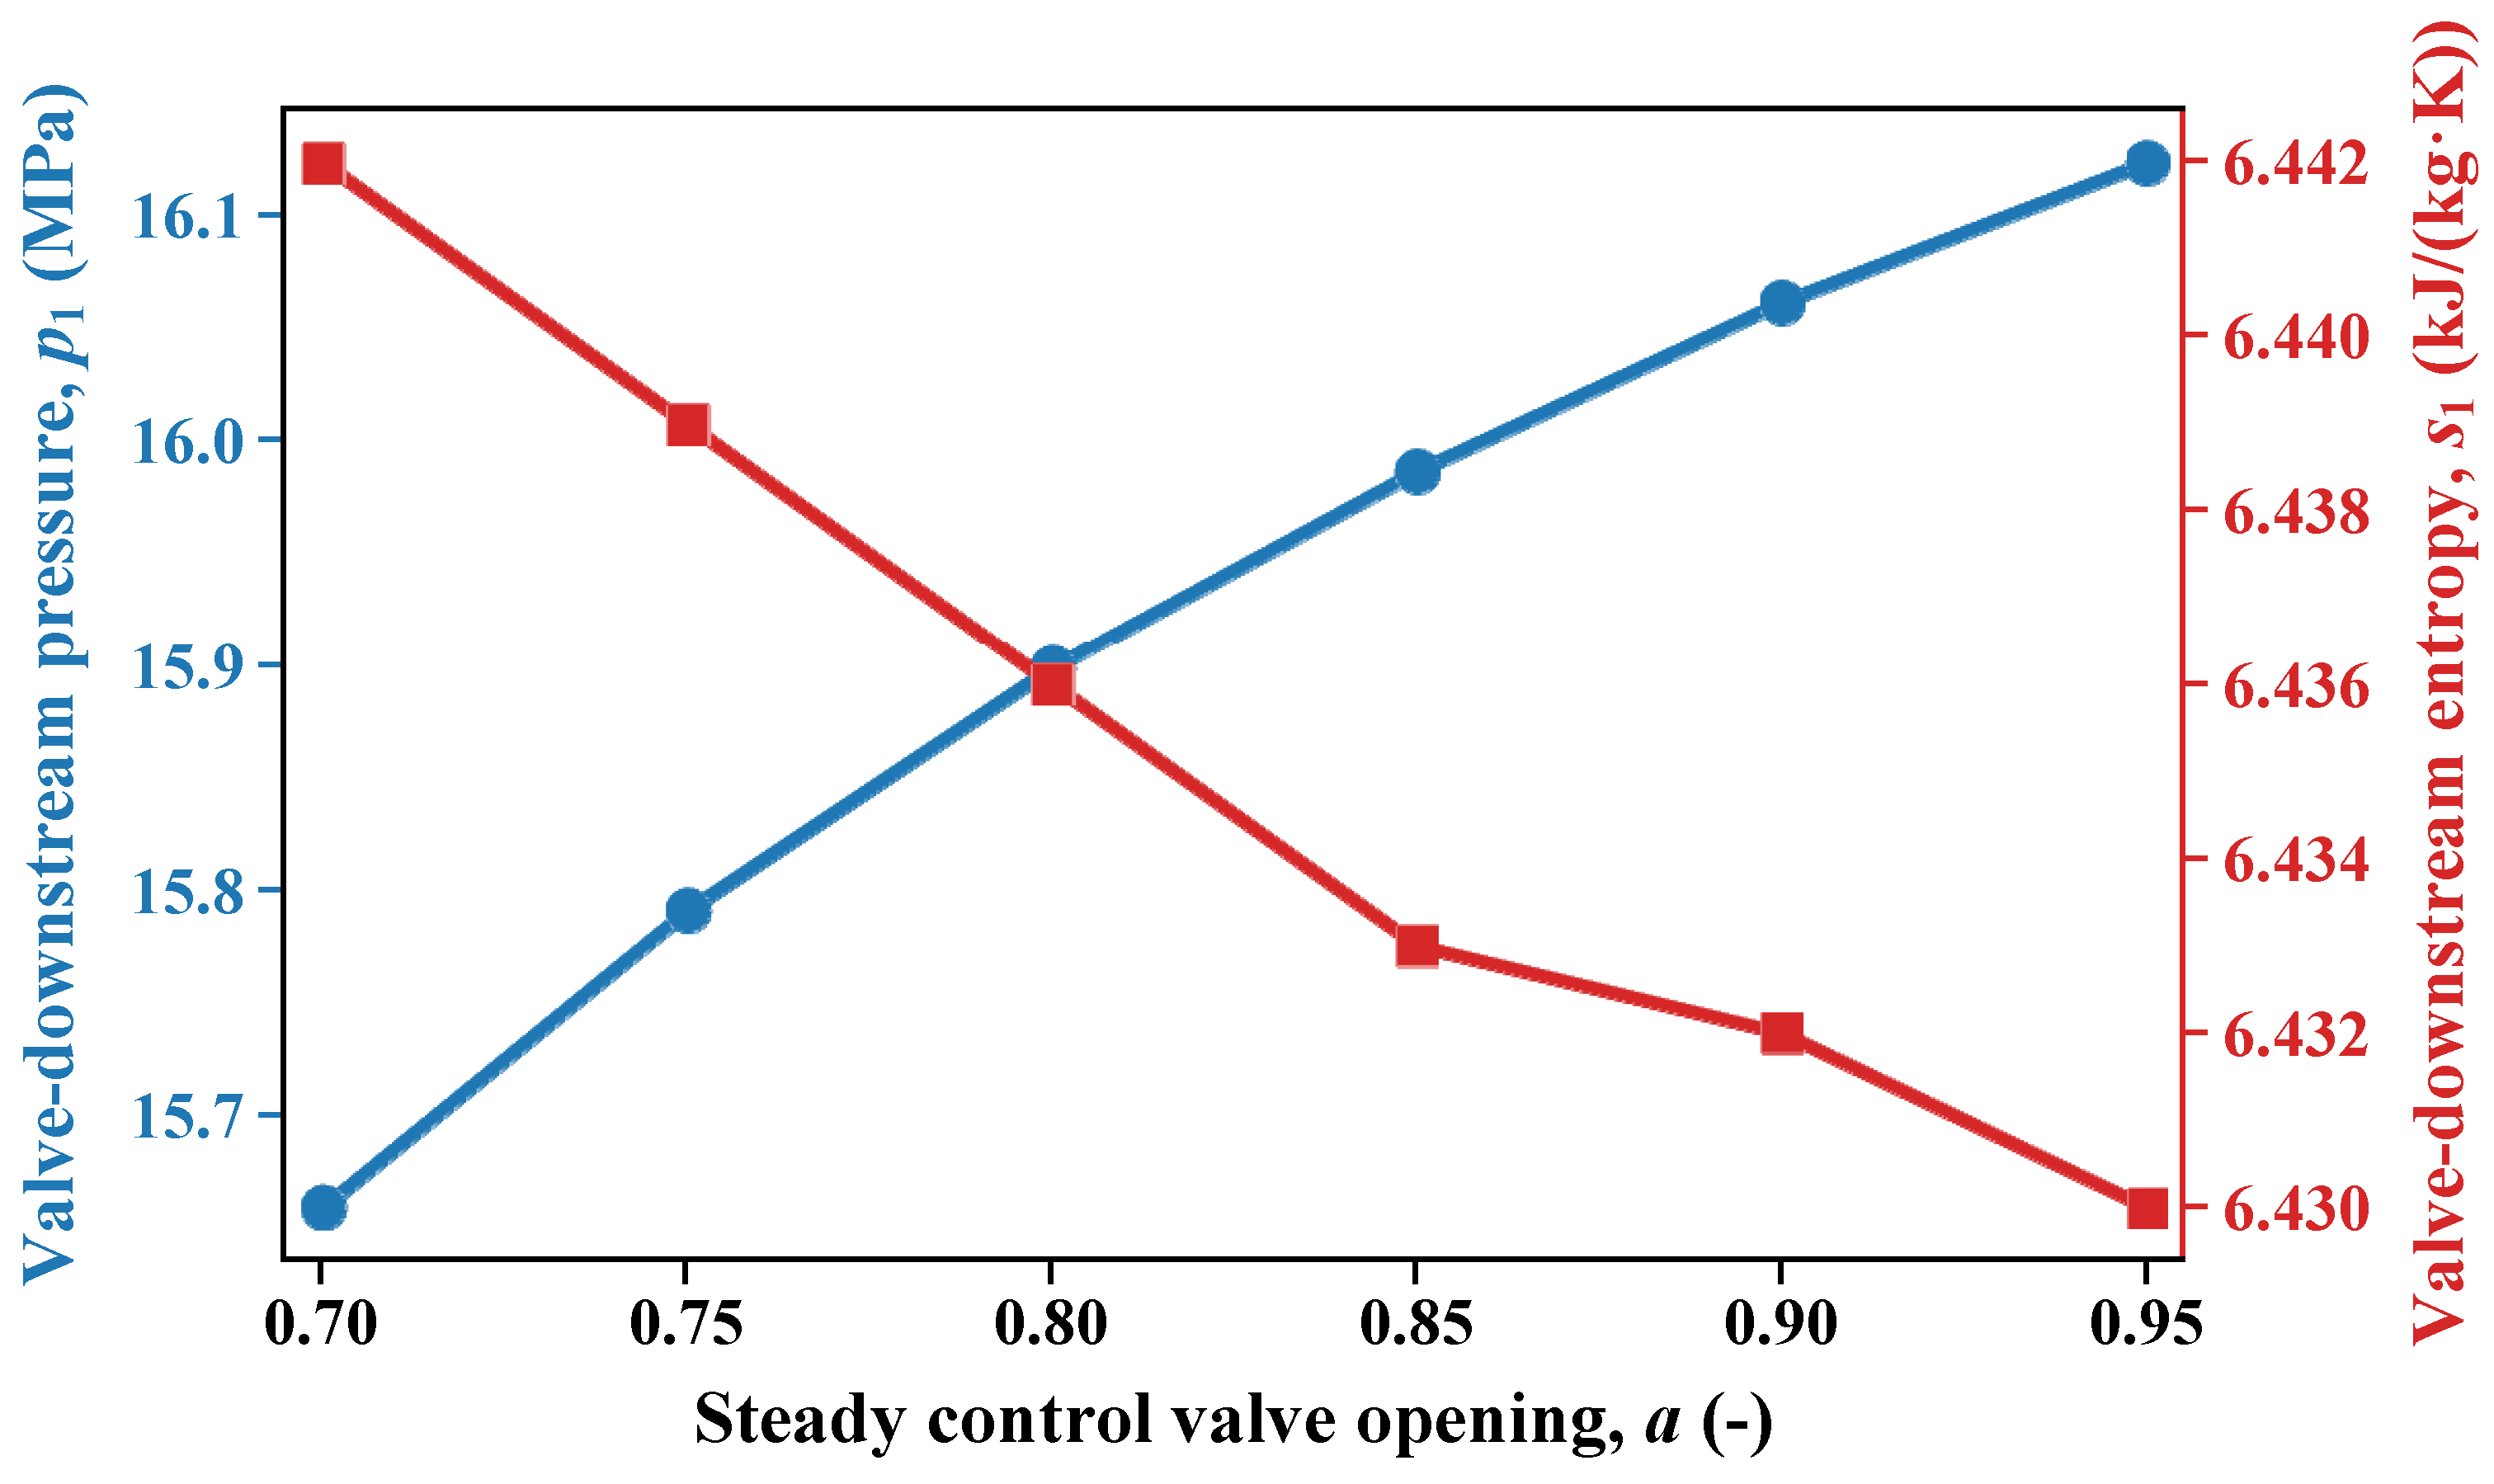
Figure 3 shows the influence of steady control valve opening on the downstream pressure
p1 and downstream entropy
s1. As
a decreases from 0.95 to 0.70 while
p0 and
T0 remain fixed,
p1 drops from 16.124 to 15.659 MPa and the pressure ratio
p1/
p0 decreases from 0.967 to 0.939. At the same time,
s1 increases from 6.430 to 6.442 kJ/(kg·K). This monotonic trend indicates that a smaller steady valve opening intensifies throttling and slightly degrades the thermodynamic quality of the steam entering the turbine, which is consistent with the throttling-loss interpretation in [
13].
4.2. Effect on Effective Enthalpy Drop and Required Steam Flow
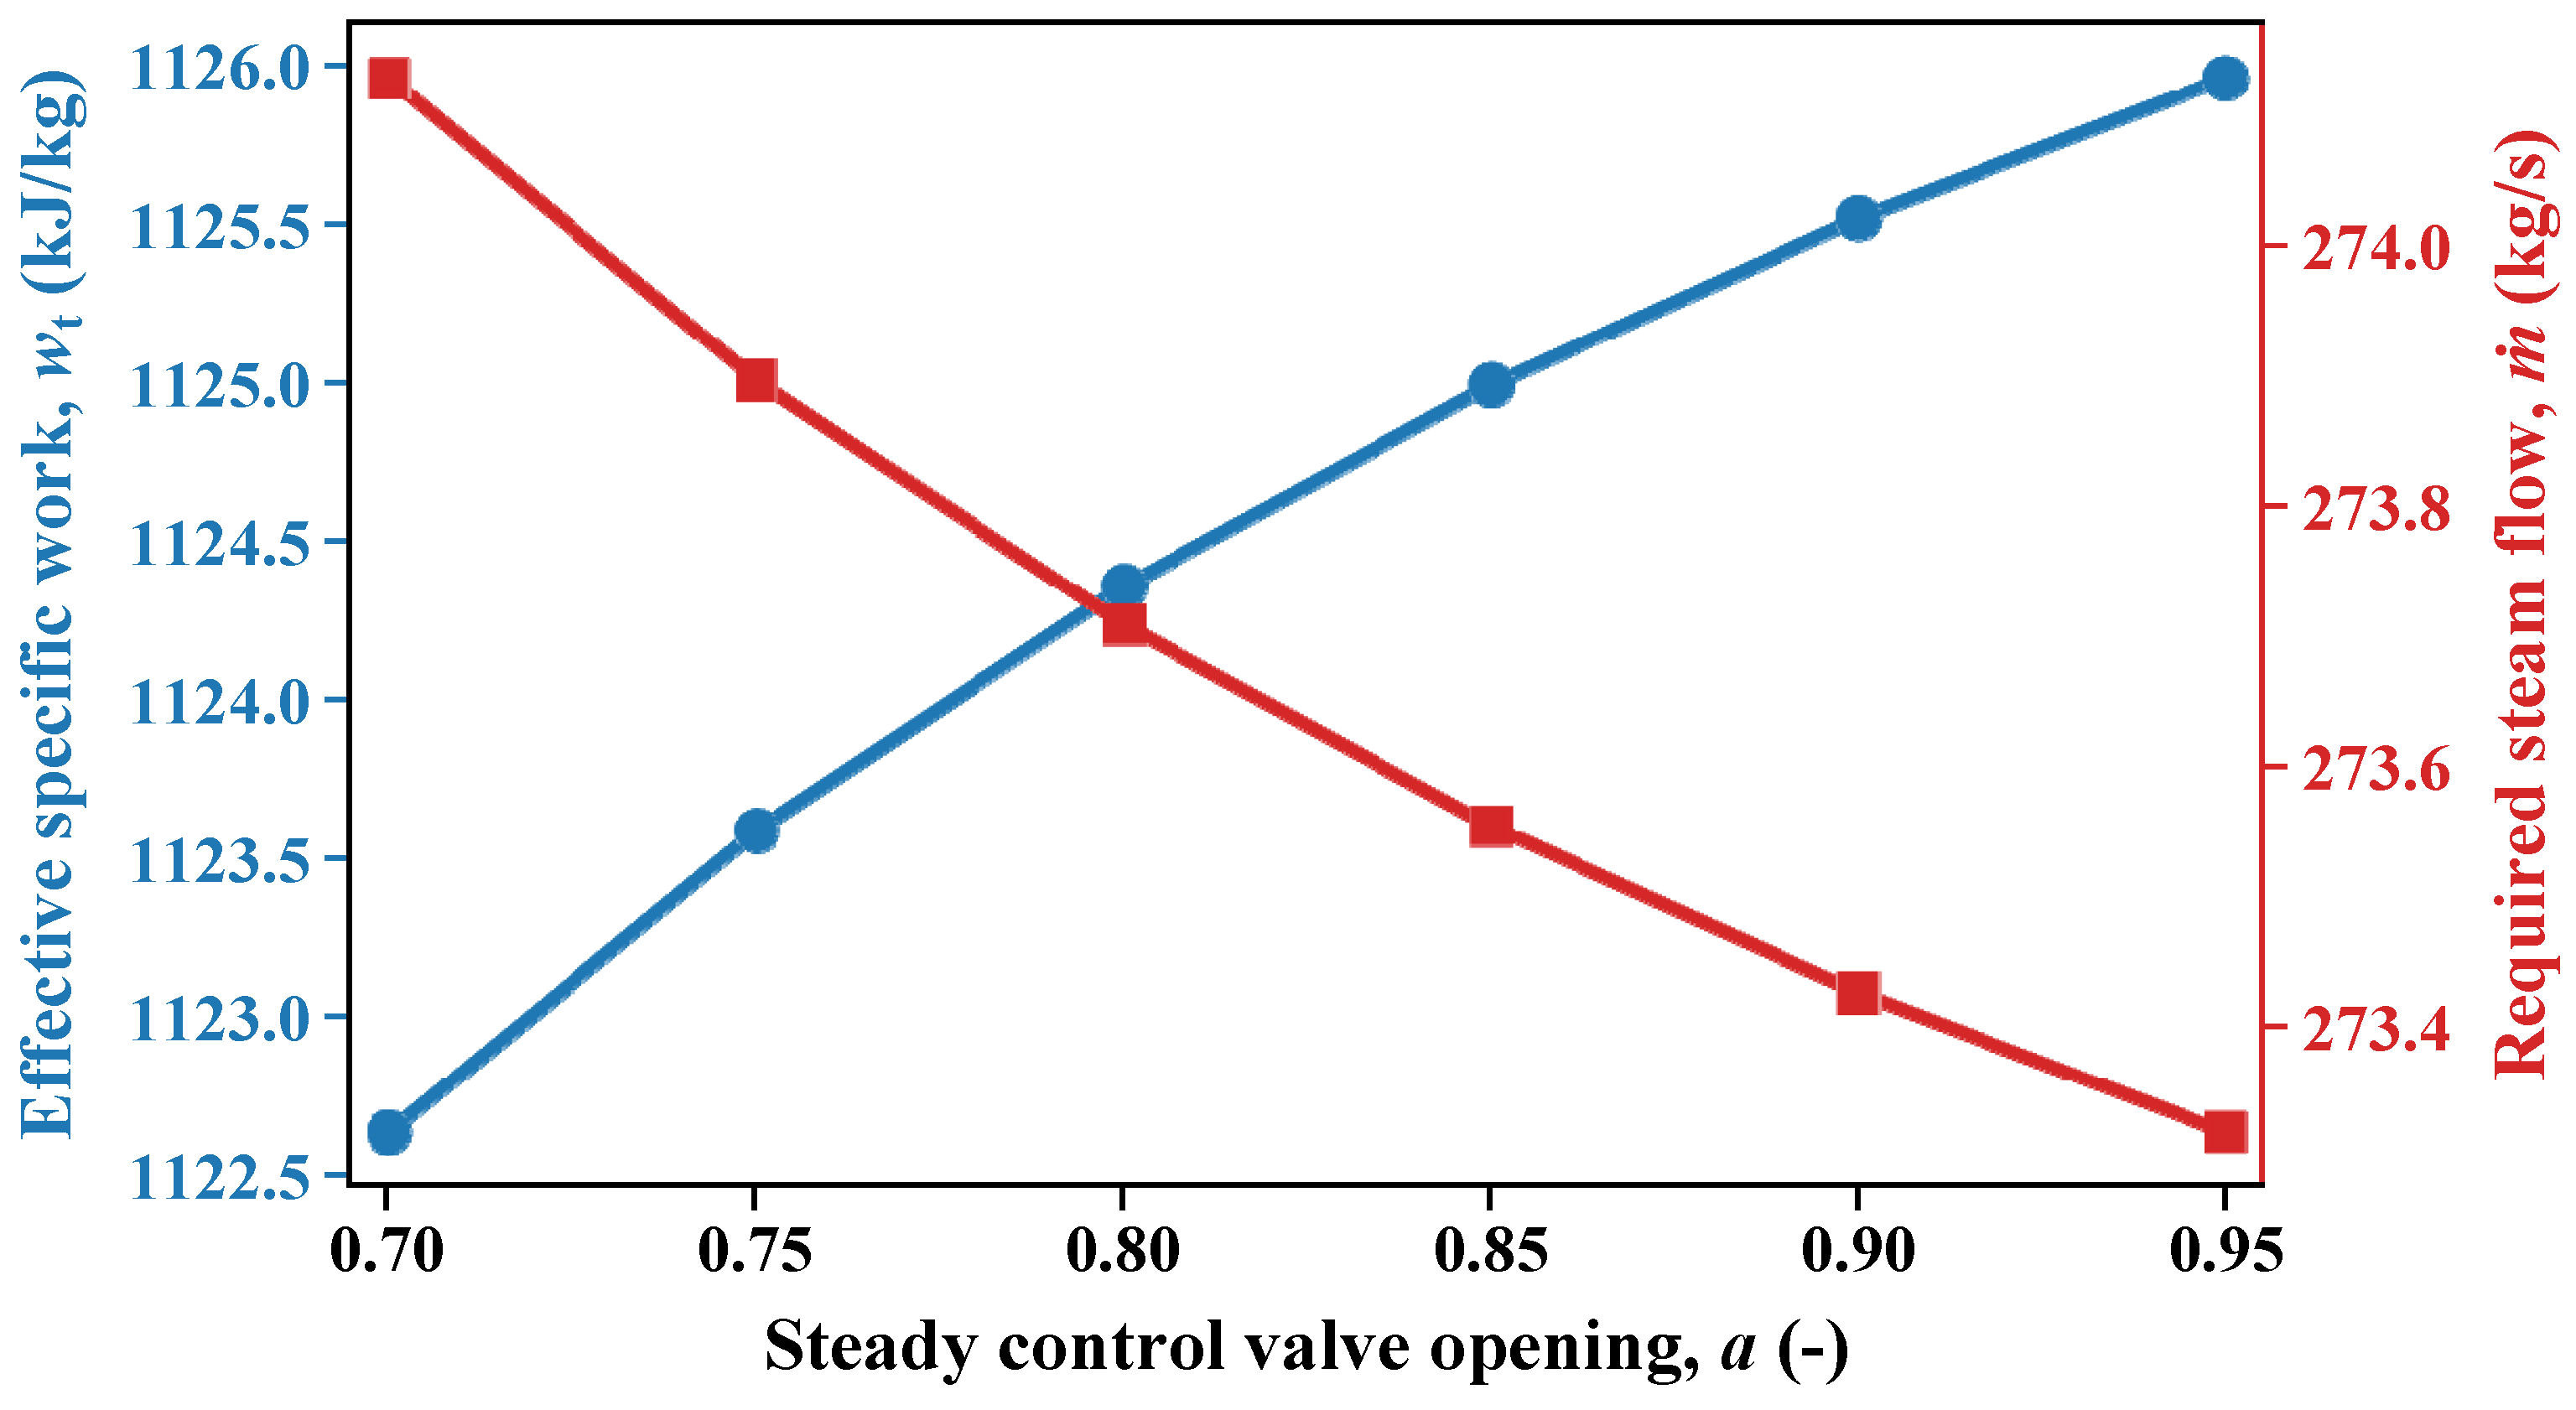
Figure 4 presents the change in effective specific work
wt and the required main-steam flow rate
ṁ. Because a lower
p1 yields a less favorable turbine inlet state,
wt decreases monotonically from 1125.970 to 1122.636 kJ/kg as
a decreases from 0.95 to 0.70. Although the absolute drop is only 3.334 kJ/kg (about 0.30%), the required steam flow still increases from 273.319 to 274.131 kg/s in order to maintain the same electrical output. Relative to the baseline Case A0.90, Case A0.70 requires an additional 0.704 kg/s of steam.
4.3. Fuel-Demand Penalty Under the Same-Load Condition
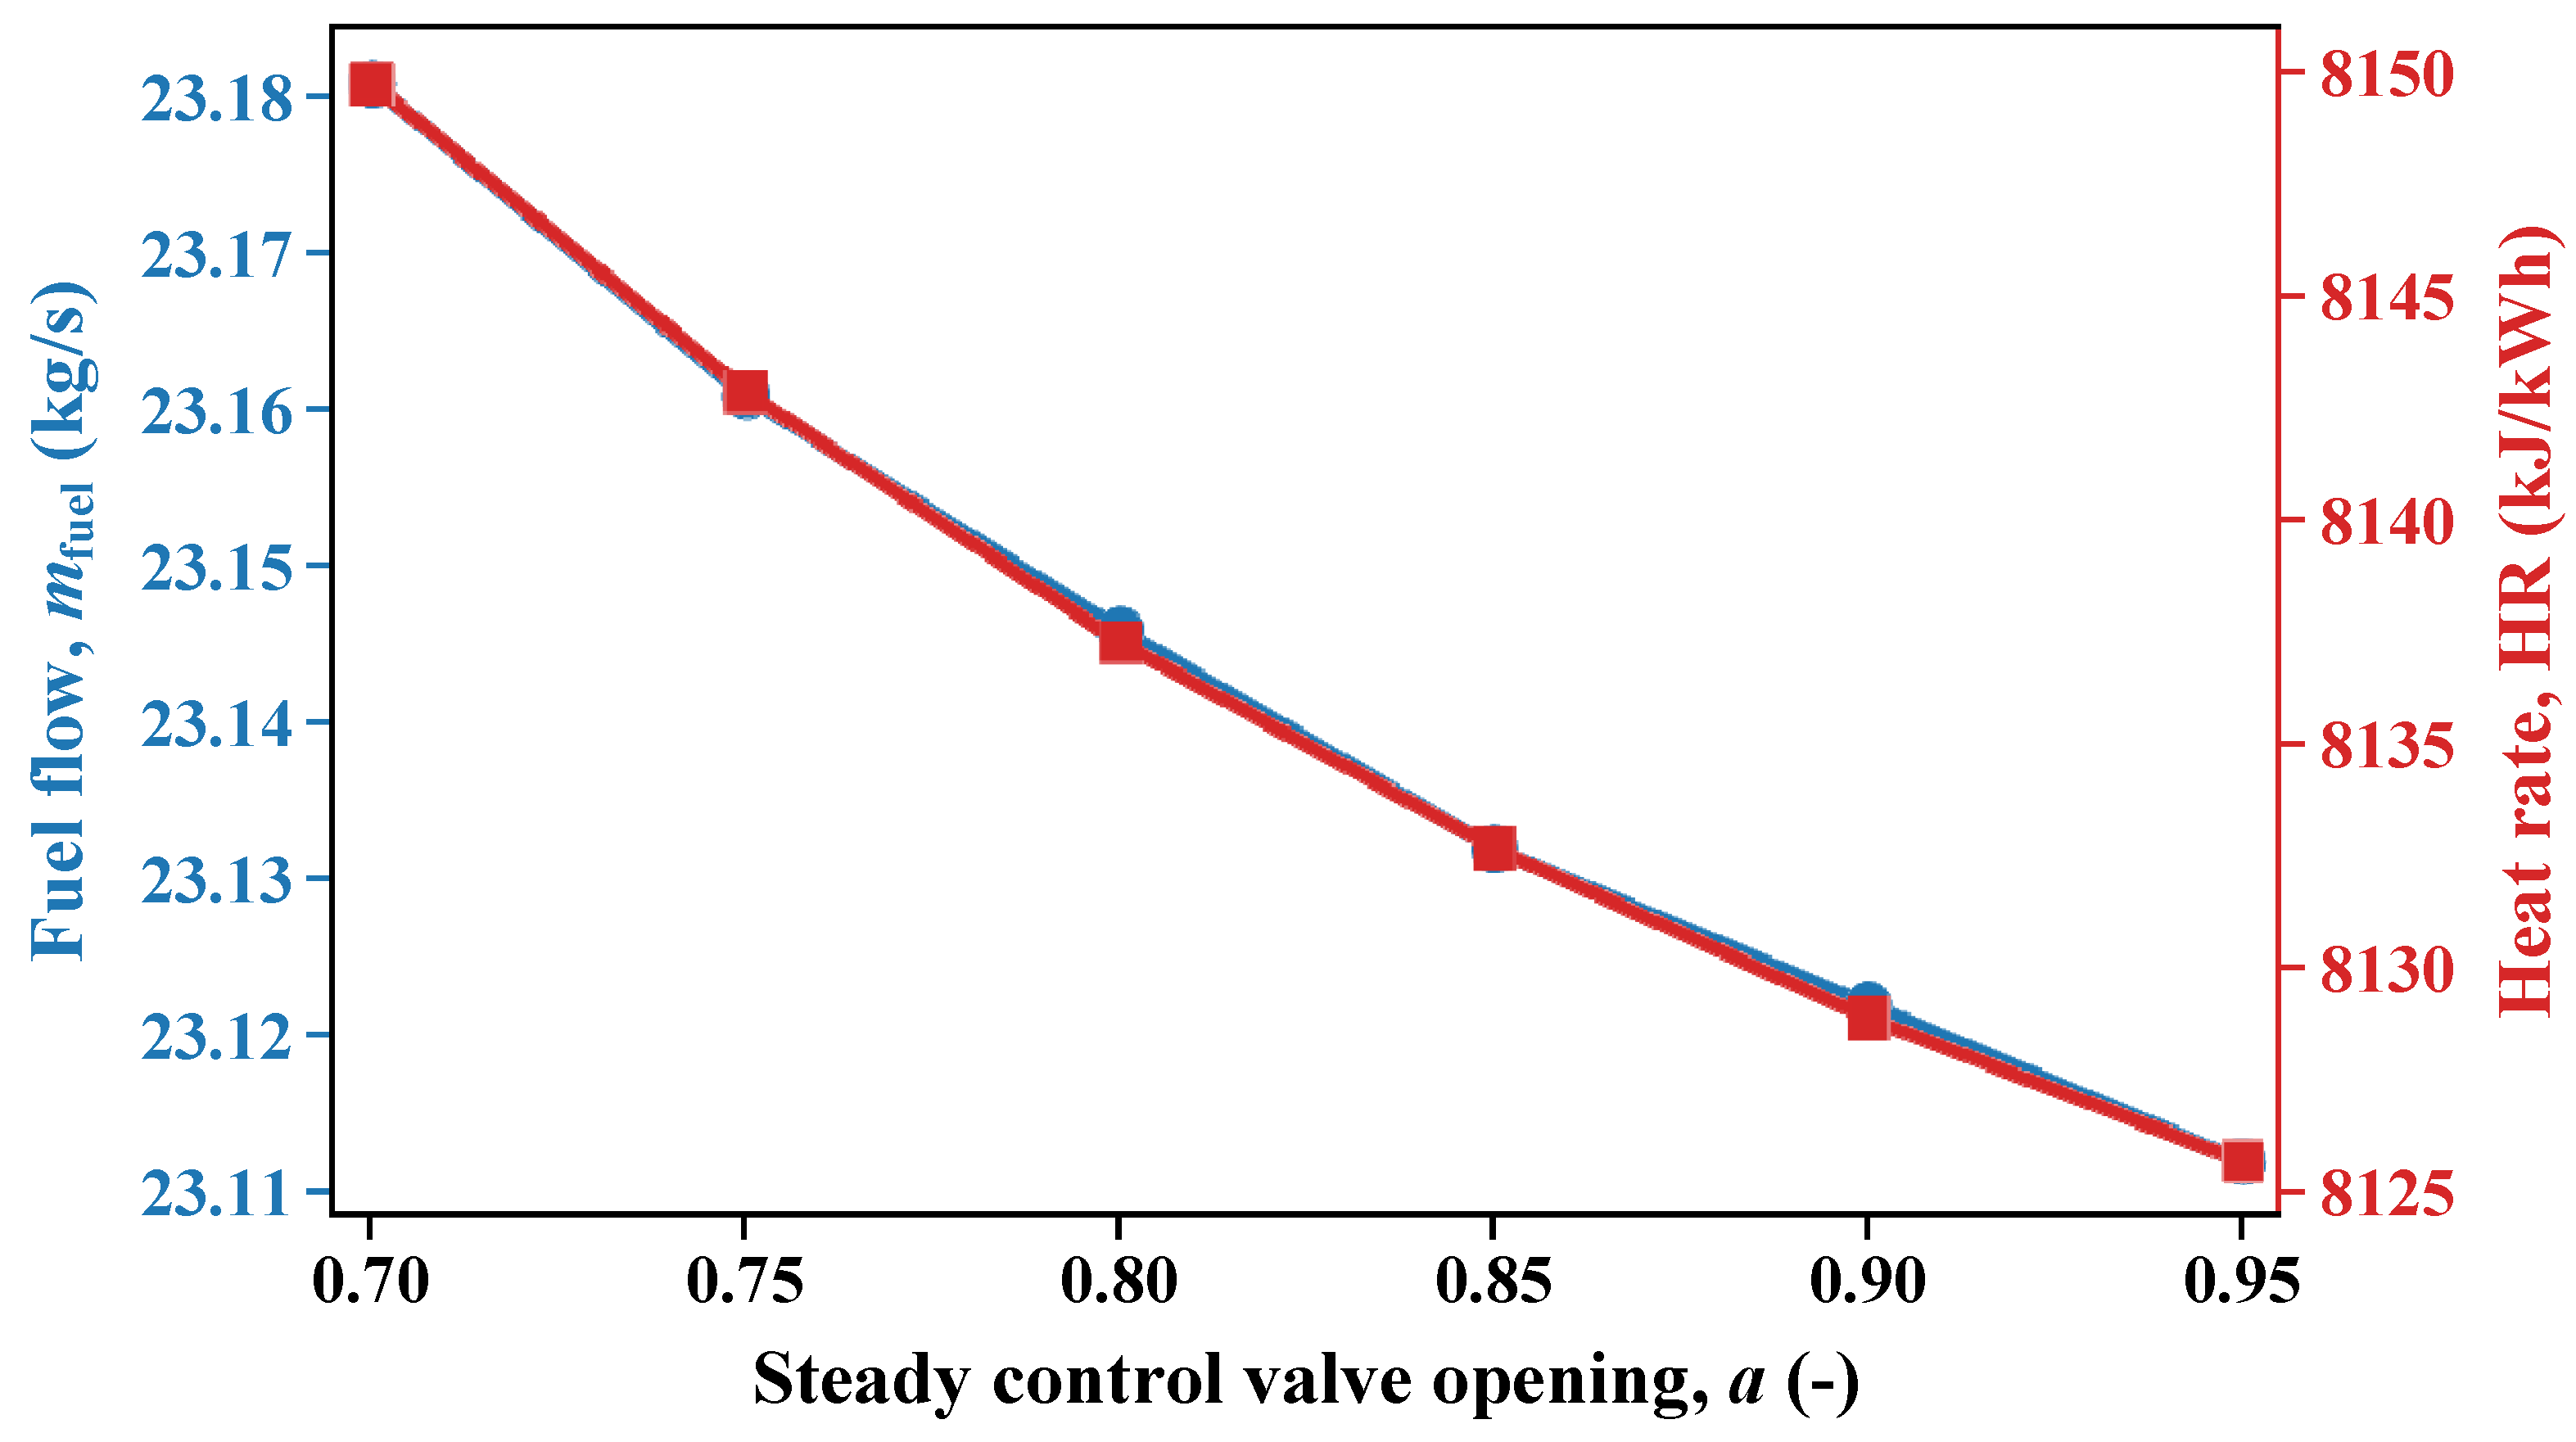
The steady-state cost becomes more explicit when the required steam flow is converted into boiler-side heat duty and fuel demand. As shown in
Figure 5, both fuel flow and heat rate rise monotonically as the steady valve opening decreases. From
a = 0.95 to
a = 0.70, fuel flow increases from 23.112 to 23.181 kg/s and heat rate increases from 8125.7 to 8149.8 kJ/kWh. Relative to the baseline Case A0.90, Case A0.70 adds 0.059 kg/s of fuel flow and 20.9 kJ/kWh of heat rate. These penalties are modest in the present high-opening range, but they are systematic and monotonic rather than random.
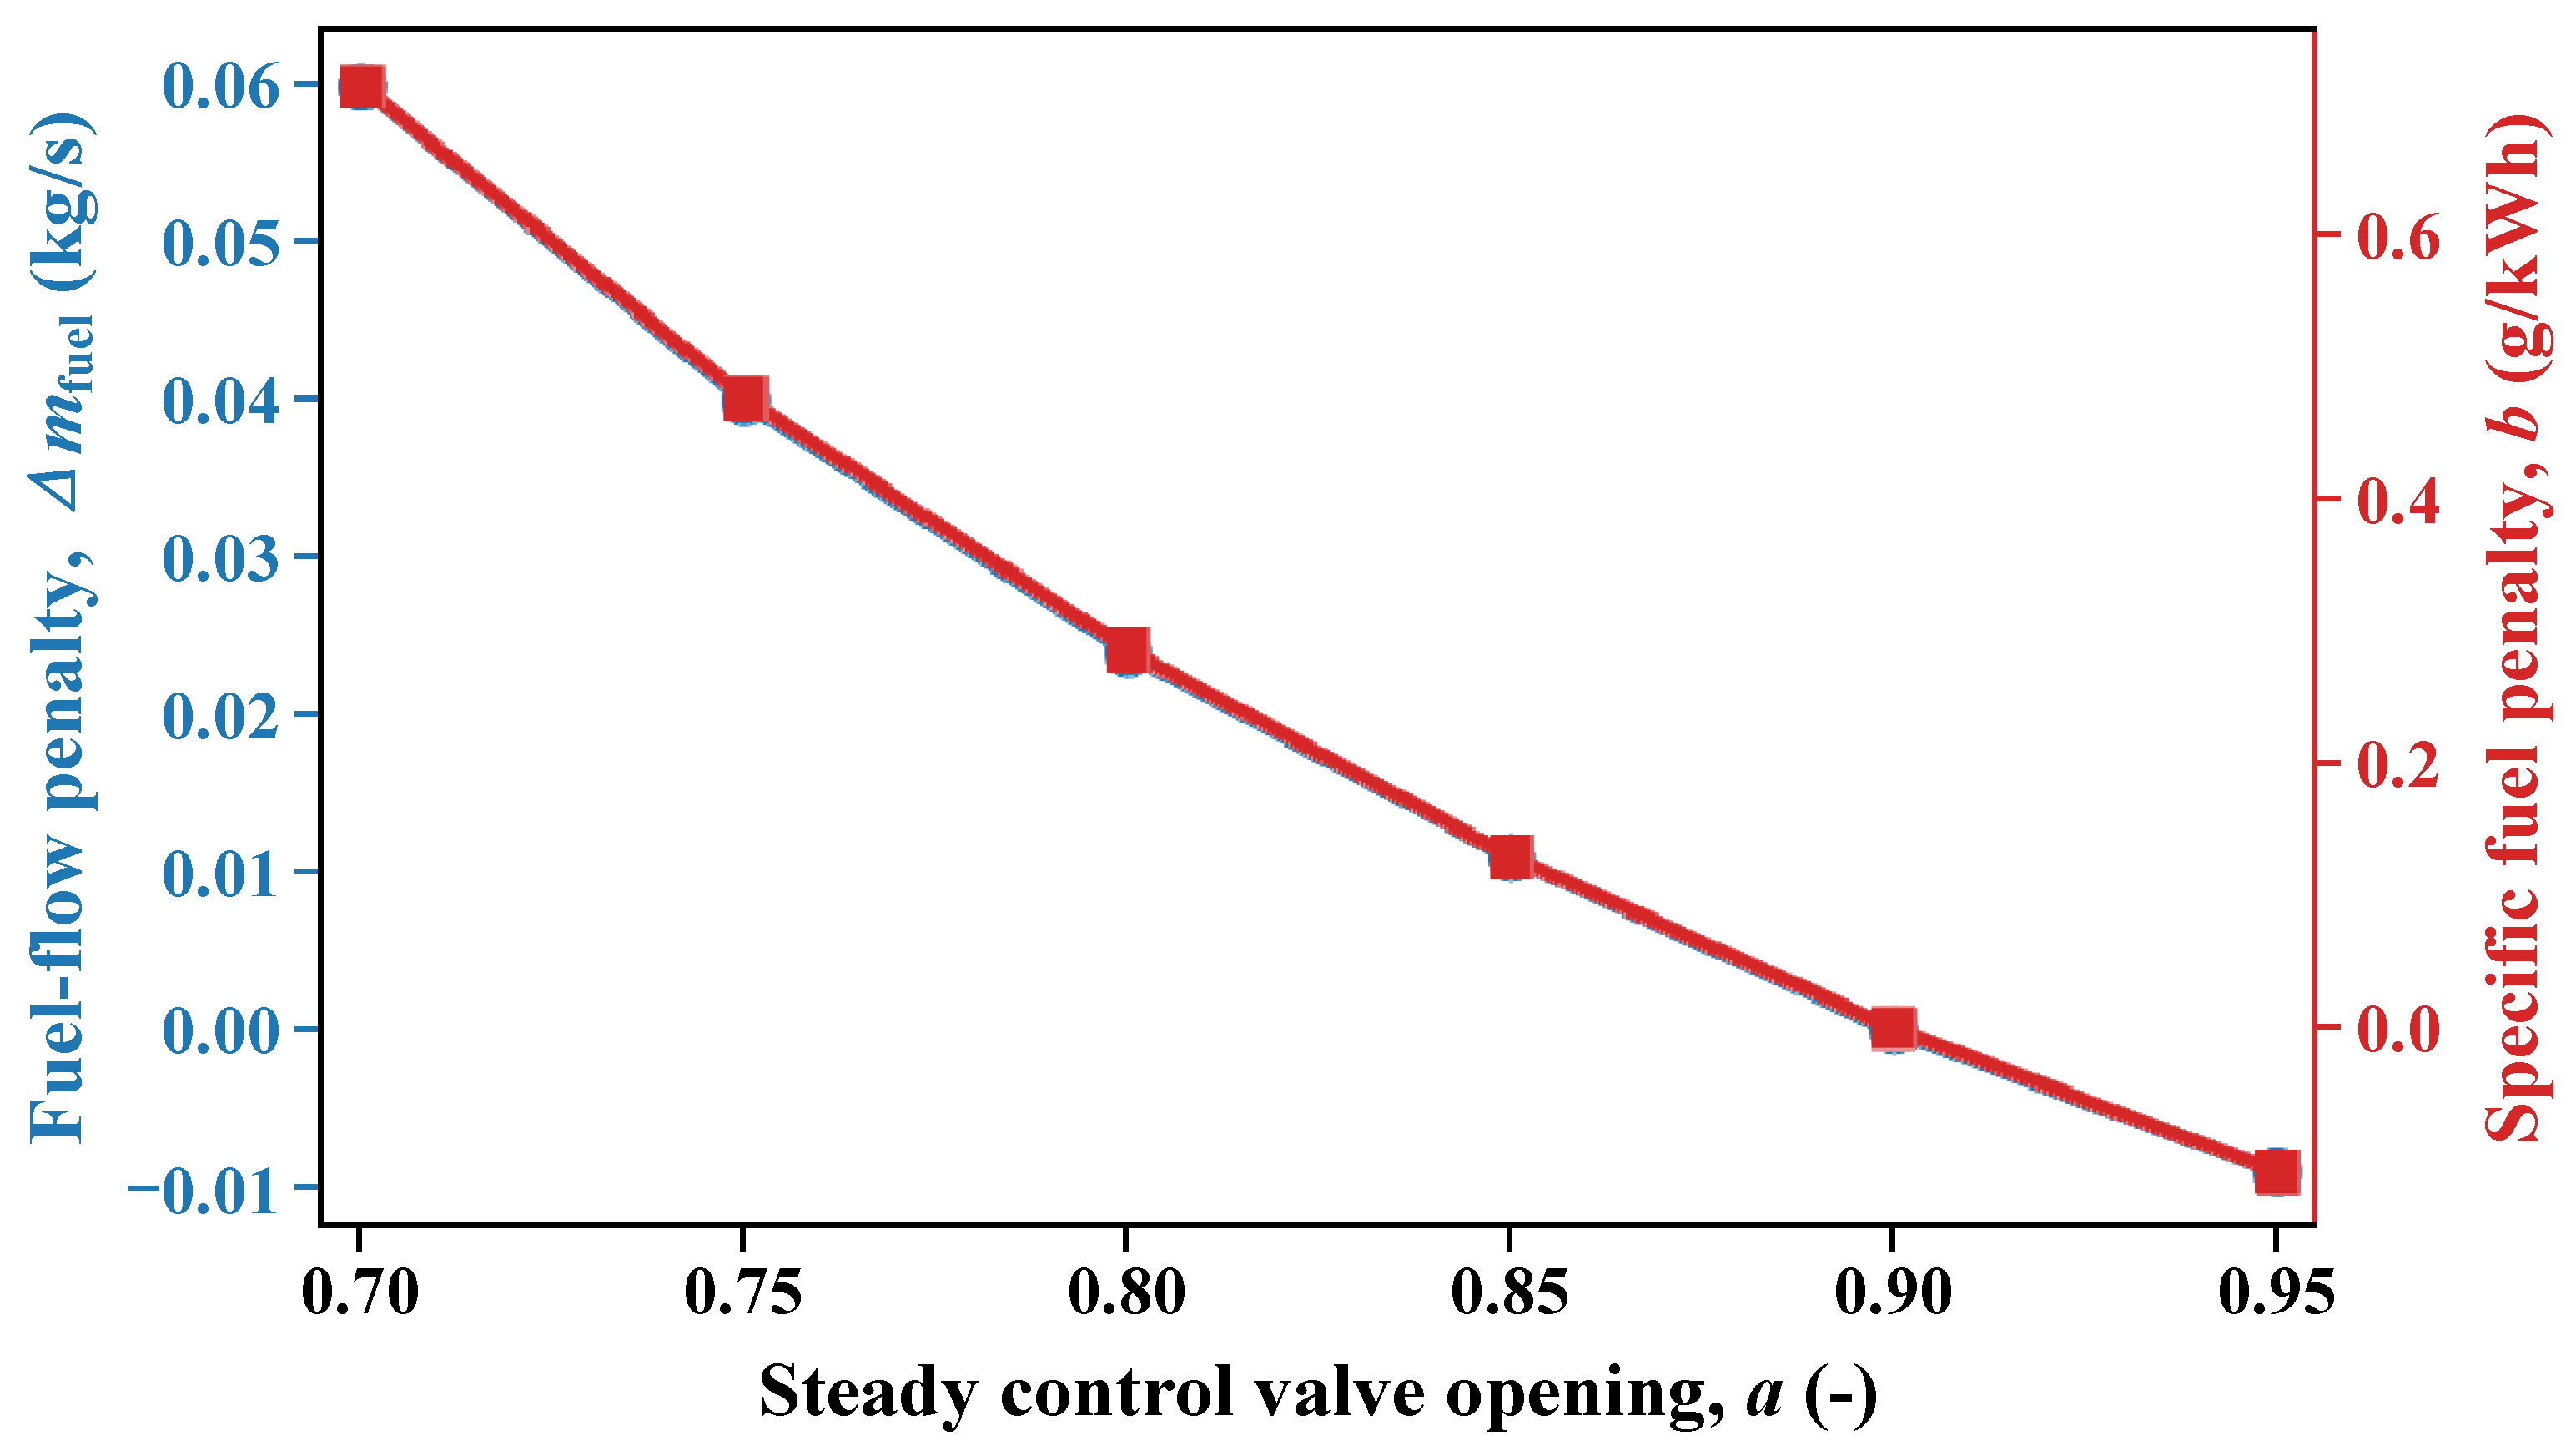
Figure 6 further expresses the same tendency in relative terms. Compared with the baseline Case A0.90, corresponding to
a = 0.90, the fuel-flow penalty reaches 0.060 kg/s and the specific-fuel-consumption penalty reaches 0.714 g/kWh at
a = 0.70. Conversely, increasing the opening to
a = 0.95 slightly reduces the fuel demand below the baseline. Therefore, the thermodynamic price of reserving more control valve margin can already be identified in steady-state before any dynamic PFR capability is analyzed.
In addition to the baseline Case A0.90, Case A0.70 is highlighted as a second representative case because it corresponds to a 30% reserved valve opening margin. Compared with Case A0.90, Case A0.70 lowers the valve-downstream pressure from 16.062 to 15.659 MPa, increases the downstream entropy from 6.432 to 6.442 kJ/(kg·K), decreases the effective specific work from 1125.527 to 1122.636 kJ/kg, and increases the required main-steam flow from 273.427 to 274.131 kg/s. The fuel flow increases by approximately 0.059 kg/s, and the heat rate increases by 20.9 kJ/kWh. Therefore, the additional high-margin case confirms the same monotonic tendency shown by the full set of valve opening cases.
According to Equation (12), the equivalent electrical efficiency is calculated from the heat rate as
ηe = 3600/
HR. As shown in
Table 2, when the operating case changes from Case A0.90 to Case A0.70, the steady control valve opening decreases from
a = 0.90 to
a = 0.70. In operational terms, this corresponds to increasing the reserved valve opening margin from 10% to 30%, although the margin itself is not an independent calculation variable in the model. Under the same 300.102 MW electrical output, the heat rate increases from 8128.9 to 8149.8 kJ/kWh, and the equivalent electrical efficiency decreases from 44.286% to 44.173%. The corresponding relative decrease in equivalent electrical efficiency is 0.256%, while the absolute decrease is 0.114 percentage points. This result shows that decreasing the steady control valve opening to reserve more upward valve margin produces a small but quantifiable steady-state efficiency penalty.
4.4. Sensitivity Analysis
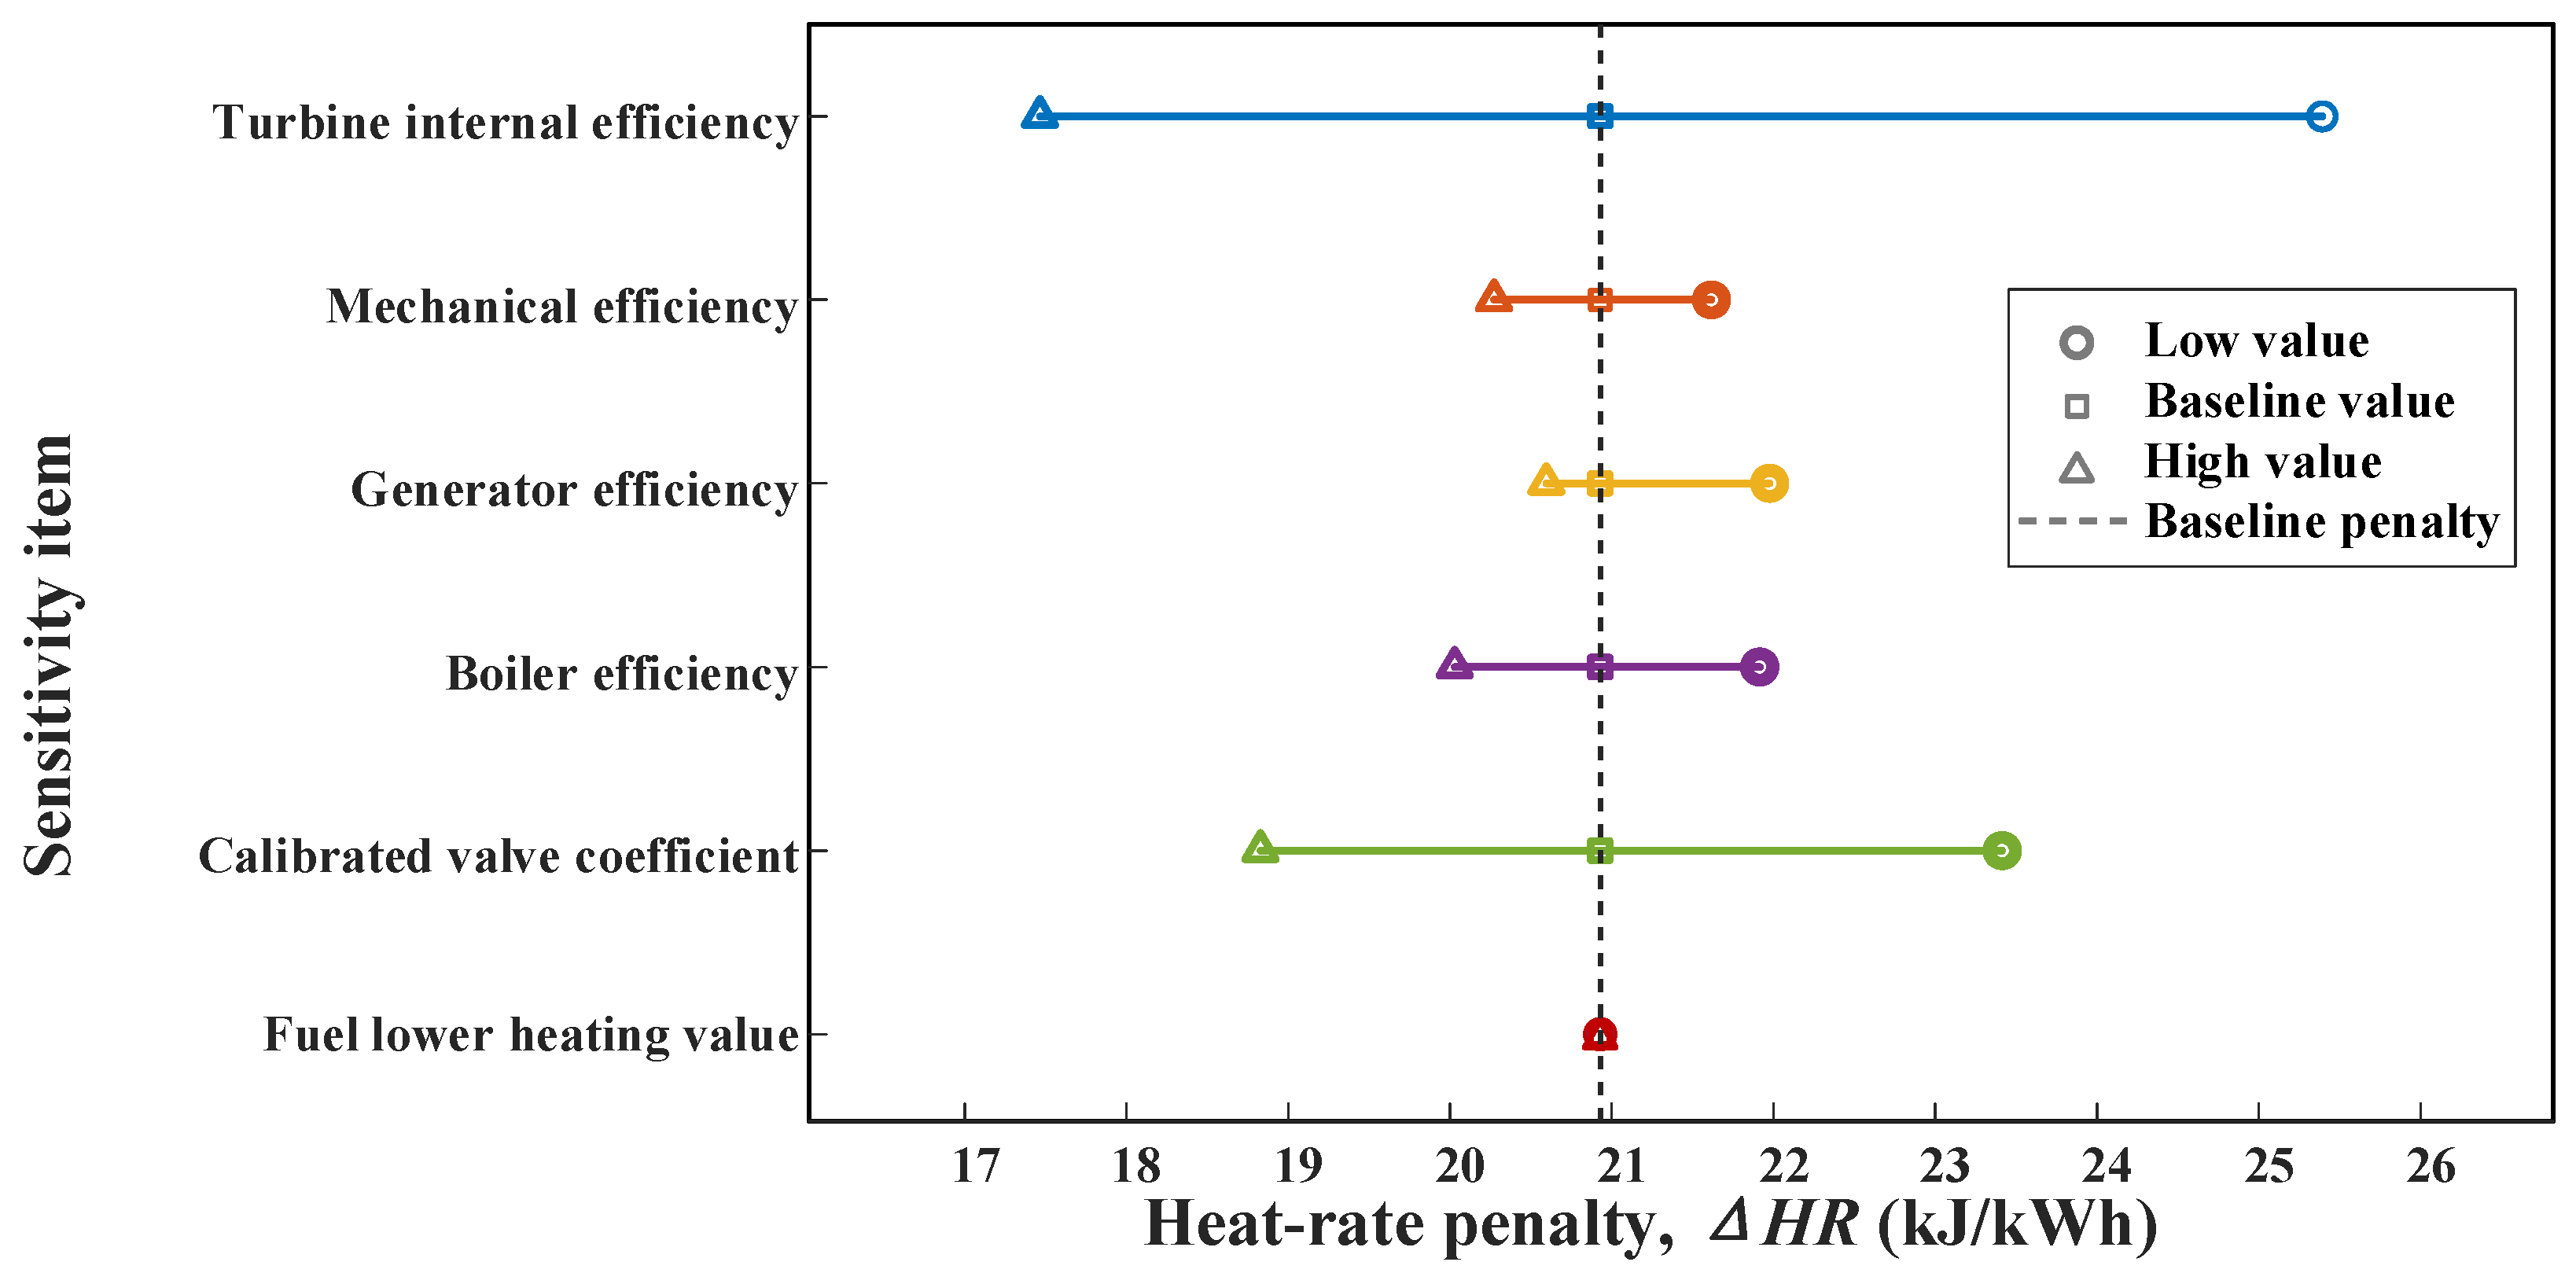
A one-factor-at-a-time sensitivity analysis was performed to evaluate the influence of the main parameters listed in
Table 1. The sensitivity target is the heat-rate penalty from Case A0.90 to Case A0.70, because this comparison corresponds to decreasing the steady control valve opening from a = 0.90 to a = 0.70 under the same electrical output. To keep the analysis focused on the same-load valve opening penalty, the heat-rate increase
ΔHR is used as the main sensitivity indicator.
The results are summarized in
Table 4 and visualized in
Figure 7. Under the baseline parameter setting, the heat-rate penalty from Case A0.90 to Case A0.70 is 20.93 kJ/kWh. When the turbine internal efficiency
ηt varies from 0.80 to 0.90,
ΔHR changes from 25.39 to 17.46 kJ/kWh, giving the widest variation among the tested parameters. When the calibrated valve coefficient
Kmax varies from 0.05225 to 0.05775,
ΔHR changes from 23.41 to 18.83 kJ/kWh. These two parameters have relatively stronger effects because they directly influence the valve–turbine coupled solution and the effective specific work. The mechanical efficiency, generator efficiency, boiler efficiency, and fuel lower heating value produce smaller variations:
ΔHR varies from 21.62 to 20.27 kJ/kWh for
ηm, from 21.98 to 20.60 kJ/kWh for
ηg, from 21.91 to 20.03 kJ/kWh for
ηB, and from 19.88 to 21.98 kJ/kWh for LHV. In all tested cases, the heat-rate penalty remains positive, indicating that decreasing the steady control valve opening increases the same-load steady-state heat-rate penalty. Therefore, the main conclusion is not limited to a single set of baseline parameter values.
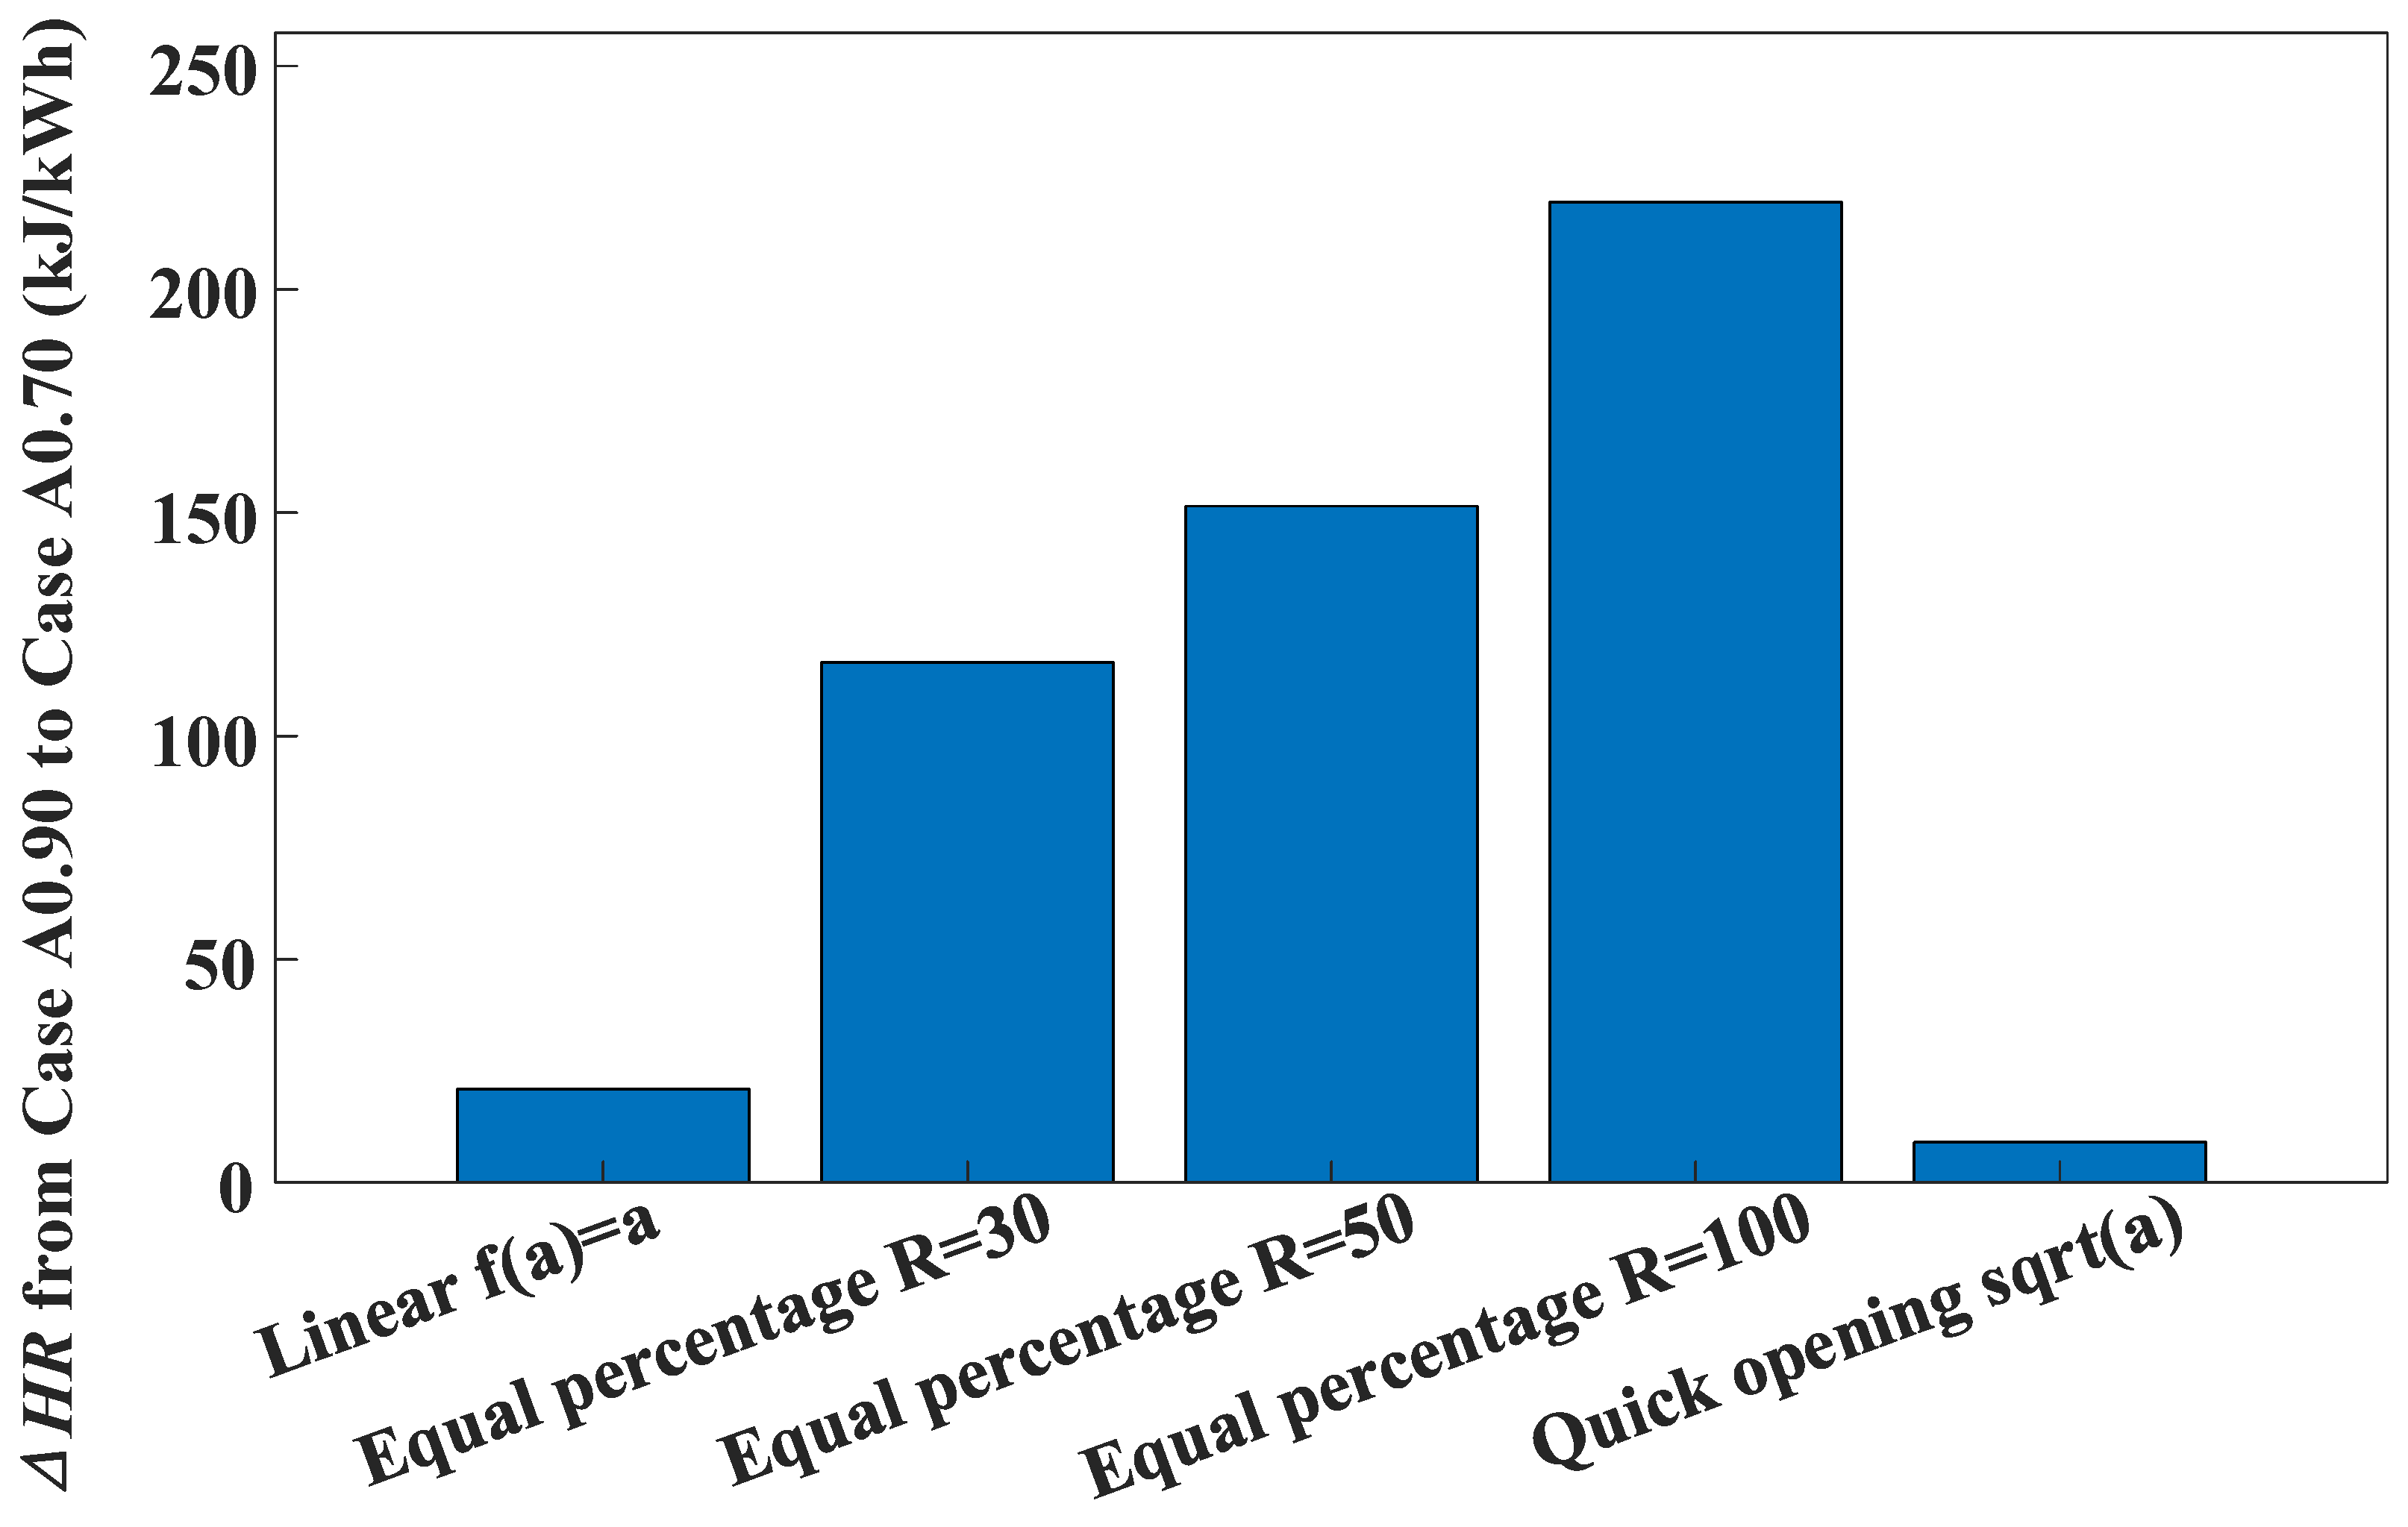
The sensitivity to the assumed valve characteristic is further summarized in
Table 5 and
Figure 8. The comparison includes the baseline linear characteristic, equal-percentage characteristics with
R = 30, 50, and 100, and a representative quick-opening approximation. For each characteristic, the valve coefficient
Kmax is recalibrated at Case A0.90 before calculating the penalty from Case A0.90 to Case A0.70. This recalibration keeps the baseline operating point consistent and isolates the effect of the valve characteristic.
The results show that the assumed valve characteristic has a clear influence on the numerical magnitude of the valve opening penalty. Under the baseline linear characteristic f(a) = a, the heat-rate penalty is 20.93 kJ/kWh, the fuel-flow increase is 0.06 kg/s, the specific-fuel-consumption increase is 0.71 g/kWh, and the relative equivalent-efficiency decrease is 0.26%. For the equal-percentage characteristics, the penalty becomes larger as the rangeability parameter R increases. When R = 30, 50, and 100, the heat-rate penalties are 116.45, 151.49, and 219.53 kJ/kWh, respectively, and the corresponding relative equivalent-efficiency decreases are 1.41%, 1.83%, and 2.63%. In contrast, the representative quick-opening approximation gives a smaller heat-rate penalty of 9.04 kJ/kWh and a relative equivalent-efficiency decrease of 0.11%.
Although the numerical magnitude changes with the assumed valve characteristic, all tested characteristics preserve the same physical conclusion: decreasing the steady control valve opening from Case A0.90 to Case A0.70 increases the same-load steady-state heat-rate and fuel-demand penalty. Therefore, the baseline linear characteristic affects the numerical magnitude of the penalty but does not alter the qualitative interpretation of the valve-margin efficiency trade-off. A manufacturer-specific valve curve can be incorporated in future plant-specific applications if detailed valve test data are available.
4.5. Engineering Implications and Current Limitations
The current result should be interpreted as the steady-state price tag of reserving valve opening margin, not as a full assessment of PFR strategy quality. A smaller steady opening may still be worthwhile if it materially improves the dynamic upward power response, but that capability gain has not yet been modeled in the present study. Likewise, the alternative route of increasing upstream main-steam pressure at the same load remains part of the future work rather than a completed comparison. Therefore, the present conclusions should be read narrowly: within the completed model scope, stronger throttling created by reserving a steadier valve margin increases steam demand, fuel demand, and heat rate at the same electrical output.
5. Conclusions
A simplified steady-state boiler–valve–turbine model has been established to quantify the thermodynamic cost of reserving control valve opening margin under the same-load condition. The present study uses the completed valve model together with fixed boiler-side and turbine-side assumptions, and it focuses on steady-state cost rather than dynamic PFR capability.
For fixed upstream main-steam pressure and temperature, decreasing the steady valve opening strengthens throttling. In the studied 300.102 MW operating point, reducing a from 0.95 to 0.70 lowers the valve-downstream pressure from 16.124 to 15.659 MPa and raises the downstream entropy from 6.430 to 6.442 kJ/(kg·K).
The stronger throttling reduces the effective specific work of the turbine. Over the same a range, wt decreases from 1125.970 to 1122.636 kJ/kg, which forces the required main-steam flow to increase from 273.319 to 274.131 kg/s in order to keep the electrical output unchanged.
The steady-state penalty is clearly reflected in fuel and heat-rate indicators. Relative to the baseline Case A0.90, Case A0.70 increases fuel flow by 0.059 kg/s, raises heat rate by 20.9 kJ/kWh, and increases specific fuel consumption by 0.714 g/kWh. From a practical perspective, the penalty is small per unit of electricity but continuous as long as the higher valve margin is maintained. For the studied 300.102 MW operating point, changing from Case A0.90 to Case A0.70 increases the fuel flow by approximately 0.059 kg/s, equivalent to about 212 kg/h of additional fuel input under the assumed fuel and boiler-efficiency parameters. The heat-rate increase is 20.9 kJ/kWh, and the specific-fuel-consumption increase is 0.714 g/kWh. These values indicate that reserving additional control valve opening margin is not thermodynamically free, even before the dynamic PFR benefit is considered.
The present study does not yet evaluate dynamic PFR capability. Nevertheless, it demonstrates that reserving more control valve opening margin is not thermodynamically free. The steady-state cost quantified here can be used as the baseline for the next-stage comparison that will include dynamic frequency-response capability and the main-steam pressure route.





 ,
,