


Abstract
To address the need for dynamic and static parameter testing of IGBT modules, an integrated test platform was developed. In production-line applications, consistency differences in key parameters between the upper and lower bridge arms of manufactured modules were found to be difficult to quantify using a single metric. To overcome this limitation, a multi-parameter consistency evaluation method was proposed. Based on more than 400 sets of production-level measurements obtained from newly manufactured IGBT modules from the same batch, eight key parameters, including Eon, Eoff, dv/dt, di/dt, VCES, ICES, VGEth and IGES, were selected to construct paired samples of the upper and lower bridge arms. A dimensionless consistency index (CI) was introduced to quantify relative deviations between bridge arms, and consistency characteristics were analyzed using raw-parameter boxplots, CI boxplots, and paired scatter plots in terms of distribution, discrepancy quantification, and sample-wise pairing. The results show that different parameters exhibit different levels of distributional difference and relative deviation between the two bridge arms under identical test conditions, and that the three analyses reveal mutually consistent trends. The proposed method provides an effective basis for within-batch quality assessment, bridge-arm matching, abnormal sample identification, and production process troubleshooting.
1. Introduction
IGBT power modules are key devices in power electronic conversion systems and are widely used in high-power, high-reliability applications such as electric vehicle drive systems, railway traction systems, and industrial variable-frequency drives [1]. With the continuous increase in power density, switching frequency, and system integration, performance stability issues arising from the combined effects of electrical stress, thermal stress, and dynamic commutation have become increasingly prominent [2]. In bridge-type power conversion topologies, the devices in the upper and lower bridge arms do not operate independently; rather, they are strongly coupled during turn-on, turn-off, freewheeling, commutation, and loss distribution. The degree of parameter matching between the two bridge arms affects not only switching behavior and loss distribution, but also thermal load balancing, dynamic response consistency, and overall system reliability [3,4]. Therefore, quantitative evaluation of the consistency of key parameters between the upper and lower bridge arms of IGBT modules is of clear engineering significance.
Existing studies on the performance evaluation and reliability of IGBT modules have mainly focused on condition monitoring, failure mechanism analysis, and lifetime prediction [5]. In condition monitoring studies, parameters such as threshold voltage, on-state voltage drop, leakage current, and gate-related transient signals are commonly used to characterize device degradation and identify health-state variations during operation [6]. Failure mechanism studies have further revealed that thermal cycling, power cycling, overload stress, bond-wire fatigue, solder-layer degradation, and packaging-related thermal–mechanical stress can significantly affect the electrical behavior and reliability of IGBT modules [7]. In recent years, data-driven methods have also been introduced to establish relationships between measurable electrical features and aging degree or remaining useful life, thereby improving the capability of reliability prediction [8]. These studies provide important references for understanding the degradation behavior and reliability evolution of IGBT modules. However, most of them are oriented toward single-device degradation, failure evolution, or lifetime assessment, and they pay relatively limited attention to the paired multi-parameter relationship between the upper and lower bridge arms within the same module under production test conditions. Therefore, a systematic bridge-arm consistency evaluation method based on paired production-line test data is still needed [9,10].
In practice, bridge-arm mismatch does not necessarily manifest itself as a pronounced anomaly in a single indicator, but may instead appear simultaneously across multiple parameter dimensions. Different parameters correspond to different physical processes [11]. Dynamic parameters mainly reflect transient switching behavior and energy variation, whereas static parameters characterize blocking capability, threshold behavior, and leakage behavior under specified test conditions. Differences between the upper and lower bridge arms in these parameters may lead to asymmetric commutation, increased local losses, concentrated thermal stress, and degraded long-term service stability [12]. It is therefore difficult to comprehensively characterize bridge-arm consistency by relying solely on a single parameter or a single graphical analysis method [13]. A multi-parameter consistency evaluation method based on paired samples from the upper and lower bridge arms is therefore needed to comprehensively analyze bridge-arm matching characteristics in terms of overall distribution, discrepancy quantification, and sample-wise correspondence [14].
From the perspective of engineering application, the application of the proposed method to IGBT module samples from the same batch has clear practical significance. Since samples from the same batch generally have relatively consistent manufacturing processes, material sources, and packaging conditions, comparing bridge-arm parameters under unified test conditions can reduce the influence of inter-batch variations to a certain extent. As a result, the observed parameter differences can more directly reflect the matching state between the upper and lower bridge arms within the module.
Based on this consideration, this study focuses on the bridge-arm consistency evaluation of IGBT modules and conducts multi-parameter analysis using production-line dynamic and static parameter test data. Relying on the self-developed IGBT dynamic–static test machine, dynamic and static parameter data of newly manufactured IGBT modules were obtained under unified test conditions. Key parameters, including turn-on energy, turn-off energy, voltage change rate, current change rate, blocking voltage, leakage current, gate threshold voltage, and gate leakage current, were selected as evaluation objects, and paired sample sets of the upper and lower bridge arms were constructed. On this basis, a dimensionless Consistency Index (CI) was introduced to characterize the relative differences between bridge arms. Combined with parameter distribution analysis, CI-based quantification, and sample-level paired analysis, the bridge-arm consistency characteristics were systematically evaluated. This work aims to provide a feasible experimental analysis method for IGBT module consistency evaluation, bridge-arm matching, abnormal sample identification, and production-process issue tracing.
Newly manufactured IGBT modules from the same batch were used as the main validation objects in this study. The purpose of using same-batch samples was to reduce the influence of inter-batch differences in manufacturing processes, material sources, and packaging conditions on the analysis results, so that the observed parameter differences could more directly reflect the matching state between the upper and lower bridge arms within the module. The remainder of this paper is organized as follows. Section 2 introduces the overall structure of the IGBT dynamic–static test machine, the key parameter measurement methods, and the test conditions. Section 3 establishes the bridge-arm multi-parameter consistency evaluation method. Section 4 presents the consistency analysis results based on production-line measured data. Section 5 summarizes the conclusions and discusses the applicability of the method and possible directions for future improvement.
2. IGBT Module Test System and Key Parameter Measurement
To evaluate the consistency of key parameters between the upper and lower bridge arms of IGBT modules, production-level measurement data with clear provenance, unified test conditions, and good comparability are first required. The dynamic–static parameter test platform developed in this study enables the acquisition of both static and dynamic parameters of IGBT modules under unified test conditions, thereby providing a reliable foundation for subsequent key-parameter measurement and consistency evaluation.
2.1. Overall Design of the Test System
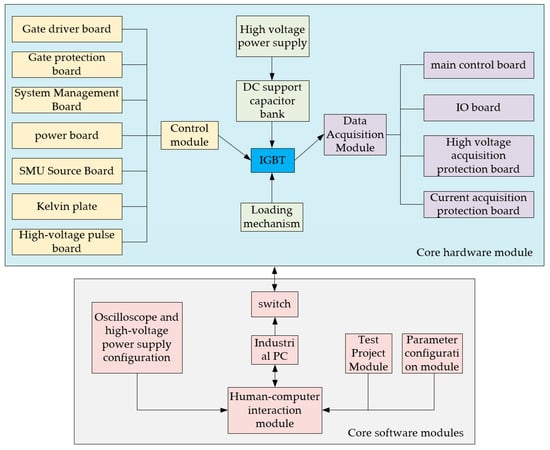
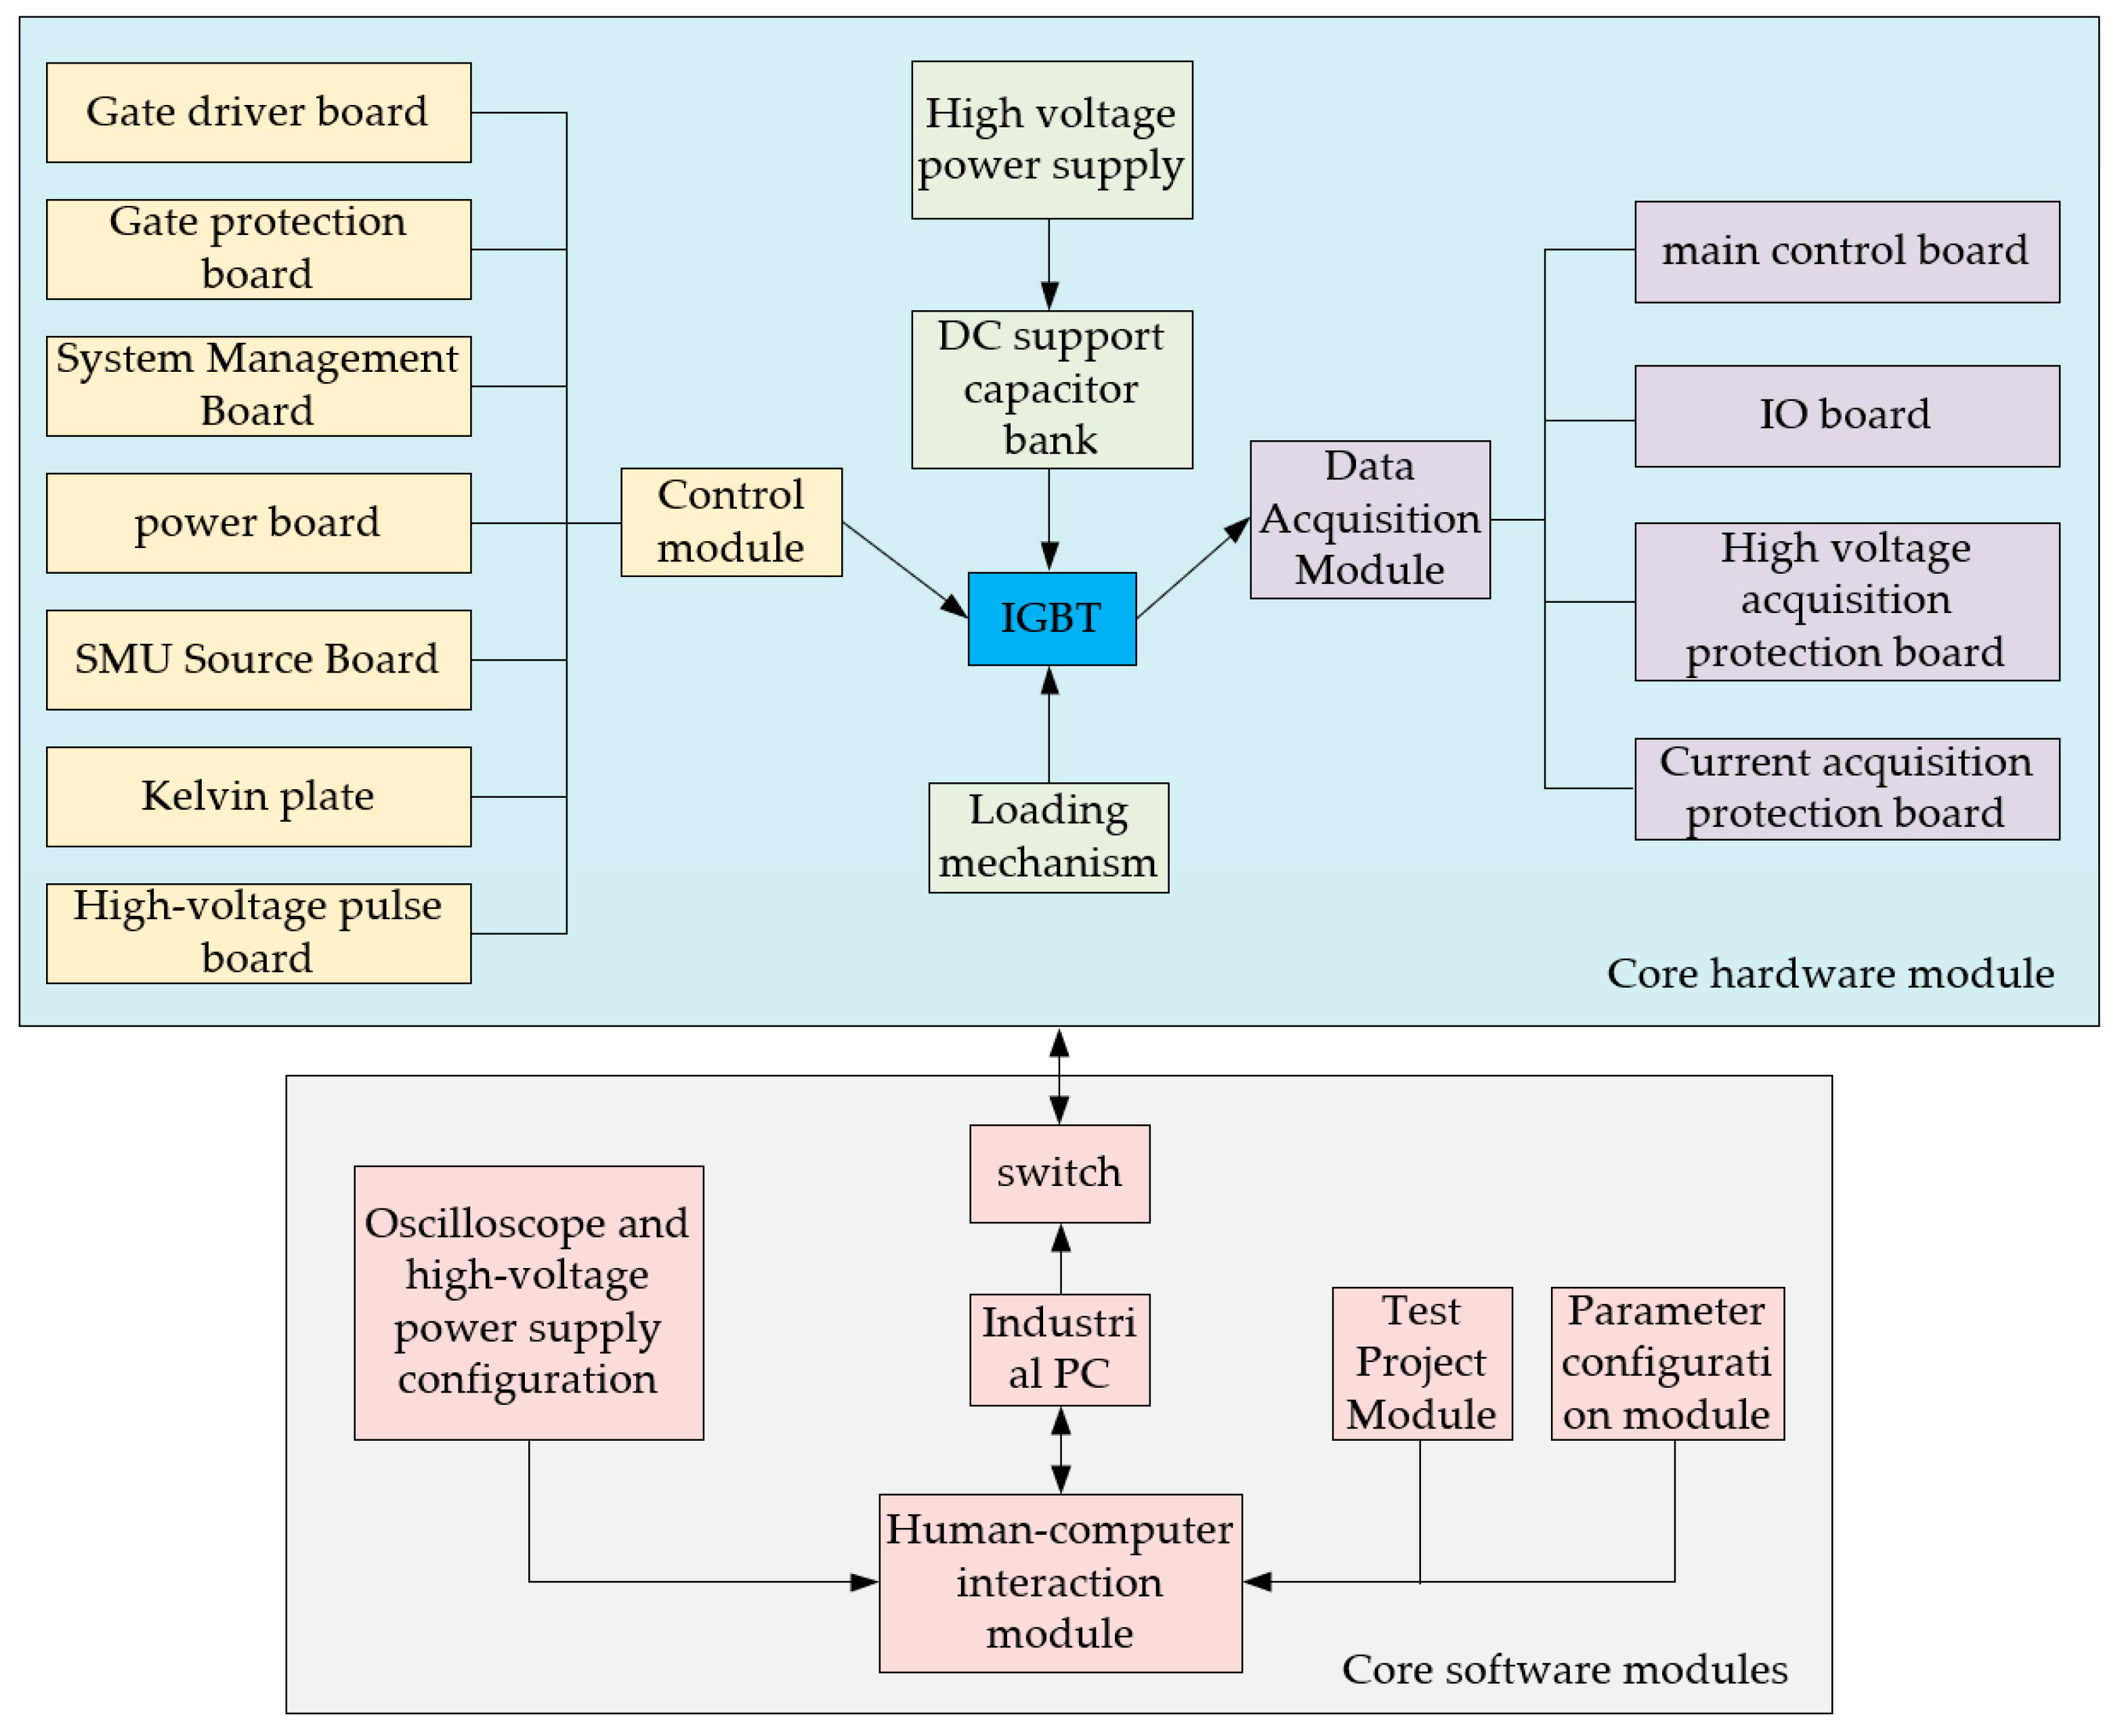
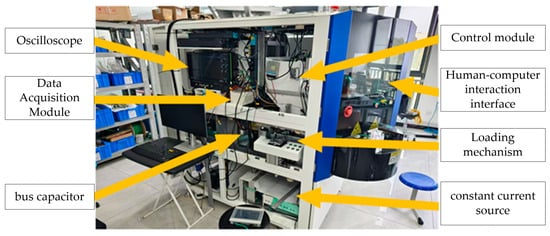
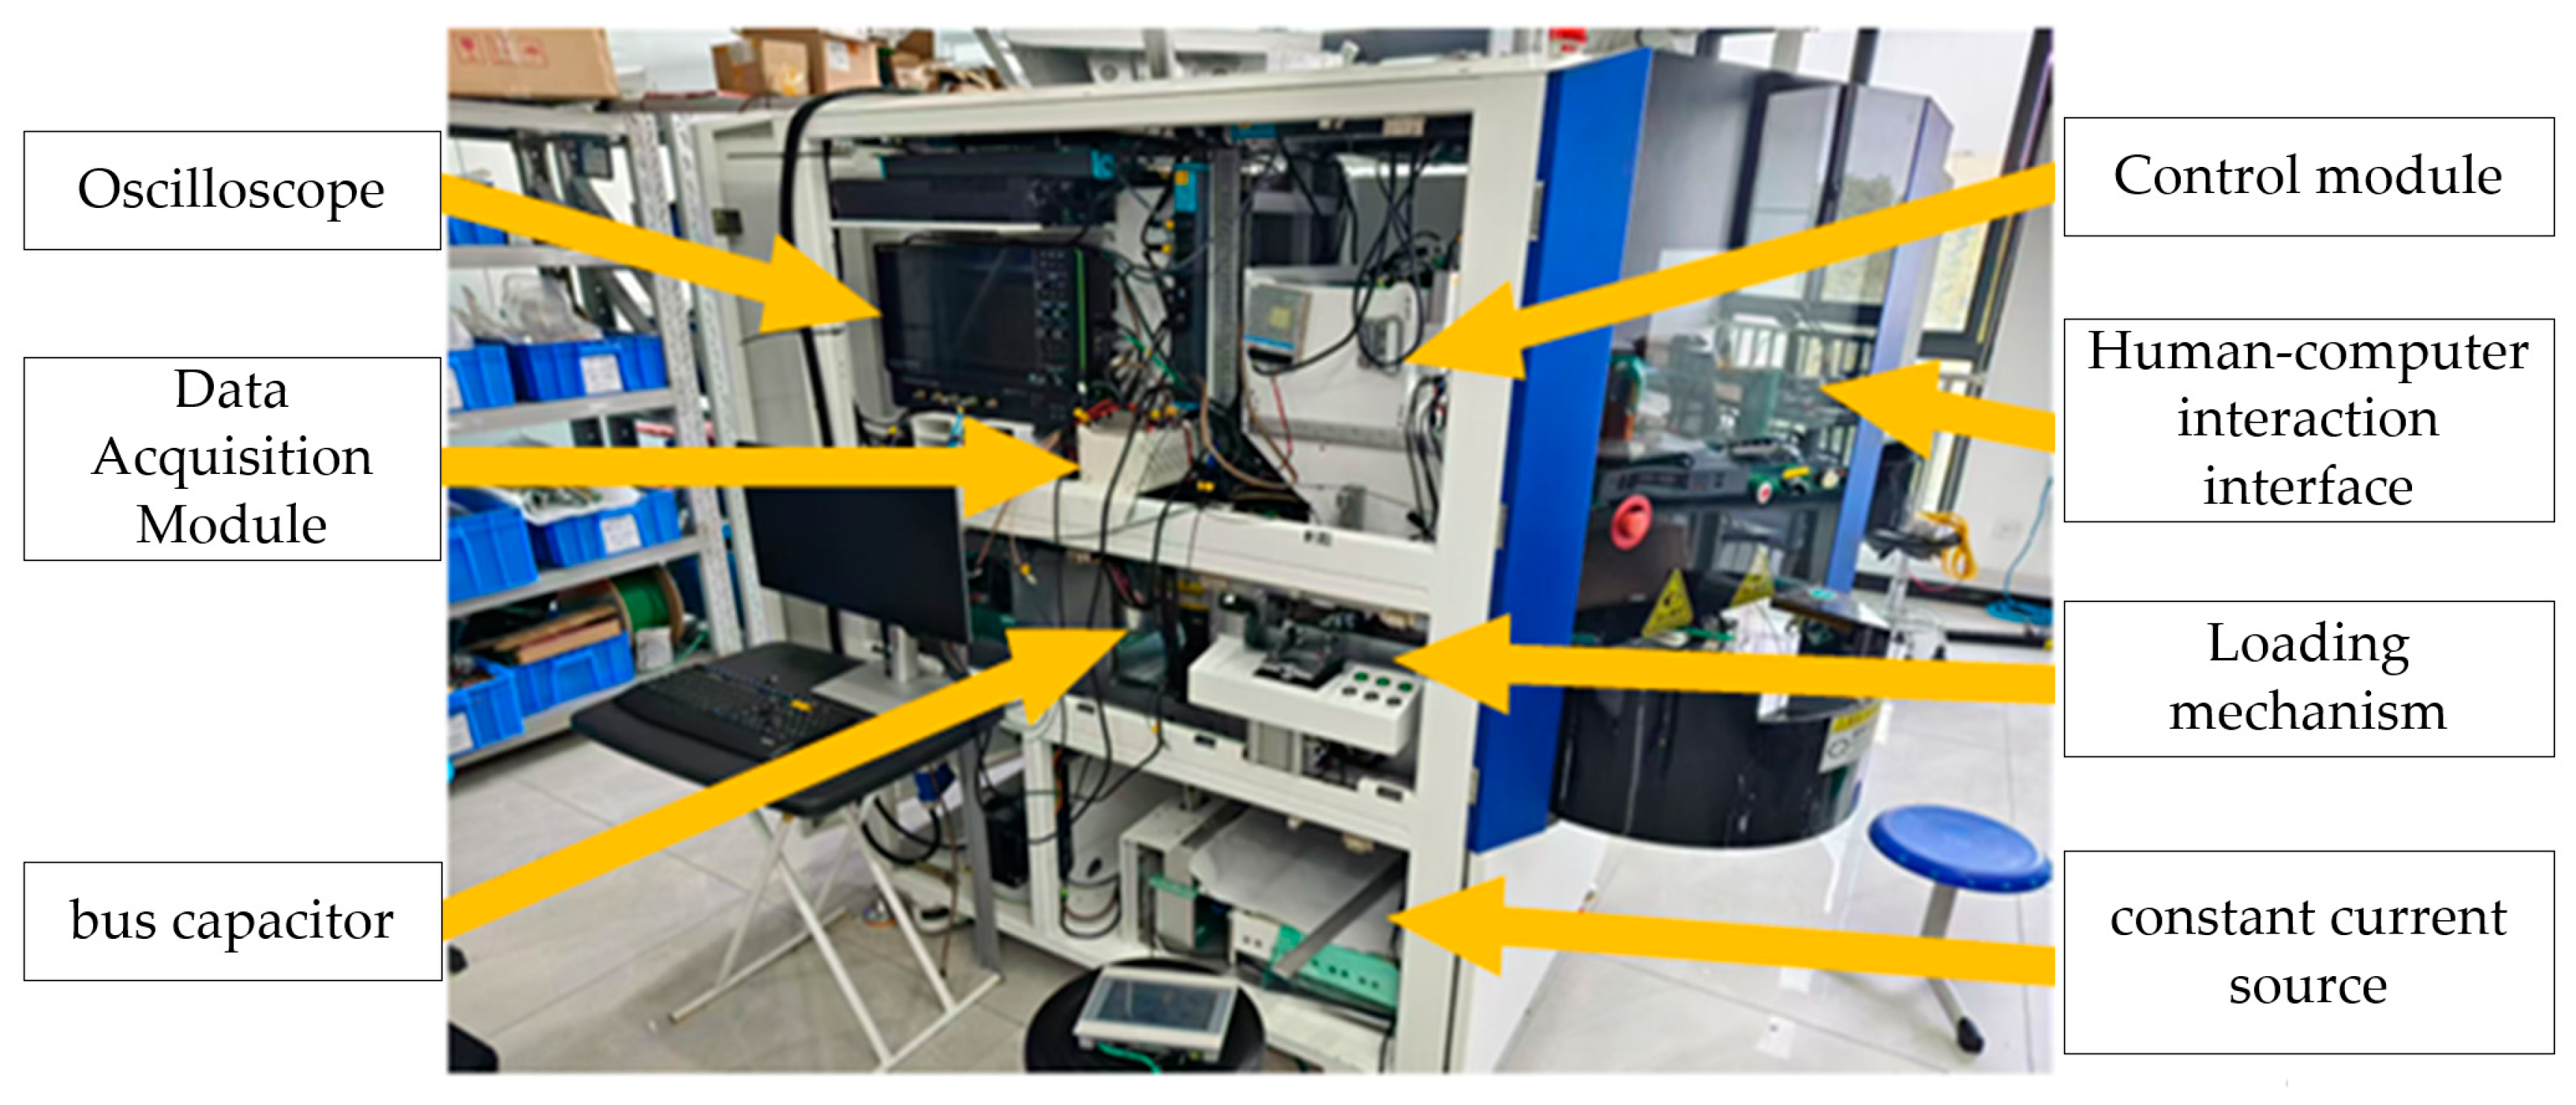
As shown in Figure 1, the test system consists of two main parts: core hardware modules and core software modules. The core hardware modules include a control module, a loading unit, and an acquisition module. Specifically, the control module comprises a gate driver board, a gate protection board, a system management board, a power supply board, an SMU source board, a Kelvin board, and a high-voltage pulse board, which perform functions such as gate driving, high-voltage excitation, static source measurement, and contact detection. The loading unit establishes the test circuit and load conditions required for the device under test, while the acquisition module captures key voltages, currents, and gate-drive signals. Together, these hardware modules operate on the IGBT module under test and provide the hardware foundation for parameter measurement [15].
Figure 1.
Overall structure of the test system.
The core software modules mainly consist of an industrial computer, a human–machine interface (HMI) module, a test-item module, a parameter-configuration module, and configuration units for the oscilloscope and high-voltage power supply. Serving as the upper-level control center, the industrial computer communicates with the core hardware modules through a switch to perform functional-board scheduling, test-sequence execution, and data exchange. The test-item module is used to define the test procedures and test objects, the parameter-configuration module is used to set the conditions and limits for each test item, and the HMI module is used for test-command input, status monitoring, and result display. In addition, the oscilloscope and high-voltage power supply are configured and controlled in a unified manner on the software side to support dynamic waveform acquisition and DC bus voltage establishment.
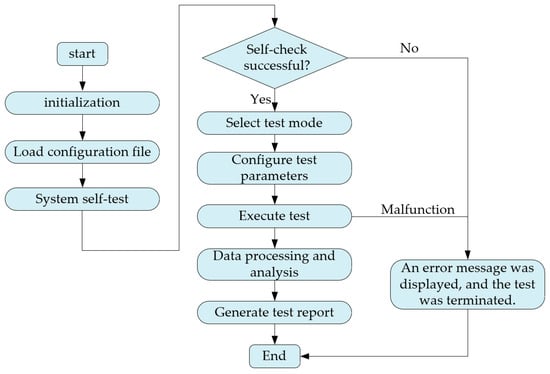
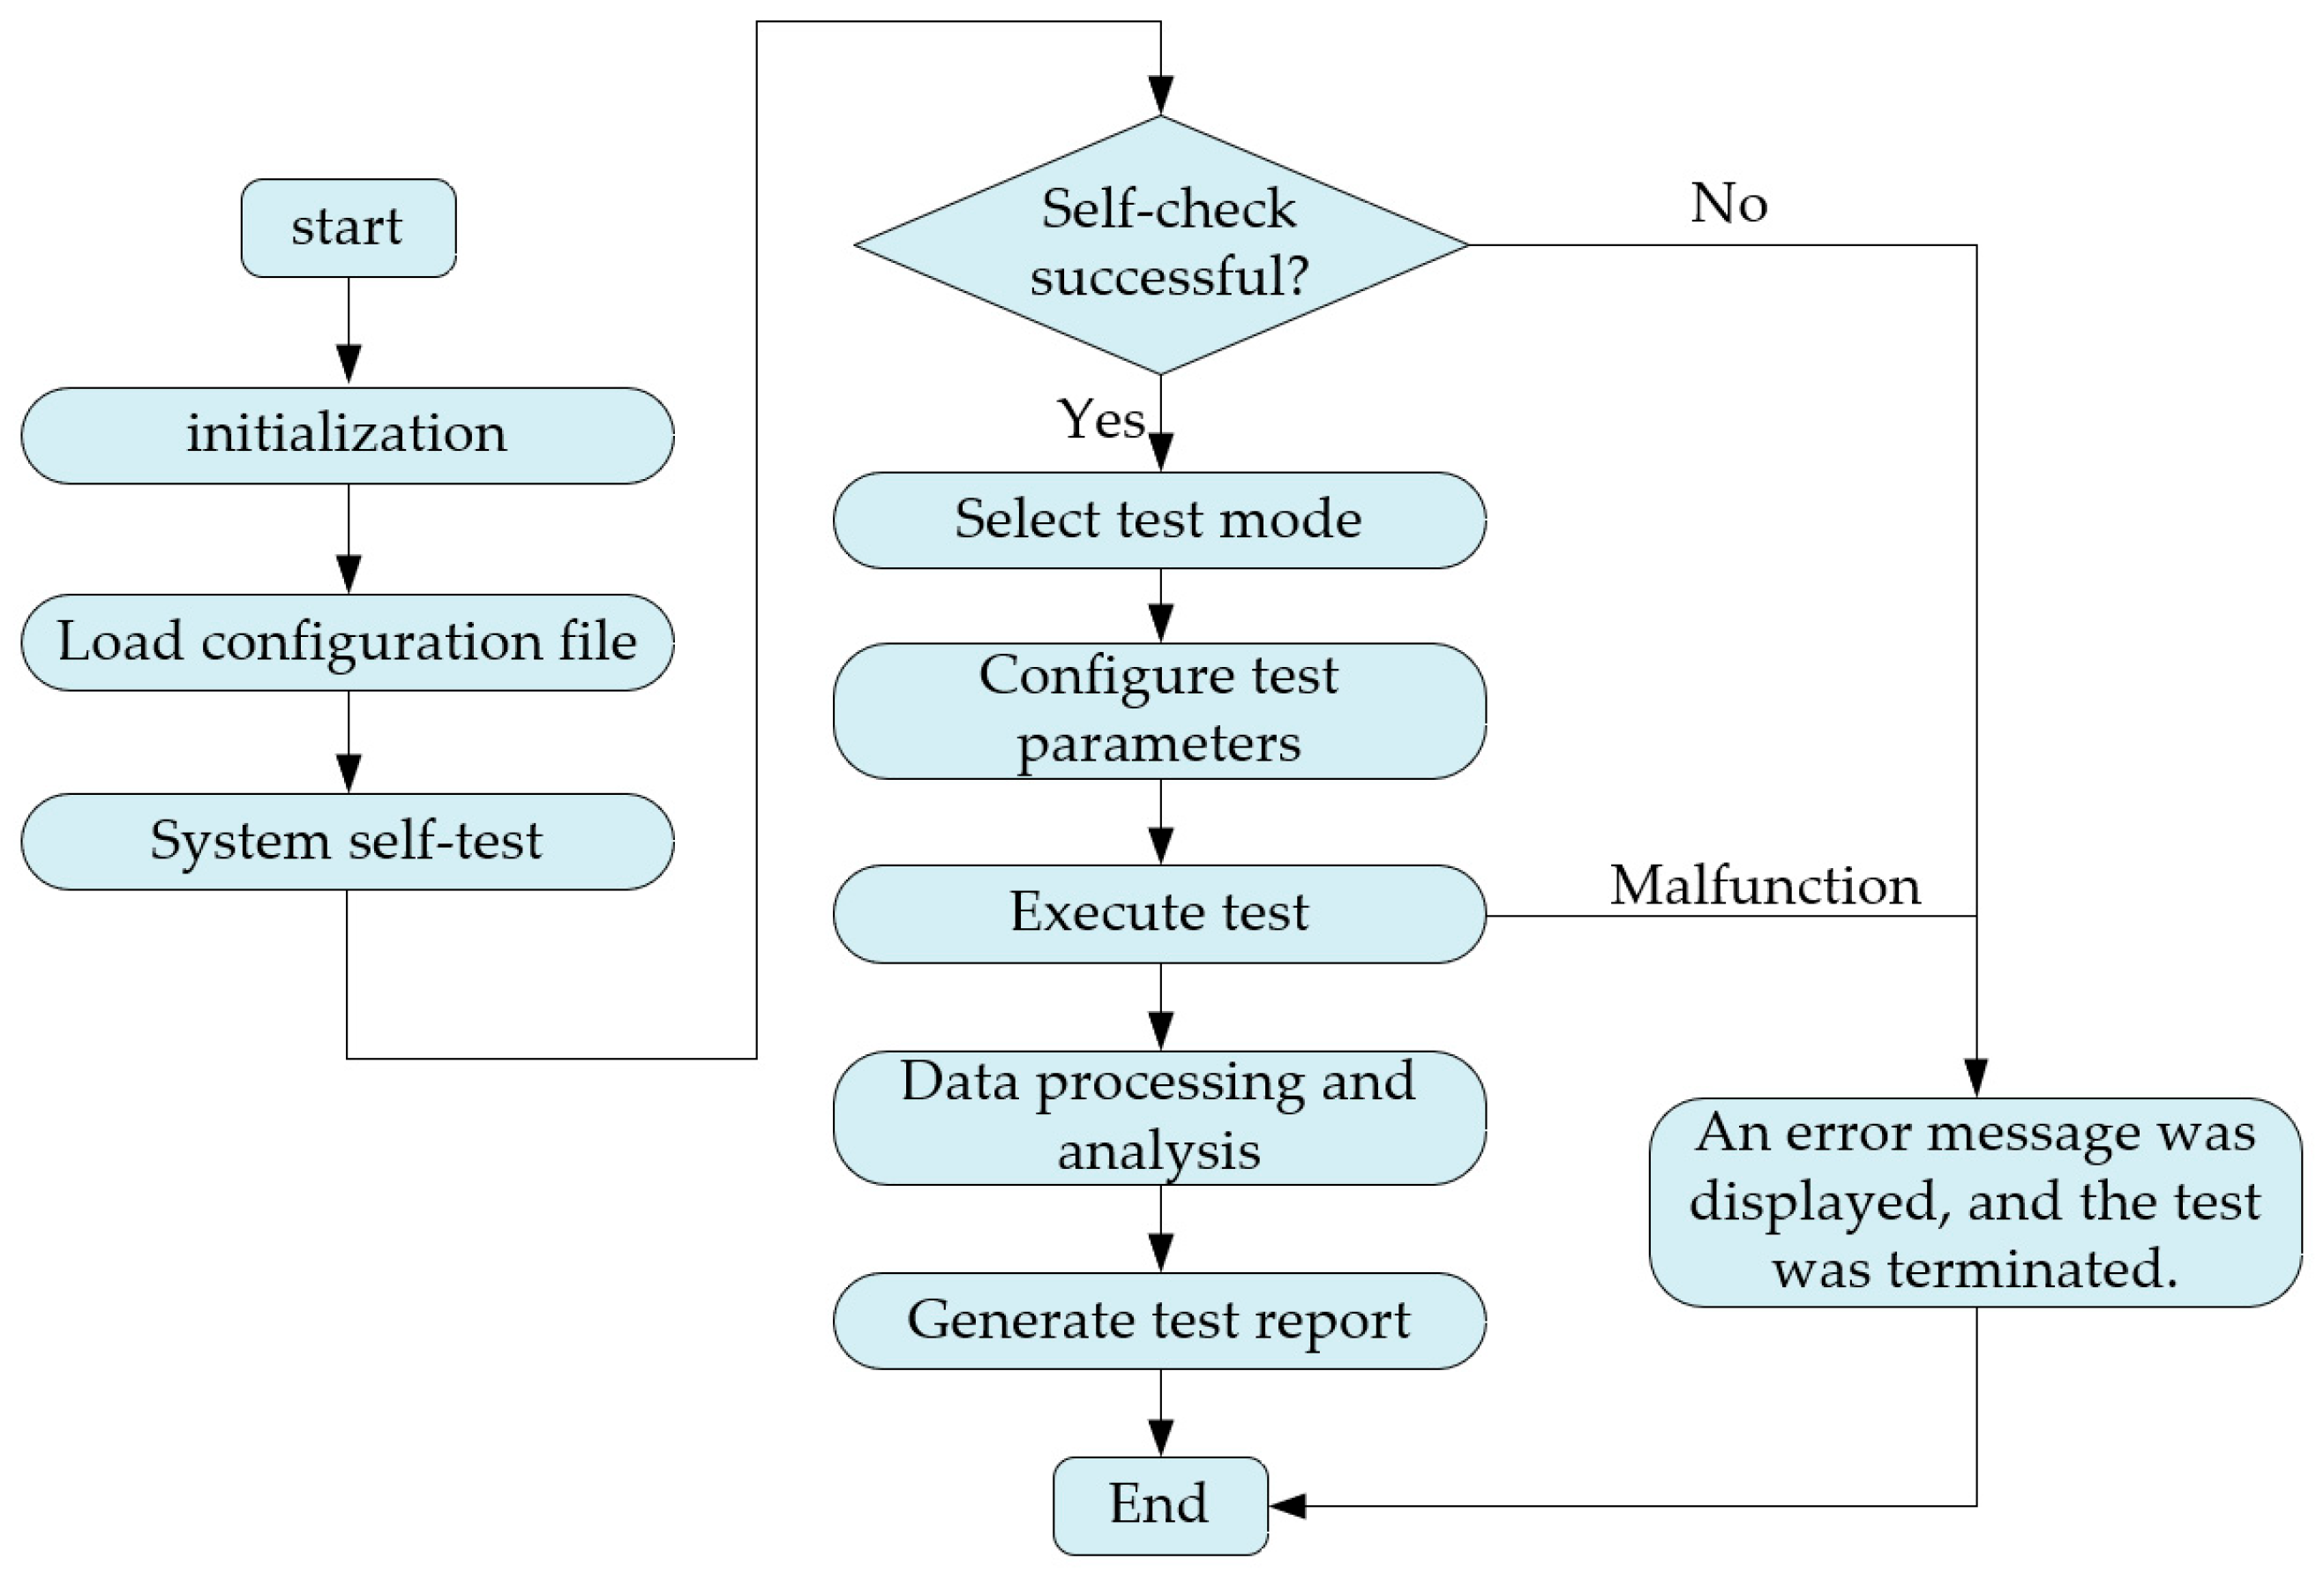
During test execution, coordinated operation among the modules is achieved through a unified control logic. Specifically, the control module is responsible for issuing test commands, scheduling board-level resources, and controlling test timing; the loading unit connects the device under test and establishes the required test circuit according to predefined conditions; and the acquisition module synchronously captures key voltages, currents, and gate-drive signals during the test. Meanwhile, the oscilloscope, high-voltage power supply, and functional boards are uniformly configured and controlled via the industrial computer, thereby ensuring that parameter measurements for different test items and different samples are conducted under identical procedures and conditions. Through such hardware–software coordination, the test system forms an integrated closed-loop workflow covering parameter configuration, test execution, signal acquisition, and result feedback, thereby providing a reliable foundation for subsequent bridge-arm consistency analysis. The upper-level control flow for dynamic–static testing of IGBT modules is shown in Figure 2, and a photograph of the developed dynamic–static test platform is shown in Figure 3.
Figure 2.
Host computer testing process.
Figure 3.
Physical prototype of the dynamic–static test machine.
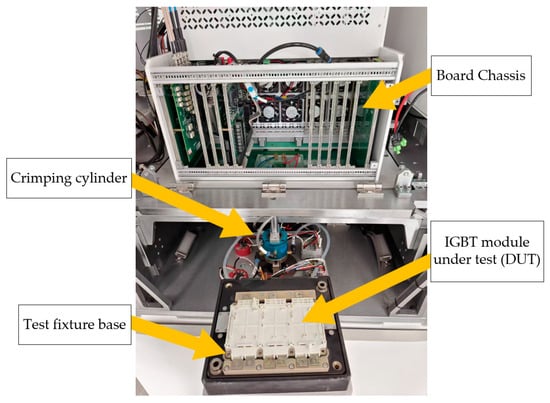
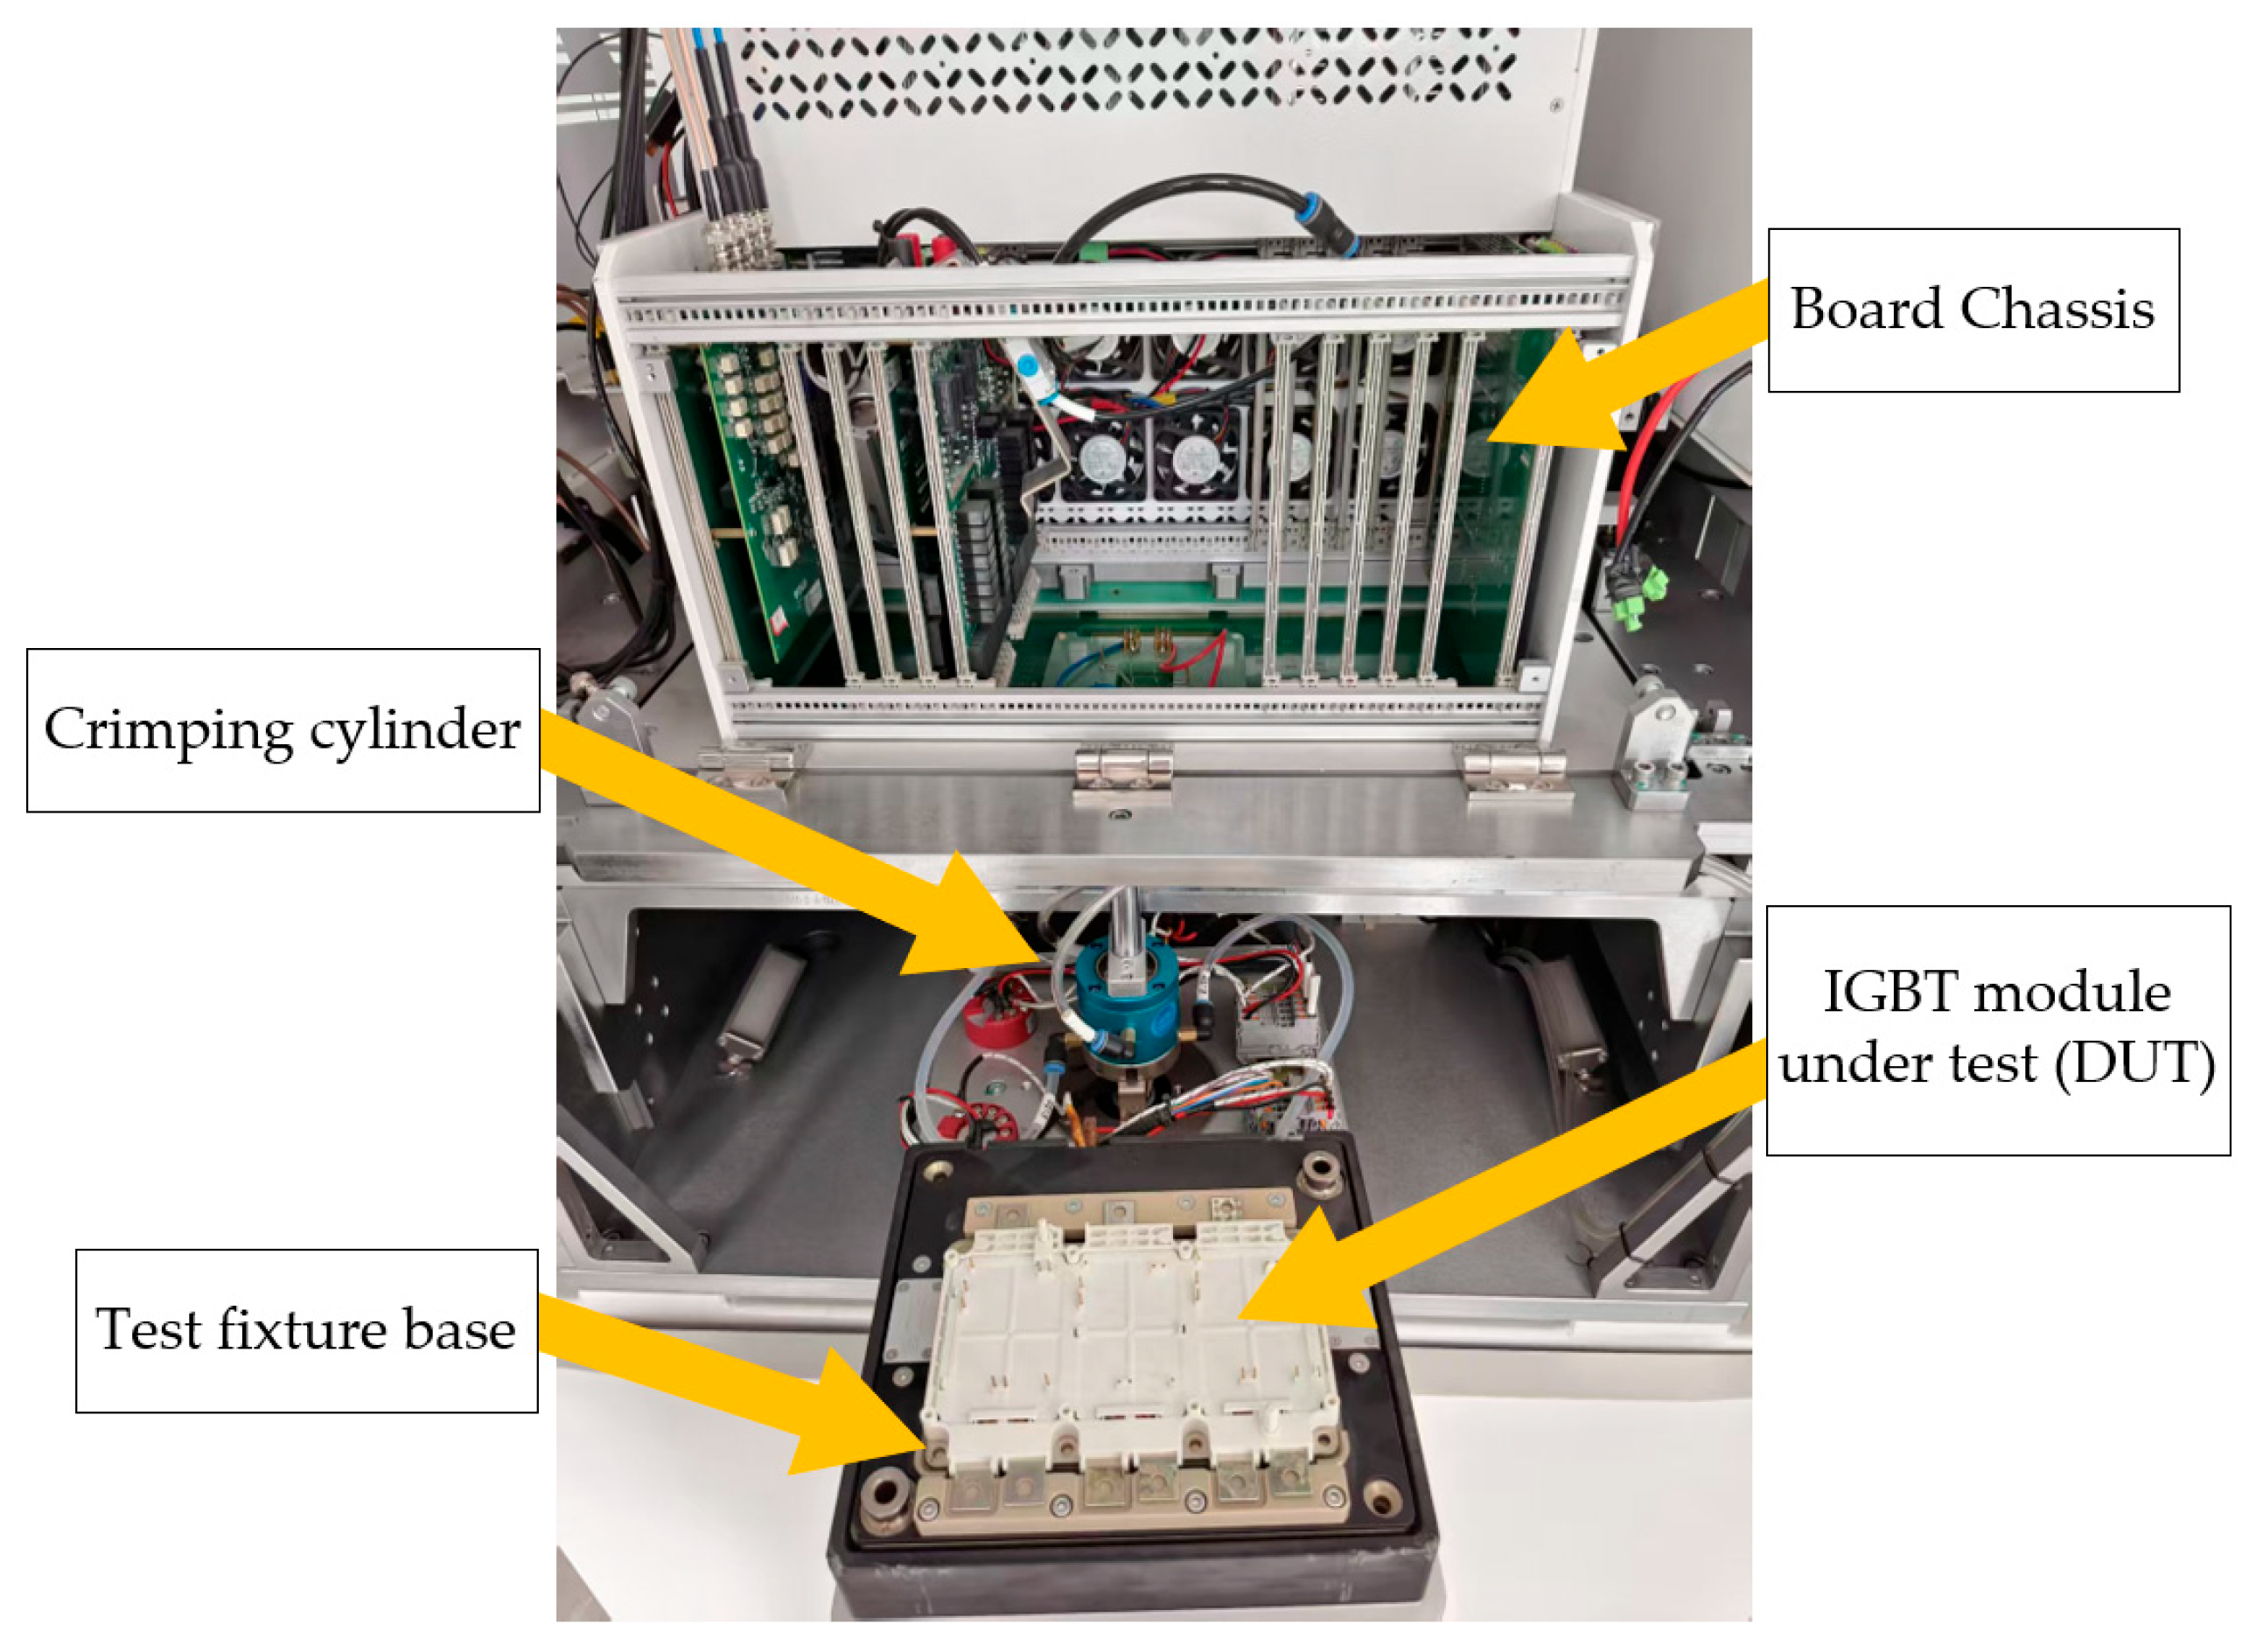
To further illustrate the installation position of the device under test and its connection to the test platform, Figure 4 shows the loading fixture and DUT placement in the developed IGBT dynamic–static test machine. During testing, the IGBT module is placed on the test fixture base and fixed by the pneumatic loading cylinder, ensuring stable mechanical contact between the module terminals and the test fixture. The board-card chassis above the fixture contains the functional boards used for gate driving, protection, signal acquisition, and source-measurement control. Through the loading fixture and Kelvin connection paths, the upper and lower bridge-arm terminals of the IGBT module are connected to the corresponding dynamic and static test circuits.
Figure 4.
Loading fixture and DUT placement in the developed IGBT dynamic–static test machine.
2.2. Core Hardware Configuration
2.2.1. Gate Driver Board
The gate driver and protection board is an in-house developed module used to generate double-pulse gate-drive signals for the selected upper- or lower-bridge-arm IGBT unit. The board is controlled by a Zynq-7000 SoC, which performs gate-drive timing control, bridge-arm selection, and gate-resistance configuration. In this study, the gate-drive voltage was set to −8/+15 V, and the turn-on and turn-off gate resistances were set to 2.4 Ω and 5.1 Ω, respectively. The driver output is electrically isolated from the control circuit through an isolated driver stage and is connected to the gate–emitter terminals of the device under test through the loading fixture and switching path. To improve test safety, the board integrates gate overvoltage and undervoltage protection circuits, which sample the measured gate voltage and compare it with preset thresholds. When an abnormal gate-drive voltage is detected, a fault signal is sent to the controller to stop the gate-drive output and interrupt the test sequence. Meanwhile, the gate-voltage signal can be routed to the oscilloscope through the oscilloscope channel-switching circuit for dynamic waveform observation.
2.2.2. High-Voltage Power Supply, DC-Link Capacitor, and Load Inductor
The dynamic test power loop consisted of an HY-HV series programmable DC high-voltage power supply developed by Shanghai Hangyu, a DC-link capacitor bank, and a load inductor. The high-voltage supply has a rated output voltage range of 0–2000 V and a rated output current range of 0–1000 mA, and supports CV/CC operating modes as well as Modbus and SCPI communication through CAN and LAN interfaces. In the double-pulse tests, the supply was used to charge the DC-link capacitor bank and establish the required DC-link voltage, with VCC set to 400 V according to the production test specification. To provide transient energy support and reduce DC-link voltage fluctuation during switching, multiple film capacitors were connected in parallel to form a DC-link capacitance of approximately 4.8 mF. Film capacitors were selected because of their low equivalent series resistance and inductance, favorable high-frequency characteristics, and good thermal stability. The load current was established using two customized air-core pulse inductors, J110-107F3 and J110-108F3, whose combined inductance can be configured as 20 μH, 50 μH, 100 μH, 200 μH, 500 μH, or 1000 μH, with the DC resistance at each setting less than 1 Ω. For the IGBT module tested in this study, the load inductance was set to 20 μH and the target load current IL was set to 450 A. The high-voltage supply, DC-link capacitor bank, load inductor, and selected bridge-arm unit of the IGBT module were connected to form the main double-pulse current path, while the voltage setting and charging process were controlled by the upper computer.
2.2.3. SMU Board
The static parameter tests were performed using an in-house developed SMU board with FPGA-based control. The board supported programmable voltage/current source-measure operation in both constant-voltage and constant-current modes, with an output capability of up to ±100 V and 2 A. Through the Force/Sense four-wire connection and Kelvin loading fixture, the SMU board was connected to the DUT terminals to reduce the influence of lead and contact resistance. It was used to provide controlled excitation and synchronous measurement for static parameters such as VGE(th), IGES, VCES, and ICES.
2.2.4. Oscilloscope and Voltage/Current Probes
The dynamic waveforms were recorded using a TELEDYNE LECROY HD06034B digital oscilloscope (Teledyne LeCroy. New York , NY, USA), which provides a sampling rate of up to 10 GSa/s, a bandwidth of 350 MHz, a maximum record length of 50 Mpts per channel, and a vertical resolution of up to 12 bits. The oscilloscope was used to synchronously acquire the gate-emitter voltage VGE (t), collector–emitter voltage VCE(t), and collector current IC(t), which were further used to calculate Eon, Eoff, dv/dt, and di/dt. Considering the voltage overshoot during switching, the VCE and VGE signals were measured using CYBERTEK DP6350B high-voltage differential probes (Shenzhen Zhiyong Electronics Co., Ltd. Shenzhen, China), with a bandwidth of 300 MHz, an accuracy of ±2%, and selectable attenuation ratios of 100X/1000X corresponding to maximum differential voltages of ±350 V and ±3500 V, respectively. The collector current IC was measured using a CP9121SA/D2A flexible Rogowski current probe manufactured by Shenzhen Youce Technology Co., Ltd. (Shenzhen, Guangdong, China), with a sensitivity of 0.5 mV/A, a peak current capability of 12 kA, a maximum current slew-rate capability of 70 kA/μs, a noise level of 5 mV, a bandwidth of 30 MHz, and a typical accuracy of 2%. This acquisition configuration provides the bandwidth, dynamic range, and measurement accuracy required for extracting switching energy and transient transition-rate parameters in double-pulse testing.
2.3. Measurement Methods for Key Parameters
Based on the above test system, this study selected key parameters that can characterize the dynamic switching behavior and static electrical characteristics of IGBT modules as the objects of consistency evaluation. To ensure the comparability and traceability of the subsequent bridge-arm consistency analysis, it is necessary to clarify the physical meanings of these parameters and their measurement principles. A total of eight key parameters were selected in this study, and their specific definitions are listed in Table 1.
Table 1.
Key parameter definition.
2.3.1. Double-Pulse Testing
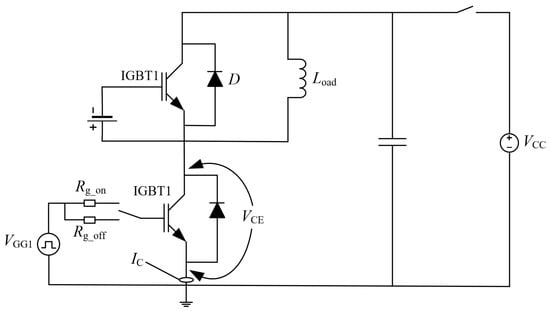
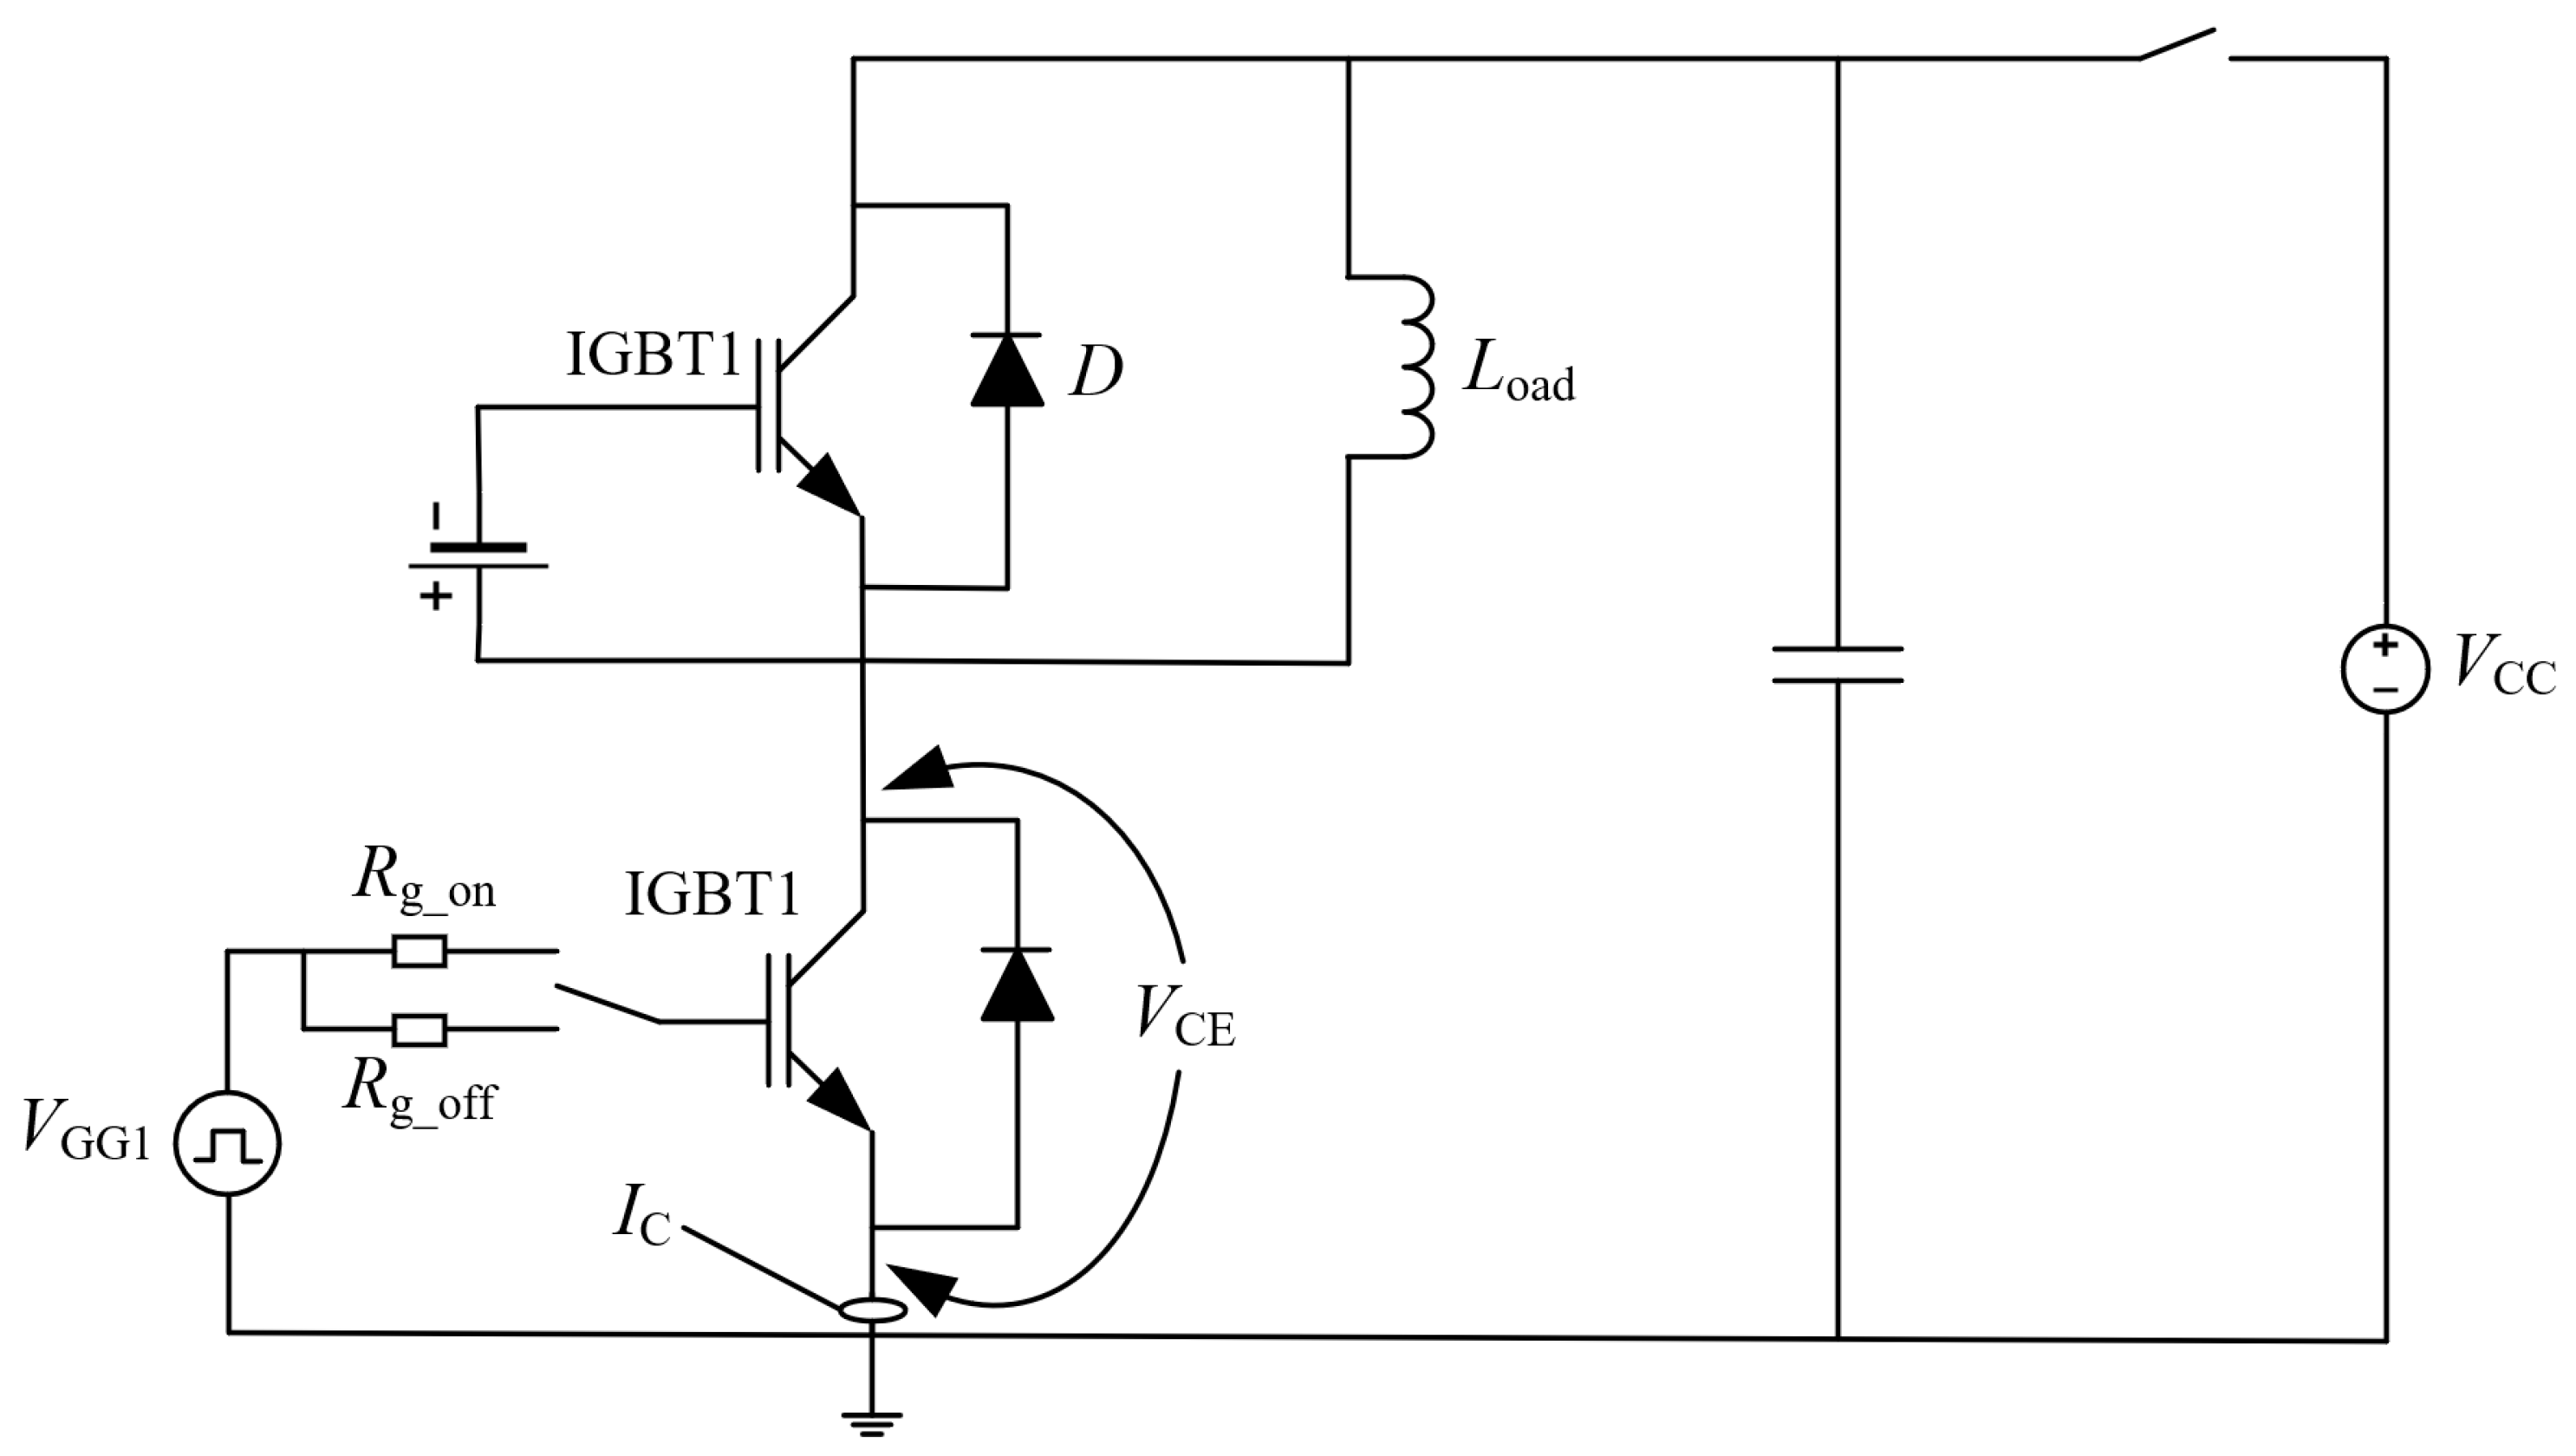
To obtain the dynamic characteristic parameters of IGBT modules, the double-pulse test method was adopted in this study. This method can record the key voltage and current waveforms during the turn-on and turn-off processes of the device under unified test conditions and is a widely used approach for characterizing the dynamic switching behavior of IGBTs. In accordance with the measurement requirements for parameters such as turn-on energy, turn-off energy, voltage slew rate, and current slew rate, and with reference to the International Electrotechnical Commission standard IEC 60747-9:2019 [16], the main circuit for the double-pulse test was designed, as illustrated in Figure 5.
Figure 5.
Schematic diagram of the double-pulse test circuit.
In Figure 5, VCC denotes the DC voltage source, Load denotes the load inductor, D denotes the freewheeling diode, and VGG1 denotes the gate-drive power supply. Rg_on and Rg_off represent the turn-on and turn-off gate resistors, respectively. IGBT1 and IGBT2 are the upper and lower test units in the bridge arm of the device under test, and the two units are connected in series to form a half-bridge topology. Specifically, a negative gate bias is applied to the upper device, IGBT1, to prevent unintended turn-on, while the lower device, IGBT2, serves as the device under test and is driven by the double-pulse signal. During testing, the DC-link capacitor bank provides a stable test voltage for the main circuit under VCC and establishes the required current condition through the load inductor. Meanwhile, the gate voltage, collector–emitter voltage, and collector current waveforms of IGBT2 are acquired in real time. For bridge-type modules, during the turn-off stage of IGBT2, the inductor current freewheels through the antiparallel diode of the upper device, thereby forming a dynamic test circuit in which the upper and lower bridge arms operate in coordination. This provides the basis for the subsequent comparative analysis of bridge-arm parameters.
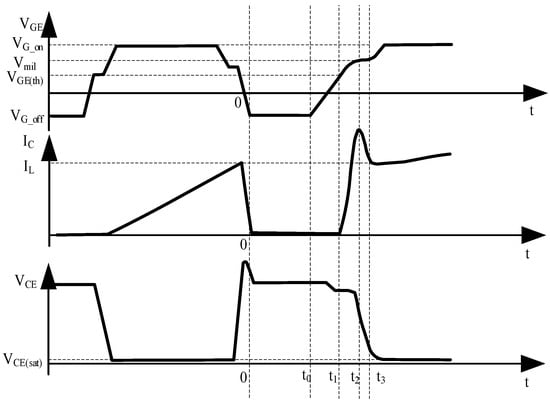
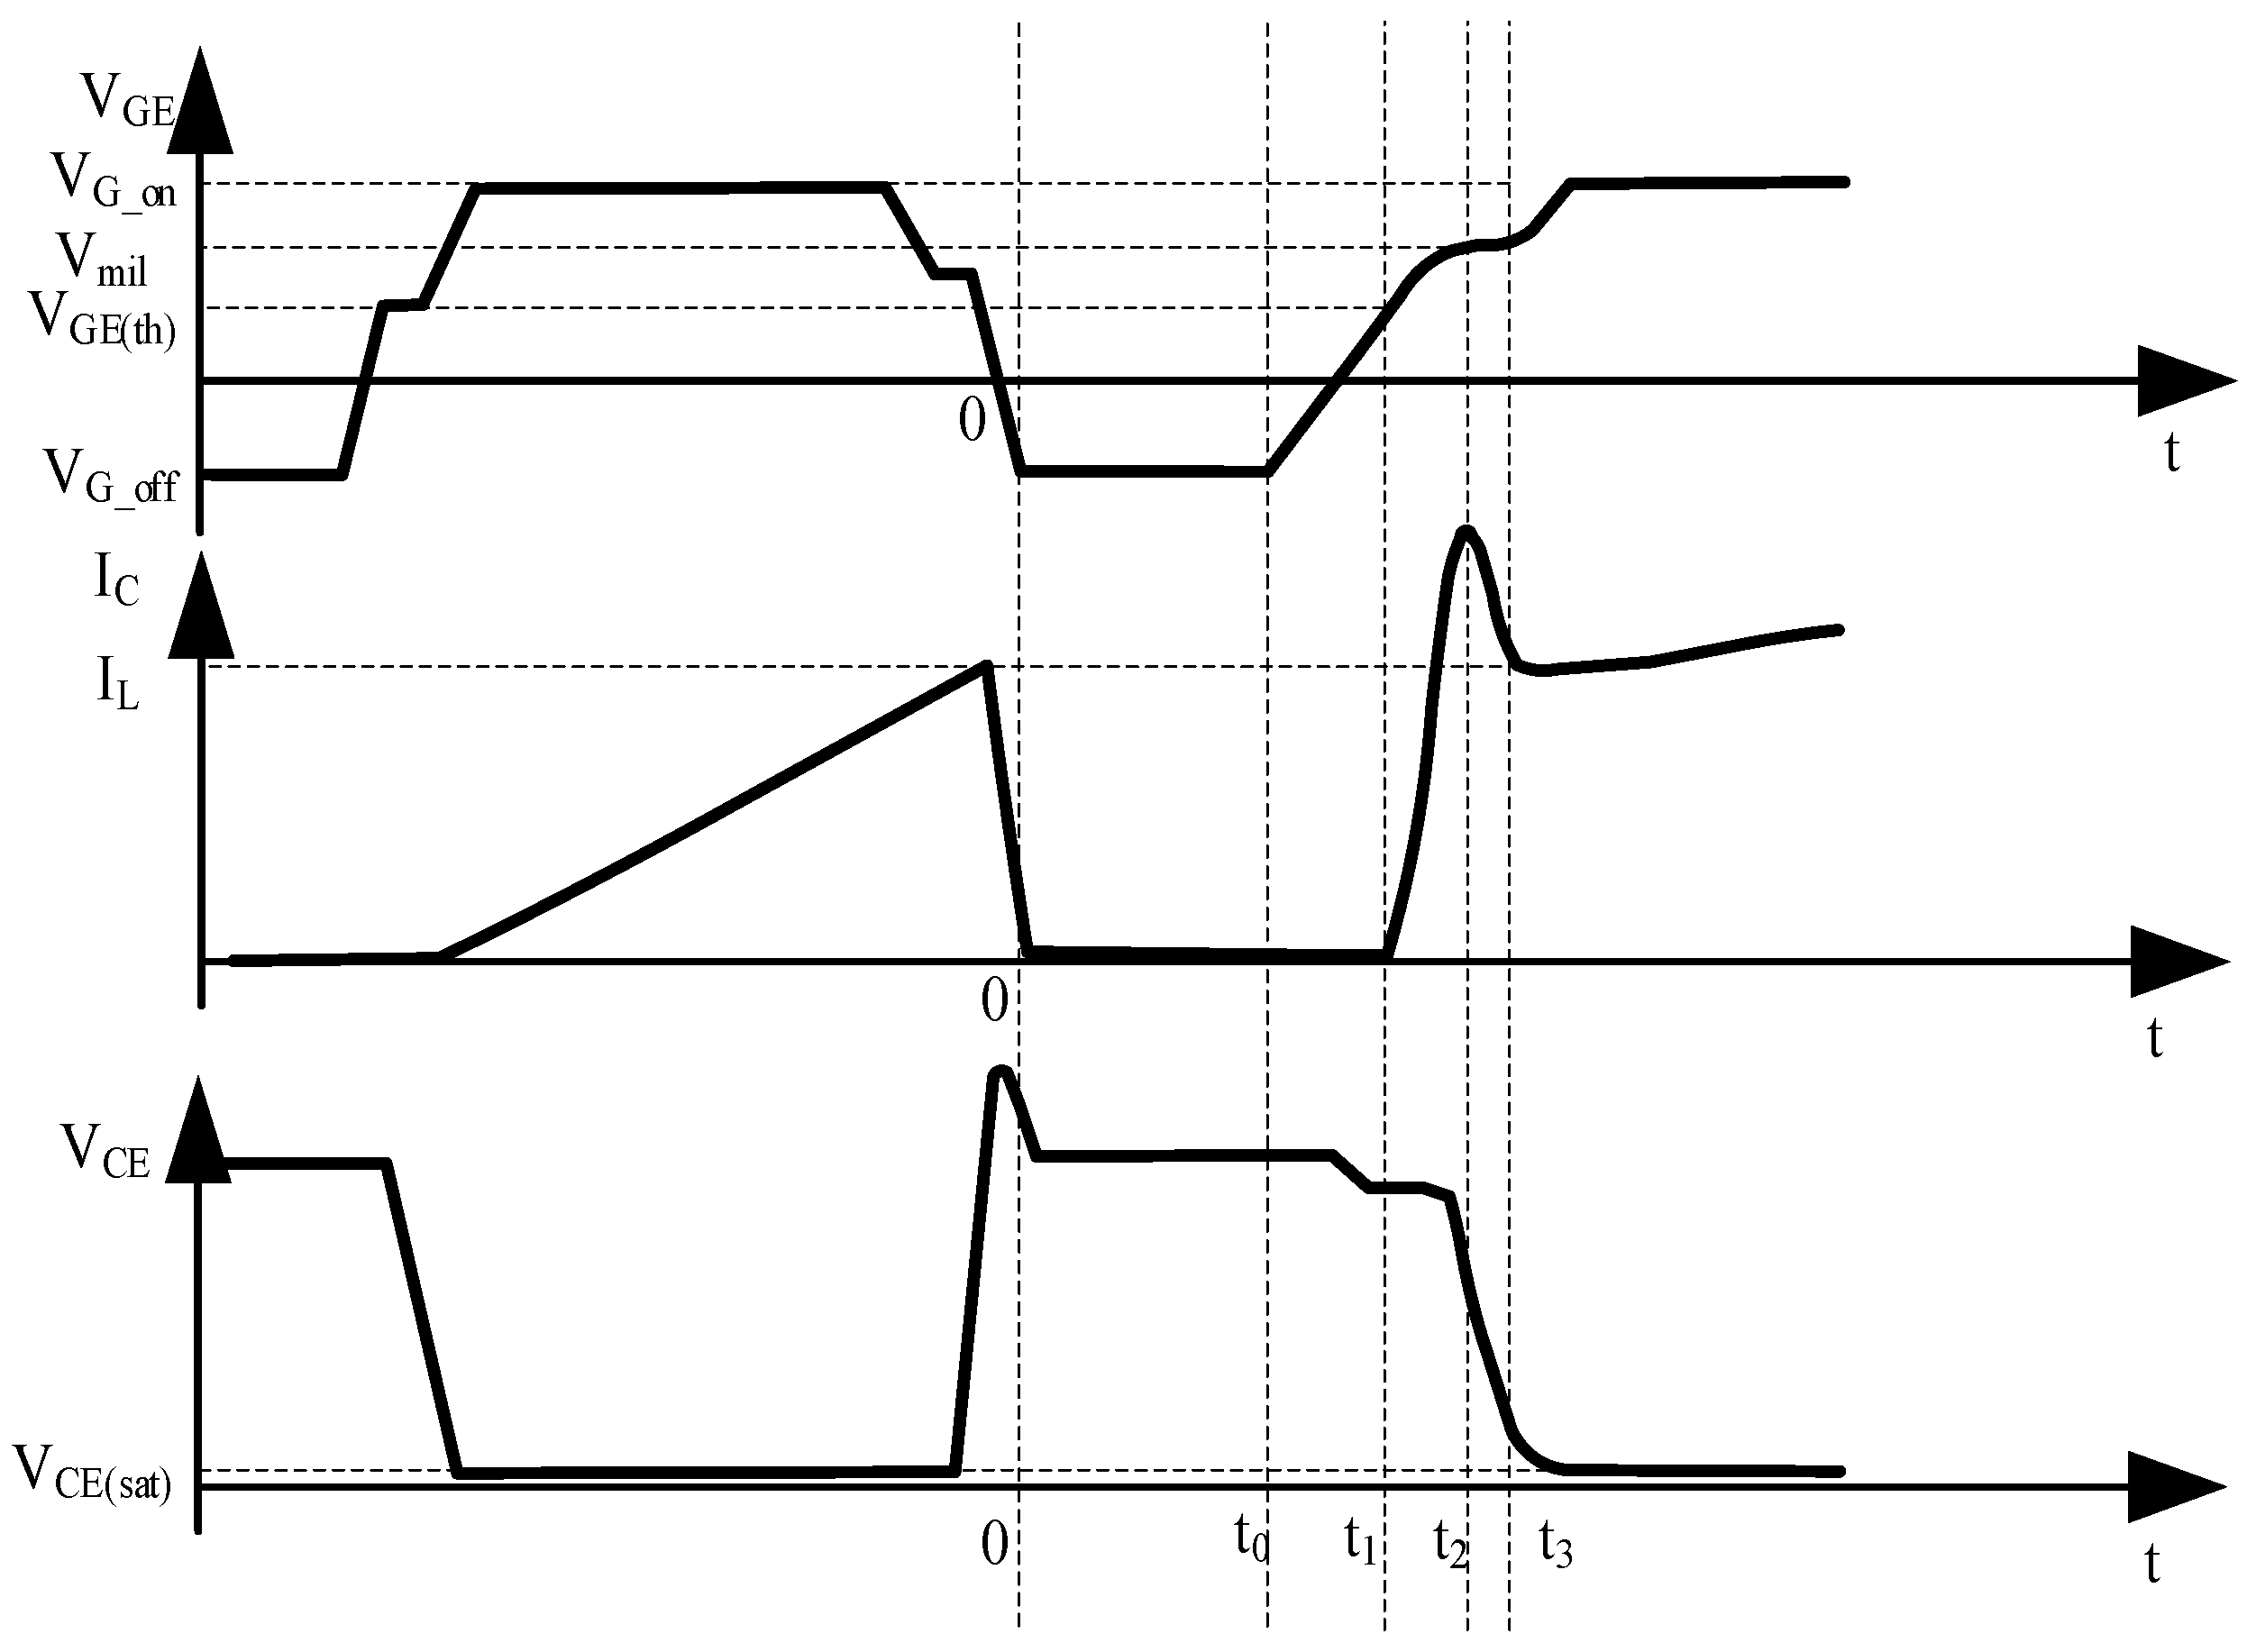
Taking the IGBT turn-on process as an example, the dynamic parameters are extracted from the voltage and current waveforms. As shown in Figure 6, during the turn-on transient, the collector–emitter voltage VCE(t) and collector current IC(t) vary rapidly with time. The turn-on energy Eon is defined as the integral of the instantaneous power VCE(t)⋅IC(t) over the turn-on interval, i.e.,
where ti and tf denote the start and end instants of the turn-on process, respectively.
Figure 6.
Calculation of turn-on parameters.
Meanwhile, the current slew rate di/dt is taken as the slope of the linear rising segment of IC(t), whereas the voltage slew rate dv/dt is taken as the slope of the linear falling segment of VCE(t). The extraction of the turn-off energy Eoff and related parameters is similar to that of the turn-on process and is therefore not repeated here.
2.3.2. Static Parameter Testing
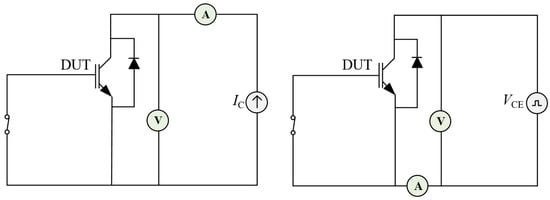
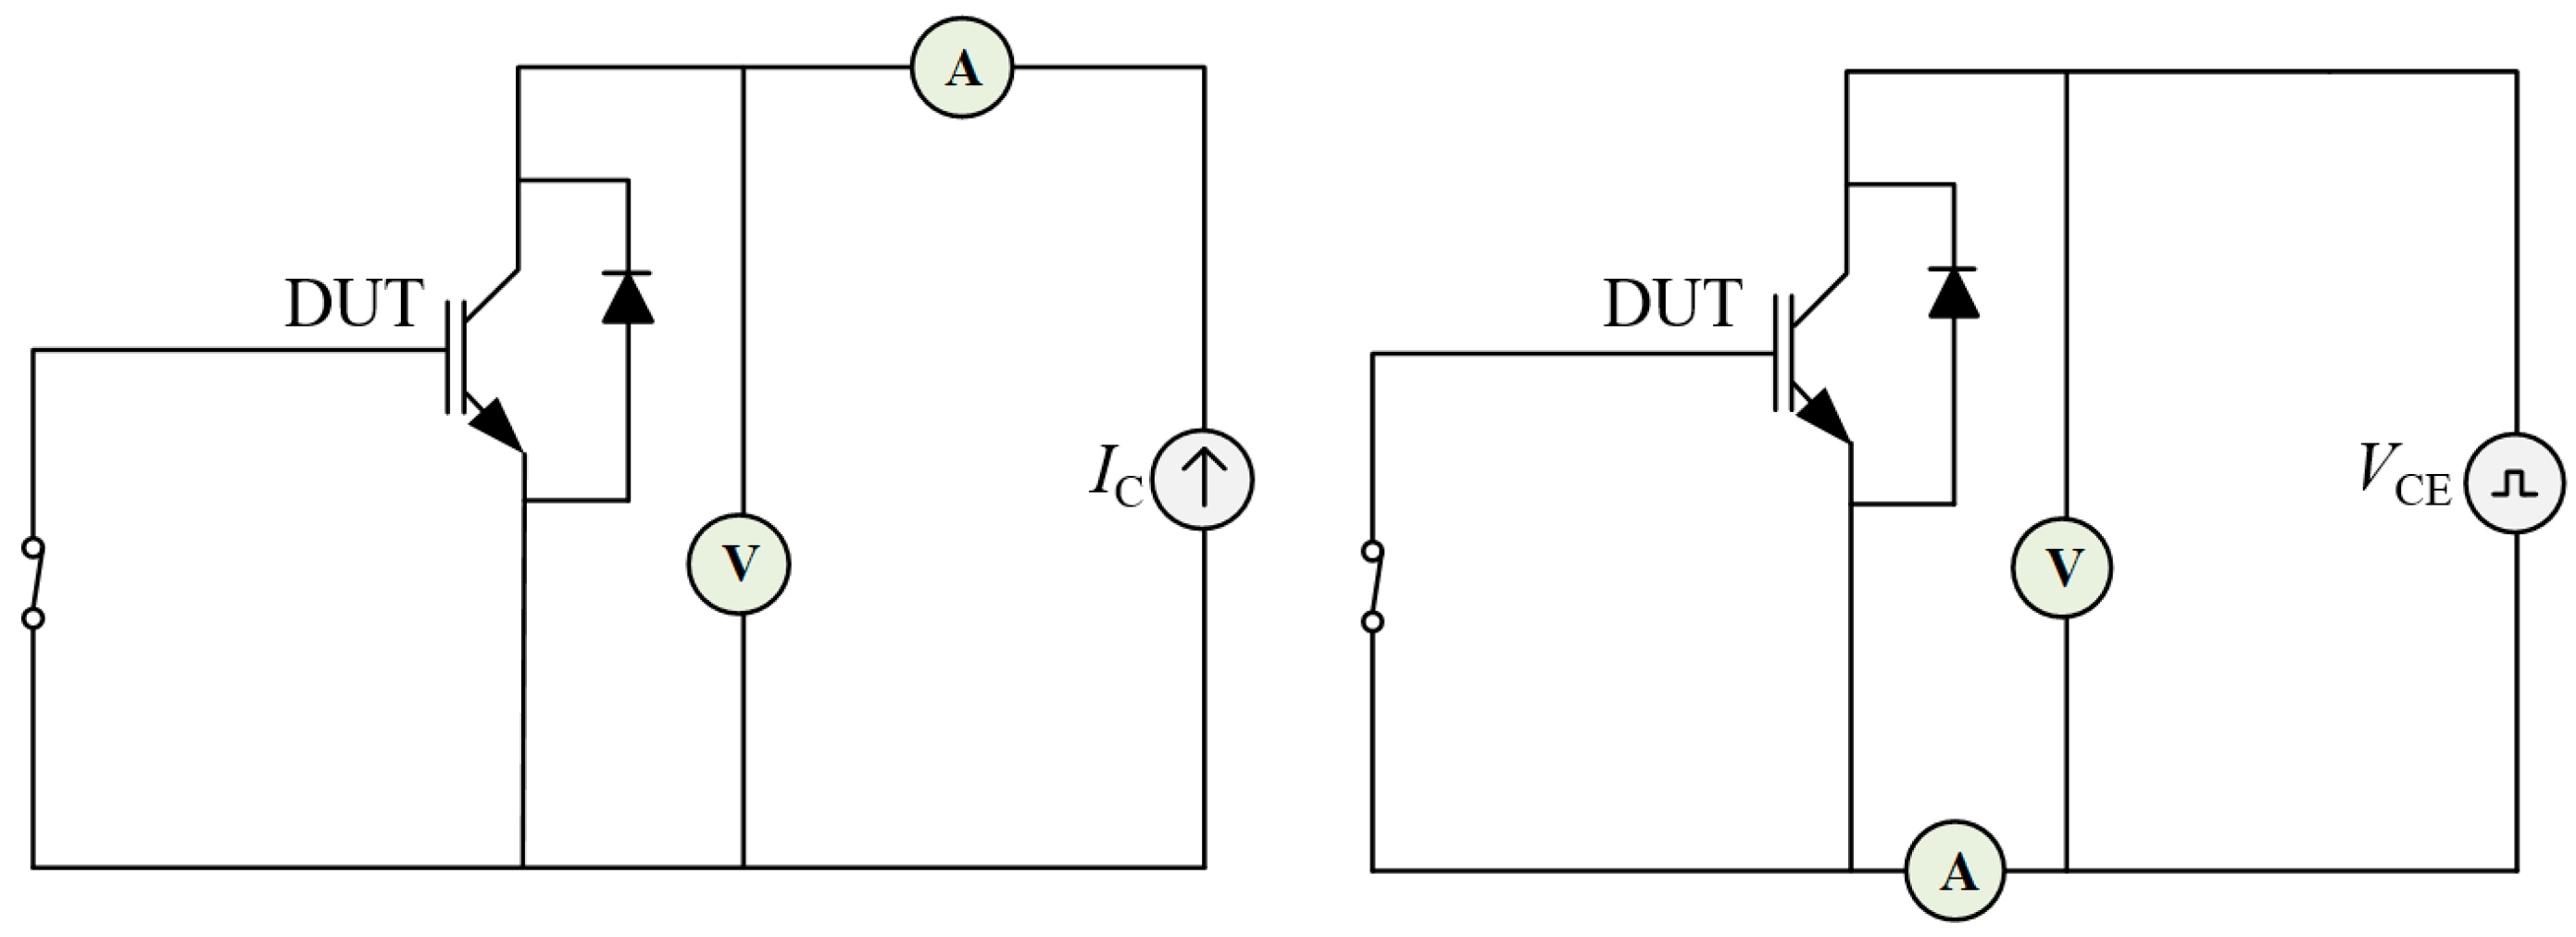
In this study, VCES and ICES were measured using the DC method. As shown in Figure 7, during the test, the gate and emitter are short-circuited, while a specified DC excitation is applied between the collector and emitter, and the corresponding voltage value is recorded as VCES. The test circuits for ICES and VCES are basically similar. A specified DC voltage is applied between the collector and emitter, and the collector current measured under this condition is defined as ICES.
Figure 7.
Testing of VCES and ICES.
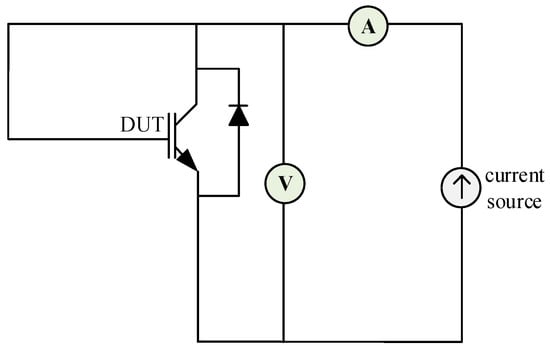
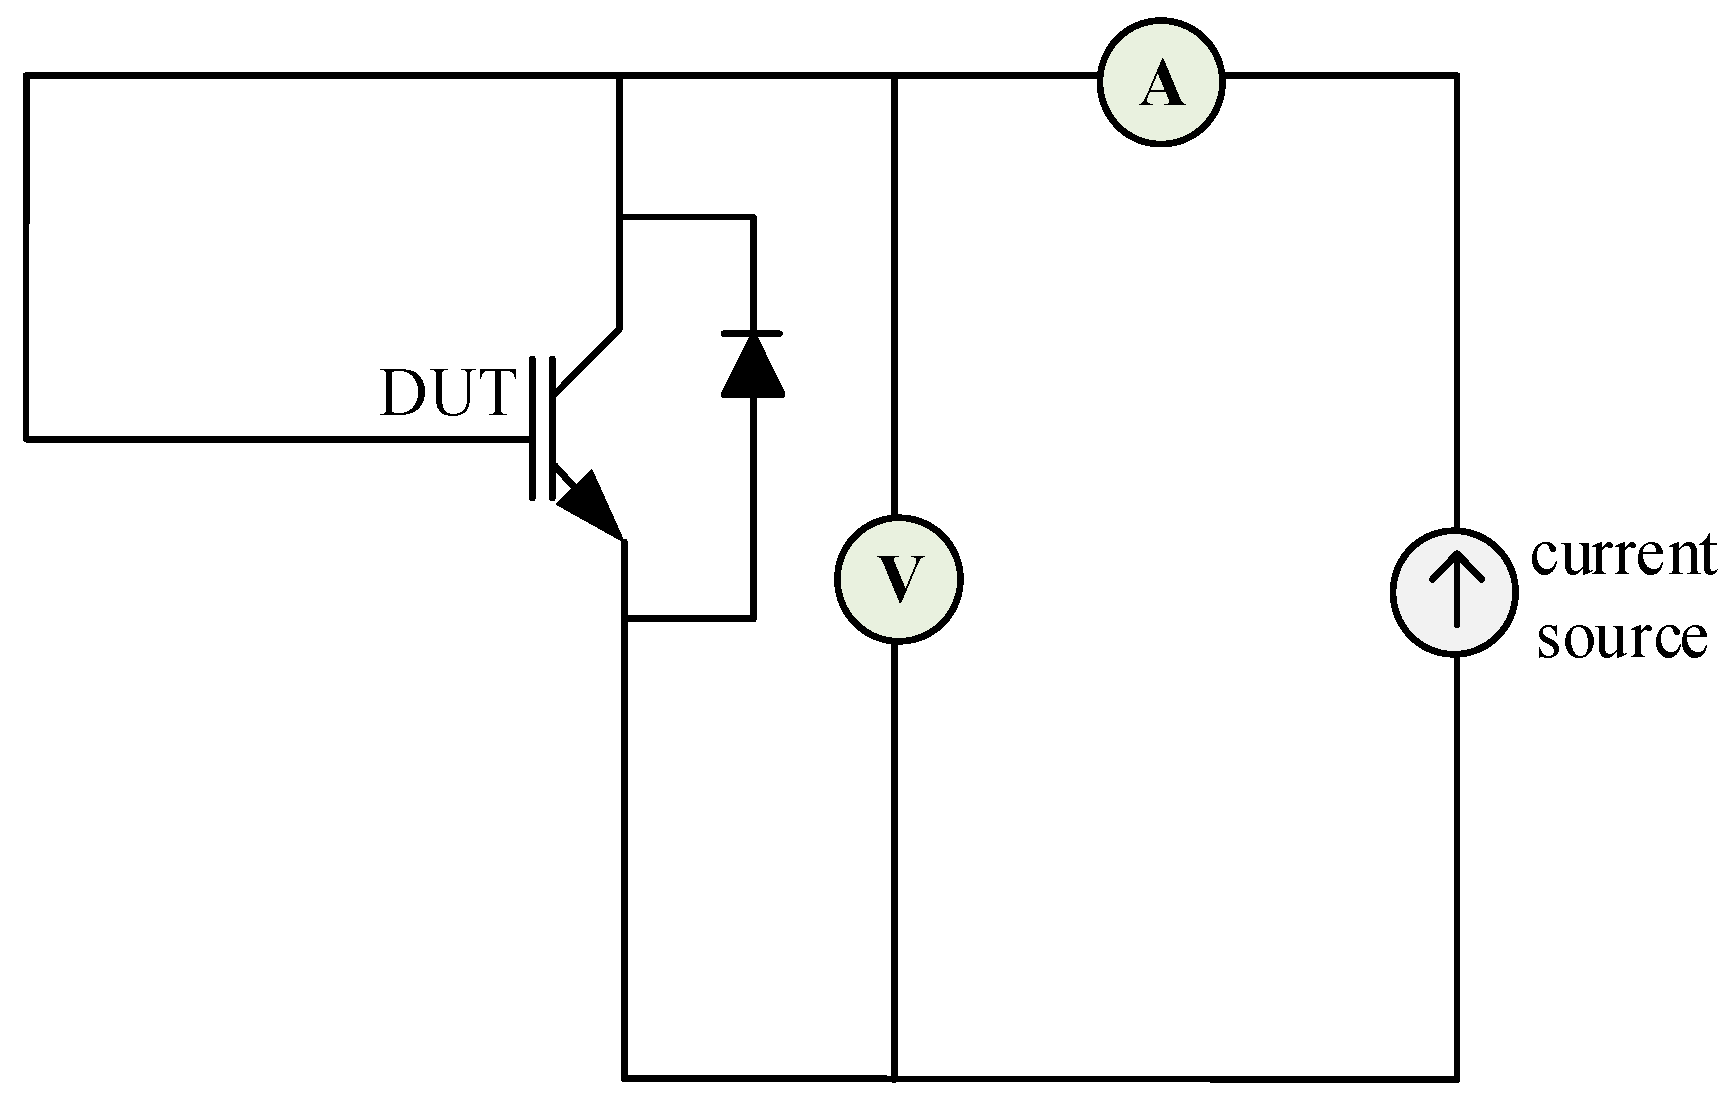
The measurement method for VGEth is shown in Figure 8. During the test, the collector and gate of the IGBT are short-circuited, and a constant current source is applied between the collector and emitter. As the test current is gradually increased, the gate–emitter voltage corresponding to the moment when the collector current reaches the value specified in the datasheet is defined as the threshold voltage VGEth.
Figure 8.
Testing of VGEth.
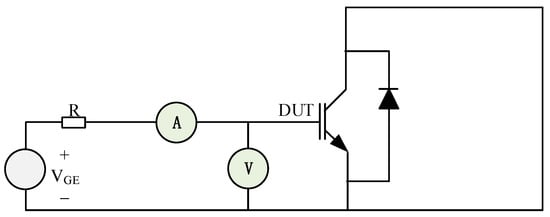
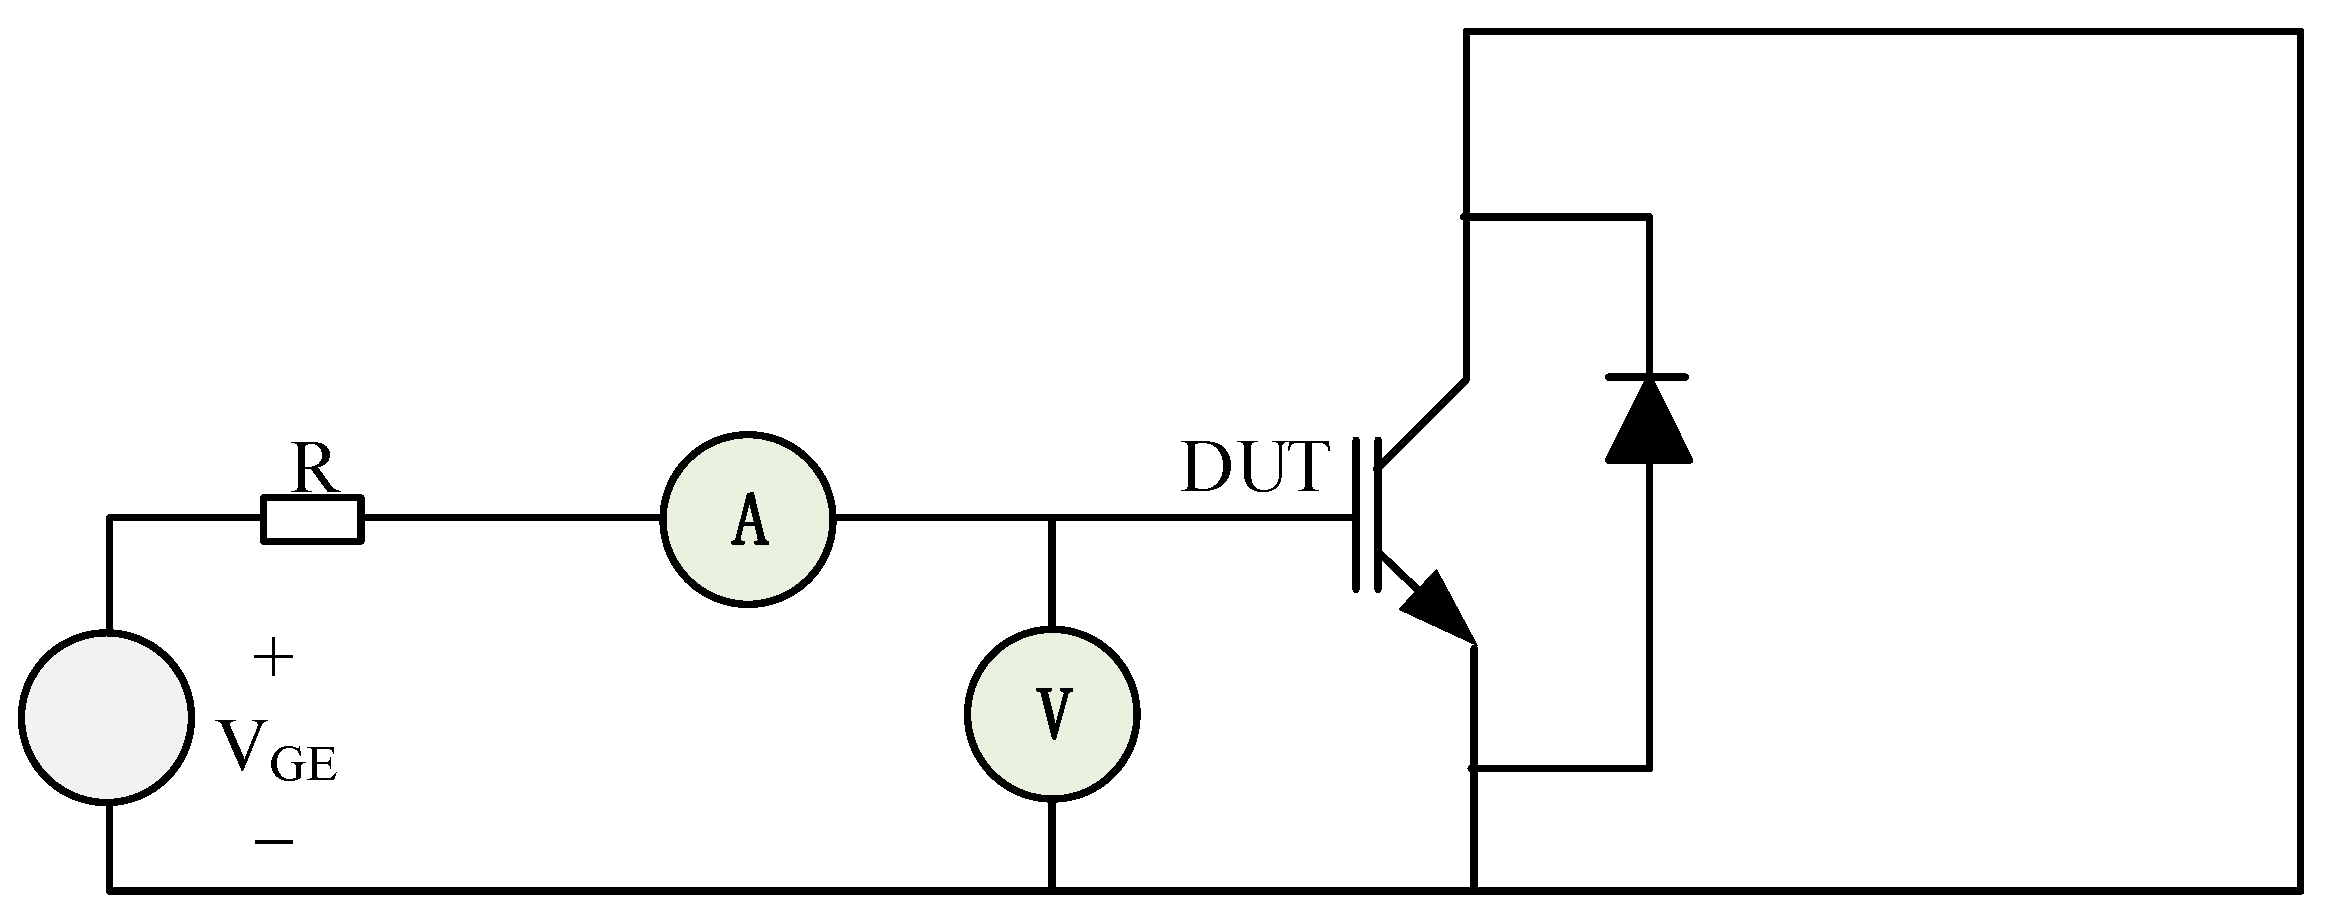
The measurement principle of IGES is shown in Figure 9. During the test, the collector and emitter are short-circuited to eliminate the influence of the collector–emitter circuit voltage on the measurement result. A specified DC voltage is then applied between the gate and emitter by a voltage source. The current in the gate circuit is measured either by connecting a high-impedance ammeter in series or indirectly by using a sampling resistor with a known resistance value. The current flowing through the gate–emitter circuit under this condition is recorded as the IGES of the device.
Figure 9.
Testing of IGES.
2.4. Test Conditions and Sample Description
The samples in this study were obtained using the developed dynamic–static parameter test platform for IGBT modules, which is capable of measuring both double-pulse dynamic parameters and static parameters under a unified test procedure. Since the DC-link voltage VCC, load current IL, gate-drive voltage VGG1, and gate resistances Rg_on and Rg_off in double-pulse testing significantly affect switching parameters such as Eon and di/dt, the double-pulse test conditions for the IGBT module type investigated in this study were determined according to the manufacturer’s datasheet and the corresponding production test specification. The tests were performed at room temperature (25 °C). The DC-link voltage VCC was set to 400 V, the gate-drive voltage VGG1 was set to −8 V/+15 V, the load current IL was set to 450 A, and the turn-on and turn-off gate resistances Rg_on and Rg_off were set to 2.4 Ω and 5.1 Ω, respectively. The load inductance was configured at the 20 μH setting. These test conditions were kept identical for all samples and for both the upper and lower bridge arms, ensuring the comparability of the dynamic parameters, including Eon, Eoff, dv/dt, and di/dt.
To reduce the influence of device self-heating and environmental fluctuations on the measurement results, all tests were conducted in a temperature- and humidity-controlled production workshop, with the ambient temperature maintained at 25 °C and the relative humidity maintained below 60%. The double-pulse tests were performed using short-duration excitation under a low-duty-cycle operating mode, and a cooling interval was set between successive measurements to limit heat accumulation in the device and fixture. The test platform was equipped with temperature monitoring and auxiliary cooling functions; when the monitored temperature exceeded the preset threshold, the cooling fan was automatically activated. In addition, the platform included a heating unit to support parameter testing under different temperature conditions. For the dataset analyzed in this study, however, all samples and both bridge arms were tested under the same room-temperature condition, test sequence, cooling interval, and temperature-control strategy. Therefore, the influence of self-heating was controlled under a unified thermal boundary condition, ensuring the comparability of both dynamic and static parameters between the upper and lower bridge arms [17].
The data analyzed in this study were derived from more than 400 sets of production-line measurements obtained from newly manufactured IGBT modules from the same batch. The use of same-batch samples was intended to minimize the influence of inter-batch variations in manufacturing process, material source, and packaging conditions, so that the observed parameter differences mainly reflected the matching state between the upper and lower bridge arms within each module. Each sample set contained production-test data for the corresponding parameters of both bridge arms, providing the data basis for subsequent CI calculation, bridge-arm difference analysis, within-batch quality evaluation, and production process troubleshooting.
Before data analysis, all production-line measurement records were checked for test validity. Records were excluded when the test process was abnormal, including fixture loading failure, poor contact or Kelvin connection failure, equipment alarm, interlock failure, overvoltage or overcurrent protection, communication interruption, incomplete data recording, waveform acquisition failure, abnormal trigger timing, waveform saturation or clipping, or deviation in the actual test conditions from the specified settings. If a valid result could not be obtained after repeated measurement under the prescribed production test procedure, the corresponding record was also excluded. After this validity screening, only complete paired records of the upper and lower bridge arms were used for subsequent analysis.
3. Multi-Parameter Evaluation of Bridge-Arm Consistency in IGBT Modules
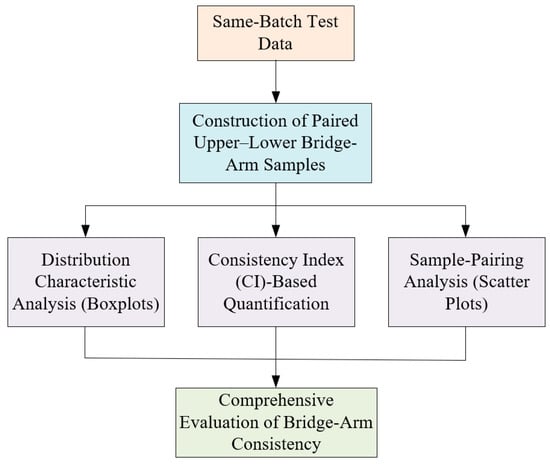
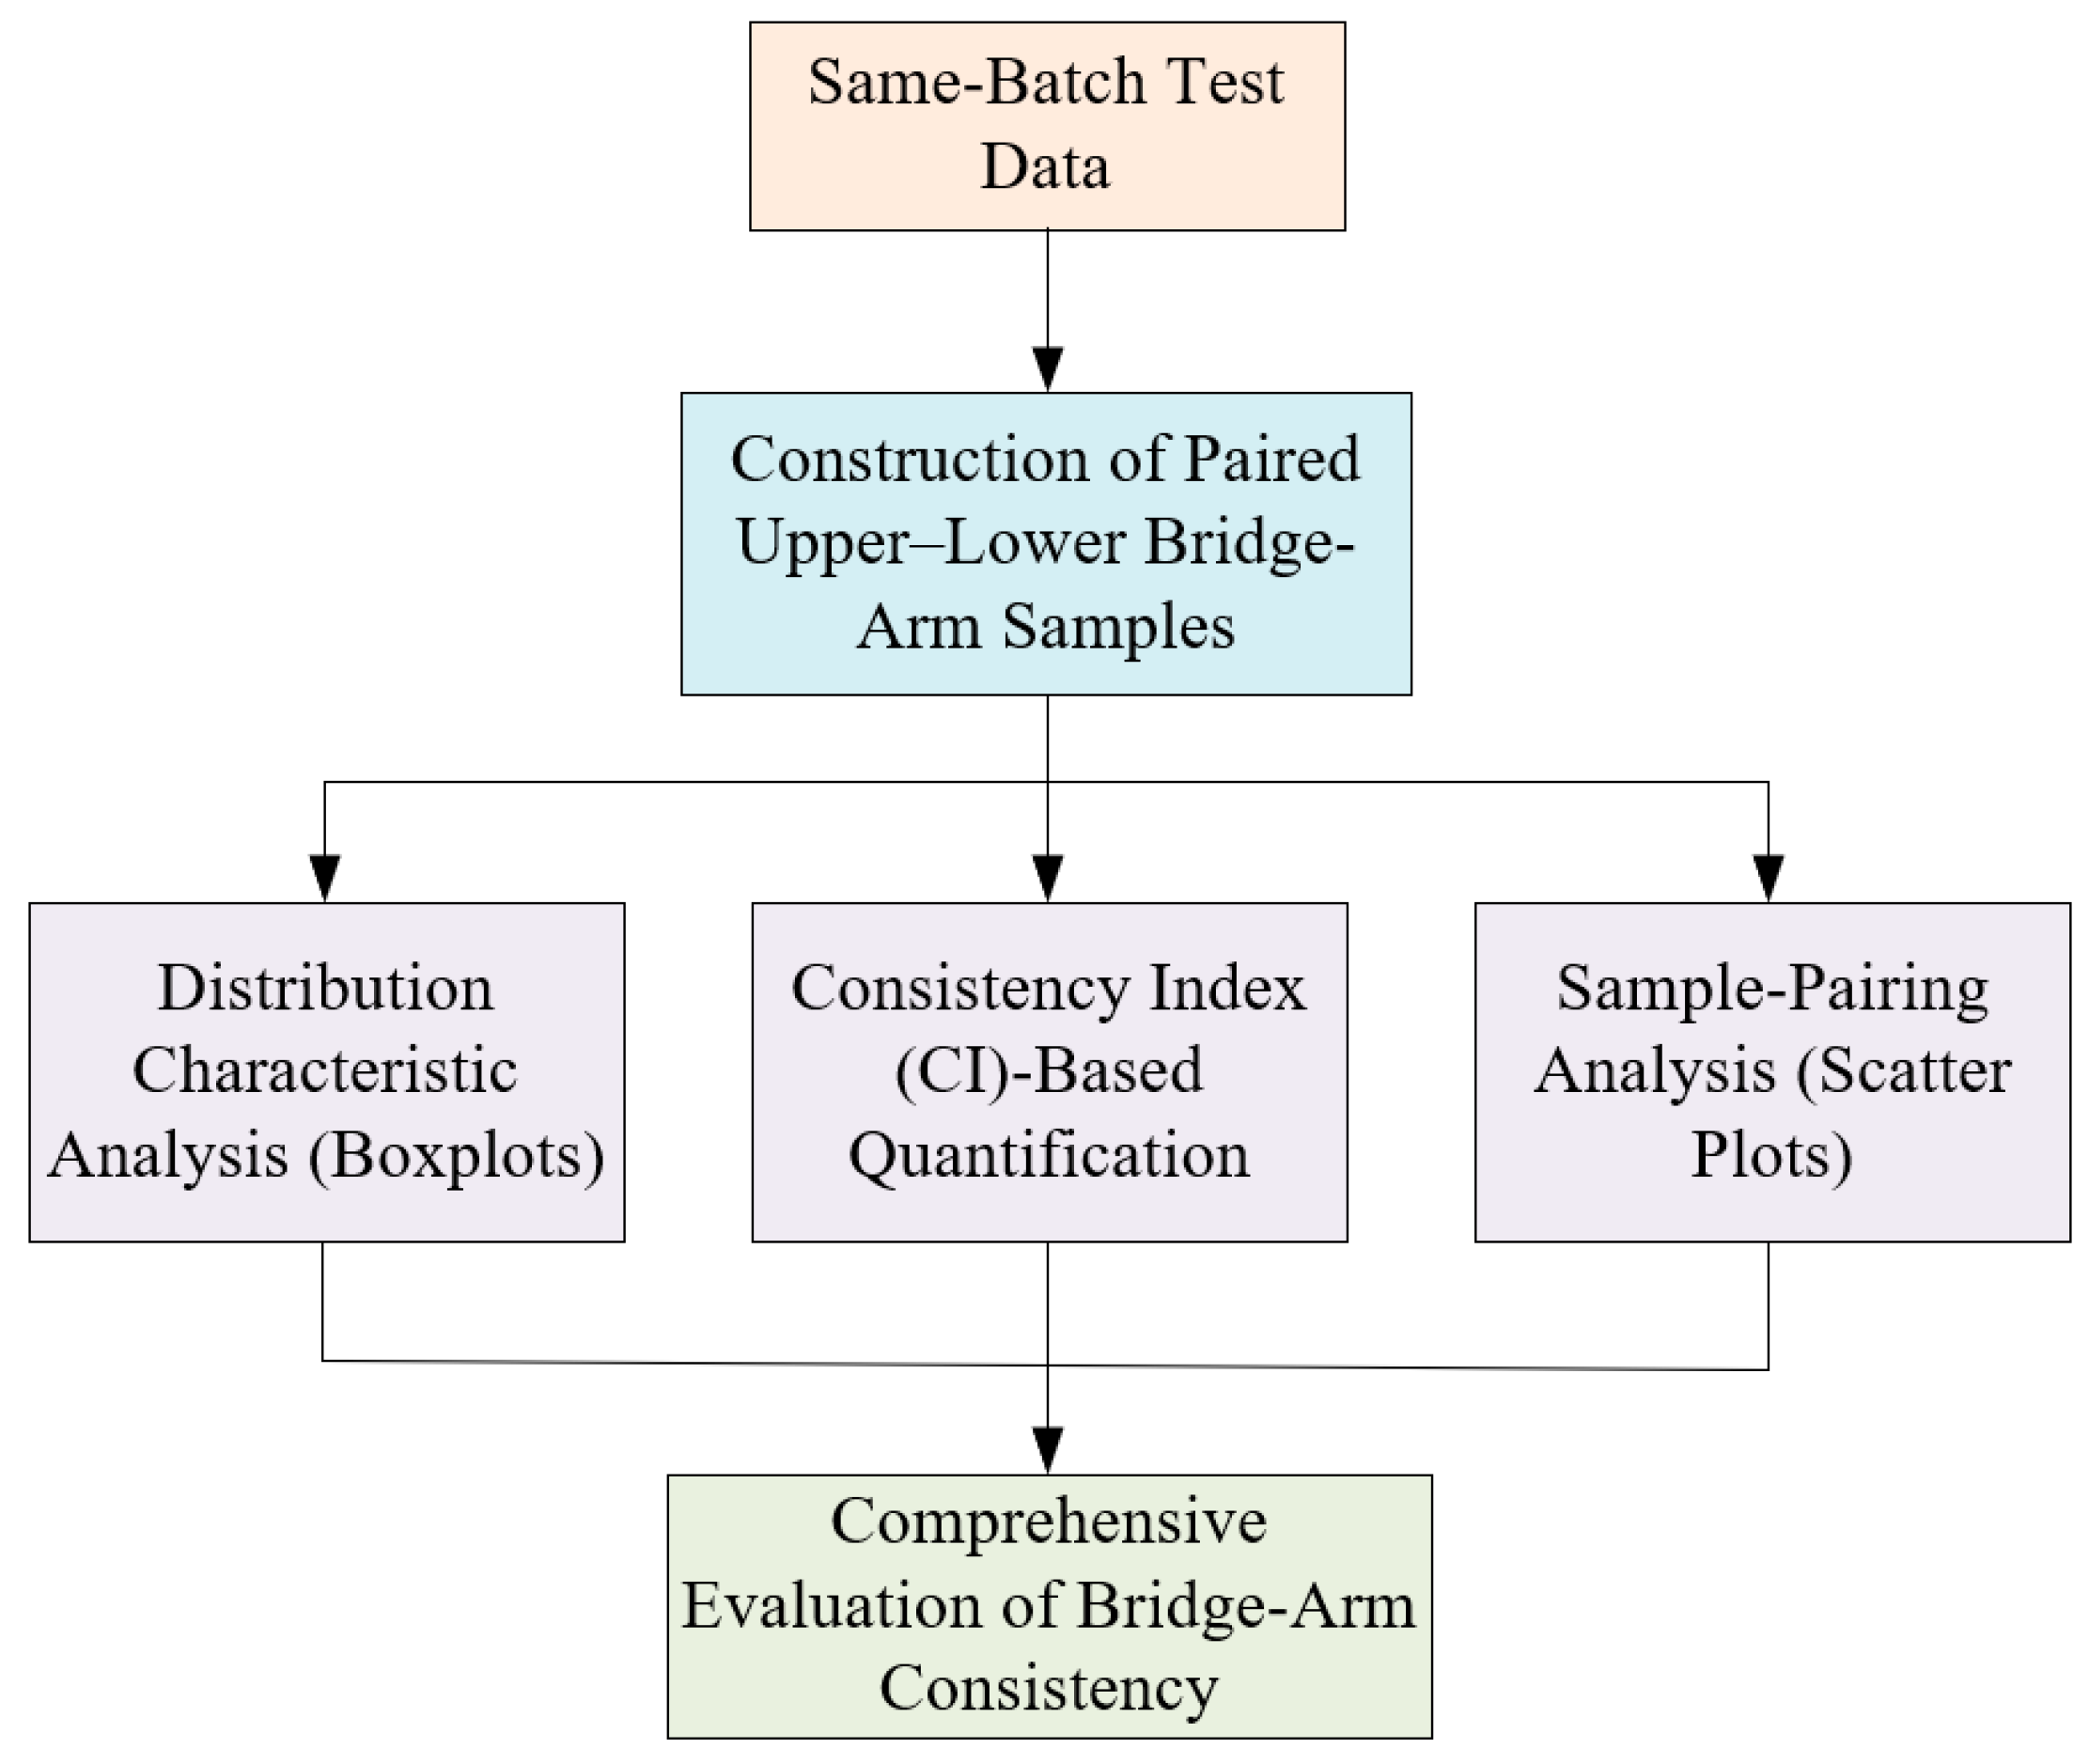
To overcome the limitations of a single analysis method, this study establishes a comprehensive consistency evaluation method for IGBT module bridge arms from three perspectives: distribution characteristics, discrepancy quantification, and sample pairing relationships. Specifically, parameter distribution analysis is used to characterize the overall distribution position, dispersion, and abnormal deviation features of the upper and lower bridge arms for different parameters; the consistency index (CI) is used to provide a dimensionless quantitative comparison of inter-arm differences; and sample-pairing analysis is used to reveal the one-to-one correspondence between the upper and lower bridge arms at the sample level and the forms of their deviations. These three methods correspond to distribution-level, quantification-level, and sample-level analyses, respectively. They progress hierarchically and complement one another, jointly forming a multi-parameter comprehensive evaluation framework for bridge-arm consistency. The framework is illustrated in Figure 10.
Figure 10.
Framework of the Multi-Parameter Evaluation Method for Bridge-Arm Consistency in IGBT Modules.
3.1. Construction of Paired Samples and Data Representation
The raw test data were organized according to the upper–lower bridge-arm structure within the same IGBT module. For each key parameter, the measured values of the upper and lower bridge arms were matched one-to-one using identical sample IDs and identical test conditions. A paired dataset was therefore constructed for bridge-arm consistency analysis. The measured values of a given parameter in the upper and lower bridge arms are denoted as xup and xlow, respectively.
For data representation, the mean, median, quartiles, and interquartile range (IQR) were calculated to describe the central tendency and dispersion of the raw parameters. Boxplots were used to visualize the distribution position, dispersion, and potential abnormal deviations in the upper and lower bridge arms. The interquartile range is defined as
where Q1 and Q3 denote the first and third quartiles of the sample, respectively. Potential abnormal samples were identified using the standard IQR-based criterion. A sample was classified as an outlier when its value was lower than or higher than . This method does not require a prior assumption regarding the sample distribution and is therefore suitable for robust preliminary screening of abnormal parameter values.
Through the above paired-sample construction and statistical representation, the raw test data were converted into a structured dataset suitable for subsequent distribution comparison, consistency-index calculation, and sample-level paired analysis.
3.2. Construction of the Consistency Index and Difference Quantification Method
On the basis of paired-sample construction and data representation, a unified consistency indicator was further established to achieve a quantitative evaluation of performance consistency between the upper and lower bridge arms of IGBT modules. This indicator should be capable of characterizing the degree of inter-arm difference across parameters with different physical dimensions and value ranges, while also exhibiting good dimensionless properties, comparability, and physical interpretability.
Assume that, under identical test conditions, the measured values of a given key parameter for the upper and lower bridge arms in the i-th sample are denoted by xup,ij and xlow,ij, respectively, where j represents the parameter index. If consistency is evaluated directly using the absolute difference , horizontal comparison across multiple parameters becomes difficult because different parameters differ substantially in physical units and numerical ranges. Therefore, the inter-arm difference must be normalized to eliminate the influence of scale effects on the evaluation results. On this basis, a symmetric normalization strategy was adopted in this study, in which the mean value of the upper- and lower-arm parameters was used as the scaling reference to convert their difference into a dimensionless form. Accordingly, the Consistency Index (CI) was defined as follows:
where CIij denotes the bridge-arm consistency index of the i-th sample for the j-th parameter. This indicator is essentially a symmetrically normalized form of relative difference. Compared with the conventional relative error defined with respect to one side as the reference, it avoids the bias introduced by inconsistent denominator selection and is therefore more physically reasonable for the symmetric upper–lower bridge-arm structure. It reflects the proportion of the relative deviation between the two bridge arms with respect to their average level. When , , indicating that this parameter is completely consistent between the upper and lower bridge arms. As the difference between the two increases, the CI value increases monotonically, indicating a gradual deterioration in consistency. Because this definition is both symmetric and dimensionless, it is suitable for consistency comparison across different physical parameters.
For convenient overall multi-parameter analysis, the CI values of all samples under different parameters were further organized into a consistency matrix:
where n is the number of sample groups and m is the number of key parameters. Each column of the matrix corresponds to the consistency distribution of one parameter, whereas each row represents the overall consistency state of the same sample group across multiple parameter dimensions.
By constructing the CI matrix, single-parameter difference evaluations that were originally independent are unified into a common data structure, enabling the consistency characteristics of different parameters to be compared and analyzed within a unified framework. On the one hand, the distribution characteristics of each column can be analyzed along the parameter dimension to obtain the consistency level and dispersion pattern of different parameters. On the other hand, the comprehensive characteristics of each row can be analyzed along the sample dimension to identify potential abnormal samples with poor bridge-arm matching.
Based on the CI distribution obtained from the production-line test data in this study, an empirical grading criterion is further introduced to improve the applicability of this index in production-line decision-making. When CI ≤ 0.01, the parameter difference between the upper and lower bridge arms is considered small, indicating good consistency. When 0.01 < CI ≤ 0.05, a certain degree of bridge-arm mismatch is considered to exist, and the corresponding sample or parameter should be monitored in within-batch quality control. When CI > 0.05, the corresponding parameter shows a relatively significant deviation between the upper and lower bridge arms, and the sample is recommended for rechecking or process traceability analysis. It should be noted that the above thresholds are empirically derived from the production-line test data in this study and are mainly intended for within-batch screening and quality warning under similar test conditions, rather than as universal criteria applicable to all IGBT module types and operating conditions.
3.3. Distribution-Based Analysis Method for Bridge-Arm Consistency
Based on the construction of paired samples and the representation of raw data, a boxplot-based distribution analysis method was further introduced to evaluate the consistency level between the upper and lower bridge arms of IGBT modules from the perspective of distribution characteristics. Using the raw measurement data as the basis, this method combines statistical description with graphical representation to comprehensively assess the distribution position, dispersion, and abnormal deviations in different parameters between the two bridge arms, thereby enabling distribution-level analysis of bridge-arm consistency.
For each key parameter, the median, quartiles, and overall value range were calculated separately for the upper- and lower-arm samples, and the corresponding boxplots were constructed for visualization. Here, the median reflects the central tendency of the parameter, the box range (i.e., the interquartile interval) characterizes data dispersion, and the whiskers describe the overall spread of the data, while samples beyond the whisker range are identified as potential outliers. By comparing the boxplots of the upper and lower bridge arms, the consistency characteristics can be evaluated from multiple aspects: when the medians are close and the boxes largely overlap, the parameter is considered to exhibit good consistency between the two bridge arms; when the medians are clearly shifted or the boxes are separated, a systematic difference between the bridge arms is indicated; when there are substantial differences in box width or whisker length, this reflects differences in sample dispersion or fluctuation characteristics.
Compared with CI-based quantification, parameter distribution analysis can directly reflect the characteristics of the raw data without introducing additional transformation, offering the advantages of strong intuitiveness and complete information retention. It is therefore suitable for the preliminary assessment of bridge-arm consistency. However, this method mainly focuses on the comparison of distribution shape and relative position, and it is difficult to achieve unified quantification of the discrepancy levels across different parameters. Therefore, it is necessary to combine it with consistency-index analysis to further characterize bridge-arm differences.
3.4. Sample-Pairing Analysis Method for Bridge-Arm Consistency
On the basis of distribution-based statistical analysis, the consistency characteristics of the upper and lower bridge arms of IGBT modules were further examined from the perspective of sample pairing. Compared with overall distribution analysis, pairing analysis preserves the correspondence between the upper and lower bridge arms within the same sample, thereby providing a more intuitive reflection of the degree and pattern of bridge-arm mismatch.
Let the measured values of the upper- and lower-arm parameters for the i-th sample under the j-th parameter be denoted by xup,ij and xlow,ij, respectively. All samples can then be represented as the point set (xup,ij, xlow,ij), and a paired scatter plot of the upper and lower bridge arms can be constructed using y = x as the reference line for ideal consistency. When the scatter points are mainly distributed near the reference line, the parameter is considered to exhibit high consistency between the two bridge arms; in contrast, a pronounced deviation from the reference line indicates a relatively large parameter mismatch.
Paired scatter plots can reveal not only the magnitude of the discrepancy, but also its form. If the sample points are evenly distributed on both sides of the reference line, the deviation mainly reflects random fluctuations. If the scatter points are overall biased toward one side of the reference line, this indicates that one bridge arm is systematically higher or lower than the other. If a small number of samples are far removed from the main distribution region, they may correspond to local mismatches or abnormal samples. Therefore, paired consistency analysis and CI-based analysis are complementary: the former preserves the sample-wise correspondence of the raw parameters, whereas the latter provides a dimensionless measure of discrepancy. Their combination enables the consistency characteristics of the upper and lower bridge arms of IGBT modules to be characterized jointly from the sample-pairing and overall statistical perspectives.
In summary, based on paired-sample construction, this study established a multi-parameter evaluation framework for bridge-arm consistency analysis in IGBT modules. The framework consists of three components: parameter distribution analysis, CI-based discrepancy quantification, and sample-pairing relationship analysis. Specifically, boxplot-based parameter distribution analysis is used to characterize the overall distribution features and dispersion of the upper and lower bridge arms from the raw-data perspective; the Consistency Index (CI) is used to achieve dimensionless quantitative comparison of bridge-arm discrepancies across different parameters; and paired-scatter-based sample-level analysis is used to reveal the one-to-one correspondence between the upper and lower bridge arms and the patterns of deviation. These three methods correspond to distribution-level, quantification-level, and sample-level analyses, respectively. They complement one another and together enable a comprehensive characterization of bridge-arm consistency within a unified framework. This framework provides the methodological basis for subsequent bridge-arm discrepancy analysis, parameter screening, and abnormal sample identification, and supports the experimental results and analysis presented in Section 4.
4. Experimental Results and Analysis
Based on the comprehensive evaluation method for bridge-arm consistency of IGBT modules established in Chapter 3, the experimental results are analyzed from three aspects: distribution characteristics, discrepancy quantification, and sample-pairing relationships. Specifically, the distribution of the raw parameters is used to characterize the overall difference patterns between the upper and lower bridge arms under different parameters; the CI metric is used to enable a unified quantitative comparison of bridge-arm discrepancies across different parameters; and paired scatter analysis is used to further reveal the sample-level pairing relationships between the bridge arms and their deviation patterns. These three analytical approaches progress hierarchically from overall distribution to quantitative metrics and then to sample-level relationships, jointly supporting a comprehensive evaluation of the bridge-arm consistency characteristics of IGBT modules.
4.1. Analysis of Parameter Distribution Characteristics
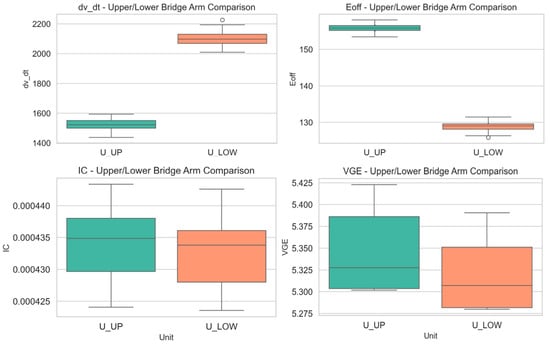
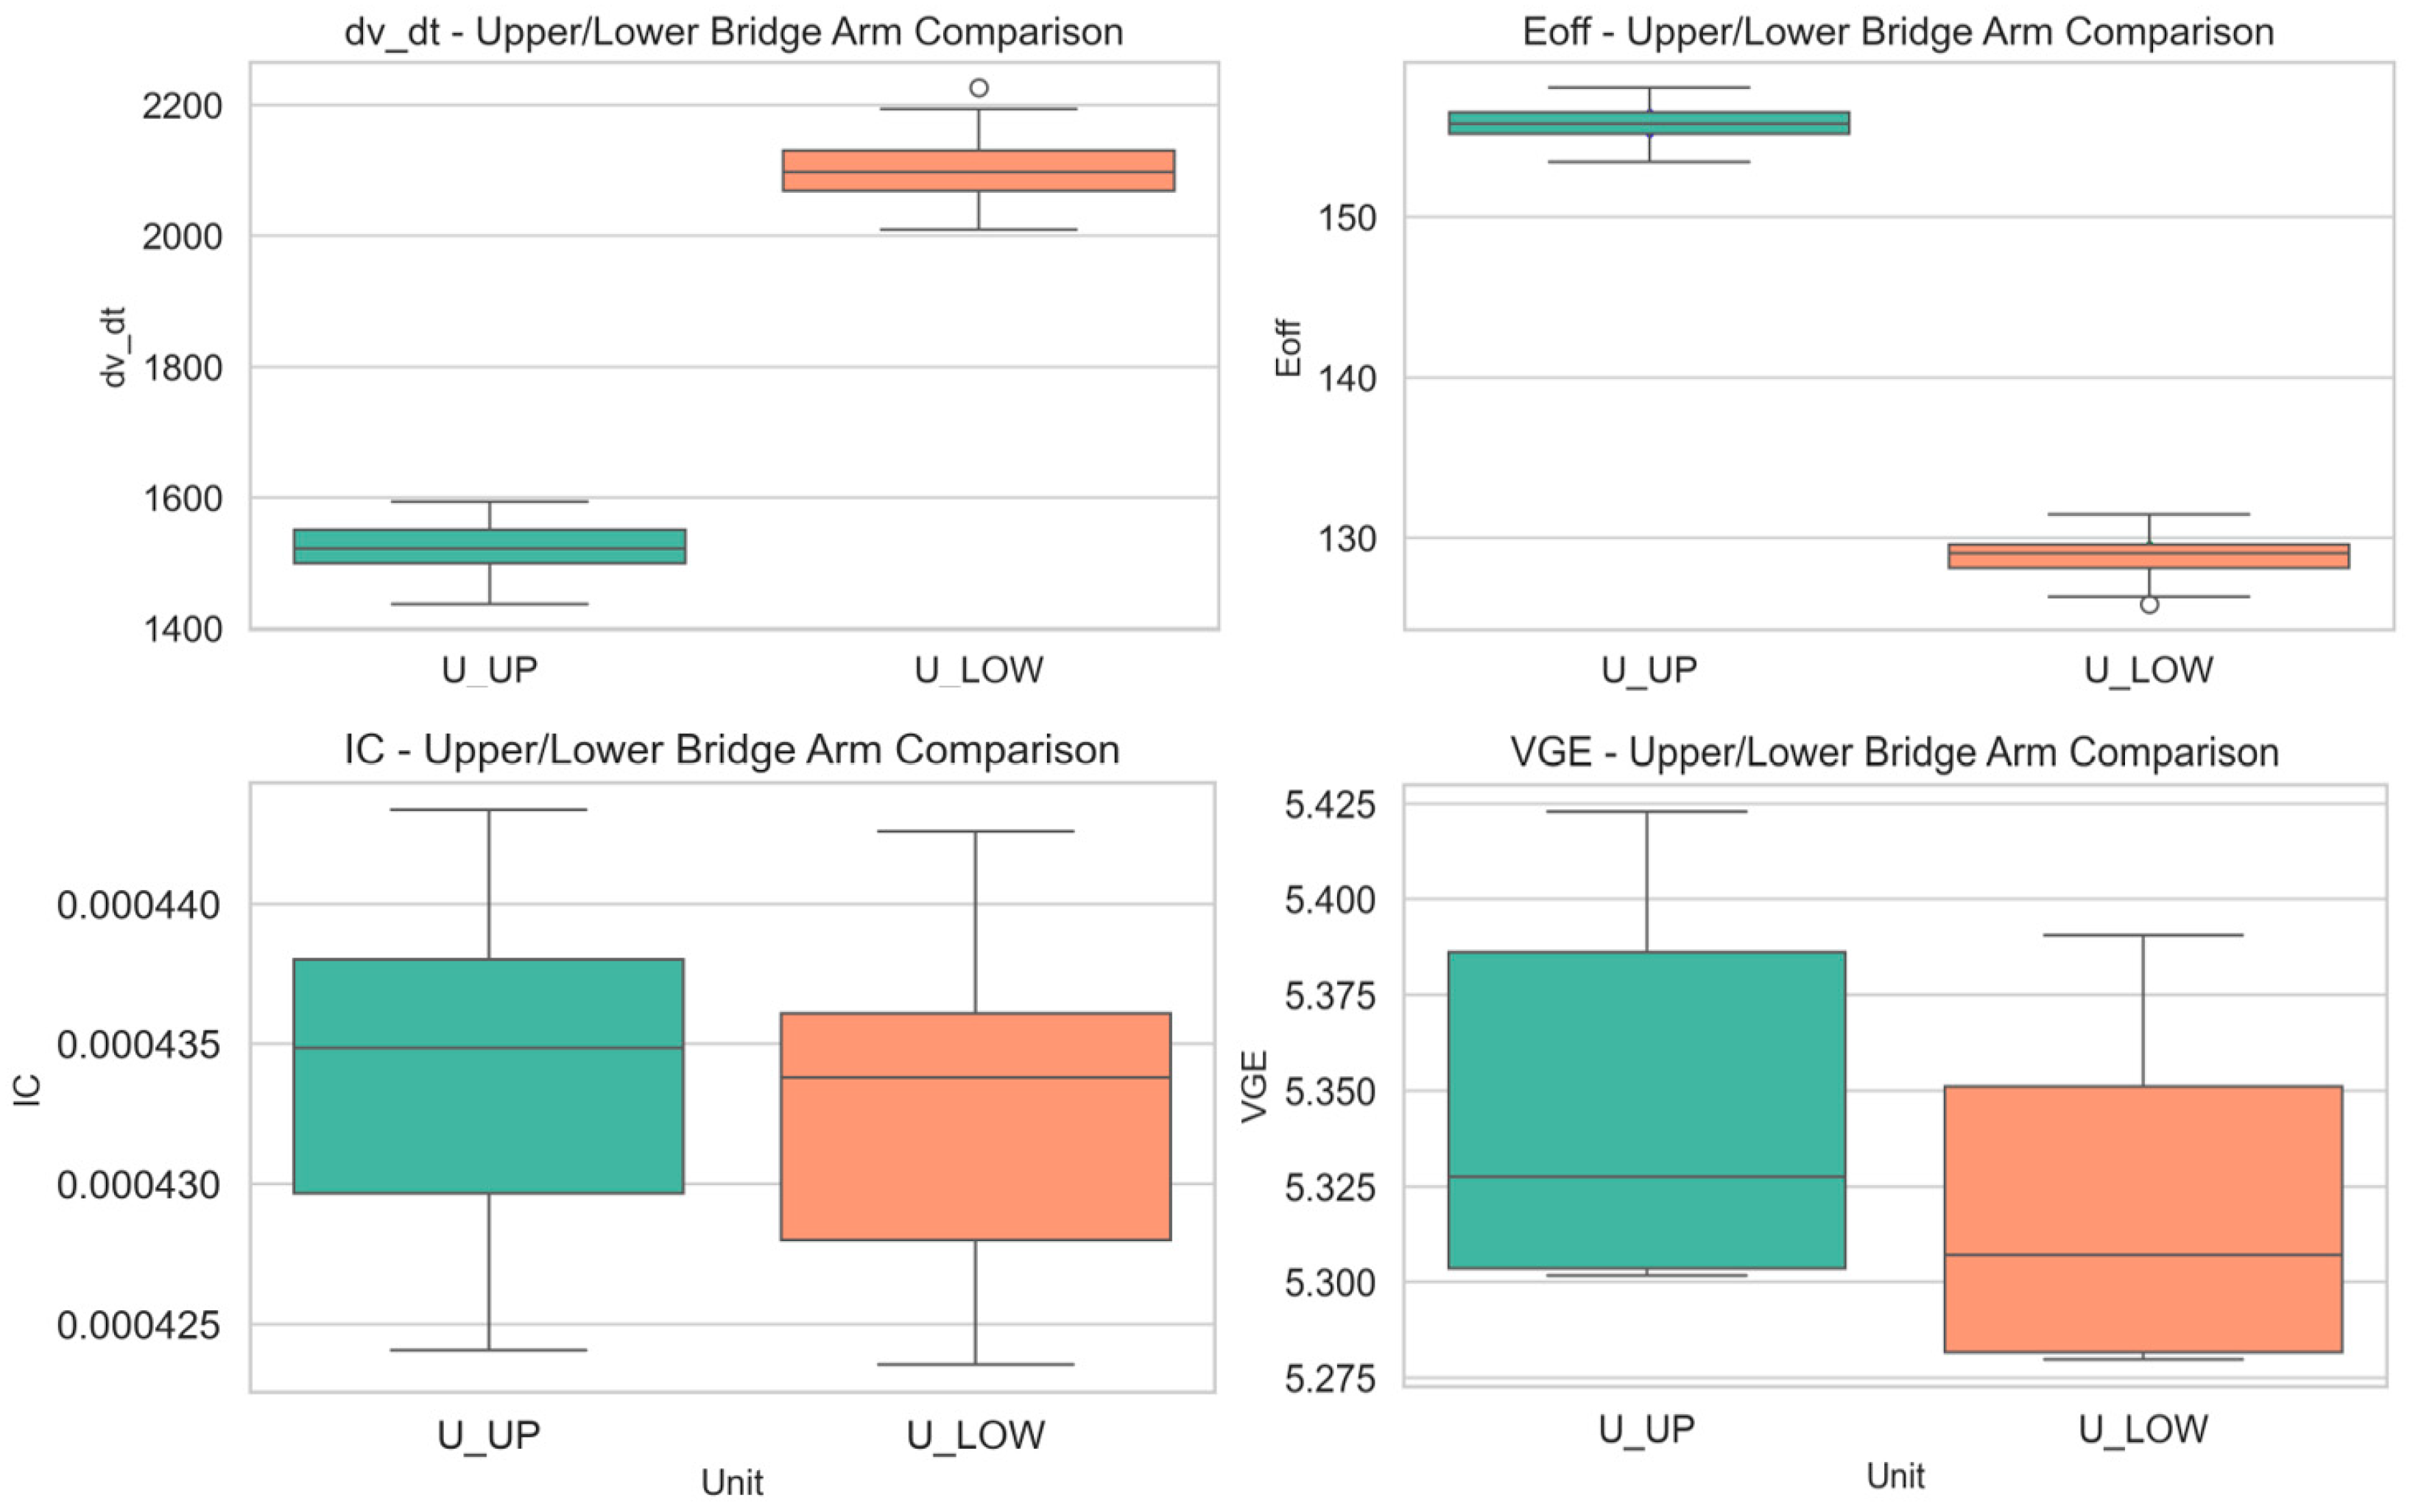
First, the consistency between the upper and lower bridge arms was preliminarily analyzed from the perspective of parameter distribution. Statistical comparisons were conducted for the distribution characteristics of all eight key parameters in the upper and lower bridge arms. To avoid repetitive presentation by discussing each parameter individually, four representative parameters, namely dv/dt, Eoff, ICES, and VGEth, were further selected as typical examples, and their boxplots for the upper and lower bridge arms were combined in Figure 11.
Figure 11.
Boxplots of dv/dt, Eoff, ICES, and VGEth.
As shown in Figure 11, different parameters exhibit different degrees of distributional difference between the upper and lower bridge arms. From the distributions of dv/dt and Eoff, it can be observed that both parameters show relatively pronounced separation between the two bridge arms. For dv/dt, the overall distribution of the lower bridge arm is significantly higher than that of the upper bridge arm, and the two box regions show almost no overlap, indicating a clear systematic deviation between the bridge arms for this parameter. For Eoff, the overall distribution of the upper bridge arm is higher than that of the lower bridge arm, and the overlap between the two boxes is likewise limited, indicating a stable offset in turn-off energy between the bridge arms. These results suggest that, under the sample set and test conditions considered in this study, dynamic parameters and switching-energy-related parameters are more likely to exhibit bridge-arm differences.
In contrast, the boxplots of ICES and VGEth for the upper and lower bridge arms show a relatively high degree of overlap, and their overall distributions are more similar. In particular, the differences in the median and interquartile range of ICES between the two bridge arms are small, indicating good consistency for this parameter. Although VGEth shows a slight shift, the two distributions still maintain a large overlap interval, suggesting that the bridge-arm difference is relatively limited. Compared with the previous group of parameters, these two static parameters exhibit better bridge-arm matching at the distribution level.
Overall, different parameters show distinct distribution characteristics between the upper and lower bridge arms: dv/dt and Eoff exhibit relatively pronounced bridge-arm separation, whereas ICES and VGEth show greater overlap and thus relatively better consistency. These results indicate that bridge-arm consistency varies across different parameter dimensions, and that a unified quantitative evaluation of bridge-arm discrepancies across parameters still requires the introduction of a consistency index.
4.2. Multi-Parameter Consistency Evaluation Based on CI
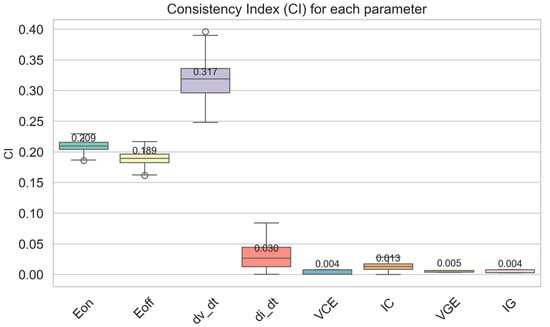
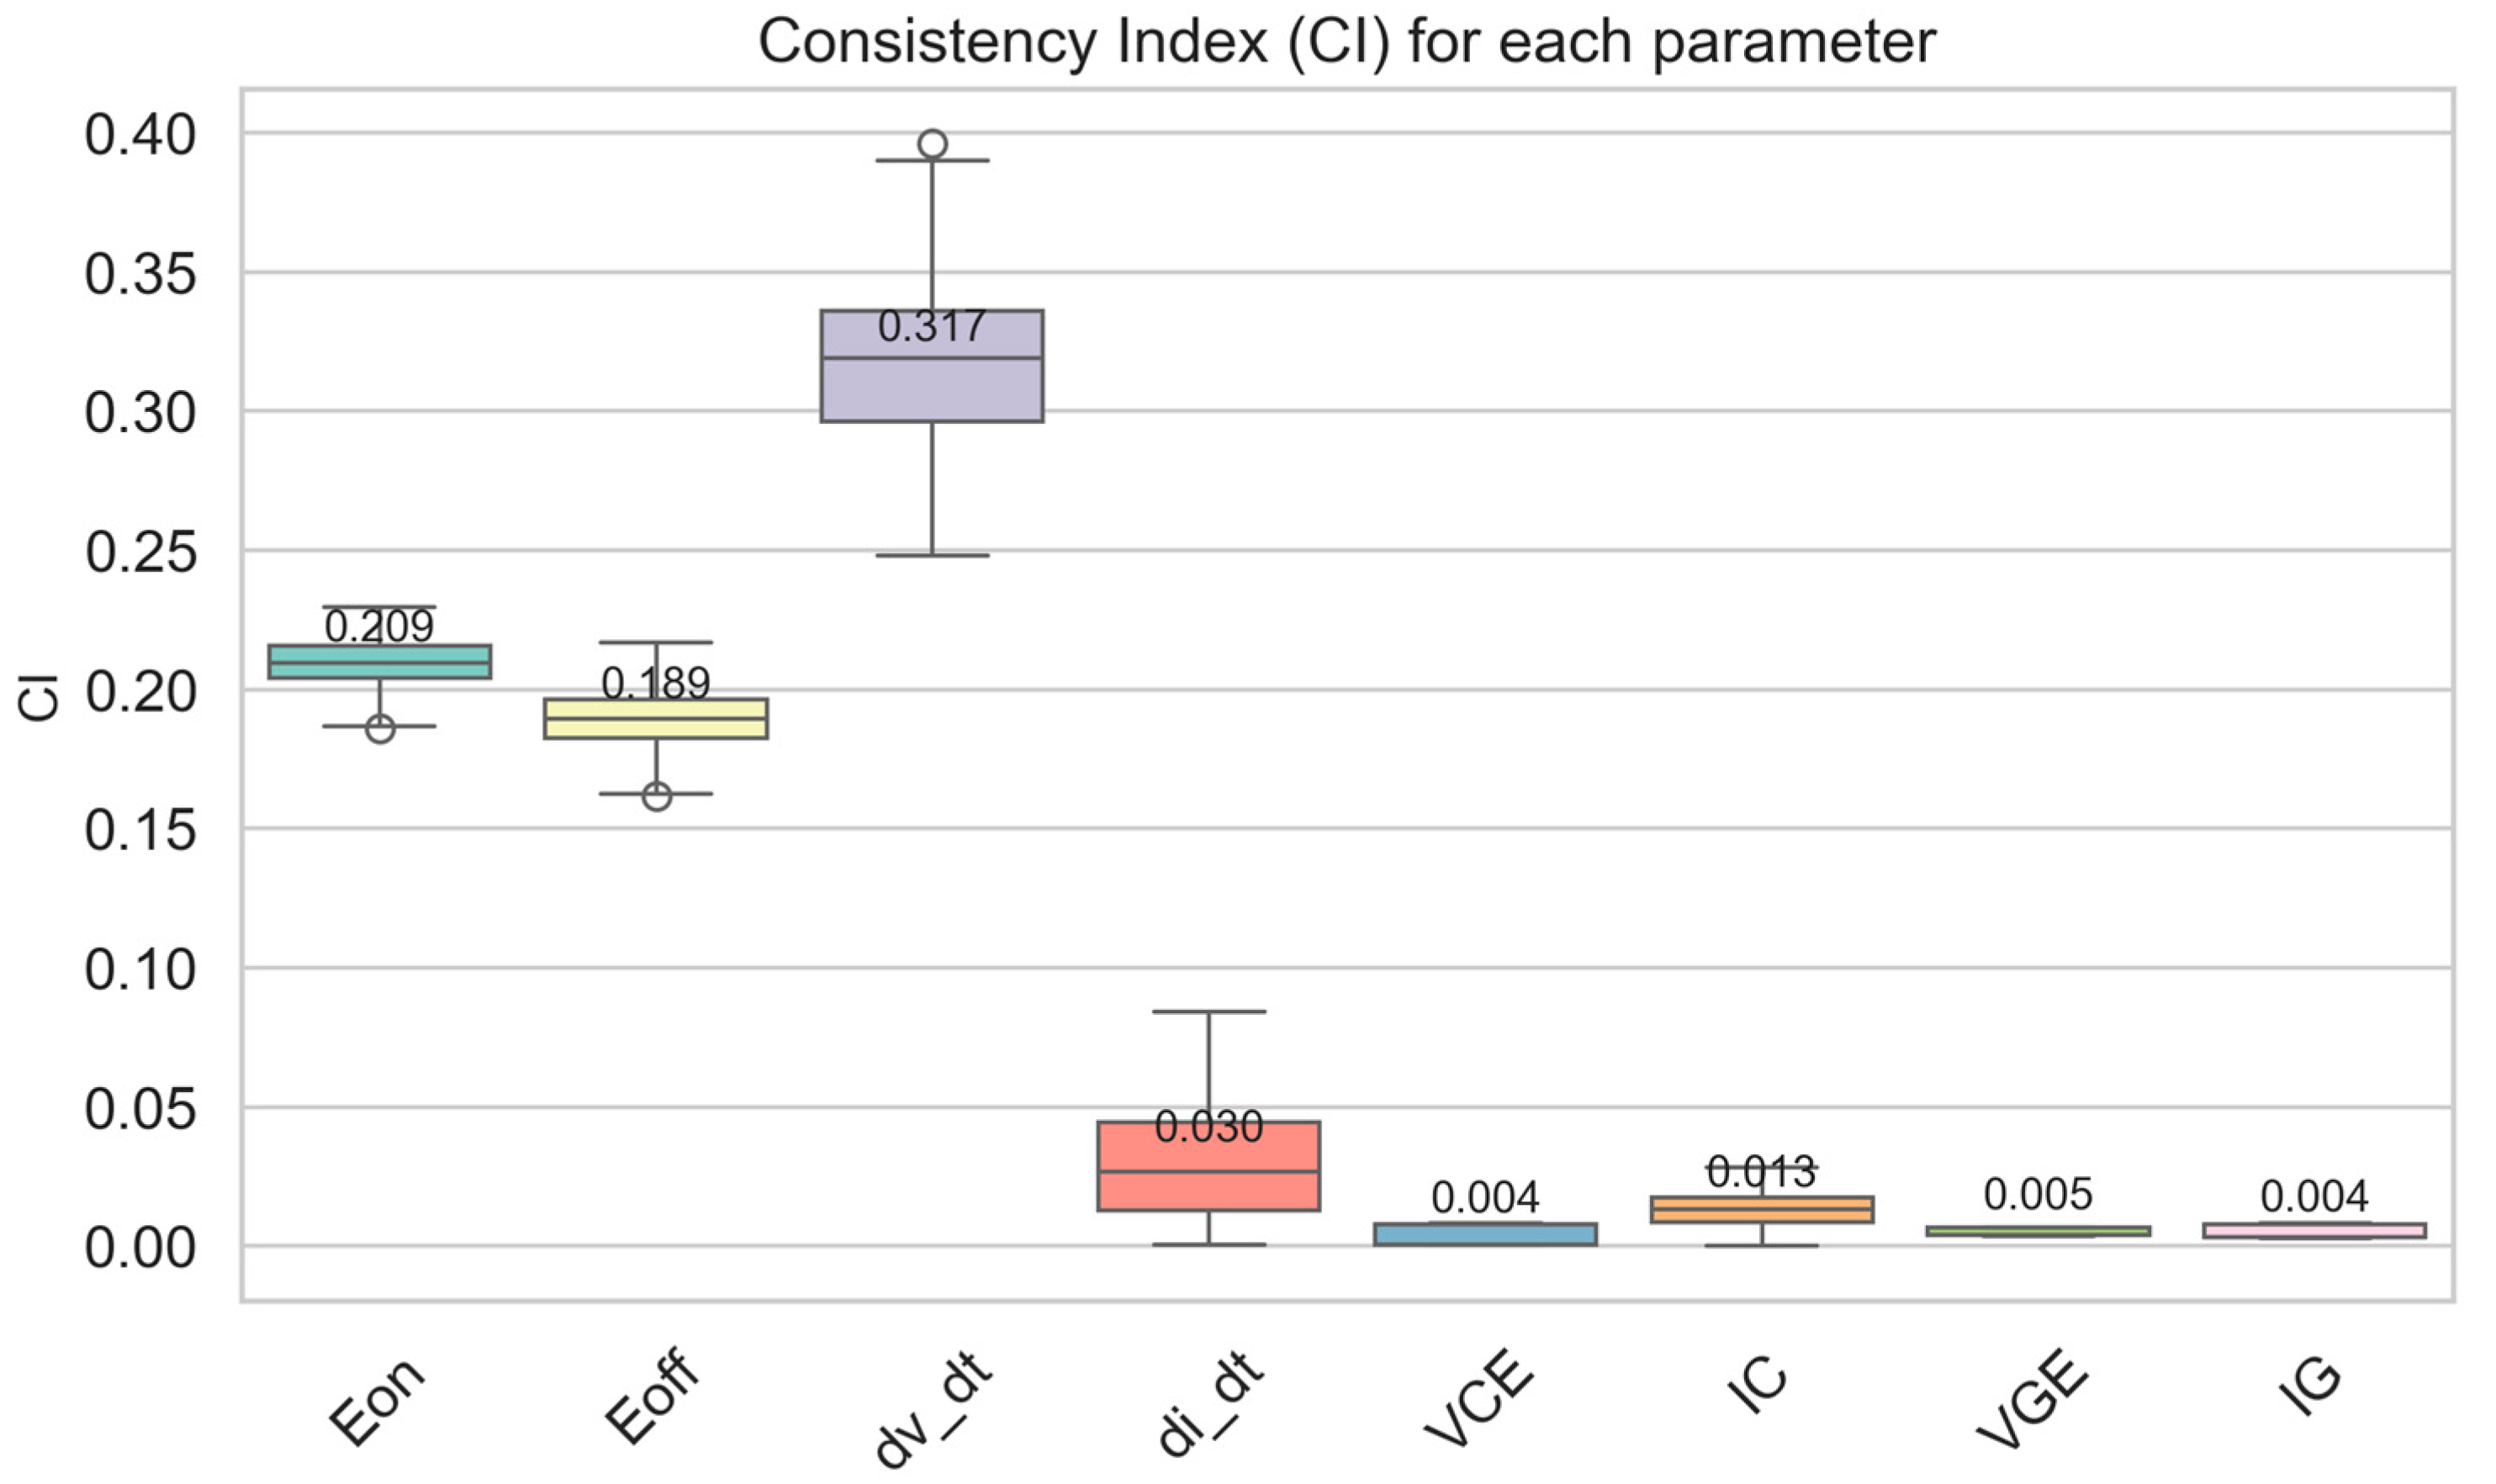
On the basis of raw-parameter distribution analysis, the Consistency Index (CI) was further used to perform a unified quantitative evaluation of bridge-arm consistency for different key parameters. Figure 12 presents the boxplot distributions of the CI values for all parameters. Since CI is a dimensionless indicator, it can be used for cross-parameter comparison of consistency levels.
Figure 12.
Boxplots of CI for Different Parameters.
As shown in Figure 12, significant differences exist in bridge-arm consistency among the key parameters. Among them, VCES, VGEth, and IGES exhibit the lowest median CI values, all approximately 0.004–0.005, with relatively narrow boxes, indicating high consistency and low variability between the upper and lower bridge arms for these three parameters. The median CI of ICES is approximately 0.013, and its overall distribution remains relatively concentrated. By comparison, the median CI of di/dt is about 0.030, with a somewhat larger dispersion.
The discrepancies between the bridge arms are more pronounced for the switching-energy-related parameters and some dynamic parameters. As shown in the figure, the median CI values of Eoff and Eon are approximately 0.189 and 0.209, respectively, both substantially higher than those of the aforementioned parameters, indicating relatively large deviations between the upper and lower bridge arms in terms of switching energy. Among all parameters, dv/dt exhibits the highest median CI, approximately 0.317, as well as the widest box range, suggesting that this parameter shows the poorest consistency between the bridge arms and is the most sensitive to bridge-arm mismatch.
Overall, Figure 12 indicates that the bridge-arm consistency of the parameters can be roughly ranked from better to worse as follows: VCES, VGEth and IGES show the best consistency; ICES follows; di/dt is intermediate; whereas Eoff, Eon, and dv/dt perform relatively poorly. These results indicate that different key parameters exhibit markedly different sensitivities in consistency evaluation, which can provide a reference for subsequent parameter selection and bridge-arm matching analysis.
4.3. Paired Consistency Analysis of the Upper and Lower Bridge Arms
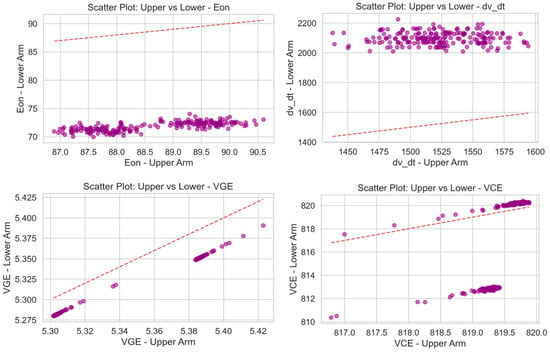
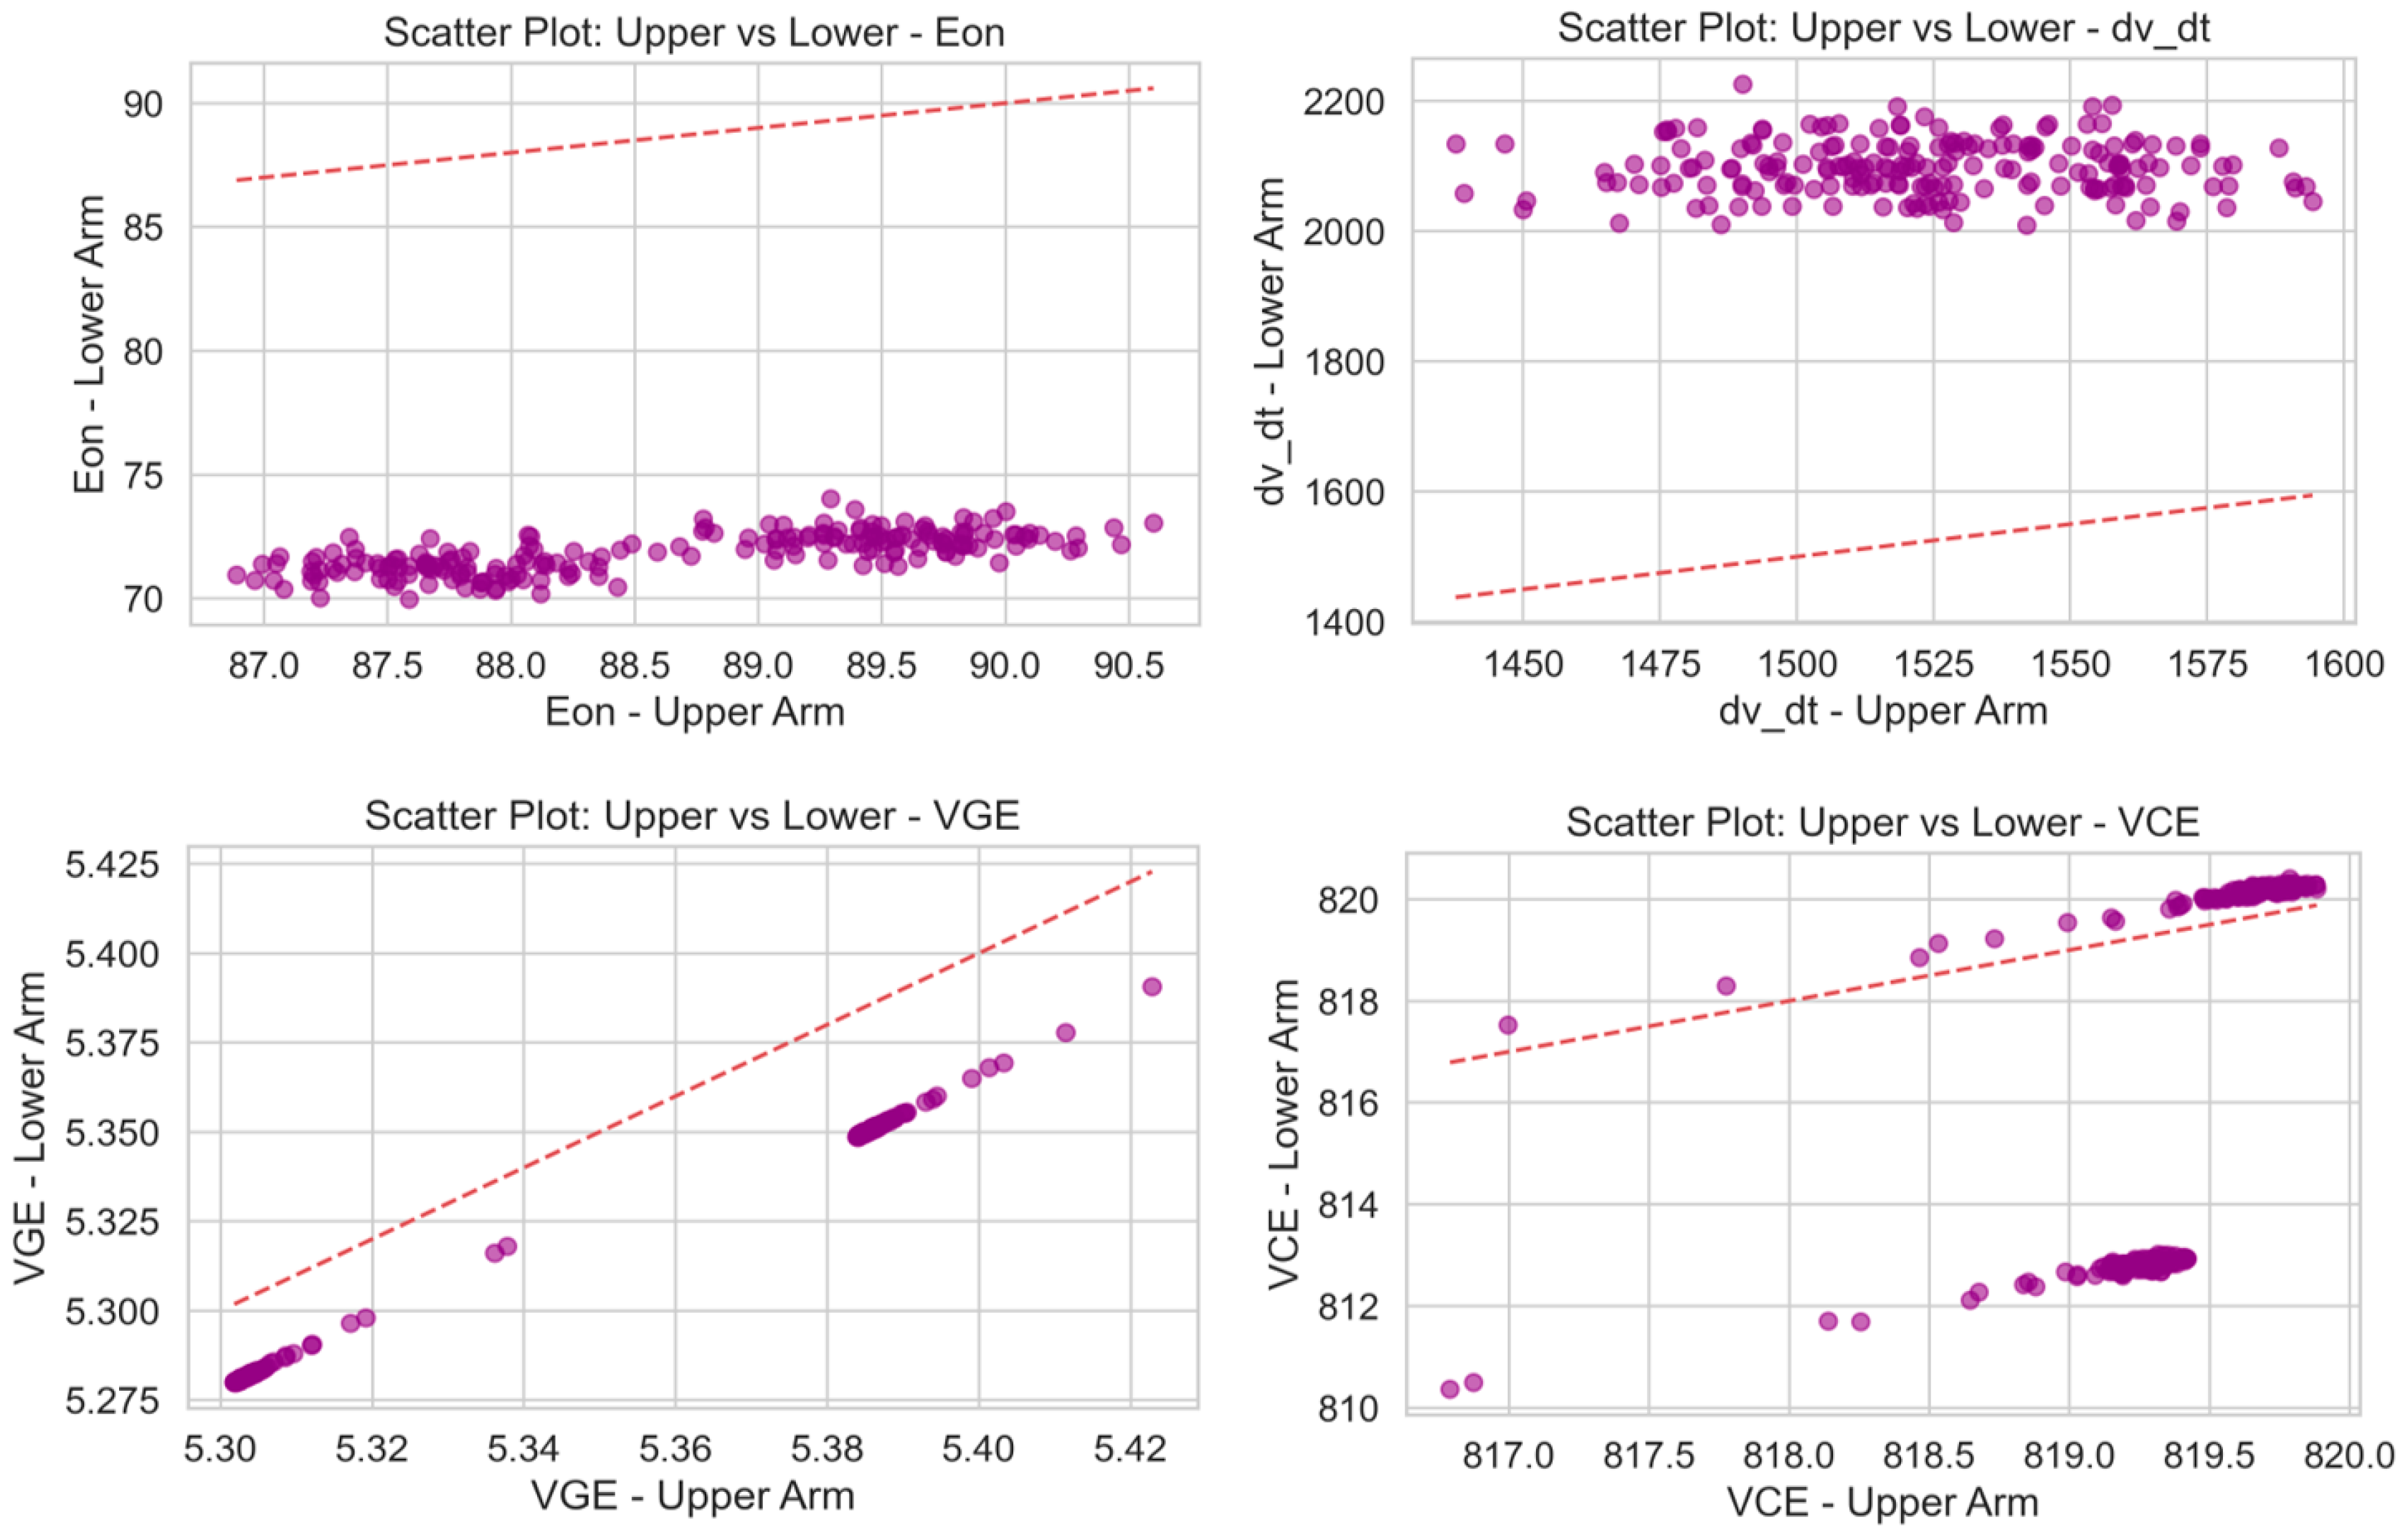
Based on the foregoing parameter distribution analysis and CI-based quantitative evaluation, the one-to-one correspondence between the upper and lower bridge arms was further examined from the perspective of sample pairing. To represent both parameters with pronounced discrepancies and those with relatively good consistency, Eon, dv/dt, VGEth, and VCES were selected as typical examples for paired scatter analysis.
As shown in Figure 13, different parameters exhibit clear differences in bridge-arm matching relationships at the sample level. For Eon, the scatter points are overall far from the reference line y = x and are mainly distributed below it, indicating that, under the sample set and test conditions considered in this study, the turn-on energy of the lower bridge arm is generally lower than that of the upper bridge arm, with a relatively stable systematic offset. For dv/dt, the scatter points are overall located above the reference line and show relatively large dispersion, indicating that this parameter exhibits not only a pronounced deviation between the upper and lower bridge arms, but also considerable sample-to-sample variation, resulting in relatively weak paired consistency.
Figure 13.
Scatter plots of Eon, dv/dt, VGEth, and VCES.
In contrast, the scatter points of VGEth are mainly distributed along several local clustered bands and are overall close to the reference line, indicating good sample-level matching between the upper and lower bridge arms for this parameter. Only a small number of samples deviate from the main distribution region, reflecting certain local differences among individual samples. The scatter points of VCES exhibit a relatively distinct bimodal clustering pattern; however, the samples within each cluster remain concentrated and are overall close to the reference line. This suggests that although grouping phenomena exist within the samples for this parameter, relatively high consistency is still maintained between the upper and lower bridge arms.
Further comparison shows that paired scatter analysis can complement the sample-level information that is difficult to directly reveal by boxplots and CI analysis alone. Boxplots mainly characterize the overall distribution position and dispersion, whereas CI mainly describes the relative magnitude of bridge-arm discrepancies. In contrast, paired scatter plots can directly display the correspondence between the upper and lower bridge arms within the same sample and indicate whether the difference manifests as an overall offset, random fluctuation, or local grouping. Combined with the results in Figure 13, it can be seen that Eon and dv/dt are more likely to exhibit obvious deviations at the sample level, whereas VGEth and VCES are overall closer to the ideal consistency reference line. These findings are consistent with the overall trends observed in the preceding raw-parameter distribution analysis and CI-based quantitative evaluation, indicating that different key parameters differ not only at the statistical distribution level but also in their sample-pairing consistency characteristics. This provides a basis for subsequent bridge-arm matching analysis and abnormal sample identification.
Based on the above results of parameter distribution analysis, CI quantification, and paired scatter analysis, this study further discusses the role of the proposed method in manufacturing-side quality analysis from the perspective of production-line application. Manufacturers can use the CI distribution of each parameter to monitor the bridge-arm matching state of modules from the same batch. When the CI median or dispersion range of a certain parameter increases significantly, it can be used as an early warning indicator of quality fluctuation within that batch. Paired scatter plots can reveal whether systematic deviation or local abnormal samples exist between the upper and lower bridge arms, thereby assisting in outgoing inspection, bridge-arm matching, and rechecking-sample identification. For samples that deviate significantly from the reference line, repeated testing and traceability analysis can be conducted by combining the original switching waveforms and static parameter results. If a certain type of parameter continuously shows an upper–lower bridge-arm deviation trend within the same batch, it may indicate potential differences in chip screening, bonding, soldering, packaging, or gate-loop-related production processes. Therefore, the proposed method can be used not only for bridge-arm consistency evaluation of modules, but also as an auxiliary tool for production-line quality monitoring and manufacturing-process troubleshooting. From the perspective of production-line deployment, the developed test machine is capable of batch testing. The complete dynamic–static parameter test time for a single IGBT module is approximately 12 s, and the overall deployment cost is about RMB 0.8 million, which can meet the requirements of rapid production-line testing and data accumulation.
5. Conclusions
Based on the dynamic–static parameter test platform developed in this study, more than 400 sets of production-level measured data were acquired from newly manufactured IGBT modules within the same batch. On this basis, a multi-parameter experimental evaluation method was established for key parameters, including Eon, Eoff, dv/dt, di/dt, VCES, ICES, VGEth and IGES. Through raw-parameter distribution analysis, Consistency Index (CI)-based quantitative analysis, and paired scatter analysis, the bridge-arm consistency characteristics of same-batch IGBT modules were systematically investigated.
The results show that, under identical test conditions within the same batch, different key parameters exhibit different degrees of distributional difference and relative deviation between the upper and lower bridge arms. The raw-parameter distribution analysis, CI-based quantification results, and sample-level paired analysis are mutually corroborative in terms of overall trends, indicating that the proposed method can effectively characterize bridge-arm consistency from the perspectives of distribution features, discrepancy quantification, and sample-pairing relationships. Further analysis shows that different key parameters exhibit markedly different behaviors with respect to bridge-arm consistency: some static parameters show relatively high consistency between the upper and lower bridge arms, whereas some dynamic parameters and switching-energy-related parameters exhibit more pronounced bridge-arm differences. This indicates that bridge-arm consistency cannot be adequately characterized by a single parameter alone and instead requires comprehensive evaluation through joint multi-parameter analysis.
Overall, the proposed multi-parameter experimental consistency evaluation method can provide a reference for within-batch consistency analysis, bridge-arm matching, abnormal sample identification, and manufacturing-process troubleshooting of IGBT modules. It should be noted that the results of this study were obtained from newly manufactured IGBT modules from the same batch under room-temperature and unified production-line test conditions, and therefore mainly reflect the bridge-arm matching characteristics of this batch under the same test conditions. For modules from different batches, under different temperatures, voltage/current stress conditions, or aging states, the parameter distributions and consistency results may vary due to manufacturing-process differences, temperature-dependent electrical characteristics, stress-level variations, and aging-related degradation mechanisms. Therefore, the conclusions obtained in this study should not be directly generalized as universal rules for all IGBT modules under all operating conditions. Future work will further extend the validation to multiple batches, multiple temperatures, different stress conditions, and aged samples to improve the applicability and engineering validation basis of the proposed method.
Author Contributions
Electrical design, Z.Z.; Mechanical design, C.Y.; Conceptualization, Z.Z.; Software, Y.L.; Supervision, B.G.; Writing—Original Draft, Z.Z.; Writing—Review and Editing, Y.Z. All authors have read and agreed to the published version of the manuscript.
Funding
This research was funded by the National Key Research and Development Program of China, grant numbers are 2024YFF0619903 and 2024YFF0619904.
Data Availability Statement
Due to privacy/ethical restrictions, the data presented in this study are not publicly available. Further inquiries can be directed to the corresponding author.
Conflicts of Interest
The author Bin Guo is employed in Hangzhou Wolei Intelligent Technology Company. The authors declare no conflict of interest. The research was conducted in the absence of any commercial or financial relationships that could be construed as a potential conflict of interest.
References
- Liu, H.; Wang, F.; Xia, W.; Shen, C. Research on Online Monitoring Method for Bond Wire Fatigue Applied to IGBT Module. Electronics 2023, 12, 3432. [Google Scholar] [CrossRef] [Scilit]
- Yuan, X.; Ji, Y.; Yuan, W.; Huai, Q.; Hao, Z.; Dongye, Z. A Method for Sensing the Internal Current Distribution State of Press-Pack IGBT Devices Based on Hall Sensors. Electronics 2025, 14, 590. [Google Scholar] [CrossRef] [Scilit]
- Górecki, K.; Ptak, P.; Górecki, P.; Data, A. Set-Up for Measuring Thermal Parameters of Power Semiconductor Devices. Electronics 2024, 13, 1636. [Google Scholar] [CrossRef] [Scilit]
- Yao, R.; Duan, Z.; Li, H.; Iannuzzo, F.; Lai, W.; Chen, X. Lifetime prediction for press pack IGBT device by considering fretting wear failure. Microelectron. Reliab. 2023, 145, 114984. [Google Scholar] [CrossRef] [Scilit]
- Yang, X.; Zhang, Y.; Wu, X.; Liu, G. Failure Mode Classification of IGBT Modules Under Power Cycling Tests Based on Data-Driven Machine Learning Framework. IEEE Trans. Power Electron. 2023, 38, 16130–16141. [Google Scholar] [CrossRef] [Scilit]
- Qin, F.; Zhang, Y.; An, T.; Zhou, R. An Improved Thermal Network Model of Press-Pack IGBT Modules Considering Contact Surface Damage. IEEE Trans. Device Mater. Reliab. 2023, 23, 444–452. [Google Scholar] [CrossRef] [Scilit]
- Abuelnaga, A.; Narimani, M.; Bahman, A.S. A Review on IGBT Module Failure Modes and Lifetime Testing. IEEE Access 2021, 9, 9643–9663. [Google Scholar] [CrossRef] [Scilit]
- Cui, H.; Guo, T.; Yang, C.; Dai, Y.; Wang, C.; Du, H.; Qin, L.; Yu, H. A New Thermal Management Strategy of IGBT in DFIG for Economic Benefit Maximization. IEEE Trans. Ind. Inform. 2024, 20, 1335–1347. [Google Scholar] [CrossRef] [Scilit]
- Ali, S.H.; Heydarzadeh, M.; Dusmez, S.; Li, X.; Kamath, A.S.; Akin, B. Lifetime Estimation of Discrete IGBT Devices Based on Gaussian Process. IEEE Trans. Ind. Appl. 2018, 54, 395–403. [Google Scholar] [CrossRef] [Scilit]
- Zhou, S.; Zhou, L.; Sun, P. Monitoring Potential Defects in an IGBT Module Based on Dynamic Changes of the Gate Current. IEEE Trans. Power Electron. 2013, 28, 1479–1487. [Google Scholar] [CrossRef] [Scilit]
- Fang, X.; Lin, S.; Huang, X.; Lin, F.; Yang, Z.; Igarashi, S. A review of data-driven prognostic for IGBT remaining useful life. Chin. J. Electr. Eng. 2018, 4, 73–79. [Google Scholar] [CrossRef] [Scilit]
- Hu, Z.; Ge, X.; Xie, D.; Zhang, Y.; Yao, B.; Dai, J.; Yang, F. An Aging-Degree Evaluation Method for IGBT Bond Wire with Online Multivariate Monitoring. Energies 2019, 12, 3962. [Google Scholar] [CrossRef] [Scilit]
- Wei, K.; Du, M.; Xie, L.; Li, J. Study of Bonding Wire Failure Effects on External Measurable Signals of IGBT Module. IEEE Trans. Device Mater. Reliab. 2014, 14, 83–89. [Google Scholar]
- Du, M.; Tang, Y.; Gao, M.; Ouyang, Z.; Wei, K.; Hurley, W.G. Online Estimation of the Junction Temperature Based on the Gate Pre-Threshold Voltage in High-Power IGBT Modules. IEEE Trans. Device Mater. Reliab. 2019, 19, 501–508. [Google Scholar] [CrossRef] [Scilit]
- Xia, M.H. Research of High Voltage High Power IGBT Test Technology and Test Platform. Master’s Thesis, Zhejiang University, Hangzhou, China, March 2014. [Google Scholar]
- IEC 60747-9:200; Semiconductor Devices—Discrete Devices—Part 9: Insulated-Gate Bipolar Transistors (IGBT). IEC: Geneva, Switzerland, 2012.
- Wei, Y.; Yang, X.; Wu, P.; Liu, G. A Data-Driven Approach to Predict the Impact of Void Characteristics on IGBT Junction Temperature. IEEE Trans. Electron Devices 2026, 73, 2106–2115. [Google Scholar] [CrossRef] [Scilit]

Disclaimer/Publisher’s Note: The statements, opinions and data contained in all publications are solely those of the individual author(s) and contributor(s) and not of MDPI and/or the editor(s). MDPI and/or the editor(s) disclaim responsibility for any injury to people or property resulting from any ideas, methods, instructions or products referred to in the content. |
© 2026 by the authors. Licensee MDPI, Basel, Switzerland. This article is an open access article distributed under the terms and conditions of the Creative Commons Attribution (CC BY) license.