


Abstract
This work presents a high-efficiency and linear Ka-band power amplifier (PA) designed in a m depletion-mode GaAs pHEMT process, targeting 5G phased-array systems. To minimize passive losses, the output matching network employs an all-transmission-line architecture. Phase mismatches among output branches are compensated directly within the interstage and output matching networks via tailored distributed and capacitive components. Device-level reliability is proactively addressed by maintaining adequate voltage headroom under worst-case load mismatch, based on voltage standing wave ratio (VSWR) analysis. The amplifier achieves a peak small-signal gain of dB at 27 GHz. Under continuous-wave excitation at 27 GHz, it delivers dBm output power at the 1-dB compression point with % power-added efficiency (PAE), reaching a peak saturated output of dBm and % PAE. When driven by a 64-QAM signal with a 250 MHz symbol rate, the PA maintains an average output power of dBm and an average PAE of %, with an rms EVM of % and an SNR of dB.
Keywords:
GaAs; pHEMT; Ka-band; mm-wave; MMIC; power amplifier; power combiner; 5G phased-array systems 1. Introduction
The rapid expansion of internet-based services, driven by video streaming and the Internet of Things (IoT), has led to a strong increase in mobile data traffic. Due to spectrum congestion in the sub-6 GHz band, millimeter-wave (mmW) frequencies are being used to enable wider bandwidths and higher data rates in 5G networks [1,2]. The maximum size of a 5G phased array module is constrained by the dimensions of user equipment (UE) devices [3,4]. As digital predistortion (DPD) is impractical in compact mmW UE phased arrays, mainly because of the required feedback/calibration hardware, the associated digital power overhead, and the need for frequent updates under beam- and load-dependent nonlinearities [5,6,7,8,9], the efficiency of 5G radios relies on high-efficiency PAs that provide sufficient linearity. Moreover, spatial power combining in both UE and access point (AP) phased arrays is essential to overcome the path loss at mmW frequencies. However, the limited form factor of UE front-end modules (FEMs) restricts the number of antenna channels. To maintain a constant EIRP and preserve link quality, the PA in each channel must deliver higher output power (Pout). While CMOS and SiGe technologies offer a high integration degree at low cost in large-volume manufacturing [10,11,12,13,14], they attain a significantly lower power density compared to III–V technologies. GaAs, on the other hand, provides a compromise between output power (Pout), reliability, and fabrication cost. In compliance with 3GPP regulations, the maximum allowable effective isotropic radiated power (EIRP) for UE devices is capped at 35 dBm [15]. Prior work [16,17] has demonstrated GaAs PAs with Pout exceeding 36 dBm and a power-added efficiency (PAE) around 25%. However, these designs are bulky and as such not compatible with compact FEMs. More recently, differential III–V PAs have been proposed [18,19,20]. However, baluns are required for the conversion between single-ended and differential signals. Because many III–V processes do not provide more than one thick metal layer, these baluns are typically implemented using coupled lines and, together with the interconnects, introduce relatively large losses [19].
In the PA proposed here, power combining based on distributed power splitters and combiners is used to obtain sufficient output power. However, mismatches among the branches inevitably arise because each branch sees a different surrounding environment. In [21], a 16-way power combiner is used in which these mismatches are compensated in the layout, but far from where they originate and only on a four-branch basis, resulting in suboptimal Pout and PAE. In the design proposed here, amplitude and phase compensation are embedded directly within the output and interstage matching networks, addressing the mismatch at its source.
The design targets of this PA are to maximize the use of the chip area constrained by the antenna array pitch [12], to achieve a saturated output power (Psat) above 33 dBm [22,23] and a modulation quality corresponding to an SNR of 25.5 dB for a 64 quadrature amplitude modulation (QAM) signal at a symbol rate of 250 MHz with an average Pout of 0.5 W. The main contribution of this work is the transmission-line-only output network, which mitigates the passive-loss limitation of prior balun- or capacitor-assisted implementations while maintaining high efficiency in a compact PA. The trade-off is a limited achievable bandwidth, since extending the bandwidth would require higher-order LC/CL sections whose additional capacitive elements would reintroduce passive loss.
This paper is organized as follows. Section 2 introduces the process technology and PA topology. Section 3 presents the unit cell sizing methodology, which makes a trade-off between physical area constraints and performance, while accounting for thermal effects and robustness against load variations. Section 4 presents the design of the power combiner and splitters that also act as interstage matching networks. A transmission-line-only topology is used to reduce passive losses compared to configurations with lumped elements. Section 5 provides measurement results and compares the design to recent state-of-the-art solutions. Section 6 concludes the paper.
2. Technology and PA Topology
2.1. Technology Overview
An AlGaAs/InGaAs pseudomorphic high-electron mobility transistor (pHEMT) process is used with a 0.13 m gate length on a 100 m-thick GaAs substrate. The HEMT attains a cutoff frequency () around 80 GHz and a maximum oscillation frequency () of 100 GHz. The drain-to-gate breakdown voltage is rated at 8 V. Two metal layers are available with a thickness of 0.8 m and 4 m, which are used for high-frequency interconnects. The technology integrates air bridges and mechanical through vias (MTVs), not only providing low-inductance grounding from the top metal layer to the substrate backside, but also facilitating efficient thermal conduction to an external heat sink. Additionally, the process supports metal–insulator–metal (MIM) SiN capacitors with a density of 650 pF/mm2, as well as both thin-film and mesa resistors with sheet resistances of 50 Ω/sq and 140 Ω/sq, respectively.
2.2. PA Topology
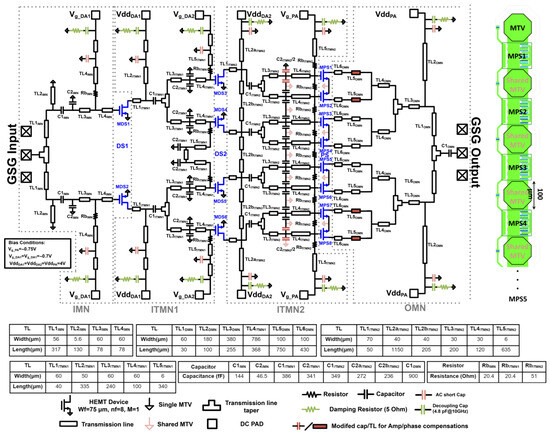
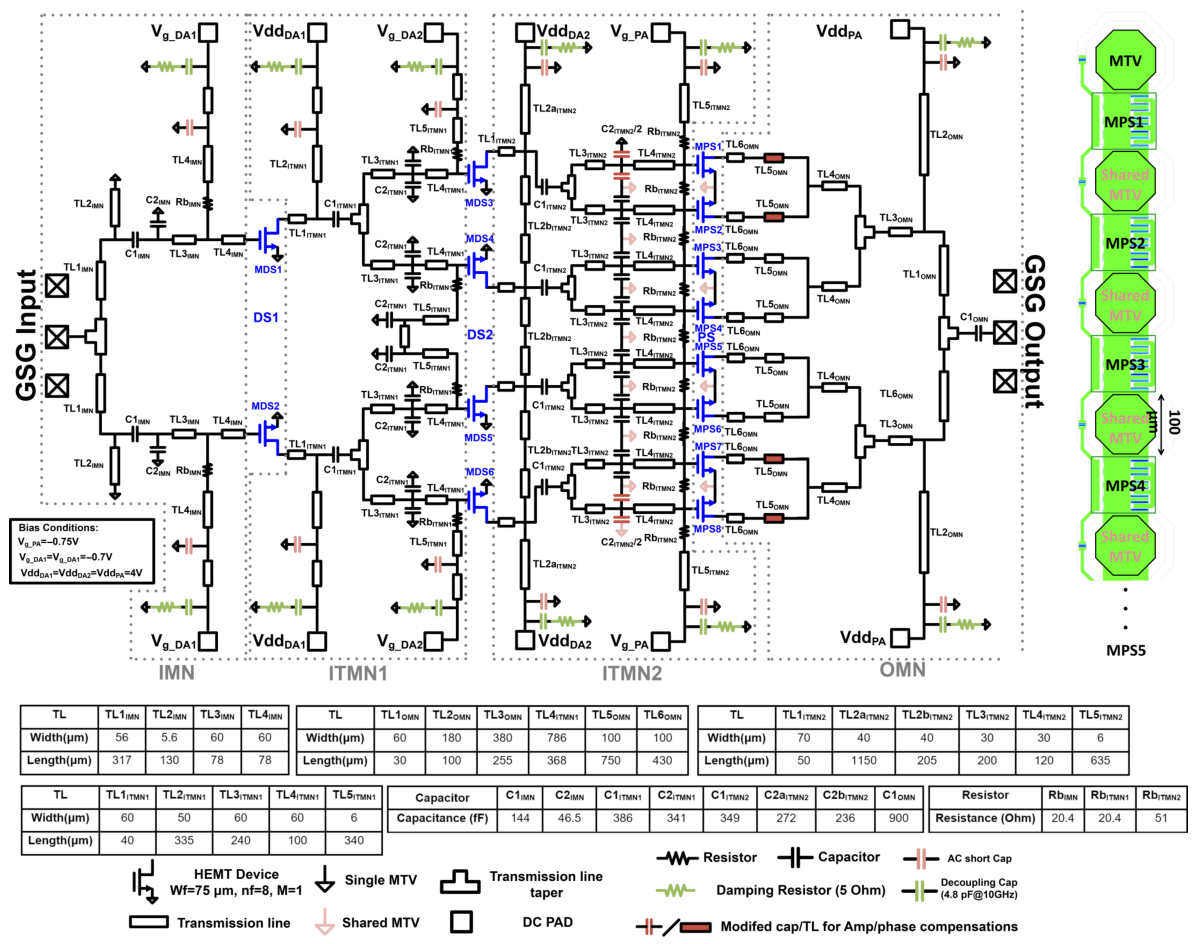
The 3-stage PA, see Figure 1, contains two driver stages, DS1 (with transistors MDS1 and MDS2) and DS2 (with transistors MDS3 to MDS6). These are followed by a power stage PS (with transistors MPS1 to MPS8). The sizes of the stages follow a multiplier progression of 2:4:8, respectively, while maintaining identical unit transistor cell (UTC) dimensions of 75 m (finger width) × 8 (number of finger) × 1 (multiplier) in each stage. When eight UTCs operate in parallel, the resulting configuration achieves a power improvement up to 9 dB compared to a single UTC.
Figure 1.
(Left): PA schematic and component values. (Right): Layout of the last stage’s upper 4 devices with MTV in between.
As seen in Figure 1, the input signal goes through three consecutive power divider stages, eventually leading to eight branches in the power stage. These are subsequently combined to produce one single-ended output. To ensure a uniform voltage distribution across all UTCs, the supply voltages are symmetrically fed from both the top and bottom edges of the chip. The power combiner, which also serves as output matching network (OMN), is implemented with wide transmission lines to minimize passive loss. The matching path does not employ lumped inductors and uses no lumped capacitors other than the AC short capacitors shown in pink in Figure 1. Separate DC blocks and decoupling capacitors are still employed for isolation and biasing. The input matching network (IMN) and the two interstage matching networks (ITMNs) perform the power split. For design simplicity and layout uniformity, they share a similar topology. Regarding the IMN, capacitor is intentionally inserted inside the signal path as an integral part of the matching network, instead of simply serving as a DC block. Further, improves the input ESD protection by providing a DC path to ground, in addition to its contribution to the input matching. Finally, all gain stages use the same UTC, discussed in the next section.
3. Unit Cell Sizing Optimization
The UTC dimensions are determined by the finger width (Wf), the number of fingers (nf) and a multiplier constant (M). The total width of a single UTC is given by Wf × nf × M, where the values of Wf, nf, and M are chosen based on the following considerations.
3.1. Size Limitations
To minimize sidelobes in the radiation pattern of a beamforming array, the array pitch should be half of the wavelength in free space, which is 5.35 mm at 28 GHz. As in [13], we constrain the y-dimension of the chip dy_chip to where is the effective wavelength for the antenna array substrate, yielding 3.1 mm [12,13]. This provides sufficient space in between the chips for biasing lines on the PCB. With a Psat of 33 dBm and a maximum allowed power density of 0.66 W/mm, the total transistor width (which stretches in the x-direction of the chip) of the PS, referred to as , should be more than 3.8 mm, taking into account a 1 dB margin for the OMN losses. This will be realized with the N parallel HEMT devices in the PS, with each UTC occupying a vertical layout height denoted as .
This GaAs process features a ground plane on the backside of the 100 m thick substrate, to which top-level features of the chip can be connected using MTVs. Measurements show that each MTV yields a series inductance of 28 pH. As shown in the right-hand side of Figure 1, the PS layout adopts a compact configuration where N UTCs share N + 1 MTVs. This approach not only saves layout area but also enhances thermal conduction to the bottom ground, thereby mitigating self-heating and mutual heating effects among transistors. Each MTV has a layout height of 100 m. Consequently, the layout height (in the y-direction of the chip) of the complete PS must satisfy
3.2. Stability and Matching of the Unit Cell
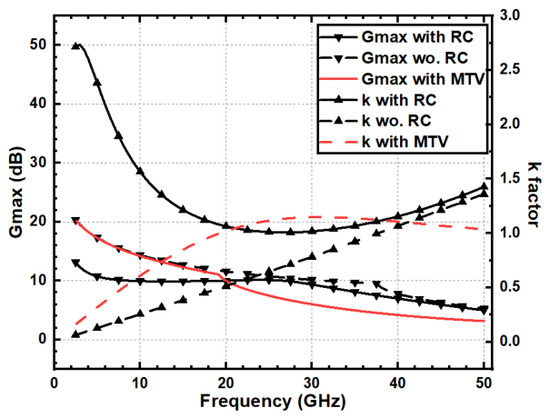
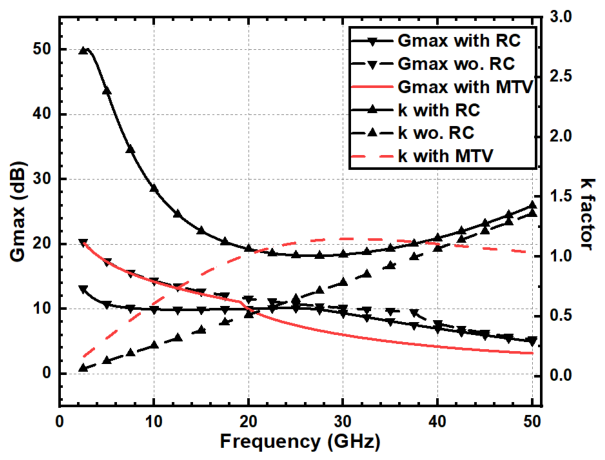
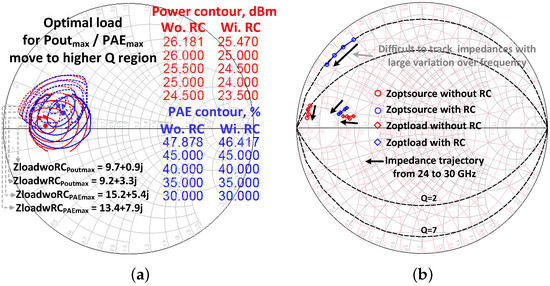
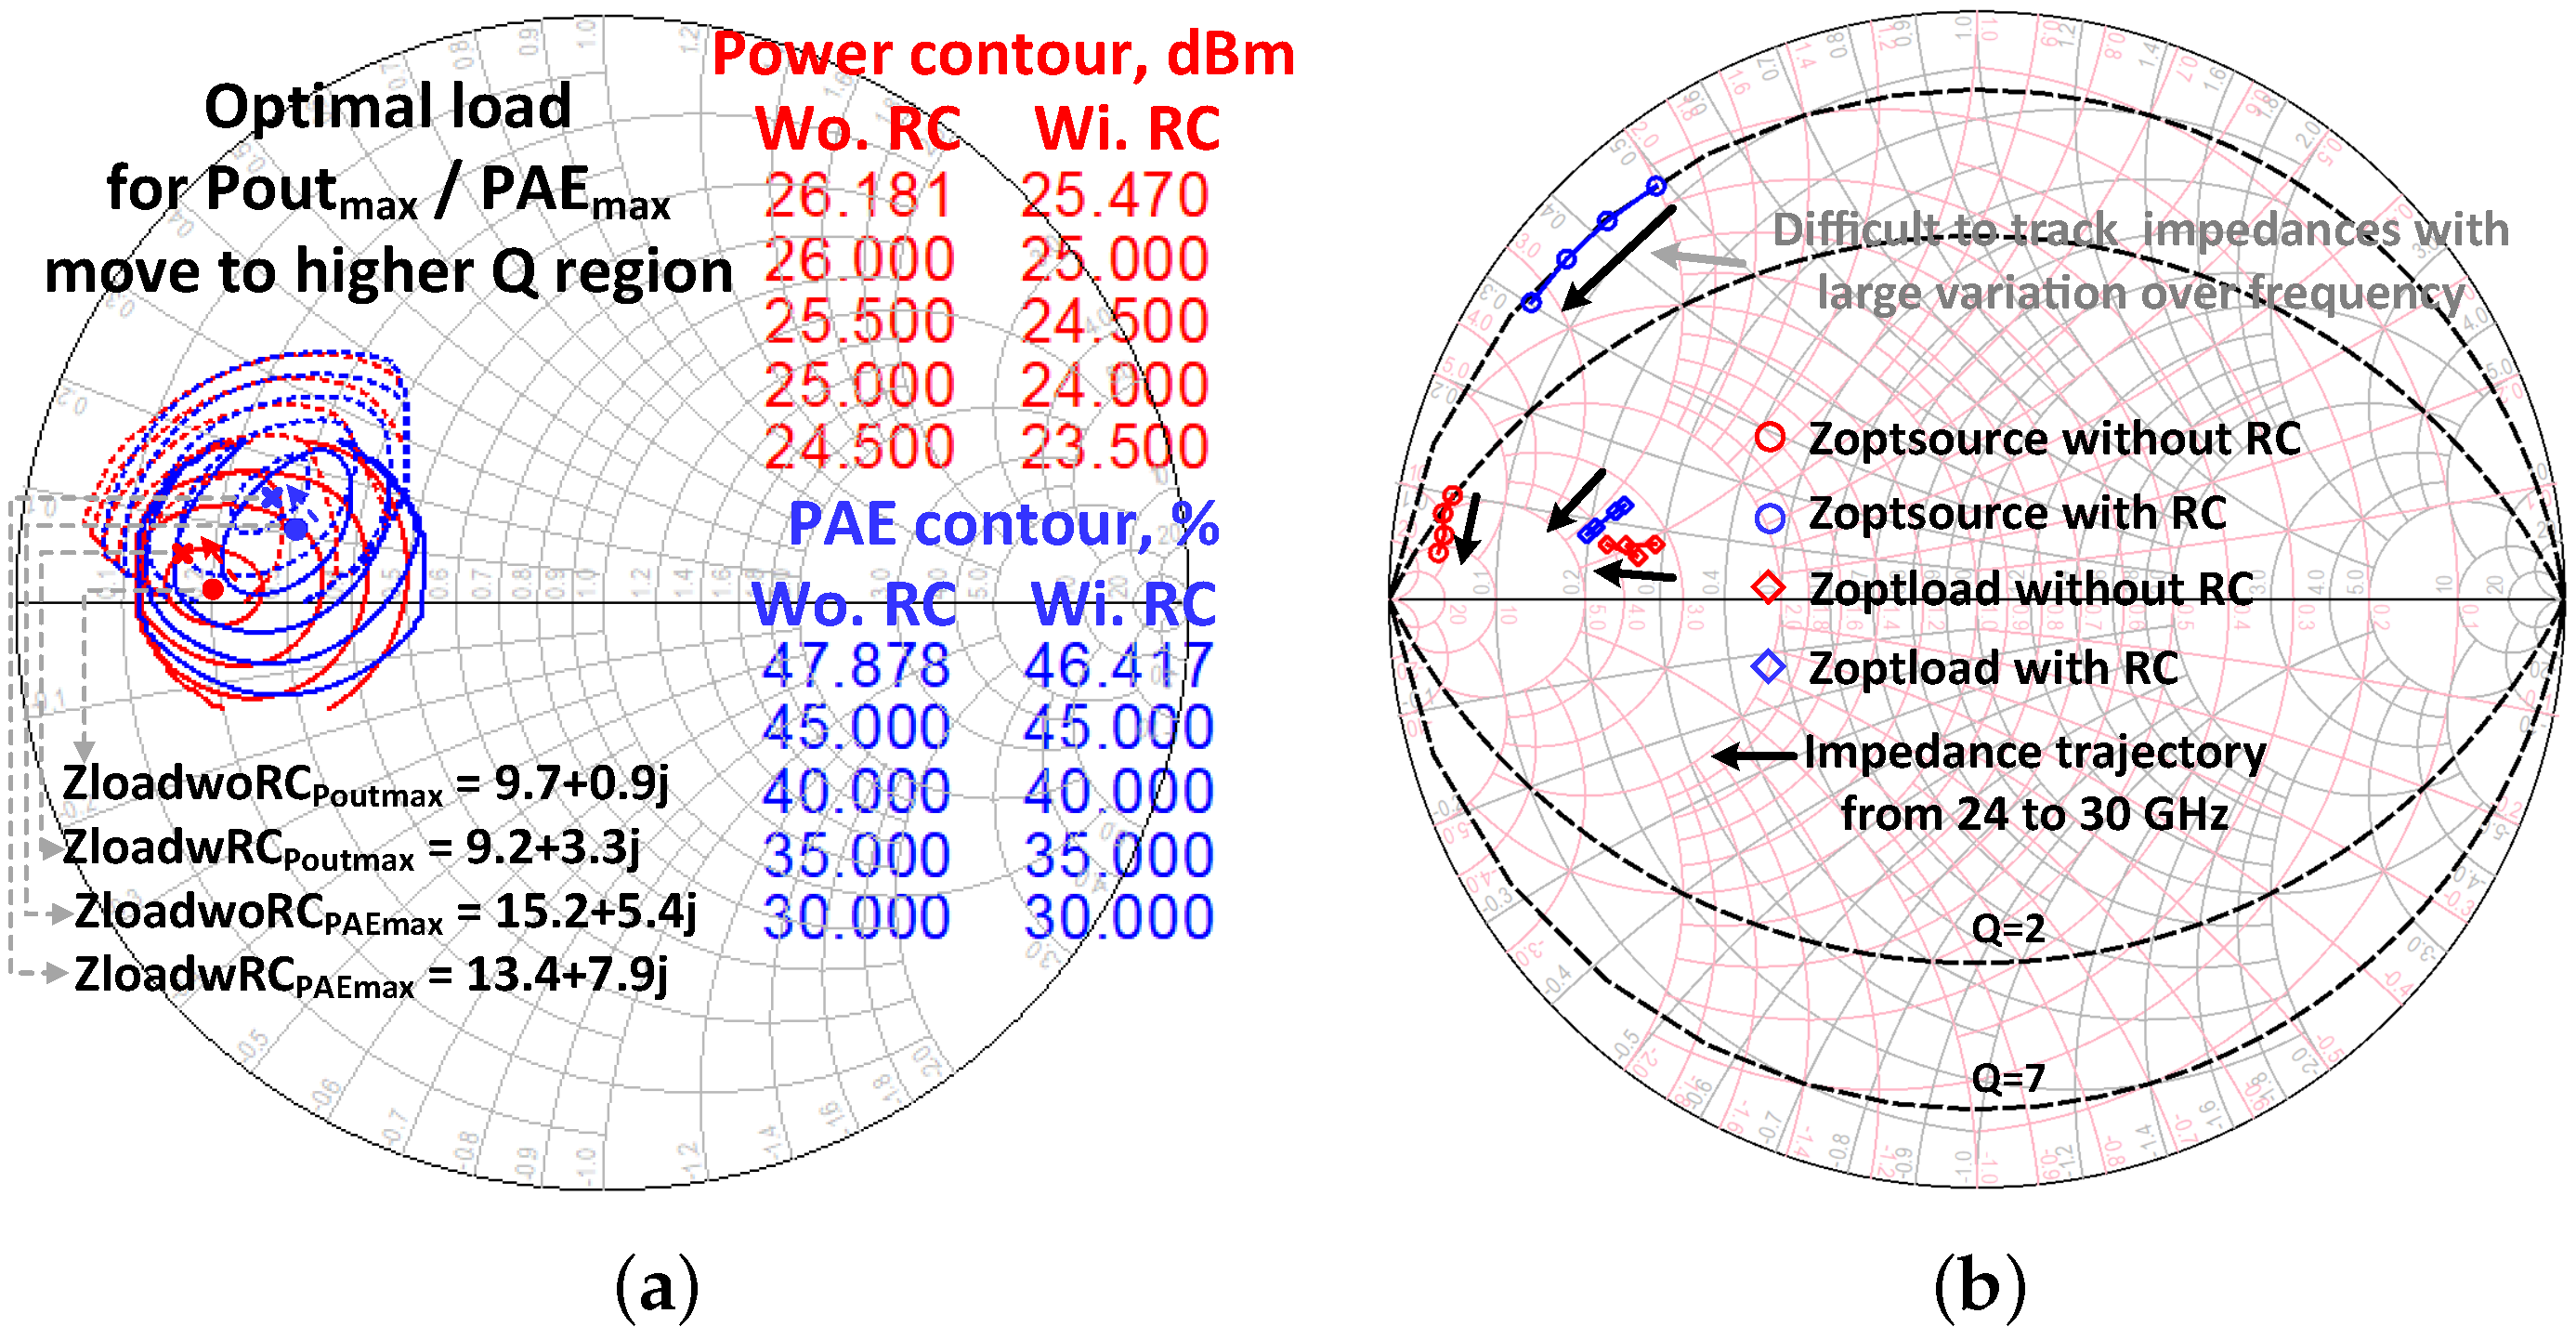
A typical method to stabilize gain stages is to insert an RC network in series with the gate of the transistors [24]. Figure 2 compares the maximum available gain (Gmax) and the stability factor k of the UTC, simulated with and without an RC stabilization network. The transistor dimensions used here are Wf = 75 m, nf = 8, M = 1, and Vgs equals −0.75 V. These values correspond to the final choices for the UTC dimensions and the gate bias. A comparison with other dimensions and bias values is given below. To isolate the impact of the RC network on the UTC performance, MTVs are first replaced with short circuits. The RC values are optimized to Rstab = 250 Ω and Cstab = 230 fF. This improves low-frequency stability while preserving Gmax in the Ka-band, keeping the performance of the UTC with RC (UTCwRC) close to the one without RC (UTCwoRC). The UTCwRC achieves unconditional stability for all frequencies, while maintaining Gmax around 28 GHz with a slight reduction due to the extra series resistance. However, the RC network impacts the value of the optimal source and load impedances obtained from source and load pull simulations. Figure 3 shows the optimal load and source impedances (Zoptload and Zoptsource) for UTCwRC and UTCwoRC from 24 to 30 GHz. It is seen that the Q factor of Zoptload does not change much across this frequency range, showing minimal dependence on the RC network. However, the RC network significantly alters Zoptsource. Indeed, the real part of Zoptsource decreases, shifting towards the edge of the Smith Chart, while the imaginary part exhibits a larger fluctuation over frequency, which adversely impacts broadband operation. To mitigate this, the proposed design adopts the UTCwoRC configuration, leveraging the parasitic inductance of MTVs at the source terminals to enhance source/load stability (see red lines in Figure 2). The potential instability below 19 GHz, where k is below 1, is further addressed through optimization of the IMN/ITMN to steer the impedance trajectories away from the unstable regions, as will be explained in Section 4.3.
Figure 2.
Gmax and stability factor k for the unit transistor cell UTC (Wf = 75 m, nf = 8, M = 1), UTCwRC vs. UTCwoRC vs. UTCwoRC with MTV.
Figure 3.
(a) Load-pull Pout and PAE contours for chosen UTC dimensions (Wf = 75 m, nf = 8, M = 1) with and without RC stabilization; (b) optimal input/output impedance trajectories.
3.3. Bias Choice
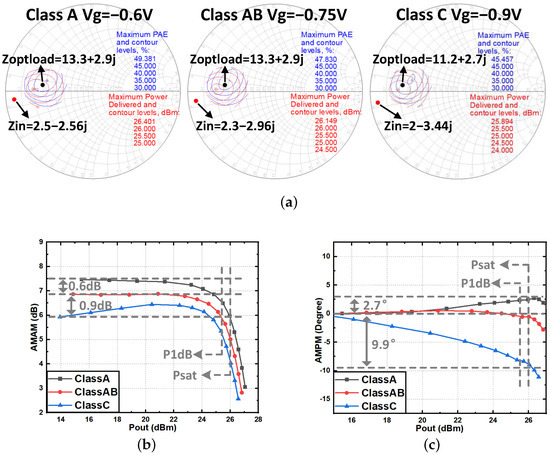
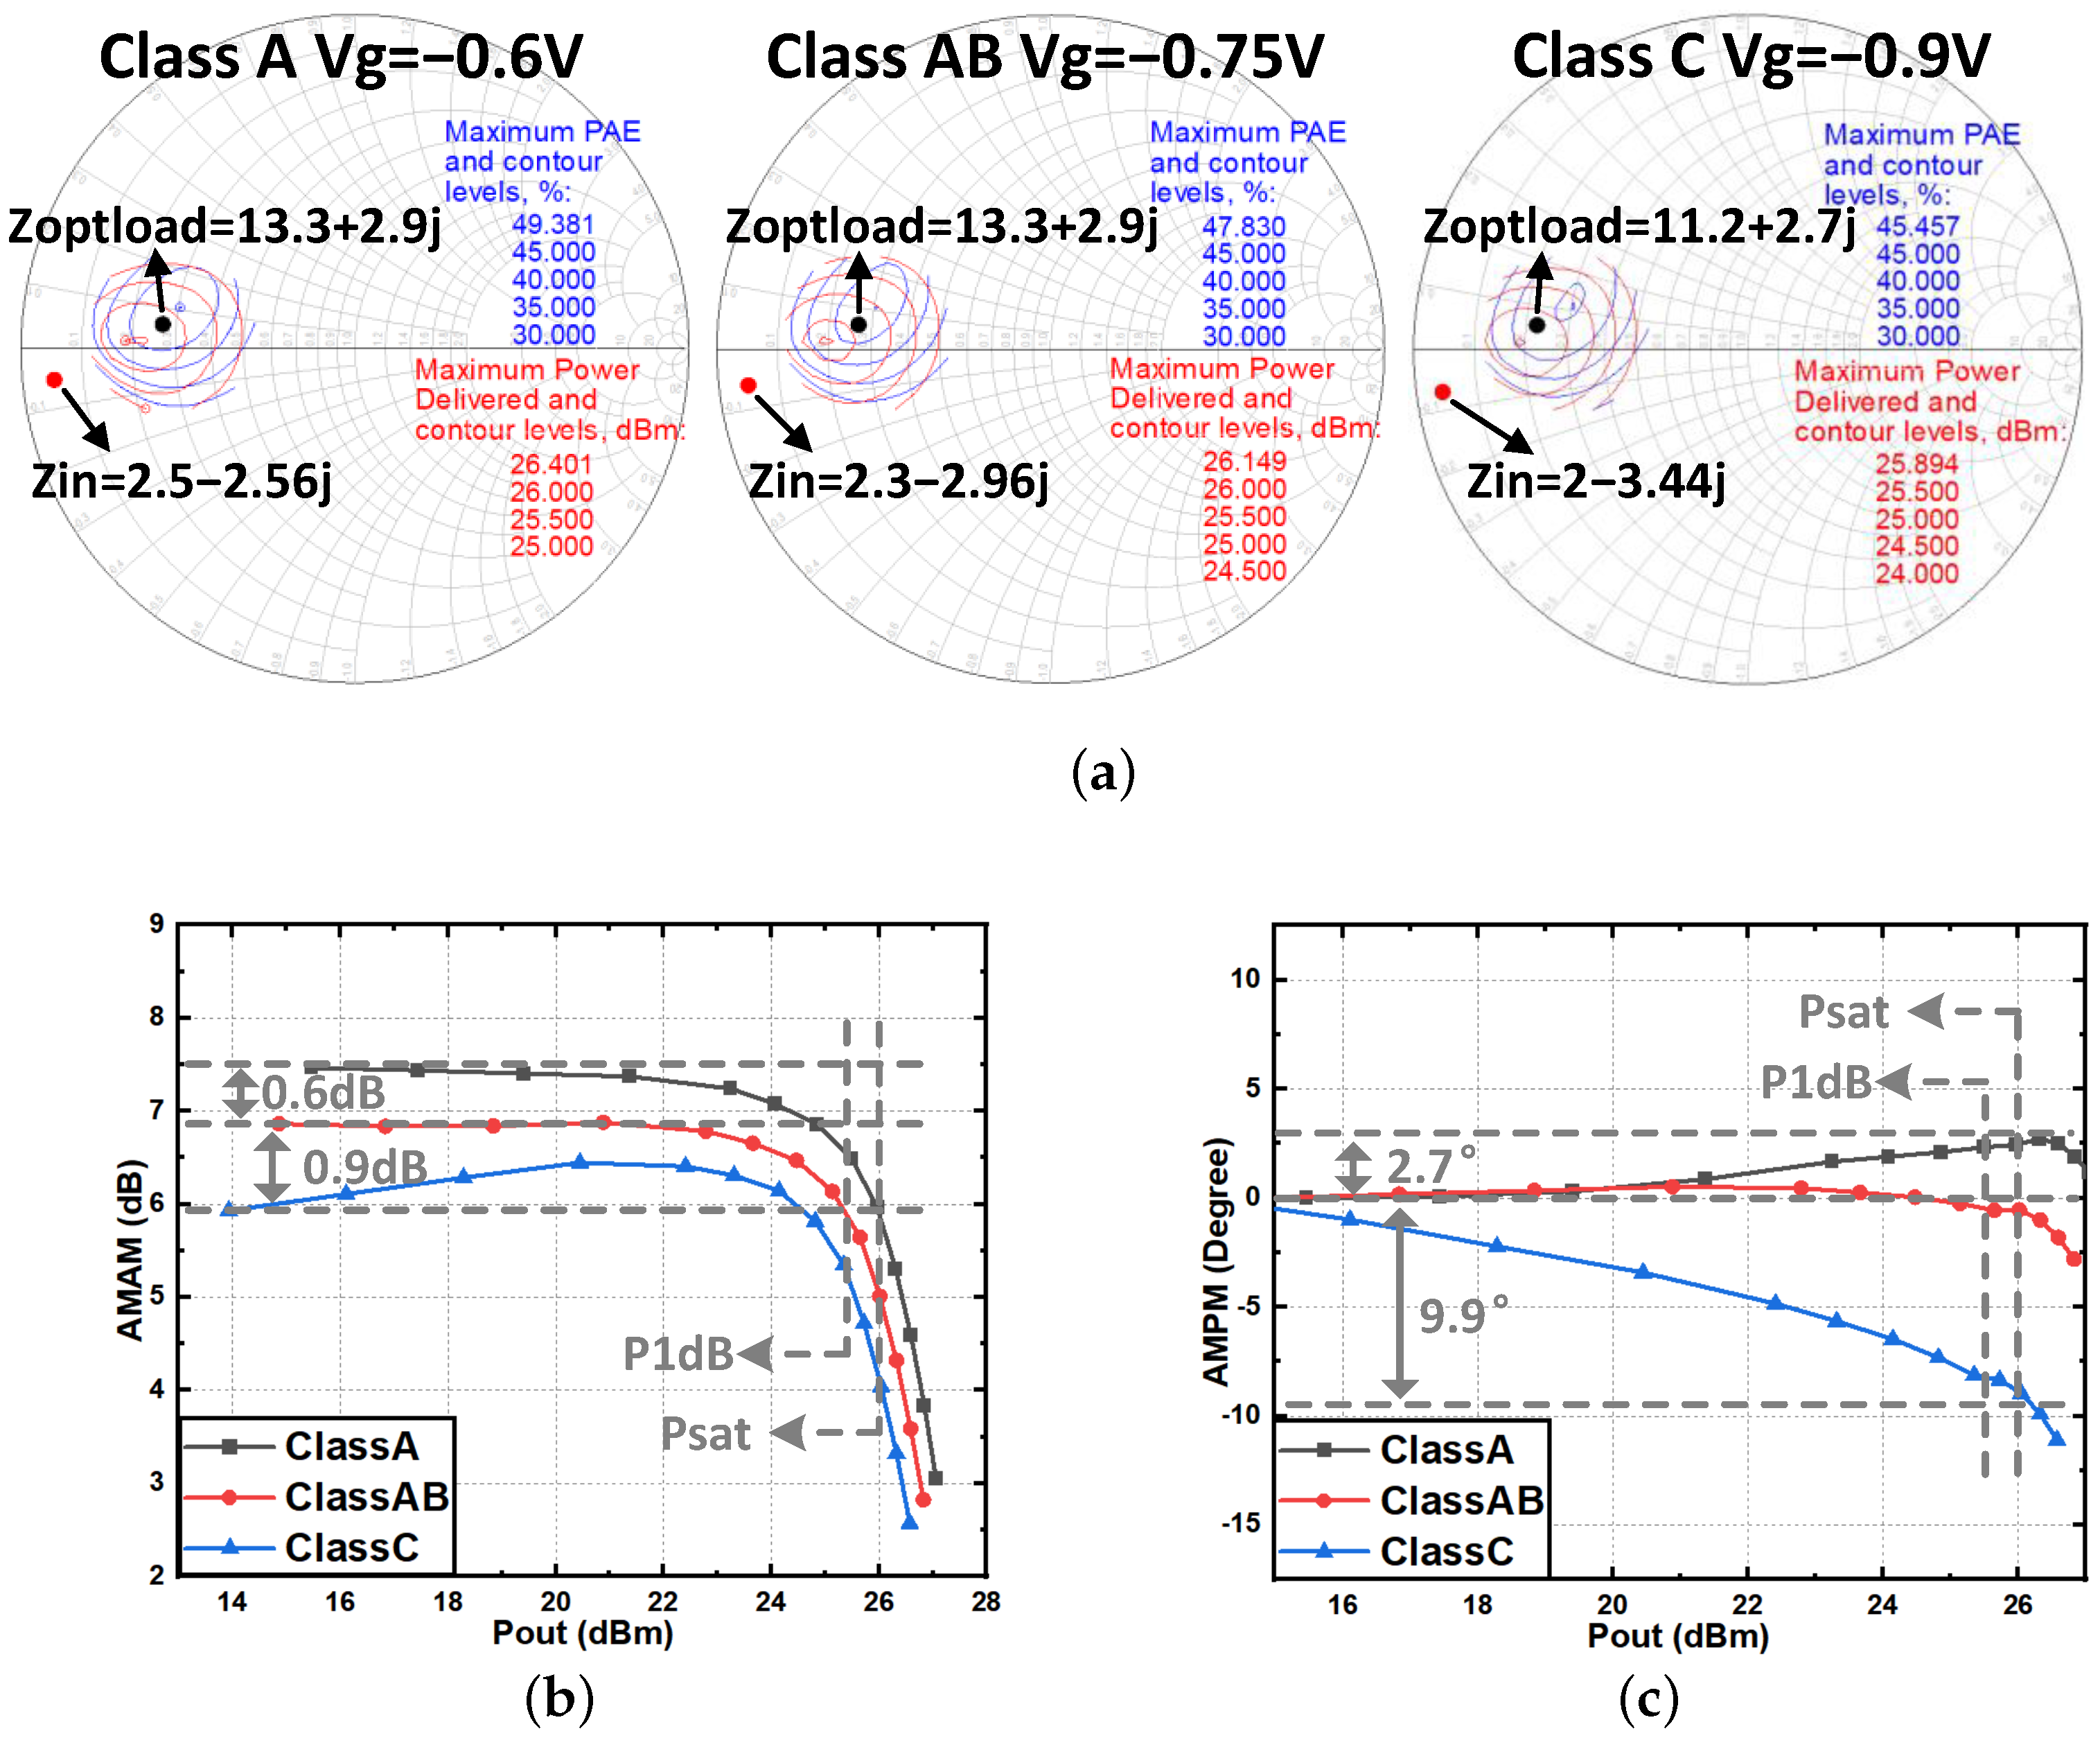
The choice of the gate-source bias voltage Vgs is mainly based on large-signal considerations. We evaluate Psat, PAEmax, AM-AM, and AM-PM for 3 Vgs values: −0.9 V, −0.75 V, and −0.6 V, corresponding to class C, AB, and A operation, respectively. As shown in Figure 4a, Zoptload and Zoptsource at OP1dB remain relatively constant across the bias points, aligning with a small variation of Psat and PAEmax. Figure 4b shows the AM-AM curve as a function of Pout. Class A operation shows the highest gain, and class C the lowest one. Class C bias exhibits gain expansion, while class A bias shows a mild gain compression. In contrast, the class AB bias produces a highly flat AM-AM curve with a sharp turning point between OP1dB and Psat. Figure 4c shows the AM-PM curve as a function of Pout. Class C bias introduces quite a steep decrease in the AM-PM curve, while class A yields a slowly increasing curve and class AB a flatter curve. Therefore, the AM-PM distortion in the whole PA is kept small by slightly increasing the gate bias from class AB in the preceding driver stages. In this design, the gate bias for the first two driver stages is set to −0.7 V, while the gate bias for the last stage is −0.75 V.
Figure 4.
Performance for different bias conditions: (a) load-pull Pout and PAE contour; (b) AM-AM curve versus Pout; (c) AM-PM curve versus Pout.
3.4. Transistor Dimension Optimization
The design space spans from 15 m to 75 m for Wf and from 2 to 8 for nf. Finger widths below 50 m lead to a very large number of fingers, yielding different parasitic inductances for different transistor parts. Table 1 compares various UTC geometries, each constrained to a total gate width of 600 m. All geometries yield low quality factors for Zoptload/Zoptsource, facilitating the matching network design. In the first two geometries, M > 1, which increases the spacing between adjacent MTVs and thus the maximum distance between the central transistor fingers and an MTV. This can lead to higher local temperature. Therefore, M is taken equal to one. The transistor with Wf = 100 m is not considered further because it has not been characterized by the foundry and exhibits lower gain and PAE. Therefore, we choose Wf = 75 m with nf = 8 and M = 1 for the UTC in all stages. Combining eight such UTCs with nine MTVs, the height of the complete power stage equals 1.67 mm, according to Equation (1). This is well below the limit of 3.1 mm, leaving sufficient margin for the bond pads and other circuit elements above and below the UTCs and MTVs.
Table 1.
Comparison between different transistor layouts at a fixed total width of 600 m.
3.5. Check for Reliable Operation
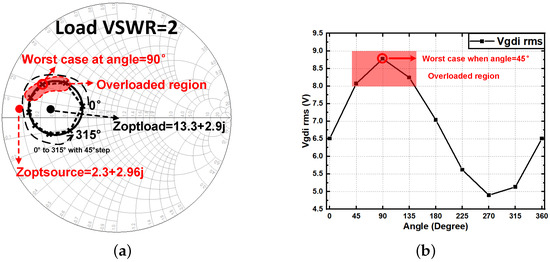
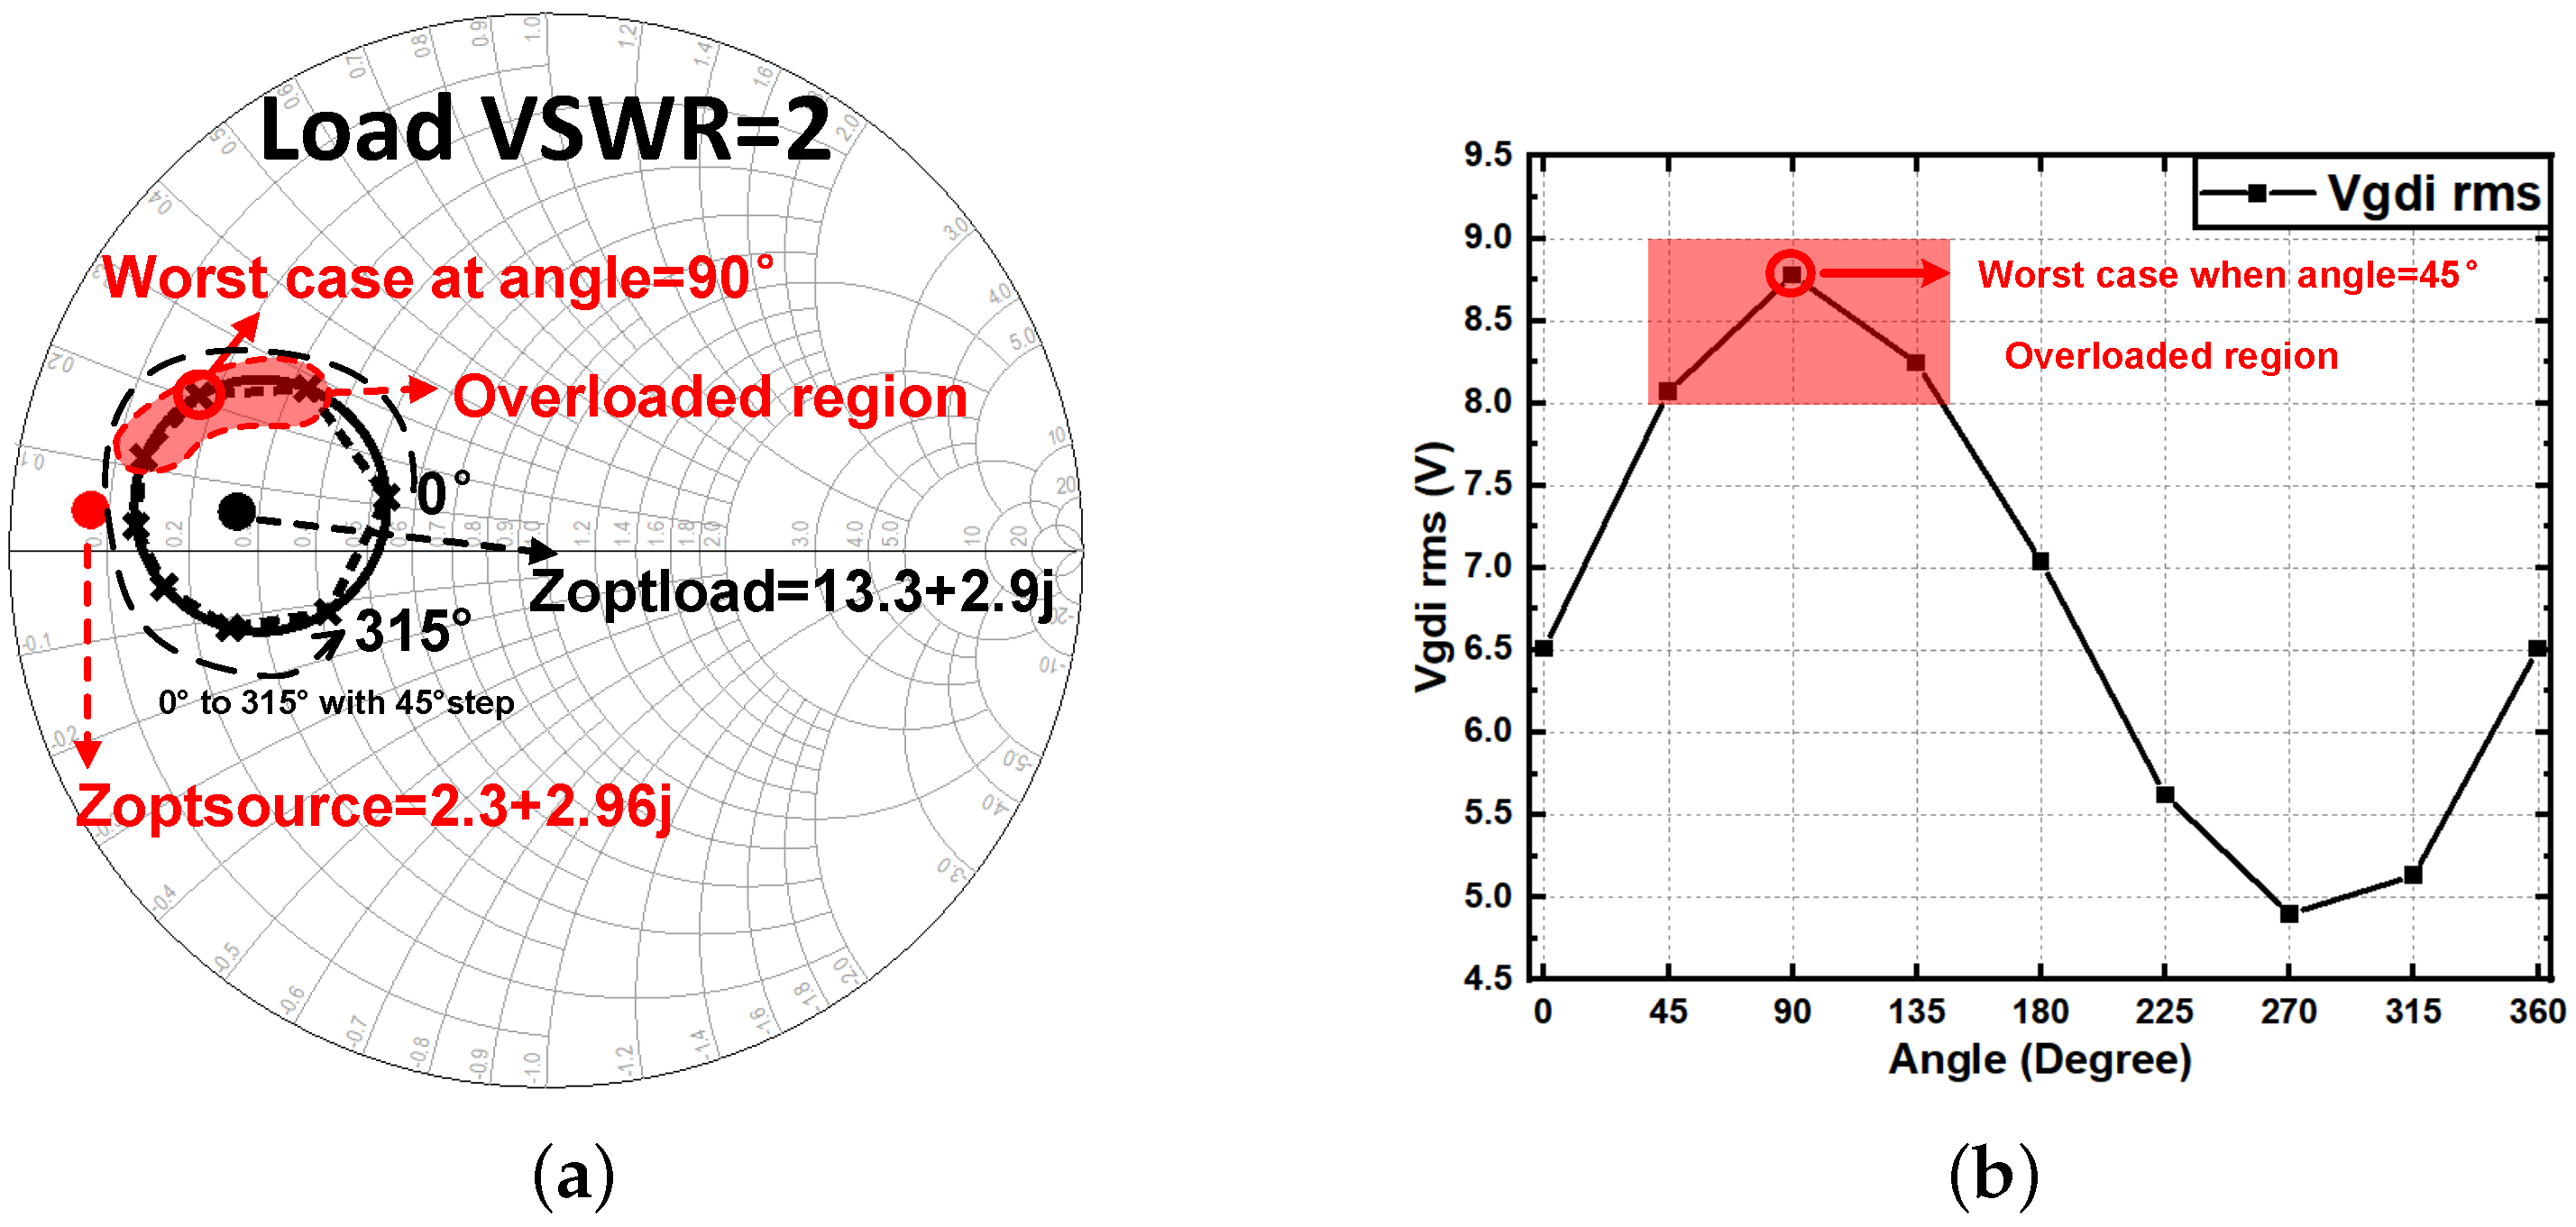
GaAs technology with its higher breakdown voltage supports a wider range of supply voltages (Vdd) than CMOS. Any Vdd value below the breakdown voltage can be applied with a safety margin to guarantee a reasonable device lifetime. For the technology used, the rms value of the voltage difference between the intrinsic gate and drain terminals [25], denoted as Vgdi (=Vdi − Vgi), should not exceed 8 V. These voltage limitations are checked in large-signal operation. When fixing the load to Zoptload, the rms value of Vgdi is 4.84 V at OP1dB, corresponding to only 60.5% of Vbd. In a beamforming scenario, the load of each PA can vary when transmitting into directions other than broadside. To maintain safe operation for all directions, the rms value of Vgdi should remain well below 8V when the VSWR of the load impedance reaches 2 [26,27,28]. Evaluating Vgdi while maintaining the same input power as for VSWR = 1 and for load impedances on a VSWR = 2 circle around Zoptload (see Figure 5) indicates that for some impedances the rms value exceeds 8 V. While here a load variation is applied at the drain of a UTC, it will be shown in Section 4.1 that in the entire PA, where the combiner is in between the PA output and the transistors’ drain, the rms Vgdi remains below Vbd for VSWR up to 4.
Figure 5.
(a) VSWR=2 circle around the optimum load impedance Zoptload for a UTC. (b) rms voltage difference between gate and drain as a function of load impedance angles on this circle. Input power corresponds to the OP1dB at VSWR = 1. The source impedance, Zoptsource, is the complex conjugate of the corresponding input impedance of the UTC when loaded with Zoptload.
4. Combiner and Splitter Design
To minimize losses, all matching networks employ transmission-line-based (non-isolated) power splitting and combining techniques. Specifically, the IMN, ITMN1, ITMN2 can be considered 2-way splitters, doubling the number of signal branches at each stage. The OMN, on the other hand, serves as an 8-to-1 power combiner. Detailed design procedures for typical power splitters and combiners are available in [16,29]. The discussion below will highlight design-specific novelties, rather than repeating standard implementation steps.
4.1. Combiner Design
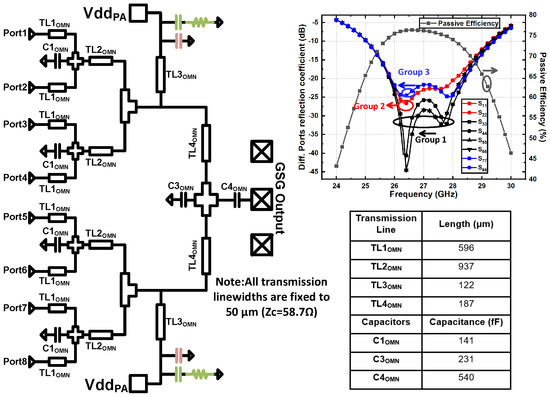
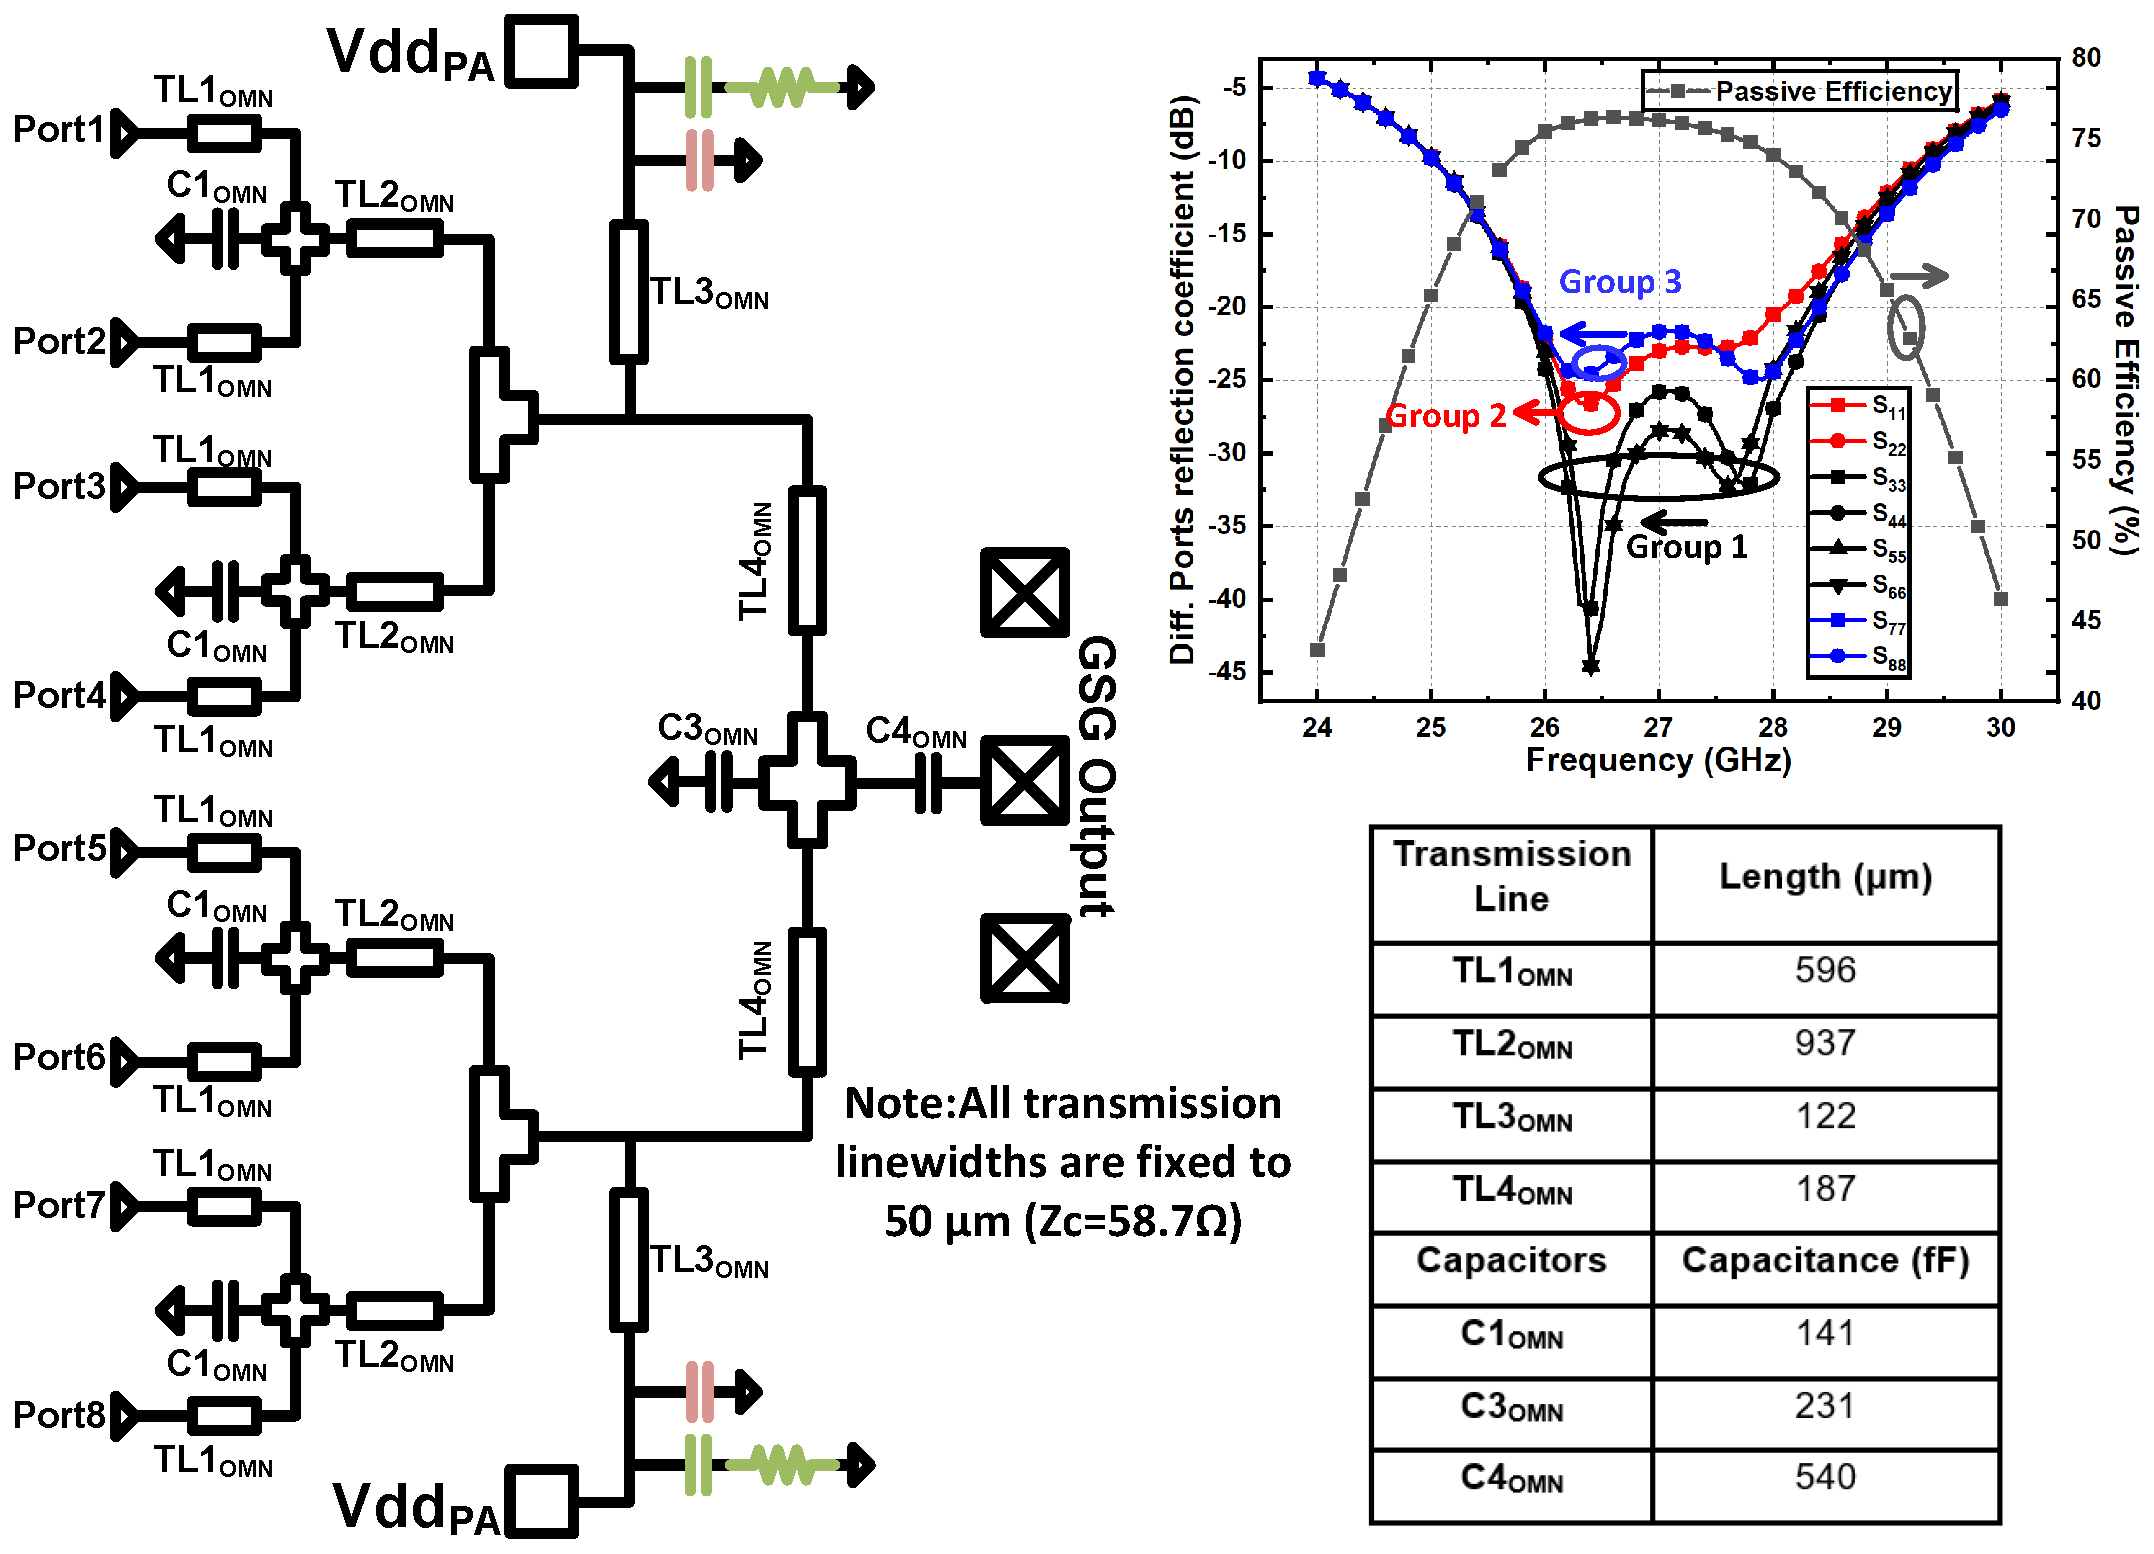
The conventional topology [17] uses shunt capacitors at each stage of the OMN (see the left schematic in Figure 6) and transmission lines with the same width. EM simulations, excluding supply feed loss, indicate that this topology yields a passive efficiency below 76%, significantly impacting the overall PAE. This low efficiency is mainly due to the large sheet resistance of the metal of the bottom plate of the MIM capacitors. Further, the reflection coefficients in the top-right plot of Figure 6 reveal mismatches across the different output ports. These non-idealities highlight the necessity of implementing amplitude and phase compensation in the OMN and ITMN to ensure uniform performance across all branches.
Figure 6.
Conventional OMN topology [17] with corresponding transmission line lengths; S-parameters from the schematic level simulation and passive efficiency . S-parameters overlap with each other: with , with , with , with .
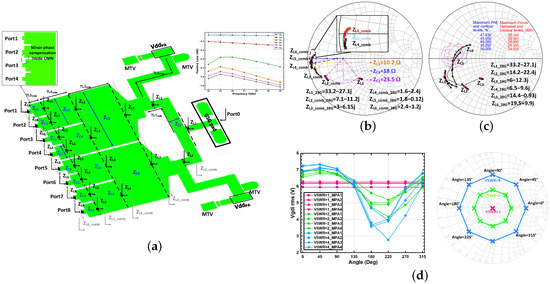
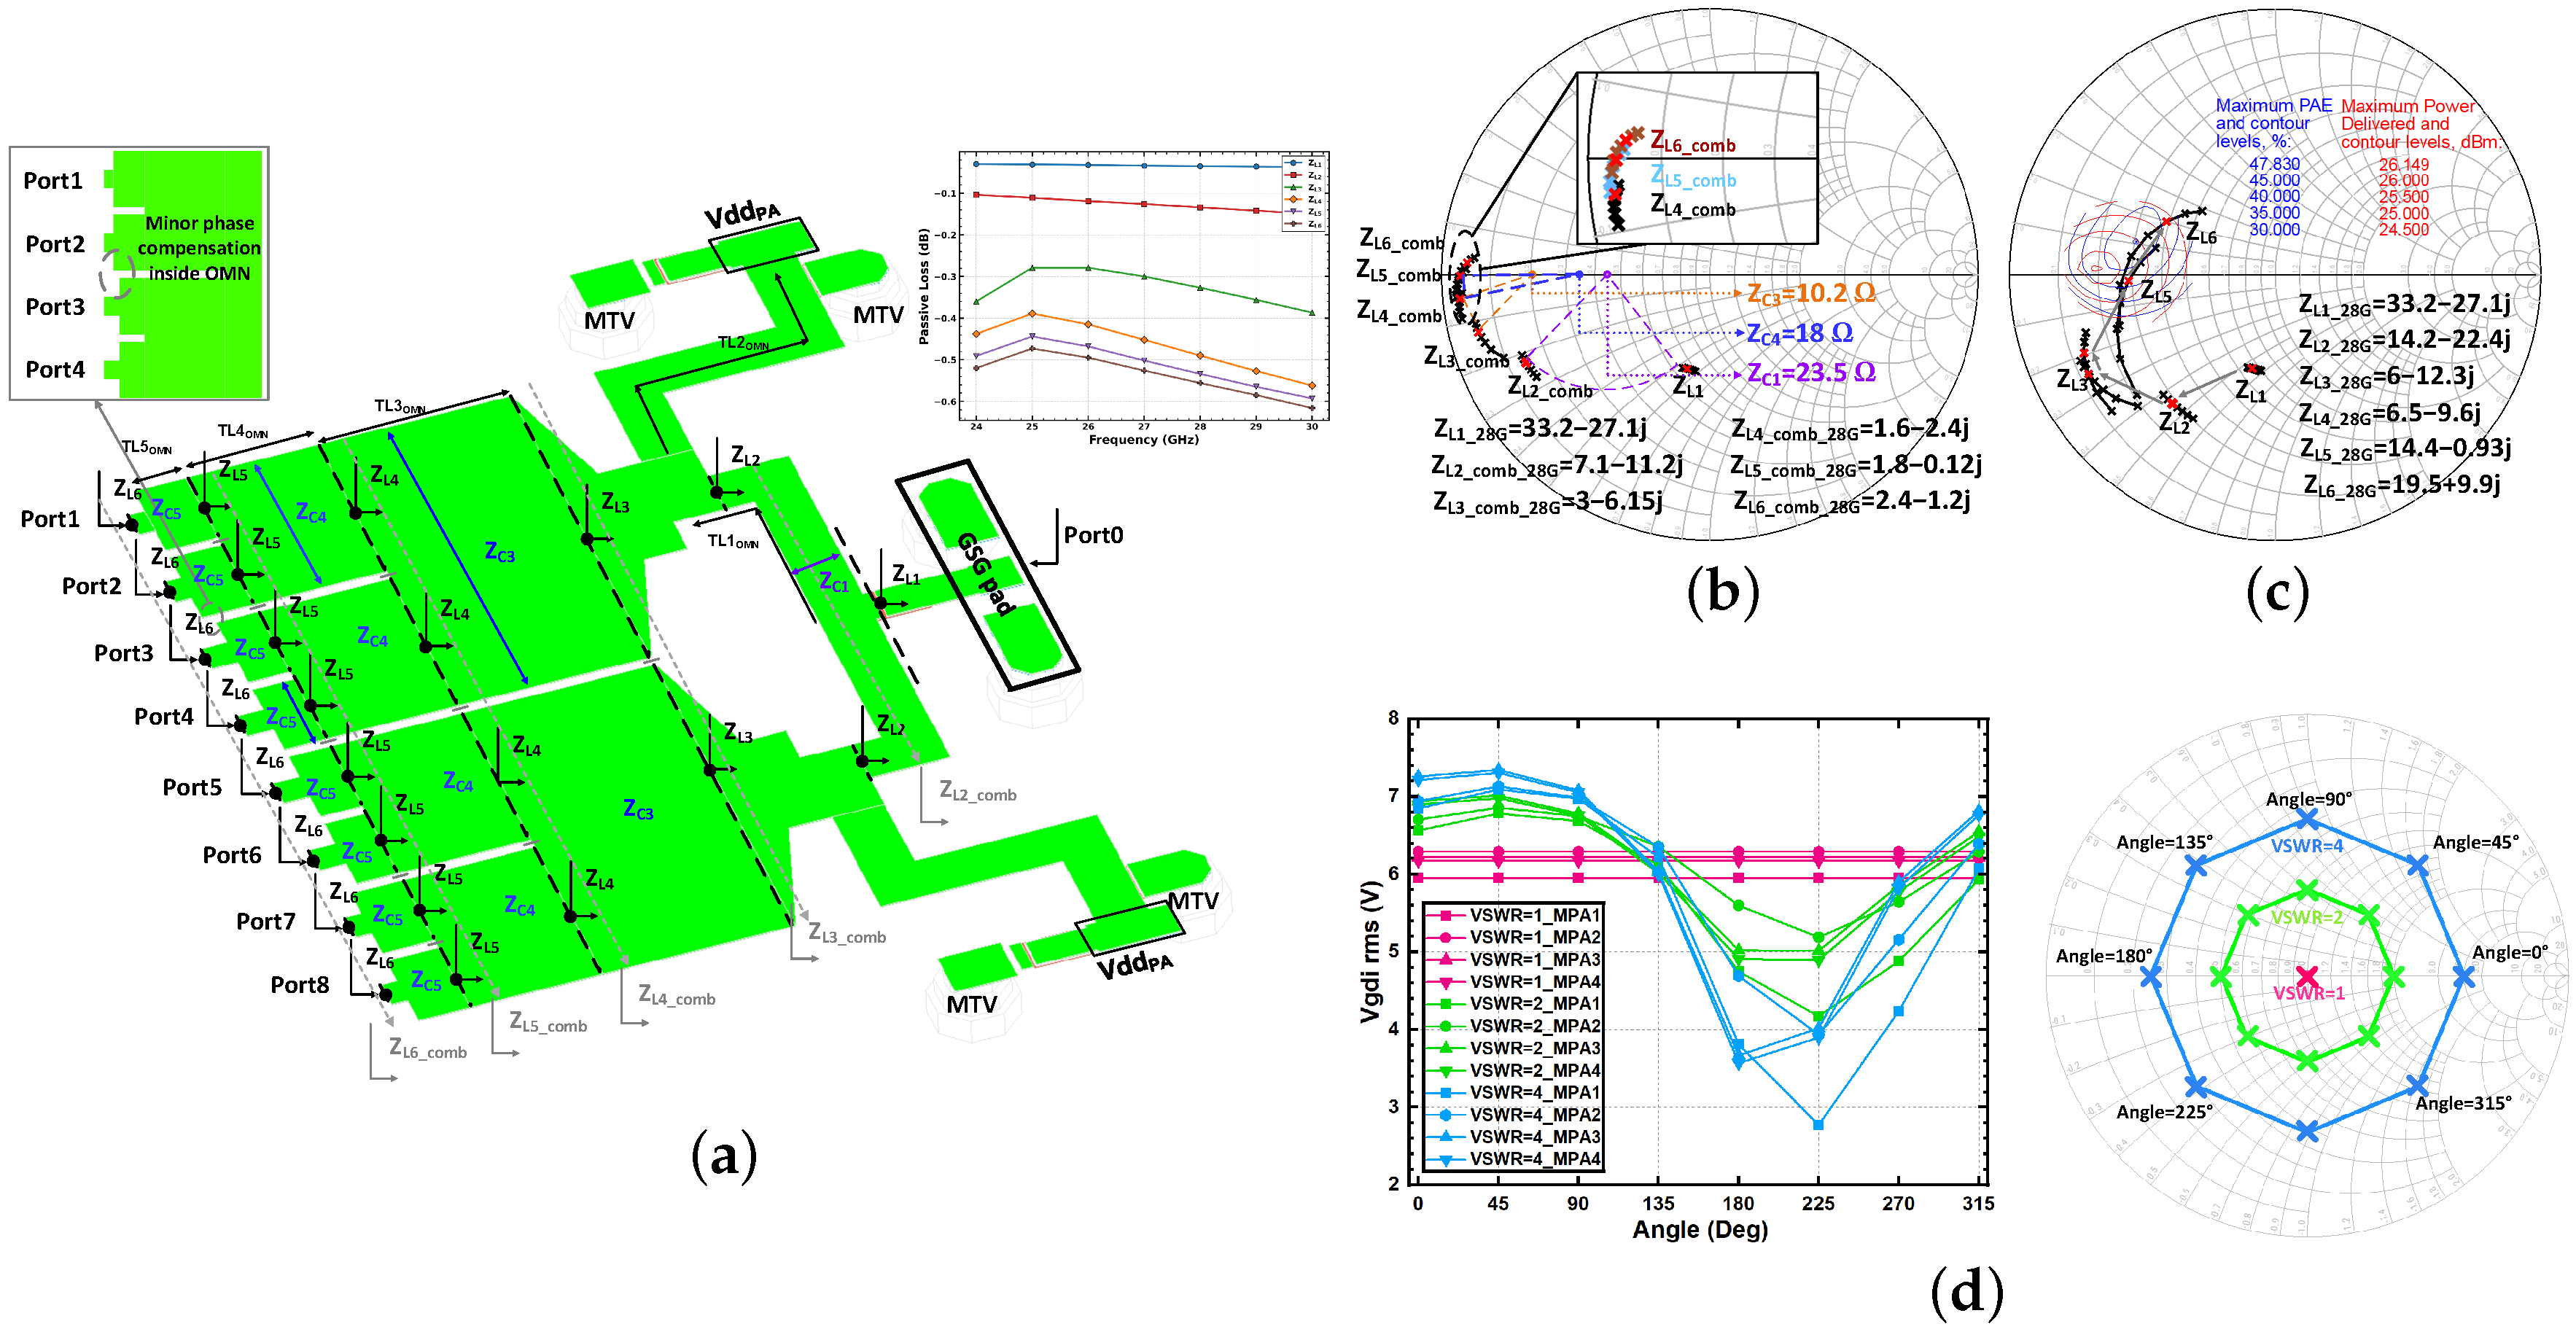
The layout of the OMN used in this work is shown in Figure 7a. The black dashed lines define virtual common reference planes. ( to 6) denotes the load impedance looking into each port towards the output. For a given i, all are connected to a virtual reference plane, and correspondingly we can define impedances ( to 6), which are 2, 4, or 8 times smaller than the impedances , corresponding to the number of parallel branches. The targeted impedance looking into the combined output of the transistors should be Zoptload/8. In Figure 7b, wide transmission lines with ( to 5) as characteristic impedance are used to efficiently transfer the 50 Ω impedance from the GSG pad to the targeted impedance (Zoptload/8). The size of the transmission lines is shown in Figure 1. To clarify the impedance transformation over the different stages, Figure 7c displays the corresponding impedance transformation trajectories for together with targeted Pout/PAE contours. Impedance is close to , indicating that the provided load impedance for each UTC is rather optimized for PAE instead of Pout.
Figure 7.
(a) Layout view of the OMN; black dashed lines define virtual common reference planes. Top curves: pure passive loss from the output GSG pad to ( to 6). ( to 6) is the load impedance seen into each port towards the output. All are connected at a virtual reference plane and we define correspondingly () such that , , , and ; (b) ( to 6) from 24 GHz to 30 GHz with 1 GHz step (black crosses, impedance at each frequency point; red crosses, impedance at 28 GHz); (c) regular impedances () seen at each node assuming all ports see an equivalent impedance; (d) rms value of Vgdi of the different transistors in the final stage for load mismatches at the overall output (VSWR = 1, 2, and 4) at different angles on the corresponding VSWR circle.
With the chosen sizes in the combiner, the variation in the rms value of Vgdi is now verified. Figure 7d depicts the variation in Vgdi,rms of transistors MPS1 to MPS4 in the final stage for variations in the load (VSWR = 1, 2, and 4) at the overall output (Port 0 in Figure 7a). On the VSWR circles, the phase angle is swept from 0° to 315° in 45° increments. It is seen that for VSWR = 2 and 4, Vgdi,rms changes significantly over this phase angle, exhibiting minima near 180°–225° and maxima near 0°–90°, primarily due to the constructive and destructive interference between incident and reflected waves at the output. Importantly, Vgdi,rms remains below 8 V under all tested mismatch scenarios.
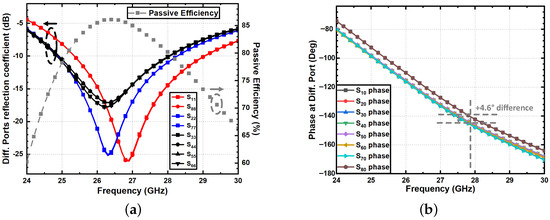
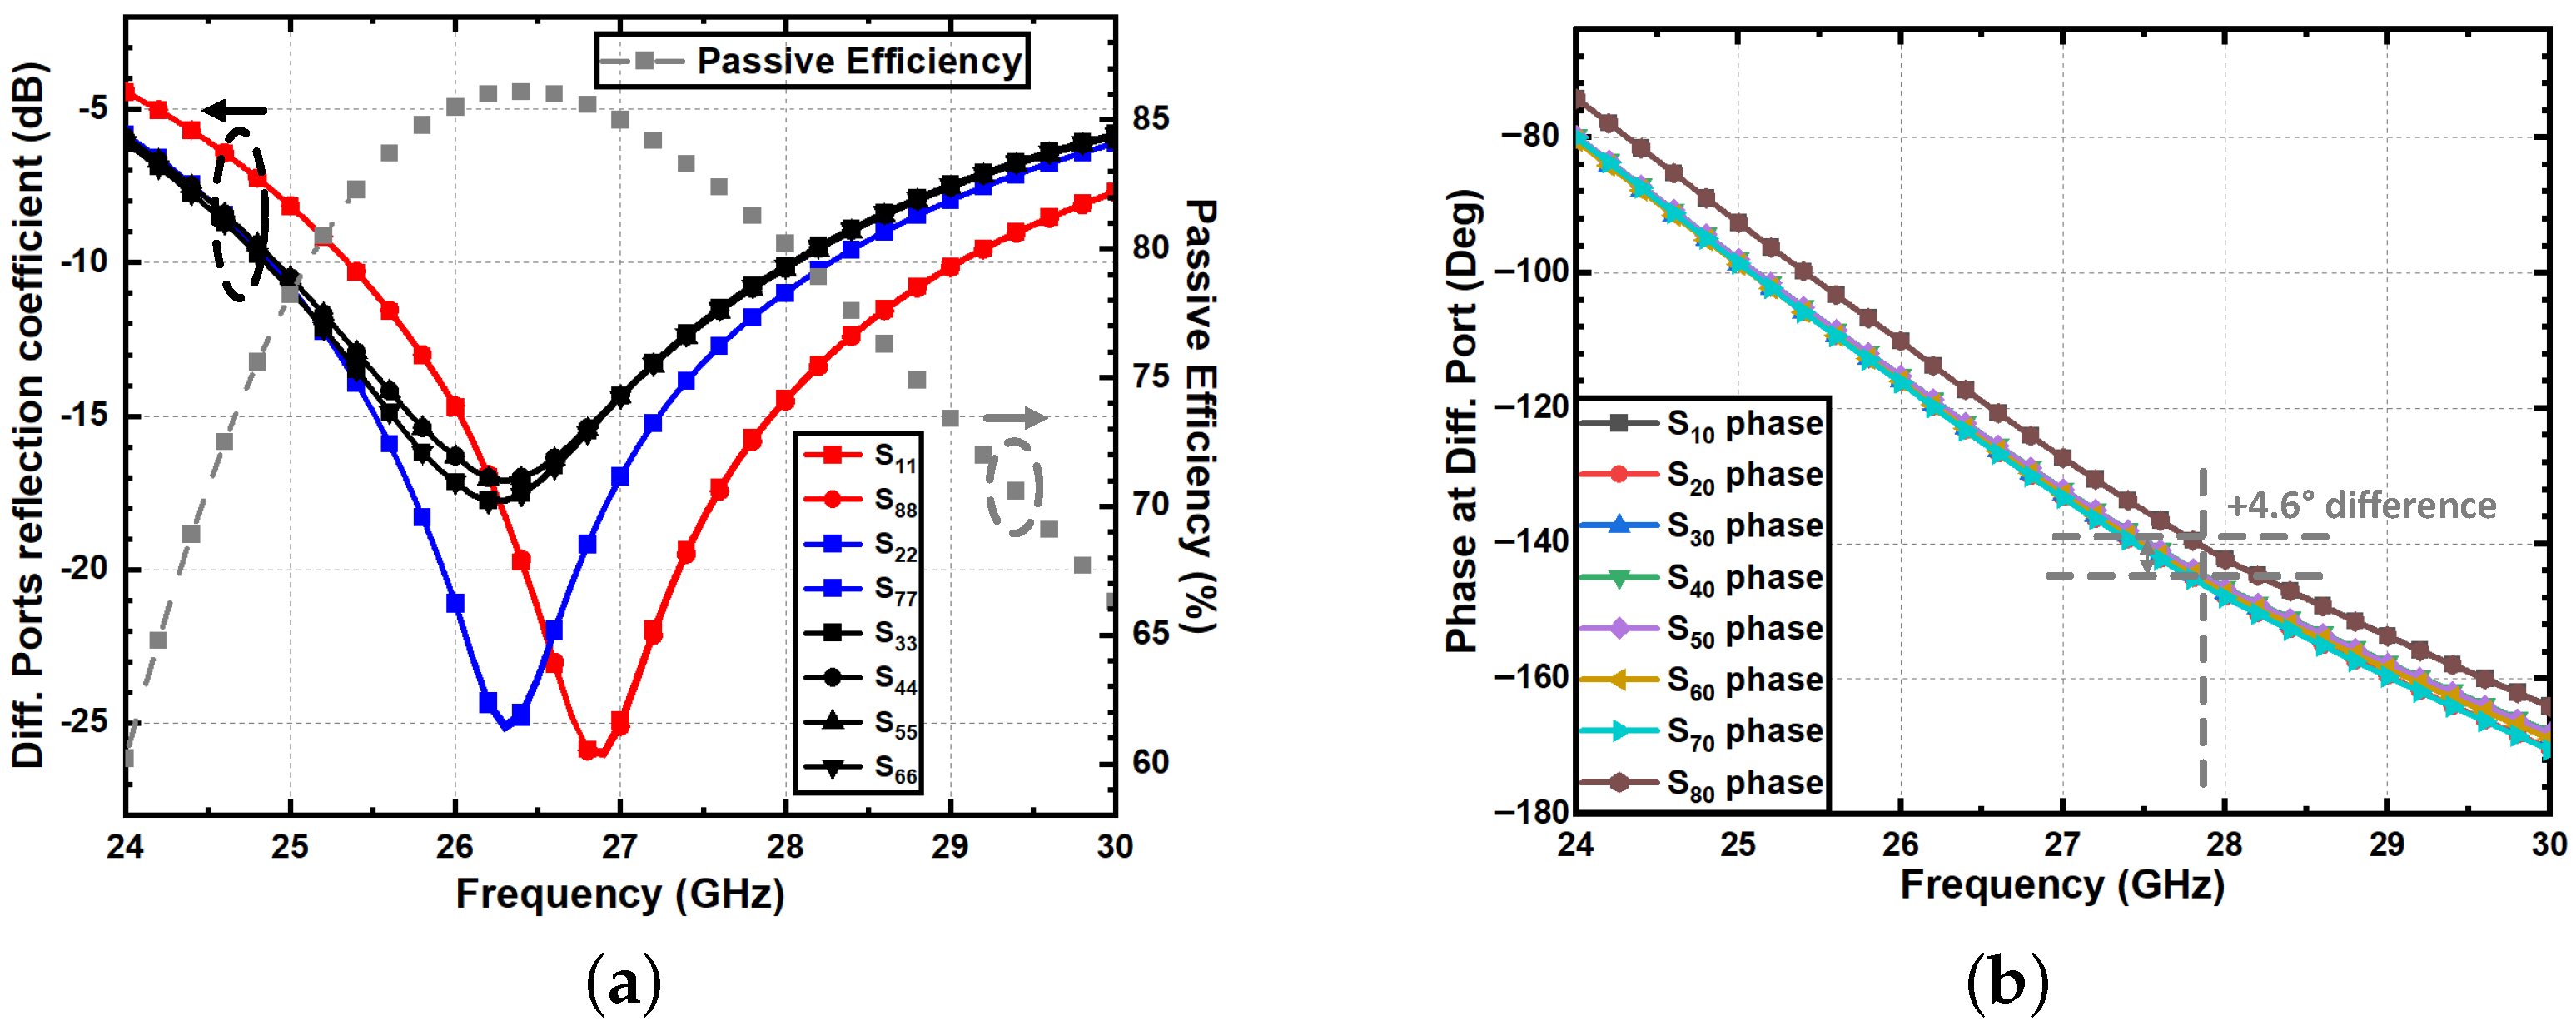
The resulting OMN has a minimum insertion loss because, in contrast with the classical topology [17], no shunt capacitors are present, except supply decoupling capacitors and a DC block at the output near the GSG pad. With the inclusion of all layout parasitics, Figure 8 shows the passive efficiency as a function of frequency. It reaches 85% at 26.5 GHz and remains near 80% from 25 to 28 GHz. This is a 10% improvement compared to Figure 6, which corresponds to a conventional design as in [17], using shunt capacitors and a single width for the transmission lines. Further, Figure 8a shows the magnitude of the reflection coefficients seen at the drain of the eight transistors MPS1 to MPS8 of the output stage. The values can be categorized into three groups. Group 1 consists of MPS3 to MPS6 in the middle of the output stage. Group 2 contains MPS1 and MPS8, which are on the outer side of the output stage, and group 3, in between groups 1 and 2, contains transistors MPS2 and MPS7. Figure 8b shows that groups 1 and 3 have almost identical phase responses, while group 2 is 4.6° ahead. This amplitude/phase asymmetry comes from (1) the deviating environment seen by the outer transistors MPS1 and MPS8 and (2) asymmetry introduced by the supply line. To further compensate for the phase differences without introducing capacitors, we provided a 20 m length difference between the transmission lines connected to ports 3 to 6 and the other ones, as shown in Figure 7a. The top traces in Figure 7a show the pure passive loss from the output GSG pad to each ( to 6). The loss remains small overall, but the largest increases occur over and , mainly due to the added bias path and irregular metal shape in the former and the longer route with strong coupling between the upper and lower metal blocks in the latter.
Figure 8.
(a) Simulated reflection coefficients – at each OMN port and passive efficiency; (b) phase of the transmission from each port to the output.
4.2. Interstage Matching and Splitter Design
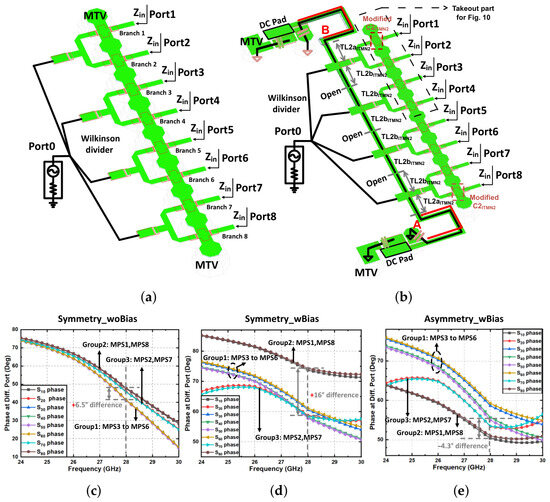
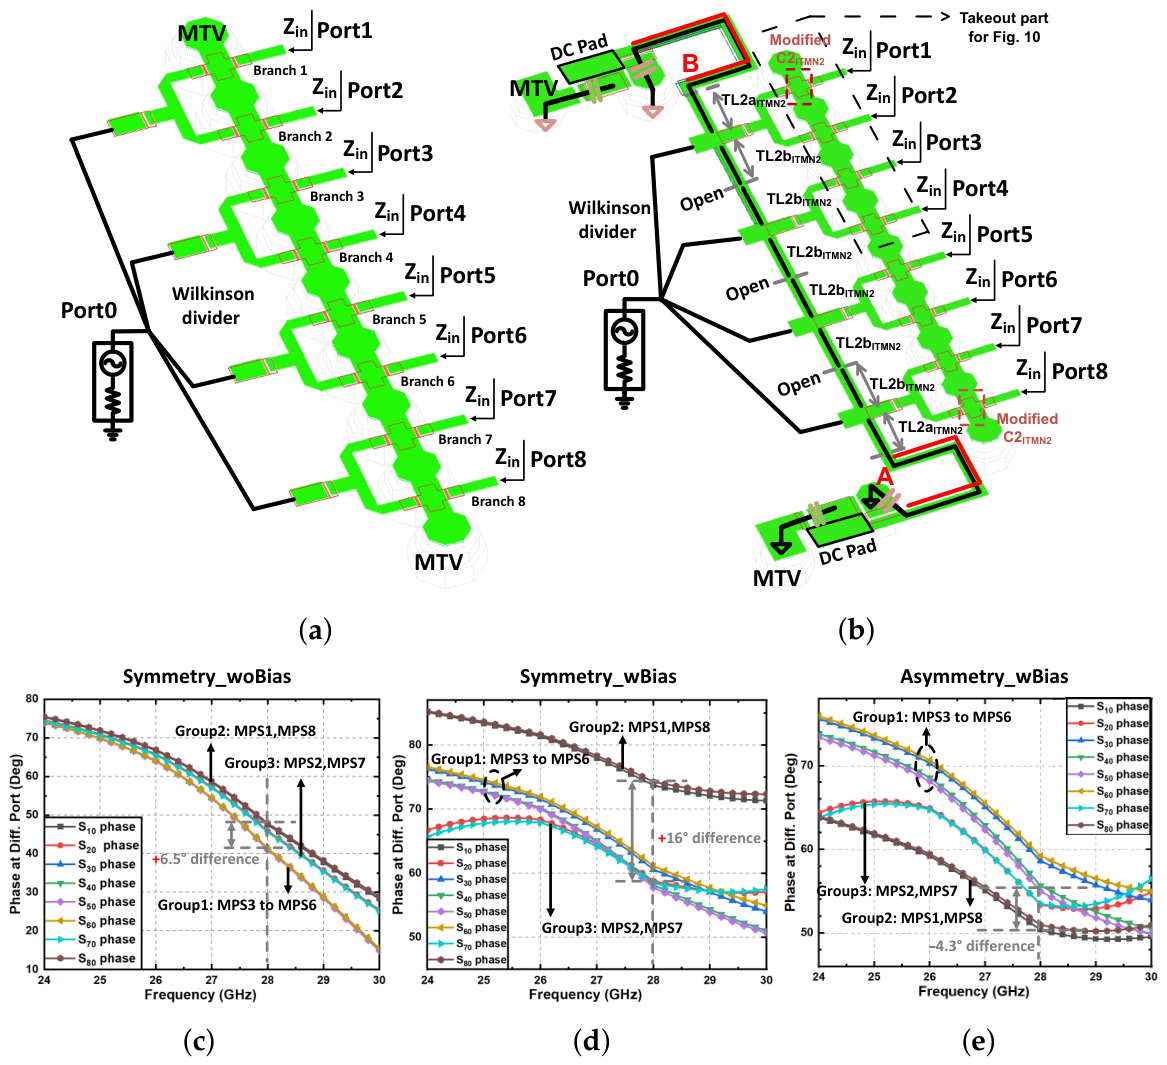
The interstage matching networks ITMN1 and ITMN2 share the same topology and are designed with the same methodology. As such, we can limit the discussion to ITMN2 only. We first analyze ITMN2 without DC bias lines (ITMN2woDC) to better understand the phase mismatches between the branches. ITMN2woDC has four input ports from driver stage DS2 and eight output ports to the final power stage. The impedance matching methodology follows that of the OMN and is omitted here for brevity. To check phase mismatches, all capacitors ( in Figure 1) are first taken identical for all branches. While simulations with an ideal divider (see Figure 9a) yield identical responses across all branches, the inclusion of layout parasitics yields phase mismatches in the transmission from port 0 to the eight ports after the splitting. These are due to differences in the surroundings of the different ports and necessitate layout-level compensations.
Figure 9.
(a) Layout of ITMN2 without bias feed lines; (b) layout including bias feed lines. The hexagonal shapes indicate MTVs; (c) phase of S-parameters (=S-parameter from port 0 to port n ()) without bias feed lines; (d) phase of including bias feed lines when all values are identical; (e) phase of including bias feed lines when branches 1 and 8 have optimally adapted values compared to other branches.
Next, we include the DC bias lines. The device spacing in DS2 is constrained by the height of the final stage (see Figure 1). Therefore, it is not feasible to bias each branch via separate quarter-wavelength lines, which are too bulky for operation around 28 GHz. Instead, we use one feed line that crosses all branches. If the four signals that feed the eight ports are all in phase, then this is equivalent to an infinite impedance between the branches. For the outer branches, a high impedance is introduced via a spiral-like inductor, as shown with the red segment of in Figure 9b. This inevitably introduces a phase difference of the signals in the outer branches relative to the other branches. To address this, both the AC short capacitor and the length of are optimized, resulting in two large impedances to ground with a magnitude of 80 Ω at 28 GHz from points A and B, instead of infinite ones. This non-ideality introduces phase mismatches among the output branches. As illustrated in Figure 9d, the phase difference between group 2 and group 1 increases to 16°, while that between group 3 and group 1 decreases. This indicates that the outer devices MPS1 and MPS8 are more affected by layout features and require additional phase compensation. Accordingly, the capacitors at branches 1 and 8 (highlighted in blue in Figure 9b) are specifically tuned to correct the phase mismatches introduced by both ITMN2 and OMN. Their final value is 273 fF (as indicated by the dark red symbol in Figure 1), compared to 236 fF for the ones in the inner branches. Including these changes, as well as all layout parasitics, yields the phases of the transmission S-parameters to the output port (port 0) as shown in Figure 9e. The phase difference between group 1 and group 3 becomes −4.3°, which can effectively counterbalance the positive 4.6° phase mismatch from the OMN. In ITMN1, placement constraints for are significantly relaxed, as DS1 includes only two HEMT devices—freeing space for bias routing. As a result, the ITMN1 exhibits much smaller asymmetries compared to ITMN2, eliminating the need for per-branch phase compensation.
4.3. Stability Verification for the Whole PA
In Section 3.2, it was shown that for one UTC the k-factor is below 1 for frequencies below 19 GHz (see Figure 2). Therefore, all matching networks are designed to ensure that the source and load impedances presented to devices below 19 GHz stay away from the unstable regions on the Smith Chart. In the frequency band of operation, the long and narrow transmission lines act as open circuits, thereby preserving the original matching network characteristics.
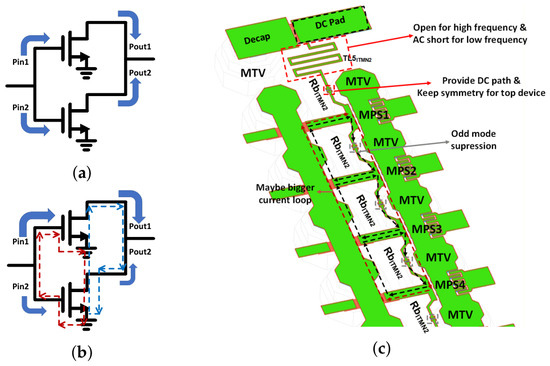
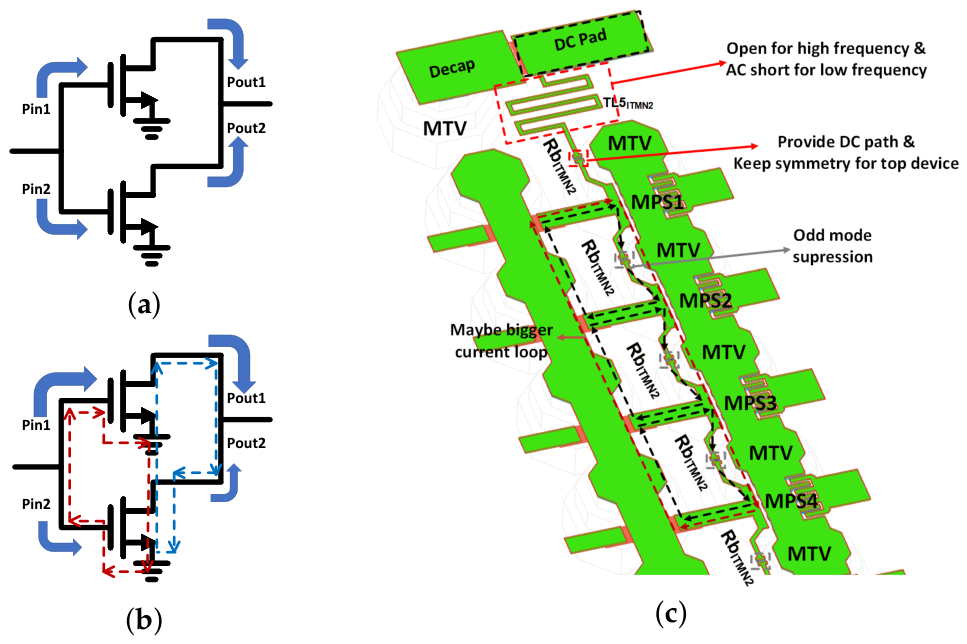
Another stability aspect is the possibility of odd-mode oscillations [30,31]. These are caused by phase/amplitude mismatches among branches due to layout asymmetries in ITMN2 and OMN, IR drops along the bias paths, and differences in grounding. In addition, small differences between transistors occur after fabrication. Those mismatches can generate odd-mode currents, leading to current loops, as depicted in Figure 10c. To illustrate this mechanism, Figure 10a,b use a simplified two-way power-combining example. In the ideal case of Figure 10a, both branches receive equal input amplitude and phase and exhibit identical gain and phase delay, so only the even mode is excited. In practice, as shown in Figure 10b, small phase/amplitude mismatches in the branch excitation and transistor response can create inter-branch feedback paths and associated current loops. If such a loop reaches an effective 180° phase shift with a loop gain above unity, odd-mode oscillation can be sustained; although the two-way example is only illustrative, similar mechanisms may occur among multiple branches and internal nodes in the complete PA. To address the potential instability, inter-branch resistors () are introduced, as suggested in [32,33]. Additionally, small resistors and are inserted between amplifier stages to suppress low-frequency oscillations while maintaining the DC gate bias.
Figure 10.
Odd-mode oscillation illustration and current loops in ITMN2: (a) ideal two-way power combining with only even-mode excitation; (b) phase/amplitude mismatches generating inter-branch feedback loops; (c) actual layout-based current loops, including loops covering adjacent branches (black) and more than two branches (red).
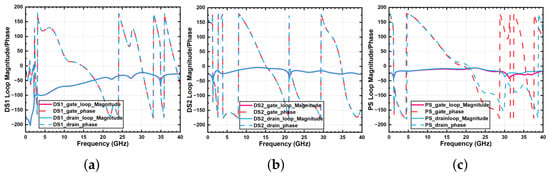
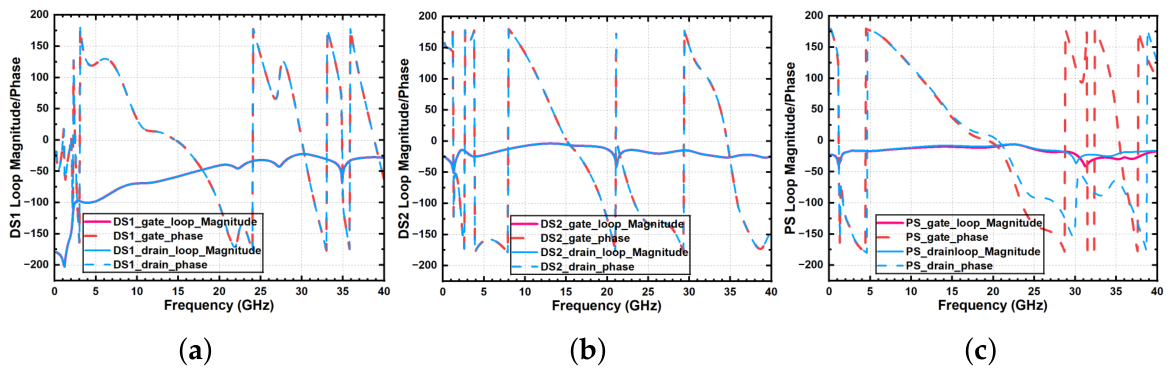
To check for potential instabilities, a Winslow probe [34] is employed at the gate and drain terminals of each transistor across all stages to evaluate the magnitude and phase of the loop gain. This enables the detection of potential odd-mode oscillations. Oscillation occurs when the magnitude of the loop gain is above 1 and the phase reaches 180°. Figure 11 shows that the proposed PA exhibits sufficient stability margins across the entire frequency range, with no signs of oscillation, particularly at low frequencies.
Figure 11.
Winslow probe loop gain magnitude and phase at the gate and drain terminals for (a) DS1, (b) DS2, and (c) PS.
5. Measurement Results
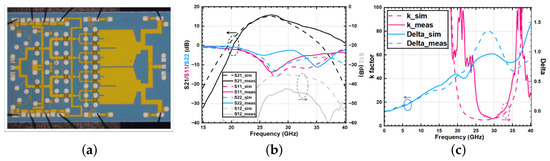
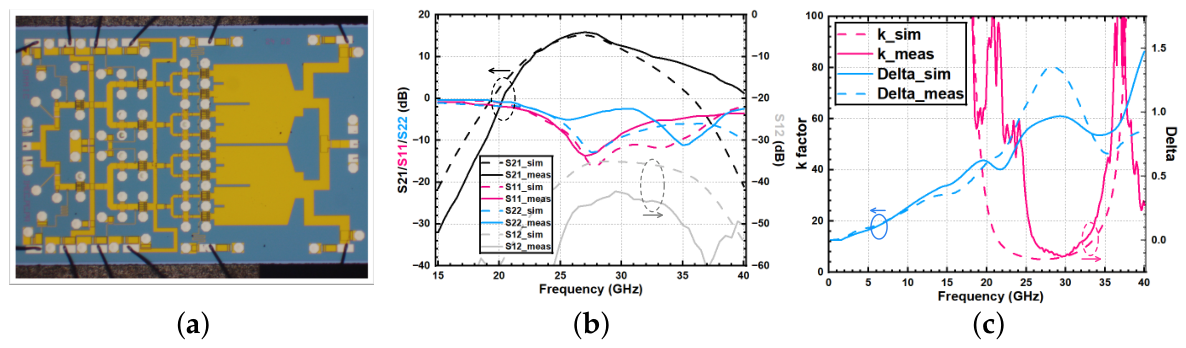
The 2-Watt PA chip, shown in Figure 12a, consumes a total quiescent current of 381 mA from a 4 V supply, consisting of 62 mA, 111 mA, and 208 mA for the DS1, DS2, and PS, respectively.
Figure 12.
(a) Chip photo (3.6 mm × 2.4 mm); (b) S-parameters; (c) k-factor and .
5.1. S-Parameter Characterization
Small-signal measurements were performed on-wafer using a Keysight N5247B PNA vector network analyzer (Keysight Technologies, Santa Rosa, CA, USA) and a Picoprobe probe rated up to 40 GHz. The measurement reference planes were moved to the probe tips through calibration. The measured S-parameters agree well with simulations, as shown in Figure 12b. The small-signal gain exceeds 12 dB across the frequency range of 25–28 GHz, reaching its peak of 15.8 dB at 27 GHz. In this frequency band, the input reflection coefficient remains below −10 dB. is below −40 dB, indicating good reverse isolation. As shown in Figure 12c, the unconditional stability criteria and are satisfied from 0 to 40 GHz.
5.2. Large-Signal Characterization
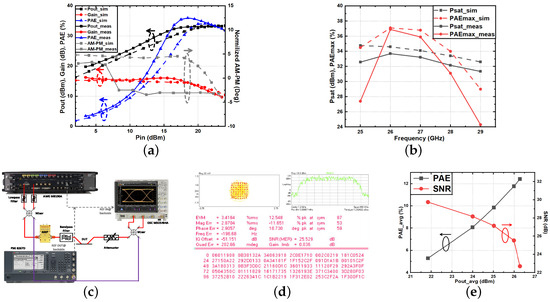
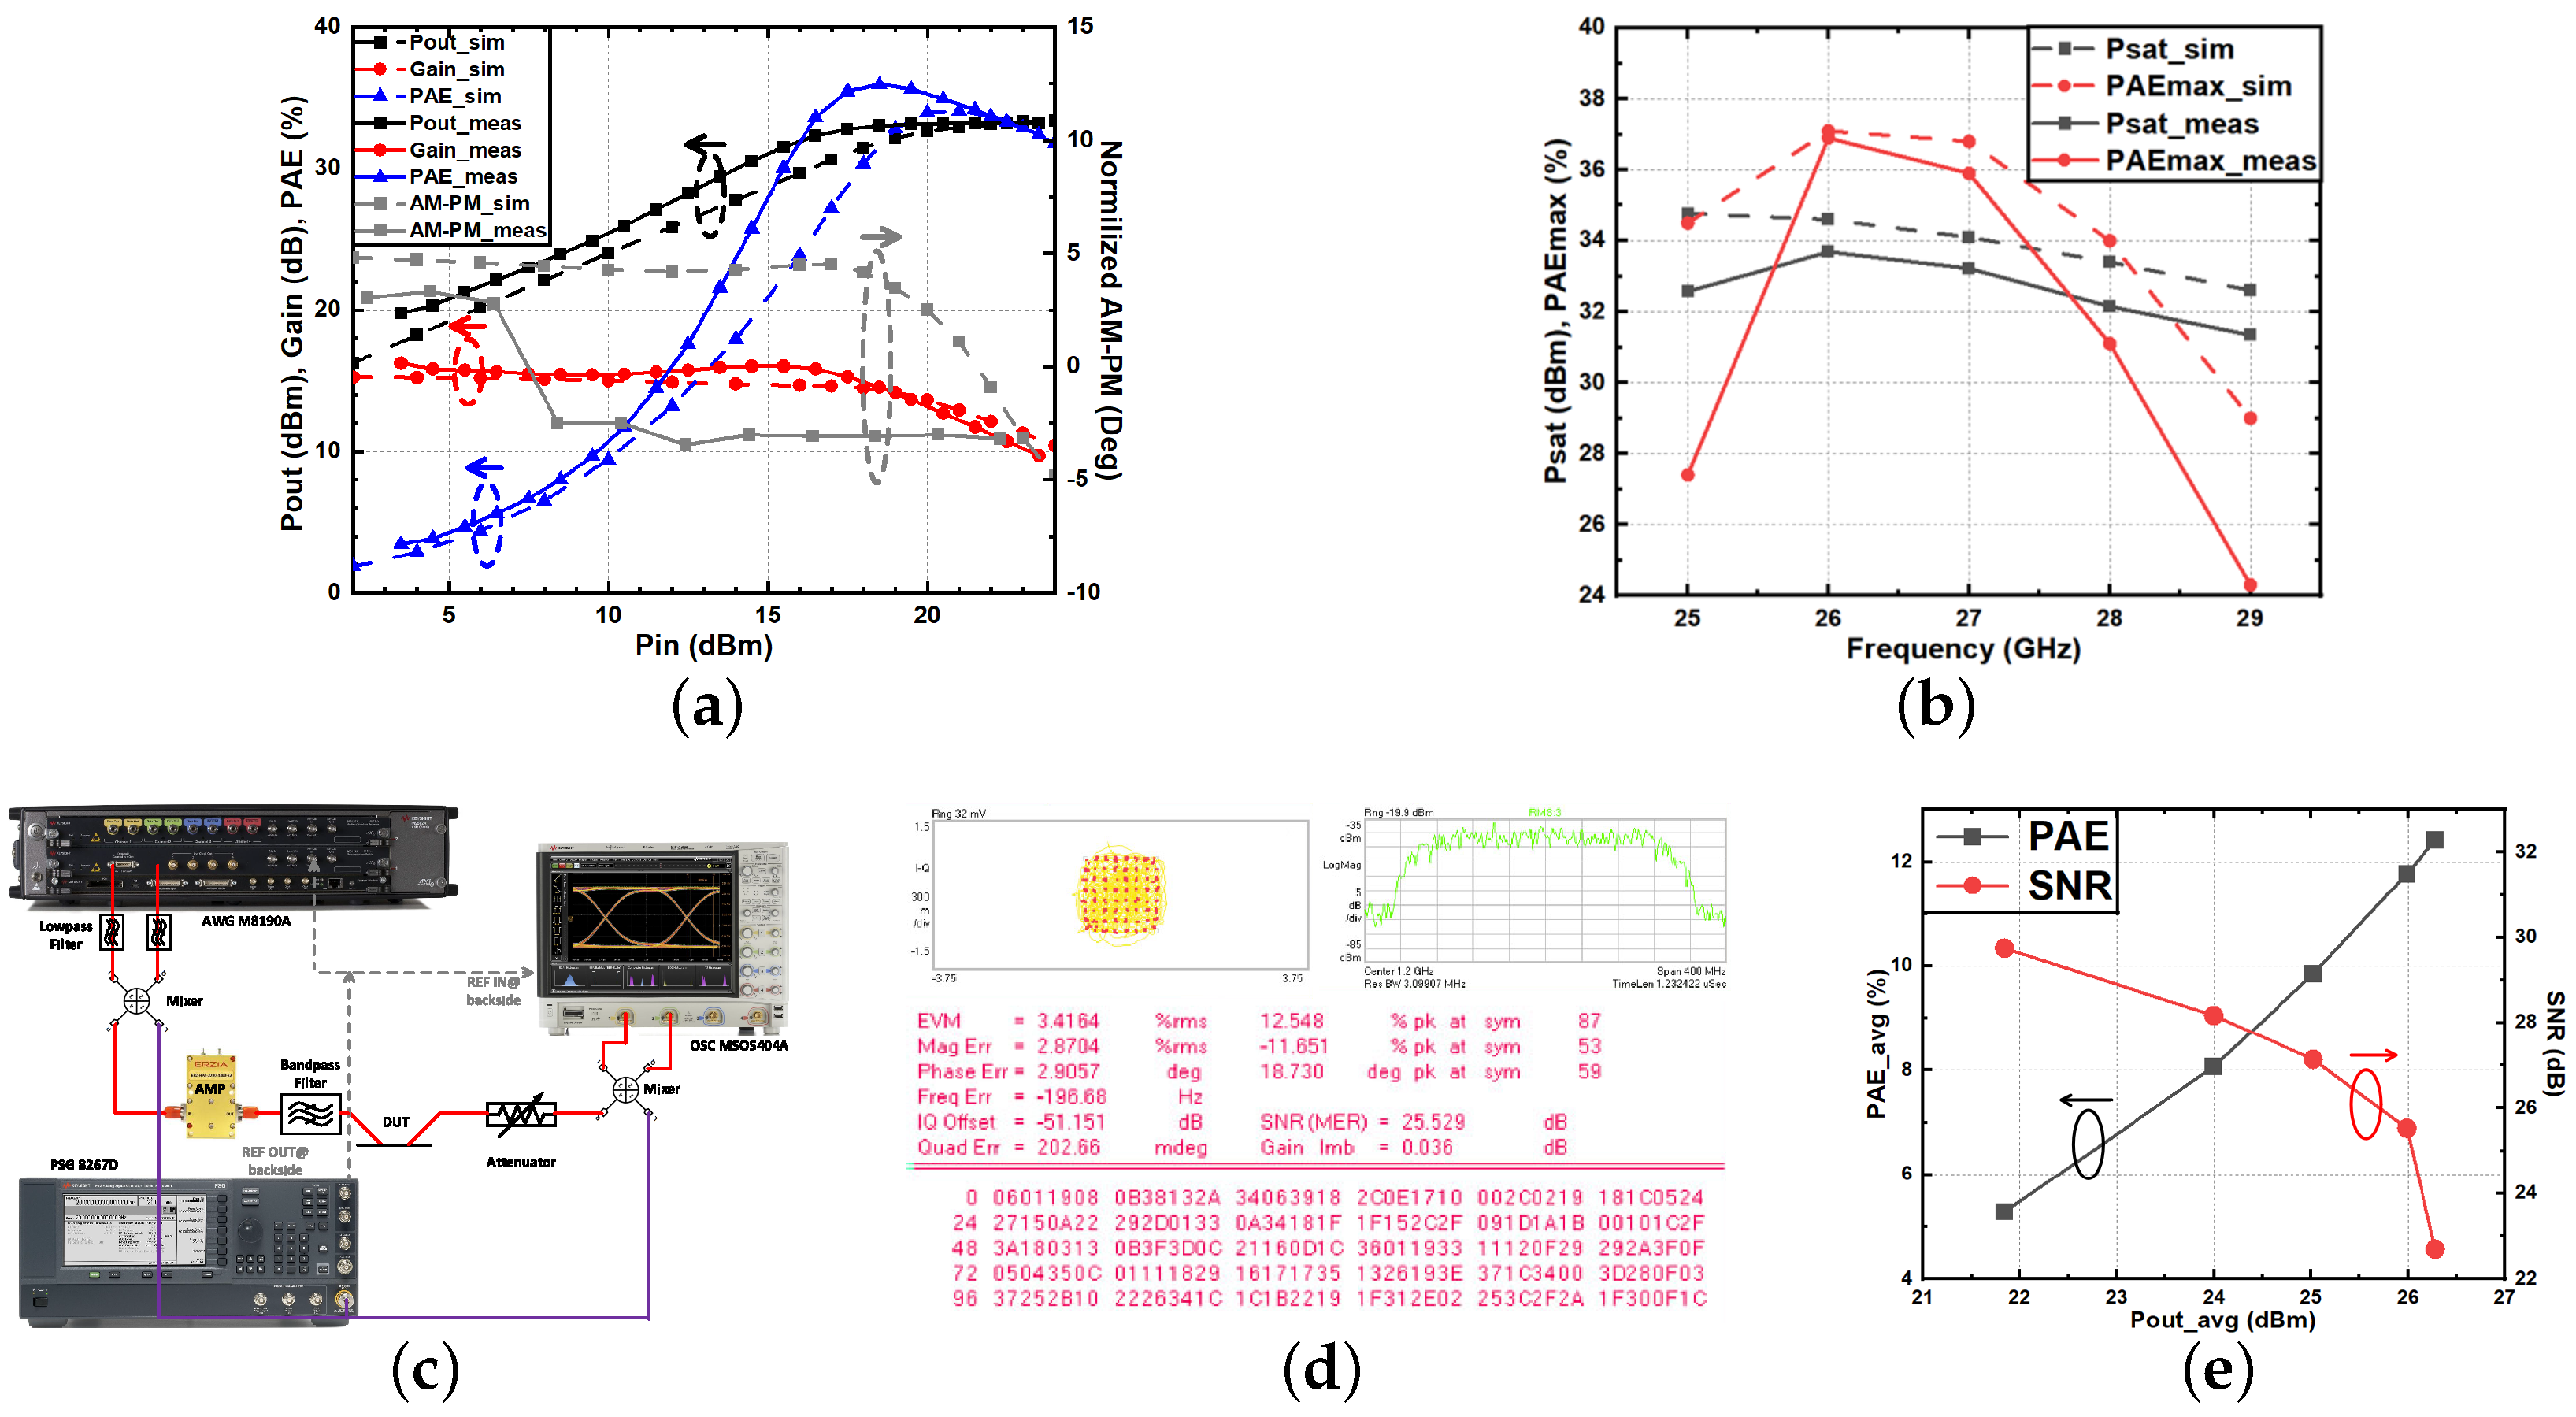
Large-signal measurements were carried out using a Keysight E8267D PSG signal generator (Keysight Technologies, Santa Rosa, CA, USA) to sweep the input power over frequency. Because the DUT output power exceeded the maximum allowable input of the Keysight U8488A power sensor (Keysight Technologies, Santa Rosa, CA, USA), a 30 dB attenuator was inserted between the output probe and the power sensor. Figure 13a,b show that the measured OP1dB and Psat are 32.9 dBm and 33.2 dBm, respectively, compared with simulated values of 32.2 dBm and 33.4 dBm. The gain variation remains within 1 dB from low input power up to OP1dB. The measured PAE at OP1dB is %, with a peak PAE of %. Over 25–29 GHz, the measured PAE ranges from 24% to 37%, peaking near 26 GHz, while Psat stays above 31 dBm; the stricter PAE > 24% window is 25–28 GHz.
Figure 13.
(a) Large-signal performance comparison at 27 GHz; (b) large-signal performance comparison from 25 to 29 GHz; (c) 64-QAM measurement setup; (d) measured 64-QAM constellation and spectrum at 27 GHz; (e) measured average PAE and SNR versus average output power at 27 GHz.
This corresponds to about 15% fractional bandwidth, which is comparable to [35,36] and narrower than the differential-end design in [37], where the balun also serves as a bandwidth-extending element. For a single-ended design, further bandwidth extension would require higher-order LC/CL matching sections, whose added capacitors would increase passive loss and offset the efficiency benefit of the transmission-line-only network. Although the measured compression starts slightly earlier than in simulation, the overall agreement confirms the effectiveness of the heat-dissipation strategy using shared MTVs between adjacent transistors and indicates that self-heating is well controlled [38,39]. In addition, a noticeable AM–PM variation appears at relatively low input power because of the narrowband matching network used in each stage [40]; this can be reduced by broadband matching or by slightly shifting the operating point away from the center frequency. The remaining discrepancy between simulated and measured PAE is likely caused by two factors. First, the transistor model is only validated up to 40 GHz, whereas the second and third harmonics extend beyond that range. Second, the cascaded matching chain still introduces residual mismatch together with passive-network loss. At 27 GHz, the extracted whole-network losses are 1.19 dB for the IMN, 2.08 dB for ITMN1, 1.96 dB for ITMN2, and 0.69 dB for the OMN. Unlike the pure-passive loss check in Section 4.1, these values represent the complete networks and therefore include both matching-related and passive losses, which can directly reduce the measured Pout and PAE.
The modulated signal measurement setup is shown in Figure 13c. A modulated waveform was generated by a Keysight M8190A AWG (Keysight Technologies, Santa Rosa, CA, USA) at 12 GSa/s, digitally upconverted to an IF of about 1 GHz, filtered by a Mini-Circuits ZFBT-6GW+ (Mini-Circuits, Brooklyn, NY, USA) to suppress AWG DC leakage, and applied to a Marki MMIQ-1865L passive mixer (Marki Microwave, Morgan Hill, CA, USA). A Keysight E8267D PSG (Keysight Technologies, Santa Rosa, CA, USA) provided a 25-GHz, 10-dBm LO signal, and the upconverted 27-GHz modulated signal was amplified by an ERZIA ERZ-HPA-2600-4000-33 driver (ERZIA Technologies, Santander, Spain) before being delivered to the DUT through a cable and probe. The driver was operated in its linear region, with less than 0.1 dB compression at the waveform peak while still providing sufficient average power to drive the DUT into compression. At the output, a 30 dB attenuator protected the downconversion mixer, after which the signal was downconverted to a 1 GHz IF, captured by a Keysight MSOS404A oscilloscope (Keysight Technologies, Santa Rosa, CA, USA) at 25 GSa/s, and processed in Keysight 89600 VSA software (Keysight Technologies, Santa Rosa, CA, USA). The PSG 10 MHz reference synchronized the AWG and oscilloscope, and the reference planes were shifted to the probe tips through calibration. All instrument control operations were carried out through MATLAB R2024b (MathWorks, Natick, MA, USA). The PA was then evaluated using a 64 QAM signal at 27 GHz with a 250 MHz symbol rate. With a roll-off factor of 0.35, the modulated signal has an instantaneous bandwidth of 337 MHz. The waveform exhibits a 6.3 dB peak-to-average power ratio (PAPR), closely emulating a 5G NR signal with crest factor reduction [41]. As shown in Figure 13d, the measured rms EVM without digital predistortion (DPD) is 3.4%, corresponding to an SNR of 25.5 dB, while the average output power and PAE are 26.3 dBm and 12.2%, respectively. Figure 13e shows the corresponding output–backoff efficiency–SNR trade-off: as the average output power is backed off, the average PAE decreases while the SNR improves.
Table 2 compares the proposed design with state-of-the-art K/Ka-band PAs. The results demonstrate that this PA achieves competitive PAE and output power while maintaining a compact chip area—making it suitable for handheld device applications.
Table 2.
Performance comparison table.
6. Conclusions
This paper presents a three-stage PA for 5G mm wave applications in GaAs technology, using a low-loss 8-way power-combining network based only on microstrip lines to preserve high power-added efficiency. Amplitude and phase asymmetries among the output branches are compensated by tailoring distributed and capacitive components within the interstage and output matching networks. Experimental results demonstrate that the designed amplifier maintains a peak power above 31 dBm from 25 to 29 GHz, while the PAE remains above 24% from 25 to 28 GHz. The proposed amplifier serves as a versatile building block within larger phased-array systems while adhering to stringent system requirements.
Author Contributions
Conceptualization, Y.Z.; methodology, D.Y. and Y.Z.; software, D.Y.; validation, D.Y.; formal analysis, D.Y.; writing—original draft preparation, D.Y.; writing—review and editing, D.P., M.I. and P.W.; supervision, M.I. and P.W.; project administration, M.I. and P.W. All authors have read and agreed to the published version of the manuscript.
Funding
This research received no external funding.
Data Availability Statement
Data are contained within the article.
Acknowledgments
The authors would like to acknowledge Hans Suys for his assistance with printed circuit board fabrication and soldering.
Conflicts of Interest
The authors declare no conflicts of interest.
References
- Pi, Z.; Khan, F. An introduction to millimeter-wave mobile broadband systems. IEEE Commun. Mag. 2011, 49, 101–107. [Google Scholar] [CrossRef] [Scilit]
- Rangan, S.; Rappaport, T.S.; Erkip, E. Millimeter-wave cellular wireless networks: Potentials and challenges. Proc. IEEE 2014, 102, 366–385. [Google Scholar] [CrossRef] [Scilit]
- Ali, S.A.; Wajid, M.; Kumar, A.; Alam, M.S. Design challenges and possible solutions for 5G SIW MIMO and phased array antennas: A review. IEEE Access 2022, 10, 88567–88594. [Google Scholar] [CrossRef] [Scilit]
- Xia, X.; Yu, C.; Wu, F.; Jiang, Z.H.; Li, Y.L.; Yao, Y.; Hong, W. Millimeter-wave phased array antenna integrated with the industry design in 5G/B5G smartphones. IEEE Trans. Antennas Propag. 2023, 71, 1883–1888. [Google Scholar] [CrossRef] [Scilit]
- Khan, B.; Tervo, N.; Jokinen, M.; Parssinen, A.; Juntti, M. Statistical digital predistortion of 5G millimeter-wave RF beamforming transmitter under random amplitude variations. IEEE Trans. Microw. Theory Tech. 2022, 70, 4284–4296. [Google Scholar] [CrossRef] [Scilit]
- IEEE Future Networks. IEEE International Network Generations Roadmap (INGR): Hardware, 1st ed.; Available online: https://futurenetworks.ieee.org/images/files/images/roadmap/INGR_Hardware_Ed1.pdf (accessed on 23 March 2026).
- Liu, Y.; Xia, X.; Zhang, Q.; Pan, W.; Shao, S.; Tang, Y. Digital predistortion utilizing over-the-air feedback for phased arrays. IEEE Access 2021, 9, 37064–37074. [Google Scholar] [CrossRef] [Scilit]
- Zanen, J.; Klumperink, E.; Nauta, B. Power efficiency model for MIMO transmitters including memory polynomial digital predistortion. IEEE Trans. Circuits Syst. II Exp. Briefs 2021, 68, 1183–1187. [Google Scholar] [CrossRef] [Scilit]
- Brihuega, A.; Abdelaziz, M.; Anttila, L.; Turunen, M.; Allén, M.; Eriksson, T.; Valkama, M. Piecewise digital predistortion for mmWave active antenna arrays: Algorithms and measurements. IEEE Trans. Microw. Theory Tech. 2020, 68, 4000–4017. [Google Scholar] [CrossRef] [Scilit]
- Kibaroglu, K.; Sayginer, M.; Phelps, T.; Rebeiz, G.M. A 64-element 28-GHz phased-array transceiver with 52-dBm EIRP and 8–12-Gb/s 5G link at 300 meters without any calibration. IEEE Trans. Microw. Theory Tech. 2018, 66, 5796–5811. [Google Scholar] [CrossRef] [Scilit]
- Dunworth, J.; Ku, B.H.; Ou, Y.C.; Lu, D.; Mouat, P.; Homayoun, A.; Chakraborty, K.; Arnett, A.; Liu, G.; Chakraborty, K.; et al. 28 GHz phased array transceiver in 28 nm bulk CMOS for 5G prototype user equipment and base stations. In Proceedings of the 2018 IEEE/MTT-S International Microwave Symposium (IMS), Philadelphia, PA, USA, 10–15 June 2018; IEEE: Piscataway, NJ, USA, 2018; pp. 1330–1333. [Google Scholar]
- Shakib, S.; Elkholy, M.; Dunworth, J.; Aparin, V.; Entesari, K. A wideband 28-GHz transmit–receive front-end for 5G handset phased arrays in 40-nm CMOS. IEEE Trans. Microw. Theory Tech. 2019, 67, 2946–2963. [Google Scholar] [CrossRef] [Scilit]
- Shakib, S.; Park, H.C.; Dunworth, J.; Aparin, V.; Entesari, K. A highly efficient and linear power amplifier for 28-GHz 5G phased array radios in 28-nm CMOS. IEEE J. Solid-State Circuits 2016, 51, 3020–3036. [Google Scholar] [CrossRef] [Scilit]
- Sadhu, B.; Tousi, Y.; Hallin, J.; Sahl, S.; Reynolds, S.K.; Renström, Ö.; Sjögren, K.; Haapalahti, O.; Mazor, N.; Bokinge, B.; et al. A 28-GHz 32-element TRX phased-array IC with concurrent dual-polarized operation and orthogonal phase and gain control for 5G communications. IEEE J. Solid-State Circuits 2017, 52, 3373–3391. [Google Scholar] [CrossRef] [Scilit]
- User Equipment (UE) Radio Transmission and Reception. Available online: https://www.etsi.org/deliver/etsi_ts/138100_138199/13810102/15.04.00_60/ts_13810102v150400p.pdf (accessed on 23 March 2026).
- Alizadeh, A.; Frounchi, M.; Medi, A. On design of wideband compact-size Ka/Q-band high-power amplifiers. IEEE Trans. Microw. Theory Tech. 2016, 64, 1831–1842. [Google Scholar] [CrossRef] [Scilit]
- Campbell, C.F.; Dumka, D.C.; Kao, M.-Y.; Fanning, D.M. High efficiency Ka-band power amplifier MMIC utilizing a high voltage dual field plate GaAs PHEMT process. In Proceedings of the 2011 IEEE Compound Semiconductor Integrated Circuit Symposium (CSICS), Waikoloa, HI, USA, 16–19 October 2011; IEEE: Piscataway, NJ, USA, 2011; pp. 1–4. [Google Scholar]
- Yan, D.; Park, S.; Zhang, Y.; Peumans, D.; Ingels, M.; Wambacq, P. A differential GaN power amplifier with <1° AM-PM distortion for 5G mm-wave applications. In Proceedings of the 2023 18th European Microwave Integrated Circuits Conference (EuMIC), Berlin, Germany, 18–19 September 2023; IEEE: Piscataway, NJ, USA, 2023; pp. 80–83. [Google Scholar]
- Zhang, J.; Wu, T.; Nie, L.; Wei, D.; Ma, S.; Ren, J. A 20–30 GHz compact PHEMT power amplifier using coupled-line based MCCR matching technique. In Proceedings of the 2020 IEEE/MTT-S International Microwave Symposium (IMS), Los Angeles, CA, USA, 4–6 August 2020; IEEE: Piscataway, NJ, USA, 2020; pp. 956–959. [Google Scholar]
- Zhang, J.; Nie, L.; Chen, Y.; Ren, J.; Ma, S. A 6.5-mm2 10.5–15.5-GHz differential GaN PA with coupled-line-based matching networks achieving 10-W peak Psat and 42% PAE. IEEE Trans. Circuits Syst. II Exp. Briefs 2022, 69, 4268–4272. [Google Scholar] [CrossRef] [Scilit]
- Fujii, K. Low-cost Ka-band 7 W GaAs PHEMT based HPA with GaN PHEMT equivalent performance. In Proceedings of the 2015 IEEE Radio Frequency Integrated Circuits Symposium (RFIC), Phoenix, AZ, USA, 17–19 May 2015; IEEE: Piscataway, NJ, USA, 2015; pp. 207–210. [Google Scholar]
- Ramella, C.; Pirola, M.; Colantonio, P. A Ka-band 33 dBm stacked power amplifier cell in 100 nm GaN-on-Si technology. In Proceedings of the 2020 23rd International Microwave and Radar Conference (MIKON), Warsaw, Poland, 5–8 October 2020; IEEE: Piscataway, NJ, USA, 2020; pp. 204–208. [Google Scholar]
- Cao, J.; Wang, X.W.; Quek, C.K.; Singh, R.; Nakamura, H. A 3.2 V, 45% efficient, novel Class AB+C CDMA MMIC power amplifier using quasi enhancement mode PHEMTs. In Proceedings of the 2000 IEEE Radio Frequency Integrated Circuits (RFIC) Symposium, Boston, MA, USA, 10–13 June 2000; IEEE: Piscataway, NJ, USA, 2000; pp. 93–96. [Google Scholar]
- Chang, J.; Lin, Y. DC 10.5 GHz complementary metal oxide semiconductor distributed amplifier with RC gate terminal network for ultra-wideband pulse radio systems. IET Microw. Antennas Propag. 2012, 6, 127–134. [Google Scholar] [CrossRef] [Scilit]
- Tkachenko, Y.A.; Bao, J.W.; Wei, C.J.; Hwang, J.C.M. Waveform Analysis of GaAs FET Breakdown. In Proceedings of the IEEE Princeton Section Sarnoff Symposium, Princeton, NJ, USA, 28 April 1995; IEEE: Piscataway, NJ, USA, 1995; pp. 46–49. [Google Scholar]
- Larcher, L.; Sanzogni, D.; Brama, R.; Mazzanti, A.; Svelto, F. Oxide breakdown after RF stress: Experimental analysis and effects on power amplifier operation. In Proceedings of the 2006 IEEE International Reliability Physics Symposium (IRPS), San Jose, CA, USA, 26–30 March 2006; IEEE: Piscataway, NJ, USA, 2006; pp. 283–288. [Google Scholar]
- Munzer, D.; Mannem, N.; Garay, E.; Wang, H. A broadband mm-wave VSWR-resilient joint true-power detector and impedance sensor supporting single-ended antenna interfaces. In Proceedings of the 2022 IEEE International Solid-State Circuits Conference (ISSCC), San Francisco, CA, USA, 20–26 February 2022; IEEE: Piscataway, NJ, USA, 2022; Volume 65, pp. 1–3. [Google Scholar]
- Boroujeni, S.R.; Al-Saedi, H.; Nezhad-Ahmadi, M.-R.; Safavi-Naeini, S. Investigation of active load pulling effect on radiated power of the antenna elements in a finite phased array transmitter for satellite communication. In Proceedings of the 2018 IEEE International Symposium on Antennas and Propagation & USNC/URSI National Radio Science Meeting, Boston, MA, USA, 8–13 July 2018; IEEE: Piscataway, NJ, USA, 2018; pp. 2159–2160. [Google Scholar]
- Camarchia, V.; Quaglia, R.; Piacibello, A.; Nguyen, D.P.; Wang, H.; Pham, A.V. A review of technologies and design techniques of millimeter-wave power amplifiers. IEEE Trans. Microw. Theory Tech. 2020, 68, 2957–2983. [Google Scholar] [CrossRef] [Scilit]
- Costantini, A.; Vannini, G.; Filicori, F.; Santarelli, A. Stability analysis of multi-transistor microwave power amplifiers. In Proceedings of the GaAs Application Symposium, Paris, France, 2–6 October 2000. [Google Scholar]
- Anakabe, A.; Collantes, J.M.; Portilla, J.; Mons, S.; Mallet, A. Detecting and avoiding odd-mode parametric oscillations in microwave power amplifiers. Int. J. RF Microw. Comput. Aided Eng. 2005, 15, 469–478. [Google Scholar] [CrossRef] [Scilit]
- Freitag, R.G.; Lee, S.H.; Krafcsik, D.M.; Dawson, D.E.; Degenford, J.E. Stability and improved circuit modeling considerations for high power MMIC amplifiers. In Proceedings of the IEEE 1988 Microwave and Millimeter-Wave Monolithic Circuits Symposium, New York, NY, USA, 24–25 May 1988; IEEE: Piscataway, NJ, USA, 1988; pp. 125–128. [Google Scholar]
- Anakabe, A.; Collantes, J.M.; Portilla, J.; Jugo, J.; Mallet, A.; Lapierre, L.; Fraysse, J.P. Analysis and elimination of parametric oscillations in monolithic power amplifiers. In Proceedings of the 2002 IEEE MTT-S International Microwave Symposium, Seattle, WA, USA, 2–7 June 2002; IEEE: Piscataway, NJ, USA, 2002; pp. 2181–2184. [Google Scholar]
- Winslow, T.A. A novel CAD probe for bidirectional impedance and stability analysis. In Proceedings of the 2018 IEEE/MTT-S International Microwave Symposium-IMS, Philadelphia, PA, USA, 10–15 June 2018; IEEE: Piscataway, NJ, USA, 2018; pp. 1032–1035. [Google Scholar]
- Xie, H.; Fan, Y.; Li, W.Y.; Wang, L.; Cheng, Y.J. A Ka-band watt-level high-efficiency Doherty amplifier MMIC in 90-nm GaAs technology. IEEE Microw. Wirel. Technol. Lett. 2023, 33, 204–207. [Google Scholar] [CrossRef] [Scilit]
- Peng, L.; Li, J.; Zhang, G.; Lin, S.; Chen, J. Ka-band GaAs MMIC driver amplifier design. In Proceedings of the 2020 IEEE 3rd International Conference on Electronic Information and Communication Technology (ICEICT), Shenzhen, China, 13–15 November 2020; IEEE: Piscataway, NJ, USA, 2020; pp. 287–290. [Google Scholar]
- Qunaj, V.; Reynaert, P. A compact Ka-band transformer-coupled power amplifier for 5G in 0.15 μm GaAs. In Proceedings of the 2019 IEEE BiCMOS and Compound semiconductor Integrated Circuits and Technology Symposium (BCICTS), Nashville, TN, USA, 3–6 November 2019; IEEE: Piscataway, NJ, USA, 2019; pp. 1–4. [Google Scholar]
- Pedro, J.; Nunes, L.; Cabral, P. Soft compression and the origins of nonlinear behavior of GaN HEMTs. In Proceedings of the 2014 44th European Microwave Conference, Rome, Italy, 6–9 October 2014; IEEE: Piscataway, NJ, USA, 2014; pp. 353–356. [Google Scholar]
- Tkachenko, Y.A.; Bartle, D.; Wei, C.J.; DiCarlo, P. The correlation between intermodulation distortion of GaAs MESFETs and ungated recess width. In Proceedings of the 1999 IEEE MTT-S International Topical Symposium on Technologies for Wireless Applications, Vancouver, BC, Canada, 21–24 February 1999; IEEE: Piscataway, NJ, USA, 1999; pp. 41–45. [Google Scholar]
- Rahkonen, T.; Hietakangas, S.; Aikio, J. AM–PM distortion caused by transistor’s signal-dependent input impedance. In Proceedings of the 2011 20th European Conference on Circuit Theory and Design (ECCTD), Linköping, Sweden, 29–31 August 2011; IEEE: Piscataway, NJ, USA, 2011; pp. 833–836. [Google Scholar]
- Farabegoli, A.; Sogl, B.; Mueller, J.E.; Weigel, R. A novel crest factor reduction technique using memoryless polynomials. In Proceedings of the 2014 44th European Microwave Conference, Rome, Italy, 6–9 October 2014; IEEE: Piscataway, NJ, USA, 2014; pp. 825–828. [Google Scholar]
- Guo, Y.; Lei, D.; Yu, C.; Wang, X.; Xiao, L. A 3-W high-power 32-GHz GaAs power amplifier. In Proceedings of the 2024 9th International Conference on Computer and Communication Systems (ICCCS), Xi’an, China, 19–22 April 2024; IEEE: Piscataway, NJ, USA, 2024; pp. 1139–1143. [Google Scholar]
- Lai, Y.-S.; Fu, Z.-H.; Ye, J.-W.; Wu, C.-S.; Lin, K.-Y. 28 GHz GaAs pHEMT high-efficiency power amplifier using multi-section transmission-line power combining/matching technique. In Proceedings of the 2024 IEEE/MTT-S International Microwave Symposium-IMS 2024, Washington, DC, USA, 16–21 June 2024; IEEE: Piscataway, NJ, USA, 2024; pp. 827–830. [Google Scholar]
- Liu, L.; Zhao, D. A 0.5 W 33%-PAE Ka-band power amplifier in 0.15 μm GaAs. In Proceedings of the 2022 IEEE MTT-S International Wireless Symposium (IWS), Harbin, China, 12–15 August 2022; IEEE: Piscataway, NJ, USA, 2022; pp. 1–3. [Google Scholar]

Disclaimer/Publisher’s Note: The statements, opinions and data contained in all publications are solely those of the individual author(s) and contributor(s) and not of MDPI and/or the editor(s). MDPI and/or the editor(s) disclaim responsibility for any injury to people or property resulting from any ideas, methods, instructions or products referred to in the content. |
© 2026 by the authors. Licensee MDPI, Basel, Switzerland. This article is an open access article distributed under the terms and conditions of the Creative Commons Attribution (CC BY) license.