Article

Improving CNN Generalization for Photovoltaic Nowcasting Under Data Scarcity Through Sky Image Hybrid Augmentation Approaches


by
Markos A. Kousounadis-Knousen
,
Velissarios Theocharis
,
Athina P. Georgilaki
and
Pavlos S. Georgilakis
*
School of Electrical and Computer Engineering, National Technical University of Athens, 15780 Athens, Greece
*
Author to whom correspondence should be addressed.
Electronics 2026, 15(10), 2054; https://doi.org/10.3390/electronics15102054
Submission received: 23 April 2026 / Revised: 7 May 2026 / Accepted: 9 May 2026 / Published: 11 May 2026

Abstract

Reliable photovoltaic (PV) power forecasting based on deep learning typically requires large historical datasets to capture the high temporal and spatial variability of solar irradiance. However, in many real-world applications, data availability is limited to short observation periods, hindering the effective training of deep learning models. This paper investigates how sky image data augmentation techniques can improve the generalization capability of Convolutional Neural Networks (CNNs) trained under data scarcity. Three augmentation-based oversampling methods—SMOTE, Mixup-kNN, and Mixup-RP—are evaluated, along with two novel hybrid strategies that combine these methods in parallel and series configurations. The proposed framework is validated on two distinct PV power nowcasting case studies, in which the original sky image training datasets span less than one month. Experimental results show average performance improvements of up to 50% on external testing data when training the CNN on the augmented datasets compared to the original base datasets, demonstrating that accurate PV power nowcasting is feasible even under data-scarce conditions typical of newly installed PV systems, and highlighting the potential of data-efficient learning approaches for renewable energy applications.

1. Introduction

Increased energy consumption has been associated with improved economic performance and higher living standards across modern societies; however, it has also led to significant environmental challenges that contribute to the ongoing climate crisis [1]. In response, the European Union has adopted an ambitious strategy to gradually replace fossil fuels with Renewable Energy Sources (RESs) for electric power generation. Over the past decade, this transition has been driven largely by the growing deployment of photovoltaic (PV) systems, which have been connected to the electrical grid predominantly at the distribution level [2]. The increasing penetration of such non-dispatchable PV systems necessitates the modernization of conventional electric power systems through the adoption of smart power electronics, dynamic modeling techniques, and Artificial Intelligence (AI), to mitigate the negative impact of the induced uncertainty and ensure reliable and efficient operation [3].
Solar power forecasting is one of the most effective methods for the reliable integration of PV systems into the electrical grid, as it enables optimal planning and proactive control while reducing operational costs [4]. Forecasting horizons vary depending on the downstream task, ranging from a few seconds ahead (nowcasting), to minutes ahead (ultra-short-term forecasting), hours ahead (short-term forecasting), and up to days or even weeks ahead (mid- and long-term forecasting) [4]. For ultra-short- and short-term horizons, remote sensing data from satellites and ground-based sky cameras have emerged as particularly promising input sources. These types of data provide detailed information on cloud formations in the form of images, thereby enabling the application of computer vision techniques for tasks such as cloud detection and cloud motion modeling within solar power forecasting frameworks [4].
Recent advances in AI have enabled the partial or complete replacement of traditional physics-informed computer vision techniques with data-driven deep learning methods for solar power forecasting [4]. For ultra-short-term horizons, where ground-based sky cameras provide images with the required spatiotemporal resolution for minutes-ahead analysis, two primary approaches have emerged [5]: (i) directly forecasting the target variable (e.g., solar irradiance or PV power) from sequences of obtained sky images through deep learning (end-to-end modeling), e.g., with the usage of Convolutional Neural Networks (CNNs) or Vision Transformers (VT), and (ii) splitting the forecasting task into two stages by first predicting future sky images (image forecasting), and then deriving the target variable from these images (nowcasting), using chained models based on deep learning or hybrid methods. End-to-end modeling for sky-image-based solar power forecasting was first explored in [6], which employed the Stanford University Neural network for Solar Electricity Trend (SUNSET) model [7] for 15 min ahead forecasting using sky image sequences. Since then, various end-to-end solar power forecasting architectures have been explored, including Convolutional Long Short-Term Memory (ConvLSTM) models, ResNet-based models, and encoder–decoder frameworks [8,9]. Nevertheless, recent studies suggest that end-to-end models may struggle to predict the highly non-linear dynamics of solar power generation directly from sky images, indicating that splitting the forecasting task into subtasks can be advantageous [5].
A major drawback of AI-based models for solar power forecasting is their strong dependence on large volumes of high-quality historical data for effective training [10]. Despite the growing availability of PV-related datasets, data scarcity remains a significant challenge, particularly with the widespread deployment of distributed PV systems and the adoption of more complex model architectures. In general, data requirements increase with the number of trainable parameters, making it unrealistic to assume that sufficient historical data will always be available, especially for sky image data and small-scale local PV installations. In addition, sky image datasets are often imbalanced, as certain sky conditions are over-represented due to the prevailing climatic conditions of the target location [11]. Since machine learning models typically optimize objective functions based on average errors, under-represented conditions tend to be inadequately learned during training. This issue is particularly pronounced in regions dominated by clear sky conditions, where sky images depicting clouds are under-represented. As a result, models become biased towards clear sky patterns, which are inherently easier to predict and generally do not require complex deep learning architectures.
Based on the above, it is evident that acquiring sufficiently large and balanced historical sky image datasets for training AI-based solar power forecasting models remains a challenge. In recent years, data scarcity has been addressed through transfer learning, where models are pre-trained on large global datasets and subsequently finetuned using local data [12]. Although this approach can substantially reduce the need for extensive local datasets, it still relies on access to large-scale data repositories that adequately resemble the conditions of the target location. On the other hand, dataset imbalance has primarily been addressed through classification-based approaches. In classification-based approaches, sky images are partitioned into distinct classes either to train separate sky-condition-specific models for each class [13,14] or to construct a more balanced training subset for a single model through targeted sampling [15]. However, while these approaches can improve the representation of diverse sky conditions, they do not resolve the data scarcity problem, increasing the risk of overfitting or training collapse [16].
Dataset augmentation has emerged as a promising approach to address the combined challenges of data scarcity and imbalance in the context of AI-based electric power system applications [10]. In contrast to data resampling, which only replicates existing samples, data augmentation enriches datasets by generating new synthetic samples [4], thereby reducing the risk of overfitting and improving the generalization capability of deep learning models. In the context of image data, augmentation can be conducted using simple transformations, such as Gaussian noise injection [17], color casting [18], and brightness adjustment [19]. More advanced approaches include data-driven techniques, such as the Synthetic Minority Oversampling Technique (SMOTE) [20] and Mixup k nearest neighbors (kNN) [21], as well as deep generative AI models such as Generative Adversarial Networks (GANs) [22].
Despite the growing interest in image data augmentation for RES-related applications, such as PV panel soiling localization [23], limited research has been conducted on sky image data augmentation for solar power forecasting. A thorough exploration of various augmentation methods in the context of sky-image-based PV power forecasting, including noise injection, color transformations, and image mixing, was first presented in [11]. The different augmentation methods were systematically evaluated based on the performance of the SUNSET model on two tasks: a nowcasting task and a 15 min ahead forecasting task. In [24], the sky image dataset was augmented using translational, vertical, and temporal transformations, improving irradiance forecasting performance of three deep learning models across multiple horizons up to 10 min ahead. In [25], augmentation techniques including color adjustments, cropping, and rotation were combined with transfer learning to improve the sky-image-based PV power nowcasting performance of two deep CNN-based models. Similarly, Ref. [26] incorporated several augmentation techniques, such as translations, scaling, and flipping, within a comprehensive sky image pre-processing pipeline to improve solar irradiance forecasting accuracy.
Nevertheless, some important research gaps remain. Most notably, existing studies apply sky image data augmentation in data-abundant settings, as the datasets used in [11,24,25,26] span two or three years at minute-scale temporal resolutions, resulting in several hundred thousand sky images. Such data availability is not representative of newly deployed PV systems, particularly in small-scale and resource-constrained environments. Furthermore, Refs. [24,25,26] do not explicitly address dataset imbalance, as augmentation is applied across the entire dataset, aiming only to enhance diversity. Only Ref. [11] considers dataset imbalance, by splitting the dataset into two subsets based on the error distribution of a baseline forecasting model and applying augmentation selectively to the higher-error subset. However, this approach relies on a relatively simple classification scheme, which may not fully capture the underlying structural imbalances present in the dataset.
This paper presents a novel sky image augmentation framework aimed at improving the generalization capability of CNNs for PV power nowcasting under data scarcity. Unlike existing studies, the proposed framework applies augmentation to a base training dataset comprising only a few days of data, enabling a systematic evaluation of its effectiveness when data availability is limited. Accordingly, the objective of augmentation is not only to mitigate dataset imbalance, but also to increase dataset size to a level sufficient for training deep CNN models. Furthermore, dataset imbalances are identified using a recently proposed sky image clustering approach [14], which results in detailed clusters representing diverse sky conditions. To further address the limited size of the base training dataset and enhance data diversity, new hybrid augmentation approaches based on image mixing are also explored. The proposed framework is evaluated using two distinct sky image datasets, spanning several weeks of unseen data. The main contributions of this paper are summarized as follows:
  • The introduction of a novel, holistic framework to evaluate the impact of different sky image augmentation methods on PV power nowcasting performance under data scarcity. The proposed framework integrates dataset clustering, resampling, and hybrid augmentation, and is evaluated using the SUNSET model on two small-scale sky image datasets.
  • The development of novel hybrid data-driven augmentation strategies based on image mixing. SMOTE, Mixup-kNN, and Mixup-Random Pair (RP) are combined both in series and in parallel, to generate more diverse synthetic sky images and further improve nowcasting performance.
  • The employment of a state-of-the-art automatic sky image clustering approach to identify detailed clusters and reveal underlying dataset imbalances. Clustering is performed with respect to the downstream task, i.e., PV power nowcasting, and clusters are characterized as critical and non-critical for augmentation based on their size and their associated nowcasting errors.
The remainder of this paper is organized as follows: Section 2 presents the sky image datasets, the PV power nowcasting settings, and the proposed sky image augmentation framework. The experimental results are presented in Section 3. Section 4 discusses the experimental findings and summarizes the main insights. Concluding remarks are provided in Section 5.

2. Materials and Methods

2.1. Sky Image Datasets

2.1.1. Archon Dataset

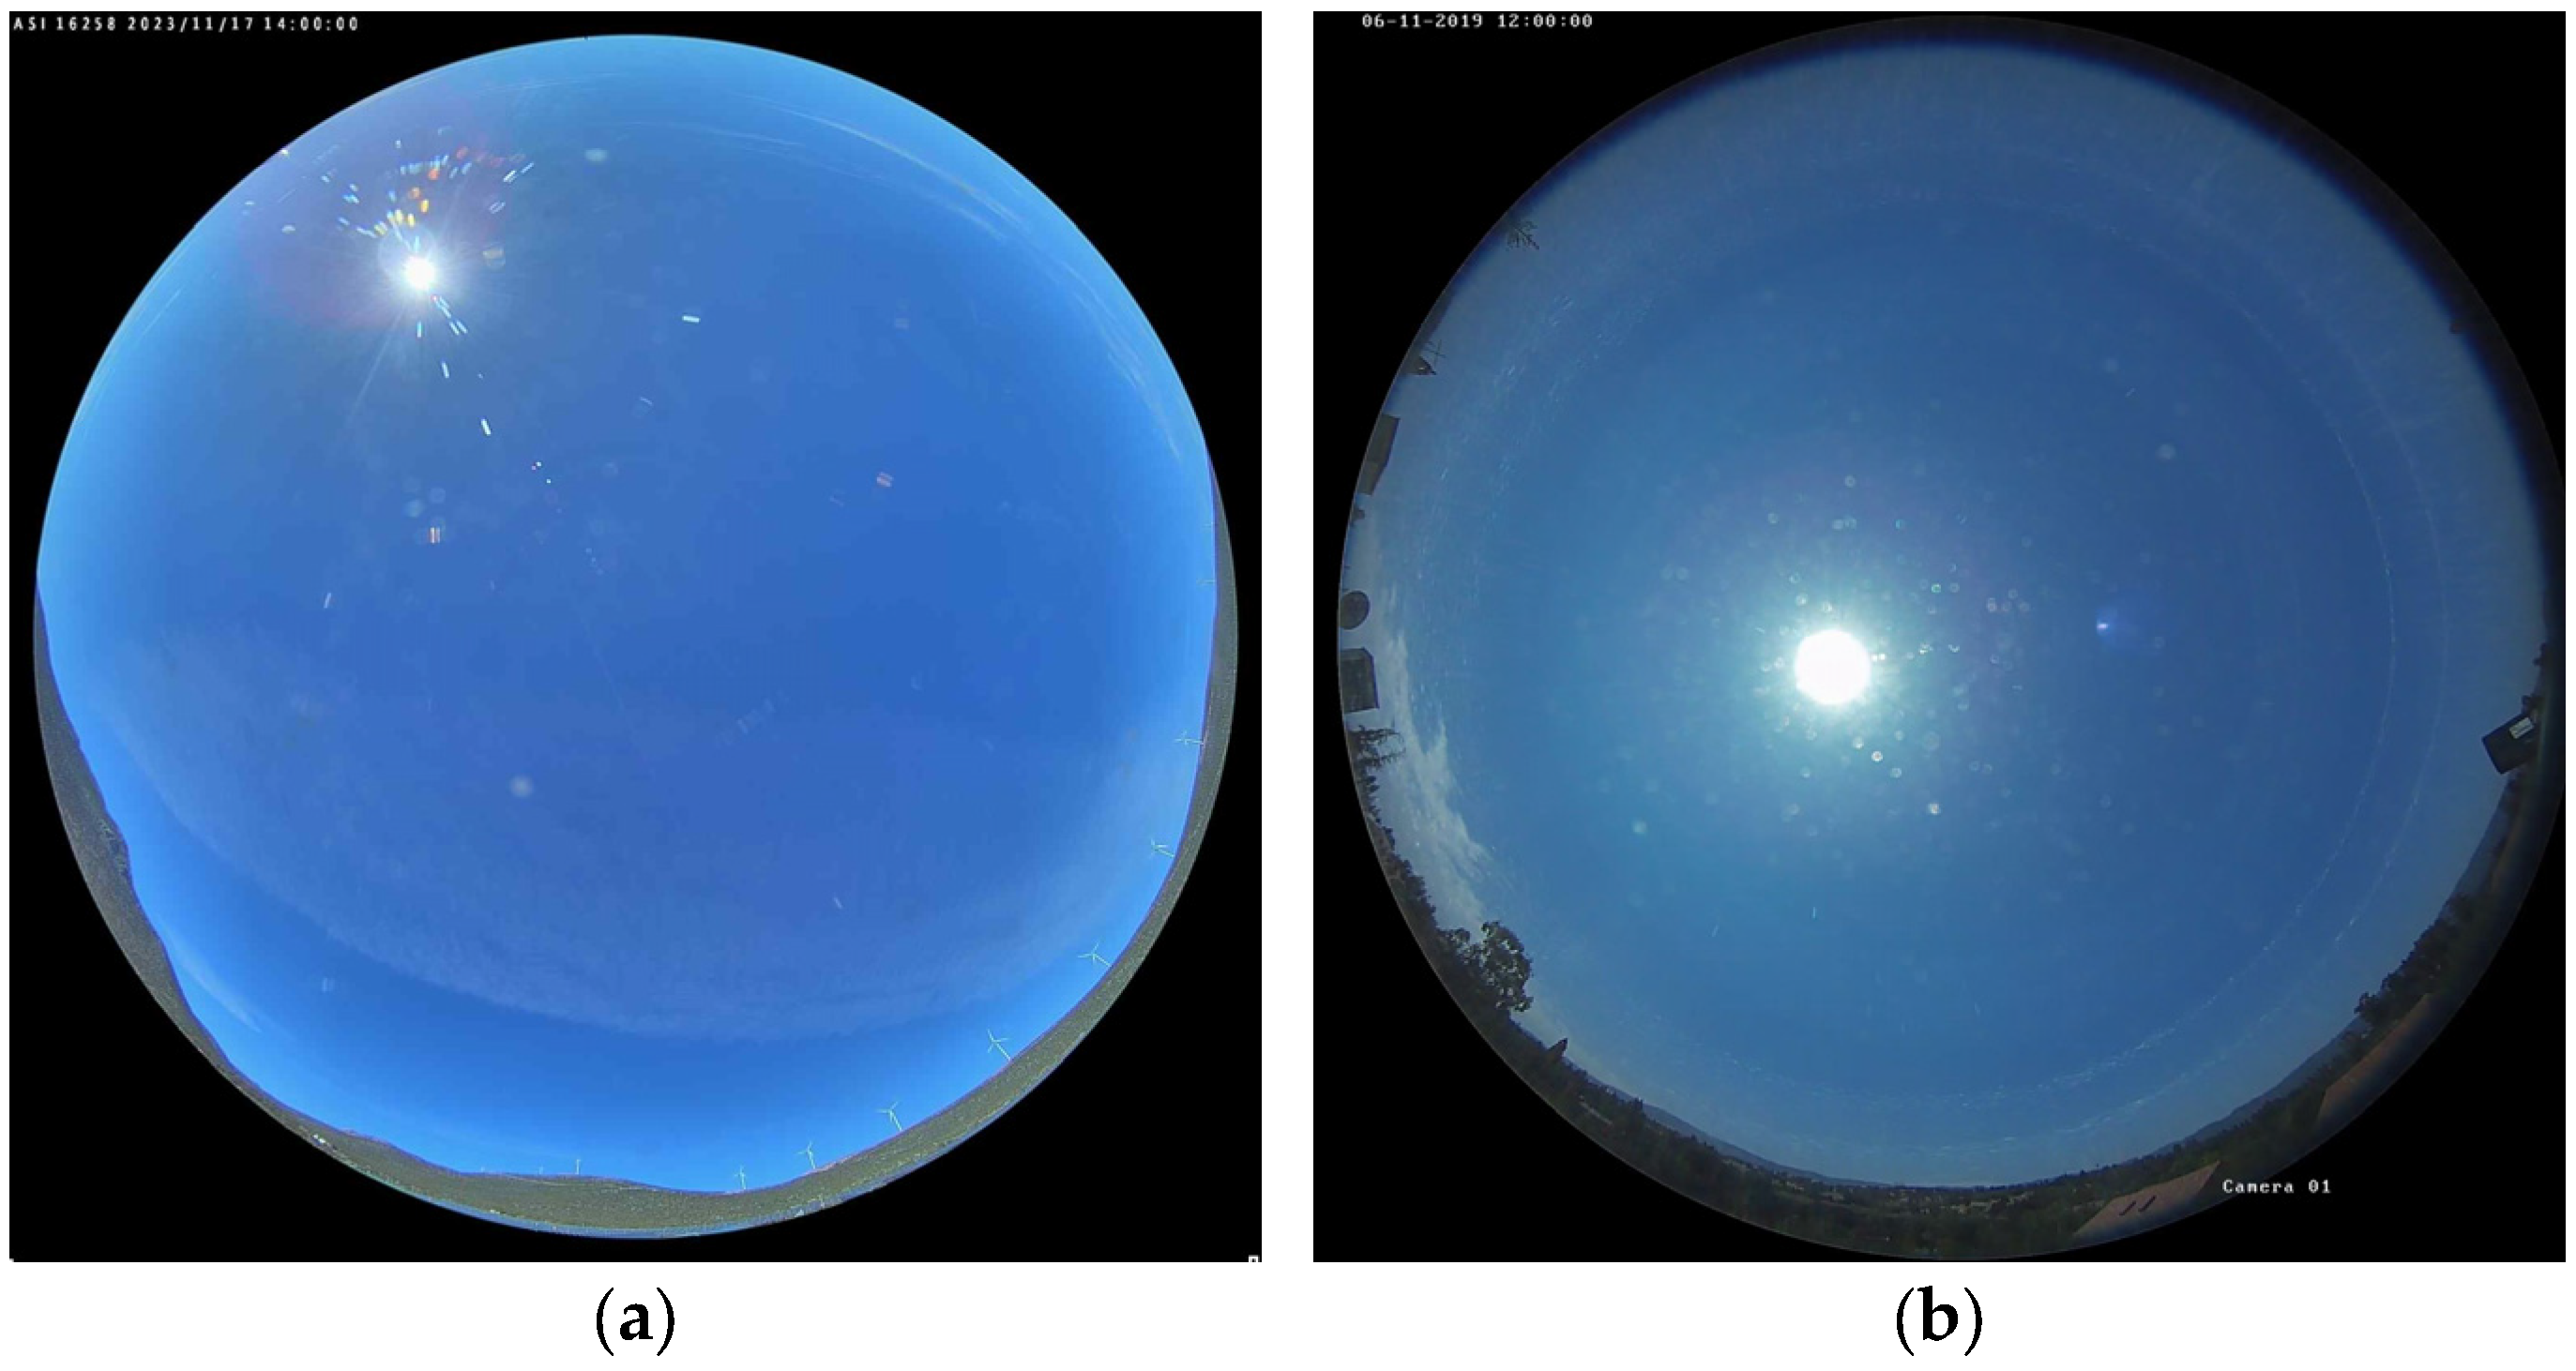
The Archon dataset [27] contains RGB sky images captured at a PV system in Greece between 16 November 2023 and 6 January 2024 using a professional All-Sky Imager (ASI)-16 ground-based sky camera with a fisheye lens and a 180° Field Of View (FOV), manufactured by CMS Ing. Dr. Schreder GmbH (Kirchbichl, Austria). The images have a resolution of 1536 × 1536 pixels, 96 DPI, and 8-bit color depth, and are captured at 1 min intervals during daylight hours. An example image captured under clear sky conditions at midday is shown in Figure 1a. The ASI-16 camera is installed near a 1.2 kW PV system, from which power measurements are also recorded at a 1 min resolution.

2.1.2. SKIPP′D Dataset

The publicly available SKIPP′D dataset [28] contains RGB sky images captured at a rooftop PV system at the Stanford Campus in the US between 2017 and 2019 using a commercial HIKVISION (Hangzhou, China) surveillance camera with a fisheye lens and a 180° FOV. The camera has a resolution of 2048 × 2048 pixels and 8-bit color depth, and records videos at 20 frames per second. In this paper, images are extracted at 1 min intervals during daylight hours only for the period between 1 February 2019 and 31 July 2019. An example image captured under clear sky conditions at midday is shown in Figure 1b. The surveillance camera is installed approximately 125 m away from the 30 kW PV system, from which power measurements are also recorded at a 1 min resolution.

2.2. PV Power Nowcasting

2.2.1. Mathematical Formulation

As mentioned in Section 1, end-to-end ultra-short-term PV power forecasting using sky images is inherently complex, and deep learning models often struggle to capture the non-linear relationships between sequences of past sky images and future PV power values. In recent years, deeper AI models based on VTs have demonstrated promising performance in end-to-end ultra-short-term PV power forecasting; however, training such models requires even larger datasets compared to more conventional deep learning models such as CNNs, to accommodate their billions of parameters. Therefore, this paper focuses on PV power nowcasting under the assumption that future sky images have already been predicted using a chained model, such the auto-encoder-like CNN proposed in [16].
In this paper, the PV power nowcasting problem is mathematically formulated as follows:
y ^ ( t ) = f x t
where x t is the matrix corresponding to the sky image recorded at time t , y ^ ( t ) is the predicted PV power at time t , and f( ) is the underlying function that maps the sky image (input) to the estimated PV power (output). In other words, the target objective is to estimate PV production at a given time t using only the recorded sky image at time t .

2.2.2. PV Power Nowcasting Model

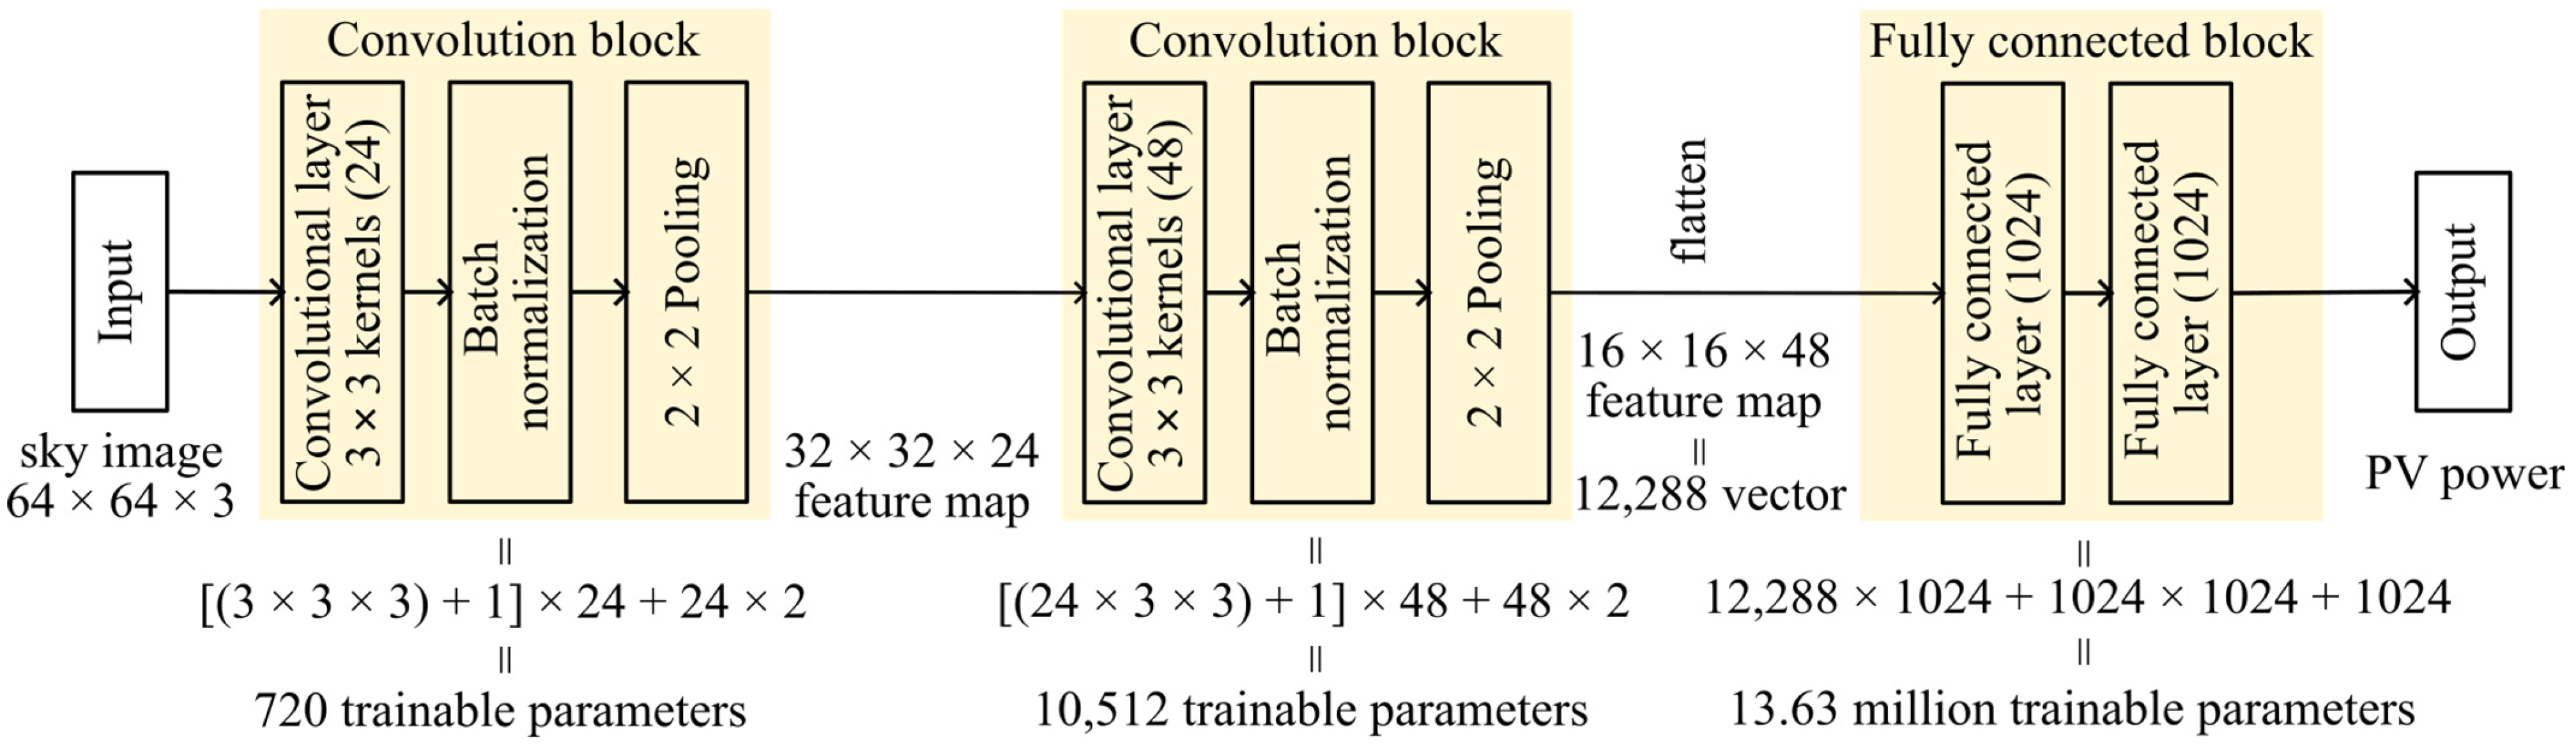
To extract the mapping function f( ) in (1), the CNN-based SUNSET model [7] is employed. The architecture of SUNSET, illustrated in Figure 2, comprises two convolutional blocks followed by a fully connected block. The model receives a single sky image as input, downscaled to 64 × 64 pixels to reduce computations, with pixel values normalized to [0, 1] per color channel. Each convolution block contains three layers: a convolutional layer, a batch normalization layer, and a pooling layer. The convolutional layers use 3 × 3 kernels with unit stride and padding to preserve input dimensions for the feature maps. Pooling layers then down-sample these feature maps by a factor of two. Figure 2 also includes the explicit calculation of the number of trainable parameters per block, excluding the biases of the fully connected block. Each convolutional layer introduces a total of trainable parameters equal to the product of the number of input channels, the kernel dimensions, and the number of filters, whereas each batch normalization layer introduces two trainable parameters per filter. The output of the convolutional blocks is flattened and passed to the fully connected block, which contains two layers with 1024 neurons each and introduces more than 99% of the total trainable parameters. All hidden layers use ReLU activation. The output layer uses linear activation and contains a single neuron, which represents the predicted PV power.
SUNSET is a deep learning computer vision model capable of directly extracting point values from input images. It has demonstrated state-of-the-art performance and is widely regarded as a reliable PV power nowcasting model. Nevertheless, the primary motivation for selecting SUNSET in this study is its relatively low number of trainable parameters compared to other models in the same category. Specifically, SUNSET comprises 13.65 million trainable parameters [12], making it feasible to train effectively with datasets consisting of only a few thousand sky images. In general, the amount of data required for effective training increases with the number of trainable parameters. Therefore, under data-scarce conditions, model dimensionality becomes a critical factor, as deeper architectures typically demand larger training datasets. More complex deep learning models, such as VTs or CNN-based architectures like ResNet-50, typically involve tens of millions to billions of parameters. In this context, augmenting limited datasets in a meaningful way becomes a significant challenge. This issue is mitigated when using shallower models such as SUNSET, which are better suited to scenarios with data scarcity. For example, in ref. [7], SUNSET was effectively trained with fewer than 16,000 sky images and achieved average PV power nowcasting errors below 10% of the nominal installed capacity under the most challenging cloudy conditions. Furthermore, in contrast to VTs, which typically require extensive training times ranging from days to weeks on high-performance GPUs, models like SUNSET can be trained on CPUs within a few hours, depending on training dataset size. Therefore, SUNSET not only aligns well with the data-scarce environment considered in this study but also provides a favorable accuracy–efficiency trade-off, making it a highly suitable and still competitive model for PV power nowcasting applications.

2.3. Sky Image Augmentation Methods

The base datasets presented in Section 2.1 are augmented using SMOTE, Mixup-kNN, and Mixup-RP, as well as novel in-series or in-parallel combinations of these image mixing techniques. Generative AI models such as GANs are not considered in this study, as they require substantial amounts of training data to produce reliable synthetic images, making them unsuitable for data-scarce environments. Simpler augmentation techniques, such as Gaussian noise injection, brightness adjustment, and color casting, were also evaluated; however, preliminary experiments indicated that their impact is limited compared to more advanced mixing methods. This contrasts with the findings in [11], where nowcasting performance differences among augmentation techniques were relatively small, indicating that, when the base dataset is sufficiently large, model performance becomes less sensitive to the choice of augmentation method due to the sufficient diversity of the base dataset. In contrast, under data-scarce conditions, the limited diversity of the base dataset necessitates more sophisticated augmentation methods, which can generate greater variability and thus have a larger impact on nowcasting performance.

2.3.1. Synthetic Minority Oversampling Technique

With SMOTE [20], a synthetic image is generated through linear interpolation between the original image and one of its k nearest neighbors, as follows:
x i = λ x i + ( 1 λ ) z i
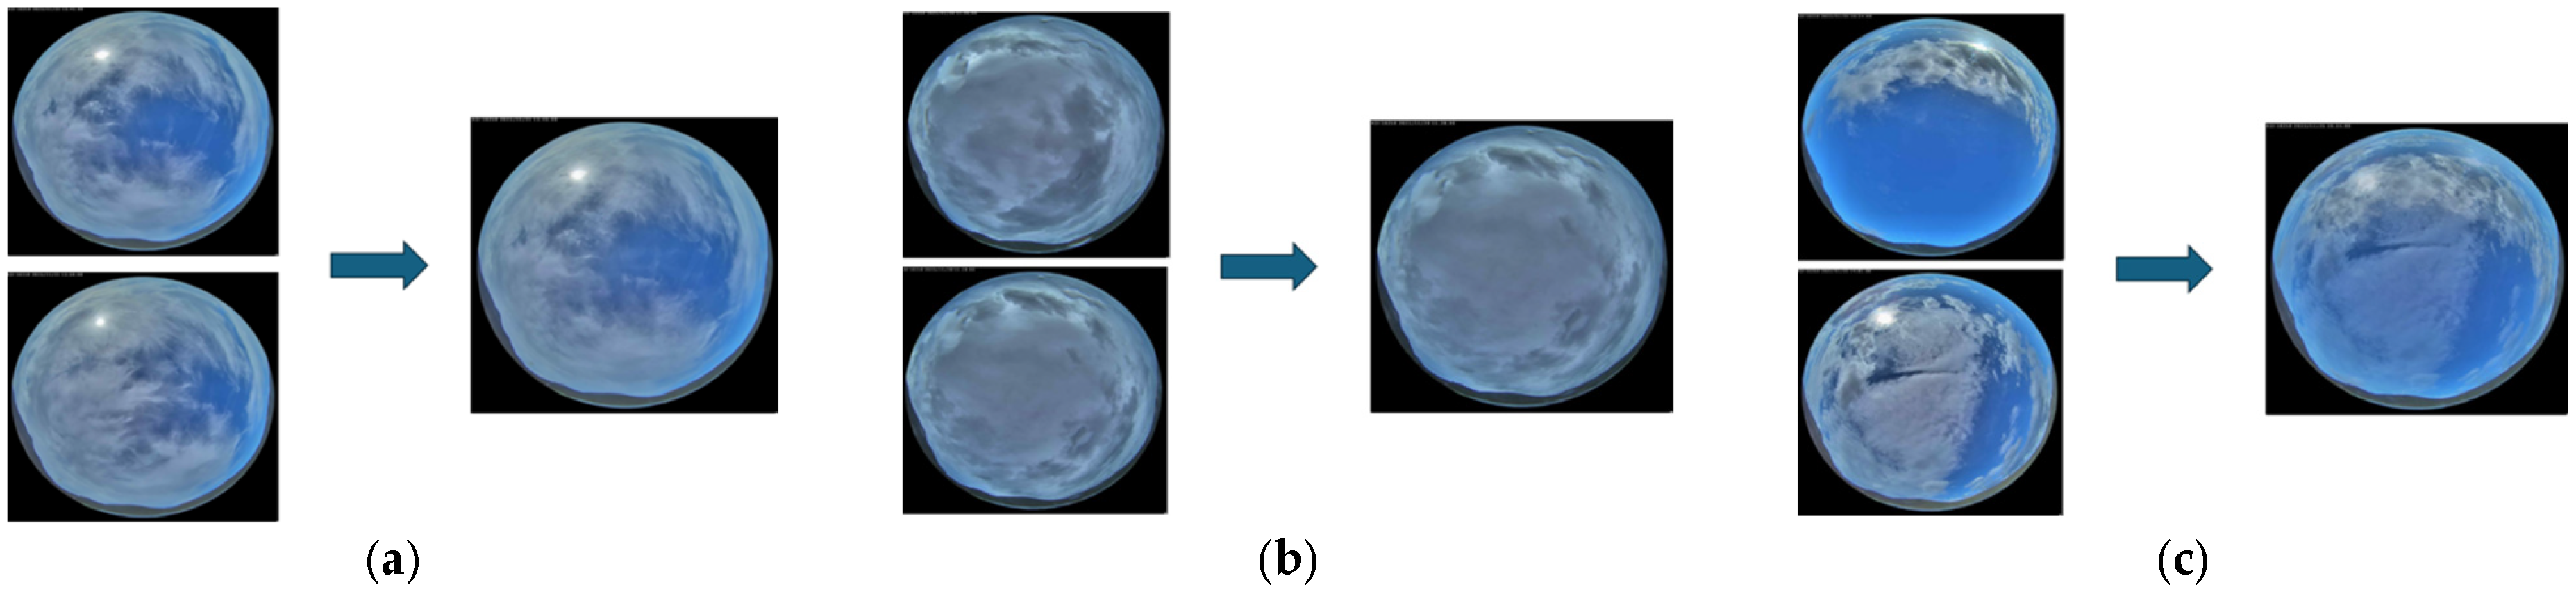
where x i is the i t h pixel of the synthetic image x , x i is the i t h pixel of the original image x , z i is the i t h pixel of the selected neighbor image z , and λ is a random coefficient that follows a uniform distribution in [0, 1] and controls the interpolation ratio. Figure 3a depicts an augmentation example for the Archon dataset using SMOTE. The corresponding PV power value of the synthetic sky image is calculated as the weighted average of the PV power values of the two original images, using the same coefficient λ .

2.3.2. Mixup-kNN

Mixup-kNN [21] is conceptually similar to SMOTE, as synthetic images are generated through linear interpolation between the original image and one of its k nearest neighbors. However, in this case, the interpolation coefficient λ is sampled from a Beta a , a distribution, whose probability density function is given by the following:
p d f λ ; a ,   a =   Γ ( 2 a ) Γ ( a ) 2 λ a 1 1 λ a 1  
where a     ( 0 ,   ) is the shape parameter of the Beta distribution and Γ ( ) is the gamma function. Figure 3b depicts an augmentation example for the Archon dataset using Mixup-kNN. The corresponding PV power value of the synthetic sky image is calculated as the weighted average of the PV power values of the two original images, using the coefficient λ .

2.3.3. Mixup-RP

In contrast to SMOTE and Mixup-kNN, Mixup-RP [21] is not restricted to the k nearest neighbors but generates synthetic images through linear interpolation between the original image and any randomly selected image from the base dataset. The interpolation coefficient λ follows the same Beta a , a distribution as in Mixup-kNN. Figure 3c depicts an augmentation example for the Archon dataset using Mixup-RP. Compared to SMOTE and Mixup-kNN, Mixup-RP typically produces synthetic sky images with greater diversity, as randomly selected images from the dataset can differ significantly from the original image. The corresponding PV power value of the synthetic sky image is calculated as the weighted average of the PV power values of the two original images, using the coefficient λ .

2.4. Data Scarcity Environment Simulation

At design time, the sky image datasets presented in Section 2.1 are first split chronologically into a training subset and an external testing subset to prevent data leakage. To emulate data-scarce conditions, only 15% and 10% of the Archon and SKIPP′D datasets, respectively, are allocated to the training subsets, which is substantially lower than the typical allocation of at least 50% used in AI model development. Consequently, the training subset of Archon consists of 5782 sky images (approximately 10 days of data), whereas the training set of SKIPP′D consists of 9663 sky images (approximately 16 days of data). This limited proportion of training data, combined with the already small size of the sky image datasets, reflects realistic data-scarce scenarios, such as newly deployed PV systems with only a few days or weeks of recorded measurements. These training subsets serve as the base datasets which are subsequently clustered, analyzed for imbalances, and augmented accordingly.

2.5. Sky Image Dataset Clustering

Identifying imbalances in sky image datasets requires an appropriate data classification strategy rather than relying on simple classification schemes (e.g., sunny—cloudy—overcast). To this end, the automatic sky image clustering framework recently introduced in [14] is employed, primarily due to its ability to generate multiple clusters without relying on pre-defined ground truth labels. This multi-class partitioning enables a more detailed representation of the base dataset structure and facilitates the detection of subtle imbalances. At operation time, the framework proceeds as follows: a total of 49 handcrafted features are extracted from the current sky image, including common spectral and textural features. The handcrafted feature set includes also the cloud coverage percentage, the clear sky index, the luminance level, and solar elevation (zenith and azimuth angles), as well as the average cloud motion vector. The selected features have been designed to capture the global properties of sky images, accounting for factors such as color variations, color distribution, and non-instantaneous information such as cloud velocity [14]. The handcrafted feature set is subsequently projected into the latent space using a hybrid dimensionality reduction technique that combines Principal Component Analysis (PCA) with a shallow fully connected auto-encoder [29]. Specifically, PCA is first applied to reduce dimensionality linearly, after which the auto-encoder handles the residuals in order to account for non-linearities and minimize reconstruction errors. The sky image is then assigned to one of several pre-defined clusters using k-means clustering [30].
The latent space dimensionality and number of clusters is determined at design time. Specifically, the dimensionality of the latent space is aligned with the intrinsic dimensionality of the handcrafted feature dataset, following the procedure described in [29]. For the number of clusters, an empirical method based on partial co-optimization and downstream evaluation is employed. Specifically, several different partitions are explored and evaluated concurrently while optimizing a neural network-based PV generation forecasting model using a metaheuristic algorithm based on simulated annealing. After a few evaluations, the partition that leads to the minimum forecasting error is selected as optimal. Although not exhaustive, this approach provides a reliable estimate of the optimal partition with respect to the downstream task of nowcasting PV generation [14].
As an unsupervised learning approach, the employed sky image clustering method does not involve ground-truth labels and is thus difficult to evaluate quantitatively. Previous studies have demonstrated the effectiveness of the employed approach both qualitatively, i.e., the semantic meaning of the obtained clusters, and quantitatively, i.e., in terms of its impact on the average forecasting error [14]. The employed clusters are semantically meaningful in the sense that each cluster represents distinct sky conditions, such as clear sky, dawn or dusk, high turbulence levels, scattered cloudy, and overcast conditions. Quantitatively, the employed clustering approach has exhibited similar performance on the downstream forecasting task with other state-of-the-art unsupervised learning approaches and can reduce the average forecasting error by up to 10% compared to simpler classification schemes (e.g., sunny—cloudy—overcast) [14]. More information on the employed sky image clustering approach and its evaluation can be found in [14].

2.6. Proposed Sky Image Dataset Resampling and Augmentation

In contrast to [11], which characterizes sky images individually as either critical or non-critical for augmentation, this paper conducts a cluster-level analysis to resample the base dataset and address imbalances. Specifically, to determine whether a cluster should be considered critical for augmentation, all sky images within the cluster are jointly evaluated through aggregation (e.g., averaging), which improves robustness to noise that may arise from the criticality criterion (such as the performance of a PV nowcasting model). Furthermore, operating at the cluster level enables cluster-specific augmentation strategies and more flexible handling of individual clusters, thereby expanding the possible ways to process the base dataset and address imbalances.
In the proposed method, each sky image cluster is characterized as critical or non-critical for augmentation based on two criteria: (i) the cluster size relative to the base dataset, and (ii) similar to [11], the associated downstream task performance, i.e., the average PV power nowcasting error. The proposed cluster-level criticality criterion is formulated as follows:
c i     C c i r 1 D ε i r 2 P     i { 1 ,   2 ,   ,   n }
where c i denotes cluster i , C is the critical dataset, D is the base dataset, c i is the size of cluster i , n is the total number of clusters,   ε i is the PV power nowcasting error associated with cluster i , P is the installed capacity of the PV system, and r 1 ,   r 2 are pre-defined coefficients determining the criticality thresholds. In other words, a cluster is considered critical for augmentation only if it is both relatively under-represented in the base dataset and associated with relatively high PV power nowcasting errors. If a cluster is associated with low nowcasting errors (e.g., a cluster representing clear sky conditions), augmentation is unnecessary, even if the cluster is small, since such sky images do not significantly contribute to the overall nowcasting error. On the other hand, if a cluster is associated with high nowcasting errors but is also sufficiently large, it is excluded from augmentation, as its sky images are already adequately represented in the base dataset.
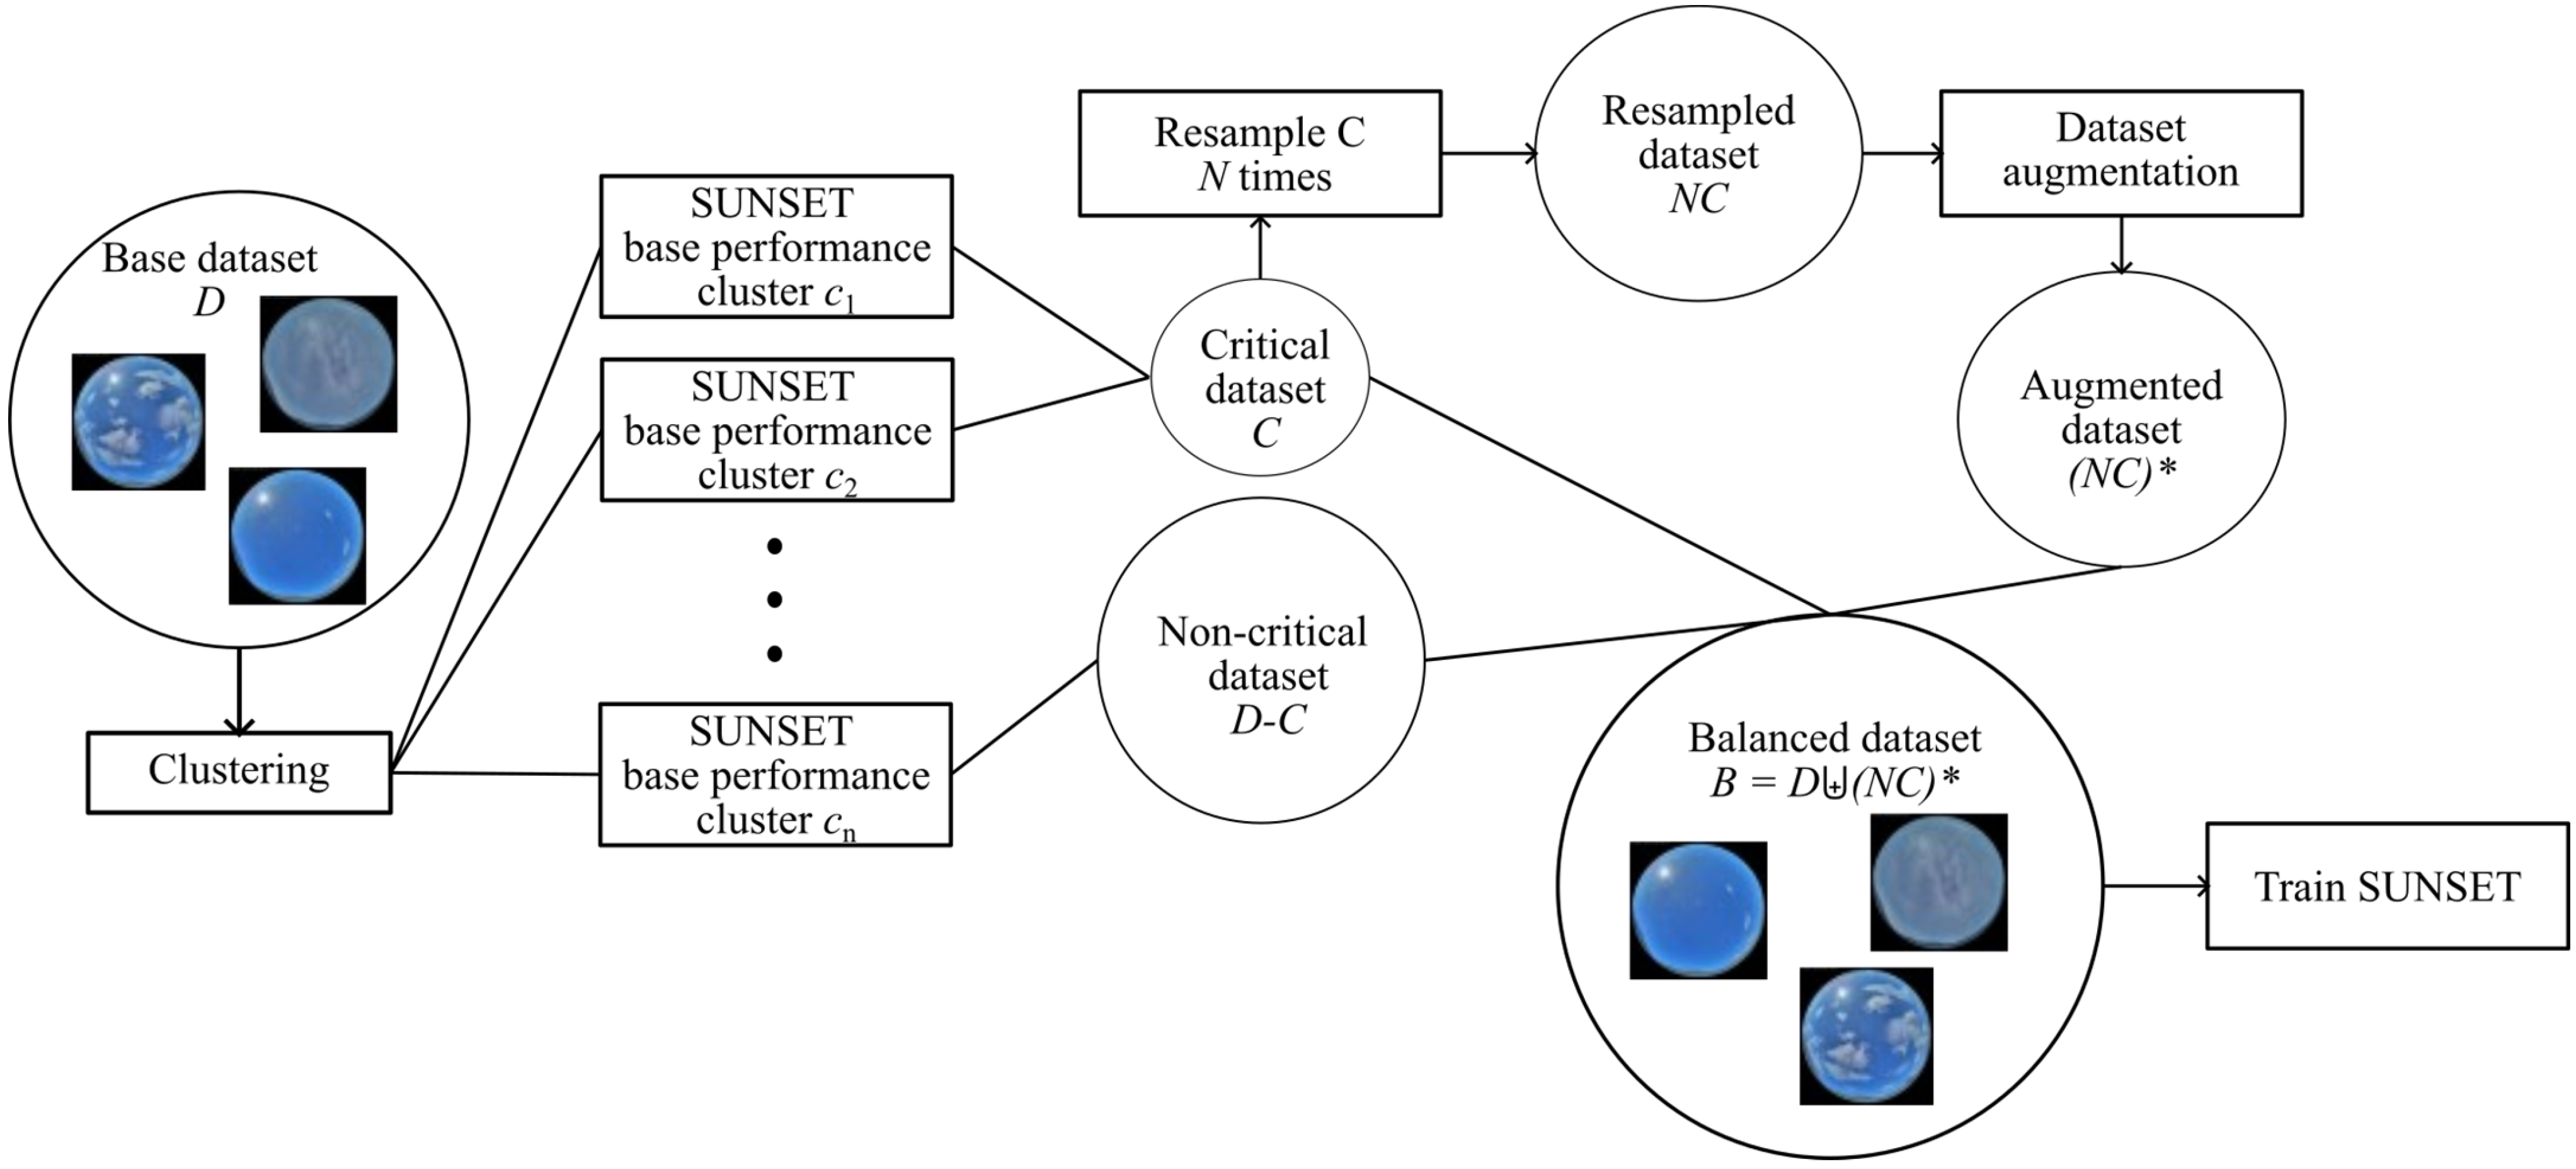
A schematic overview of the proposed sky image dataset augmentation framework for PV power nowcasting under data-scarce settings is provided in Figure 4. The base dataset D is first partitioned into n clusters using the sky image clustering method described in Section 2.5. The SUNSET model of Figure 2 is then trained separately on each cluster of the base dataset to solve the nowcasting problem defined in (1). Training performance is evaluated internally using the Root Mean Square Error (RMSE):
R M S E = 1 N t i = 1 N t y ^ ( i ) y ( i ) 2
where y ^ ( i ) is the predicted PV power for training sample i , y ( i ) is the actual PV power for training sample i , and N t is the number of training samples used for internal validation. Based on (4), each cluster is characterized as critical or non-critical for augmentation. The critical dataset C is resampled N times to increase dataset volume and achieve better balance with the non-critical dataset. The resampled sky images are subsequently augmented using one of the augmentation techniques described in Section 2.3 or one of the proposed hybrid augmentation methods described in Section 2.7, to create the augmented dataset N C * . Finally, the base dataset is combined with the augmented dataset to form the final balanced dataset B , which is used to train the SUNSET model for PV power nowcasting:
B = D     N C *
where denotes multiset union.

2.7. Proposed Hybrid Augmentation Methods

Two novel hybrid augmentation strategies are introduced in this paper, combining SMOTE, Mixup-kNN, and Mixup-RP: (i) in-parallel augmentation, and (ii) in-series augmentation. In the in-parallel approach, rather than applying the same augmentation method to all N resampled copies of the critical dataset, different augmentation techniques are applied across the copies. Specifically, a subset of the resampled copies is augmented using one method (e.g., SMOTE), whereas the remaining subsets are augmented using an alternative method (e.g., Mixup-kNN or Mixup-RP). The proposed in-parallel augmentation approach can be mathematically formulated as follows:
x i , j = λ 1 x i + ( 1 λ 1 ) z i , j ,       1 j N 1 λ 2 x i + ( 1 λ 2 ) z i , j ,       N 1 < j N
where x i , j is the i t h pixel of the synthetic image x j generated for the j t h resampling of the critical dataset, x i is the i t h pixel of the original image x , z i , j is the i t h pixel of the image z j selected for image mixing at resampling j , N is the total number of resampled copies of the critical dataset (resampling factor), N 1 is the total number of subsets resampled using the first augmentation method, and λ 1 ,   λ 2 are the interpolation coefficients associated with the two selected augmentation methods. In other words, if the first N 1 resampled copies of the critical dataset are created using one of SMOTE, Mixup-kNN, or Mixup-RP, the remaining N N 1 resampled copies are created using one of the other augmentation methods. Obviously, the selection of z j and the sampling of λ 1 and λ 2 depend on the selected augmentation methods.
In the in-series approach, two augmentation methods are applied sequentially to the critical dataset to create all N resampled copies. In the first step, intermediate synthetic images x are created using one of SMOTE, Mixup-kNN, or Mixup-RP:
x i = λ 1 x i + ( 1 λ 1 ) z i
where x i is the i t h pixel of the original image x , z i is the i t h pixel of the image z selected for image mixing, and λ 1 is the interpolation coefficient associated with the first augmentation method. Subsequently, synthetic images x are augmented using one of the remaining augmentation methods to produce the final synthetic image x :
x i = λ 2 x i + ( 1 λ 2 ) z i
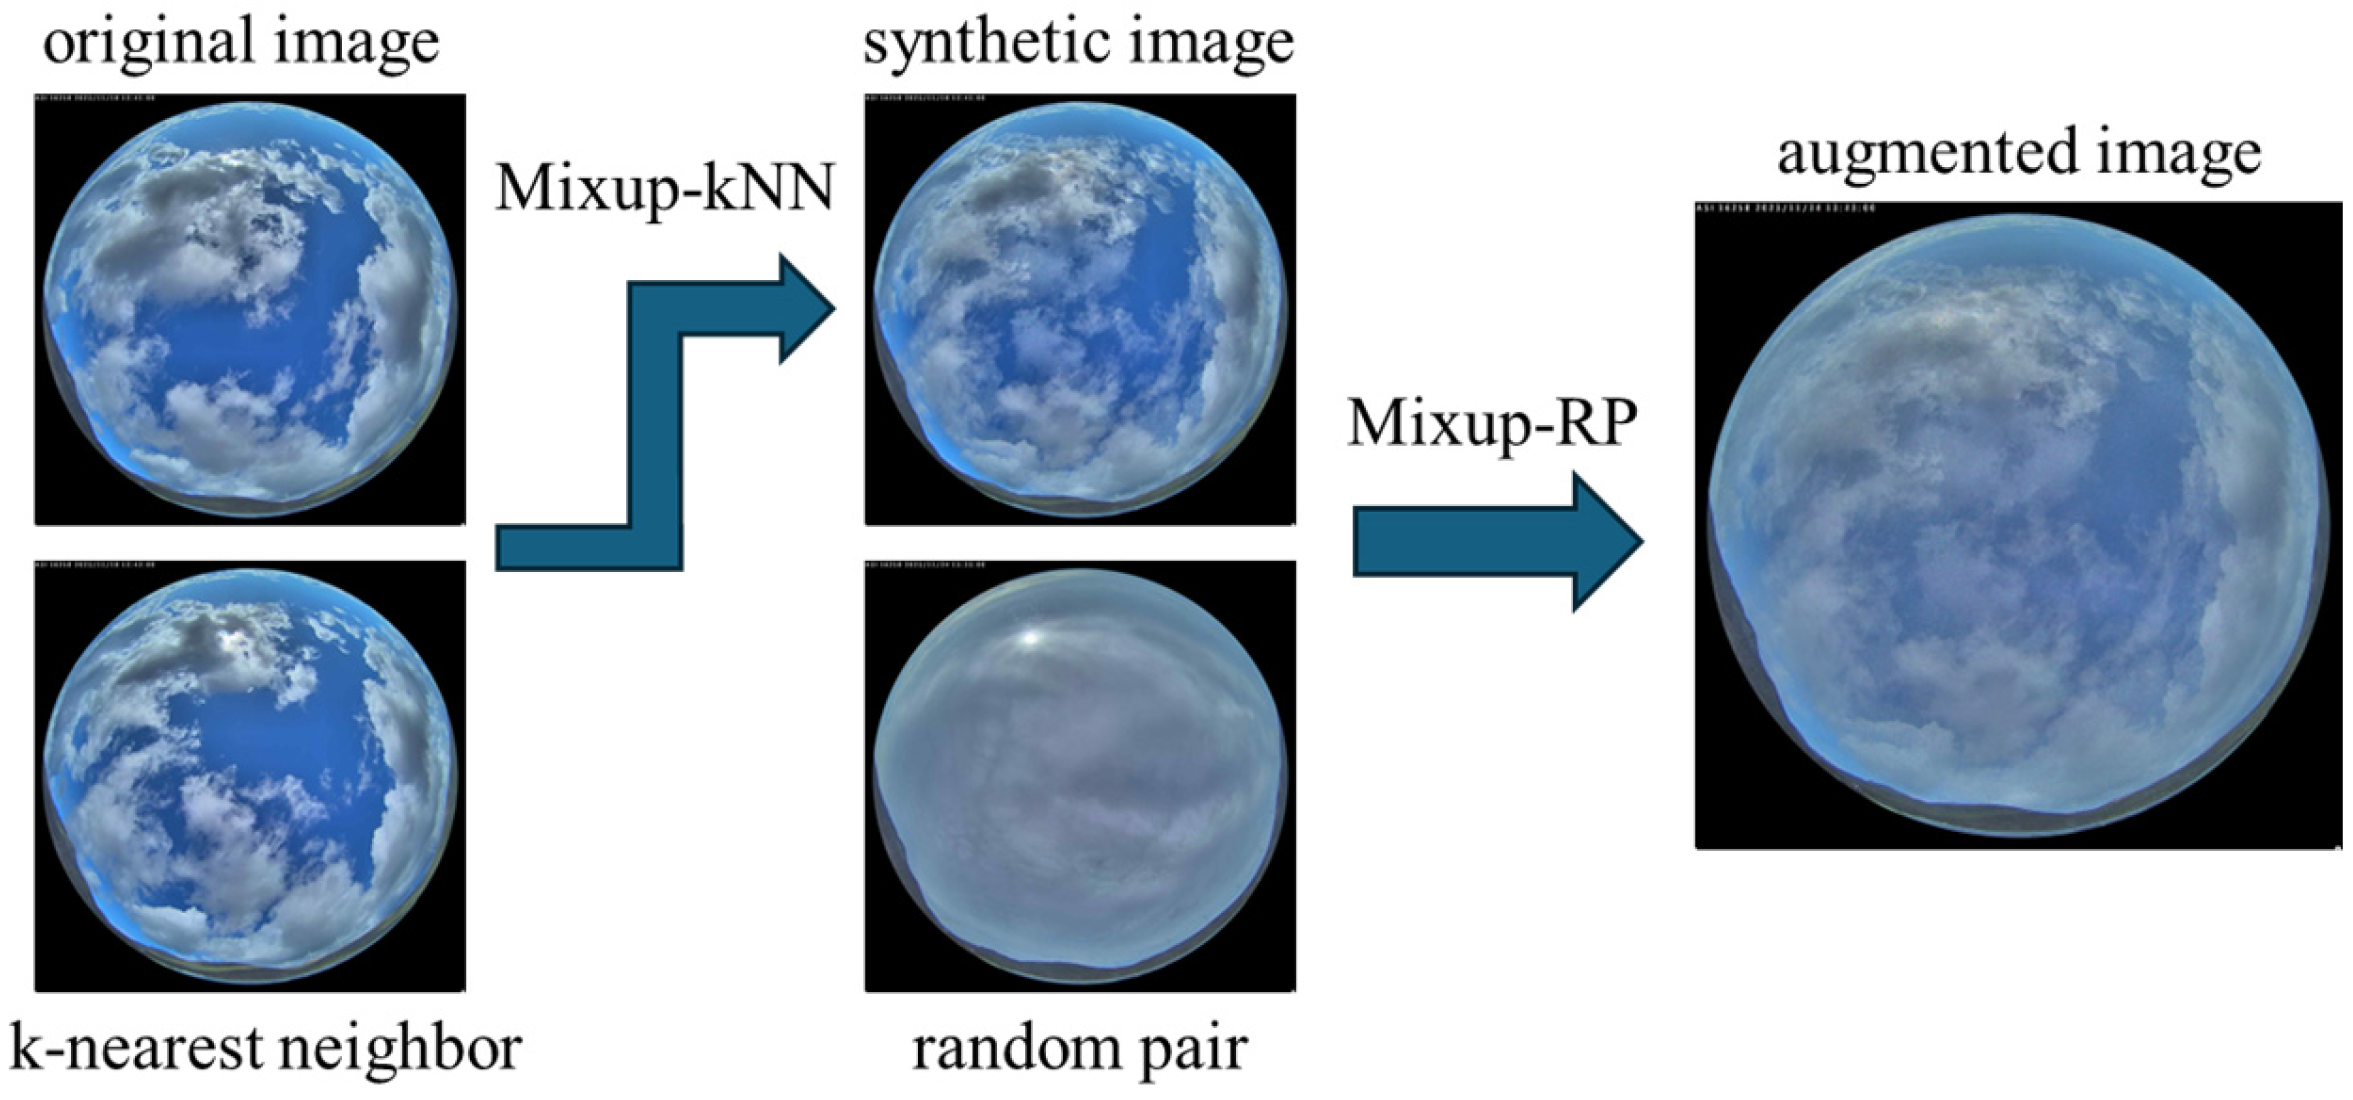
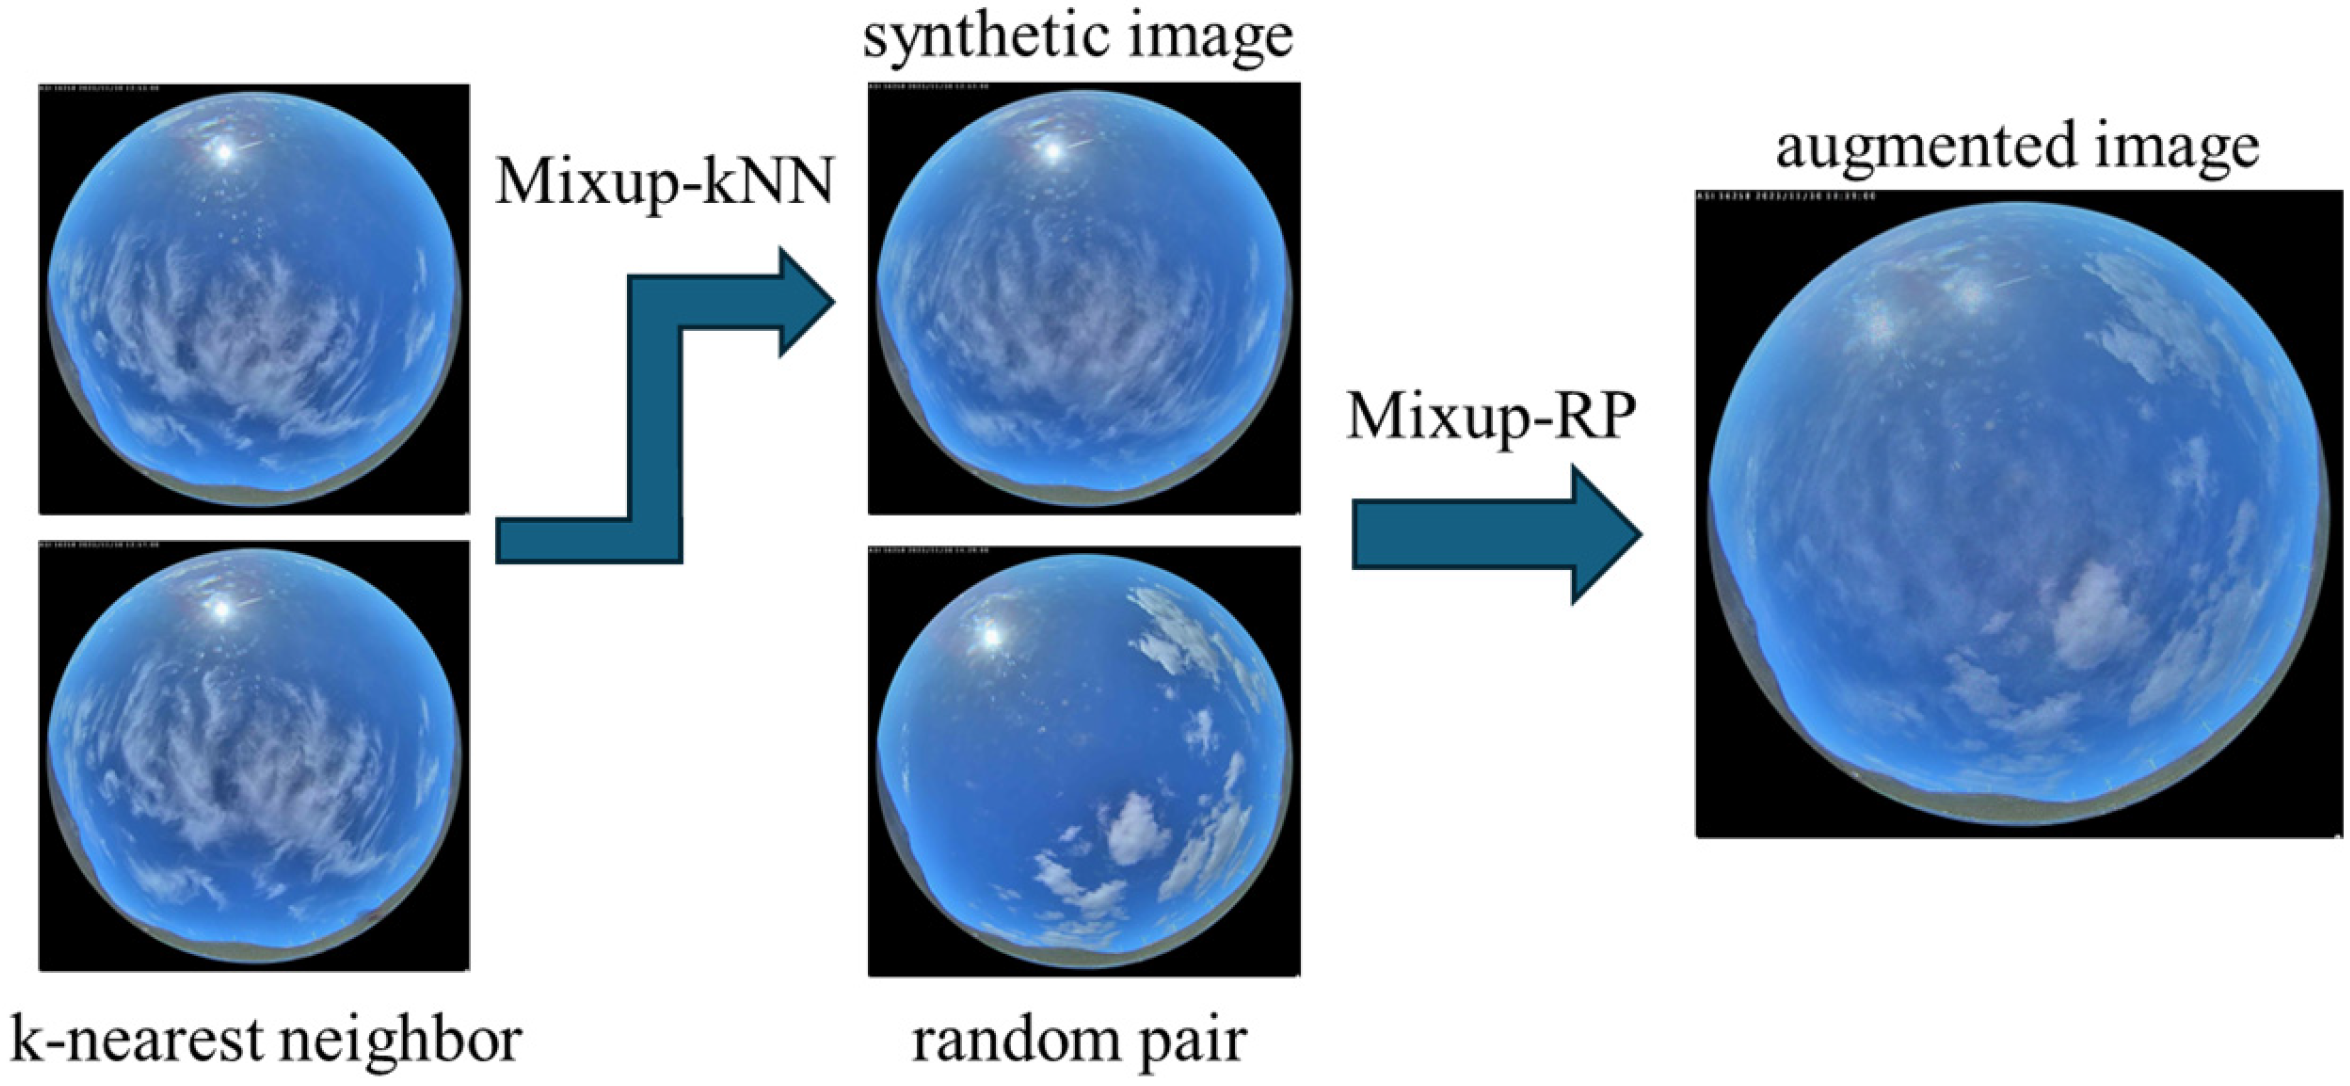
where z i is the i t h pixel of the image z selected for image mixing according to the criterion of the second augmentation method, and λ 2 is the corresponding interpolation coefficient. Figure 5 depicts an augmentation example for the Archon dataset of the proposed in-series hybrid approach, combining Mixup-kNN with Mixup-RP.
Both the proposed in-parallel and in-series augmentation approaches are expected to further increase dataset diversity by leveraging two distinct augmentation techniques to generate synthetic sky images. This effect is particularly pronounced in the in-series approach, where images undergo successive augmentation steps, producing synthetic samples that differ more substantially from the original images. Beyond increasing diversity, the proposed hybrid augmentation approaches may also promote a more balanced augmentation by exploiting the complementary strengths of each individual augmentation method. For example, combining SMOTE with Mixup-RP in parallel results in two resampled subsets: one that maintains semantic realism (SMOTE) and another that increases color diversity (Mixup-RP). Their combination can therefore achieve a diversity–realism trade-off, resulting in a more balanced synthetic dataset. On the other hand, the in-series approach combines augmentation methods that may introduce largely uncorrelated perturbations. As a result, successive augmentations can reduce systematic biases associated with any single method and improve robustness to noise by limiting the reinforcement of method-specific artifacts.

3. Results

3.1. Experimental Setup

All methods and models were implemented in Python 3.10.12, and all experiments were conducted on an Intel(R) Core (TM) i7-8700 CPU (3.20 GHz, 6 cores) desktop computer with 8 GB of RAM. SUNSET is trained by minimizing the Mean Square Error (MSE) using the Adam optimization algorithm [31], with a learning rate of 3 × 10 6 , a batch size of 256, and a maximum of 100 epochs. Each experiment is repeated five times with different random seeds, and the reported results correspond to the mean values. The augmented datasets are split into training and internal validation subsets using a 70:30 ratio, with the validation subset serving for internal evaluation to identify critical sky image clusters, as well as to prevent overfitting during training. The interpolation coefficient λ is randomly sampled for each augmentation of every sky image of the critical dataset. For Mixup-kNN and Mixup-RP, the shape parameter α of the Beta distribution was set to 1 and 0.6, respectively, after finetuning on the internal validation subset using grid search over the interval [0, 1].

3.2. Clustering Results

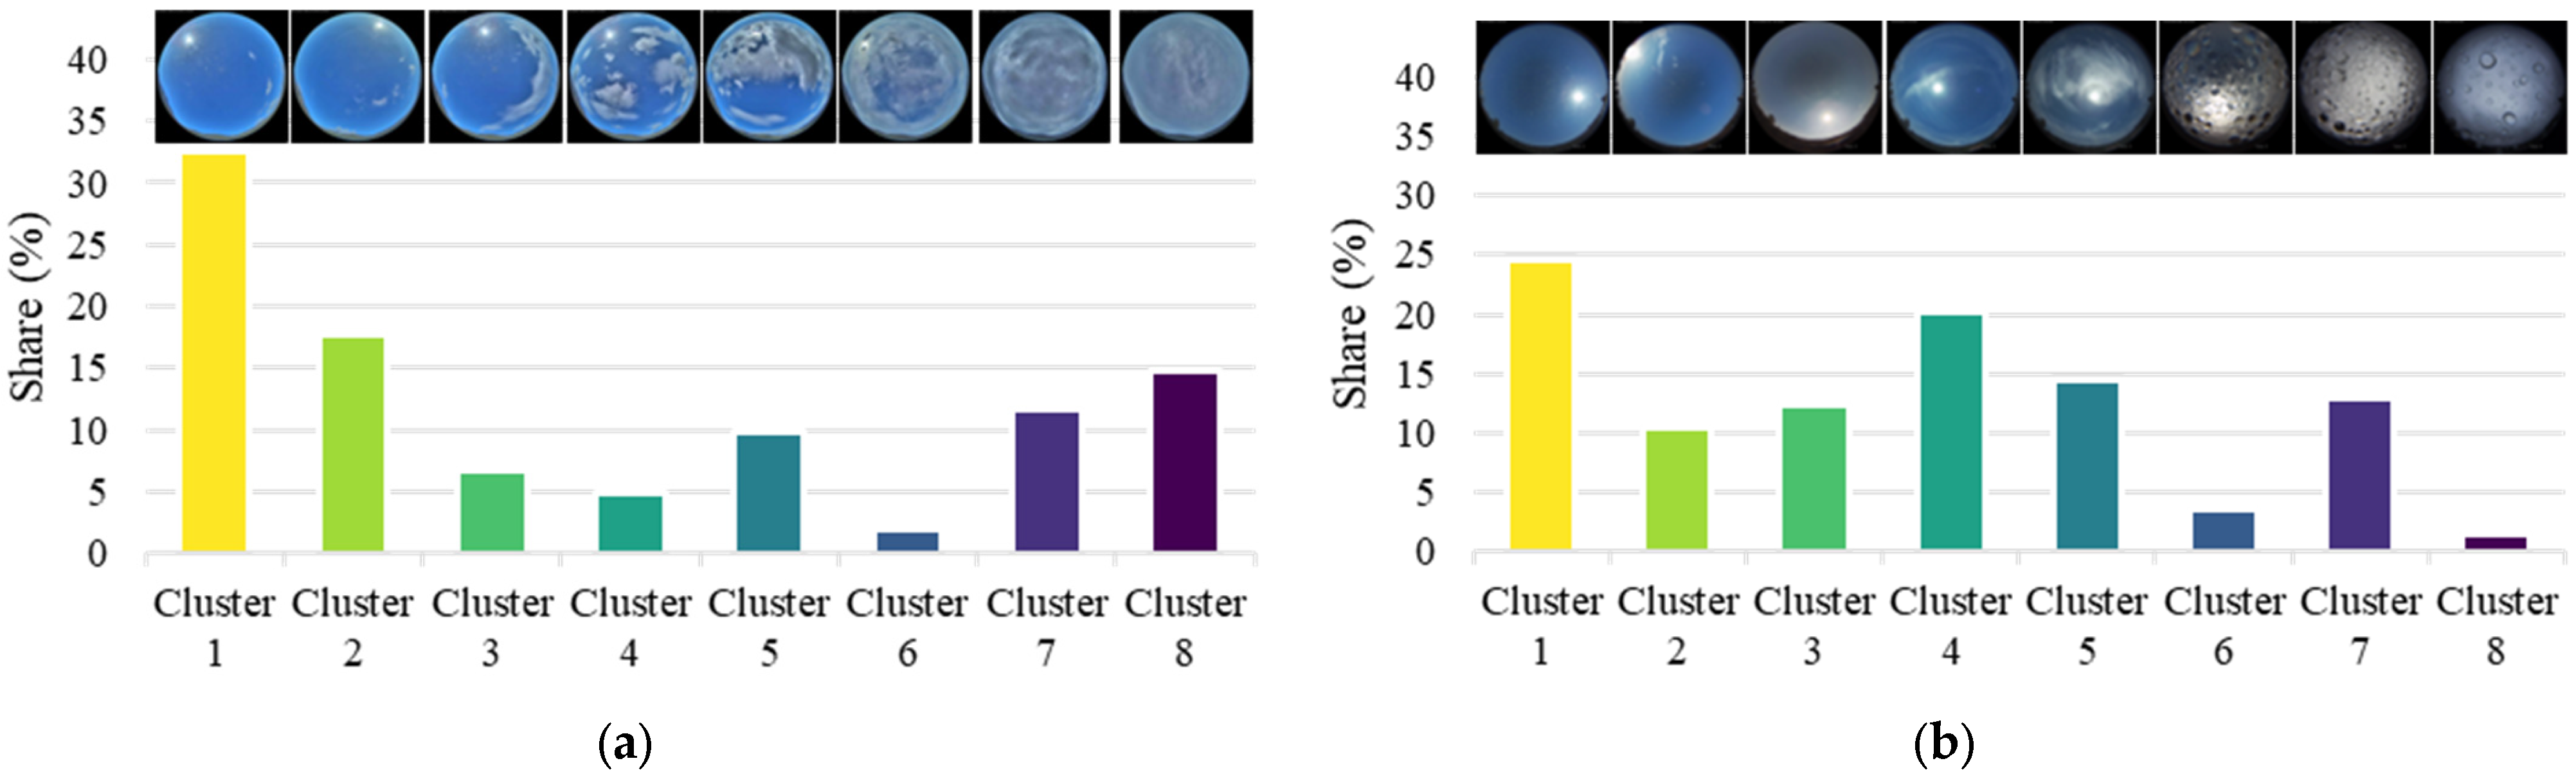
Following [16], eight clusters are created during design time for both datasets. Figure 6 presents the clustering results for the Archon and SKIPP′D datasets, along with the relative proportion of each cluster within the base dataset and a representative sky image of each cluster. Qualitatively, clustering is driven by factors such as cloud coverage, cloud distribution, solar elevation, solar disk occlusion, turbulence levels, and raindrops appearance. As shown in Figure 6, sky images are not uniformly distributed across clusters, revealing inherent dataset imbalances. Clear sky or nearly clear sky conditions dominate both datasets, accounting for approximately 50% and 45% of the sky images in the Archon (clusters 1 and 2) and SKIPP′D (clusters 1 and 4) datasets, respectively. Overcast conditions (clusters 7 and 8) are well represented in the Archon dataset, comprising 26.52% of the sky images. The remaining clusters of the Archon dataset are relatively under-represented, corresponding to scattered/broken clouds with varying cloud coverage and solar disk visibility, with shares ranging from 2% to 10%. In the SKIPP′D dataset, only cluster 5 corresponds to scattered/broken clouds, accounting for 14.48% of the sky images. Overcast conditions in the SKIPP′D dataset are represented by clusters 7 and 8, which mainly differ in the dominant color, with cluster 7 relatively well represented (12.98%) compared to the cluster 8 (1.4%). The SKIPP′D dataset also includes clusters primarily associated with low solar elevation (cluster 2—10.44%), high turbulence levels (cluster 3—12.34%), and clear sky conditions following rainfall (cluster 6—3.57%).

3.3. SUNSET Per-Cluster Base Nowcasting Performance

Table 1 presents the per-cluster nowcasting RMSE achieved by SUNSET using the base training datasets. Specifically, SUNSET is trained separately on each cluster using the corresponding training subset, and the RMSE is calculated using the respective internal validation subset. Table 1 also includes the normalized RMSE (nRMSE), expressed as the RMSE percentage relative to the nominal installed PV capacity. For both datasets, nRMSE values remain relatively high across all clusters—no lower than 8.75% and 7.1% of the nominal PV capacity for the Archon and SKIPP′D datasets, respectively. This is primarily due to the limited number of training samples within each cluster, which is insufficient for effectively training a deep learning model such as SUNSET. In the SKIPP′D dataset, where most clusters contain slightly more sky images than in the Archon dataset, PV power nowcasting errors are generally lower. Nevertheless, despite the negative impact of data scarcity on training reliability, the results still provide useful insights into the sky conditions associated with the largest PV power nowcasting errors.
As expected, clusters corresponding to clear sky conditions (clusters 1 and 2 in the Archon dataset and clusters 1 and 4 in the SKIPP′D dataset) exhibit the lowest PV power nowcasting errors due to their low variability and relatively large volumes of training data, so these clusters are naturally non-critical for augmentation. In contrast, nRMSE reaches values as high as 58% of the nominal PV capacity for certain clusters in both datasets; a result primarily driven by the combination of very limited training samples (fewer than 5% of the total sky images) and highly variable sky conditions. Overall, under-represented clusters associated with high variability (clusters 4 and 5 in the Archon dataset and cluster 6 in the SKIPP′D dataset) lead to the highest errors. For the remaining clusters, nRMSE varies depending on both cluster size and dominant sky conditions, ranging from 20% to 43.5% for the Archon dataset and from 9.4% to 40% for the SKIPP′D dataset.
Based on the results of Table 1, the criticality coefficients r 1 and r 2 in (4) are set to 0.15 and 0.4, respectively. Accordingly, a cluster is characterized as critical for augmentation if it contains less than 15% of the total sky images and is associated with PV power nowcasting nRMSE values exceeding 40% of the installed PV capacity. Nevertheless, r 1 and r 2 can be easily adjusted to reflect the specific characteristics of other datasets, the selected error metric ε i , and the desired sensitivity to nowcasting errors. A more systematic approach for selecting r 1 and r 2 could be based on the number of clusters and the mean per-cluster error, respectively. Specifically, r 1 could be set to 1 / n so that any cluster exceeding its proportional share is considered well represented. For r 2 , a data-driven formulation can be adopted based on the mean and variability of the per-cluster errors, e.g., ε ¯ + 0.5 σ / P , where ε ˉ   and σ denote the mean and standard deviation, respectively, of the per-cluster errors, defining a moderate deviation level from the average error.
Based on above threshold values, clusters 4, 5, and 7 are characterized as critical in the Archon dataset (26.29% of the total dataset), and clusters 2 and 6 for the SKIPP′D dataset (14.01% of the total dataset). In the Archon dataset, clusters 4 and 5 correspond to scattered cloudy conditions, whereas cluster 7 represents overcast conditions; thus, augmenting the sky images of these clusters will improve the representation of both partly cloudy and overcast conditions in the final balanced dataset. Although clusters 3 and 6 are also under-represented, their associated PV power nowcasting errors are comparatively lower, making them less critical for augmentation. In the SKIPP′D dataset, both clusters characterized as critical correspond to challenging conditions for PV power nowcasting. Cluster 2 represents sky images with low solar elevation, characterized by high color and PV power variability, whereas cluster 6 represents clear or nearly clear sky conditions with residual raindrops on the camera lens, indicating recent rainfall. Cluster 8, although under-represented and associated with overcast conditions, is not considered critical for augmentation due to its relatively low nowcasting error; moreover, similar conditions are already represented by cluster 7.

3.4. PV Power Nowcasting Performance with Sky Image Augmentation

Preliminary experiments using the internal validation subset revealed that resampling the critical dataset N = 7 and N = 14 times results in optimal performance for the Archon and SKIPP′D datasets, respectively. Nevertheless, to avoid additional finetuning and to limit scalability issues, a practical approach for selecting N is to set it such that the smallest cluster characterized as critical is up-sampled to match the size of the most highly represented cluster, thereby ensuring a sufficiently balanced dataset. Following the procedure outlined in Section 2.6, the resampled dataset N C is then augmented once with each of the basic augmentation methods described in Section 2.3, as well as with the two proposed hybrid augmentation approaches introduced in Section 2.7. This process results in multiple distinct balanced datasets D     N C * , on which SUNSET is trained for PV power nowcasting. Model performance is subsequently evaluated using the external testing subset (Section 2.4), which comprises the majority of the original data and represents previously unseen sky images.
Table 2 presents the PV power nowcasting performance of SUNSET on the external testing subset after training on balanced datasets generated using five augmentation methods: SMOTE, Mixup-kNN, Mixup-RP, SMOTE in-parallel with Mixup-kNN, and Mixup-kNN followed by in-series augmentation with SMOTE. For reference, baseline results are also reported for training on the original dataset D and on the resampled dataset D     N C . Reported values are means over five runs, with standard deviations shown in parentheses. When trained solely on the base dataset, SUNSET achieves RMSE values of 0.1675 kW and 3.10 kW for the Archon and SKIPP′D datasets, respectively, corresponding to 13.96% and 10.33% of their nominal PV capacities. Although this marks a significant improvement compared to the per-cluster results presented in Table 1—primarily due to the larger size of the base dataset compared to the cluster sizes—it remains suboptimal for accurate PV power nowcasting using sky images. Notably, even simple resampling of the critical dataset leads to significant performance gains of 34.33% for Archon and 18.39% for SKIPP′D, reducing nRMSE to 9.17% and 8.43% of the nominal PV capacities, respectively. These baseline results exhibit the highest standard deviation, primarily due to the cases of overfitting due to inadequate dataset diversity.
Sky image augmentation using SMOTE, Mixup-kNN, and Mixup-RP further improves performance, leading to similar SUNSET results, with nRMSE values ranging from 7.2% to 8.25% of the nominal PV capacity across both datasets. However, the best PV power nowcasting performance is achieved when SUNSET is trained on balanced datasets generated using the two proposed hybrid augmentation approaches. Note that Table 2 reports only the RMSE and nRMSE corresponding to the optimal in-series and in-parallel configurations, i.e., Mixup-kNN followed by SMOTE (in-series), Mixup-kNN applied in-parallel with Mixup-RP and N 1 = 5 (Archon), and SMOTE applied in-parallel with Mixup-kNN and N 1 = 6 (SKIPP′D). For both datasets, the proposed in-series augmentation approach delivers the best performance, reducing RMSE to 0.0808 kW and 1.54 kW for the Archon and SKIPP′D datasets, respectively. These values correspond to 6.73% and 5.13% of the nominal PV capacities, representing an approximate 50% nowcasting error reduction compared to training on the base dataset. Similarly, the proposed in-parallel augmentation approach improves PV power nowcasting performance by 46.75% and 35.81% compared to training on the Archon and SKIPP′D base datasets, respectively, and results in the most stable performance, with an RMSE standard deviation of approximately 0.3% for both datasets.
Table 3 presents the PV power nowcasting performance of SUNSET using different configurations of the hybrid in-series augmentation. In general, all combinations lead to improved performance compared to training on the base and resampled datasets. For both datasets, the best performance is achieved when Mixup-kNN is applied to sky images, followed by SMOTE. For the Archon dataset, comparable performance is also obtained when Mixup-RP is applied after Mixup-kNN, as well as when Mixup-RP is applied after SMOTE. For the SKIPP′D dataset, the remaining combinations result in similar performance, with nRMSE values ranging from 5.83% to 6.07% of the nominal PV capacity.
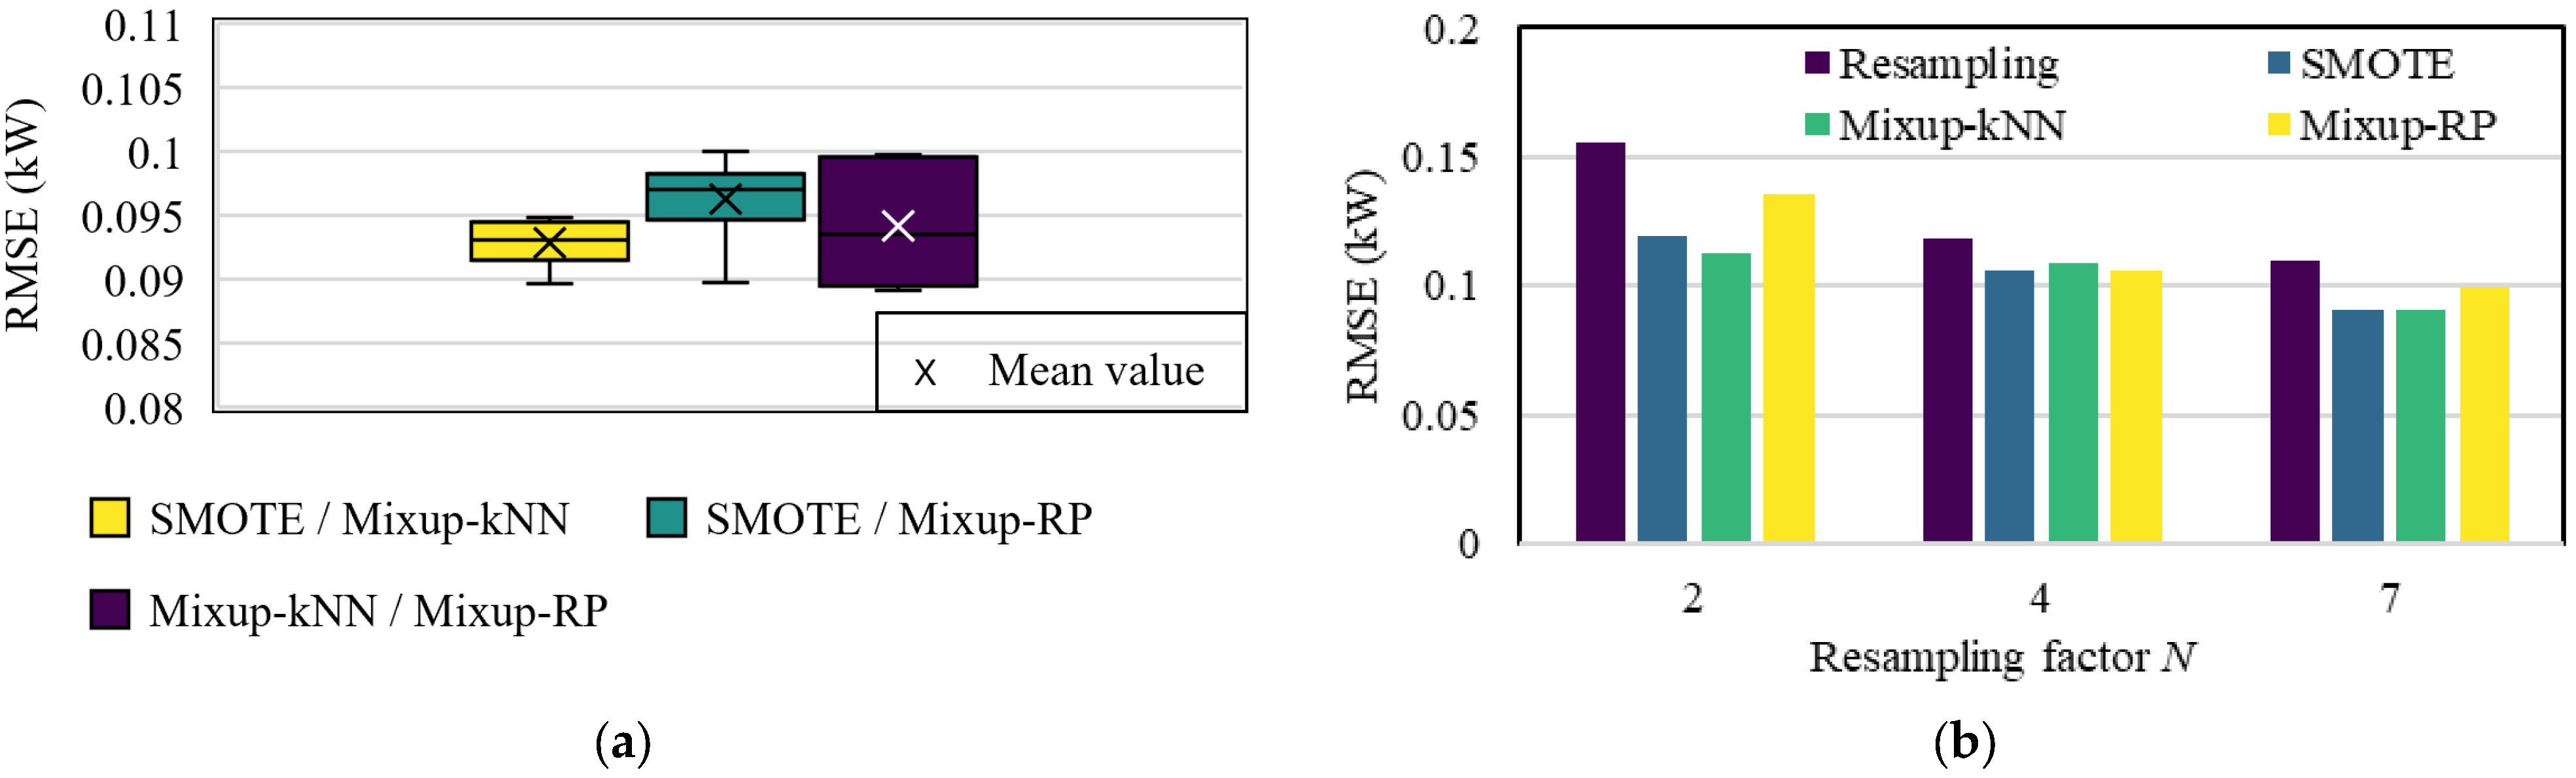
Figure 7a presents a boxplot of the PV power nowcasting performance of SUNSET using different configurations of the hybrid in-parallel augmentation on the Archon dataset. In this setup, all combinations of SMOTE, Mixup-kNN, and Mixup-RP are evaluated across different dataset splits. Specifically, from the seven resampled copies of the critical dataset, N 1 are augmented using one method, while the remaining are augmented using the other, with N 1   { 1 , 2 , 3 , 4 , 5 , 6 } . It is observed that the SMOTE/Mixup-RP in-parallel combination results in the lowest RMSE, but also exhibits the highest variance, with values ranging from 0.0892 kW and 0.0998 kW. In contrast, consistent with the results of the SKIPP′D dataset, the SMOTE/Mixup-kNN in-parallel combination results in the most stable performance and achieves a minimum RMSE of 0.0896 kW, which is very close to the overall optimum. Consequently, SMOTE/Mixup-kNN can be considered as the most robust in-parallel augmentation approach across both datasets.
Figure 7b presents the PV power nowcasting performance of SUNSET on the Archon dataset using SMOTE, Mixup-kNN, and Mixup-RP, under different resampling factors N { 2 , 4 , 7 } . In general, the RMSE decreases as the resampling factor increases, highlighting the beneficial effect of mitigating data scarcity and data imbalances on overall nowcasting performance. Beyond N = 7 , performance improvements were marginal and thus did not justify further increases in the resampling factor. Among the evaluated augmentation methods, Mixup-RP exhibits the most pronounced performance gains with increasing the resampling factor. This may be attributed to its inherent formulation, as it generates synthetic samples by randomly combining images, thereby promoting higher diversity but also introducing additional noise. As the number of generated samples increases, this noise is progressively mitigated through averaging effects, leading to more stable and accurate model performance.
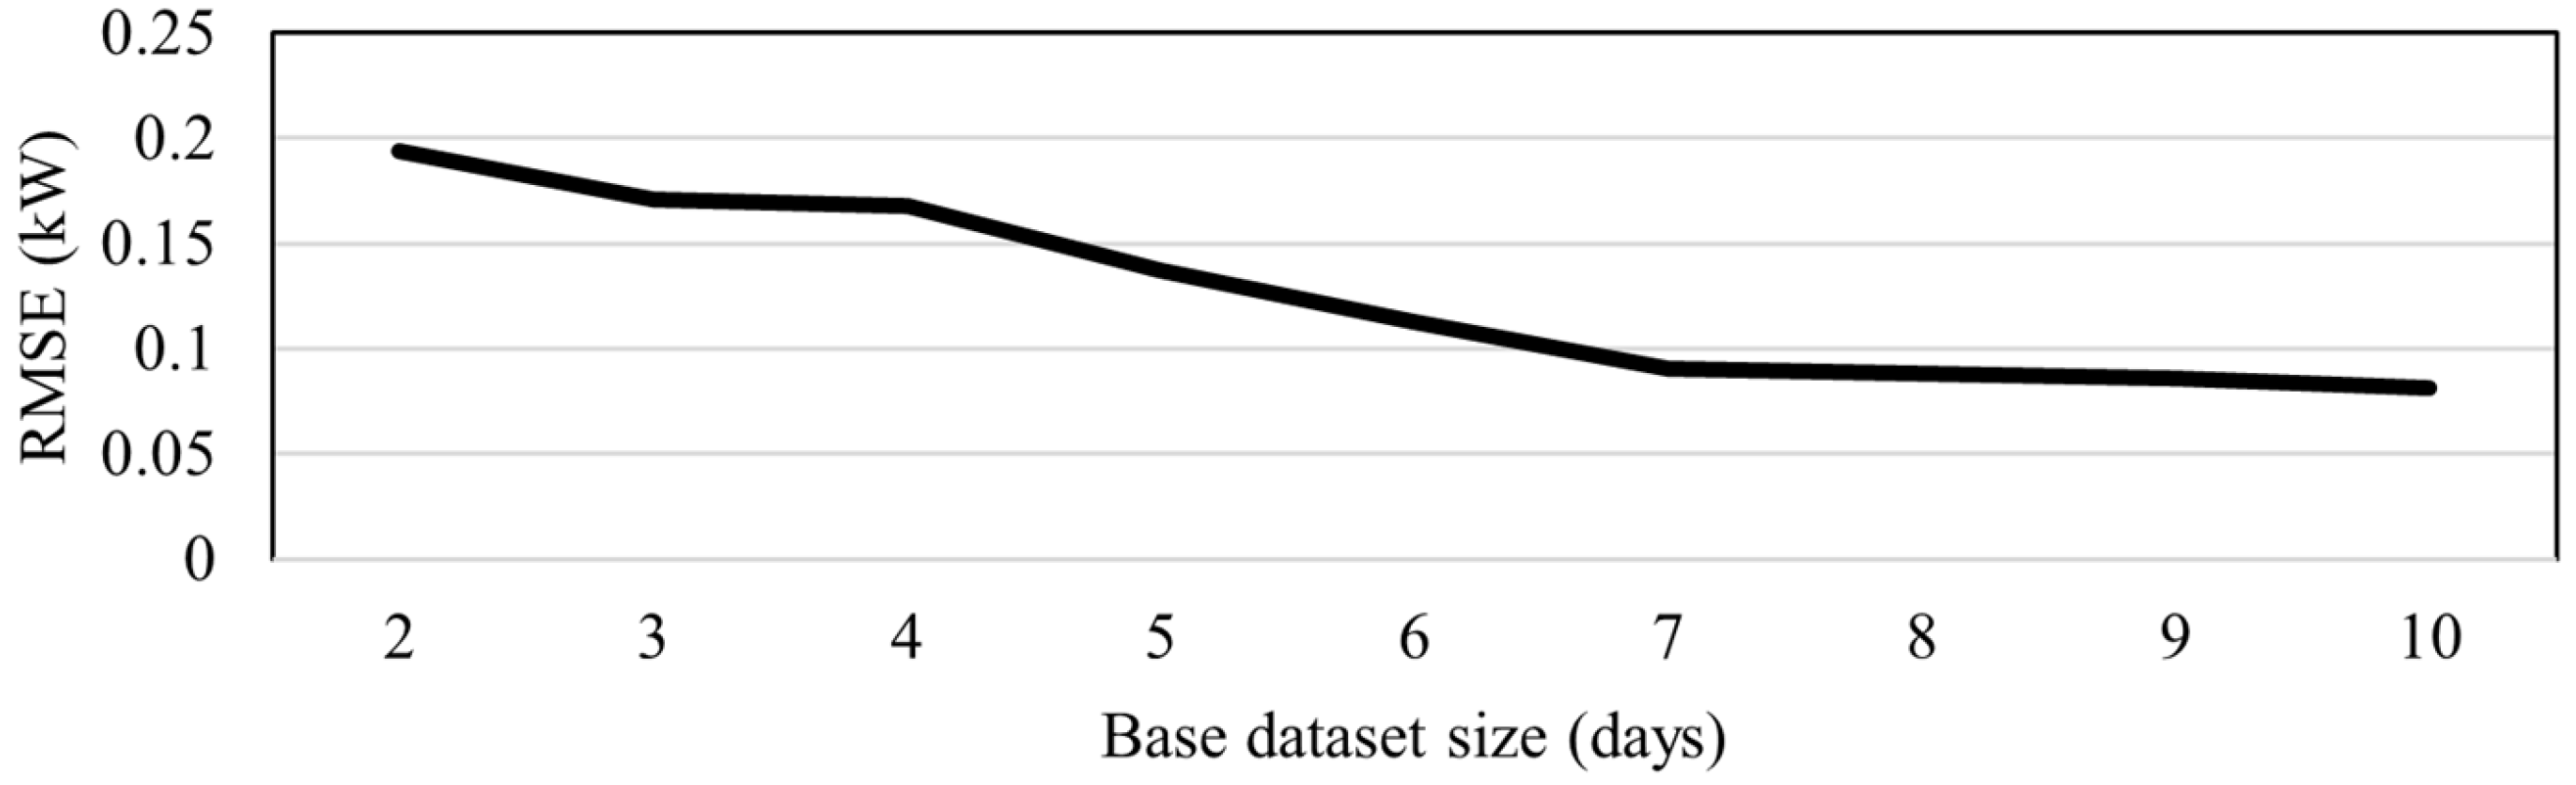
Figure 8 presents the PV power nowcasting performance of SUNSET for different sizes of the Archon base training dataset, using the proposed in-series augmentation of Mixup-kNN followed by SMOTE. Note that all parameters and remaining components (e.g., clustering results) of the proposed framework remain unchanged. As expected, the nowcasting error increases significantly when the base dataset contains less than seven days of data. This is because two or three consecutive days typically exhibit similar sky conditions, resulting in insufficient inherent diversity in the base dataset. Therefore, even with augmentation, it is impossible to create a sufficiently balanced and diverse dataset, when the base dataset contains less than seven days of data. Overall, as evident in Figure 8, PV power nowcasting performance improves as the size of the base dataset increases, with RMSE reducing by up to 60% when using a 10-day base dataset instead of a 2-day base dataset.

4. Discussion

The experimental results highlight the strong influence of both the size and distribution of historical datasets on PV power nowcasting using sky images, as well as the feasibility of achieving reliable performance under data-scarce conditions given appropriate pre-processing. Under such conditions, even simple resampling of specific data clusters leads to significant performance improvements. On the one hand, targeted resampling mitigates inherent dataset imbalances by enhancing the representation of sky images associated with higher PV power nowcasting errors. This enables a deep CNN-based model like SUNSET to learn more uniformly across diverse sky conditions during training and to generalize more effectively when applied to unseen data. On the other hand, models like SUNSET comprise millions of trainable parameters and therefore require sufficiently large datasets for effective training. In this context, increasing the training set size, even by duplicating existing historical samples, can be beneficial when data are limited. These effects are demonstrated throughout this study, from the comparison between the per-cluster performance and the aggregated baseline performance to the improvements achieved by increasing the resampling ratio.
Another key insight from the experimental results concerns the value of data augmentation. Regardless of the augmentation method, SUNSET consistently performs better when trained on augmented datasets than on merely resampled data. By generating synthetic sky images, augmentation increases dataset diversity and, thus, improves CNN generalization under data-scarce conditions. Overall, Mixup-kNN and SMOTE leads to slightly better results compared to Mixup-RP, as they generate synthetic samples by combining neighboring sky images; thus, the created samples are more realistic and introduce less additional noise. Notably, it is the proposed hybrid augmentation approaches that deliver the best PV power nowcasting performance. Their advantage lies not only in enhancing dataset diversity but also in leveraging the complementary strengths of individual augmentation methods, thereby mitigating noise propagation. For in-parallel augmentation, the Mixup-kNN/SMOTE combination provides the most robust performance for both datasets, as it integrates two neighbor-based methods with different sampling distributions, producing diverse yet realistic synthetic sky images. Similarly, in the in-series setting, applying SMOTE after Mixup-kNN exhibits superior performance. Sampling from a Beta distribution, Mixup-kNN first generates a diverse layer of intermediate images, on top of which SMOTE subsequently performs refining augmentation by subtly mixing similar images using a uniform distribution, leading to more stable and effective augmentation.
The proposed sky image augmentation framework generally produces synthetic images that are largely meaningful physically. This is primarily because images are only combined with others that are captured by the same sky camera at the same location, while methods such as SMOTE or Mixup-kNN further constrain image mixing to neighboring samples. In addition, the linear interpolation inherent in these augmentation methods tends to smooth out outliers and extreme color variations. The proposed hybrid in-series augmentation method further enhances robustness to artifacts, as it combines augmentation methods that introduce largely uncorrelated perturbations. That said, in some cases primarily involving Mixup-RP and highly dissimilar image pairs, subtle artifacts may still appear. Figure 9 illustrates such an example for the Archon dataset, where the resulting augmented image exhibits two faint solar disks. Another example is when the aggregated PV power output cannot physically correspond to the synthetic image, e.g., the augmented image may suggest sun-obstructed conditions, but the aggregated PV output remains relatively high, reflecting the contribution of only one of the original images. Under data-scarce conditions, such artifacts do not appear to significantly degrade nowcasting performance, as the nowcasting model can still benefit from the additional variability introduced by these samples, even if they are not entirely meaningful physically. However, in data-abundant settings, the inclusion of physically non-meaningful synthetic images may introduce unnecessary noise and compromise overall nowcasting performance.
It should be noted that the proposed framework has not yet been evaluated with deeper, more contemporary attention-based AI models, such as VTs. These models often include billions of trainable parameters and thus typically require substantially larger datasets to be effectively trained. In this context, they may also necessitate higher resampling factors, more diverse combinations of augmentation methods, or larger base datasets covering multiple seasons. As a result, the applicability and effectiveness of the proposed approach for such AI models remain to be investigated in future work.
Another aspect of this study that remains underexplored and could be investigated in future work is the sensitivity of the proposed framework to the clustering results. Although augmentations are applied uniformly across the entire critical dataset rather than at a cluster-specific level, thereby potentially increasing robustness to misclassifications and outliers, it would be interesting to explore alternative clustering methods based on different principles than k-means, such as density-based clustering (e.g., DBSCAN) or hierarchical clustering. In addition, future work could explore the use of supervised classification methods and labeled sky images to quantify the effect classification errors have on the performance of the proposed framework, thereby providing a more explicit assessment of the framework’s robustness to labeling uncertainty.
An important limitation of the proposed sky image augmentation framework is its deficient scalability due to the large number of parameters that must be specified, i.e., the number of clusters n , thresholds r 1 and r 2 in (4), the resampling factors N and N 1 , and parameter a of the Beta distribution used to sample λ for Mixup-kNN and Mixup-RP. In this paper, N , N 1 , and a were finetuned with grid search, whereas n , r 1 , and r 2 were selected intuitively. Nevertheless, finetuning multiple parameters across different case studies is practically challenging; thus, more systematic and data-driven approaches to determine these parameters should be explored in future work to improve scalability.
It is important to emphasize that this paper explores the potential of accurate PV power nowcasting using sky images under data-scarce conditions, within the broader context of ultra-short-term PV power forecasting using AI and deep learning. As distributed PV systems and data-driven models continue to expand, data abundance cannot always be assumed; thus, developing methods that remain robust under limited data is essential for the reliable integration of PV systems into modern power systems, particularly in terms of reducing operating costs, emissions, and power quality issues. In this context, the results demonstrate that accurate PV power nowcasting is achievable even in extreme data scarcity scenarios, e.g., for newly installed PV systems with only a few weeks of data, provided that appropriate pre-processing is applied. Nevertheless, it should be noted that, under data-abundant conditions, the effectiveness of the proposed framework and the associated insights may be less pronounced, and alternative approaches from the related literature should also be investigated.

5. Conclusions

This paper introduces a holistic sky image augmentation framework for PV power nowcasting using deep CNNs under data-scarce conditions. In the proposed framework, the original limited base dataset is initially clustered using a state-of-the-art sky image clustering method, and each cluster is characterized as critical or non-critical for augmentation based on its relative size and its associated average PV power nowcasting error. Clusters characterized as critical are then resampled and augmented using various data-driven image augmentation methods, along with novel hybrid in-series and in-parallel approaches. The proposed framework is evaluated using two distinct sky image datasets comprising several weeks of data. Experimental results demonstrate that accurate PV power nowcasting is feasible even under limited historical data availability, with the use of augmented datasets, created by the proposed augmentation methods, leading to reductions in average nowcasting error of up to 50%, driven by enhanced CNN generalization due to increased dataset balance, volume, and diversity.

Author Contributions

Conceptualization, M.A.K.-K., V.T. and P.S.G.; methodology, M.A.K.-K., V.T. and P.S.G.; software, M.A.K.-K., V.T. and A.P.G.; validation, M.A.K.-K., V.T., A.P.G. and P.S.G.; formal analysis, M.A.K.-K., V.T. and P.S.G.; investigation, M.A.K.-K., V.T. and A.P.G.; resources, M.A.K.-K. and P.S.G.; data curation, M.A.K.-K., V.T. and P.S.G.; writing—original draft preparation, M.A.K.-K.; writing—review and editing, M.A.K.-K., V.T., A.P.G. and P.S.G.; visualization, M.A.K.-K., V.T. and A.P.G.; supervision, P.S.G.; project administration, P.S.G.; funding acquisition, P.S.G. All authors have read and agreed to the published version of the manuscript.

Funding

This research received no external funding.

Data Availability Statement

The Archon dataset will become available at the project’s site http://archonproject.eu/english.html (accessed on 20 February 2026). The SKIPP′D dataset is available in the publicly accessible repository at https://purl.stanford.edu/jj716hx9049 (accessed on 20 February 2026).

Acknowledgments

The authors acknowledge that one of the datasets used in this study was obtained from the Archon project, and we thank the project team for making these data available.

Conflicts of Interest

The authors declare no conflicts of interest.

Abbreviations

The following abbreviations are used in this manuscript:
AIArtificial Intelligence
ASIAll-Sky Imager
CNNConvolutional Neural Network
FOVField Of View
GANGenerative Adversarial Network
kNNk-Nearest Neighbors
MSEMean Square Error
PCAPrincipal Component Analysis
PVPhotovoltaic
RESRenewable Energy Sources
RMSERoot Mean Square Error
RPRandom Pair
SMOTESynthetic Minority Oversampling Technique
SUNSETStanford University Neural network for Solar Electricity Trend
VTVision Transformer

References

  1. Dritsaki, M.; Dritsaki, C.; Argyriou, V.; Sarigiannidis, P. Impact of Renewable and Non-Renewable Generation on Economic Growth in Greece. Electr. J. 2024, 37, 107421. [Google Scholar] [CrossRef]
  2. Fotis, G.; Maris, T.I.; Mladenov, V. Risks, Obstacles and Challenges of the Electrical Energy Transition in Europe: Greece as a Case Study. Sustainability 2025, 17, 5325. [Google Scholar] [CrossRef]
  3. Cavus, M. Advancing Power Systems with Renewable Energy and Intelligent Technologies: A Comprehensive Review on Grid Transformation and Integration. Electronics 2025, 14, 1159. [Google Scholar] [CrossRef]
  4. Paletta, Q.; Terrén-Serrano, G.; Nie, Y.; Li, B.; Bieker, J.; Zhang, W.; Dubus, L.; Dev, S.; Feng, C. Advances in Solar Forecasting: Computer Vision with Deep Learning. Adv. Appl. Energy 2023, 11, 100150. [Google Scholar] [CrossRef]
  5. Lin, F.; Zhang, Y.; Wang, J. Recent Advances in Intra-Hour Solar Forecasting: A Review of Ground-Based Sky Image Methods. Int. J. Forecast. 2023, 39, 244–265. [Google Scholar] [CrossRef]
  6. Sun, Y.; Venugopal, V.; Brandt, A.R. Short-Term Solar Power Forecast with Deep Learning: Exploring Optimal Input and Output Configuration. Sol. Energy 2019, 188, 730–741. [Google Scholar] [CrossRef]
  7. Sun, Y.; Szűcs, G.; Brandt, A.R. Solar PV Output Prediction from Video Streams Using Convolutional Neural Networks. Energy Environ. Sci. 2018, 11, 1811–1818. [Google Scholar] [CrossRef]
  8. Papatheofanous, E.A.; Kalekis, V.; Venitourakis, G.; Tziolos, F.; Reisis, D. Deep Learning-Based Image Regression for Short-Term Solar Irradiance Forecasting on the Edge. Electronics 2022, 11, 3794. [Google Scholar] [CrossRef]
  9. Venitourakis, G.; Vasilakis, C.; Tsagkaropoulos, A.; Amrou, T.; Konstantoulakis, G.; Golemis, P.; Reisis, D. Neural Network-Based Solar Irradiance Forecast for Edge Computing Devices. Information 2023, 14, 617. [Google Scholar] [CrossRef]
  10. Habibi, M.R.; Golestan, S.; Guerrero, J.M.; Vasquez, J.C. Deep Learning for Forecasting-Based Applications in Cyber–Physical Microgrids: Recent Advances and Future Directions. Electronics 2023, 12, 1685. [Google Scholar] [CrossRef]
  11. Nie, Y.; Zamzam, A.S.; Brandt, A. Resampling and Data Augmentation for Short-Term PV Output Prediction Based on an Imbalanced Sky Images Dataset Using Convolutional Neural Networks. Sol. Energy 2021, 224, 341–354. [Google Scholar] [CrossRef]
  12. Nie, Y.; Paletta, Q.; Scott, A.; Pomares, L.M.; Arbod, G.; Sgouridis, S.; Lasenby, J.; Brandt, A. Sky Image-Based Solar Forecasting Using Deep Learning with Heterogeneous Multi-Location Data: Dataset Fusion versus Transfer Learning. Appl. Energy 2024, 369, 123467. [Google Scholar] [CrossRef]
  13. Nie, Y.; Sun, Y.; Chen, Y.; Orsini, R.; Brandt, A. PV Power Output Prediction from Sky Images Using Convolutional Neural Network: The Comparison of Sky-Condition-Specific Sub-Models and an End-to-End Model. J. Renew. Sustain. Energy 2020, 12, 046101. [Google Scholar] [CrossRef]
  14. Kousounadis-Knousen, M.A.; Catthoor, F.; Bakovasilis, A.; Georgilakis, P.S. Automatic Multiclass Classification of Unlabeled Ground-Based Sky Images for Minute-Scale PV Energy Yield Forecasting. IEEE Access 2025, 13, 120547–120562. [Google Scholar] [CrossRef]
  15. Meddahi, A.; Tuomiranta, A.; Guillon, S. Skill-Driven Data Sampling and Deep Learning Framework for Minute-Scale Solar Forecasting with Sky Images. Sol. RRL 2025, 9, 2400664. [Google Scholar] [CrossRef]
  16. Schizas, S.P.; Kousounadis-Knousen, M.A.; Catthoor, F.; Georgilakis, P.S. Multi-Step Sky Image Prediction Using Cluster-Specific Convolutional Neural Networks for Solar Forecasting Applications. Energies 2025, 18, 5860. [Google Scholar] [CrossRef]
  17. Moreno-Barea, F.J.; Strazzera, F.; Jerez, J.M.; Urda, D.; Franco, L. Forward Noise Adjustment Scheme for Data Augmentation. In Proceedings of the 2018 IEEE Symposium Series on Computational Intelligence (SSCI); IEEE: Piscataway, NJ, USA, 2018; pp. 728–734. [Google Scholar]
  18. Wu, R.; Yan, S.; Shan, Y.; Dang, Q.; Sun, G. Deep Image: Scaling up Image Recognition. arXiv 2015. [Google Scholar] [CrossRef]
  19. Shorten, C.; Khoshgoftaar, T.M. A Survey on Image Data Augmentation for Deep Learning. J. Big Data 2019, 6, 60. [Google Scholar] [CrossRef]
  20. Chawla, N.V.; Bowyer, K.W.; Hall, L.O.; Kegelmeyer, W.P. SMOTE: Synthetic Minority Over-Sampling Technique. J. Artif. Intell. Res. 2002, 16, 321–357. [Google Scholar] [CrossRef]
  21. Zhang, H.; Cisse, M.; Dauphin, Y.N.; Lopez-Paz, D. Mixup: Beyond Empirical Risk Minimization. arXiv 2017. [Google Scholar] [CrossRef]
  22. Chen, Y.; Yang, X.-H.; Wei, Z.; Heidari, A.A.; Zheng, N.; Li, Z.; Chen, H.; Hu, H.; Zhou, Q.; Guan, Q. Generative Adversarial Networks in Medical Image Augmentation: A Review. Comput. Biol. Med. 2022, 144, 105382. [Google Scholar] [CrossRef]
  23. Go, S.-E.; Kim, J.-H.; Chuluunsaikhan, T.; Choi, W.-S.; Choi, S.-H.; Nasridinov, A. Unified Generative Data Augmentation for Efficient Solar Panel Soiling Localization. Electronics 2024, 13, 4859. [Google Scholar] [CrossRef]
  24. Paletta, Q.; Hu, A.; Arbod, G.; Blanc, P.; Lasenby, J. SPIN: Simplifying Polar Invariance for Neural Networks Application to Vision-Based Irradiance Forecasting. In Proceedings of the 2022 IEEE/CVF Conference on Computer Vision and Pattern Recognition Workshops (CVPRW); IEEE: Piscataway, NJ, USA, 2022; pp. 5178–5187. [Google Scholar]
  25. Gentner, T.; Knoell, M.; Adam, J.; Theissler, A.; Klaiber, M. Sky Is the Limit: Exploring Solar Photovoltaic Nowcasting with Sky Images, Transfer Learning, and Data Augmentation. Procedia Comput. Sci. 2025, 270, 1649–1658. [Google Scholar] [CrossRef]
  26. Piechocki, M.; Kraft, M. A Systematic Synthesis of Sky Image Enhancement Techniques for Ground-Based Solar Irradiance Forecasting. Appl. Energy 2026, 410, 127533. [Google Scholar] [CrossRef]
  27. Archon Project. Available online: http://archonproject.eu/english.html (accessed on 20 February 2026).
  28. Nie, Y.; Li, X.; Scott, A.; Sun, Y.; Venugopal, V.; Brandt, A. 2019 Sky Images and Photovoltaic Power Generation Dataset for Short-Term Solar Forecasting (Stanford Raw). Stanford Digital Repository. 2022. Available online: https://purl.stanford.edu/jj716hx9049 (accessed on 20 February 2026).
  29. Kärkkäinen, T.J.; Hänninen, J. Additive Autoencoder for Dimension Estimation. Neurocomputing 2023, 551, 126520. [Google Scholar] [CrossRef]
  30. MacQueen, J. Some Methods for Classification and Analysis of Multivariate Observations. In Proceedings of the 5th Berkeley Symposium on Mathematical Statistics and Probability; Statistical Laboratory of the University of California: Berkeley, CA, USA, 1967; pp. 281–297. [Google Scholar]
  31. Kingma, D.P. Adam: A Method for Stochastic Optimization. arXiv 2014. [Google Scholar] [CrossRef]
Figure 1. Example sky images under clear sky conditions at midday: (a) Archon dataset; (b) SKIPP′D dataset.
Electronics 15 02054 g001
Figure 2. Architecture of the SUNSET PV power nowcasting model [7], along with explicit calculation of the number of trainable parameters per block (excluding biases of fully connected block).
Electronics 15 02054 g002
Figure 3. Sky image augmentation examples for the Archon dataset: (a) SMOTE, with the interpolation coefficient set to λ = 0.4 for all pixels; (b) Mixup-kNN, with the interpolation coefficient sampled from the Beta a , a distribution with a = 0.6 ; and (c) Mixup-RP with the interpolation coefficient sampled from the Beta a , a distribution with a = 0.8 .
Electronics 15 02054 g003
Figure 4. Schematic illustration of the proposed holistic sky image dataset augmentation framework for PV power nowcasting under data-scarce settings.
Electronics 15 02054 g004
Figure 5. Sky image augmentation example of the proposed in-series hybrid approach, combining Mixup-kNN ( α = 0.6 ) and Mixup-RP ( α = 0.8 ) for the Archon dataset.
Electronics 15 02054 g005
Figure 6. Clustering results along with a representative image of each cluster for both sky image base datasets: (a) Archon dataset; (b) SKIPP′D dataset.
Electronics 15 02054 g006
Figure 7. PV power nowcasting performance of SUNSET on the Archon external testing subset using: (a) RMSE boxplot for different in-parallel hybrid augmentations with varying splits, and (b) SMOTE, Mixup-kNN, and Mixup-RP, with varying resampling factors.
Electronics 15 02054 g007
Figure 8. PV power nowcasting error of SUNSET for different sizes of the Archon base training dataset, using the proposed in-series augmentation of Mixup-kNN followed by SMOTE.
Electronics 15 02054 g008
Figure 9. Example of the proposed in-series hybrid augmentation approach combining Mixup-kNN and Mixup-RP that includes artifacts in the final augmented image.
Electronics 15 02054 g009
Table 1. SUNSET per-cluster nowcasting performance for both sky image base datasets.
ArchonSKIPP′D
ClusterSamplesRMSE (kW)nRMSE (%)ClusterSamplesRMSE (kW)nRMSE (%)
118770.1714.17123822.217.37
210230.1058.752100912.0440.13
33850.46438.67311925.9519.83
42810.68557.08419472.137.10
55650.6251.67513998.0426.80
61180.24820.67634517.3757.90
76740.52243.50712546.0420.13
88590.25421.1781352.829.40
Clusters characterized as critical for augmentation are in bold.
Table 2. PV power nowcasting performance of SUNSET on the external testing subset after training with different augmentations of both sky image base datasets. Results for the base and resampling datasets are included as baselines. Reported values are means, with standard deviations in parentheses, over five runs.
Training DatasetAugmentation MethodArchonSKIPP′D
RMSE (W)nRMSE (%)RMSE (kW)nRMSE (%)
Base   ( D )167.5 (22.19)13.96 (1.85)3.10 (0.62)10.33 (2.06)
Resampling   ( D     N C )110 (17.72)9.17 (1.48)2.53 (0.52)8.43 (1.73)
D     N C * SMOTE90.2 (11.78)7.52 (0.98)2.39 (0.32)7.97 (1.06)
D     N C * Mixup-kNN90.5 (13.23)7.54 (1.10)2.16 (0.31)7.20 (1.04)
D     N C * Mixup-RP99 (16.89)8.25 (1.41)2.45 (0.37)8.17 (1.22)
D     N C * Hybrid (in-parallel)89.2 (3.62)7.43 (0.30)1.99 (0.01)6.63 (0.32)
D     N C * Hybrid (in-series)80.8 (6.96)6.73 (0.58)1.54 (0.16)5.13 (0.54)
Best reported values are in bold.
Table 3. PV power nowcasting performance of SUNSET on the external testing subset after training with different augmentations of both sky image datasets using the proposed hybrid in-series approach.
Hybrid in-Series Augmentation MethodArchonSKIPP′D
RMSE (kW)nRMSE (%)RMSE (kW)nRMSE (%)
SMOTE → Mixup-kNN0.09027.521.765.87
SMOTE → Mixup-RP0.08767.31.826.07
Mixup-kNN → SMOTE0.08086.731.545.13
Mixup-kNN → Mixup-RP0.08176.811.806.00
Mixup-RP → SMOTE0.09587.981.775.90
Mixup-RP → Mixup-kNN0.10018.341.755.83
Best reported values are in bold.
Disclaimer/Publisher’s Note: The statements, opinions and data contained in all publications are solely those of the individual author(s) and contributor(s) and not of MDPI and/or the editor(s). MDPI and/or the editor(s) disclaim responsibility for any injury to people or property resulting from any ideas, methods, instructions or products referred to in the content.