


Abstract
This study presents a data-driven analysis of electric powertrain energy flow and traction battery behavior in a modern battery electric vehicle based on real-world on-board diagnostic (OBD) measurements. Time-resolved signals acquired during an urban trip by a Renault 5 E-Tech Electric were processed to reconstruct instantaneous energy exchange between the traction system and the battery, identify distinct operating regimes, and derive physically interpretable empirical models of selected drivetrain relationships. The analysis focused on the traction power, battery current, battery voltage, state of charge, accelerator pedal position, and cell voltage imbalance. The recorded data were decomposed into propulsion, regenerative, and auxiliary-load-dominated operating regimes, which improved the interpretability of the measured signals and the quality of the regression-based models. A second-order model was used to describe the relationship between traction power and accelerator pedal position, while a linear current-voltage model provided a locally accurate approximation of battery electrical behavior. In addition, the dependence of the cell voltage imbalance on the battery current was analyzed as a diagnostic indicator of load-dependent battery response. The results show that auxiliary loads, especially cabin and battery heating under winter conditions, introduce a significant baseline power demand that affects the apparent drivetrain response. Within the analyzed single-trip dataset, the recorded battery signals showed a low cell-voltage imbalance and a consistent local current–voltage trend over the observed operating range. These findings should be interpreted as preliminary and vehicle-specific, since they were obtained from one short winter urban trip and from a restricted set of OBD-accessible signals. Although the study is limited to a single vehicle and a single short trip, it demonstrates that accessible real-world OBD data can support physically interpretable, exploratory analysis of electric powertrain operation and battery response under practical measurement constraints.
1. Introduction
The global number of battery electric vehicles (BEVs) has been rapidly increasing in recent years [1,2,3,4], driven by technological progress [5,6,7], environmental regulations [8,9,10], and the need to reduce greenhouse gas emissions in the transport sector [11,12,13,14,15]. Electric vehicles have proven to be particularly effective in urban mobility [16,17], where frequent stop-and-go operation allows for efficient use of regenerative braking and reduced local emissions [18,19,20,21]. At the same time, continuous improvements in battery capacity [22], charging infrastructure and power electronics have extended their usability beyond city traffic to suburban and intercity applications [23,24,25]. As a result, BEVs are becoming a key element of modern transport systems, offering both environmental and operational advantages across a wide range of driving conditions [26]. Unlike many previous studies based primarily on simulations or laboratory measurements, this work investigates the behavior of a traction battery in a real electric vehicle using diagnostic data obtained from the on-board OBD interface under actual driving conditions.
Battery electric vehicles offer a number of clear operational advantages that contribute to their growing popularity among users [27,28,29]. They are characterized by very low noise levels and smooth, vibration-free operation, which significantly improves driving comfort, especially in urban environments [30]. The electric drivetrain provides high dynamic performance with immediate torque response and very fast control of traction forces, enabling precise and stable vehicle handling that in many situations surpasses the response of the conventional hydraulic control systems used in internal combustion vehicles [31]. In addition, the low position of the traction battery lowers the center of gravity, which improves vehicle stability and cornering behavior [32,33]. An important practical benefit in winter conditions is also the rapid heating of the vehicle interior, enabled by electric heating systems that do not depend on engine warm-up [34].
These advantages are the direct result of the continuous development of the individual components that constitute modern electric vehicles, achieved through the work of scientists and engineers in fields such as power electronics, control engineering, battery technology and vehicle dynamics [35,36]. A contemporary BEV is inherently a mechatronic system in which mechanical, electrical and software subsystems are tightly integrated and co-designed to achieve optimal performance and efficiency [37,38]. Effective control strategies play a central role in coordinating the operation of the traction motor, battery system and auxiliary loads, enabling a fast and precise response to driver inputs and external conditions [39,40]. At the same time, advanced in-vehicle communication networks provide the data backbone for real-time monitoring and control, allowing a high-frequency exchange of information between sensors, controllers and actuators and supporting both operational safety and energy optimization [41,42].
Regulatory frameworks in the European Union and many other regions require vehicle manufacturers to provide access, via the on-board diagnostics (OBD) interface, to a set of parameters describing current vehicle operation, fault codes, and the possibility of performing active diagnostic tests using advanced diagnostic tools [43,44]. This has led to a well-established and widely standardized diagnostic ecosystem in conventional internal combustion engine vehicles, developed over several decades [45,46]. In the case of electric vehicles, however, such standardization is still evolving and remains less consistent, with significant variability in the availability, naming and interpretation of signals exposed through the OBD interface [47]. As a result, researchers and practitioners working with BEV data often face limitations in data accessibility and consistency, which directly affects the scope and resolution of experimental analyses based on OBD measurements [48].
Recent studies on electric and electrified vehicles increasingly emphasize the importance of real-world data for evaluating energy consumption, driving behavior, and battery response under practical operating conditions [49]. Compared with laboratory cycles or simulation-based analyses, real-world CAN/OBD measurements provide direct insight into transient vehicle operation, driver-dependent load variation, regenerative braking events, auxiliary power demand, and battery-voltage response during actual use. However, such datasets are often incomplete, vehicle-specific, and constrained by the diagnostic interface, sampling rate, proprietary signal decoding, and limited availability of high-voltage powertrain variables. Therefore, recent data-driven studies increasingly combine physically interpretable signal processing, empirical modeling, clustering, or regression-based methods to extract useful information from imperfect measurement sets, rather than relying exclusively on fully instrumented experimental platforms.
This situation leads to a number of practical challenges. Most importantly, it complicates the diagnostics, servicing and repair of electric vehicles, as limited or non-standardized access to operational signals reduces the effectiveness of fault identification and maintenance procedures [50,51]. In addition, it hinders experimental research under real driving conditions, as incomplete datasets restrict the development and validation of data-driven models [52,53]. This limitation can negatively impact the progress of advanced transport technologies, including autonomous driving systems, which rely on high-quality and comprehensive real-world vehicle data for their development and testing [54].
In the context of battery diagnostics, cell-voltage consistency and voltage imbalance have been increasingly considered as useful indicators of load-dependent battery behavior and potential cell-to-cell heterogeneity [55]. Nevertheless, the interpretation of such indicators under real driving conditions remains challenging because voltage imbalance depends not only on the current, but also on the SOC, temperature, transient load history, BMS sampling strategy, and cell-level variability [56]. For this reason, OBD-derived voltage-imbalance signals should be treated with caution and are particularly suitable for exploratory, dataset-specific analysis, rather than direct general diagnostic inference. This motivates the present study, in which cell voltage imbalance is analyzed as an accessible but limited diagnostic indicator derived from real-world OBD data.
In this study, the authors use one of the newest electric vehicles currently available on the market, the Renault 5 E-Tech Electric, together with an experimental communication application based on the OBD ELM327 interface to acquire measurement data from real vehicle operation [57]. The collected signals are then assessed in terms of quality and completeness and subsequently used to build data-driven models of selected components of the electric powertrain [58]. This approach enables the evaluation of the practical usability of OBD-based measurements for the analysis, diagnostics and modeling of modern passenger electric vehicles [59].
The objective of this study is to demonstrate, using a single short real-world trip as an illustrative case, the feasibility of deriving physically interpretable empirical relationships that describe selected aspects of energy flow and battery behavior in a modern battery electric vehicle from limited OBD data acquired under real driving conditions [60,61]. The scope of the research includes the acquisition and preprocessing of time-resolved electrical signals, driving regime segmentation, modeling of traction power as a function of accelerator pedal position, and determination of current–voltage characteristics of the traction battery [62]. In addition, the study introduces the use of cell voltage imbalance ΔU as a diagnostic indicator and analyses its dependence on battery current using regression models [63]. The research is limited to electrical and energy-based variables due to the absence of vehicle speed and motor speed signals in the dataset, which reflects the practical constraints of experimental OBD-based data acquisition. The obtained results are intended to assess the usefulness of accessible OBD data for modeling, diagnostics and future digital-twin-oriented studies of electric vehicles.
The main contributions of this study can be summarized as follows:
- (1)
- An experimental analysis of traction battery behavior in a real electric vehicle based on high-resolution OBD data collected during real driving conditions.
- (2)
- Empirical characterization and modeling of relationships between selected operational variables of the electric drivetrain, including the battery current, voltage imbalance, accelerator pedal position, and traction power.
- (3)
- Demonstration that decomposing the dataset into specific operating regimes (e.g., propulsion mode) significantly improves the accuracy and interpretability of empirical regression models.
The remainder of this paper presents a data-driven analysis of traction battery behavior in a real electric vehicle using OBD data, with particular emphasis on modeling the relationships between key drivetrain variables and demonstrating the benefits of decomposing operating regimes for improved regression accuracy.
The present work differs from studies based on extended fleets, repeated drive cycles, controlled battery tests, or complete drivetrain telemetry. Instead, it deliberately focuses on a constrained real-world dataset recorded during one short winter urban trip of a Renault 5 E-Tech Electric. The objective is not to derive statistically generalizable battery or powertrain models, but to demonstrate how limited OBD data can be organized into a physically interpretable workflow including energy-flow reconstruction, operating-region segmentation, local current–voltage modeling, power–pedal regression, and exploratory analysis of cell-voltage imbalance. In this sense, the contribution of this study lies in the transparent extraction of engineering information from practically accessible OBD signals under uncertainty.
In contrast to studies aimed at developing general predictive models from large datasets, the present work focuses on a single, constrained OBD recording and evaluates how much physically interpretable information can be extracted from the signals that are actually accessible in a modern BEV through a non-invasive diagnostic interface.
The contribution of this study is not the development of a general battery or drivetrain model, but the demonstration of a transparent workflow for extracting physically interpretable empirical relationships from limited real-world OBD data acquired from a modern BEV under practical measurement constraints. Therefore, the novelty of this work lies not in proposing a general battery or powertrain model, but in demonstrating how a limited, irregularly sampled, real-world OBD dataset can be transformed into a reproducible and physically interpretable set of empirical relationships describing selected aspects of the BEV energy flow and battery response.
2. Materials and Methods
2.1. Vehicle and Measurement Setup
The experimental study was conducted using a battery electric passenger vehicle Renault 5 E-Tech Electric (Douai, France) operating under real urban driving conditions [64]. The measurements were performed during a short winter trip, which allowed for the observation of both the traction energy demand and auxiliary loads related to cabin and battery heating.
The experimental vehicle used in this study is a Renault 5 E-Tech Electric equipped with an electric motor rated at 88 kW (approximately 120 HP) and a traction battery with a nominal capacity of 40 kWh. The vehicle supports both fast DC charging via the CCS interface with a maximum power of 85 kW and AC charging via a Type 2 connector with a maximum power of 11 kW [65,66]. The research vehicle is shown in Figure 1.
Figure 1.
Experimental vehicle Renault 5 E-Tech Electric during charging at the test location.
2.2. Recorded Signals and Data Scope
For data acquisition [67,68], a Vgate ELM327 OBD (Shenzhen, China) interface was used together with an experimental application dedicated to Renault electric vehicles, Car Scanner Pro (Rostov-on-Don, Russia) [69], which enabled real-time recording of selected operational parameters.
The dataset includes time-resolved electrical and control signals describing the operation of the traction system and battery pack. The most relevant variables used in the analysis are:
- Traction power P [kW];
- Battery current I [A];
- Battery voltage U [V];
- State of charge (SOC) [%];
- Accelerator pedal position [%];
- Cell voltage imbalance ΔU [mV];
- Selected battery temperature signals (min/max/cooling).
The dataset does not include vehicle speed or electric motor speed signals due to the limitations of the experimental OBD interface and data availability during the measurement campaign. All electrical quantities were expressed in SI units, with power in kW, current in A and voltage in V.
2.3. Data Preprocessing
The raw OBD data were preprocessed prior to analysis [70,71]. This included:
- Removal of missing and non-numeric values;
- Synchronization of time stamps;
- Conversion of time to relative minutes;
- Filtering of physically inconsistent samples.
The resulting dataset represents a continuous time series describing the full driving event.
2.4. Energy Flow Reconstruction
Instantaneous energy flow was reconstructed using the measured traction power signal. Positive values of P correspond to propulsion mode (energy drawn from the battery), while negative values correspond to regenerative braking (energy returned to the battery). The cumulative energy of the trip was calculated as the time integral of the traction power:
This allowed the determination of the total energy consumed and recovered during the analyzed trip.
2.5. Driving Regime Decomposition
Based on the sign and magnitude of the measured traction power, the recorded driving process was decomposed into operating regions used for exploratory interpretation: propulsion-dominated operation, regenerative operation, and a low-power region that was likely influenced by auxiliary loads [72]. Positive power values correspond to energy drawn from the battery, while negative values correspond to regenerative braking. In addition, the interval 0 ≤ P ≤ 8 kW was treated as a local low-power band observed in the analyzed winter trip. This threshold was selected empirically from the recorded dataset to separate the persistent baseline power region from higher-power propulsion events. Since the OBD dataset did not include direct measurements of cabin heating or battery thermal-management power, this band should not be interpreted as a directly measured heating regime. It is instead referred to as a low-power operation likely influenced by auxiliary loads, including cabin heating, battery thermal management, and onboard electrical systems.
2.6. Regression Models
Several regression models were developed to obtain physically interpretable relationships:
(a) Traction model:
modeled using a second-order polynomial regression.
(b) Battery electrical model:
modeled using linear regression to represent the ohmic behavior of the battery pack.
(c) Diagnostic/exploratory model:
modeled using low-order polynomial regressions to describe possible load-dependent tendencies in the recorded cell voltage imbalance signal. The polynomial models were treated as descriptive empirical fits, not as identified electrochemical models.
The regression models used in this study are intended as low-order empirical approximations of relationships observed in the recorded OBD dataset, rather than as fully identified general battery or powertrain models. Their role is to provide physically interpretable descriptions of selected dependencies within the analyzed operating range of the recorded trip. Owing to the limited scope of the dataset, including a single trip and restricted signal availability, the adopted models are not intended to resolve the full dynamic structure of the battery or drivetrain, but rather to support an exploratory interpretation of the measured electrical variables.
Polynomial orders were selected to balance the empirical fitting quality and interpretability. The second-order polynomial used for the accelerator-pedal–power relationship was the lowest-order nonlinear model able to represent the observed curvature of the local power response. Higher-order terms were avoided to reduce overfitting and preserve interpretability. For the ΔU–current relationship, linear, second-order, and third-order models were compared using R2, RMSE, and MAE. Although the third-order polynomial gave the best numerical fit, it was retained only as a descriptive dataset-specific approximation and not as a general electrochemical model.
2.7. Statistical Analysis and Visualization
The analysis included:
- Time-series plots;
- Histograms and distributions;
- Scatter plots with regression models;
- Regime segmentation plots.
All figures were generated using Python 3.13.5-based data analysis tools and prepared in a high-resolution format that was suitable for publication.
The overall data acquisition and processing workflow is presented in Figure 2.
Figure 2.
Data acquisition and processing workflow for energy flow and battery behavior analysis based on OBD measurements.
To improve the reproducibility and transparency of the proposed data-processing workflow, the main analytical steps are additionally summarized in Appendix A in the form of pseudocode. The pseudocode describes the sequence of operations applied to the OBD time-series dataset, including data import, timestamp conversion, filtering of invalid records, calculation of variable sampling intervals, numerical integration of traction power, operating-regime segmentation, regression-model fitting, error-metric calculation, and figure generation.
2.8. OBD Data Quality and Signal Reliability
The OBD-derived dataset used in this study should be interpreted in the context of practical diagnostic interface limitations. The analyzed recording contained 3232 samples acquired over approximately 12.57 min. The sampling interval was not uniform: the median time step was 0.154 s, with an interquartile range of 0.13–0.216 s, corresponding to a typical effective sampling frequency of approximately 6–8 Hz. However, occasional interruptions were present, with the maximum time gap reaching approximately 93.27 s. Therefore, the OBD stream was treated as an irregularly sampled time series, rather than as a uniformly sampled measurement sequence.
This has direct implications for the energy-flow reconstruction. To avoid bias associated with assuming a constant sampling period, the traction energy was calculated by numerical integration of the measured traction-power signal, using the actual time intervals between consecutive OBD records. Short irregularities in sampling may affect the representation of fast transients; however, the integration procedure remains appropriate for estimating the cumulative energy balance over the recorded trip because it accounts for the real elapsed time between samples. The calculated energy values should therefore be interpreted as trip-specific estimates derived from the available OBD power signal, not as high-precision laboratory-grade energy measurements.
Signal reliability also differs between the analyzed variables. The battery current, battery voltage, state of charge, traction power, accelerator pedal position, and cell-voltage imbalance were obtained from the OBD-accessible diagnostic stream and processed as exported by the application. Some EV-specific signals are based on proprietary vehicle communication and application-level decoding; therefore, their underlying CAN identifiers or proprietary PIDs could not be independently verified. Consequently, the analysis focuses on internally consistent relationships between simultaneously recorded signals rather than on manufacturer-level validation of each diagnostic parameter.
The absence of vehicle speed and motor speed is a major limitation for drivetrain interpretation. In particular, the accelerator-pedal–power model cannot distinguish between driver torque demand, power demand, and speed-dependent drivetrain control maps. Therefore, this model is interpreted only as a local empirical surrogate describing the observed relationship between accelerator pedal position and measured traction power during the recorded trip. A physically complete drivetrain model would require vehicle speed, motor speed, and preferably torque-related signals.
By contrast, the current–voltage relationship and the cell-voltage-imbalance analysis are based on directly recorded electrical or BMS-related quantities and are less directly affected by the absence of speed signals. Nevertheless, these models remain local, low-order empirical approximations. Their validity is restricted by the narrow SOC interval, winter operating conditions, possible BMS sampling asynchrony, and the limited duration of the recording. For this reason, the regression models are used only for an exploratory interpretation of the analyzed dataset and should not be generalized without independent validation on additional trips and vehicles.
2.9. Reproducibility and Data Availability
To improve reproducibility, the complete list of OBD-derived signals used in the analysis is provided in Appendix B. The table reports the signal names as exported from Car Scanner Pro, physical units, their analytical role, and information on availability. Data were acquired using a Vgate ELM327-compatible diagnostic interface and Car Scanner Pro 2.1.15 configured for Renault electric-vehicle parameters. It should be noted that some EV-specific parameters available through the application are based on proprietary vehicle communication and application-level decoding; therefore, the underlying CAN identifiers or proprietary PIDs are not fully disclosed and could not be independently verified. For this reason, the manuscript reports the exact exported signal names and units, rather than claiming full access to manufacturer-level CAN definitions.
To support reproducibility without publishing the complete raw OBD log, Appendix A provides the pseudocode of the data-processing and modeling workflow, whereas Appendix B reports the complete list of OBD-derived signals used in the analysis, including signal names, units, analytical roles, exported sources, and PID/CAN identifier availability. Vehicle-identifying information, user-specific metadata, and location-related information were removed before sharing. The data-processing workflow included the removal of missing and non-numeric values, conversion of timestamps to relative time, treatment of the OBD stream as an irregularly sampled time series, and numerical integration of traction power using the actual time intervals between consecutive records.
3. Results
Section 3 presents the results of the experimental analysis of the electric vehicle based on time-resolved OBD measurement data. The results include energy flow reconstruction, driving regime segmentation, and regression-based empirical models describing selected aspects of traction-system and battery behavior. The analysis is organized from basic time-series representations towards physically interpretable models of energy conversion and battery response.
3.1. Drive Energy
Figure 3 shows the time histories of key energy quantities recorded during a short urban trip of a Renault 5 E-Tech Electric electric vehicle (Douai, France). The traction power, battery current, battery pack voltage, and state of charge are summarized on a common timeline expressed in minutes, allowing for a direct observation of the interdependencies between these quantities. Clear power and current pulses are visible, corresponding to acceleration phases, as well as periods of low variability corresponding to steady-state driving. During braking, negative power values and a change in current flow direction appear, indicating energy recuperation. Changes in battery voltage reflect the battery’s dynamic electrochemical response to transient loads. The state of charge profile changes slowly, confirming low energy consumption during the short trip. Combining these signals into a single time representation allows for a comprehensive interpretation of the trip’s energy profile.
Figure 3.
Time-resolved OBD signals recorded during the analyzed Renault 5 E-Tech Electric urban trip: traction power, battery current, battery voltage, and state of charge.
A visual inspection of the multi-channel OBD time series is useful for identifying major events such as acceleration, regenerative braking, or low-power operation, but it is insufficient for quantifying relationships between electrical and control variables. For this reason, the present analysis combines time-series visualization with regression modeling, operating-regime segmentation, and error metrics. This approach enables a more objective interpretation of the recorded power, current, voltage, SOC, and cell-imbalance signals within the limitations of the available dataset.
Figure 4 shows the relationship between the traction power of an electric vehicle and the cumulative energy determined as the power–time integral during a short urban trip. The upper panel shows the power curve, with the area under the curve highlighted, representing energy consumed or recovered during individual driving phases. Positive power values represent energy consumption during acceleration and steady-state driving, while negative values correspond to the recuperation process. The lower panel shows the cumulative energy as a function of time, which increases with the trip duration and accounts for both consumption and partial energy recovery. Changes in the slope of the energy curve reflect the dynamics of the vehicle’s energy loads over subsequent sections of the route. This allows for a clear connection between instantaneous power profiles and the overall energy balance of the trip.
Figure 4.
Energy reconstruction from the measured traction-power signal: instantaneous traction power and cumulative trip energy calculated using actual OBD sampling intervals.
Time-series graphs have limited diagnostic value because they only show the time history of individual signals, without revealing deeper relationships between variables. With large data sets, their interpretation becomes unclear and prevents effective use of the potential of Big Data analysis. Identifying relationships between signals, such as correlations, nonlinear interdependencies, and dynamic system characteristics, which better reflect the actual behavior of the system, is crucial. Only multivariate analysis enables the extraction of diagnostic, operational, and energy information at a level that is unavailable with simple time histories. In this context, physical models based on actual measurement data are particularly promising. They combine engineering interpretation with a data-driven approach and allow for the construction of physically interpretable empirical models of drive-system operation.
The graph in Figure 5 shows a clear negative dependence of the pack voltage on the battery current, consistent with the classic electrochemical behavior of cells under load. As the discharge current increases, a voltage drop is observed due to internal resistance and polarization effects. The slope of the regression line provides an approximate measure of the system’s effective dynamic resistance. The scatter of points around the line results from transient operating states, temperature changes, and the influence of the battery management system. The resulting linear model provides a useful simplification for energy analysis and diagnostics under real-world operating conditions. For the voltage–current relationship shown in Figure 5, the linear regression model achieves R2 = 0.951, RMSE = 1.63 V, and MAE = 1.26 V, confirming the good agreement between the model and the experimental data.
Figure 5.
Battery pack voltage as a function of battery current with local linear regression fitted to the analyzed OBD dataset.
The voltage–current regression model we developed provides the simplest physical approximation of the operation of an electric vehicle’s drive system, corresponding to the linear characteristic of a voltage source with internal resistance. This relationship reflects the basic model of an electric motor and battery as a power system, in which the voltage drop is proportional to the current drawn. A linear regression was used because, within the analyzed operating range, the relationship between the battery voltage and current follows an approximately linear trend that is consistent with the internal resistance model of the battery.
3.2. Battery Status (BMS)
Figure 6 presents the voltage asymmetry of the cell of the tested vehicle. The ΔU signal was obtained directly from the BMS via the OBD interface; due to the proprietary nature of many EV diagnostic parameters, the exact internal definition of this signal is not publicly documented. The diagnostic interface provides both the maximum and minimum cell voltages in the battery pack, allowing the cell voltage imbalance to be interpreted as ΔU = Umax − Umin. Occasional negative values observed in the dataset are attributed to asynchronous sampling of BMS signals through the OBD interface during dynamic driving conditions.
Figure 6.
Cell voltage imbalance ΔU recorded during the analyzed trip: (a) time series of ΔU and (b) distribution of ΔU values.
Figure 6a presents the time evolution of the cell voltage imbalance ΔU obtained directly from the measurement data recorded during the analyzed trip. The signal reflects instantaneous differences in cell voltages under dynamic driving conditions and provides a direct insight into the electrochemical response of the traction battery. The observed variations correspond to changes in load and regenerative events occurring along the route. The recorded ΔU profile constitutes the primary dataset for further analysis of both driving dynamics and battery behavior under real operating conditions.
Figure 6b presents the statistical distribution of cell voltage imbalance ΔU obtained from the entire analyzed trip. The histogram is strongly concentrated around low values of ΔU, indicating that the battery pack remains well balanced during the majority of the operation. The distribution exhibits a narrow central peak with a small number of higher-value outliers corresponding to periods of dynamic loading. The slight asymmetry of the distribution reflects different operating regimes such as propulsion and regenerative braking. The recorded battery signals indicated stable behavior within the analyzed trip.
Figure 7 presents the relationship between the battery current and cell voltage imbalance ΔU together with linear, second-order, and third-order regression models fitted to the experimental dataset. The purpose of this comparison is exploratory and descriptive. The fitted curves are used to assess whether a weak load-dependent tendency can be observed in the recorded ΔU signal, rather than to identify a general electrochemical model of cell imbalance. Since ΔU is affected by asynchronous BMS sampling, transient load changes, cell-to-cell variability, and measurement limitations of the OBD interface, the regression results should be interpreted with caution.
Figure 7.
Exploratory relationship between battery current and cell voltage imbalance ΔU with low-order descriptive regression fits. The polynomial models are dataset-specific and are not intended as general electrochemical models.
To assess the robustness of the regression approach, linear, second-order polynomial, and third-order polynomial models were fitted to the experimental dataset describing the relationship between battery current and cell voltage imbalance (ΔU). The comparison is shown in Figure 7 and summarized in Table 1.
Table 1.
Comparison of regression models for the relationship between battery current and cell voltage imbalance ΔU.
Among the tested models, the third-order polynomial provided the highest coefficient of determination (R2 = 0.259) and the lowest RMSE (24.73 mV) and MAE (10.31 mV). However, the R2 value remains low, indicating that only a limited fraction of the variance in ΔU is explained by the battery current alone. Therefore, the improvement over the lower-order models should be interpreted cautiously. The third-order polynomial is used here only as a descriptive fit for the analyzed dataset and not as evidence of a general nonlinear electrochemical relationship. The third-order polynomial is retained only as a descriptive, dataset-specific fit and should not be interpreted as a validated electrochemical model of cell voltage imbalance.
The third-order polynomial should not be interpreted term-by-term as a physically identified electrochemical model. In particular, the cubic term is not treated here as direct evidence of additional high-load nonlinearities. The low R2 value indicates that the cell voltage imbalance is influenced by factors that are not represented in the single-variable regression, including transient operating conditions, BMS sampling asynchrony, cell-level variability, temperature, SOC, and possible measurement noise. For this reason, the polynomial model is retained only as a dataset-specific descriptive approximation of the observed ΔU–current tendency. Further validation using independent trips, controlled current excitation, broader operating conditions, and direct BMS-level measurements would be required before assigning a robust electrochemical interpretation to this relationship.
3.3. Driving Regimes
The recorded time series of the traction power and battery current reveal the clearly distinguishable operating regimes of the electric vehicle during real-world driving. Based on the sign and magnitude of the traction power signal, three primary regimes can be defined: propulsion (P > 0), regenerative braking (P < 0), and idle or near-zero power operation (P ≈ 0).
The propulsion regime corresponds to periods of positive traction power and positive battery current, indicating energy flow from the battery to the electric motor. These intervals are characterized by dynamic variations in power associated with acceleration and load changes. The regenerative regime is defined by negative power values and a reversed current direction, indicating energy recovery from vehicle motion back to the battery system. The idle regime corresponds to near-zero power levels, typically observed during vehicle standstill or low-load cruising.
Figure 8 presents the time-resolved segmentation of driving regimes based on traction power, with the idle operating range clearly indicated as the green band corresponding to 0–8 kW.
Figure 8.
Segmentation of the recorded traction-power signal with the empirically selected low-power region likely influenced by auxiliary loads, 0–8 kW, highlighted.
The separation of these regimes allows for the analysis of the propulsion system under more homogeneous conditions, significantly improving the interpretability of relationships such as power–pedal position or current–voltage characteristics. In particular, the propulsion regime provides a clean dataset for modeling driver demand and motor response, while the regenerative regime enables the assessment of energy recovery efficiency and battery response under charging conditions.
Figure 9 illustrates the relationship between traction power and accelerator pedal position in both the full operating range and the propulsion-only regime. Figure 9a presents the overall dataset, including both propulsion and regenerative operation, while Figure 9b focuses exclusively on the propulsion mode (P > 0), providing a clearer view of the driver demand–power response. A second-order polynomial model was selected as the simplest function capable of capturing the nonlinear relationship between the accelerator pedal position and EV power while avoiding unnecessary model complexity. In electric vehicles, the accelerator pedal signal is translated by the control system into a torque request, which is further shaped by drivetrain control strategies and operational constraints. As a result, the increase in traction power with pedal position is not perfectly linear and tends to exhibit a mild nonlinear saturation at higher pedal inputs due to torque limits, inverter control, and battery power constraints.
Figure 9.
Relationship between traction power and accelerator pedal position with second-order polynomial regression models: (a) full recorded operating range and (b) propulsion-dominated operation, P > 0.
The second-order polynomial was selected as a compromise between model simplicity and the need to represent the nonlinear character of the observed accelerator-pedal–power response. It was not intended to reconstruct the full drivetrain control map, but to provide a local empirical approximation within the recorded dataset.
In both cases, the coefficients for APP2 and APP are very similar (i.e., the curvature and slope of the control characteristic remain virtually unchanged), but the intercept differs. For the “full-range” model, the intercept is 17.9 kW, and for the model limited to the P > 0 drive mode, it is 24.0 kW, meaning that the difference in intercepts is approximately 6.1 kW. This difference can be interpreted as a shift in the base power level resulting from data selection and the dominance of positive power in the P > 0 set, as well as the presence of fixed auxiliary loads. In practice, a value of ~6 kW is consistent with the previously observed auxiliary load level (cabin and battery heating) in the range of several kilowatts, which increases the “background” power regardless of the pedal signal itself. The model obtained after data decomposition is therefore more representative and has a smaller fitting error, so it can be used more effectively for empirical interpretation of the electric vehicle drive-system response within the analyzed operating range. This is a very practical conclusion resulting from the data decomposition performed, which directly translates into the improved modeling quality of the electric vehicle drive system.
It should be emphasized that, due to the absence of vehicle speed and motor speed signals, the observed power–pedal relationship cannot be interpreted as a pure torque-demand characteristic. The fitted polynomial describes the combined effect of accelerator pedal position, unobserved vehicle-speed-dependent control maps, drivetrain operating conditions, and auxiliary loads. For this reason, the model is used here only as an empirical description of the recorded OBD dataset, rather than as a general drivetrain control characteristic.
To quantitatively evaluate the second-order polynomial regression models describing the relationship between EV power and accelerator pedal position (Figure 9), the goodness-of-fit and error metrics (R2, RMSE, and MAE) were calculated. The results are summarized in Table 2.
Table 2.
Error metrics of the second-order polynomial regression models describing the relationship between EV power and accelerator pedal position (Figure 9), evaluated using R2, RMSE, and MAE.
Although the regression models presented in Figure 9a,b have similar polynomial structures, the model corresponding to propulsion mode (P > 0) shows significantly better agreement with the experimental data. As indicated in Table 2, this model achieves a higher R2 and lower RMSE and MAE values, which reflects the more consistent relationship between the accelerator pedal position and traction power during propulsion compared with the full operating range. The decomposition of the dataset into propulsion mode significantly improved the modeling accuracy, as evidenced by the clear reduction in the regression error metrics.
Figure 10 presents the current–voltage characteristics of the traction battery derived from the measurement data. Figure 10a shows the full operating range, while Figure 10b focuses on the propulsion regime (P > 0), enabling a comparison of the electrical response of the battery under different operating conditions. It should be noted that the linear voltage–current model represents a simplified approximation, since in lithium-ion batteries, the open-circuit voltage is nonlinear with the SOC and the internal resistance depends on the SOC, temperature, and operating conditions. The linear model represents a local approximation of the voltage–current relationship within the analyzed operating range.
Figure 10.
Battery current–voltage relationship with local linear regression models: (a) full recorded operating range and (b) propulsion-dominated operation, P > 0.
For the current-voltage characteristic, decomposing the data into the full range and the P > 0 drive mode does not introduce significant changes to the regression model. The resulting linear equations have nearly identical slopes and intercepts, indicating a stable and repeatable electrochemical response of the battery pack regardless of the operating mode. The high values of the coefficient of determination R2 obtained for both cases confirm the very good fit of the linear model and the dominant character of the ohmic relationship. This result indicates that, unlike the power model, decomposition is not necessary in the voltage–current analysis to obtain a useful local empirical approximation of the voltage–current relationship.
To quantitatively assess the linear regression models describing the traction battery current–voltage characteristics in Figure 10, the goodness-of-fit and error metrics (R2, RMSE, and MAE) were calculated. The results are presented in Table 3.
Table 3.
Statistical performance of the linear regression models describing the traction battery current–voltage relationship shown in Figure 10, evaluated using the coefficient of determination (R2), root mean square error (RMSE), and mean absolute error (MAE).
During the analyzed trip, the OBD-reported SOC varied from 60.39% to 64.71%, corresponding to a total SOC range of approximately 4.31 percentage points. The first and last recorded SOC values were 64.71% and 60.78%, respectively, indicating a net decrease of approximately 3.92 percentage points over the analyzed trip. It should also be noted that the SOC signal was quantized and changed stepwise, which limits its usefulness for detailed OCV–SOC modeling during such a short measurement.
Therefore, the high R2 of the current–voltage regression should be interpreted as a local result obtained within a narrow and quantized SOC interval, rather than as evidence of a general battery voltage model independent of SOC. The regression intercept should be treated only as an empirical parameter of the local approximation and not as a physically identified open-circuit voltage.
The regression model fitted to the propulsion mode dataset shows slightly improved accuracy compared with the full operating range, as indicated by the higher R2 and lower RMSE and MAE values.
From a methodological perspective, the decomposition of driving data into regimes constitutes an essential step in transitioning from raw time-series analysis to physically interpretable models of energy flow and system behavior.
3.4. Operating Conditions
The analyzed dataset represents a short urban trip performed under real winter operating conditions, which significantly influence the energy balance of the electric vehicle. The recorded traction power and battery current signals indicate that, in addition to propulsion, a substantial portion of the total energy demand is associated with auxiliary loads: primarily cabin heating and battery thermal management.
This effect is clearly visible in the low-power operating range, where a constant baseline power level in the order of several kilowatts is observed even for small accelerator pedal positions. As identified in the regime segmentation, the low-power operation that is likely influenced by the auxiliary loads range extends up to approximately 8 kW and constitutes a significant share of the total operating time.
The presence of this auxiliary load has a direct impact on the regression models of the propulsion system, particularly on the intercept term of the power–pedal relationship. The difference in intercept values between the full dataset and the propulsion-only dataset reflects the contribution of non-traction energy consumption, which must be considered in realistic energy modeling of electric vehicles.
From the battery perspective, the operating conditions remain stable, as confirmed by the narrow distribution of cell voltage imbalance ΔU and the consistent current–voltage characteristics. Despite dynamic load variations, the battery operates within a well-balanced regime without signs of abnormal degradation or thermal instability. The battery pack appeared to be well balanced within the recorded dataset.
The results within the analyzed range indicate that realistic operating conditions, especially thermal loads in cold environments, play a crucial role in shaping both the energetic and electrical behavior of electric vehicles and should be explicitly included in data-driven modeling approaches.
The analyzed dataset does not include vehicle speed or electric motor speed signals. The absence of the vehicle speed data results from the unavailability of location-related information during the measurement campaign, while the motor speed signal was not visible in the OBD stream, most likely due to its absence in the vehicle CAN bus or a limitation of the experimental OBD application used for data acquisition. Although the lack of these signals limits the possibility of constructing speed-dependent or torque–speed models of the propulsion system, it does not affect the validity of the presented energy-based and electrochemical analyses, which are based on directly measured electrical quantities.
The analyzed dataset represents a short urban trip performed under winter operating conditions, which may significantly influence the energy balance of the electric vehicle. The recorded traction power and battery current signals indicate the presence of a persistent low-power baseline in addition to more dynamic propulsion-related events. This baseline is plausibly associated with auxiliary loads, including cabin heating, battery thermal management, and onboard electrical systems; however, these contributions were not measured separately in the available OBD dataset. Therefore, the 0–8 kW interval is interpreted conservatively as an empirically selected low-power region that is likely influenced by auxiliary loads, rather than as a directly measured heating regime. The presence of this low-power baseline has a direct impact on the regression models of the propulsion system, particularly on the intercept term of the power–pedal relationship. The difference in intercept values between the full dataset and the propulsion-only dataset may therefore reflect the contribution of non-traction power demand and other low-load operating effects, but it should not be attributed exclusively to heating without direct auxiliary-power measurements.
4. Discussion
4.1. Discussion of the Results Obtained
The obtained results demonstrate that real-world OBD data can be successfully transformed into physically interpretable empirical relationships describing selected aspects of electric vehicle operation, providing diagnostic insight and a practical basis for exploratory energy-related analysis [73,74]. The proposed processing pipeline, which links time-resolved measurements with regression models and energy balance analysis, shows that even a limited set of signals can be organized into a coherent representation of the traction system and battery behavior. This confirms that data acquired from standard diagnostic interfaces may be used not only for monitoring purposes, but also for model development in real operating conditions.
A key observation from the analyzed trip is the presence of a persistent low-power baseline under winter operating conditions. This baseline is likely influenced by auxiliary loads such as cabin heating, battery thermal management, and onboard electrical systems, although the available OBD dataset does not allow these components to be separated quantitatively. Consequently, the low-power band should be treated as an auxiliary-influenced operating region, rather than a direct measurement of heating power. This observation indicates that auxiliary loads must be explicitly considered in empirical analyses of BEV energy behavior, especially for urban operation in cold climates. The reconstructed energy values were consistent with the cumulative energy reported by the vehicle diagnostic system, confirming the validity of the adopted reconstruction approach.
The decomposition of the driving process into propulsion, regeneration and low-power operation likely influenced by auxiliary loads proved to be an effective methodological step that improves the interpretability of the results. In the case of the traction power model, the separation of propulsion data significantly clarifies the relationship between the pedal position and power demand and allows the physical meaning of the intercept term to be identified. In contrast, for the current–voltage characteristic of the battery, the decomposition does not introduce noticeable changes, which suggests stable and approximately quasi-linear ohmic behavior of the battery within the analyzed operating range.
The analysis of cell voltage imbalance ΔU provides additional diagnostic information on the condition of the battery pack. The narrow distribution of ΔU values and the absence of a long-term drift indicate a well-balanced battery system operating in a stable regime. The analysis of cell voltage imbalance ΔU provides exploratory information on the load-dependent response of the recorded battery signals. The observed ΔU–current relationship was weak, as reflected by the low R2 values of the fitted models. Therefore, the polynomial regression should be treated only as a descriptive approximation of the analyzed dataset. It suggests that the current may contribute to changes in ΔU, but it does not provide a validated electrochemical or degradation model. Independent validation under broader operating conditions would be required to confirm whether such tendencies are repeatable and diagnostically meaningful [75,76].
The linear current–voltage characteristics obtained for both the full dataset and the propulsion regime show almost identical parameters, which confirms a consistent electrical response of the battery and supports the interpretation of the pack as a voltage source with internal resistance. This enables an approximate interpretation of the dominant ohmic behavior within the analyzed operating range and may provide a starting point for more advanced diagnostic or aging-oriented studies based on richer datasets.
4.2. Limitations in the Experimental Area
The authors acknowledge that the present analysis is based on a single short urban trip recorded for one vehicle under one specific set of winter operating conditions. For this reason, the reported results should be interpreted as a proof-of-concept feasibility study, rather than as statistically generalizable battery or powertrain models. The main value of the study lies in demonstrating that even a limited real-world OBD dataset can yield physically interpretable empirical relationships and useful insight into the energy flow, auxiliary loads, and battery behavior under practical measurement constraints. At the same time, the authors recognize that broader validation would require a substantially extended experimental campaign including multiple trips, different routes, varying ambient and thermal conditions, and a wider range of operating states. Therefore, the conclusions drawn here are preliminary, vehicle-specific, and trip-specific, and should be treated as an illustration of the analytical potential of accessible OBD data, rather than as a universal representation of BEV operation.
The absence of vehicle speed and electric motor speed signals is a major limitation of the present dataset and directly affects the interpretation of the accelerator-pedal–power relationship. In a physically complete electric drivetrain model, the accelerator pedal position should be interpreted together with vehicle speed, motor speed, torque demand, inverter control strategy, and battery power limits. Since vehicle speed and motor speed were not available in the recorded OBD stream, the fitted power–pedal relationship necessarily conflates driver input with unobserved speed-dependent drivetrain control effects. Therefore, the polynomial model proposed in this study should not be interpreted as a complete drivetrain characteristic. It should rather be treated as a local surrogate empirical model describing the observed power response within the recorded trip and available signal set. This approach reflects a common situation in real-world OBD-based research, where physically interpretable approximations must often be derived from incomplete but practically accessible vehicle data. Despite this limitation, the model remains useful as an exploratory representation of the recorded relationship between the driver input and measured power demand, provided that it is not extrapolated beyond the analyzed operating conditions. Similar methodological challenges have been reported in OBD-based studies of electrified vehicles, where incomplete diagnostic datasets require exploratory and surrogate modeling approaches to recover interpretable operating-state information from practically accessible signals [49].
Due to the absence of vehicle speed and motor speed signals, the accelerator-pedal–power model has an important interpretative limitation. The accelerator pedal signal cannot be directly translated into a pure power-demand characteristic, because in an electric drivetrain, the driver input is processed through speed-dependent torque and power control maps. Consequently, the observed nonlinear relationship between accelerator pedal position and traction power may partly reflect unobserved vehicle speed, motor speed, torque limits, inverter control, and battery power constraints. The model should therefore be treated as a local empirical approximation for the recorded trip, not as a physically complete drivetrain model. A complete drivetrain model would require vehicle speed, motor speed, and preferably torque signals. The purpose of the power–pedal model is not to reconstruct the full drivetrain control map, but to provide a transparent surrogate relationship derived from the signals that are actually available in the real-world OBD dataset.
The measurement constraints affect different parts of the analysis in different ways. The energy-flow reconstruction is primarily affected by irregular sampling and possible interruptions in the OBD stream; this was mitigated by integrating the traction power using actual time intervals. The accelerator-pedal–power regression is strongly affected by the absence of vehicle speed and motor speed, because the measured power response combines driver input with unobserved drivetrain control maps and speed-dependent effects. The current–voltage regression is less affected by the missing speed data, but its interpretation remains limited by the narrow SOC range and the lack of controlled relaxation periods required for open-circuit-voltage identification. Finally, the ΔU–current relationship should be treated as exploratory, because cell-voltage imbalance may be influenced by the current, SOC, temperature, transient load history, BMS sampling strategy, and measurement noise.
The results presented in this study should be interpreted strictly within the context of the analyzed measurement campaign. The dataset represents one short winter urban trip of a single Renault 5 E-Tech Electric and does not include vehicle speed or motor speed signals. Consequently, the empirical relationships derived in this work are preliminary, vehicle-specific, and trip-specific. They are intended to demonstrate the feasibility of extracting physically interpretable information from limited OBD data, rather than to provide statistically generalizable models of BEV battery or powertrain behavior.
4.3. Limitations in the Modeling Area
It should be emphasized that the regression models proposed in this study are not intended to constitute full battery or powertrain identification in the sense of advanced equivalent-circuit, recursive-identification, state-estimation, machine-learning, or digital-twin frameworks. Such approaches typically require richer datasets, controlled excitation conditions, parameter-identifiability analysis, dedicated validation procedures, and broader operating ranges than those that are available in the present study. Instead, the models presented here represent low-order empirical approximations derived from a limited real-world OBD dataset recorded during a single short trip. Their purpose is to support physically interpretable analysis of selected relationships that are observable in the available signals and to address a more modest methodological question: how much useful information can be extracted from accessible but incomplete measurement data under practical operating conditions? Accordingly, the linear voltage–current relation is interpreted as a local approximation of the dominant ohmic behavior within the analyzed operating range, while the power–pedal and ΔU–current relationships are treated as exploratory, dataset-specific surrogate models. More complex dynamic phenomena, including polarization effects, speed-dependent drivetrain control, and generalized battery aging behavior, remain outside the scope of the present dataset and should be investigated in future work using broader experimental campaigns.
The modeling approach adopted in the present study should be interpreted in the context of its deliberately limited objective and data basis. The recent battery-modeling literature increasingly relies on advanced identification frameworks, including equivalent-circuit models with time-varying parameters [77,78], recursive least-squares methods [79], Kalman-filter-based state estimation [79,80], and hybrid data-driven approaches aimed at accurate SOC/SOH estimation, online parameter tracking, digital-twin development [81] and degradation analysis [82]. In such studies, the model structure, excitation conditions, parameter observability, and validation procedures are typically addressed using substantially richer datasets, dedicated test protocols, and broader operating envelopes [82]. By contrast, the present work is based on a single short real-world OBD recording with restricted signal availability and was therefore not intended to provide full formal identification of a general battery or powertrain model. Instead, the proposed regressions should be understood as low-order empirical approximations that remain physically interpretable within the analyzed operating range and under the specific conditions of the recorded trip. In this sense, the contribution of the present study is not to compete with advanced ECM-, RLS-, Kalman-, or digital-twin-based frameworks, but to demonstrate how accessible yet incomplete OBD data can still be used to recover practically useful information on selected relationships between the power demand, current, voltage, and auxiliary winter loads in a real vehicle. Accordingly, the present models are positioned as exploratory and trip-specific tools for empirical interpretation, rather than as validated general-purpose battery-identification models.
To better position the modeling approach adopted in the present study within the current battery-modeling literature, a comparative overview of selected advanced modeling frameworks and the present low-order OBD-based empirical approach is provided in Table 4.
Table 4.
Comparison of the modeling approach adopted in this study with selected advanced battery-modeling frameworks reported in the recent literature.
Recent real-world EV studies increasingly combine CAN/OBD measurements, driving-behavior analysis, and data-driven battery diagnostics. Li et al. showed that battery cell voltage consistency in real-world EVs is associated with driving-behavior parameters, including accelerator pedal stroke and average speed, and demonstrated nonlinear relationships between driving behavior and voltage variation between cells using random forest models. Savran et al. used real-world CAN bus data acquired through the OBD-II port to develop unsupervised anomaly detection models for EV driving behavior and linked detected anomalies with energy-efficiency and chaoticity indicators. These studies confirm that real-world EV data streams can reveal diagnostic and energy-related patterns that are not accessible from static specifications or laboratory-only analyses. Against this background, the present work is positioned as a narrower proof-of-concept study focused on physically interpretable local empirical relationships derived from a single limited OBD recording of a modern BEV. The present study differs from Li et al. [83] in both scale and objective. Li et al. analyzed the voltage consistency using naturalistic driving data and machine-learning models to quantify the influence of driving-behavior parameters on voltage variation between cells. In contrast, the present work does not attempt to develop a predictive voltage-consistency model. Instead, it uses the available OBD signal of cell voltage imbalance as an exploratory diagnostic indicator and examines its local relationship with the battery current during a single recorded trip. The present study also differs from Savran et al. [84], who focused on anomaly detection, energy-saving potential, and chaoticity assessment using real-world CAN bus driving data. Our analysis does not aim to detect anomalies or classify driving behavior. Rather, it uses simple regression models and operating-region segmentation to obtain physically interpretable descriptions of selected energy-flow and battery-response relationships from a restricted OBD dataset.
4.4. Future Applications
From a broader perspective, the presented approach may provide a useful empirical starting point for future digital-twin-oriented studies of electric vehicles, as it provides compact regression models linking driver input, power demand and battery response [85]. Such simple relations may support preliminary diagnostics, exploratory energy-management analyses, and future model development when richer datasets become available. The methodology can also be extended by incorporating additional signals, such as vehicle speed, torque or temperature, as well as by applying machine learning techniques for pattern recognition and long-term degradation analysis, which constitutes a promising direction for future research.
Beyond onboard battery behavior, the broader context of electric mobility also includes the development of advanced energy transfer and charging technologies. Recent studies have investigated wireless power transfer systems aimed at improving charging flexibility and operational convenience in electric mobility applications, including aerial and ground vehicles [86,87]. Although the present work focuses on traction battery behavior during vehicle operation, such technologies represent an important complementary direction for future EV energy systems.
The dataset also includes battery temperature signals (minimum, maximum and cooling system temperatures), which were not analyzed in detail in this study and will be addressed in future work focused on the thermal behavior of the traction battery.
5. Conclusions
This study should be interpreted as a vehicle-specific and trip-specific proof-of-concept analysis based on one short winter urban trip by a Renault 5 E-Tech Electric and a limited set of OBD-accessible signals. The results indicate that, even under such constrained measurement conditions, diagnostic OBD data can support exploratory modeling of selected relationships that are relevant to the electric powertrain energy flow and traction battery response. The obtained regression models and observed signal patterns are therefore not intended to represent general BEV battery or powertrain behavior, but rather to demonstrate the analytical potential of limited real-world OBD data.
For the analyzed trip and SOC interval, the battery current–voltage relationship was locally well approximated by a linear regression model, with R2 exceeding 0.95. This result indicates that the measured pack voltage variation was strongly associated with the battery current under the recorded conditions. However, the regression intercept should not be interpreted as a general open-circuit voltage, and the model does not explicitly account for SOC-dependent voltage variation. Broader measurements over a wider SOC and temperature range would be required to identify a physically complete battery voltage model.
The investigation of the relationship between the cell voltage imbalance and battery current indicated only a weak load-dependent tendency in the analyzed dataset. Although the third-order polynomial provided the best numerical fit among the tested low-order regressions, the low R2 value shows that its explanatory power is limited. Therefore, this model should be interpreted only as a descriptive, dataset-specific approximation and not as a general electrochemical model of cell imbalance.
The analysis of the relationship between the accelerator pedal position and traction power showed that decomposing the dataset into specific operating regimes significantly improves the modeling accuracy. In particular, the propulsion-mode dataset produced higher R2 values and lower regression errors compared with the model based on the full operating range. For the analyzed trip, the empirical relationship between the accelerator pedal position and traction power showed improved fitting quality after restricting the dataset to propulsion operation. However, because vehicle speed and motor speed were not available, this relationship should be interpreted only as a local power-response approximation that combines driver input with unobserved speed-dependent drivetrain control effects. Future work should include vehicle speed, motor speed, and torque-related signals to separate torque demand from power demand and to develop physically complete drivetrain models.
Overall, the results suggest that, for the analyzed trip, decomposition of real driving data into physically meaningful operating regimes improved the interpretability and fitting quality of selected empirical relationships. Further measurements are required to verify whether the same modeling benefits are retained across other routes, ambient conditions, vehicles, and driving styles.
Future work may focus on extending the proposed modeling framework by incorporating additional influencing factors such as the battery temperature, thermal management conditions, and cell heterogeneity to improve the predictive capability of the models.
Author Contributions
Conceptualization, J.C. and A.M.; methodology, B.Š.; software, A.M.; validation, B.Š. and J.C.; formal analysis, A.M.; investigation, A.M.; resources, J.C. and A.M.; data curation, B.Š. and M.L.; writing—original draft preparation, J.C., B.Š., A.M., S.D. and M.L.; writing—review and editing, J.C., B.Š. and A.M.; visualization, B.Š. and S.D.; supervision, J.C. and M.L.; project administration, A.M.; funding acquisition, J.C. and A.M. All authors have read and agreed to the published version of the manuscript.
Funding
This research received no external funding.
Data Availability Statement
The anonymized time-series dataset can be made available by the corresponding author upon reasonable request. Direct publication of the complete raw OBD log is restricted because the file may contain vehicle-specific diagnostic metadata and application-level proprietary signal definitions. To support reproducibility, Appendix A provides the exact exported signal names, units, and analytical role of each signal, and information on the availability of PID/CAN identifiers. The preprocessing and modeling workflow is described in the Section 2 (Materials and Methods).
Conflicts of Interest
The authors declare no conflicts of interest.
Abbreviations
The following abbreviations are used in this manuscript:
| AC | Alternating Current |
| AEKF | Adaptive Extended Kalman Filter |
| APP | Accelerator Pedal Position |
| BEV | Battery Electric Vehicle |
| BMS | Battery Management System |
| CAN | Controller Area Network |
| CCS | Combined Charging System |
| DC | Direct Current |
| ECM | Equivalent Circuit Model |
| EKF | Extended Kalman Filter |
| EV | Electric Vehicle |
| HP | Horsepower |
| MAE | Mean Absolute Error |
| OBD | On-Board Diagnostics |
| OCV | Open-Circuit Voltage |
| PID | Parameter Identifier |
| R2 | Coefficient of Determination |
| RLS | Recursive Least Squares |
| RMSE | Root Mean Square Error |
| SOC | State of Charge |
| SOH | State of Health |
| UKF | Unscented Kalman Filter |
Appendix A. Pseudocode
- Import OBD time-series dataset.
- Convert timestamps to relative time.
- Remove missing/non-numeric records.
- Compute Δt between samples.
- Integrate P(t) over irregular Δt.
- Segment operating regions.
- Fit U–I, ΔU–I and P–APP regressions.
- Compute R2, RMSE, MAE.
- Generate figures.
Appendix B
Table A1.
OBD-derived signals used in the analysis.
References
- Borucka, A.; Stopka, O.; Kozłowski, E. Analysis of Electric Vehicles in the Context of the World’s Largest Economies. Arch. Automot. Eng. 2024, 106, 65–82. [Google Scholar] [CrossRef] [Scilit]
- Gnap, J.; Dockalik, M.; Dydkowski, G. Examination of the development of new bus registrations with alternative powertrains in Europe. Logi Sci. J. Transp. Logist. 2021, 12, 147–158. [Google Scholar] [CrossRef] [Scilit]
- Piasecka, I.; Tomporowski, A.; Piotrowska, K. Environmental life cycle assessment of selected SUV passenger cars. Combust. Engines 2025, 203, 138–145. [Google Scholar] [CrossRef] [Scilit]
- Pollock, J.; Chong, P.L.; Ramegowda, M.; Dawood, N.; Habibi, H.; Hou, Z.; Faraji, F.; Guo, P. Battery Electric Vehicles: A Study on State of Charge and Cost-Effective Solutions for Addressing Range Anxiety. Machines 2025, 13, 411. [Google Scholar] [CrossRef] [Scilit]
- Barta, D.; Mruzek, M. Non-conventional drive and its possibilities of using in road vehicles of public transport. In Proceedings of the OPT-I 2014—1st International Conference on Engineering and Applied Sciences Optimization, Kos Island, Greece, 4–6 June 2014; pp. 2049–2061. [Google Scholar]
- Kozlowski, E.; Zimakowska-Laskowska, M.; Snauko, B.; Wisniowski, P. Modelling of Energy Recovery from Braking in Vehicle Drive Systems. Eng. Rural. Dev. 2025, 24, 629–636. [Google Scholar]
- Stańko-Pająk, K.; Seńko, J.; Nowak, R.; Rymuszka, M.; Danielewicz, D.; Jóźwik, K. Numerical Stability and Handling Studies of Three-Wheeled Vehicles Using ADAMS/Car. Appl. Sci. 2026, 16, 98. [Google Scholar] [CrossRef] [Scilit]
- Laskowski, P.; Kozłowski, E.; Zimakowska-Laskowska, M.; Wiśniowski, P. Assessment of Methods for Determining Vehicle Emission Characteristics. Eng. Trans. 2025, 73, 407–420. [Google Scholar]
- Warguła, Ł.; Kadirov, A.; Aimukhanov, D.; Ulbrich, D.; Kaczmarzyk, P.; Bąk, D.; Wieczorek, B. Ecological Paradox in the Reuse of Internal Combustion Engines from Scrapped Vehicles for Electric Power Generation—Circular Economy Potential Versus Emission Certification Barriers. Sustainability 2025, 17, 10435. [Google Scholar] [CrossRef] [Scilit]
- Zimakowska-Laskowska, M.; Laskowski, P. Comparison of pollutant emissions from various types of vehicles. Combust. Engines 2024, 197, 139–145. [Google Scholar] [CrossRef] [Scilit]
- Bulková, Z.; Zitrický, V.; Ľupták, V.; Brabec, J.; Pečman, J. Energy and emissions balance of modal shift in freight transport: A case study from the Central European region. Transp. Res. Interdiscip. Perspect. 2025, 34, 101656. [Google Scholar] [CrossRef] [Scilit]
- Hurtova, I.; Sejkorova, M.; Verner, J.; Sarkan, B. Comparison of electricity and fossil fuel consumption in trolleybuses and buses. Eng. Rural. Dev. 2018, 17, 2079–2084. [Google Scholar] [CrossRef] [Scilit]
- Luty, W.; Mieteń, M.; Simiński, P. Effect of combustion of an alternative fuel with different physicochemical properties on the dynamics of special vehicles. Przem. Chem. 2018, 97, 746–748. [Google Scholar] [CrossRef] [Scilit]
- Piotrowska, K.; Piasecka, I.; Opielak, M. Life Cycle Assessment of Small Passenger Cars in the Context of Smart Grid Integration and Sustainable Power System Development. Sustainability 2025, 17, 10788. [Google Scholar] [CrossRef] [Scilit]
- Niewczas, A.; Rymarz, J.; Ślęzak, M.; Kasperek, D.; Hołyszko, P. Reliability Study of Electric Buses in the Urban Public Transport System. Energies 2025, 18, 3863. [Google Scholar] [CrossRef] [Scilit]
- Dižo, J.; Blatnický, M.; Melnik, R.; Karľa, M. Improvement of Steerability and Driving Safety of an Electric Three-Wheeled Vehicle by a Design Modification of its Steering Mechanism. Logi Sci. J. Transp. Logist. 2022, 13, 49–60. [Google Scholar] [CrossRef] [Scilit]
- Yildiz, B.; Çiğdem, Ş.; Meidute-Kavaliauskiene, I. Sustainable mobility and electric vehicle adoption: A study on the impact of perceived benefits and risks. Transport 2024, 39, 129–145. [Google Scholar] [CrossRef] [Scilit]
- Kozłowski, E.; Zimakowska-Laskowska, M.; Dudziak, A.; Wiśniowski, P.; Laskowski, P.; Stankiewicz, M.; Šnauko, B.; Lech, N.; Gis, M.; Matijošius, J. Analysis of Instantaneous Energy Consumption and Recuperation Based on Measurements from SORT Runs. Appl. Sci. 2025, 15, 1681. [Google Scholar] [CrossRef] [Scilit]
- Pečman, J.; Stopka, O.; Rybicka, I.; Stopková, M. Influence of Road Longitudinal Terrain Profile on Vehicle Kinetic Energy Recovery and Mitigation of Selected Transport Negative Aspects. Transp. Probl. 2023, 18, 125–133. [Google Scholar] [CrossRef] [Scilit]
- Szumska, E.M. Regenerative Braking Systems in Electric Vehicles: A Comprehensive Review of Design, Control Strategies, and Efficiency Challenges. Energies 2025, 18, 2422. [Google Scholar] [CrossRef] [Scilit]
- Szumska, E.; Skuza, A.; Jurecki, R. The analysis of energy recovered by an electric vehicle during selected braking manoeuvres. Arch. Automot. Eng. 2023, 99, 18–29. [Google Scholar] [CrossRef] [Scilit]
- Sang, V.T.D.; Duong, Q.H.; Zhou, L.; Arranz, C.F.A. Electric Vehicle Battery Technologies and Capacity Prediction: A Comprehensive Literature Review of Trends and Influencing Factors. Batteries 2024, 10, 451. [Google Scholar] [CrossRef] [Scilit]
- Čulík, K.; Hrudkay, K.; Morgos, J. Operating characteristics of electric buses and their analysis. In Proceedings of the Transport Means—Proceedings of the International Conference, Online, 6–8 October 2021; pp. 251–256. [Google Scholar]
- Guerrero-Silva, J.A.; Romero-Gelvez, J.I.; Aristizábal, A.J.; Zapata, S. Optimization and Trends in EV Charging Infrastructure: A PCA-Based Systematic Review. World Electr. Veh. J. 2025, 16, 345. [Google Scholar] [CrossRef] [Scilit]
- Stopka, O.; Stopková, M.; Pečman, J. Application of multi-criteria decision making methods for evaluation of selected passenger electric cars: A case study. Commun.-Sci. Lett. Univ. Zilina 2022, 24, A133–A141. [Google Scholar] [CrossRef] [Scilit]
- Alanazi, F. Electric Vehicles: Benefits, Challenges, and Potential Solutions for Widespread Adaptation. Appl. Sci. 2023, 13, 6016. [Google Scholar] [CrossRef] [Scilit]
- Čulík, K.; Hrudkay, K.; Ondruš, J.; Grísa, R. Investigating Households Attitude toward Electromobility. In Proceedings of the Transport Means Proceedings of the International Conference, 2022, Kaunas, Lithuania, 5–7 October 2022; pp. 589–594. [Google Scholar]
- Orynycz, O.; Zimakowska-Laskowska, M.; Ruchała, P.; Laskowski, P.; Matijošius, J.; Fidanova, S.; Roeva, O.; Sokolovskij, E.; Menes, M. Method of Evaluation of Potential Location of EV Charging Stations Based on Long-Term Wind Power Density in Poland. Energies 2026, 19, 434. [Google Scholar] [CrossRef] [Scilit]
- Stoma, M.; Dudziak, A. Future Challenges of the Electric Vehicle Market Perceived by Individual Drivers from Eastern Poland. Energies 2023, 16, 7212. [Google Scholar] [CrossRef] [Scilit]
- Mendoza-Armenta, A.A.; Félix-Herrán, L.C.; Silvestri, B.; Valderrama-Solano, A.C.; Tudon-Martínez, J.C.; Roccotelli, M.; Lozoya-Santos, J.d.J. Autonomous and Electric Vehicles in Urban Living Labs: Smart Mobility Strategies for the Future. Energies 2024, 17, 5399. [Google Scholar] [CrossRef] [Scilit]
- Guo, J.; Dai, Z.; Liu, M.; Xie, Z.; Jiang, Y.; Yang, H.; Xie, D. Distributed Drive Electric Vehicle Handling Stability Coordination Control Framework Based on Adaptive Model Predictive Control. Sensors 2024, 24, 4811. [Google Scholar] [CrossRef] [Scilit]
- Baráth, B.; Józsa, D. Determination of the Centre of Gravity of Electric Vehicles Using a Static Axle-Load Method. Future Transp. 2026, 6, 22. [Google Scholar] [CrossRef] [Scilit]
- Kolla, E.; Ondruš, J.; Gogola, M.; Šarić, Ž. Braking Characteristics of the Specified Modern Electric Vehicle During Intensive Braking. Adv. Sci. Technol. Res. J. 2020, 14, 125–134. [Google Scholar] [CrossRef] [Scilit]
- Čulík, K.; Štefancová, V.; Hrudkay, K.; Morgoš, J. Interior Heating and Its Influence on Electric Bus Consumption. Energies 2021, 14, 8346. [Google Scholar] [CrossRef] [Scilit]
- Figlus, T.; Czachor, T. Preliminary studies of the effect of travelling speed and propulsion type on the sound level in the passenger compartment of a vehicle with a hybrid propulsion system. In Proceedings of the 11th International Science and Technical Conference Automotive Safety Automotive Safety 2018, Casta, Papiernicka, Slovakia, 18–20 April 2018; pp. 1–5. [Google Scholar] [CrossRef] [Scilit]
- Gubarevych, O.; Wierzbicki, S.; Melnyk, O.; Kyrychenko, O.; Riashchenko, O. Increasing the accuracy of calculated indicators of operational reliability of industrial electric motors. Eksploat. Niezawodn.–Maint. Reliab. 2025, 27, 203006. [Google Scholar] [CrossRef] [Scilit]
- Dizo, J.; Barta, D.; Blatnicky, M. Improvement driving characteristics of electric tricycle. Eng. Rural. Dev. 2018, 17, 2123–2128. [Google Scholar]
- Boukhari, M.; Bouzidi, R.; Ghadbane, I.; Khaled, B.; Bendib, A.; Abdelhammid, K. Real-Time Implementation of ESOGI-FLL-based Speed-Sensorless Control for Induction Motor Drives within Electric Vehicle Systems. Arch. Automot. Eng. 2025, 107, 82–101. [Google Scholar] [CrossRef] [Scilit]
- Jagicza, M.; Sütheö, G.; Saly, G. Analyzing On-Board Vehicle Data to Support Sustainable Transport. Future Transp. 2026, 6, 17. [Google Scholar] [CrossRef] [Scilit]
- Liu, W.; Placke, T.; Chau, K.T. Overview of batteries and battery management for electric vehicles. Energy Rep. 2022, 8, 4058–4084. [Google Scholar] [CrossRef] [Scilit]
- Hasan, M.K.; Habib, A.A.; Islam, S.; Balfaqih, M.; Alfawaz, K.M.; Singh, D. Smart Grid Communication Networks for Electric Vehicles Empowering Distributed Energy Generation: Constraints, Challenges, and Recommendations. Energies 2023, 16, 1140. [Google Scholar] [CrossRef] [Scilit]
- Cheng, A.; Xin, Y.; Wu, H.; Yang, L.; Deng, B. A Review of Sensor Applications in Electric Vehicle Thermal Management Systems. Energies 2023, 16, 5139. [Google Scholar] [CrossRef] [Scilit]
- Lukášik, P. Monitoring of engine oil degradation and possibilities of life predictions in combustion engine. Diagnostyka 2023, 24, 169032. [Google Scholar] [CrossRef] [Scilit]
- Smit, R.; Ayala, A.; Kadijk, G.; Buekenhoudt, P. Excess Pollution from Vehicles—A Review and Outlook on Emission Controls, Testing, Malfunctions, Tampering, and Cheating. Sustainability 2025, 17, 5362. [Google Scholar] [CrossRef] [Scilit]
- Michailidis, E.T.; Panagiotopoulou, A.; Papadakis, A. A Review of OBD-II-Based Machine Learning Applications for Sustainable, Efficient, Secure, and Safe Vehicle Driving. Sensors 2025, 25, 4057. [Google Scholar] [CrossRef] [Scilit]
- Pełechaty, P.; Konieczny, Ł. Analysis of security vulnerabilities in vehicle on-board diagnostic systems. Diagnostyka 2024, 25, 2024310. [Google Scholar] [CrossRef] [Scilit]
- Wierzbicki, S. Evaluation of the effectiveness of on-board diagnostic systems in controlling exhaust gas emissions from motor vehicles. Diagnostyka 2019, 20, 75–79. [Google Scholar] [CrossRef] [Scilit]
- Campos-Ferreira, A.E.; Lozoya-Santos, J.d.J.; Tudon-Martinez, J.C.; Mendoza, R.A.R.; Vargas-Martínez, A.; Morales-Menendez, R.; Lozano, D. Vehicle and Driver Monitoring System Using On-Board and Remote Sensors. Sensors 2023, 23, 814. [Google Scholar] [CrossRef] [Scilit]
- Loman, M.; Šarkan, B.; Małek, A.; Caban, J.; Martyna-Syroka, B.; Piotrowska, K. A Methodological Framework for Inferring Energy-Related Operating States from Limited OBD Data: A Single-Trip Case Study of a PHEV. Vehicles 2025, 7, 165. [Google Scholar] [CrossRef] [Scilit]
- Wu, C.; Sehab, R.; Akrad, A.; Morel, C. Fault Diagnosis Methods and Fault Tolerant Control Strategies for the Electric Vehicle Powertrains. Energies 2022, 15, 4840. [Google Scholar] [CrossRef] [Scilit]
- Konczak, J.; Mieten, M. Problems of Traffic Stability, Reliability and Ergonomics in Prototype Studies of Special Vehicles. In Proceedings of the 7th International Conference on Integrity-Reliability-Failure (IRF2020), Funchal, Portugal, 6–10 September 2020; pp. 221–222. [Google Scholar]
- Małek, A.; Marciniak, A.; Kroczyński, D. Defining Signatures for Intelligent Vehicles with Different Types of Powertrains. World Electr. Veh. J. 2025, 16, 135. [Google Scholar] [CrossRef] [Scilit]
- Sojka, M.; Cornák, Š.; Droppa, P. Selected problems of tracked vehicle movement modelling. In Proceedings of the 21st Inter-484 National Scientific Conference Transport Means 2017, Juodkrante, Klaipeda, Lithuania, 20–22 September 2017; pp. 493–498. [Google Scholar]
- Droppa, P.; Filipek, S.; Cornák, S. The Possibilities of Using Diagnostics and Simulation Methods to Design and Modernization of Military Technics. In Proceedings of the 20th International Scientific Conference Transport Means, Kaunas, Lithuania, 5–7 October 2016; pp. 156–160. [Google Scholar]
- El-Sayed, E.I.; ElSayed, S.K.; Alsharef, M. Data-Driven Approaches for State-of-Charge Estimation in Battery Electric Vehicles Using Machine and Deep Learning Techniques. Sustainability 2024, 16, 9301. [Google Scholar] [CrossRef] [Scilit]
- Poliak, M.; Frej, D.; Łagowski, P.; Jaśkiewicz, J. A Systematic Review of Computational and Data-Driven Approaches for Energy-Efficient Battery Management in Electrified Vehicles. Appl. Sci. 2026, 16, 618. [Google Scholar] [CrossRef] [Scilit]
- Małek, A.; Caban, J.; Dudziak, A.; Marciniak, A.; Vrábel, J. The Concept of Determining Route Signatures in Urban and Extra-Urban Driving Conditions Using Artificial Intelligence Methods. Machines 2023, 11, 575. [Google Scholar] [CrossRef] [Scilit]
- Husyeva, I.I.; Navas-Delgado, I.; García-Nieto, J. Data-Driven Approaches for Efficient Vehicle Driving Analysis: A Survey. J. Sens. Actuator Netw. 2025, 14, 52. [Google Scholar] [CrossRef] [Scilit]
- Szumska, E.; Skuza, A. Virtual Prototyping of Electric Vehicles: An Examination of Modelling and Simulation Tools with an AVL Cruise Case Study Analysis. Arch. Automot. Eng. 2025, 110, 5–37. [Google Scholar] [CrossRef] [Scilit]
- Zhao, Z.; Li, L.; Ou, Y.; Wang, Y.; Wang, S.; Yu, J.; Feng, R. A Comparative Study on the Energy Flow of Electric Vehicle Batteries among Different Environmental Temperatures. Energies 2023, 16, 5253. [Google Scholar] [CrossRef] [Scilit]
- Parczewski, K.; Wnęk, H. Analysis of Energy Flow in Hybrid and Electric-Drive Vehicles. Energies 2024, 17, 1915. [Google Scholar] [CrossRef] [Scilit]
- Yadav, P.; Jinadasa, L.; Wray, A.; Petrovich, S.; Georgiou, M.; Ebrahimi, K. Battery Electric Vehicle Thermal Management System Modelling and Validation. Thermo 2026, 6, 4. [Google Scholar] [CrossRef] [Scilit]
- Wang, Y.; Huang, H.; Hao, R.; Luo, L.; He, H.-D. Prediction of Battery Electric Vehicle Energy Consumption via Pre-Trained Model Under Inconsistent Feature Spaces. Technologies 2025, 13, 493. [Google Scholar] [CrossRef] [Scilit]
- Menyhart, J. Electric Vehicles and Energy Communities: Vehicle-to-Grid Opportunities and a Sustainable Future. Energies 2025, 18, 854. [Google Scholar] [CrossRef] [Scilit]
- Christoforidis, C.; Christakis, I.; Kotzasavva, F.; Fousekis, G.; Rimpas, D. Electric Vehicles Charging Stations and their influence on the Electricity Utility Grid. Arch. Automot. Eng. 2025, 107, 102–126. [Google Scholar] [CrossRef] [Scilit]
- Lewicki, W.; Coban, H.H.; Wróbel, J. Integration of Electric Vehicle Power Supply Systems—Case Study Analysis of the Impact on a Selected Urban Network in Türkiye. Energies 2024, 17, 3596. [Google Scholar] [CrossRef] [Scilit]
- Molina-Campoverde, J.J.; Zurita-Jara, J.; Molina-Campoverde, P. Driving Pattern Analysis, Gear Shift Classification, and Fuel Efficiency in Light-Duty Vehicles: A Machine Learning Approach Using GPS and OBD II PID Signals. Sensors 2025, 25, 4043. [Google Scholar] [CrossRef] [Scilit]
- Rîșteiu, M.; Dobra, R.; Avram, A.; Samoilă, F.; Buică, G.; Rizzo, R.; Micu, D.D. Designing a Smart Gateway for Data Fusion Implementation in a Distributed Electronic System Used in Automotive Industry. Energies 2021, 14, 3300. [Google Scholar] [CrossRef] [Scilit]
- Available online: https://www.carscanner.info/ (accessed on 23 February 2026).
- Park, H.-J.; Koo, Y.-S.; Yang, H.-Y.; Han, Y.-S.; Nam, C.-S. Study on Data Preprocessing for Machine Learning Based on Semiconductor Manufacturing Processes. Sensors 2024, 24, 5461. [Google Scholar] [CrossRef] [Scilit]
- Bagui, S.S.; Eller, C.; Armour, R.; Singh, S.; Bagui, S.C.; Mink, D. Analyzing Performance of Data Preprocessing Techniques on CPUs vs. GPUs with and Without the MapReduce Environment. Electronics 2025, 14, 3597. [Google Scholar] [CrossRef] [Scilit]
- Li, J.; Han, Y.; Zhao, M. Decomposition and Decoupling Analysis of the Driving Factors of the “Water–Carbon–Ecological” Footprint in the Eleven Provinces and Municipalities of the Yangtze River Economic Belt. Sustainability 2025, 17, 3645. [Google Scholar] [CrossRef] [Scilit]
- Cieslik, W.; Stolarski, A.; Freda, S. Electricity Energy Flow Analysis of a Fuel Cell Electric Vehicle (FCEV) Under Real Driving Conditions (RDC). Energies 2025, 18, 6458. [Google Scholar] [CrossRef] [Scilit]
- Alhanouti, M.; Gauterin, F. A Generic Model for Accurate Energy Estimation of Electric Vehicles. Energies 2024, 17, 434. [Google Scholar] [CrossRef] [Scilit]
- Malozyomov, B.V.; Martyushev, N.V.; Kukartsev, V.V.; Konyukhov, V.Y.; Oparina, T.A.; Sevryugina, N.S.; Gozbenko, V.E.; Kondratiev, V.V. Determination of the Performance Characteristics of a Traction Battery in an Electric Vehicle. World Electr. Veh. J. 2024, 15, 64. [Google Scholar] [CrossRef] [Scilit]
- Khekert, E.V.; Malozyomov, B.V.; Klyuev, R.V.; Martyushev, N.V.; Konyukhov, V.Y.; Kukartsev, V.V.; Antamoshkin, O.A.; Remezov, I.S. Battery Charging Simulation of a Passenger Electric Vehicle from a Traction Voltage Inverter with an Integrated Charger. World Electr. Veh. J. 2025, 16, 391. [Google Scholar] [CrossRef] [Scilit]
- Xiong, Y.Y.; Li, D.; Zhang, J.Q. An equivalent time-varying circuit model of lithium-ion batteries with its applications. Energy 2025, 323, 135904. [Google Scholar] [CrossRef] [Scilit]
- Zhang, K.; Zhao, X.; Chen, Y.; Wu, D.; Cai, T.; Wang, Y.; Li, L.; Zhang, J. Robust equivalent circuit model parameters identification scheme for State of Charge (SOC) estimation based on maximum correntropy criterion. Int. J. Electrochem. Sci. 2024, 19, 100558. [Google Scholar] [CrossRef] [Scilit]
- Liu, E.-J.; Ting, C.-C.; Hsu, W.-H.; Chen, P.-Z.; Hong, W.-H.; Ku, H.-C. Combining Forgetting Factor Recursive Least Squares and Adaptive Extended Kalman Filter Techniques for Dynamic Estimation of Lithium Battery State of Charge. Eng. Proc. 2025, 108, 1. [Google Scholar] [CrossRef] [Scilit]
- Yao, B.; Cai, Y.; Liu, W.; Wang, Y.; Chen, X.; Liao, Q.; Fu, Z.; Cheng, Z. State-of-charge estimation for lithium-ion batteries based on modified unscented Kalman filter using improved parameter identification. Int. J. Electrochem. Sci. 2024, 19, 100574. [Google Scholar] [CrossRef] [Scilit]
- Li, X.; Niu, W.; Tian, H. Application of Digital Twin in Electric Vehicle Powertrain: A Review. World Electr. Veh. J. 2024, 15, 208. [Google Scholar] [CrossRef] [Scilit]
- Apribowo, C.H.B.; Dzaky Ashidqi, M.; Nizam, M.; Purwanto, A. Data-driven modeling of lithium-ion battery degradation using XGBoost with extended Kalman filter-based internal resistance correction. Results Eng. 2025, 28, 108100. [Google Scholar] [CrossRef] [Scilit]
- Li, S.; Zhang, H.; Ding, N.; Acquarone, M.; Miretti, F.; Misul, D.A. Associations of Battery Cell Voltage Consistency with Driving Behavior of Real-World Electric Vehicles. Green Energy Intell. Transp. 2025, 4, 100236. [Google Scholar] [CrossRef] [Scilit]
- Savran, E.; Karpat, E.; Karpat, F. Energy-Efficient Anomaly Detection and Chaoticity in Electric Vehicle Driving Behavior. Sensors 2024, 24, 5628. [Google Scholar] [CrossRef] [Scilit] [PubMed]
- Yang, L.; Wang, Y. Electric Vehicle Traction Battery Recycling Decision-Making Considering Blockchain Technology in the Context of Capacitance Level Differential Demand. World Electr. Veh. J. 2024, 15, 561. [Google Scholar] [CrossRef] [Scilit]
- Wang, H.; Wu, Y.; Madawala, U.K.; Li, X.; Dai, X.; Sun, Y.; Hu, J. Integrated Coupler Design for UAV Free-Positioning Wireless Power Transfer With Inherent Cross- Coupling Utilization and Enlarged Charging Coverage. IEEE Trans. Power Electron. 2025, 40, 14324–14330. [Google Scholar] [CrossRef] [Scilit]
- Hui, S.Y.R.; Zhong, W.; Lee, C.K. A Critical Review of Recent Progress in Mid-Range Wireless Power Transfer. IEEE Trans. Power Electron. 2014, 29, 4500–4511. [Google Scholar] [CrossRef] [Scilit]
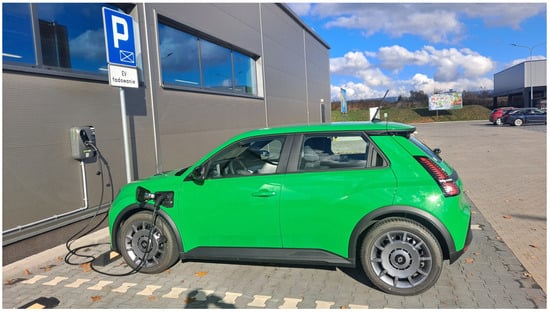
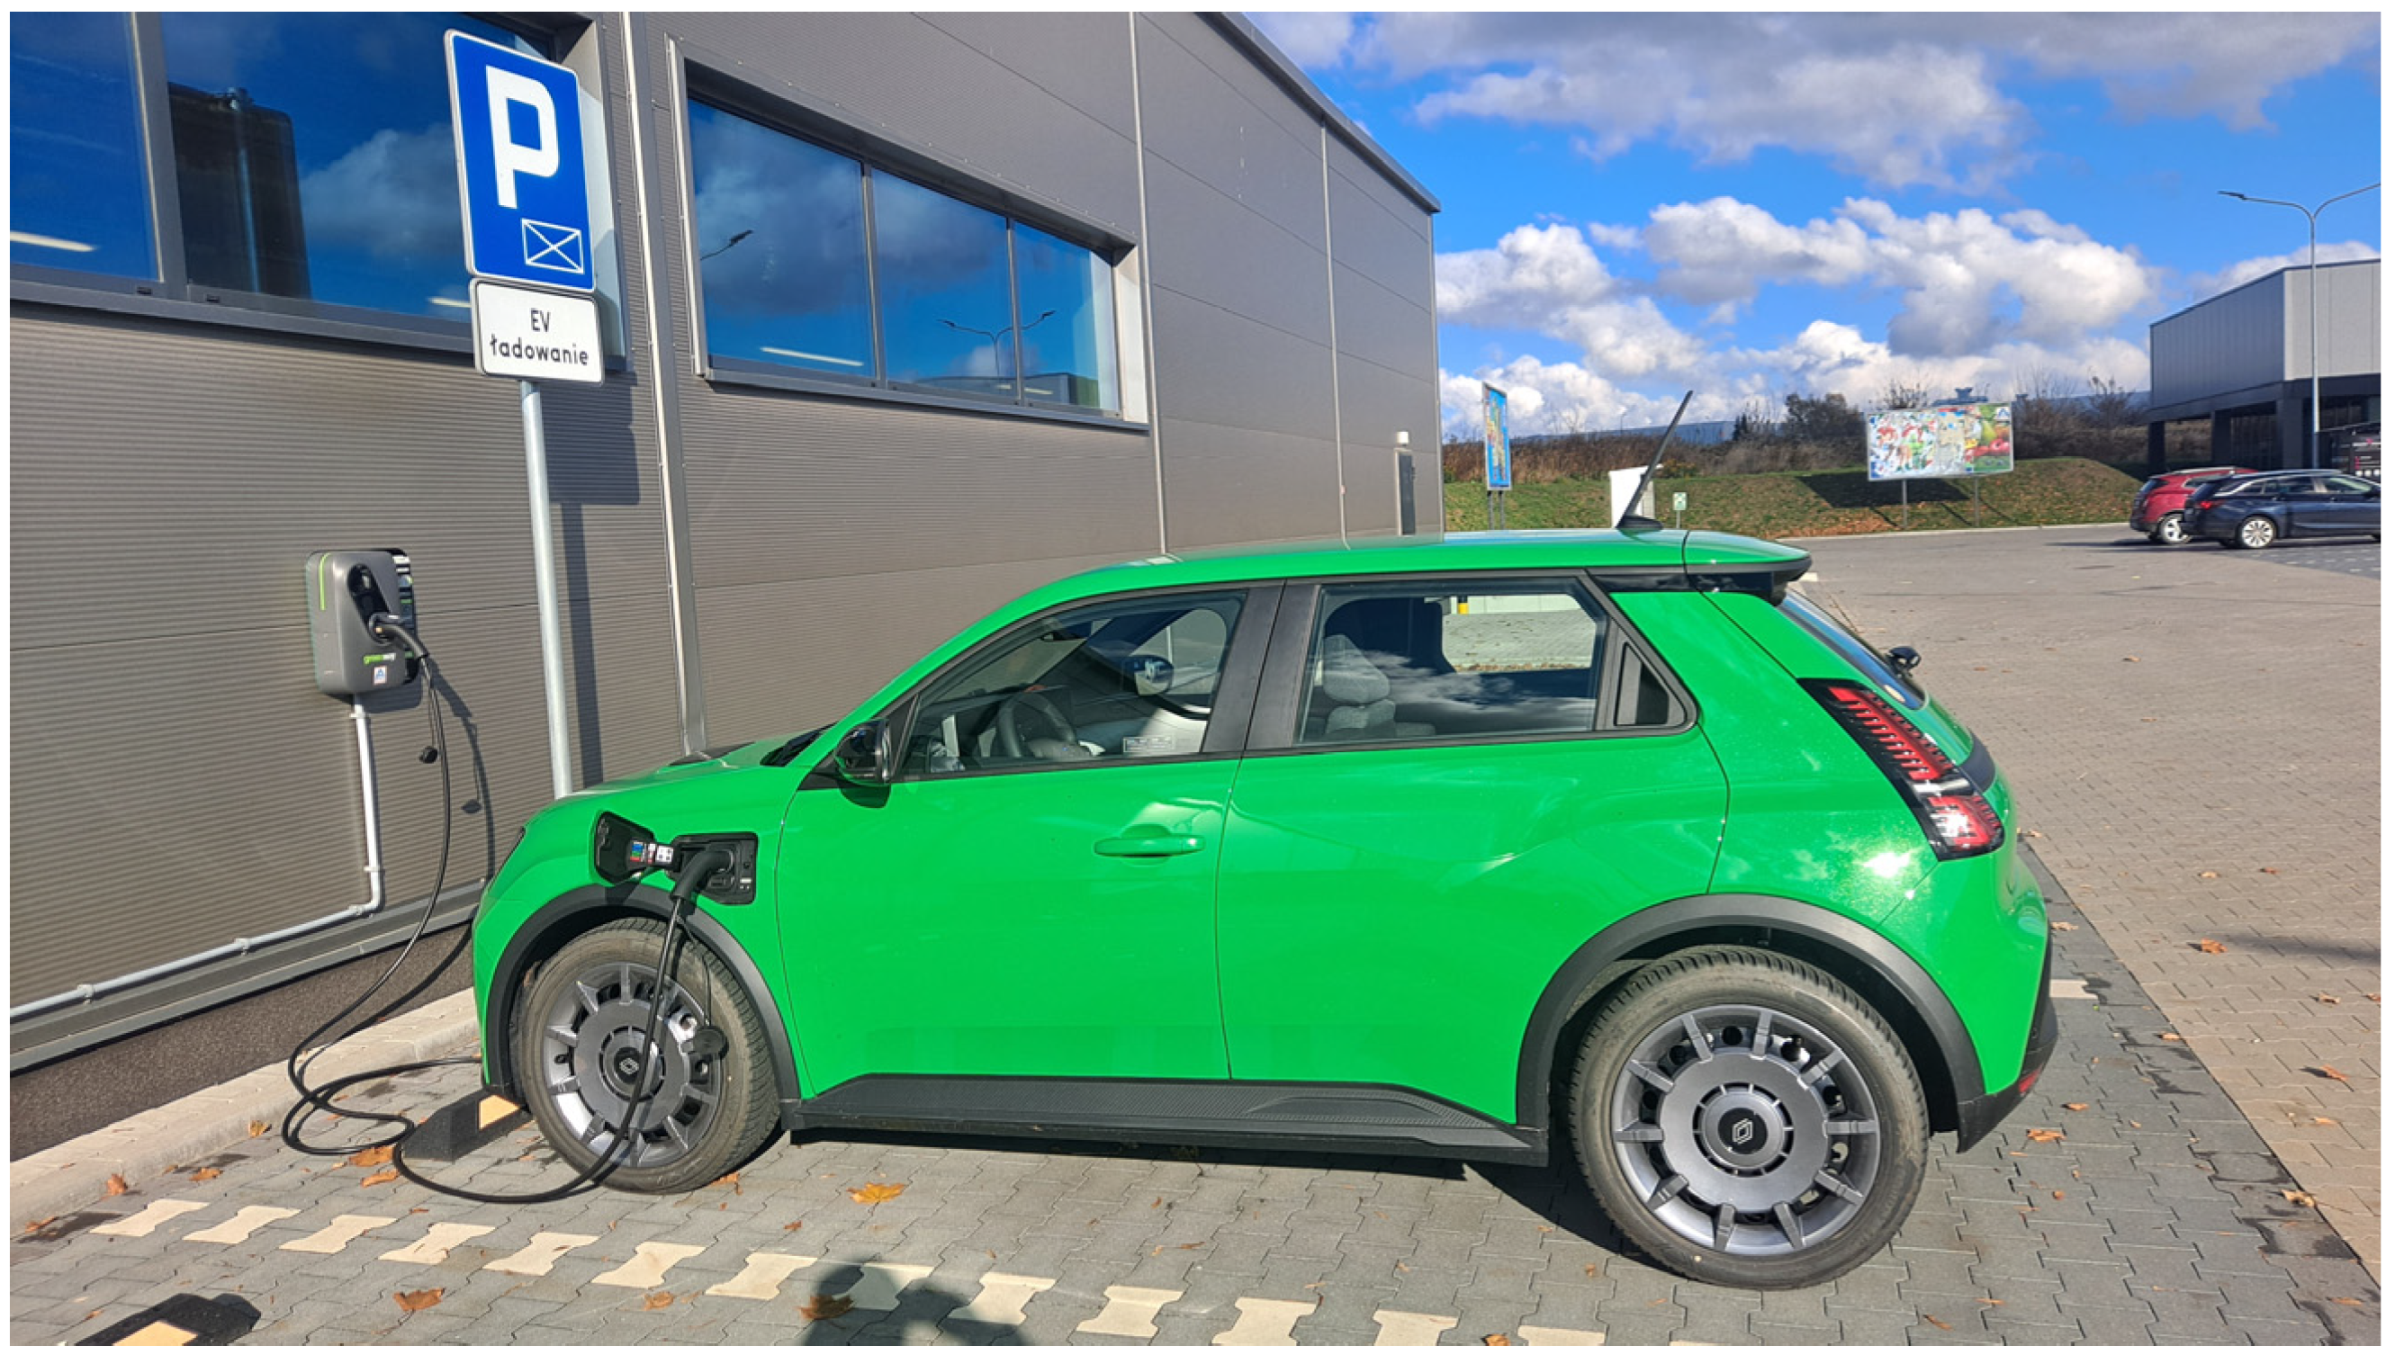
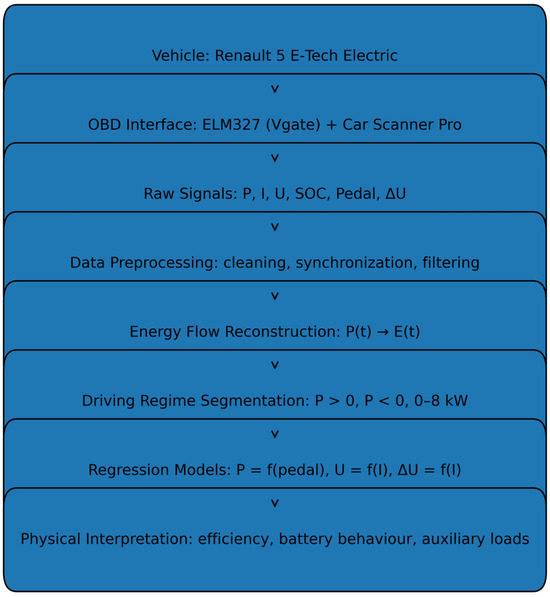
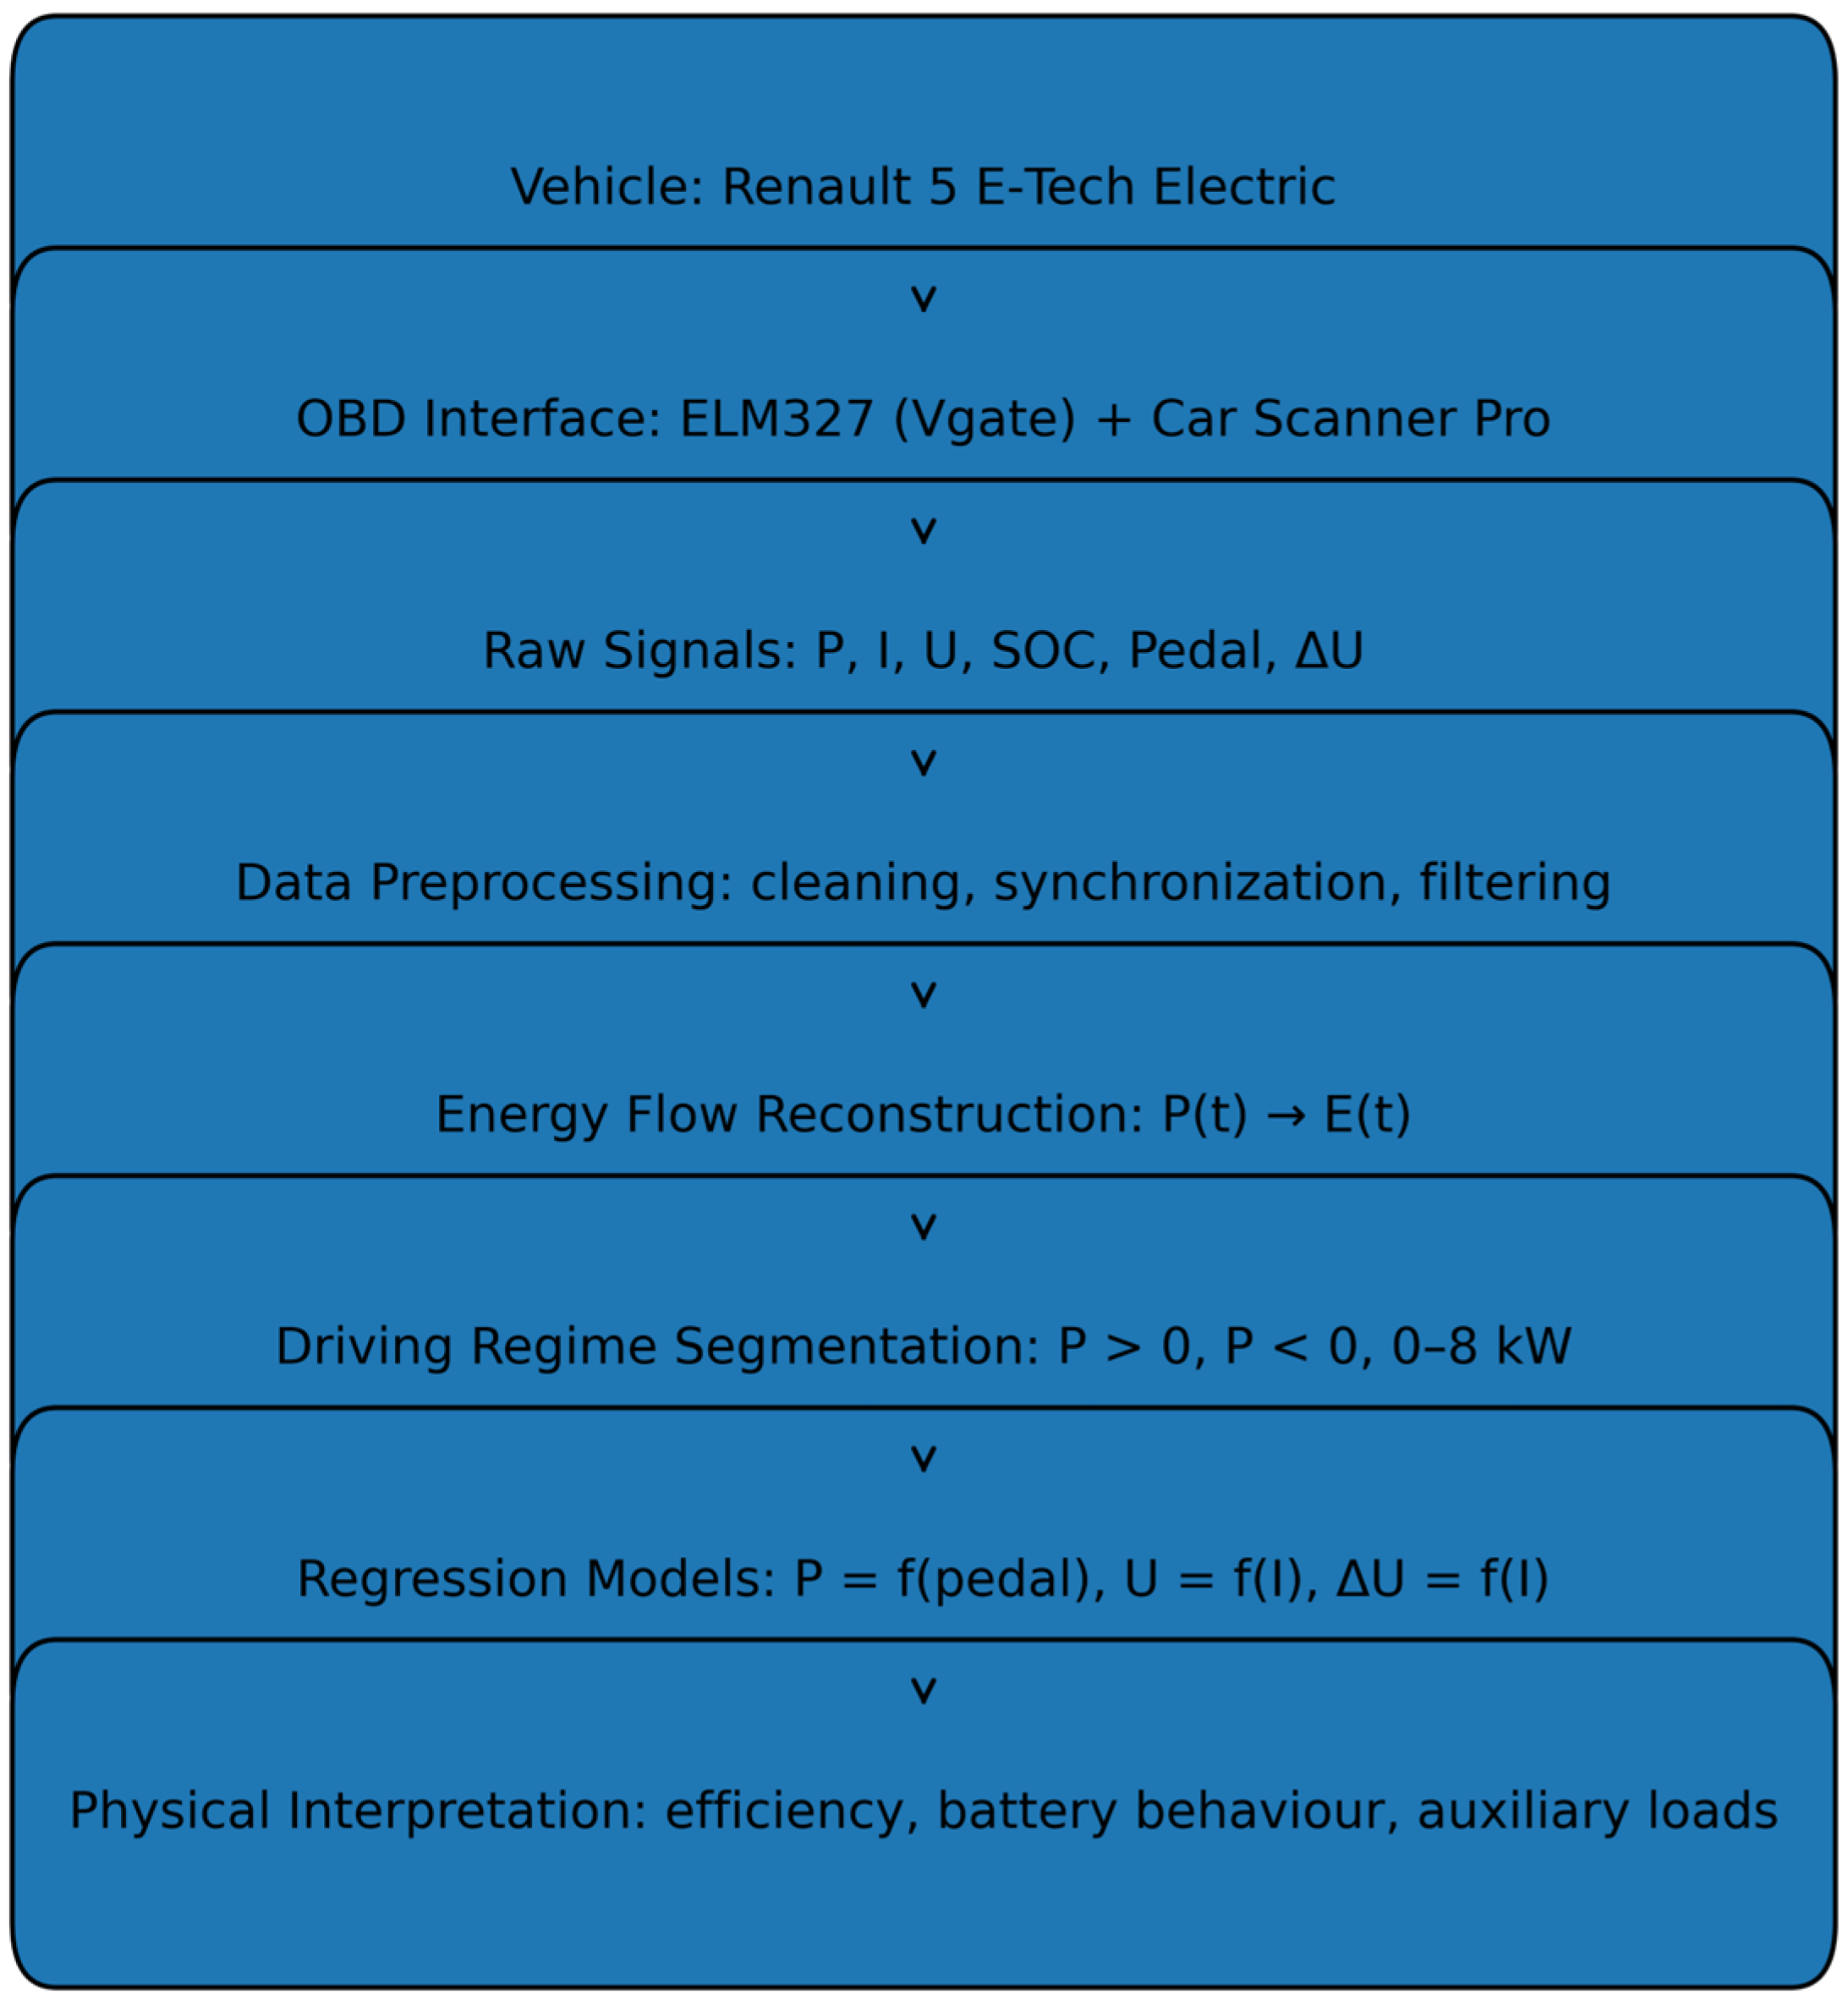
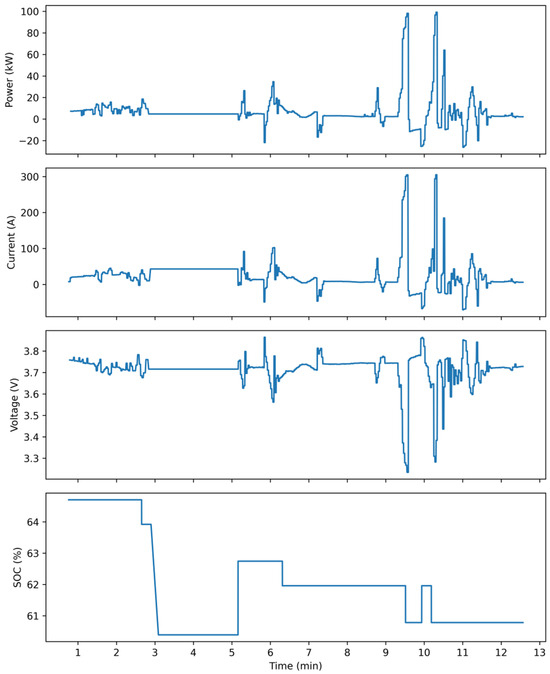
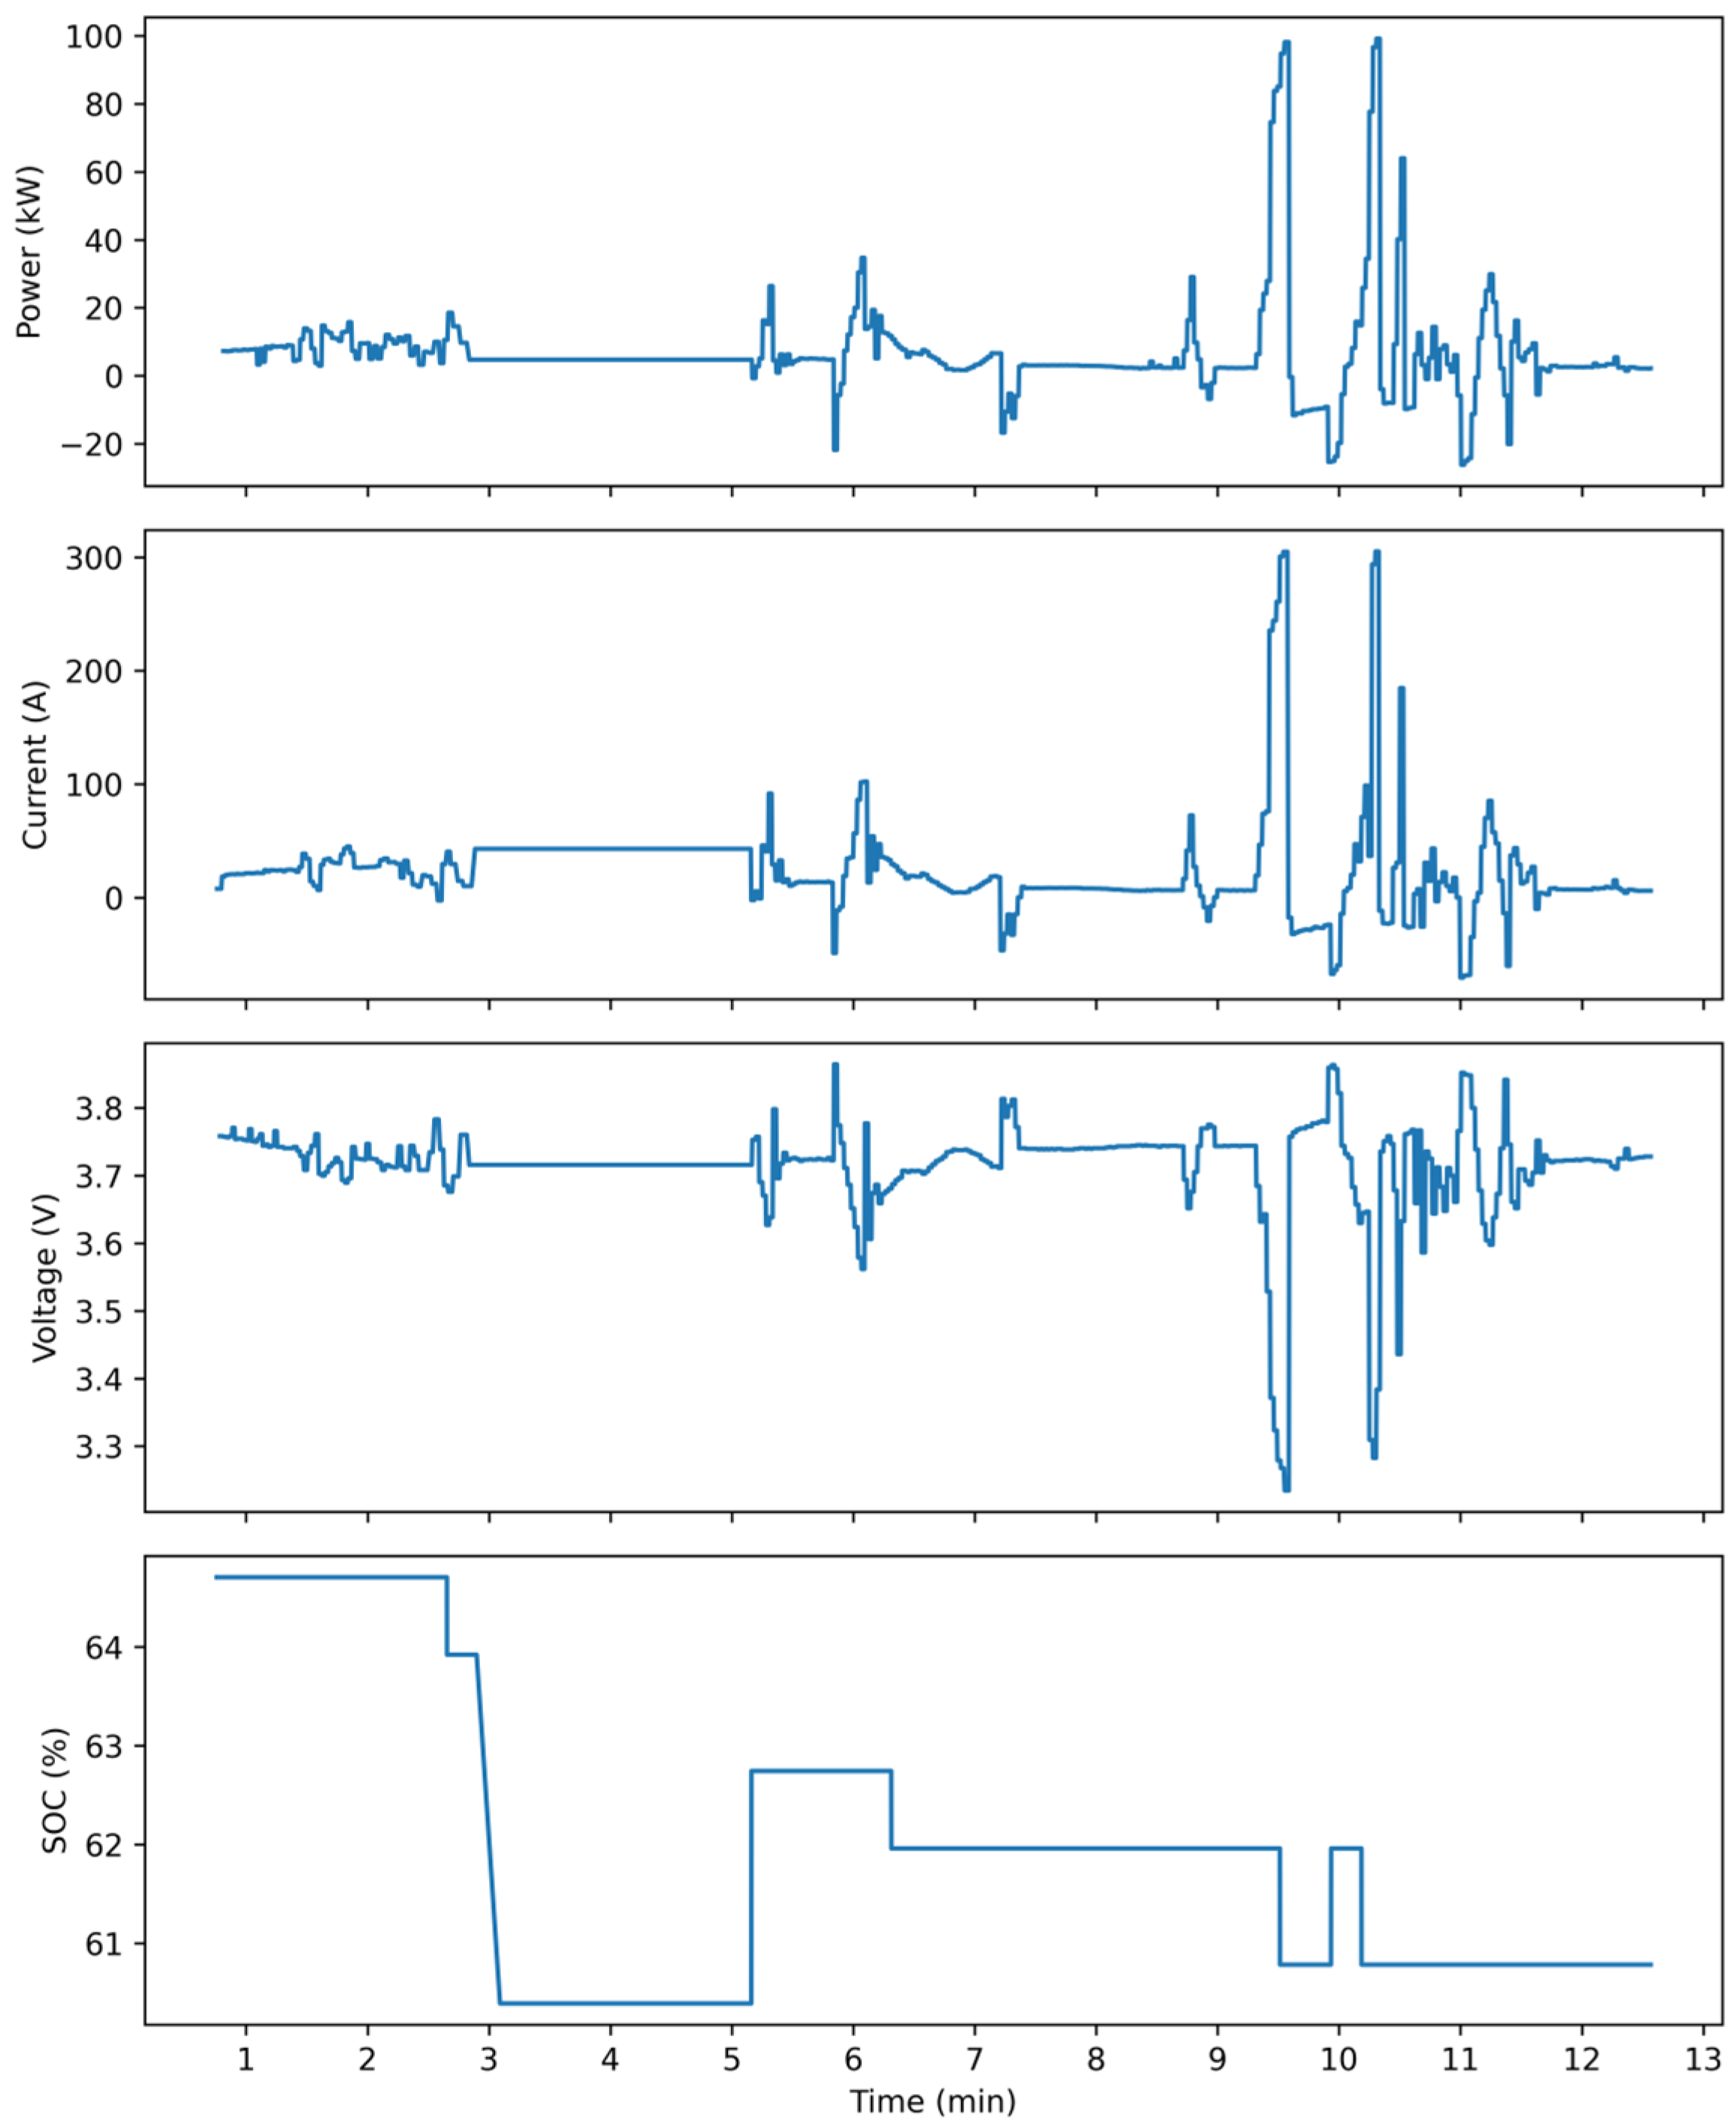
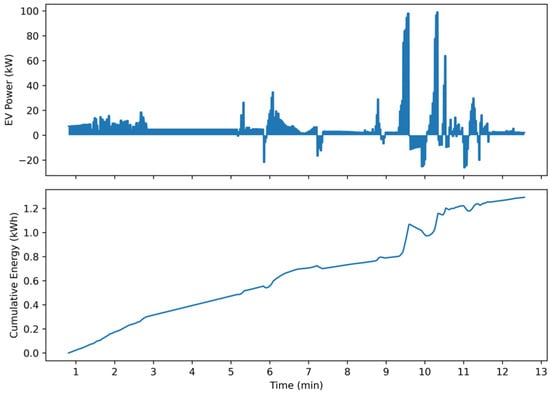
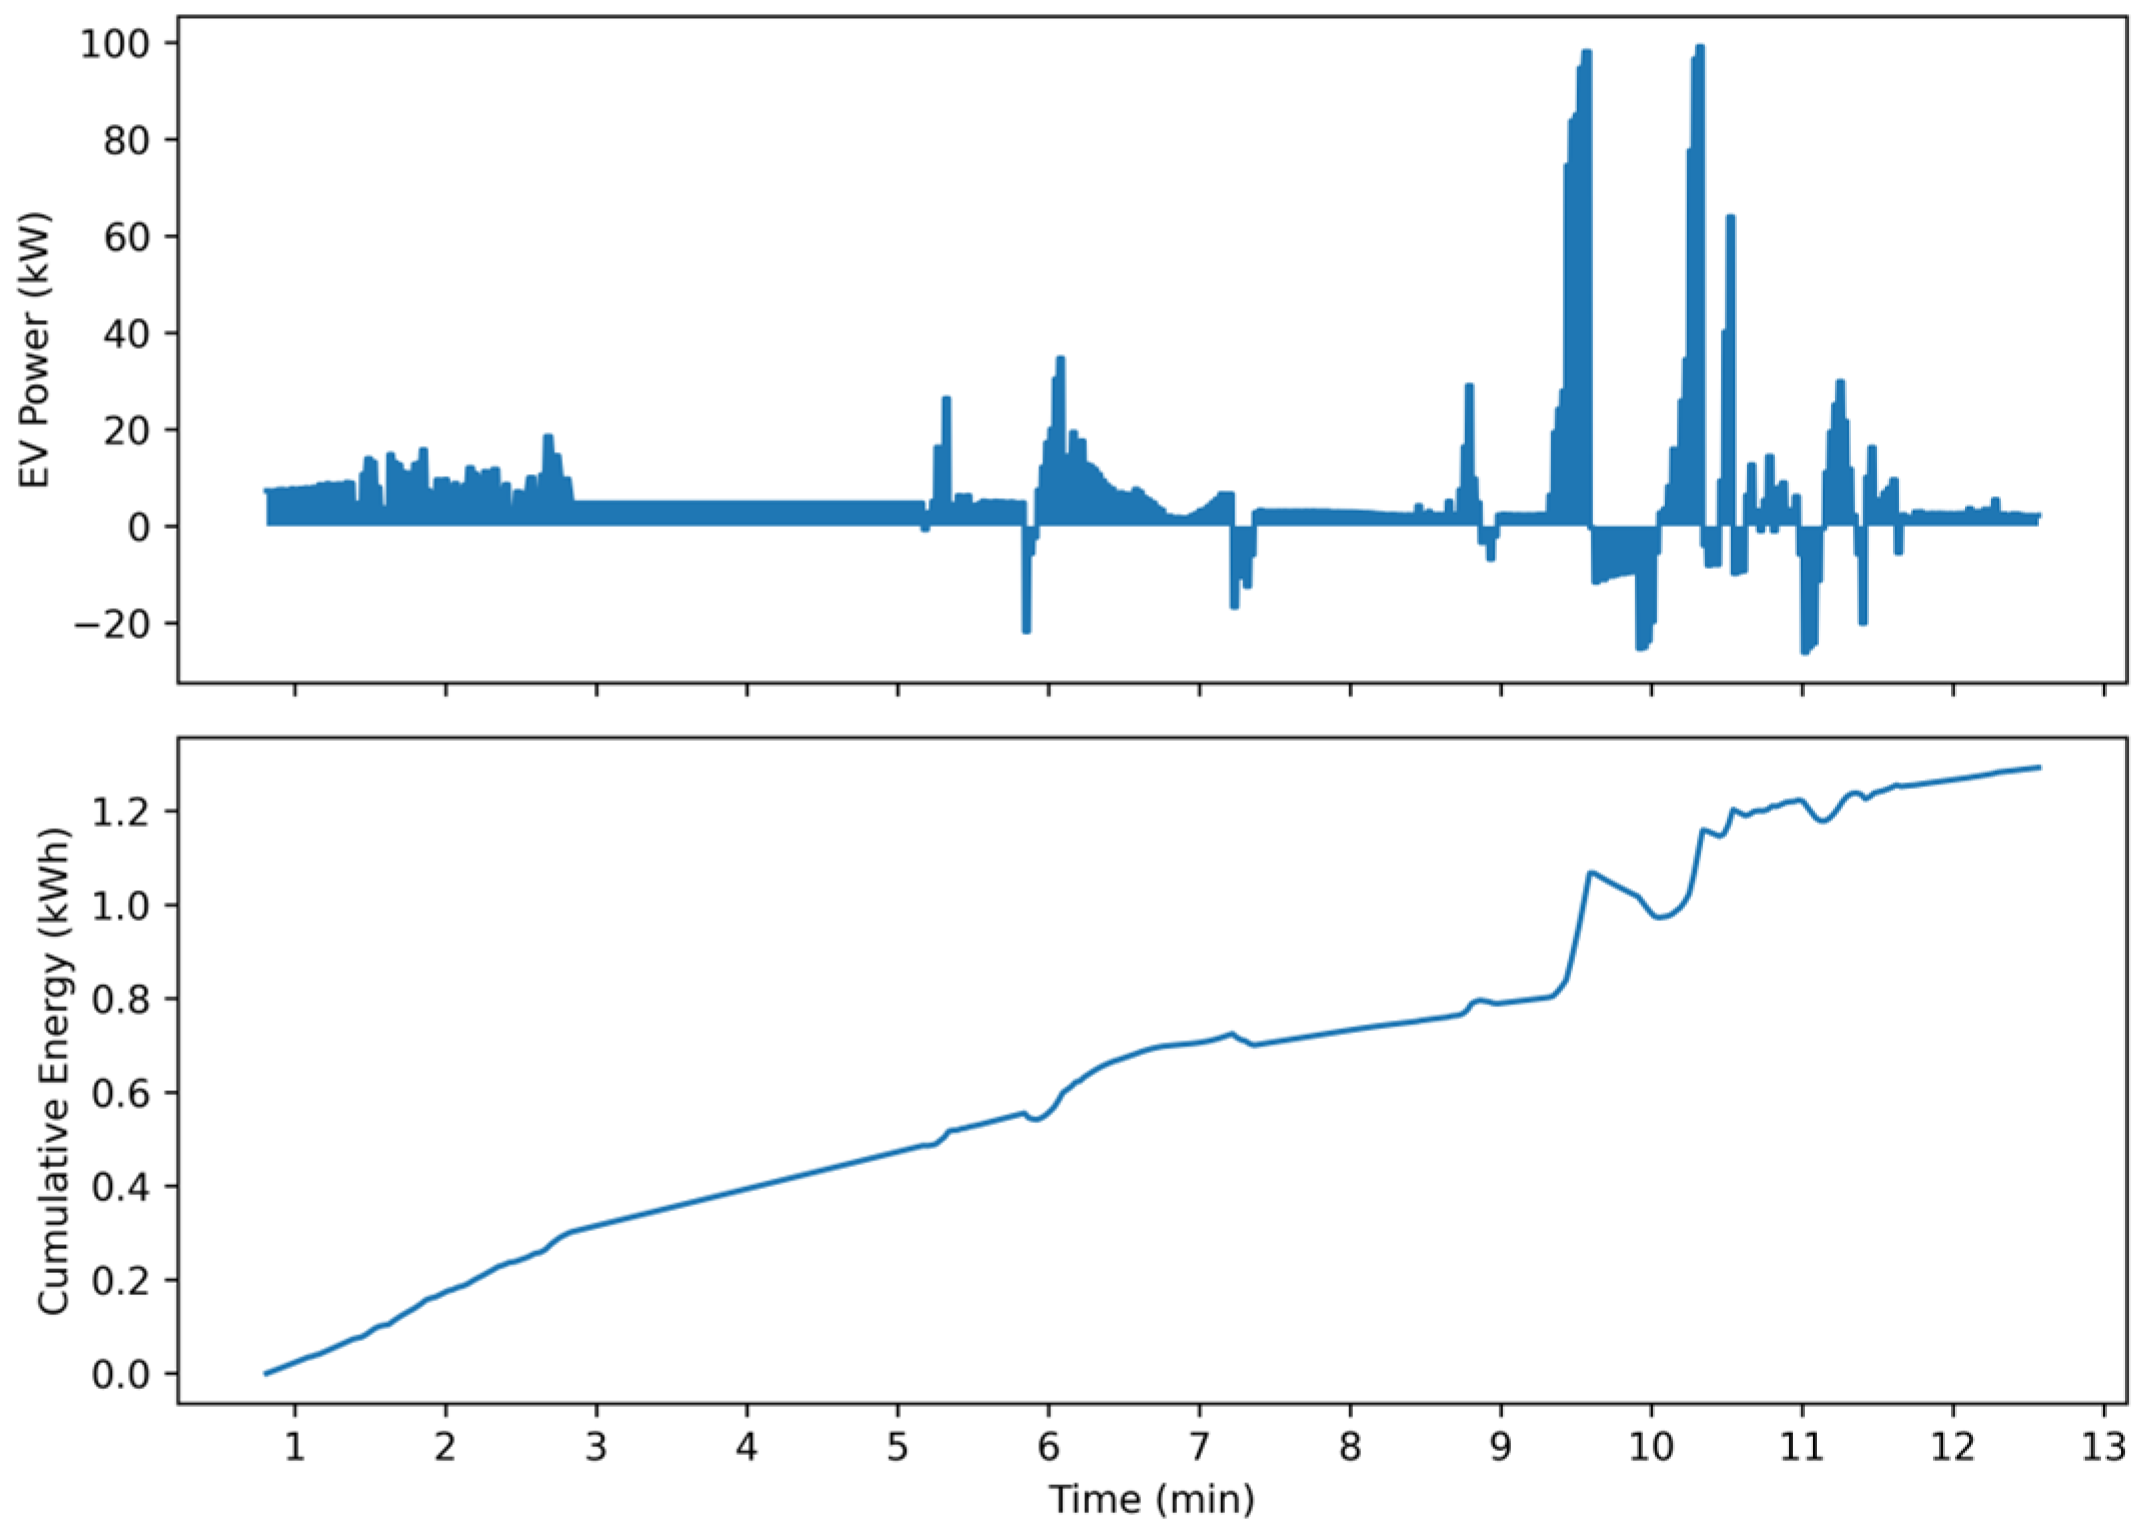
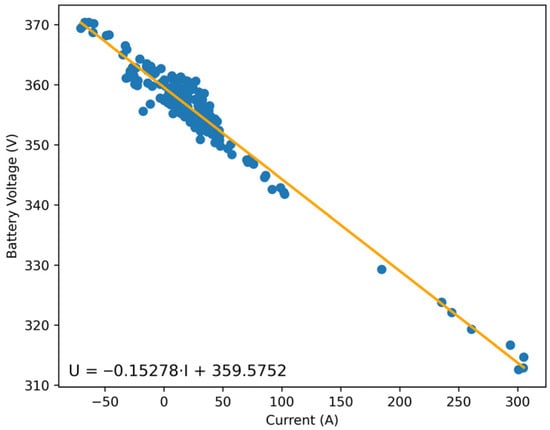
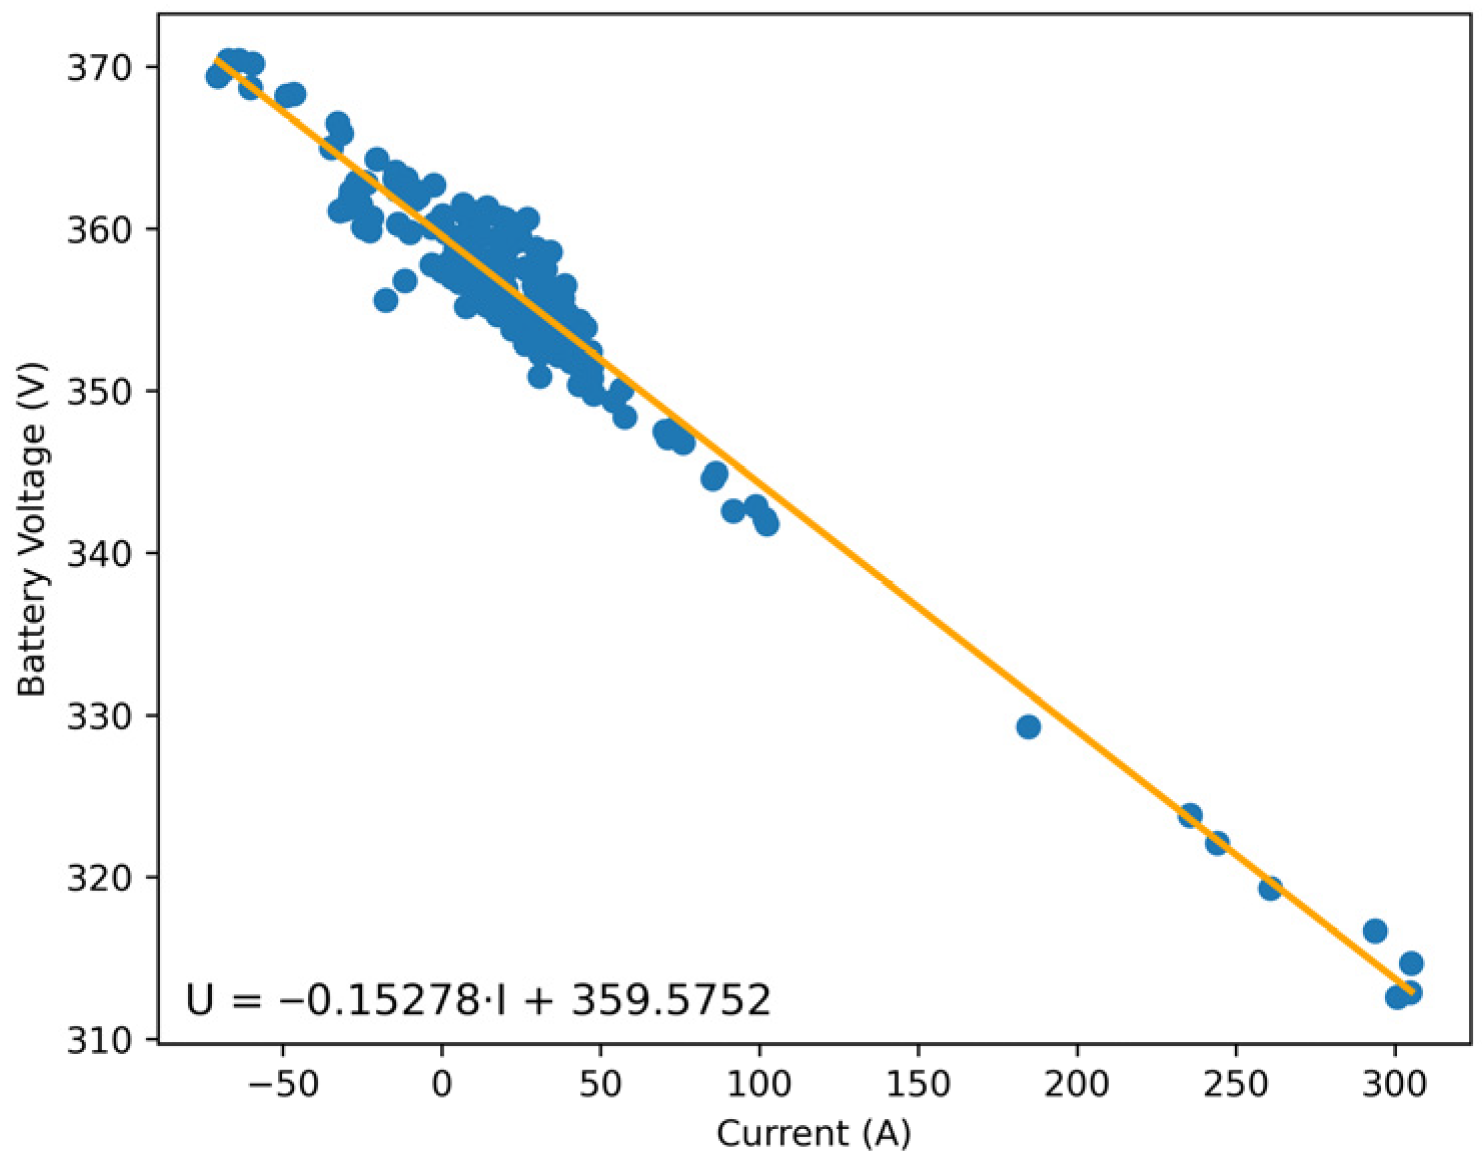
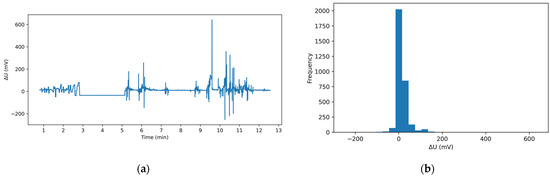
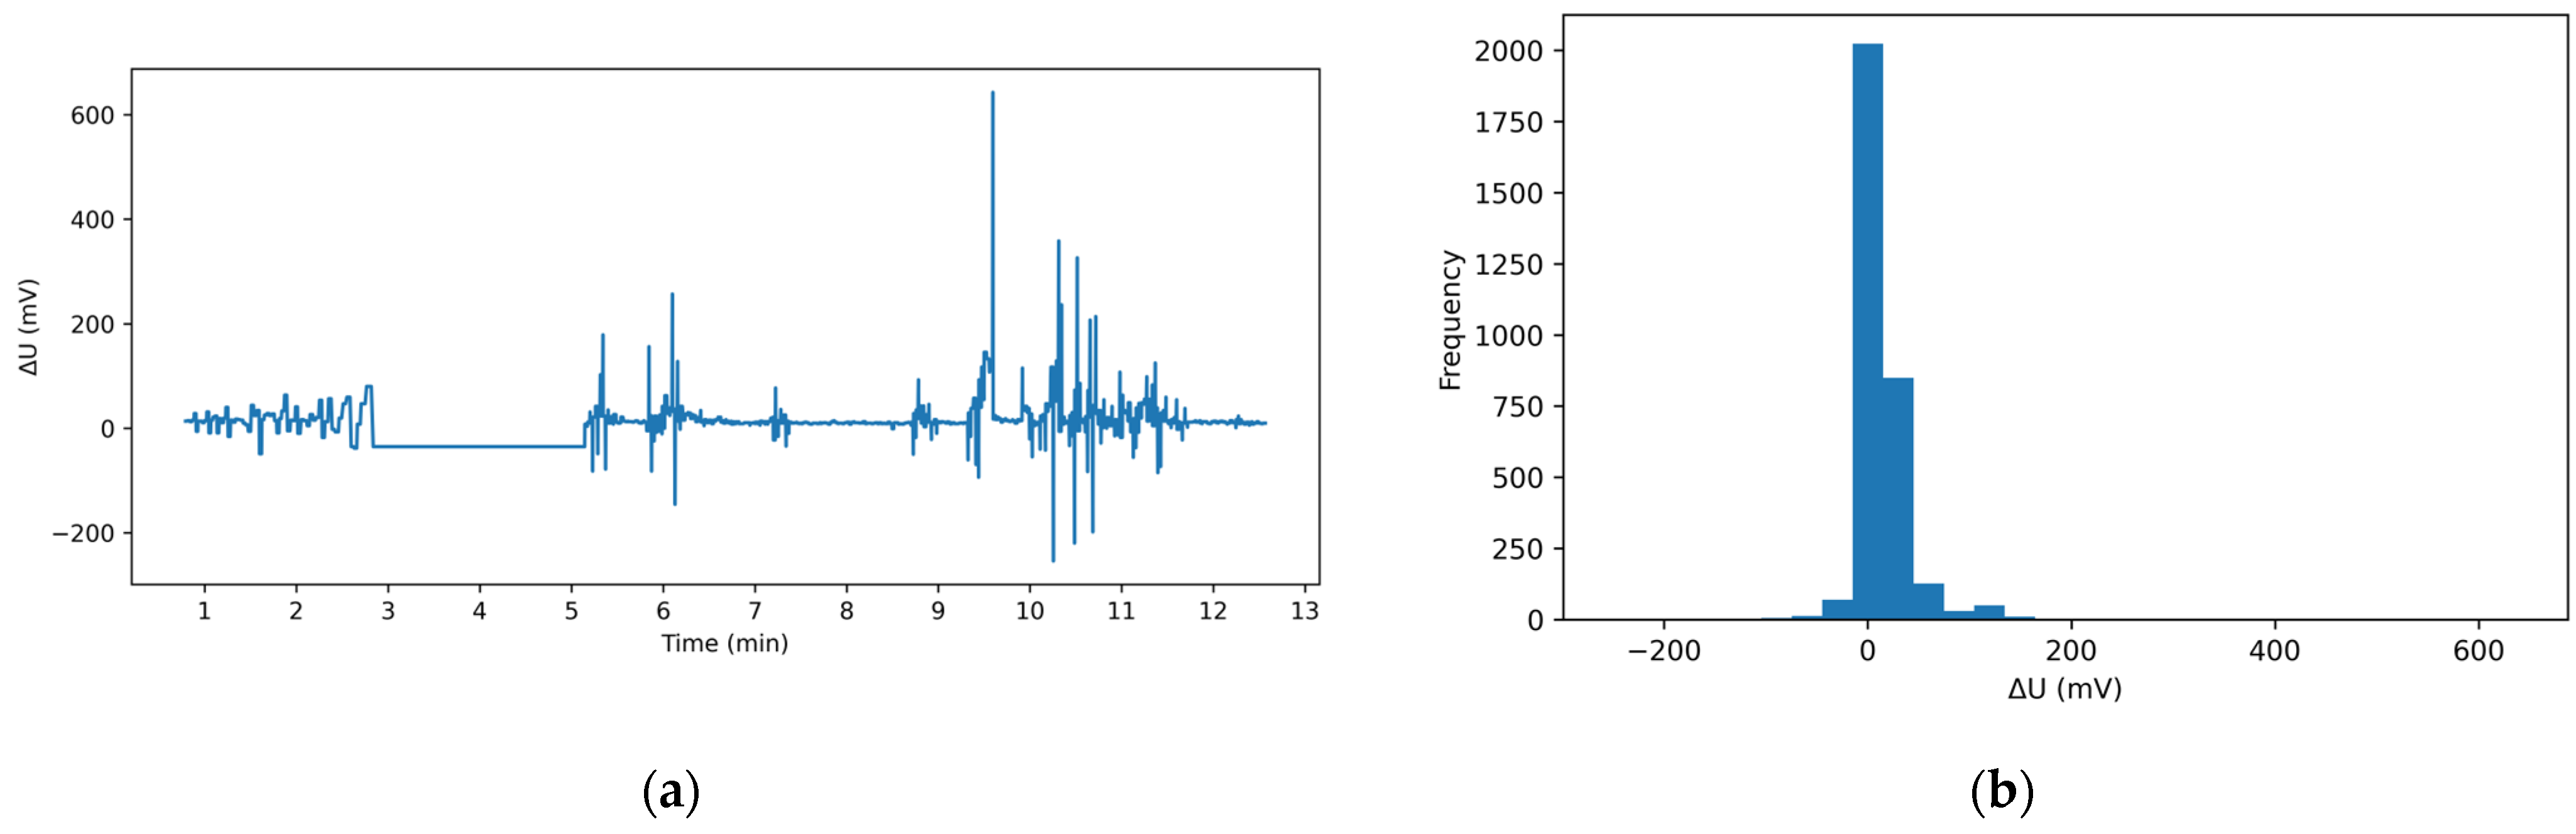
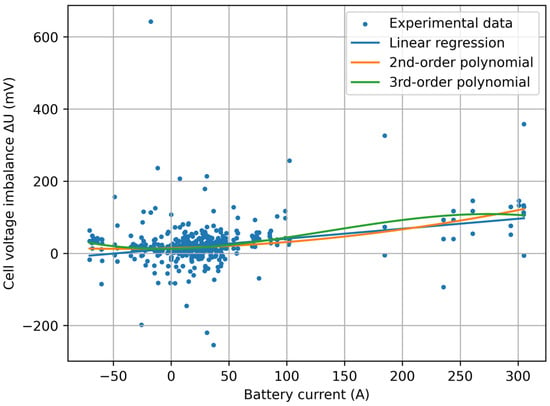
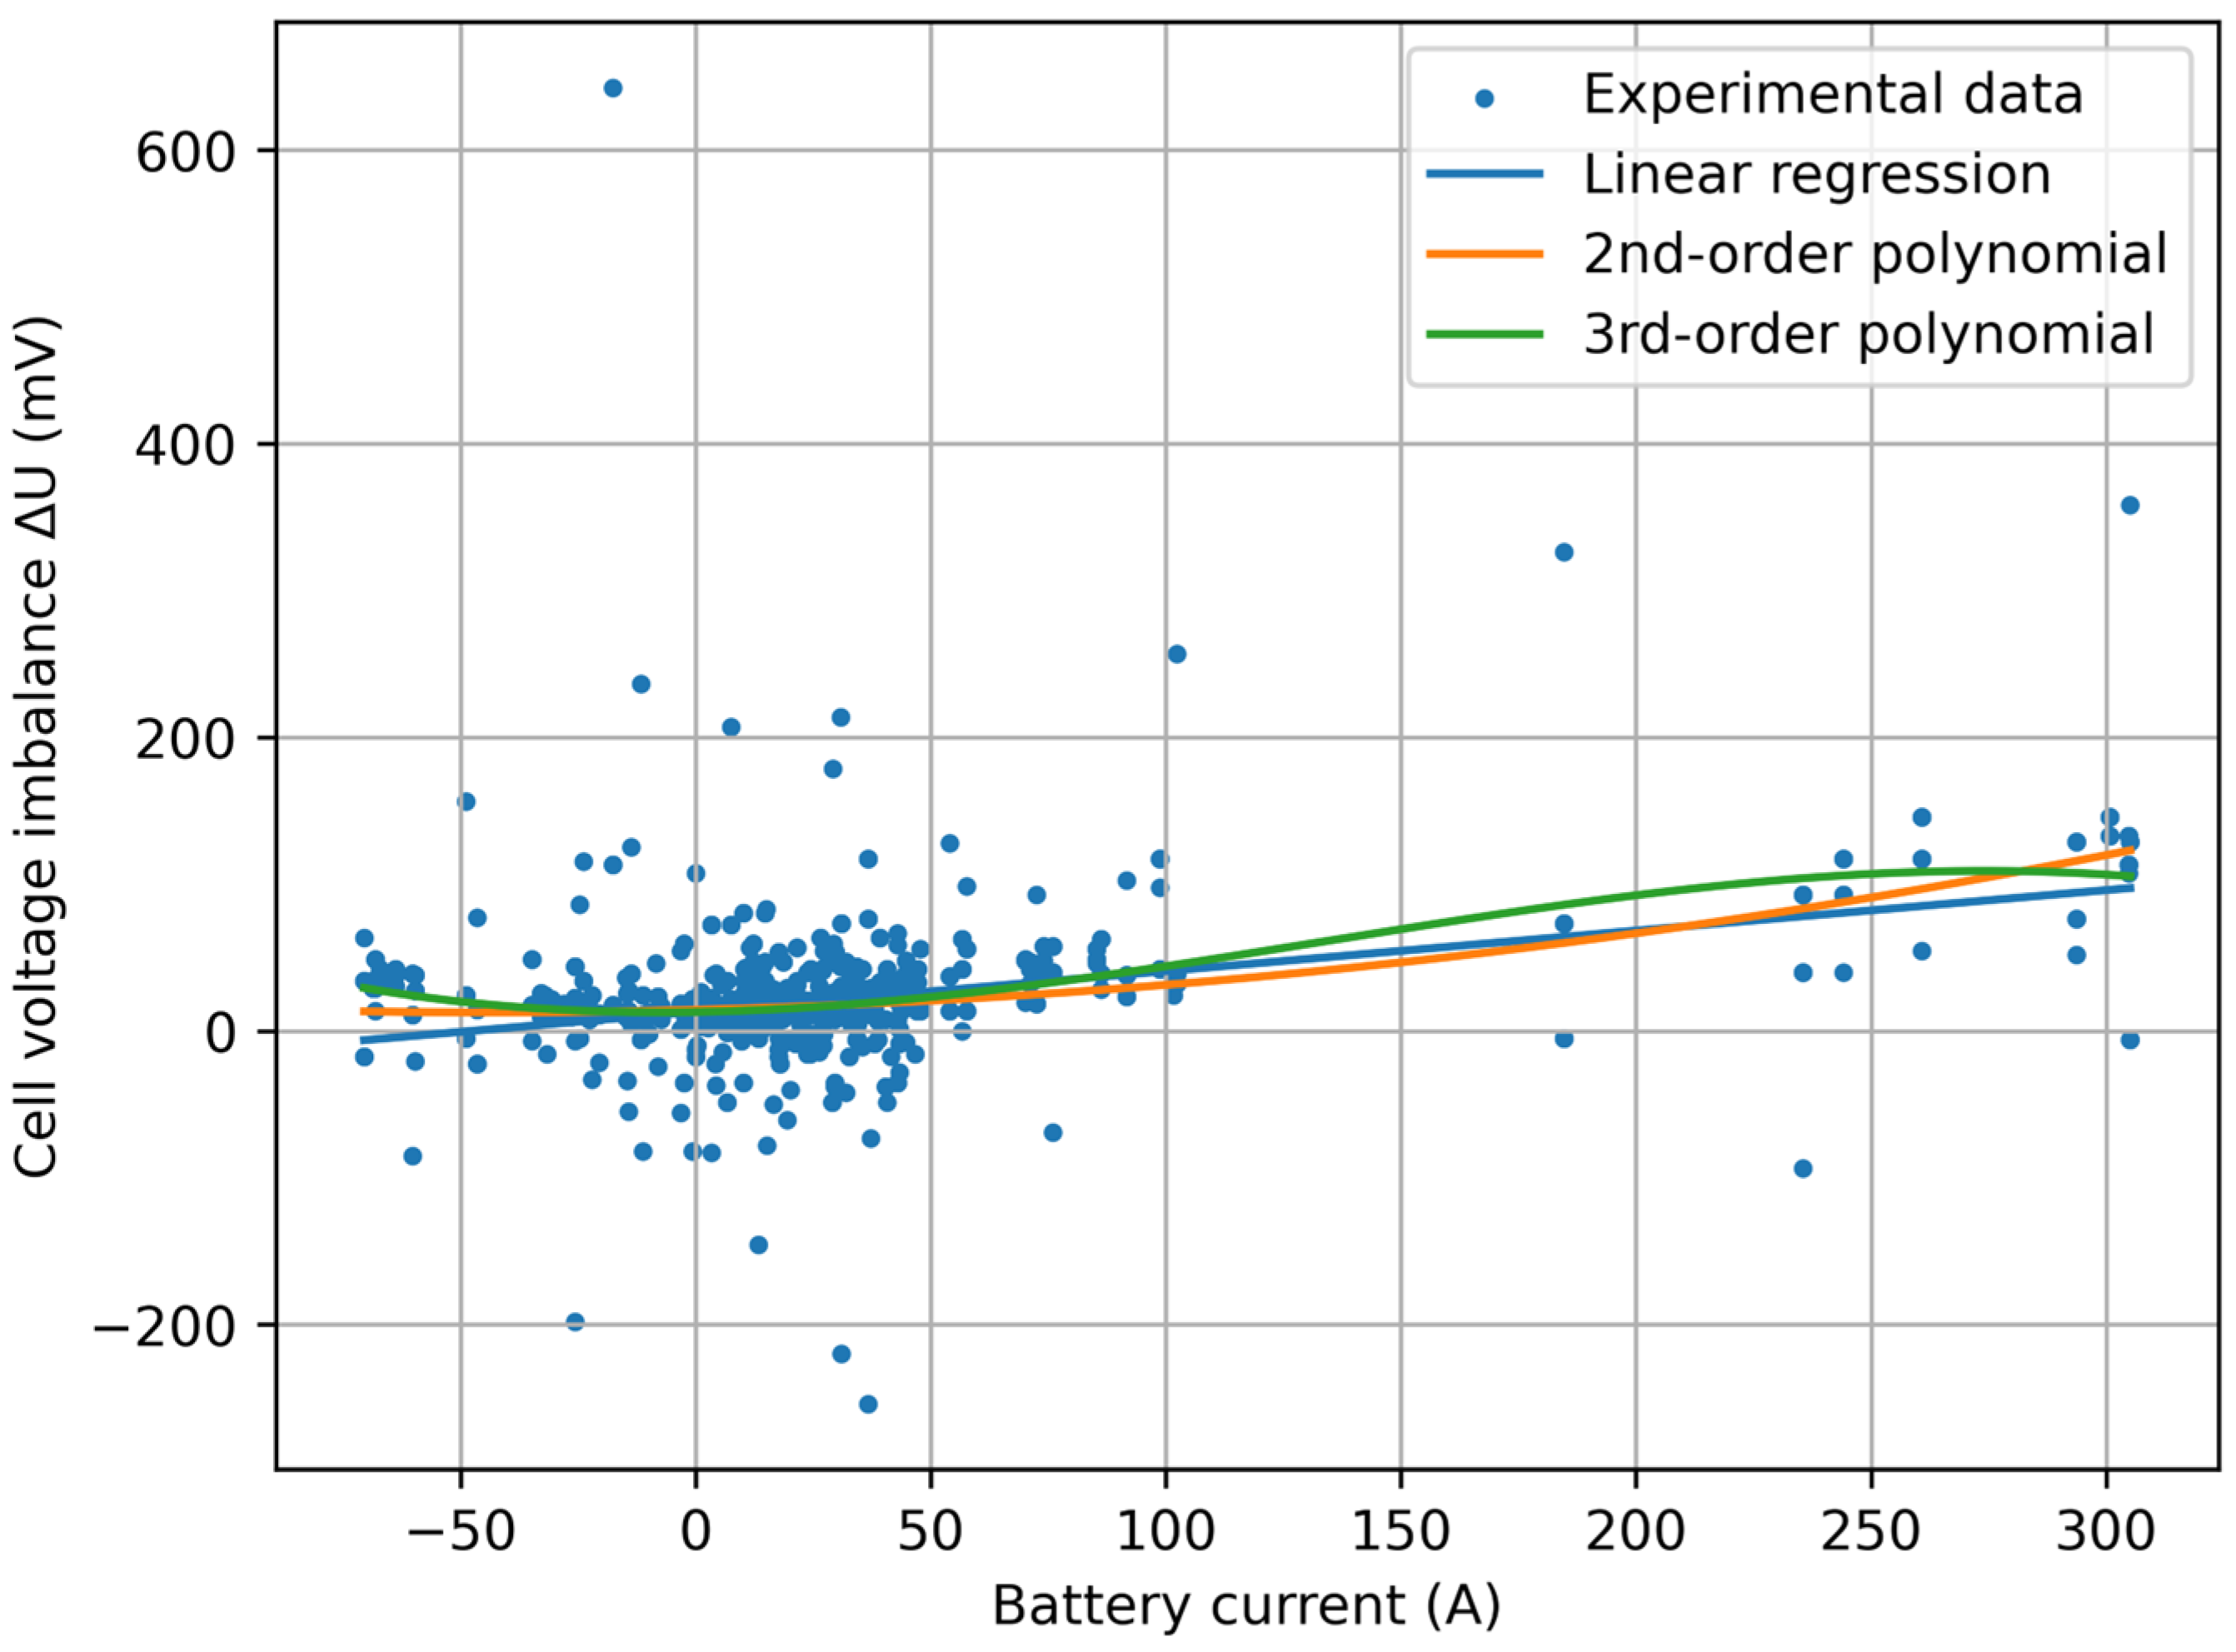
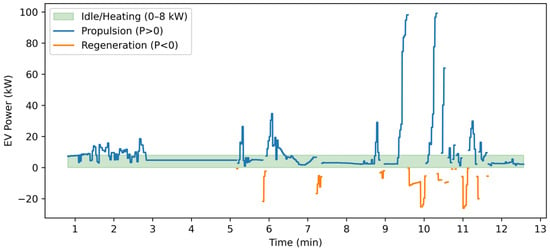
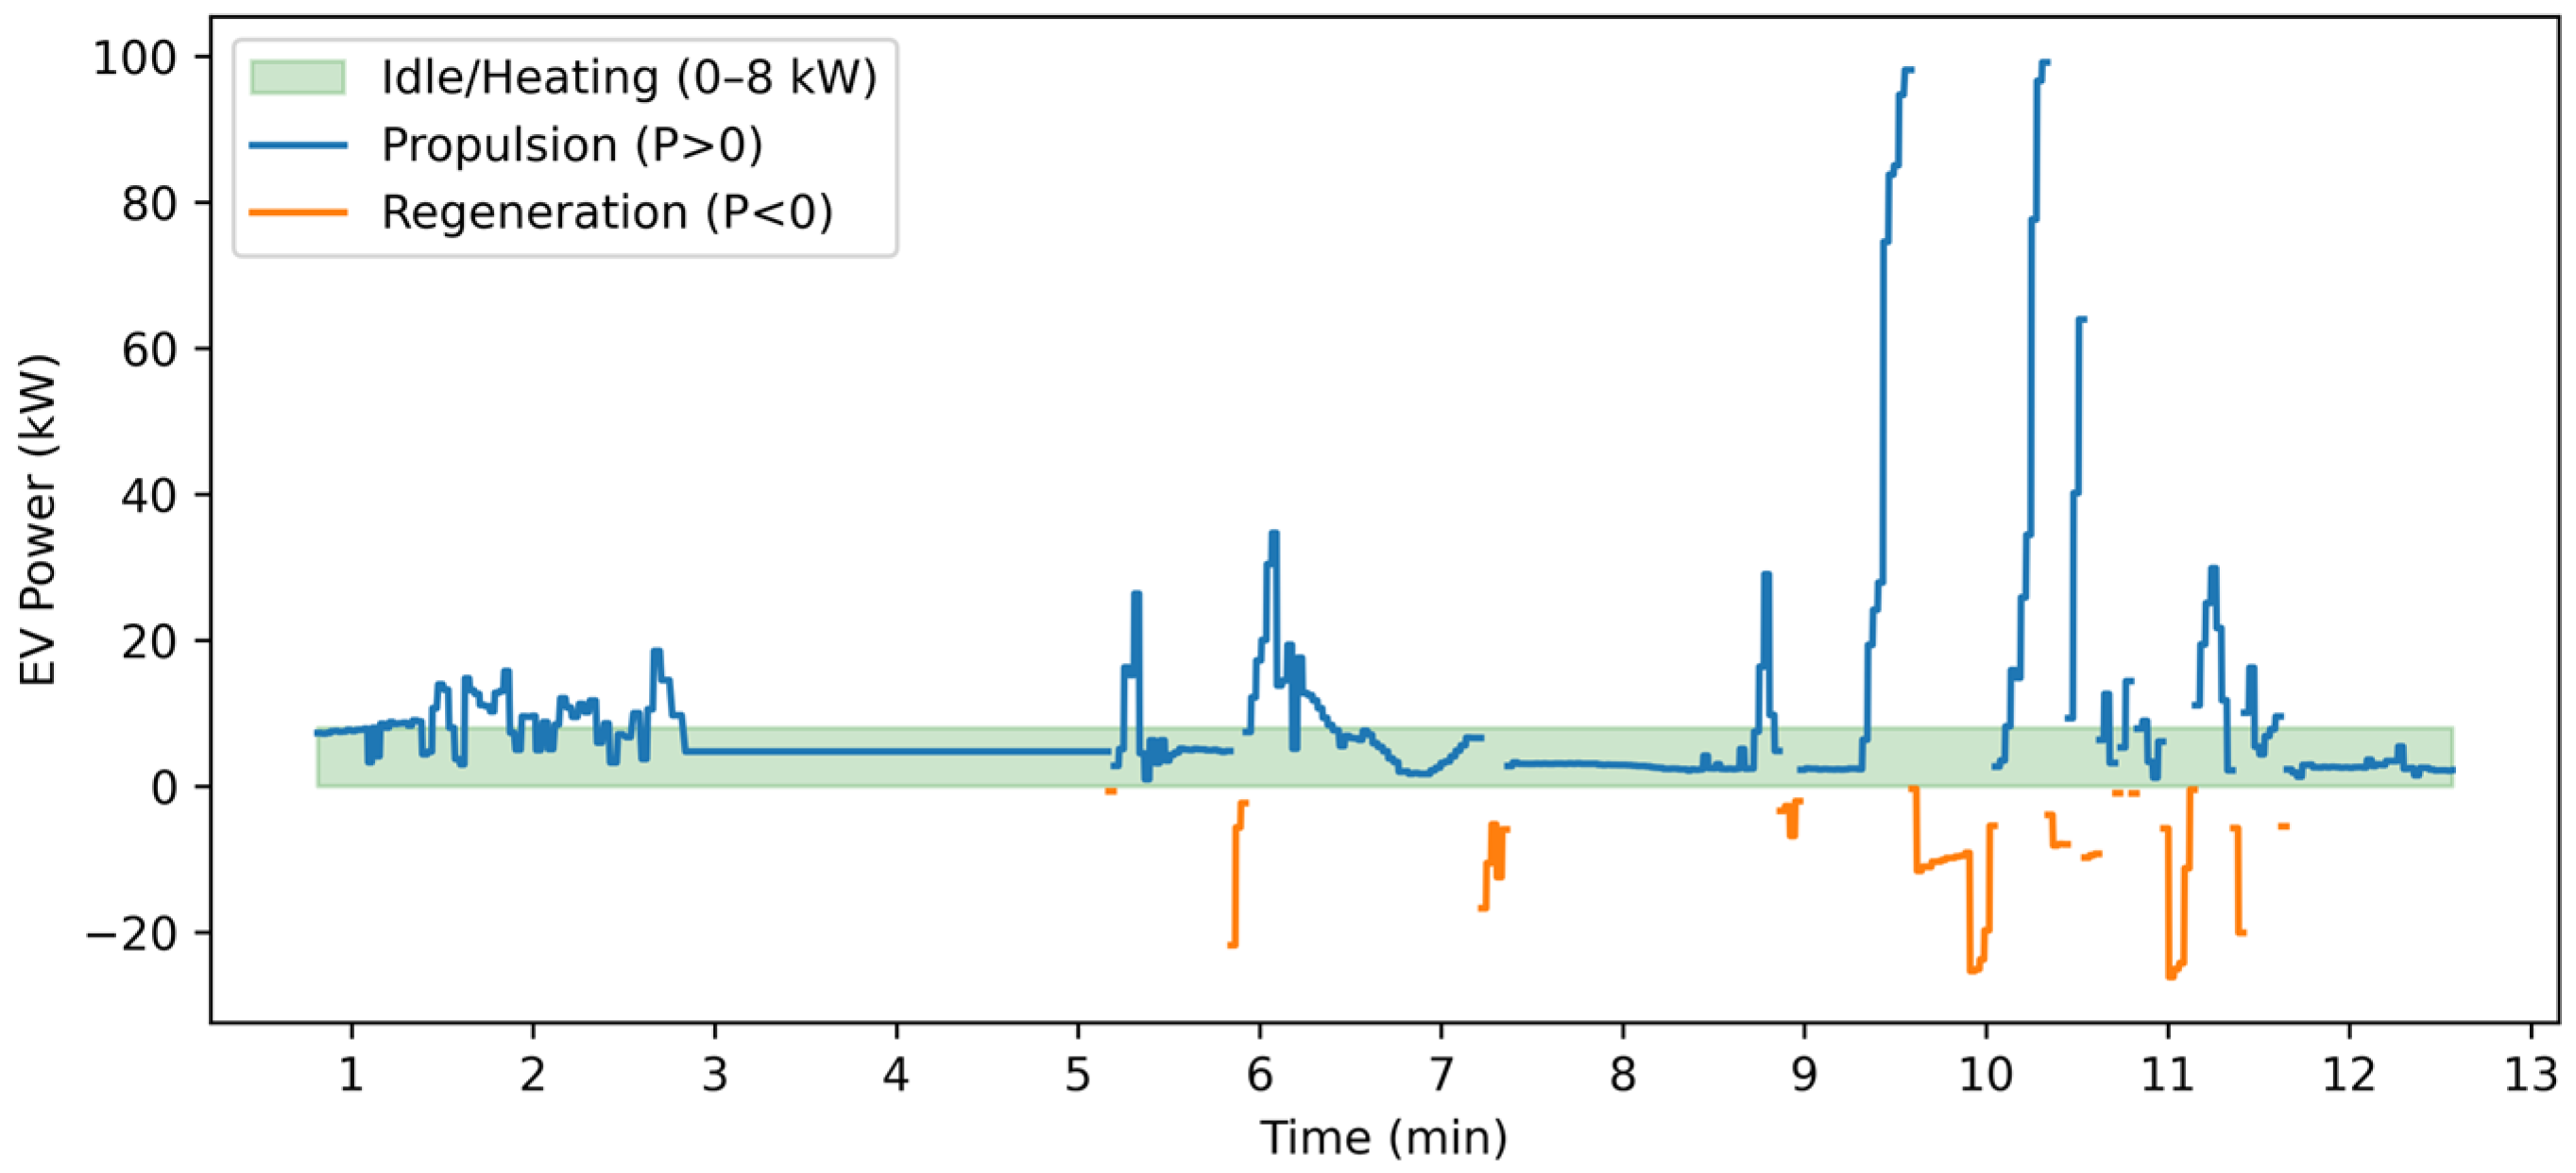
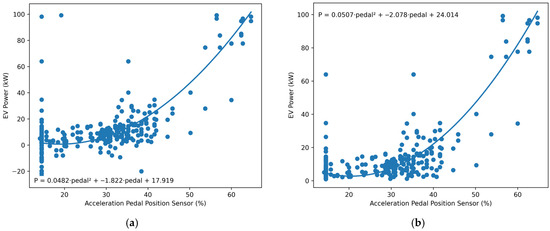
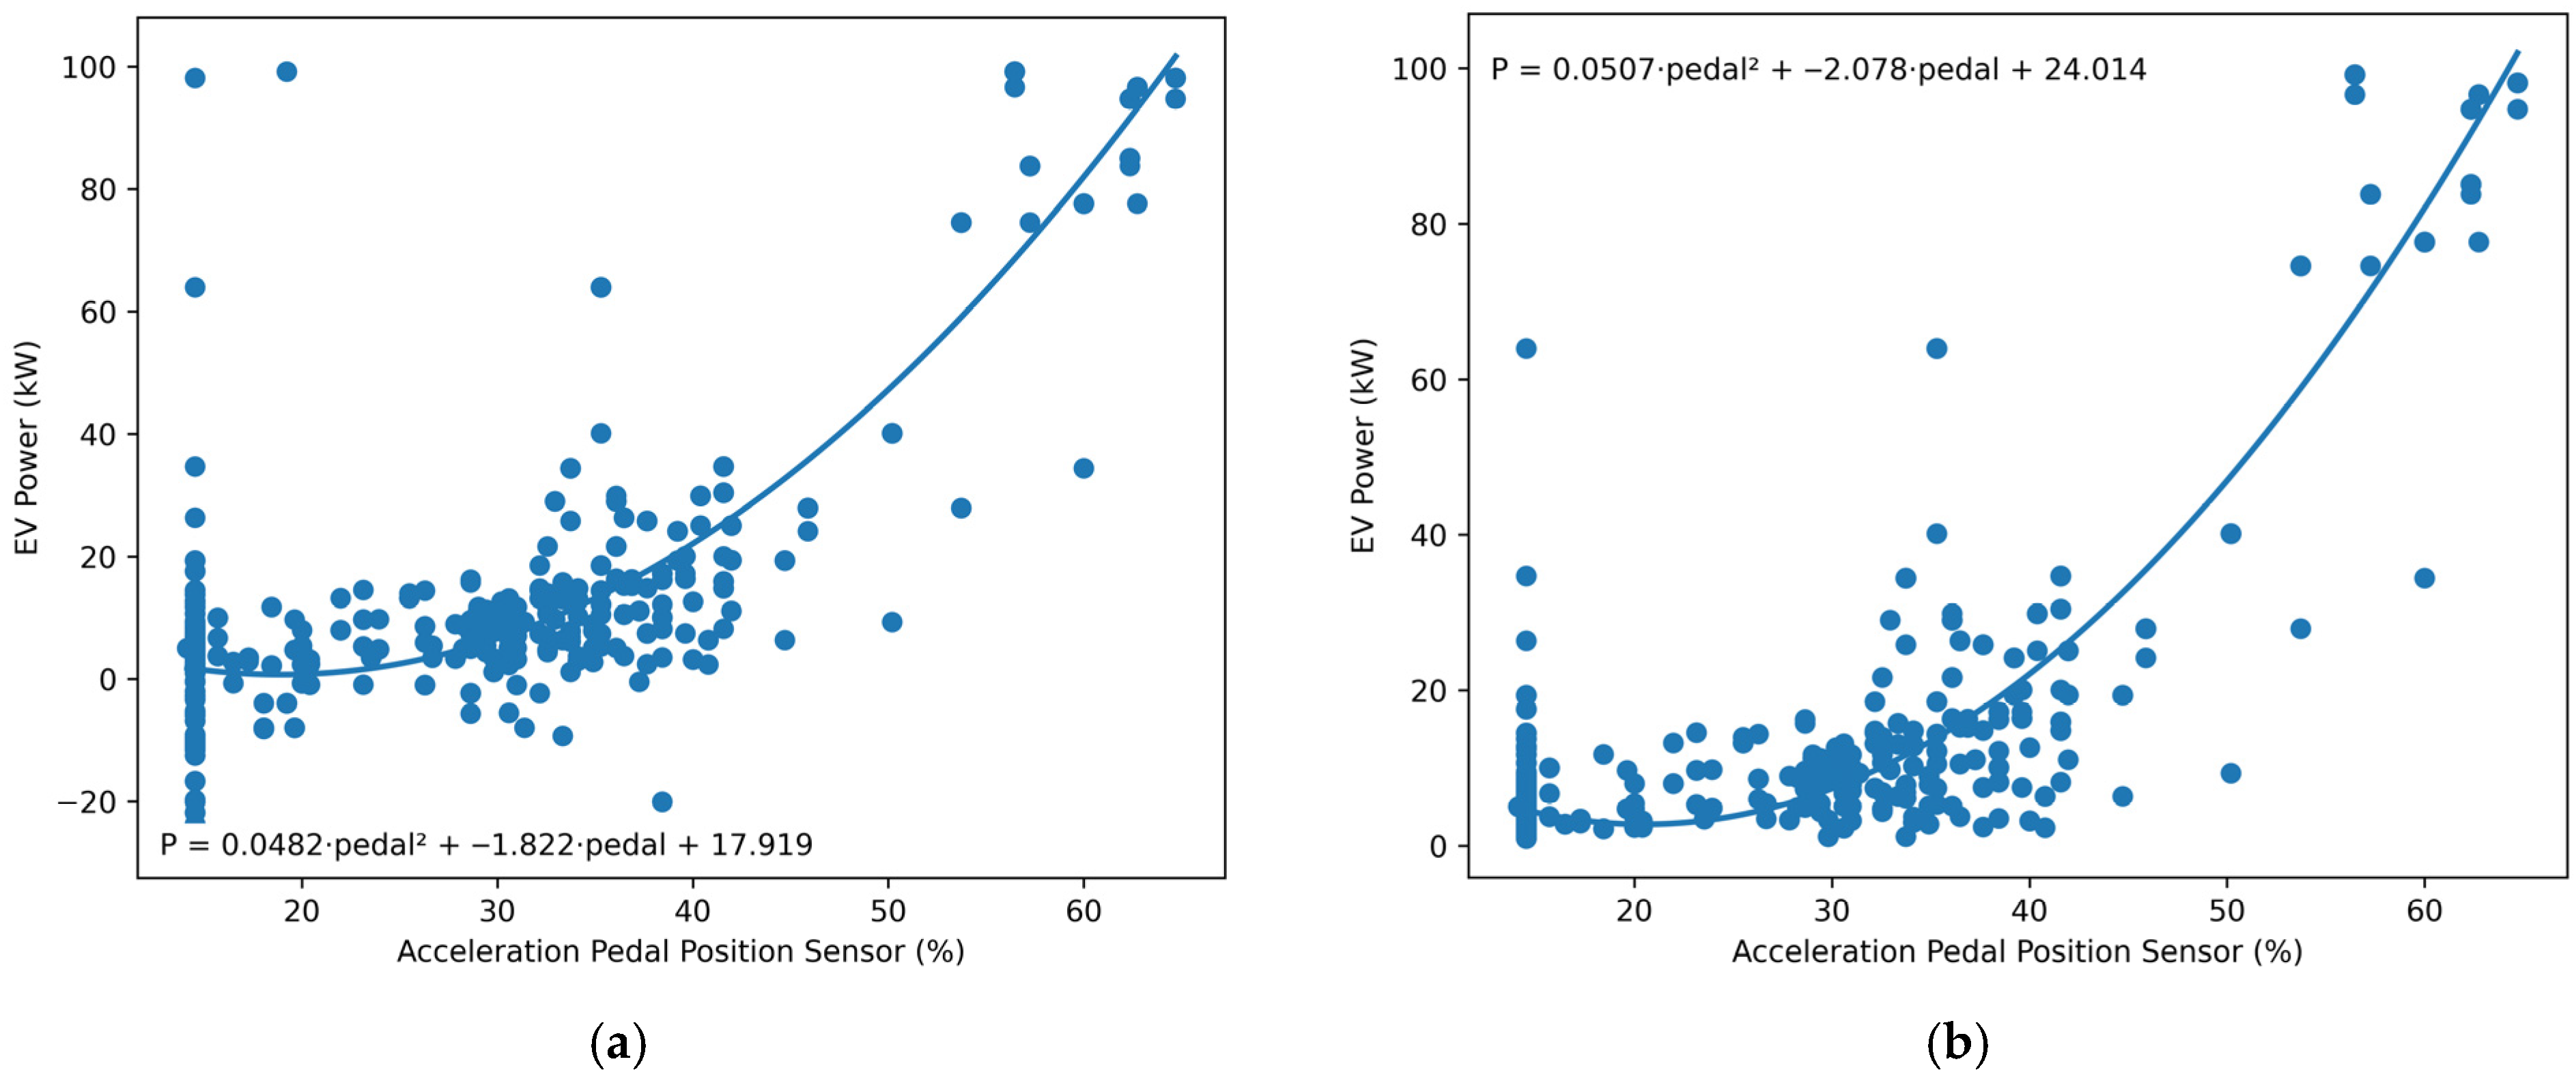
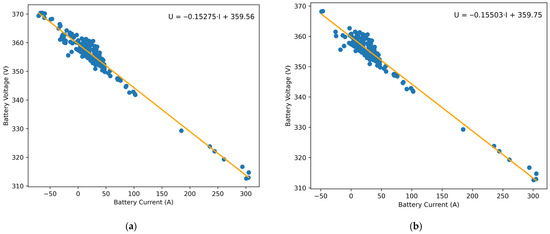
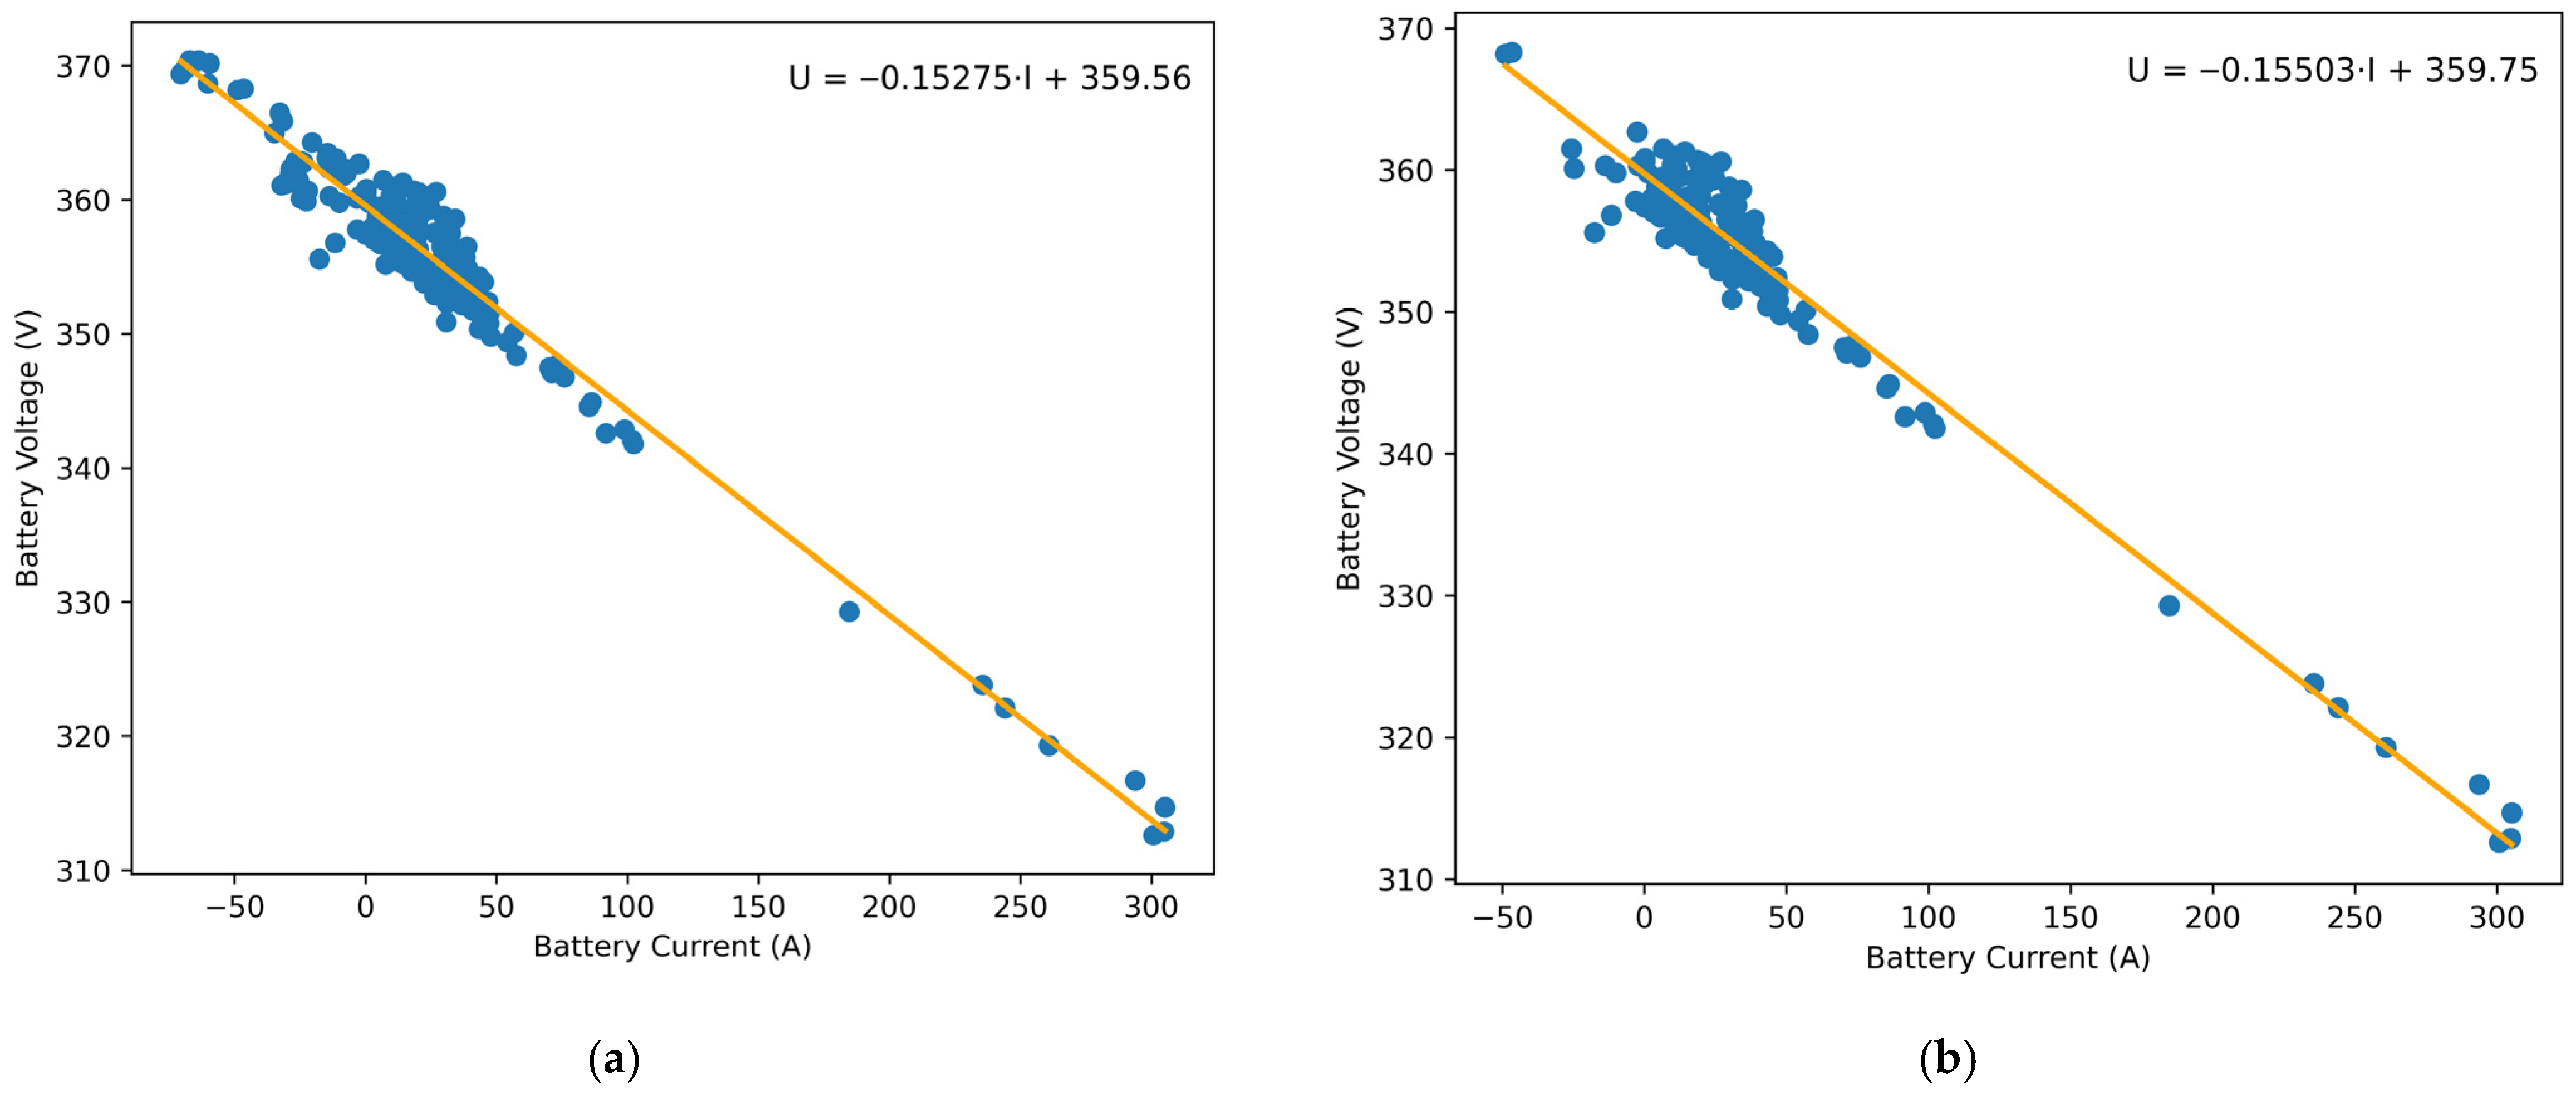

Disclaimer/Publisher’s Note: The statements, opinions and data contained in all publications are solely those of the individual author(s) and contributor(s) and not of MDPI and/or the editor(s). MDPI and/or the editor(s) disclaim responsibility for any injury to people or property resulting from any ideas, methods, instructions or products referred to in the content. |
© 2026 by the authors. Licensee MDPI, Basel, Switzerland. This article is an open access article distributed under the terms and conditions of the Creative Commons Attribution (CC BY) license.