


Abstract
A 3D multi-modal detection method using a monocular camera and LiDAR has drawn much attention due to its low cost and strong applicability, making it highly valuable for autonomous driving and unmanned aerial vehicles (UAVs). However, conventional fusion approaches relying on static arithmetic operations often fail to adapt to dynamic, complex scenarios. Furthermore, existing ROI alignment techniques, such as local projection and cross-attention, are inadequate for mitigating the feature misalignment triggered by depth estimation noise in pseudo-point clouds. To address these issues, this paper proposes a pseudo-point-based 3D object detection method that achieves biased fusion of multi-modal data. First, a meta-weight fusion module dynamically generates fusion weights based on global context, adaptively balancing the contributions of point clouds and images. Second, a module combining bidirectional cross-attention and a gating filter mechanism is introduced to eliminate the ROI feature misalignment caused by depth completion noise. Finally, a class-agnostic box fusion strategy is introduced to aggregate highly overlapping detection boxes at the decision level, improving localization accuracy. Experiments on the KITTI dataset show that the proposed method achieves APs of 92.22%, 85.03%, and 82.25% on Easy, Moderate, and Hard difficulty levels, respectively, demonstrating leading performance. Ablation studies further validate the effectiveness and computational efficiency of each module.
1. Introduction
3D object detection [1] is a fundamental capability for autonomous systems, particularly for unmanned ground vehicles (UGVs) and unmanned aerial vehicles (UAVs, or drones). It enables these platforms to accurately perceive and understand the three-dimensional structure of their operating environments. Robust 3D perception is essential for UGVs and UAVs [2,3] to perform core tasks such as obstacle avoidance and trajectory planning, and to operate safely in dynamic urban settings. Within this framework, multi-modal fusion particularly integrating monocular visual data with LiDAR geometric information represents a robust and efficient strategy for reliable perception under stringent real-world constraints. While multi-camera panoramic systems can offer a 360-degree field of view, they tend to be expensive and computationally demanding, and require strict synchronization. In contrast, the fusion of a monocular camera with LiDAR provides a balanced and resource-efficient solution. This multi-modal framework is particularly suitable for UGVs and UAVs operating under payload, power, and cost limitations. It supports a variety of applications such as urban air mobility, infrastructure inspection, and precision agriculture. Moreover, it meets the perception requirements of UGVs navigating complex ground scenarios, as well as drones operating in cluttered aerial environments. As a result, research into monocular camera and LiDAR fusion has garnered increasing interest from both the UGV and drone communities. This fusion strategy offers a scalable and practical pathway toward high-performance 3D perception, enhancing the operational capabilities of autonomous systems across both ground and aerial domains.
In contrast, fusion methods using a front-view monocular camera and LiDAR [4,5,6,7,8] offer a more general and low-cost configuration. This makes them highly valuable for practical applications. Nevertheless, this configuration faces unique challenges. The monocular camera lacks depth information and its images suffer from perspective distortion. LiDAR provides accurate but sparse 3D point clouds. There is a large gap between these two heterogeneous data representations. Therefore, achieving deep complementarity and alignment between them in the front-view direction is a core problem for improving perception system performance.
Current fusion methods are mainly divided into projection-based fusion and model-based fusion. Projection-based fusion relies on camera calibration parameters to project features from one modality into the space of another. Since projection is a type of hard association, when sparse LiDAR points are projected onto dense image pixels, each point can only associate with a limited number of pixels. This makes it difficult to fully utilize the rich contextual semantic information in the image. Taking Frustum-PointNet [9] as an example, it first reduces the 3D search space using 2D detection boxes. However, this restricts fusion to the interior of the 2D box, potentially losing useful contextual information outside the box. Moreover, its performance is highly dependent on the accuracy of the 2D detector. Model-based fusion methods use deep learning models to adaptively learn associations between features of different modalities. They employ specific backbone networks for images and point clouds separately—for example, ResNet for image feature extraction, and PointNet [10] or VoxelNet [11] for point cloud feature extraction. The extracted heterogeneous features are then fused to preserve as much information as possible. This approach is computationally intensive and challenging, as it requires aligning features with different structures. We adopt a pseudo-LiDAR-based fusion framework. It converts images into pseudo point clouds and operates in a unified 3D space. This alleviates the heterogeneity issue and avoids the geometric information loss caused by projection to the 2D view. The fused data can be fed into any high-performance pure point cloud 3D detector, offering good compatibility.
Moreover, existing fusion methods [9,12,13,14,15,16,17,18] often underperform in front-view monocular settings, primarily because they fail to coherently address three key challenges. First, commonly adopted static fusion strategies such as simple addition or concatenation overlook the varying reliability of each modality across different scenarios. For example, EPNet++ [8] employs a complex yet fixed multi-stage fusion process, while BEVFusion [19] lifts image and point cloud features into a unified BEV space and fuses them in a unidirectional, predefined manner. Second, many approaches neglect fine-grained feature fusion at the ROI level. Methods like Voxel-RCNN [20] conduct one-time feature alignment and fusion during early feature extraction, leaving subsequent region-level feature misalignment unresolved. Alternatively, current ROI-aligned fusion techniques such as local mapping and cross-attention struggle to handle the noisy pseudo-LiDAR point clouds in our architecture. Third, at the decision level, prevalent post-processing techniques are inadequate. Non-Maximum Suppression (NMS) suffers from its greedy suppression mechanism, which discards valuable overlapping predictions. While Weighted Box Fusion (WBF) improves upon this by aggregating boxes, its framework is designed for fusing independent models. WBF lacks a guidance mechanism, resulting in a conservative localization estimate through naive averaging.
To address these challenges, this paper proposes an adaptive network specifically designed for front-view monocular camera and LiDAR fusion. The network contains three modules: (1) a Meta-Weight Fusion module (MWF) that adaptively balances modal contributions at the global level; (2) a Cross-modal Attention alignment module (CMA) that tackles feature misalignment at the regional level; (3) a Class-agnostic 3D Box Fusion (C3BF) strategy that refines the final output at the decision level. Specifically, the MWF module uses a lightweight meta-network to analyze the global features of the input in real time. It dynamically generates optimal fusion weights. The CMA module addresses feature misalignment between point cloud and pseudo-point cloud sources at the ROI level, which is caused by model noise. It employs a bidirectional cross-attention mechanism. This allows features from each modality to query relevant information from the other modality. Thus, deep feature interaction and alignment are achieved. A subsequent adaptive gating mechanism further selects and enhances the most discriminative features after alignment. This ensures geometric structures effectively complement detailed information. The C3BF strategy adopts the idea of Weighted Box Fusion. It treats highly overlapping detection boxes as different observations of the same real object. It aggregates the advantages of multi-modal predictions. This makes the final output 3D bounding boxes more stable and precise.
The main contributions of this paper are as follows:
- 1.
- We propose a lightweight Meta-Weight Fusion module to balance the contributions of LiDAR and pseudo-point features, overcoming the rigidity of conventional fixed-weight fusion methods.
- 2.
- A Cross-modal Attentive Alignment module is designed. It employs a bidirectional cross-attention mechanism and an adaptive gating strategy to effectively mitigate feature misalignment caused by depth completion noise.
- 3.
- A Class-agnostic 3D Box Fusion strategy is designed as a robust post-processing step. By aggregating highly overlapping predictions through confidence-based weighting, it yields more accurate and stable 3D bounding boxes.
- 4.
- Extensive experiments on the KITTI dataset demonstrate that our approach achieves state-of-the-art performance across all difficulty levels. Ablation studies confirm that the significant performance gains are achieved with only a moderate increase in parameters.
2. Related Work
To clearly summarize the limitations of the existing LiDAR-based and Multimodal 3D object detection techniques discussed in this section and motivate our proposed work, a detailed comparison is provided in Table 1.
Table 1.
Limitations in Existing 3D Detection Techniques.
2.1. LiDAR-Based 3D Object Detection
LiDAR-based 3D object detection methods can be divided into three main categories based on how point cloud data is represented. These are point-based, voxel-based, and projection-view-based methods. Point-based detection methods process raw point clouds directly. This preserves the geometric structure. PointNet [10] and PointNet++ [21] use shared multi-layer perceptrons and symmetric functions to handle unordered point sets. PointRCNN [22] generates 3D proposals from point clouds in a bottom-up manner and then refines them. 3DSSD [23] introduces a fusion sampling strategy and proposes a single-stage, anchor-free detector to improve speed. Voxel-based methods divide the point cloud into a regular 3D grid. VoxelNet [11] pioneered this approach by introducing Voxel Feature Encoding (VFE) layers for end-to-end detection. SECOND [24] significantly improved the computational efficiency of VoxelNet using sparse convolutions. PointPillars [25] organizes the point cloud into a pseudo-image using the concept of “pillars,” balancing efficiency and information retention. Projection-view methods project the point cloud onto a 2D plane. PIXOR [26] projects the point cloud into a Bird’s Eye View (BEV) for detection. MVF [27] fuses features from the BEV projection and the Range View (RV) of the LiDAR point cloud. Range view methods, like LaserNet [28], perform detection directly on the range view projection of the point cloud.
2.2. Multimodal 3D Object Detection
Multimodal 3D object detection aims to fuse the precise geometry from LiDAR with the rich semantic texture from cameras. Early methods adopted hard fusion. For instance, Shi et al. [2] proposed a LiDAR and camera data fusion framework for UAV platforms, directly connecting the 3D point cloud tensor generated by LiDAR and RGB images to the 6-channel input of the YOLO network, which improves the processing speed. However, the dynamic target processing capability is limited, the flexibility is insufficient, and it struggles with fast-moving targets. Recent research focuses on achieving more efficient and refined cross-modal fusion. Fusion strategies based on the Bird’s Eye View (BEV) have become a mainstream trend. BEVFusion [19] proposed an effective paradigm for separately extracting and fusing camera and LiDAR features within a unified BEV space. Similarly, RCBEVDet [30] designed a RadarBEVNet for radar BEV feature extraction. It also introduced a cross-attention multi-layer fusion module for effective radar-camera fusion. At the fusion architecture level, decision-level fusion methods are noted for their efficiency. CLOCs [31] encodes candidate boxes from 2D and 3D detectors into a sparse tensor. It then learns their geometric and semantic consistency. This approach significantly improves the detection of distant objects. Emerging radar-camera fusion schemes offer potential for low-cost and highly robust perception. HGSFusion [34] enhances radar point cloud density via a radar hybrid generation module. It also uses a dual-synchronization module for feature fusion. This method demonstrates strong performance under poor lighting conditions.
2.3. Depth Completion
Depth completion research focuses on recovering high-quality dense depth maps from sparse depth measurements, such as LiDAR point clouds. Early iterative spatial propagation networks, like CSPN++ [35], propagate depth information within local neighborhoods iteratively using learnable convolutional affinities. Hybrid architectures combine strengths for more accurate completion. For example, CompletionFormer [36] integrates convolutional layers for capturing local details with Transformers for modeling global context. To handle sparse and non-uniform inputs, methods like SparseDC [37] design uncertainty-based feature fusion modules. These modules dynamically adjust the contribution of local features and global information. At the representation learning level, methods like DeCoTR [38] and TPVD [39] explicitly use 3D geometric information to guide the completion process. They introduce techniques such as 2D-3D cross-attention or tri-view decomposition. Image-guided completion methods fuse RGB information to improve edge accuracy and detail integrity. PDC [40] uses superpixels as boundaries to fuse and complete RGB images with sparse depth images. SparseFuse [32] performs depth completion on image pixels, generating pseudo point clouds for training.
3. Method
3.1. Network Architecture
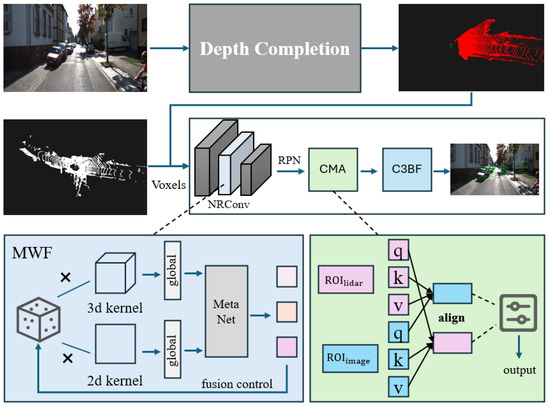
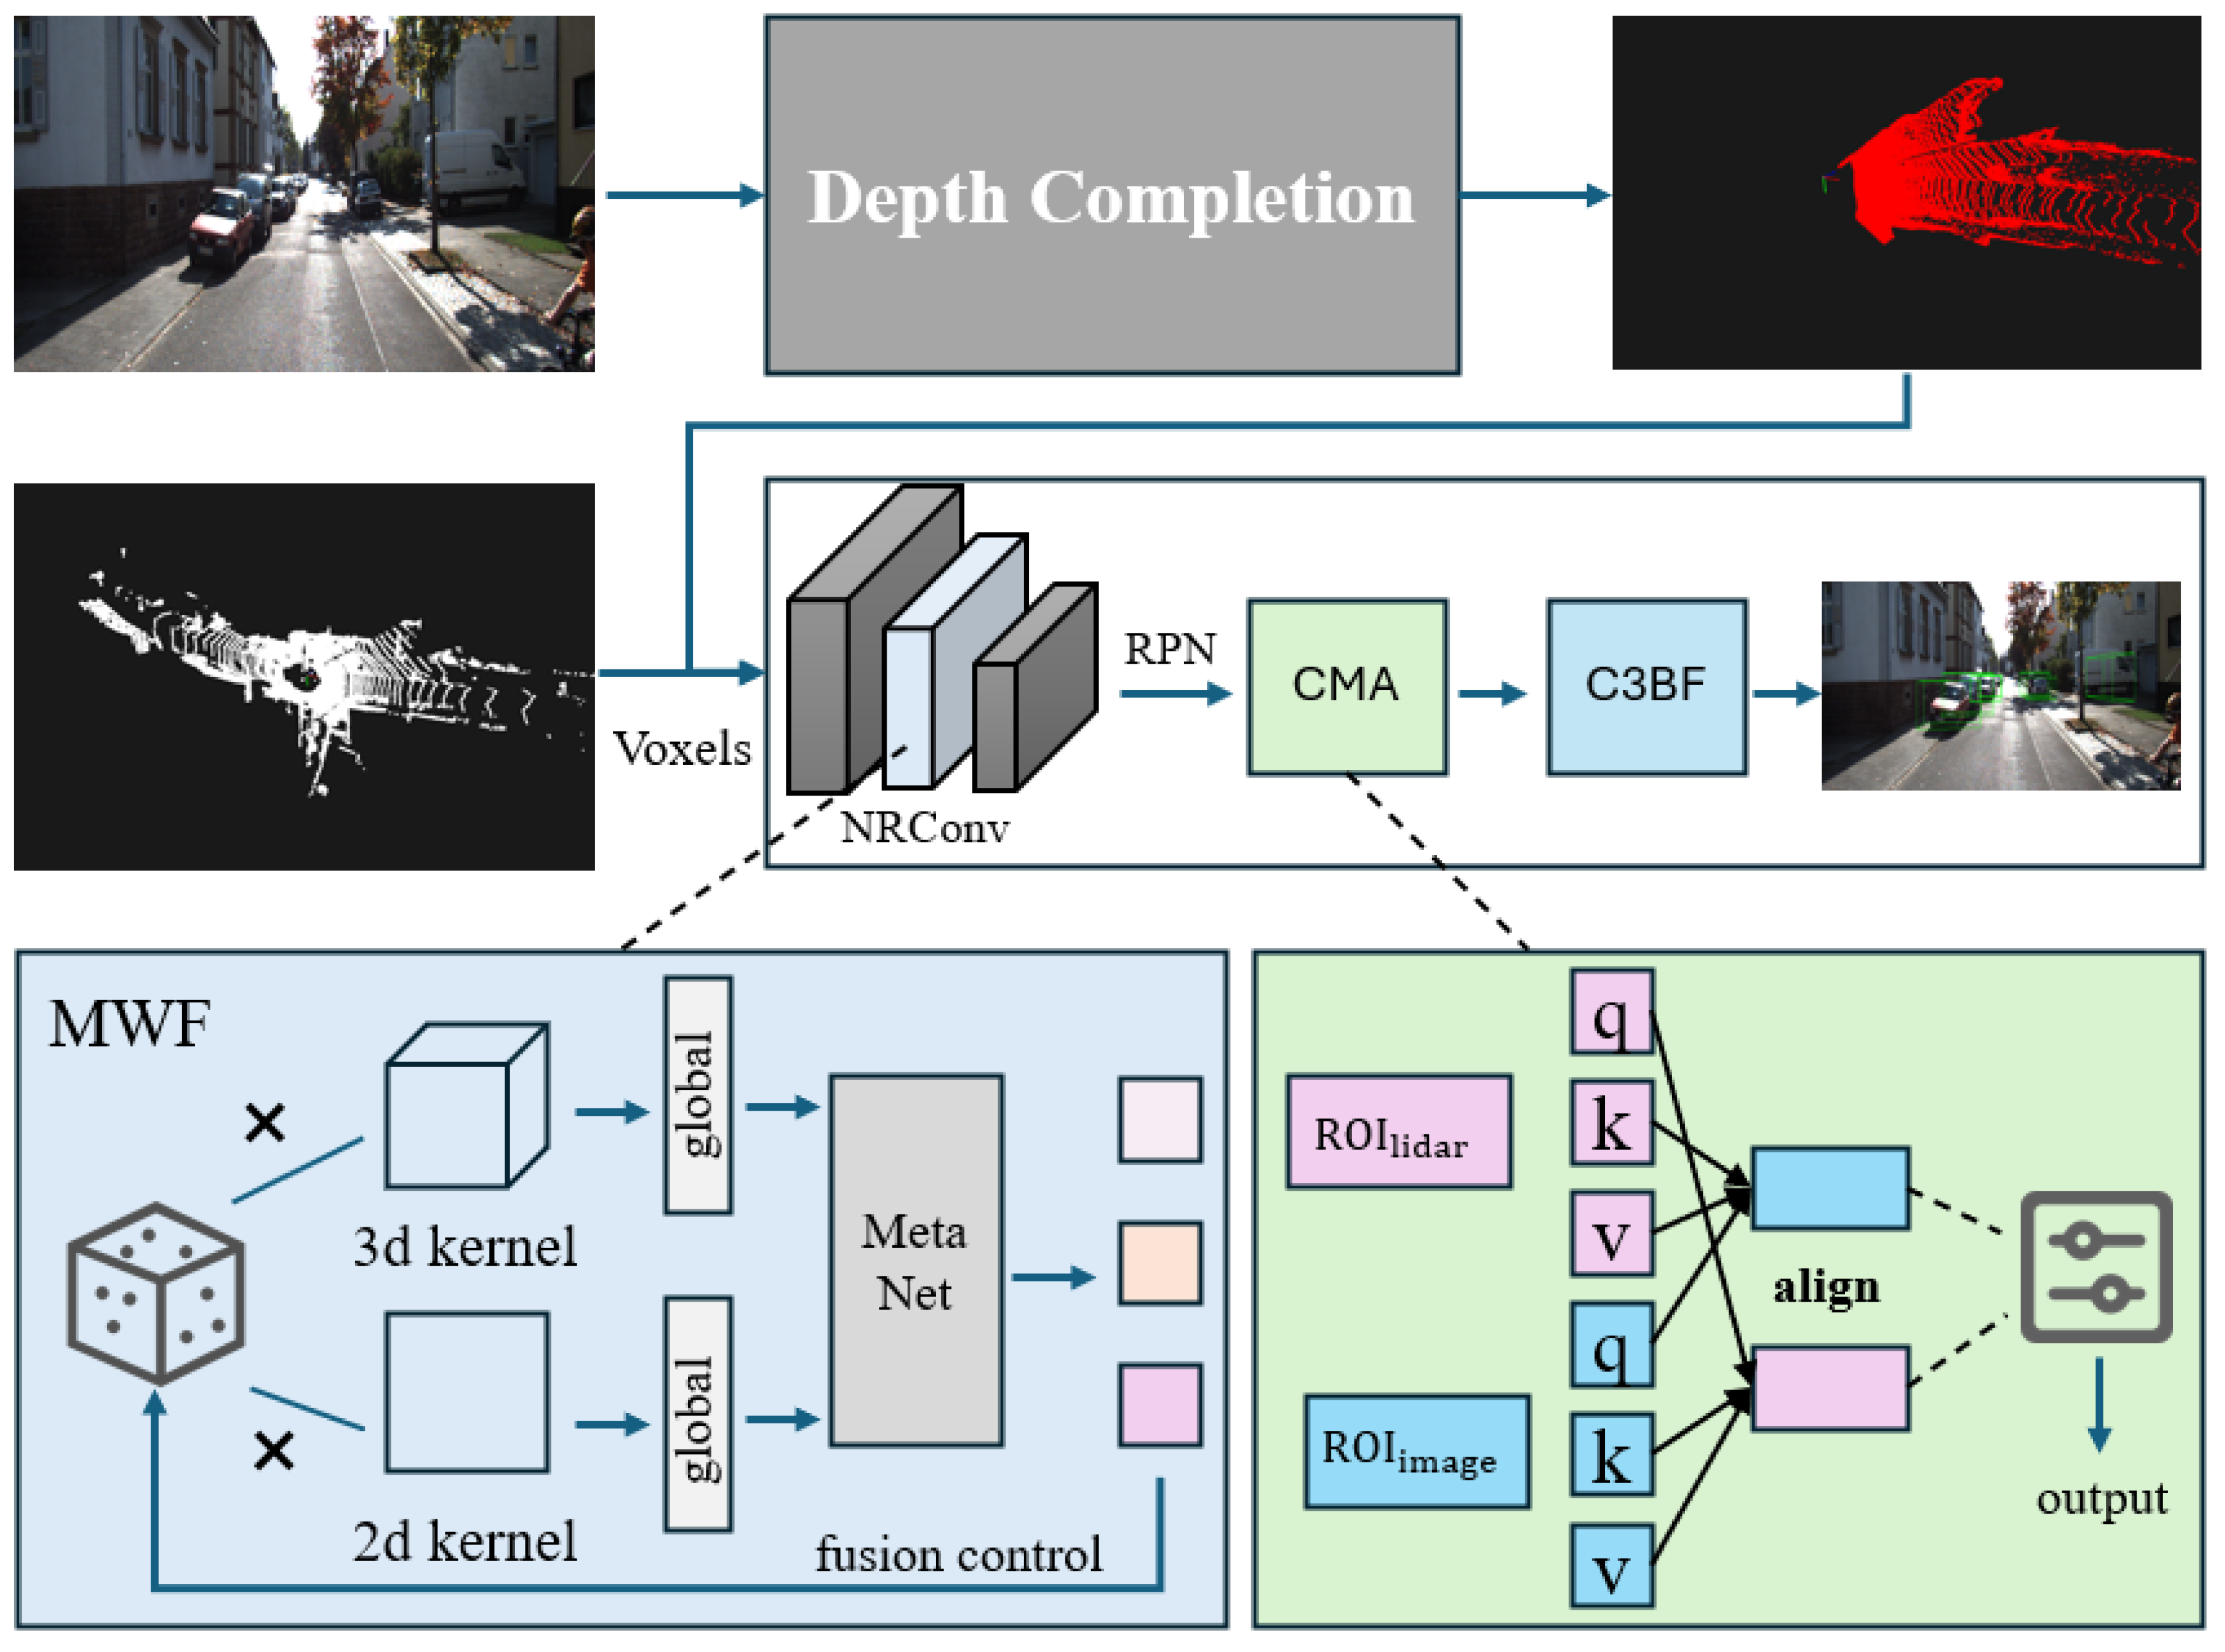
This section introduces our proposed pseudo-point-cloud-based 3D multi-modal object detector. The overall model architecture is shown in Figure 1. The model first converts a 2D image into a point cloud format using a depth completion module. It then inputs both the pseudo-point cloud and the LiDAR point cloud into a 3D detector for multi-modal fusion and prediction. The model incorporates our three novel modules: (a) the Meta-Weighted Fusion (MWF) module, which regulates the contributions of the point cloud and pseudo-point cloud within the feature extraction backbone; (b) the Cross-Modal Attentive Alignment (CMA) module, which aligns the two modalities at the ROI level to reduce noise; and (c) the Class-Agnostic 3D Box Fusion (C3BF) module, which refines the geometric parameters of highly overlapping boxes at the prediction layer via confidence weighting.
Figure 1.
Overall Network Architecture. We design three components for feature fusion, feature alignment, and prediction refinement. A Meta-Weighted Fusion (MWF) module dynamically fuses point cloud and pseudo-point cloud features. A Cross-Modal Attentive Alignment (CMA) module aligns features within Regions of Interest. A Class-Agnostic 3D Box Fusion (C3BF) module refines the predicted 3D bounding boxes.
A popular approach for image-point cloud fusion involves extracting and aligning features from each modality separately. However, aligning these heterogeneous data types is challenging and training is costly. To address this, our method uses a depth estimation model to convert the image into a pseudo-point cloud. This eliminates the heterogeneity gap and improves model efficiency. The depth completion network employs a two-branch architecture, using color and sparse depth as guiding information for dense depth prediction.
Here, and denote confidence maps. and represent the predictions from the color-dominant branch and the depth-dominant branch, respectively. The color-dominant branch aims to predict a dense depth map from a color image. The depth-dominant branch focuses on upsampling a sparse depth map.
Subsequently, the depth map is converted into a point cloud. Given a pixel coordinate in the depth map and its corresponding depth value d, the 3D coordinates of the point in the camera coordinate system can be calculated using the following formulas:
3.2. Meta-Weighted Fusion Module (MWF)
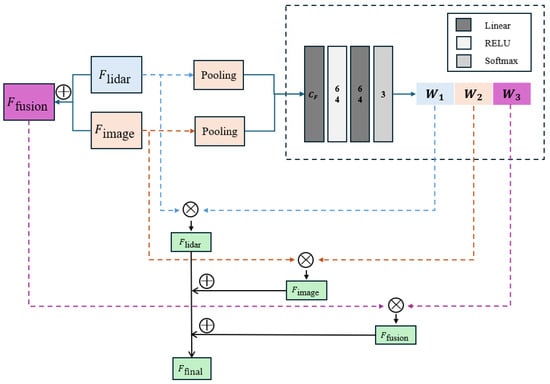
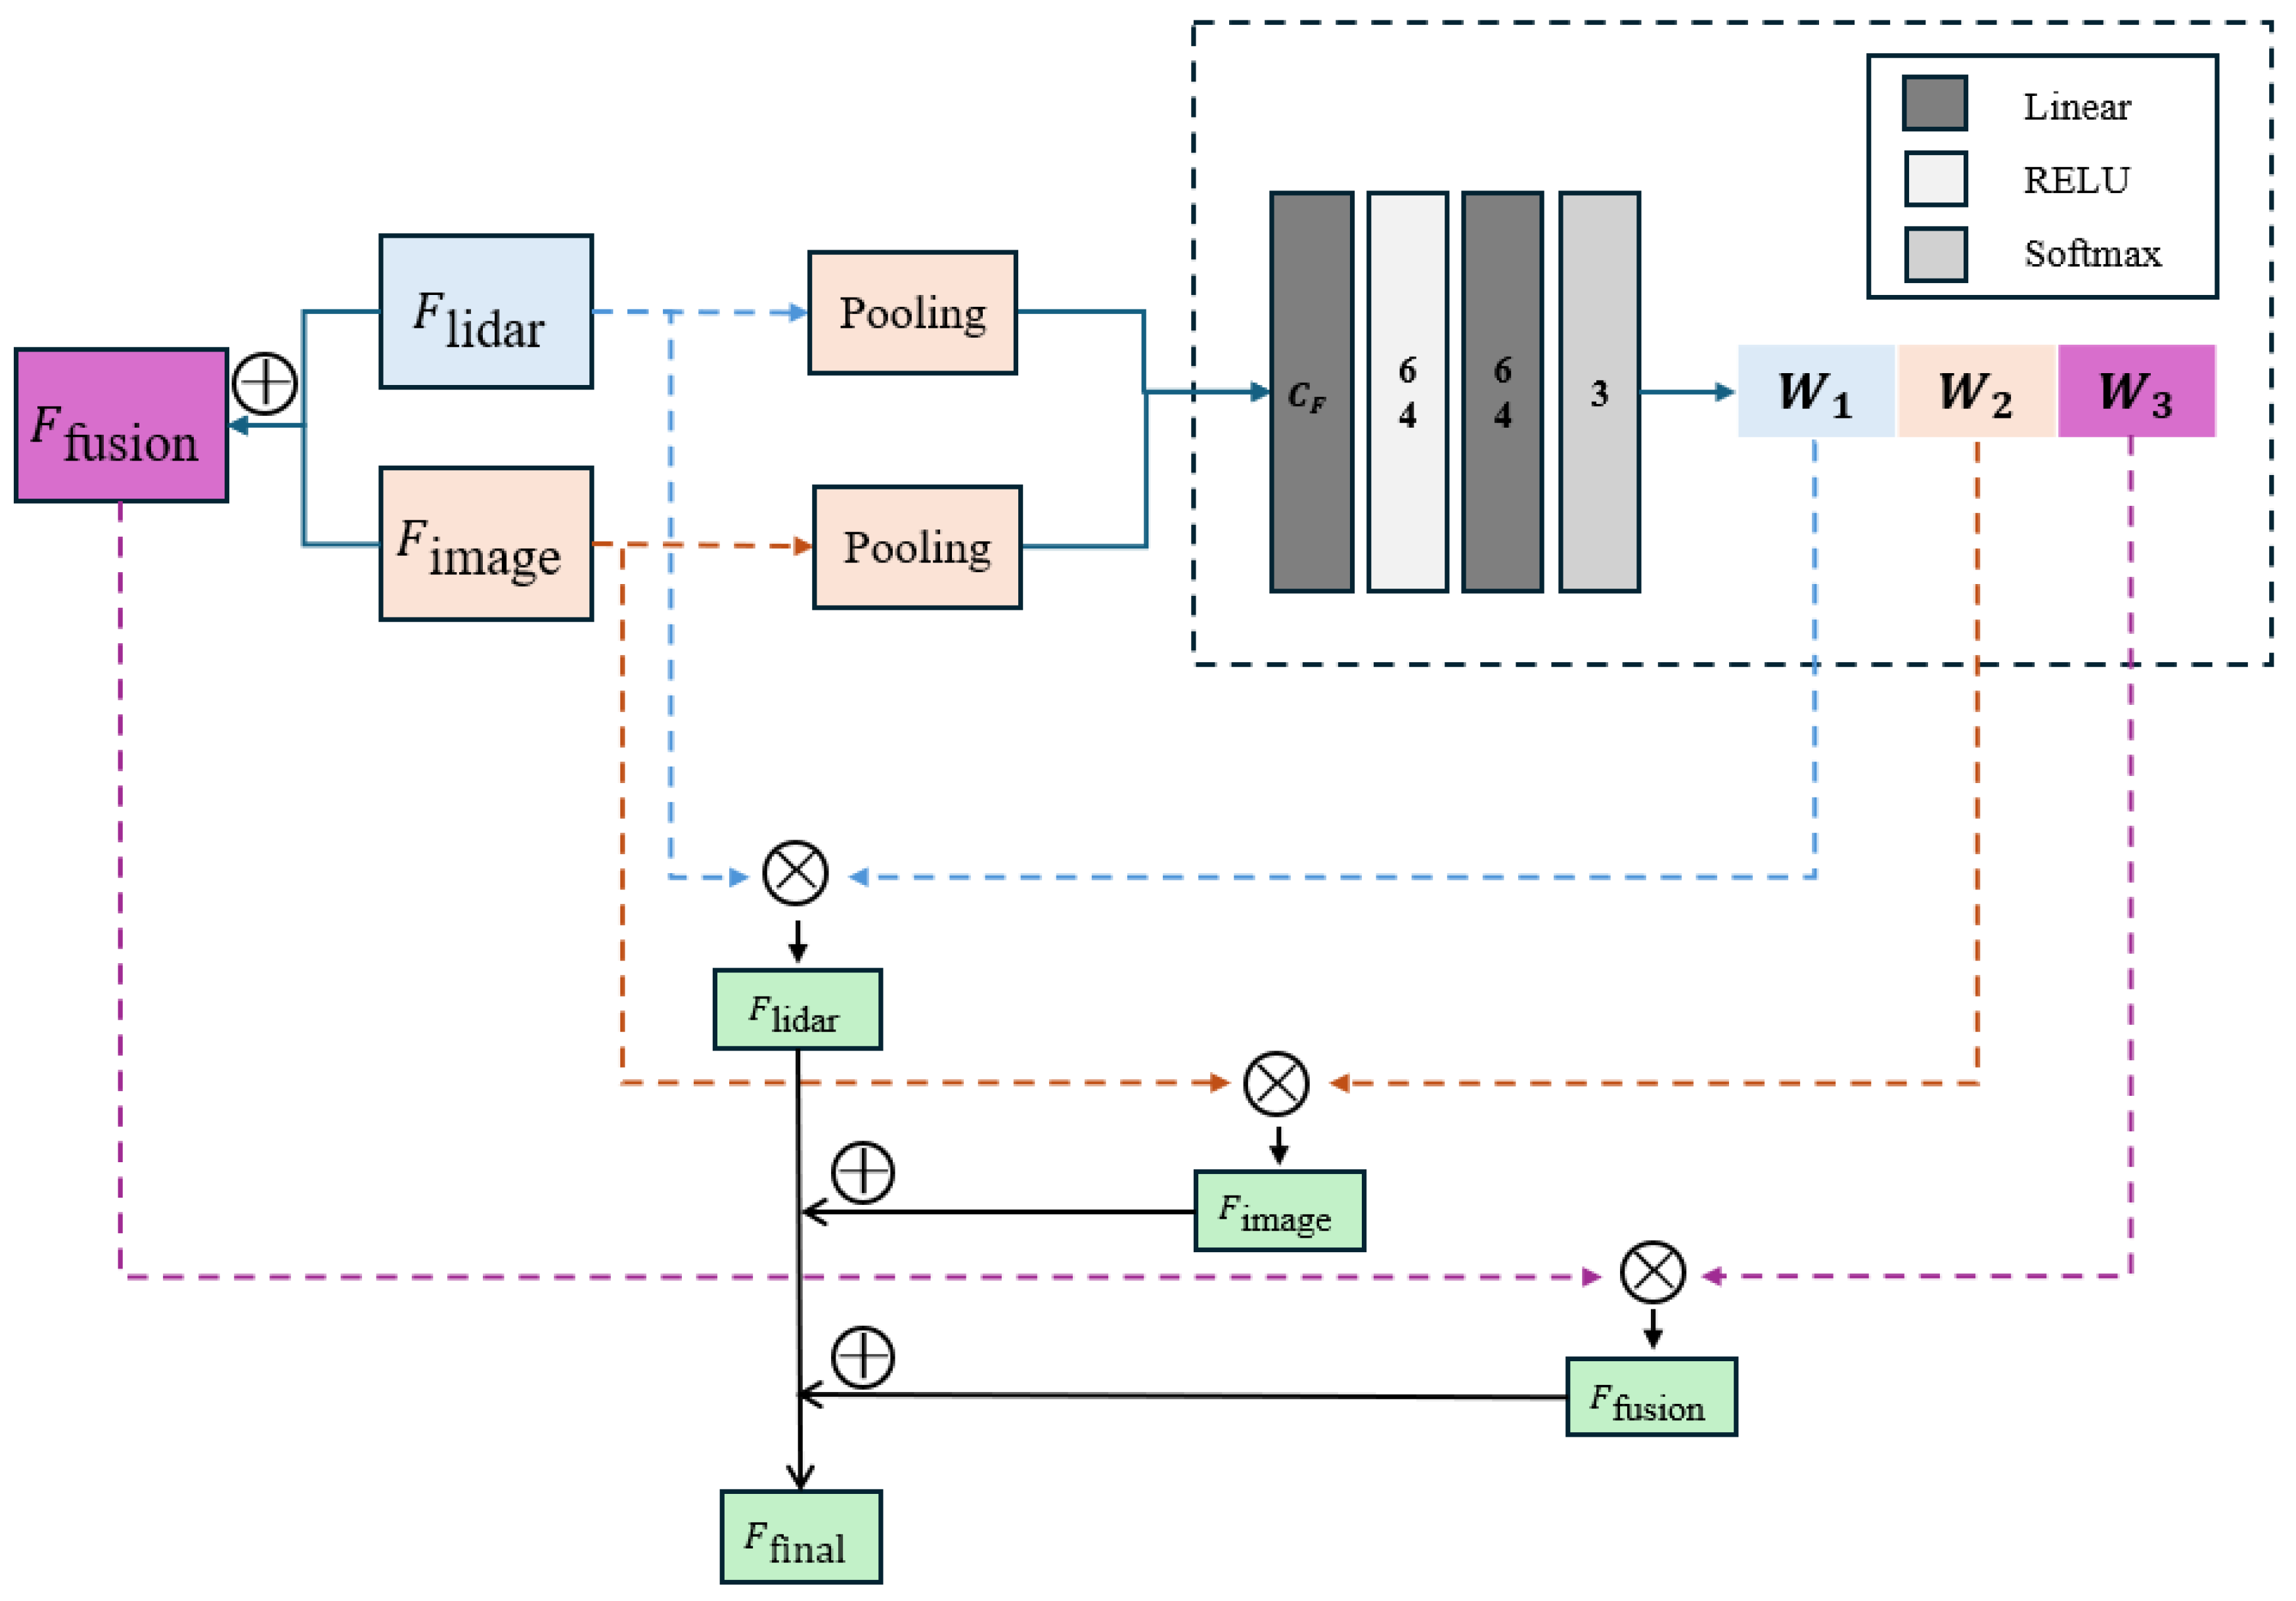
Conventional fusion methods combine features by simple summation or concatenation. Unlike static strategies that overlook scene-dependent modality advantages, our approach dynamically prioritizes features based on their contextual reliability. Specifically, the system amplifies semantic-rich image features or reinforces precise geometric LiDAR data depending on the environmental complexity. To address the limitations of fixed fusion strategies, this section introduces a context-aware Meta-weighted fusion module, as shown in Figure 2. Specifically, the module uses a lightweight meta-network. It generates optimal feature fusion weights based on the global context of the input scene. This enables autonomous allocation of modal contributions. The fusion pathways are deliberately restricted to a convex combination of three basic operations: LiDAR-dominant, Image-dominant and Balanced Average. This design leverages the Mixture-of-Experts (MoE) paradigm. It defines three expert sub-pathways, representing the core decision strategies for multi-modal fusion. This structure ensures dynamic adaptive fusion is achieved while fundamentally minimizing computational overhead and the total parameter count. Specifically, the meta-network learns a minimal set of weights for these three strategies. This process efficiently approximates the continuous, scene-dependent fusion function, successfully addressing the limitations of conventional fixed-weight methods.
Figure 2.
Meta-weighted fusion module.
Global context descriptor extraction. Given the 3D feature tensor from the LiDAR branch and the 2D feature tensor from the virtual point branch, we first apply global average pooling. This operation extracts a global scene representation that is independent of spatial locations.
Then, they are concatenated to form a joint scene context vector , which serves as the input to the meta-network.
Meta-network for dynamic weight generation. This module employs a meta network with minimal parameters. Its function is defined as:
Here, and are learnable parameters. The network maps the high-dimensional context information to a low-dimensional, normalized weight space . These weights represent the confidence scores for three basic fusion strategies.
Weight-adaptive feature fusion. The final feature fusion is a convex combination of the three basic operations. It is formulated as:
Here, ⊕ denotes element-wise addition. This module can automatically adjust the degree of reliance on each modality based on scene complexity. Factors include the sparsity of the LiDAR point cloud and the information richness of the image texture. Thus, it learns a continuous function approximation, rather than making a simple binary choice.
3.3. Cross-Modal Attentive Alignment (CMA)
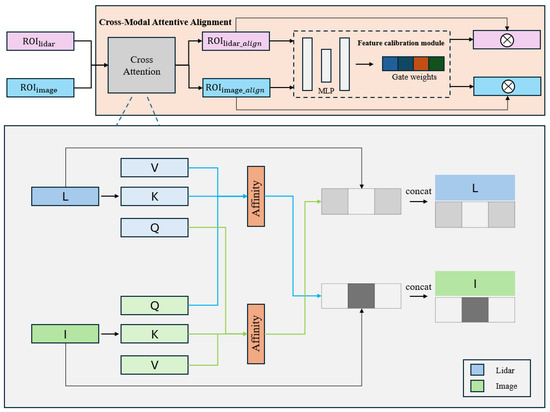
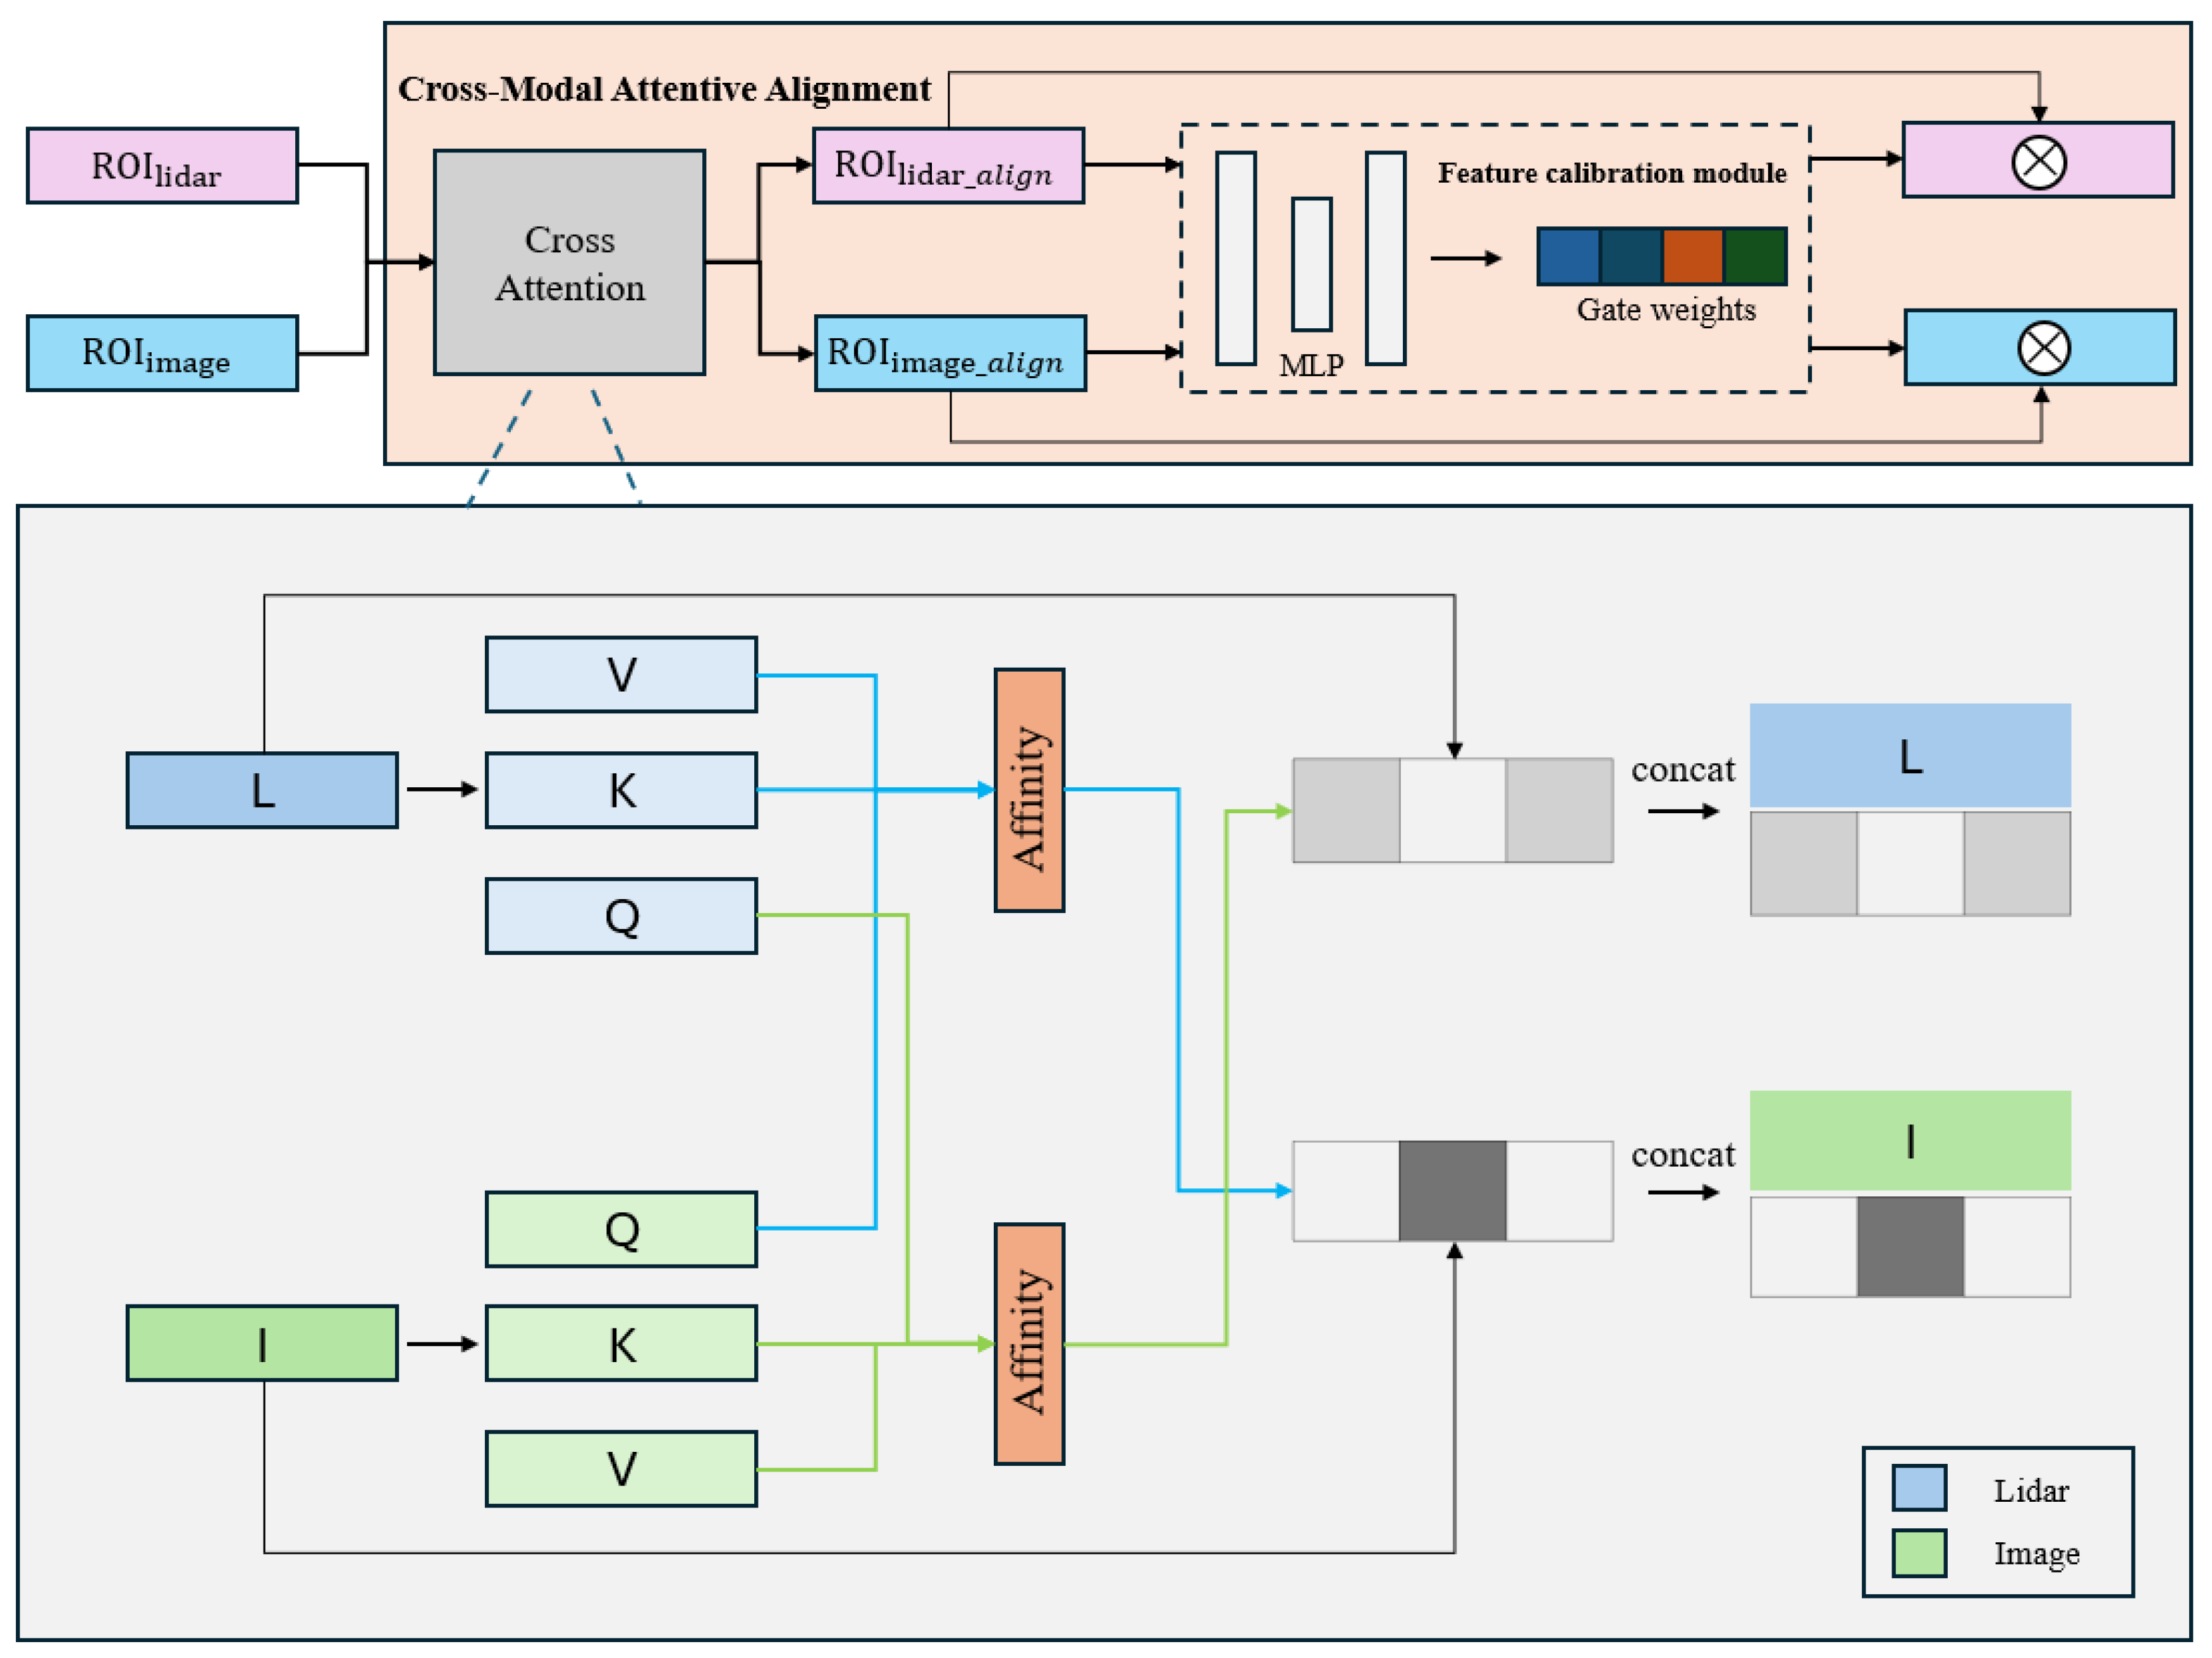
In 3D multi-modal object detection frameworks based on Region Proposal Networks (RPN), feature alignment at the Region of Interest (ROI) level critically affects detection performance. This is due to the misalignment between pseudo-point clouds and real point clouds. Pseudo-point clouds, derived from images, are dense and texture-rich but geometrically less accurate. In contrast, raw point clouds are geometrically precise but sparse. Their distributions and feature statistics within an ROI differ significantly. Simply concatenating or summing these features at the ROI level causes a modality misalignment problem. This limits the effective use of multi-modal information. To address this, we propose a Cross-Modal Attention Alignment module (CMA). It achieves cross-modal feature alignment and enhancement at the ROI level through bidirectional cross-attention and adaptive gated fusion. As shown in Figure 3, the CMA module consists of two key components. The cross-attention module establishes deep interaction between modalities. The adaptive gating fusion module performs adaptive fusion via feature concatenation and a feature selection gate. The final output is a multi-modal, aligned feature.
Figure 3.
Cross-Modal Attentive Alignment.
The ROI features from the two modalities are denoted as and . Here, N is the number of voxels, B is the batch size, and C is the feature channel dimension.
Cross-attention alignment. For the LiDAR-to-image attention path, serves as the Query, while acts as the Key and Value. The cross-attention is computed as shown in the formula. Symmetrically, for the image-to-LiDAR path, is the Query, and are the Key and Value. This generates . The output is computed as . This bidirectional design ensures symmetric information flow. It allows each modality to gather complementary context from the other. This effectively mitigates the initial feature misalignment at the ROI level.
Gated fusion. For each modality, the original ROI feature is concatenated with its cross-attention-enhanced counterpart. This yields the enriched representations: and . The feature selection gate in this module considers inter-channel relationships. More importantly, it focuses on effectively fusing the cross-modal and original modal features. The feature selection weights are computed using a two-layer MLP and a Sigmoid activation function:
Here, and are computed similarly. The selection weights are then applied to the concatenated features:
Here, ⊙ denotes channel-wise multiplication. The gated fusion emphasizes identifying and retaining the most critical feature elements for the detection task within the cross-modal context. This achieves selective information enhancement.
Multi-modal feature integration. Finally, the enhanced features from both modalities are concatenated. This forms the final aligned feature representation . It provides a more discriminative feature representation for subsequent classification and bounding box regression.
3.4. Class-Agnostic 3D Boxes Fusion
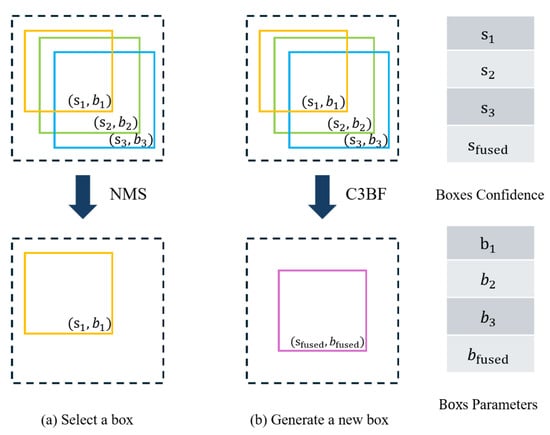
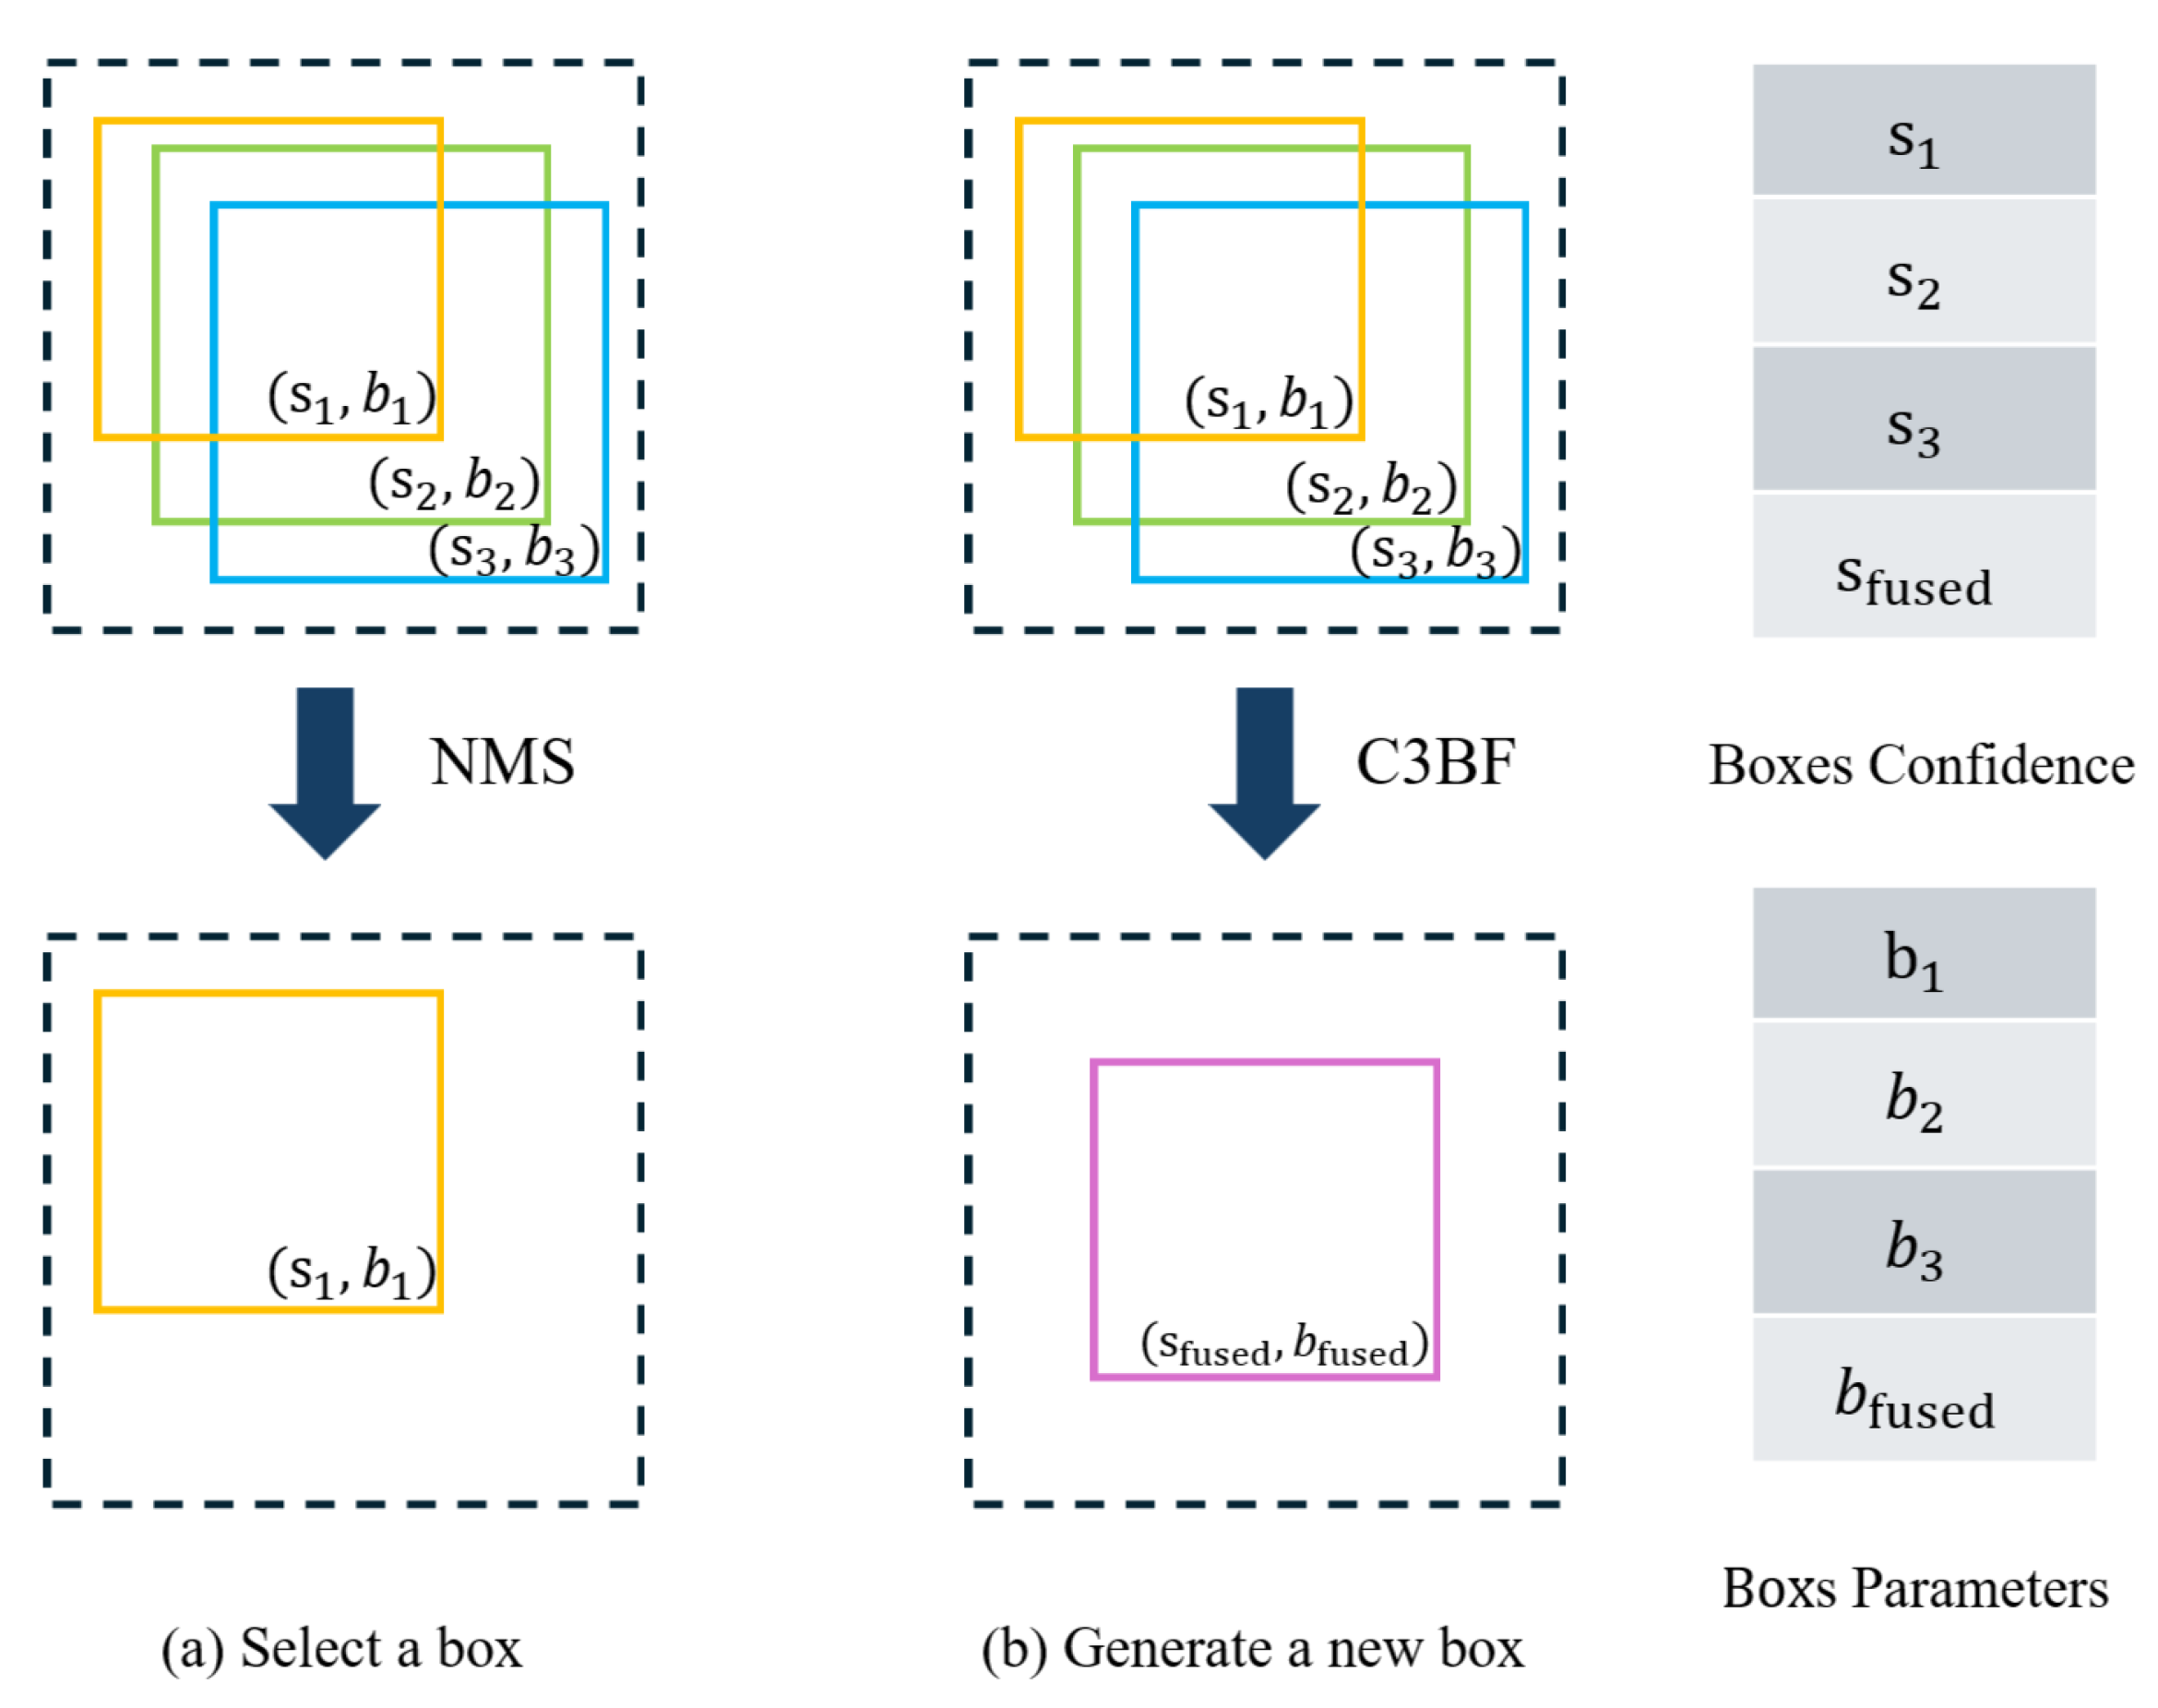
This paper employs a weighted bounding box fusion algorithm to replace the traditional Non-Maximum Suppression (NMS) method. This optimizes the initial detection results, as shown in Figure 4. NMS suppresses highly overlapping neighboring boxes by setting an IoU threshold. In dense object scenes, it can cause false suppression due to small box offsets. Furthermore, keeping only a single box discards valuable localization information. The Class-Agnostic 3D Box Fusion algorithm aims to utilize information from duplicate boxes generated by multiple modalities. It seeks to improve localization accuracy while maintaining a high recall rate.
Figure 4.
Comparison of the processing pipelines of C3BF and NMS. (a) The NMS method: it only keeps the detection box with the highest confidence (yellow) and suppresses (discards) the other overlapping boxes (green and blue). (b) The proposed C3BF method: it first clusters spatially overlapping boxes into a group. Then, it performs weighted fusion of these boxes based on their confidence scores. Finally, more accurate fused bounding boxes (purple) are generated.
Given an initial set of detection boxes and their corresponding confidence scores , where each box is parameterized as , representing its center coordinates, dimensions, and orientation angle. First, the detection boxes are sorted in descending order of confidence:
For each box , compute its 3D IoU with existing cluster centers :
If , assign it to the cluster with the maximum IoU. Otherwise, create a new cluster. Here, is a preset threshold.
For each cluster and its scores , the fused boxes’ parameters are calculated as:
The fused score is computed as the average confidence within the cluster.
4. Experimental Procedures
4.1. Experimental Details
To validate the method’s applicability in autonomous unmanned scenarios, we employ the KITTI dataset [41], which provides realistic urban driving environments analogous to low-altitude drone navigation challenges. Our method is implemented with PyTorch 1.8.1. The model is trained on two 3090 GPUs using the Adam optimizer for 50 epochs. The initial learning rate is 0.01, and we use a one-cycle learning rate scheduler. The model uses virtual point clouds generated by PENet [42]. The model architecture is based on Voxel-RCNN. It contains four VirConv layers with feature dimensions of 16, 32, 64, and 64. The training loss function follows [20]. We use both local and global data augmentation strategies. These include GT-sampling, local transformations (rotation, translation), and global transformations (rotation, flipping). Detection performance is measured by the KITTI 3D Average Precision (AP) metric on the Car class. Objects are categorized into three difficulty levels: Easy, Moderate, and Hard. This is based on their occlusion and truncation levels. Evaluation is performed over 40 recall thresholds. The IoU threshold for the Car class is set to 0.7.
4.2. Multi-Modal 3D Detection on the KITTI Dataset
This experiment evaluates the performance of our proposed method for 3D object detection. We use the detection accuracy (reported as a percentage) under three difficulty levels: Easy, Moderate, and Hard. Competing methods are divided into two categories based on their sensor data usage: LiDAR-only and LiDAR + RGB fusion. As shown in Table 2, we compare our method against various state-of-the-art algorithms. Results show that our method achieves the best overall performance across all three difficulty levels. It achieves scores of 92.22% (Easy), 85.03% (Moderate), and 82.25% (Hard). Furthermore, the overall trend indicates that methods fusing LiDAR with RGB information (LiDAR + RGB) generally outperform LiDAR-only approaches. This highlights the effectiveness of multi-modal fusion for improving detection accuracy.
Table 2.
Object detection results on the KITTI dataset.
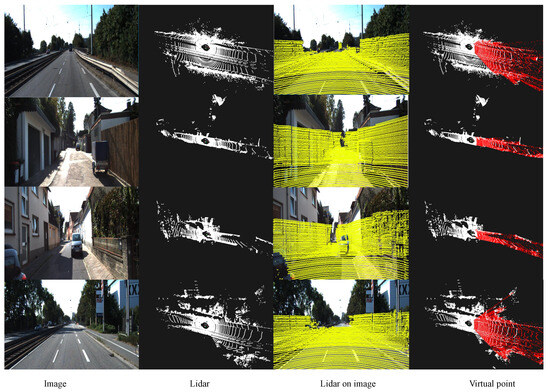
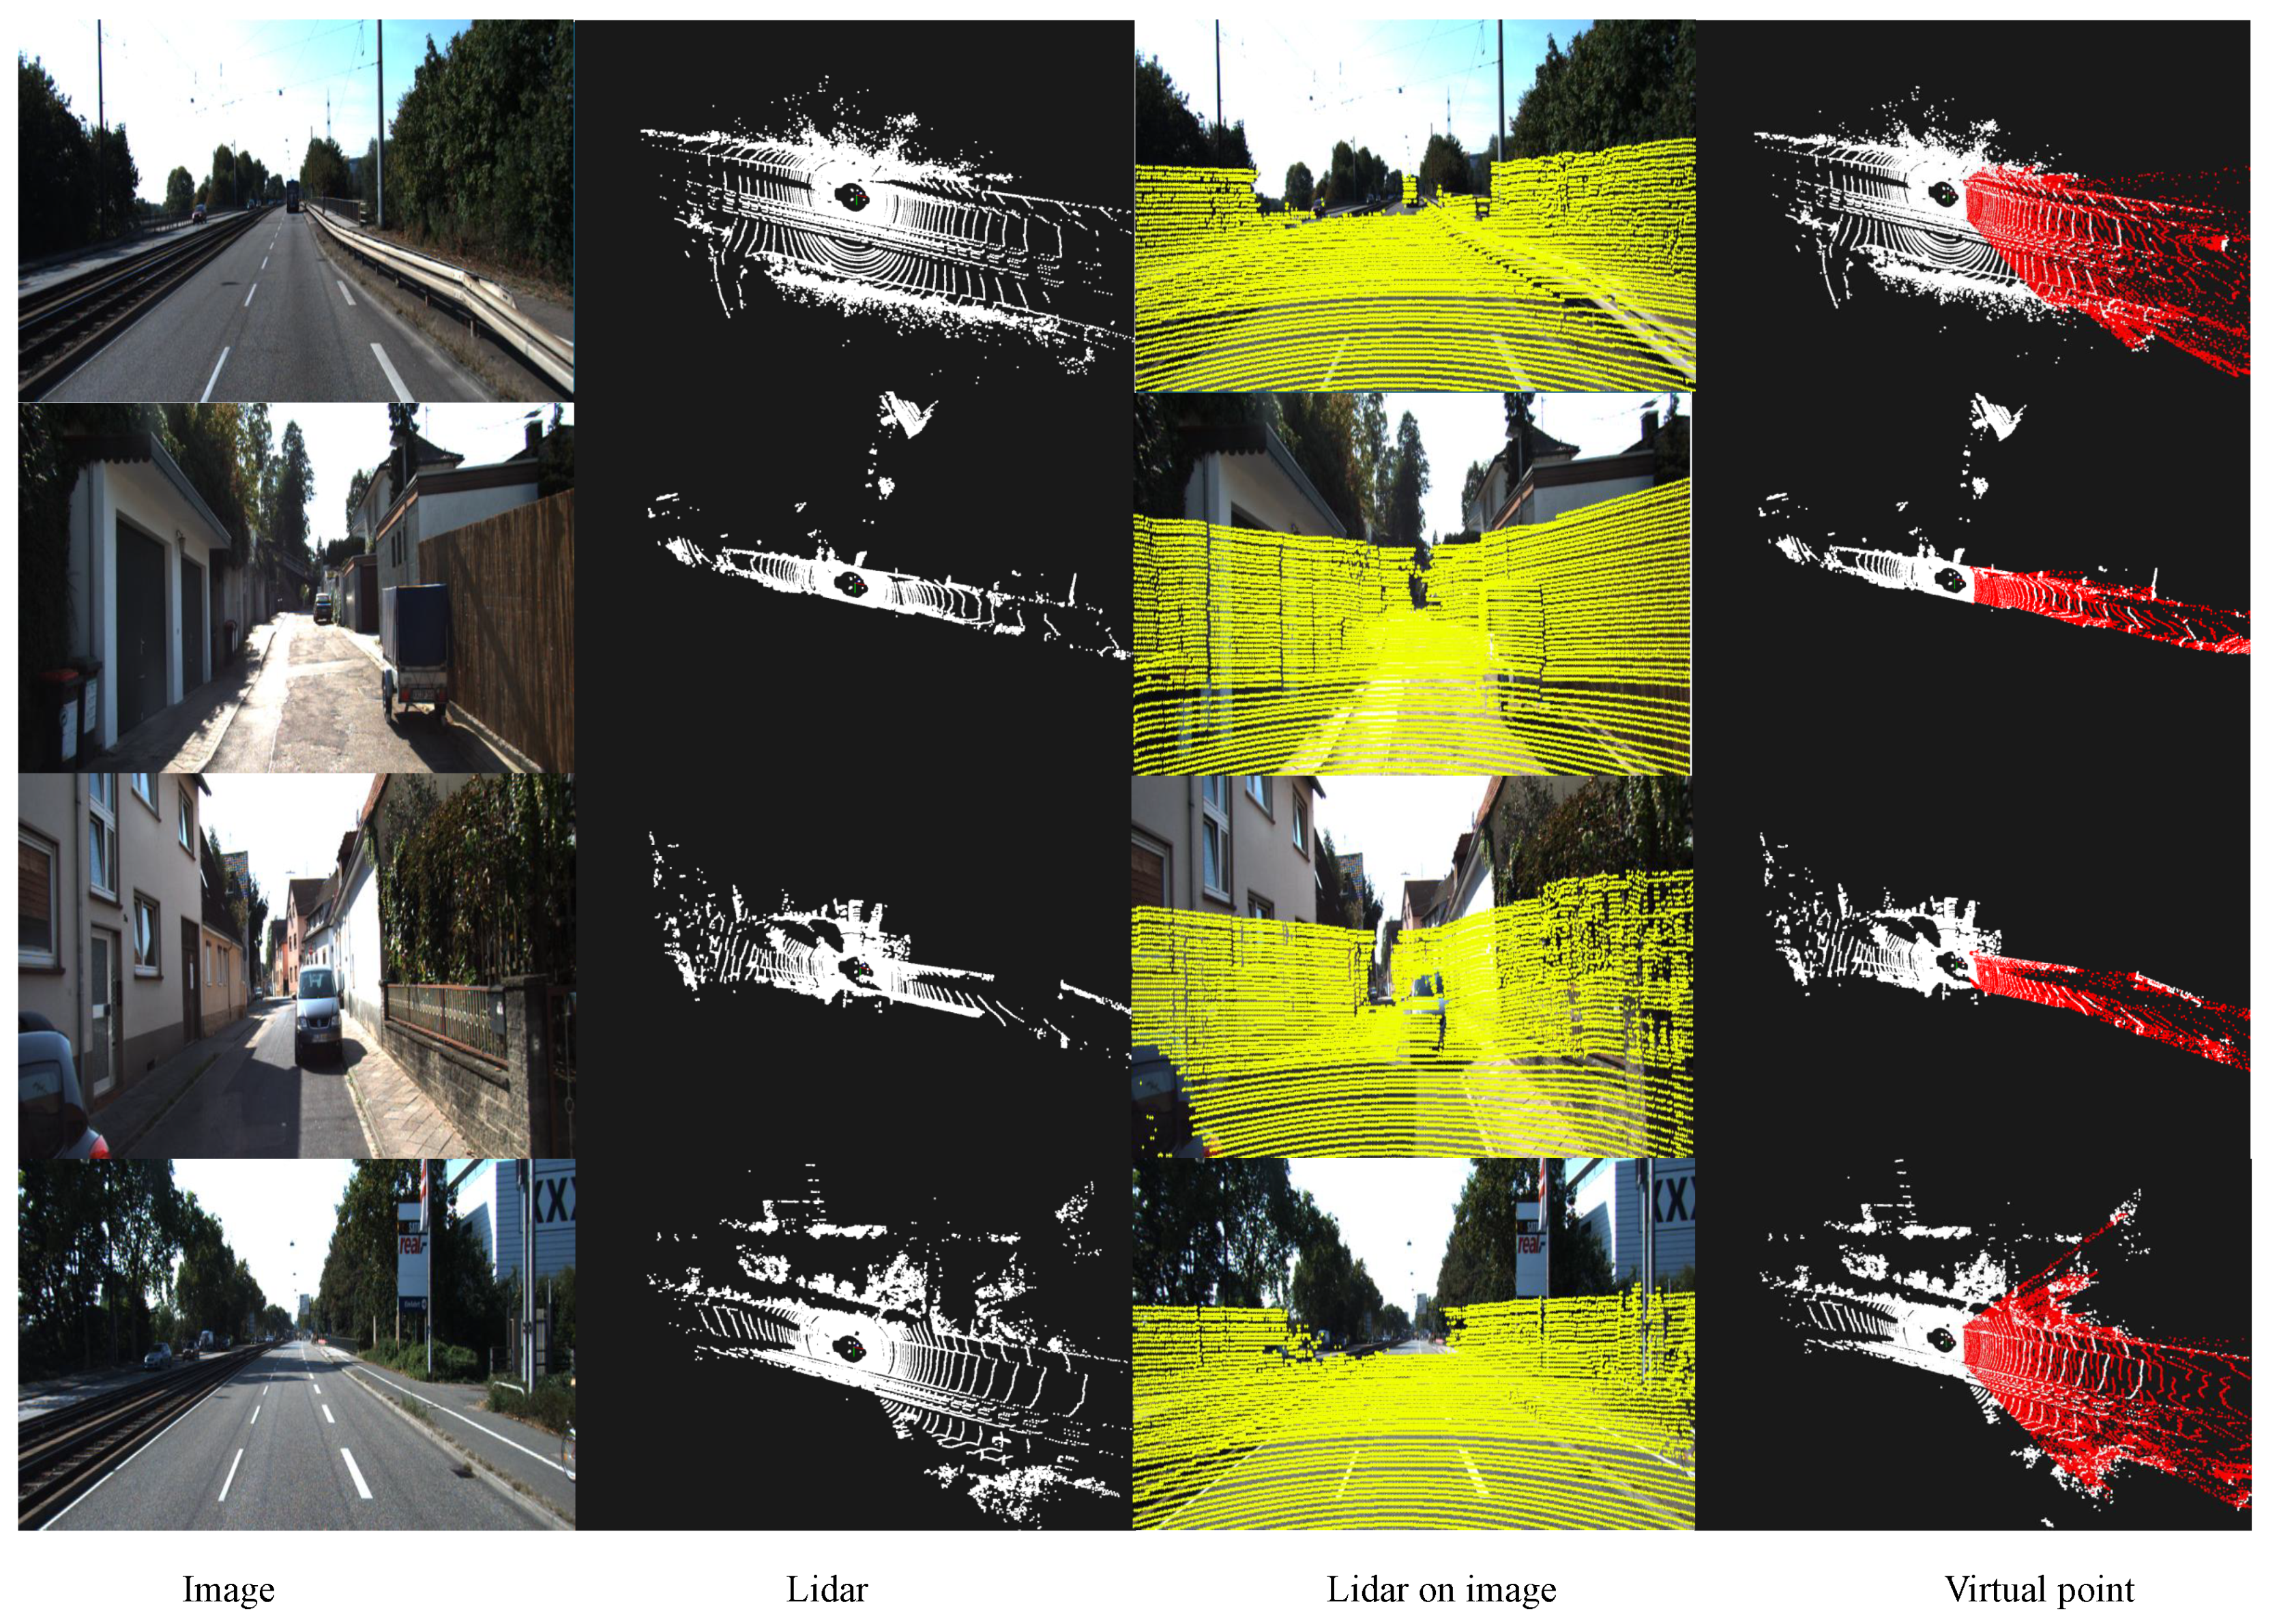
Visualization: Figure 5 illustrates the multi-modal data fusion pipeline of our method. The first column shows the original color images from the RGB camera sensor. The second column displays the 3D point cloud data from the LiDAR scan. The third column presents the result of projecting the LiDAR points onto the image plane. This step achieves pixel-level alignment of geometric and texture information, forming the basis for effective feature fusion. The last column shows the “virtual points” (in red) generated by the depth completion algorithm. These virtual points effectively compensate for the sparsity of the original LiDAR point cloud and enrich the scene’s geometric details.
Figure 5.
Input modality visualization on the KITTI dataset.
4.3. Multi-Modal 3D Detection on the KITTI Dataset Under Noisy and Occluded Conditions
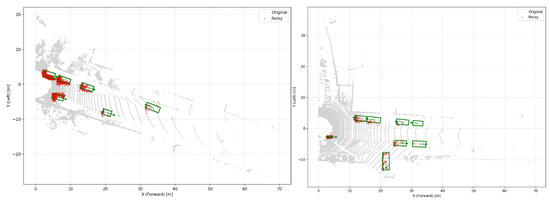
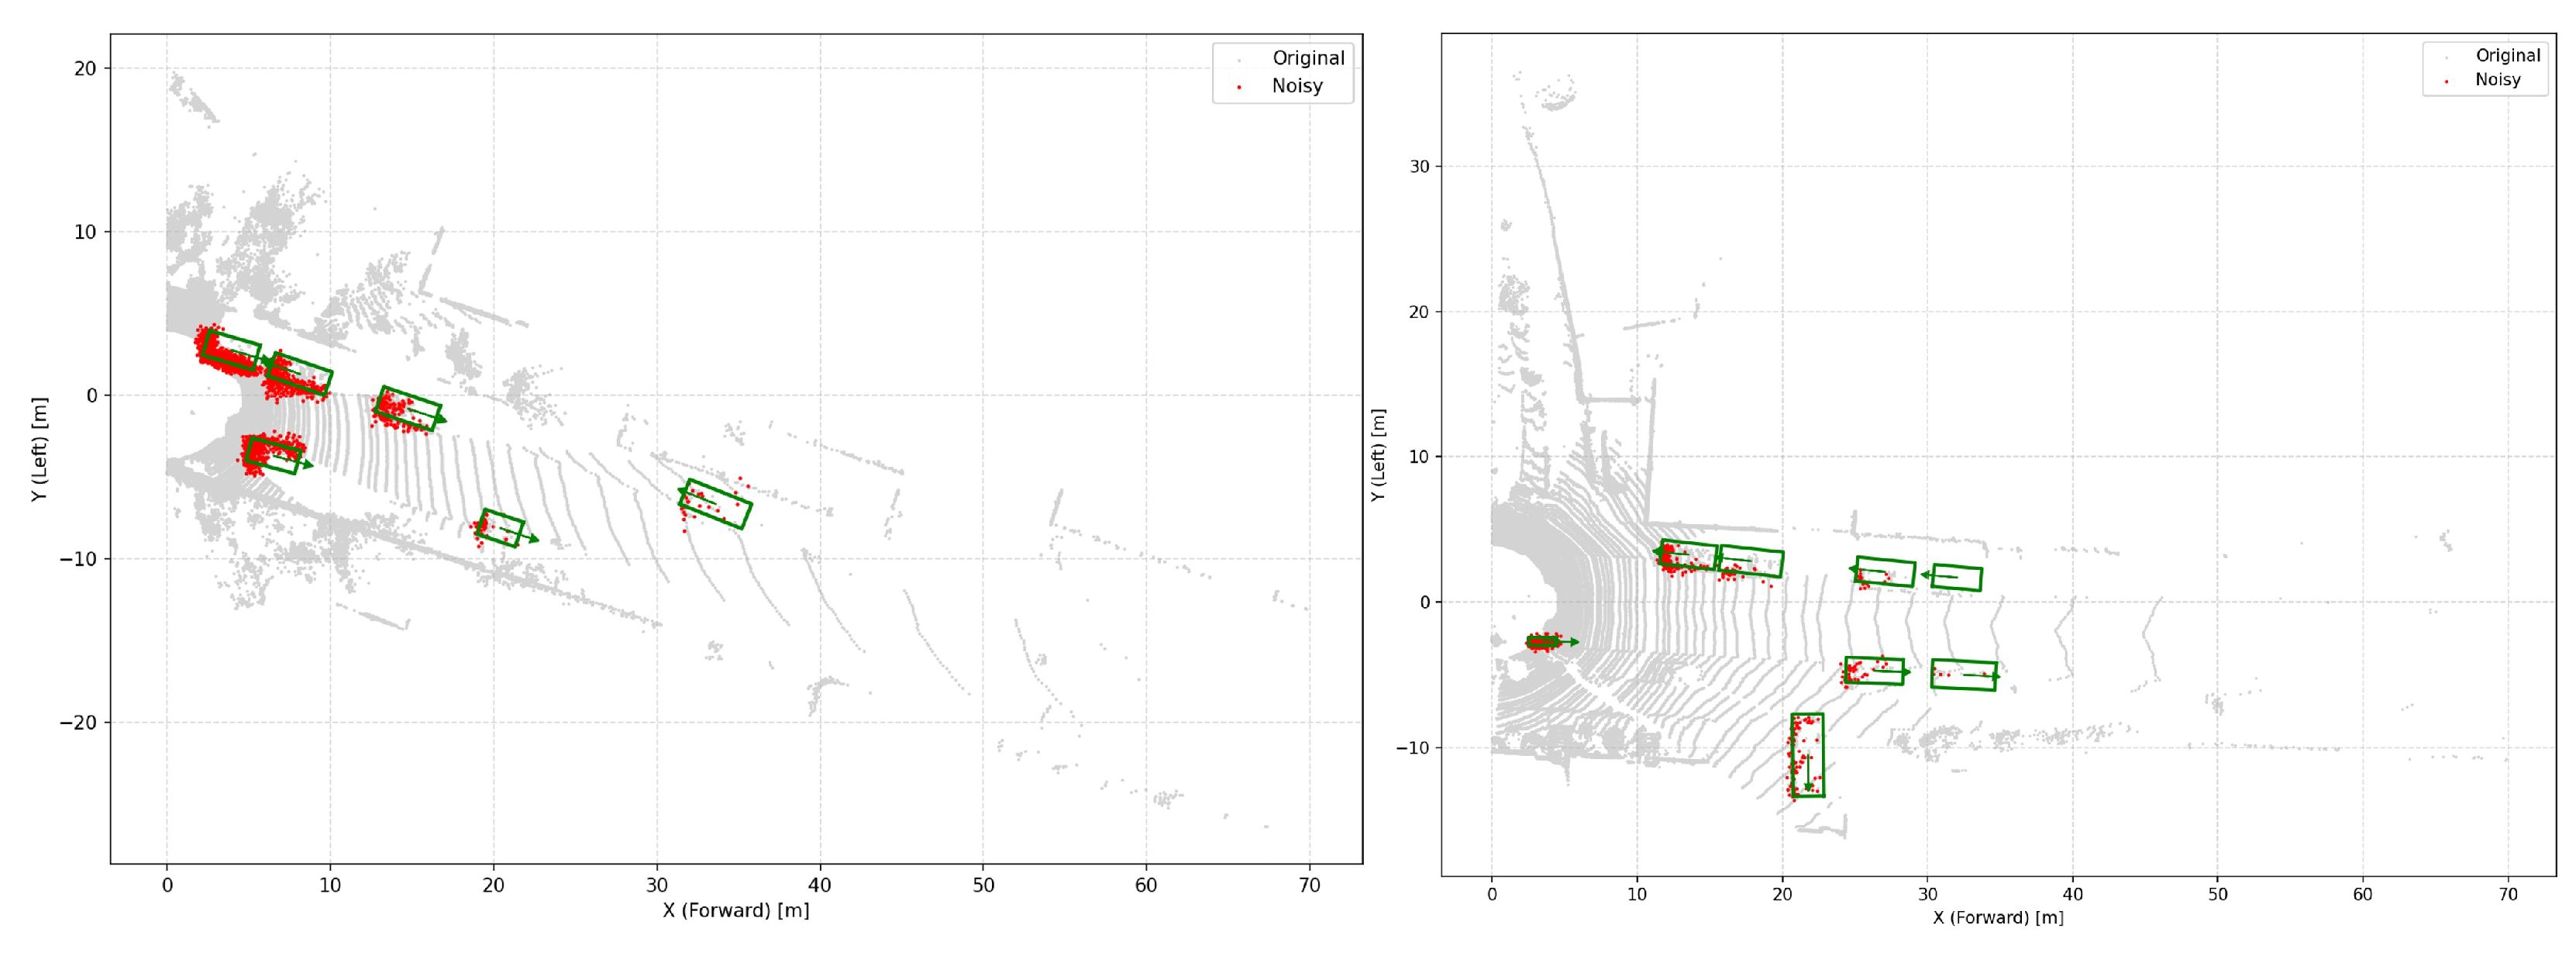
To validate the model’s performance under noisy and occluded conditions, we constructed a synthetic noisy dataset. This noisy dataset was generated from the KITTI dataset. We converted ground truth labels to the LiDAR coordinate system and identified the points within the objects. To simulate occlusion in harsh environments, 30% of the foreground points (points within the objects) were perturbed by Gaussian noise with a standard deviation of . Figure 6 visualizes the noisy point cloud distribution in the Bird’s Eye View (BEV). The added noise within the objects manifests as localized disorder and blurring of the geometric boundaries.
Figure 6.
BEV visualization on the KITTI dataset under noisy and occluded conditions. The green boxes are ground truth bounding boxes, and the arrows indicate the object orientations.
Table 3 explicitly demonstrates the detection performance of different modalities under these simulated noisy and occluded scenes. Multimodal fusion significantly outperforms single-modality methods across all difficulty levels. This confirms the robustness of the pseudo-point-based multimodal detection architecture. Our proposed method surpasses the baseline multimodal method at all difficulty levels. Specifically, our method achieves AP on the challenging Hard difficulty. This is a improvement compared to the baseline multimodal method. This demonstrates that the MWF and CMA modules effectively filter noise. They address feature misalignment caused by noise and depth estimation errors. Furthermore, performance shows a slight drop when noise is introduced compared to performance under ideal conditions (normal). We observe the smallest performance drop of 0.33% on the Hard samples. Conversely, the drop is slightly larger for Easy samples, at 0.64%. Easy samples typically feature dense original point clouds. Adding Gaussian noise causes a non-negligible perturbation to this inherently precise geometric structure. Since Easy samples rely more on precise geometric information in the absence of noise, their performance shows a relatively larger decline when noise is introduced.
Table 3.
Object detection results on the KITTI dataset under noisy and occluded conditions.
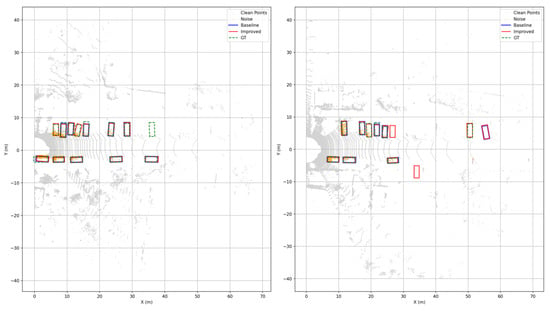
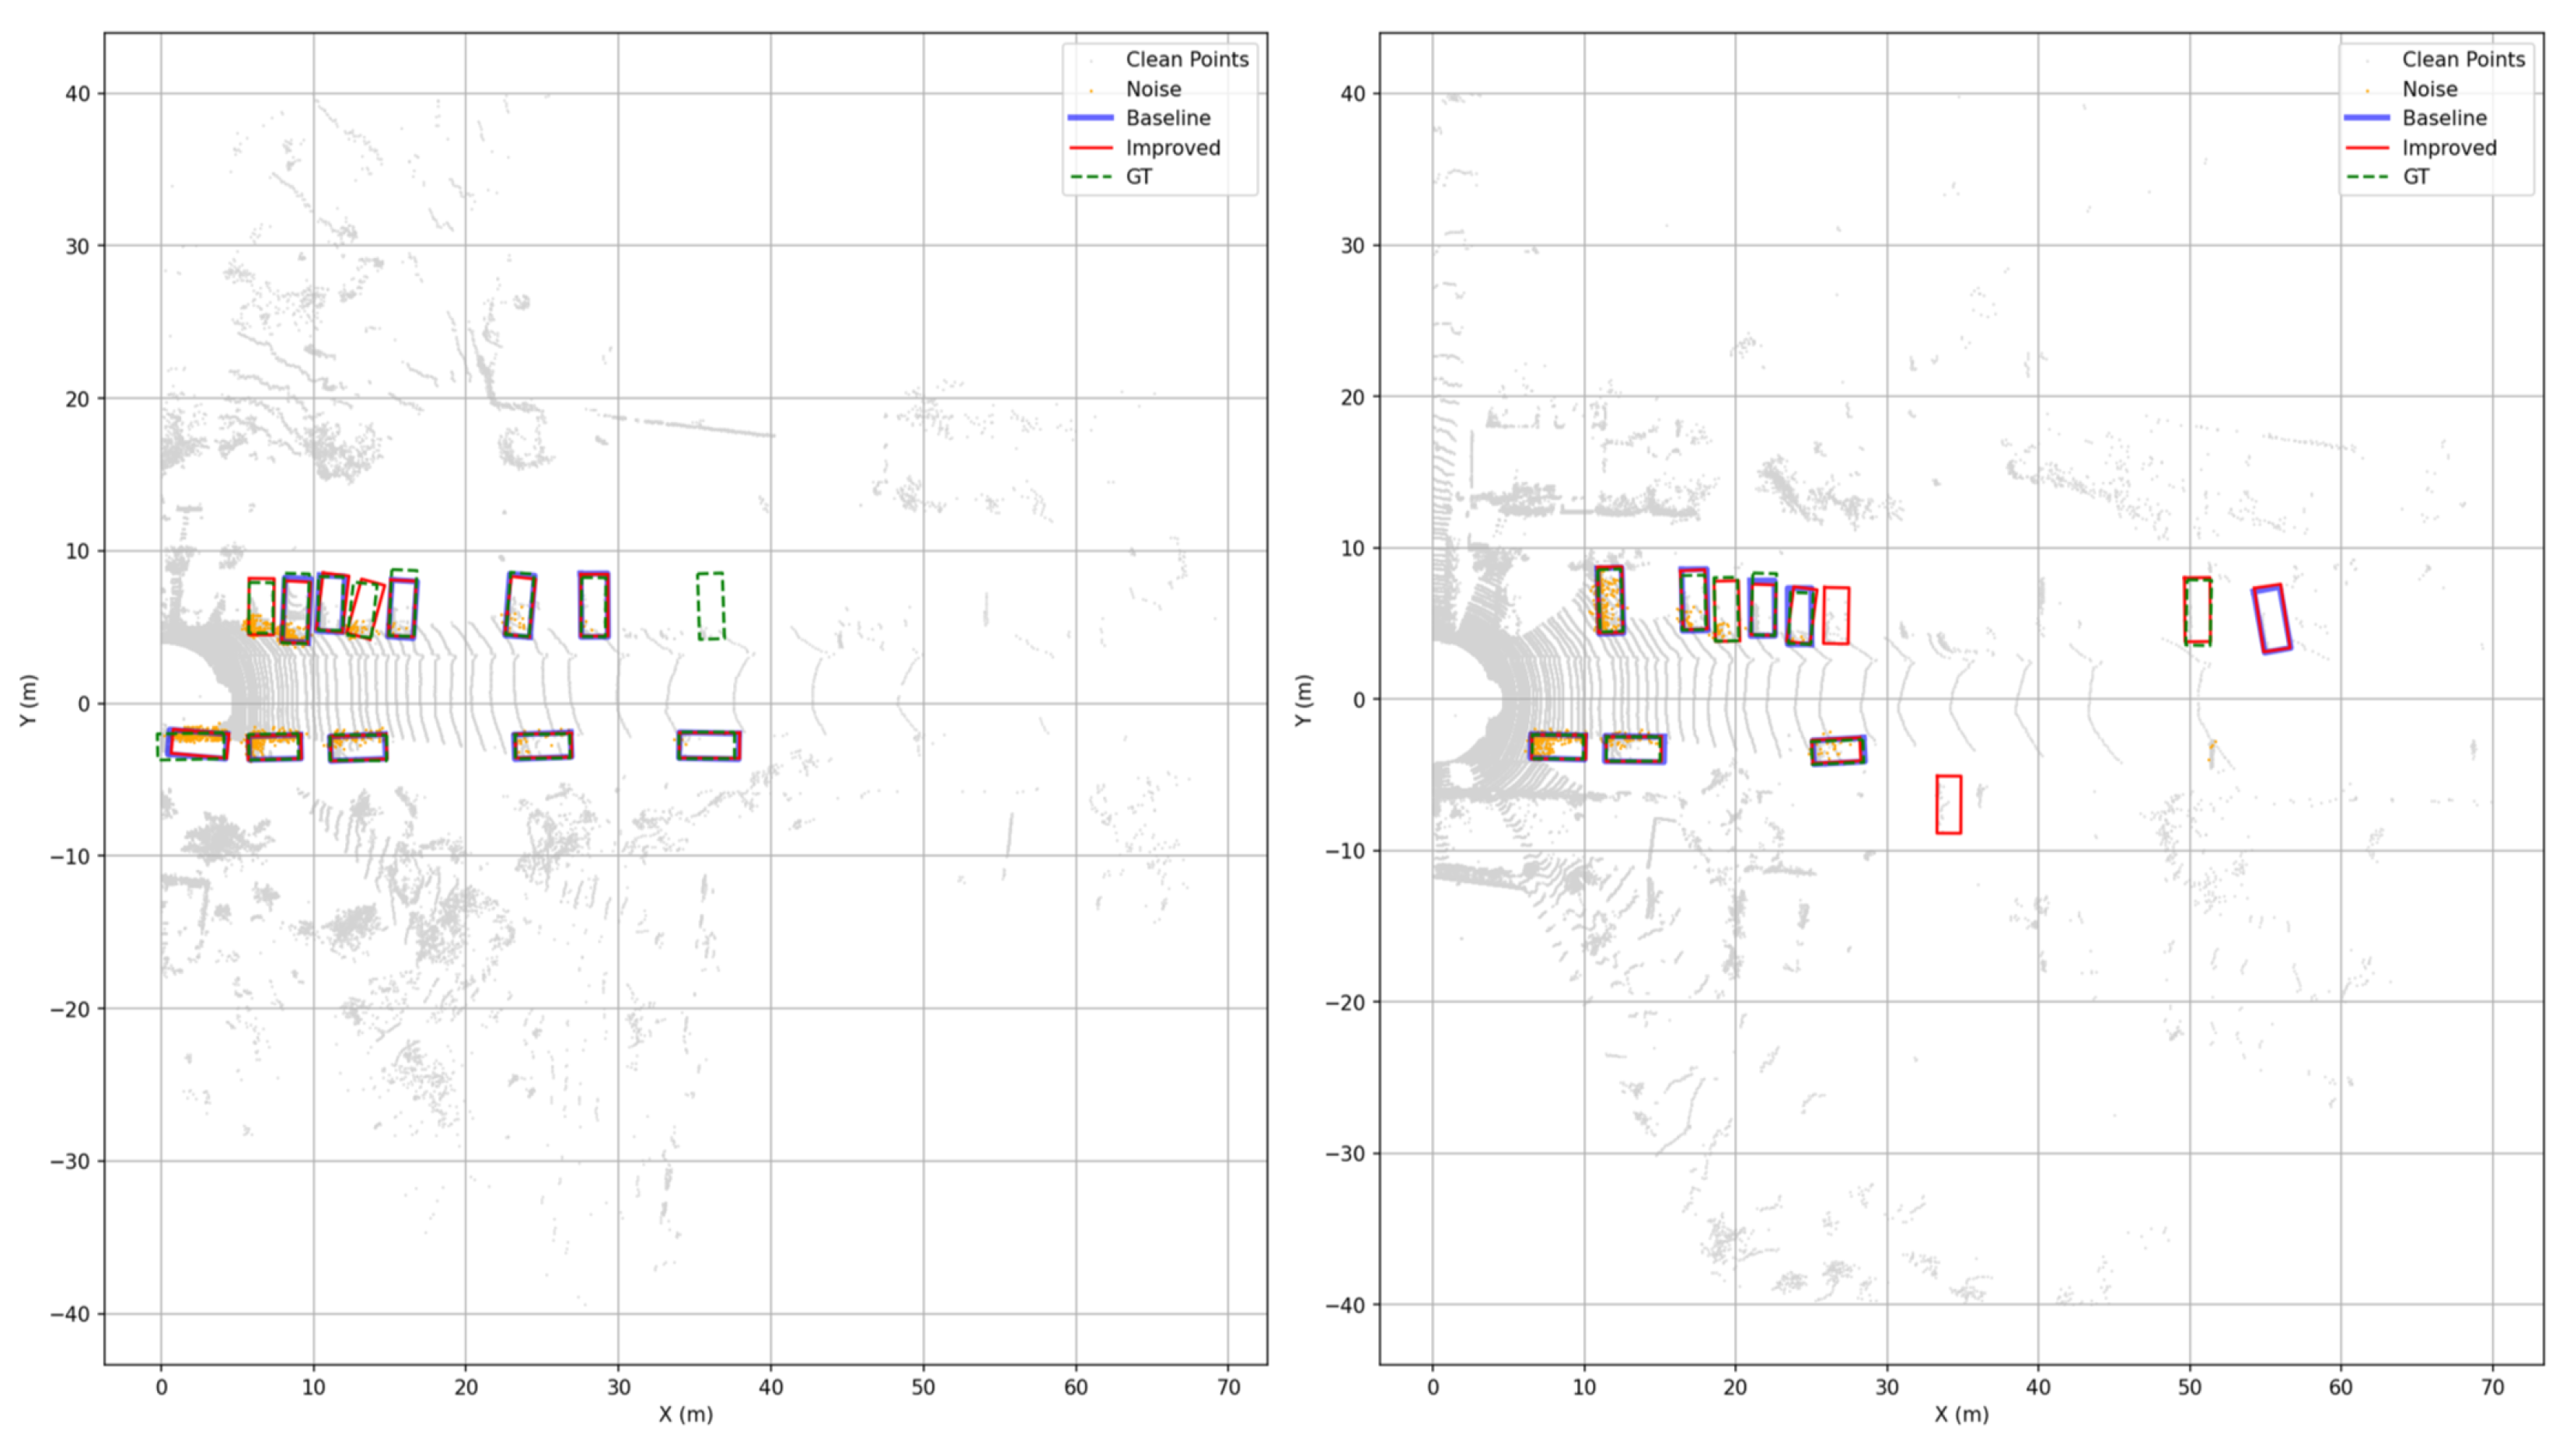
Figure 7 intuitively demonstrates the robustness of our method under simulated noisy and occluded conditions. While the point cloud data was perturbed by Gaussian noise (yellow), the baseline model resulted in missed detections. In contrast, our method successfully detected and accurately localized these occluded targets.
Figure 7.
Visualization of object detection results on the KITTI dataset under noisy and occluded conditions. The gray points represent the raw point cloud, the yellow points denote noise, the green bounding boxes are the predictions of the baseline model, the red bounding boxes are the predictions of our model, and the blue bounding boxes are the ground truth.
4.4. Ablation Experiments on the KITTI Dataset
We conduct ablation studies on the KITTI dataset to evaluate different modules. As shown in Table 4, each module effectively improves the baseline model (A). The MWF module (B) provides the most significant gain, demonstrating the effectiveness of its dynamic fusion weights. The CMA (C) and CA3D (D) modules show consistent improvements on the more challenging Moderate and Hard settings. They address feature alignment and bounding box refinement, respectively. The combination of all three modules (F) achieves the best performance, particularly on the Easy (92.22%) and Hard (82.25%) difficulty levels.
Table 4.
Ablation detection results on the KITTI validation set by using different designed components. ✔ means “with” and - is “without”.
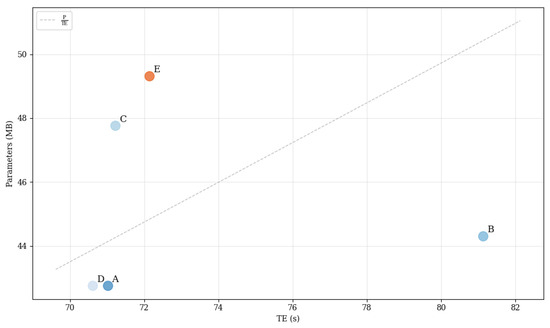
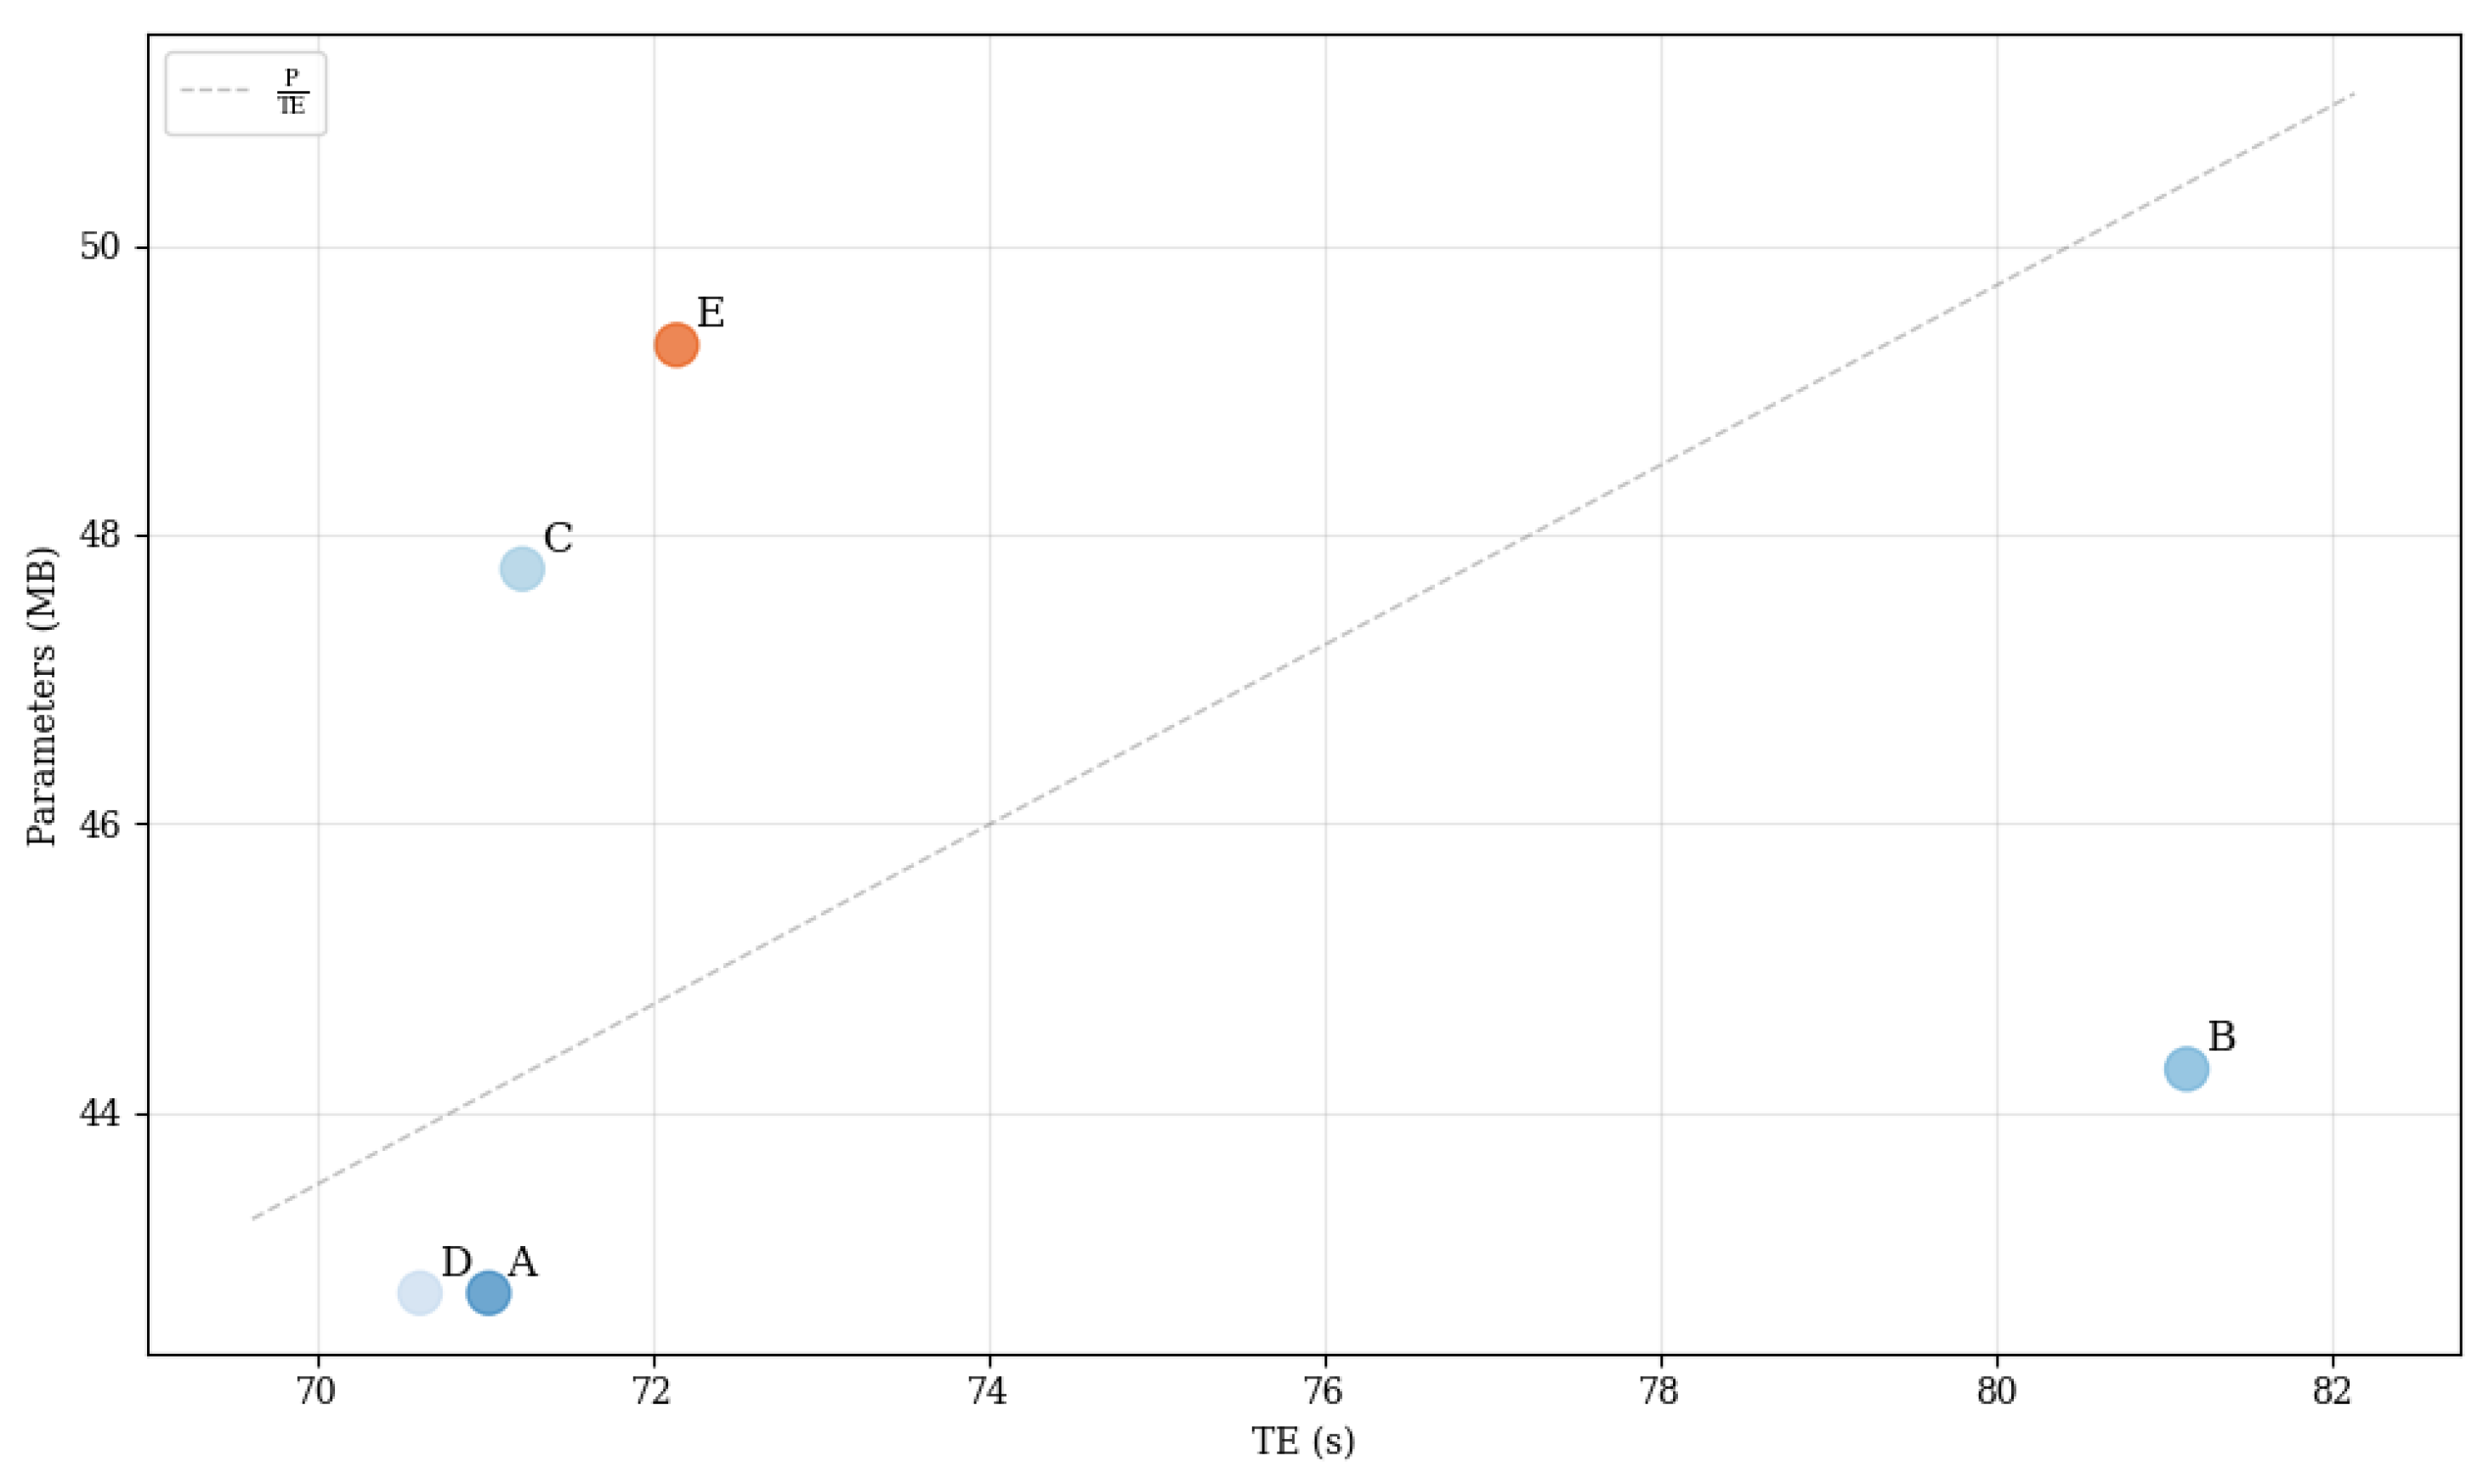
Additionally, we evaluated the parameters and efficiency of different modules using 500 test samples. As shown in Table 5, the MWF module (Model B), as a lightweight meta-network, only slightly increases the parameter count (+1.55 MB). However, due to its dynamic inference process, the runtime increases significantly (+10.12 s), and the FPS decreases accordingly from 7.04 to 6.16. The CMA module (Model C) uses an attention mechanism for feature alignment. It increases the parameter count more noticeably (+5.01 MB), but the runtime overhead is well controlled (+0.20 s). The FPS (7.02) remains almost the same as the baseline (7.04). Notably, the CA3D module (Model D) serves as a post-processing step. It does not add parameters. Its efficient box fusion algorithm slightly reduces runtime and increases FPS to 7.08, showing its advantage. The full model (E) integrates all three modules. Compared to the baseline (A), it has a controlled parameter increase (+6.56 MB). The inference time increases only slightly by 1.12 s, and the FPS remains at 6.93. Figure 8 visually illustrates the relationship between parameter count and inference time. It shows that the full model achieves a significant overall performance improvement at a very small computational cost.
Table 5.
Ablation experiment of the proposed method computational efficiency. ✔ means “with” and - is “without”.
Figure 8.
Visualization of parameters and runtime. The notations A–E correspond to the models in Table 5.
The modality ablation results presented in Table 6 unequivocally confirm the superiority of the multimodal fusion strategy. When employing the Image modality alone, performance is the lowest across all metrics (Easy: 85.63%, Moderate: 73.86%, Hard: 68.52%) due to the inherent lack of accurate depth information and perspective distortion. Conversely, the Point Cloud (LiDAR) modality, which provides accurate yet sparse 3D geometric structure, yields significantly higher detection accuracy (Easy: 88.93%, Moderate: 82.19%, Hard: 79.29%). Crucially, only the combination of both modalities—Multimodal fusion (LiDAR + RGB)—achieves the optimal overall performance (Easy: 92.22%, Moderate: 85.03%, Hard: 82.25%). This strongly validates the necessity of deep fusion, which leverages the precise geometric structure from LiDAR and the rich semantic texture from images to complement each other.
Table 6.
Ablation results on the KITTI validation set by using different modality.
As shown in Table 7, we explored the impact of different modality fusion methods. The feature concatenation strategy significantly outperforms simple addition (+) across all metrics. This proves the importance of preserving feature completeness for improving performance. Our proposed CMA fusion strategy achieves the best performance. It shows an improvement of 1.87% over the basic concatenation method, especially on the most challenging Hard level. This validates that the CMA module, through cross-modal attention for feature alignment and adaptive gated fusion, can more effectively utilize complementary information. It significantly enhances robustness in difficult scenarios. A key finding is that a naive cross-attention strategy performs worse than even concatenation. This indicates the necessity of the designs within our CMA module, such as the adaptive gating mechanism, rather than simply introducing an attention mechanism.
Table 7.
Ablation results on the KITTI validation set by using different fusion strategy on the detection head.
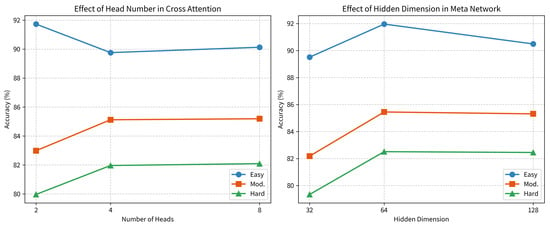
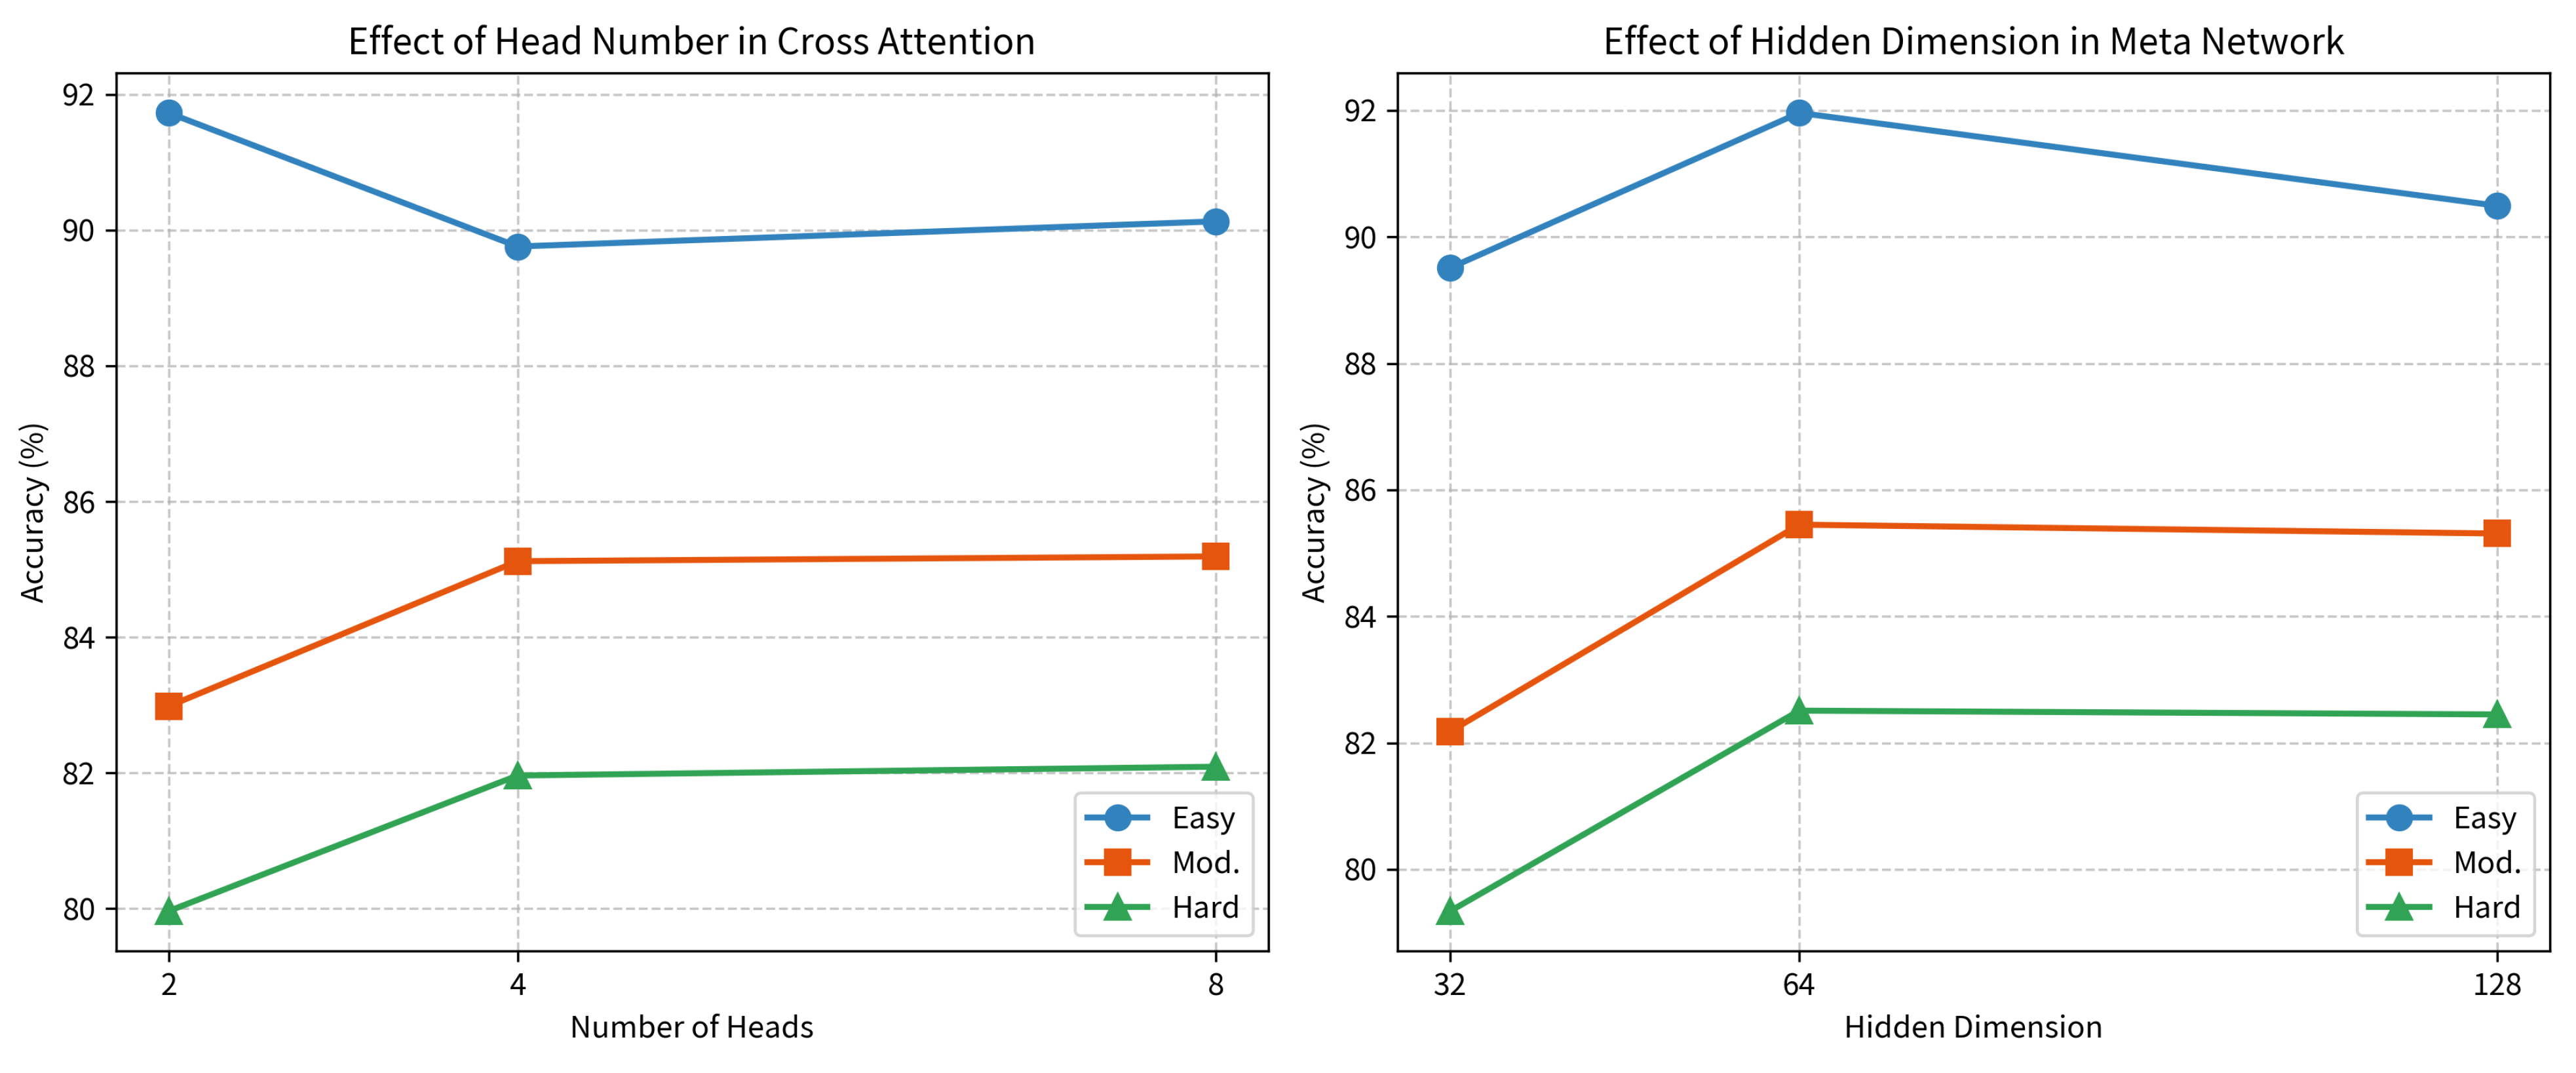
We investigated the impact of different parameter settings on module performance. As shown in Figure 9 (left), we analyzed the performance trend concerning the number of cross-attention heads. The CMA module exhibited differing optimal head counts based on difficulty level (2 for Easy, 8 for Moderate/Hard). We attribute this variation to a trade-off between feature diversity, subspace decomposition capability, and model generalization. According to Table 8, the model achieved the best performance for Moderate and Hard difficulty levels when the number of attention heads was set to 8. This is because high-difficulty scenes (e.g., high occlusion, low truncation) present sparse features and complex backgrounds, leading to more severe initial misalignment of multimodal features and necessitating the identification of finer complementary information. Employing 8 attention heads allows the cross-modal feature to be decomposed into more independent subspaces. This enables the model to learn finer-grained, multi-view alignment relationships (e.g., simultaneously attending to geometric shape and textural boundaries). This multi-granularity feature interaction significantly enhances the model’s ability to capture and utilize complementary information, thus achieving more robust feature alignment and improving performance in complex scenarios. However, performance peaked at 2 heads for the Easy difficulty level. In Easy scenes, the required cross-modal alignment relationship is relatively simple and general. An excessive number of heads (e.g., 8) may cause the model to learn overly specialized or redundant alignment patterns, slightly sacrificing generalization in simple scenes. Two heads provide sufficient capacity to capture the core alignment information for Easy scenes while maintaining good generalization. Considering overall performance across all difficulty levels, setting the number of heads to 8 is the optimal choice.
Figure 9.
Comparing the effects of different parameters on CMA and MWF.
Table 8.
Ablation study: number of heads in cross attention of CMA.
As shown in Figure 9 (right), we analyzed the effect of the meta-network’s hidden layer dimension on performance. According to Table 9, a hidden dimension of 64 was optimal, yielding the best overall performance across all three difficulty levels. The meta-network aims to dynamically generate optimal fusion weights w based on the joint 3D and 2D global context vector s. This process is a nonlinear function approximation, mapping high-dimensional scene features to a low-dimensional, normalized weight space. Setting the hidden dimension to 64 provides moderate model capacity. This capacity is sufficient to learn the complex nonlinear relationship between scene context and optimal modal contributions. This allows the model to accurately decide when to rely more on pseudo-point cloud information and when to trust point cloud geometry. A low dimension of 32 led to a notable performance drop. When the dimension was reduced to 32, the model capacity became insufficient, causing a significant performance drop, especially on Moderate and Hard samples where scene complexity is high and modal advantages change dynamically. The meta-network could not effectively capture subtle variations in different scene contexts, resulting in inaccurate or non-adaptive fusion weights (i.e., underfitting), which significantly decreased performance. A high dimension of 128 provided no significant gain. Increasing the dimension to 128 resulted in performance similar to 64, but with increased computational overhead. This indicates that the 64-dimension capacity reached the saturation point for effective information utilization in this task. The extra capacity (128 dimensions) primarily learned noise or redundant patterns in the scene features, offering no noticeable performance improvement.
Table 9.
Ablation study: number of hidden layers in the Meta network of MWF.
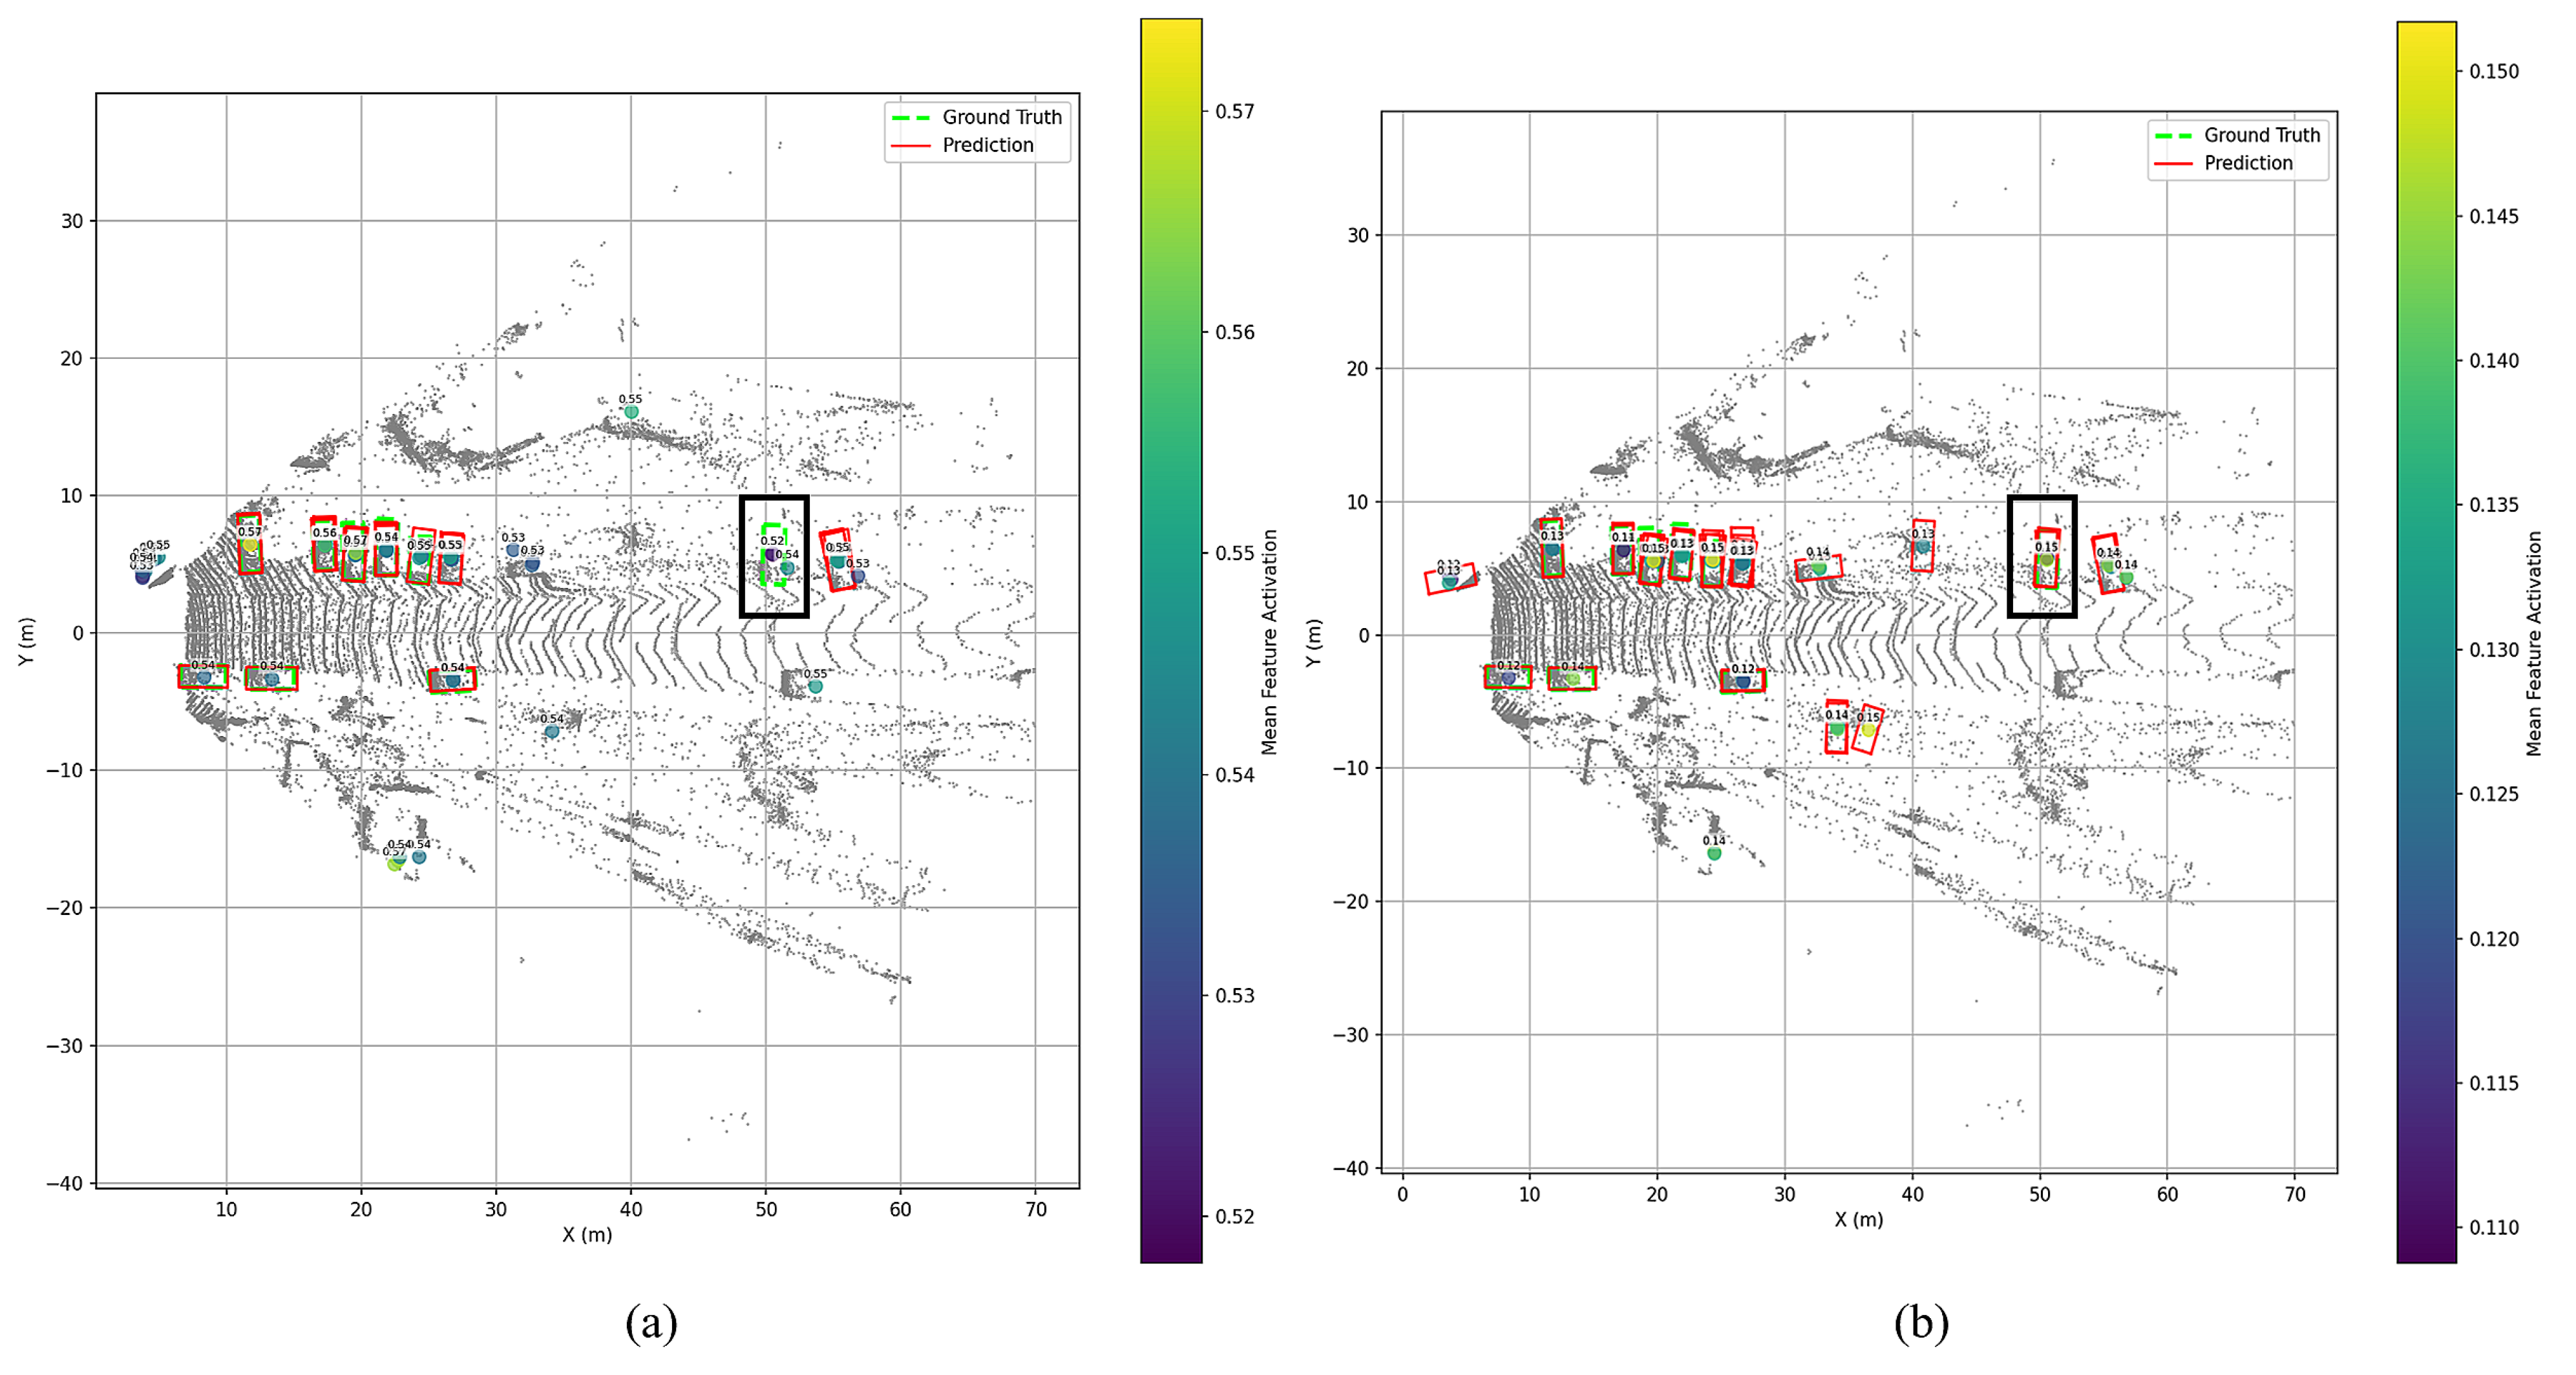
4.5. Comparative Analysis of ROI Feature Activation
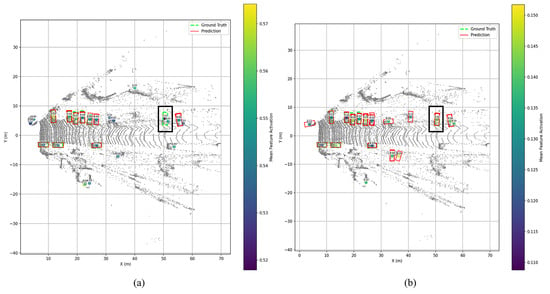
To intuitively demonstrate the effectiveness of the CMA module, we visualize the detection results and the corresponding Region of Interest (ROI) feature intensities in Figure 10. The green and red boxes represent the ground truth and model predictions, respectively. The colored dots indicate the centers of ROIs, with numerical labels explicitly displaying the mean activation intensity of the features at each location. As highlighted by the black rectangles in Figure 10, the baseline model (a) exhibits relatively suppressed feature responses, with an activation value of 0.52 positioned at the lower end of the activation intensity spectrum. This weak feature representation leads to missed detections. In contrast, our optimized model (b) generates significantly stronger feature activations in the same regions, with an intensity value of 0.15, which lies at the upper end of the activation intensity range. This enhancement indicates that our method effectively extracts more discriminative semantic features from the point cloud, enabling the model to accurately localize and classify objects that were overlooked by the baseline.
Figure 10.
Heatmap visualization of ROI feature responses. The points illustrate the center of Region of Interests (ROIs), and their colors (from purple to yellow) correspond to the feature activation intensity. Higher values indicate stronger model confidence in the local features. Subfigure (a) denotes the predictions of the baseline model, and (b) denotes those enhanced with the CMA module. Here, green boxes are ground truth, red boxes are model predictions, and black boxes are used to highlight our model’s superior performance.
4.6. Qualitative Analysis of the MWF Module
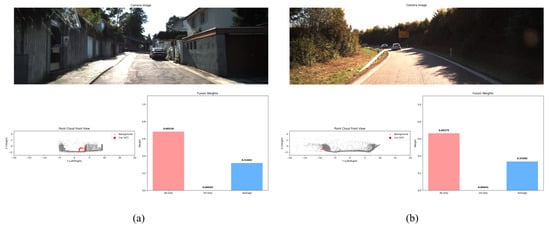
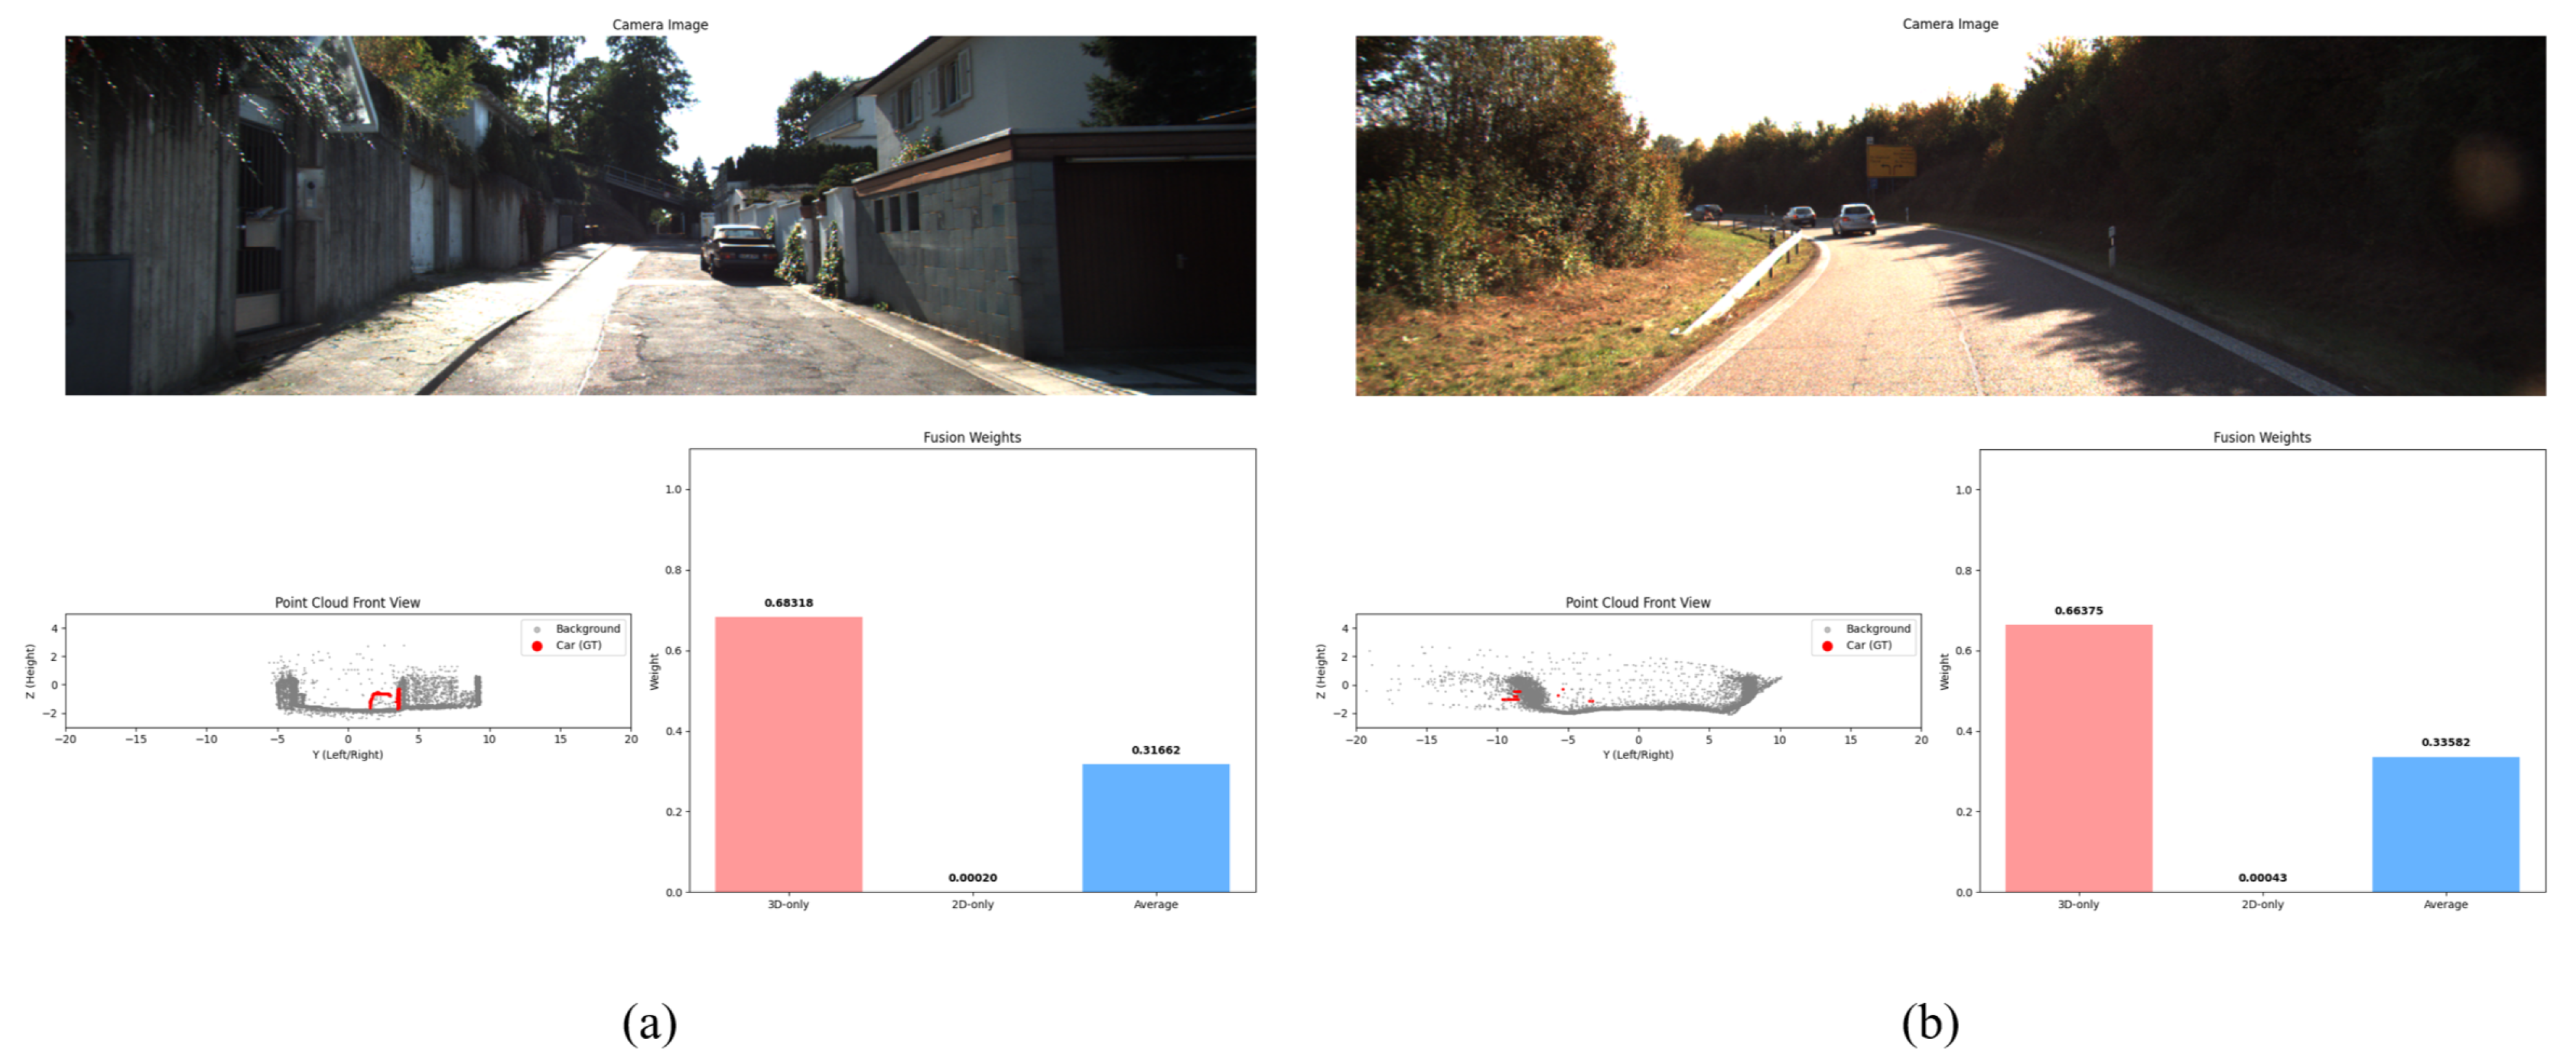
To intuitively demonstrate the adaptive behavior of our proposed Meta-Weighted Fusion (MWF) module, we visualize the dynamically generated fusion weights for different scenes. Figure 11 presents a qualitative analysis, showing the input camera image (top row), the front-view LiDAR point cloud with ground-truth objects marked in red (bottom left), and the corresponding fusion weights generated by the MWF module (bottom right). In scenario (a), the target vehicle is close. The LiDAR point cloud for this object is relatively dense and accurate. Consequently, the MWF module assigns a higher weight to the LiDAR-dominant pathway. In contrast, scenario (b) features a distant target. The corresponding LiDAR point cloud is sparse due to sensor limitations. In this challenging case, the MWF module intelligently increases the weights for the image-dominant and balanced-average strategies. This shift leverages the rich semantic texture from the image to compensate for the lack of geometric data. These observations confirm that our MWF module dynamically regulates the contributions of each modality. It enhances LiDAR features when the point cloud is reliable and strengthens image features when the geometry is sparse. This adaptive fusion strategy is crucial for robust performance across varied driving conditions.
Figure 11.
Visualization of MWF module weights. (a,b) represent near and distant scenes, thereby showing the change in weights. The top row displays the camera image. The bottom row shows the front-view projection of the LiDAR point cloud and the corresponding fusion weights of the MWF module. Red points in the point cloud view indicate ground truth objects.
4.7. Object Detection Visualization
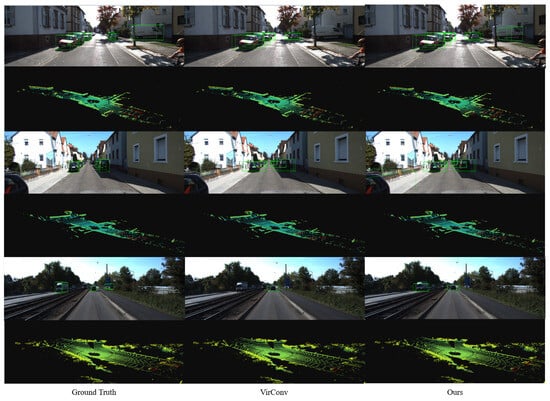
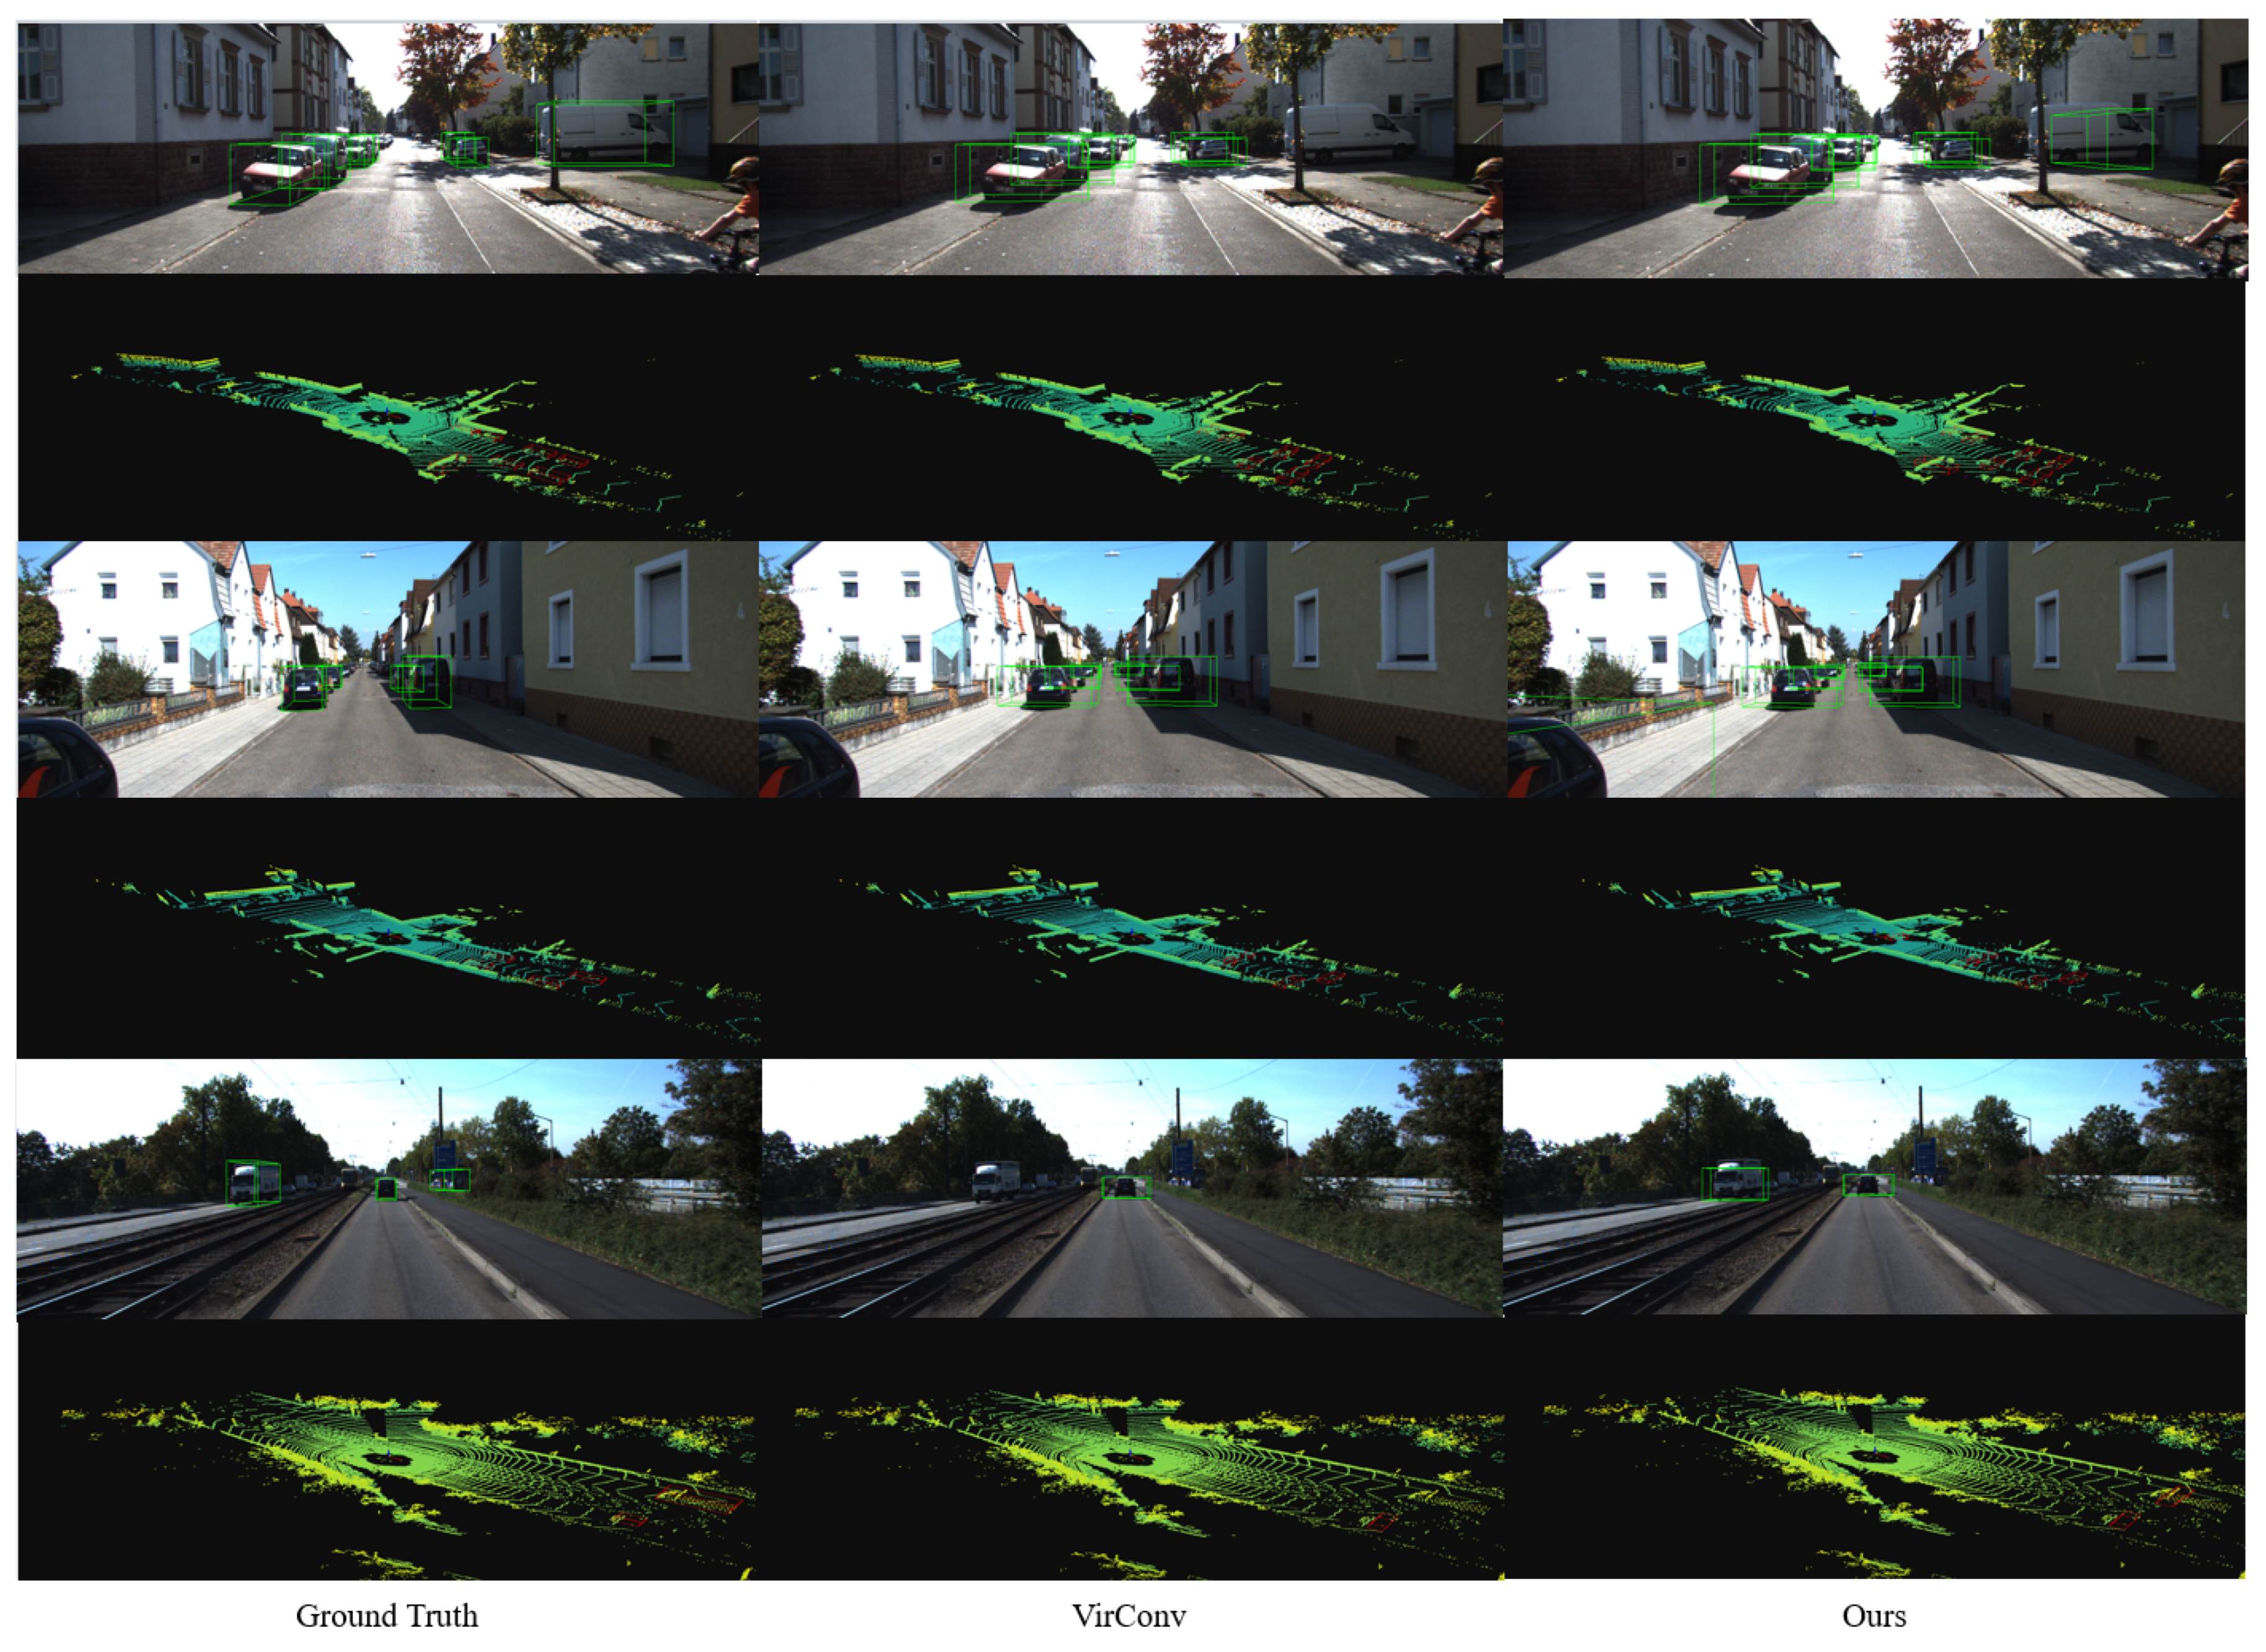
We further present qualitative 3D object detection results of our method on the KITTI dataset, as shown in Figure 12. For comparison, we also include results from VirConv, a representative method. From left to right, the figure shows the ground truth, the results from VirConv, and the results from our proposed method. Detected objects are indicated by green bounding boxes. Our method produces more accurate detection results compared to VirConv. It performs notably better at distinguishing foreground objects from complex backgrounds. For instance, in urban scenes, VirConv tends to generate false positives or miss detections, such as failing to detect vehicles with sparse features. This is because VirConv is more susceptible to background clutter and sensor noise. In contrast, our method effectively mitigates these issues through enhanced feature fusion and alignment. It demonstrates higher detection accuracy and robustness in challenging scenarios.
Figure 12.
Visualization of object detection results on the KITTI dataset. The green boxes represent the model’s 3D predicted boxes.
5. Discussion
Compared to most existing multimodal detection methods, our proposed approach demonstrates significant performance advantages. However, despite the notable gains, our method still presents certain limitations. First, the network relies on a depth completion module (e.g., PENet) to generate pseudo-LiDAR point clouds. The resulting depth estimation errors require structural mitigation within the model. Second, the MWF and CMA modules introduce marginal increases in inference time and parameter count, respectively. The full model’s total parameter count is . Our analysis suggests that the model’s total size is suitable for deployment on various autonomous systems and mobile robotic platforms. For instance, the Jetson Xavier NX platform, with its 8GB memory, is capable of running medium-complexity models like ResNet-50 (with parameters ). Furthermore, the NVIDIA DRIVE Orin chip provides a computing power of 254 TOPS. In comparison, the RTX 3090 used in our experiments provides 285 TOPS at INT8 precision. This comparison indicates that our model’s resource requirement is well below the capacity limit of dedicated automotive hardware. In future work, we will further explore model efficiency optimization techniques such as knowledge distillation and quantization, prioritizing validation on power-constrained platforms.
6. Conclusions
This paper presents a pseudo-point-based adaptive fusion network for 3D object detection, an end-to-end framework for monocular camera and LiDAR fusion. We introduced three novel modules to achieve biased fusion and optimization. The MWF module uses a lightweight meta-network to dynamically balance the contributions of LiDAR and pseudo-point features. The CMA module employs bidirectional cross-attention and adaptive gating to resolve feature misalignment at the ROI level, yielding more discriminative representations. Ultimately, the C3BF strategy consolidates redundant predictions through a confidence-weighted mechanism, substantially refining both the localization precision and the structural stability of the resultant 3D bounding boxes. Extensive ablation studies and performance evaluations were conducted on the KITTI dataset. Our method achieved leading SOTA performance, reaching 82.25% AP on the challenging Hard difficulty level. Notably, the MWF module provided the most significant performance gain, specifically achieving a 2.29% improvement on the Hard level. The efficient C3BF module slightly increased inference speed without adding model parameters. For future work, we will focus on efficiency optimization techniques like knowledge distillation and quantization, emphasizing real-world validation on power-constrained platforms.
Author Contributions
C.Z.: writing—original draft, software, methodology, investigation. W.W.: writing—review and editing, validation, supervision, methodology. H.W.: validation, methodology. B.Y.: writing—review and editing, validation, supervision. All authors have read and agreed to the published version of the manuscript.
Funding
The research was also supported by the Liaoning Provincial Department of Science and Technology under Grant No. 2024JH2/102400062 for the project “Research and Application of Intelligent Process Optimization Technology for Precision CNC Machining”.
Data Availability Statement
The original contributions presented in this study are included in the article. Further inquiries can be directed to the corresponding author. The source code is not publicly shared due to ongoing related research.
Conflicts of Interest
The authors declare no conflicts of interest.
References
- Abro, G.E.M.; Ali, Z.A.; Rajput, S. Innovations in 3D object detection: A comprehensive review of methods, sensor fusion, and future directions. ICCK Trans. Sens. Commun. Control 2024, 1, 3–29. [Google Scholar]
- Shi, C.; Lai, G.; Yu, Y.; Bellone, M.; Lippiello, V. Real-time multi-modal active vision for object detection on UAVs equipped with limited field of view LiDAR and camera. IEEE Robot. Autom. Lett. 2023, 8, 6571–6578. [Google Scholar] [CrossRef] [Scilit]
- Poliyapram, V.; Wang, W.; Nakamura, R. A point-wise LiDAR and image multimodal fusion network (PMNet) for aerial point cloud 3D semantic segmentation. Remote Sens. 2019, 11, 2961. [Google Scholar] [CrossRef] [Scilit]
- Li, Y.; Qi, X.; Chen, Y.; Wang, L.; Li, Z.; Sun, J.; Jia, J. Voxel field fusion for 3D object detection. In Proceedings of the IEEE/CVF Conference on Computer Vision and Pattern Recognition, New Orleans, LA, USA, 18–24 June 2022; pp. 1120–1129. [Google Scholar]
- Wang, K.; Zhou, T.; Zhang, Z.; Chen, T.; Chen, J. PVF-DectNet: Multi-modal 3D detection network based on perspective-voxel fusion. Eng. Appl. Artif. Intell. 2023, 120, 105951. [Google Scholar] [CrossRef] [Scilit]
- Zhao, X.; Sun, P.; Xu, Z.; Min, H.; Yu, H. Fusion of 3D LIDAR and camera data for object detection in autonomous vehicle applications. IEEE Sens. J. 2020, 20, 4901–4913. [Google Scholar] [CrossRef] [Scilit]
- Li, X.; Shi, B.; Hou, Y.; Wu, X.; Ma, T.; Li, Y.; He, L. Homogeneous multi-modal feature fusion and interaction for 3D object detection. In European Conference on Computer Vision; Springer: Cham, Switzerland, 2022; pp. 691–707. [Google Scholar]
- Liu, Z.; Huang, T.; Li, B.; Chen, X.; Wang, X.; Bai, X. EPNet++: Cascade bi-directional fusion for multi-modal 3D object detection. IEEE Trans. Pattern Anal. Mach. Intell. 2022, 45, 8324–8341. [Google Scholar] [CrossRef] [Scilit] [PubMed]
- Qi, C.R.; Liu, W.; Wu, C.; Su, H.; Guibas, L.J. Frustum pointnets for 3D object detection from rgb-d data. In Proceedings of the IEEE Conference on Computer Vision and Pattern Recognition, Salt Lake City, UT, USA, 18–23 June 2018; pp. 918–927. [Google Scholar]
- Qi, C.R.; Su, H.; Mo, K.; Guibas, L.J. Pointnet: Deep learning on point sets for 3D classification and segmentation. In Proceedings of the IEEE Conference on Computer Vision and Pattern Recognition, Honolulu, HI, USA, 21–26 July 2017; pp. 652–660. [Google Scholar]
- Zhou, Y.; Tuzel, O. Voxelnet: End-to-end learning for point cloud based 3D object detection. In Proceedings of the IEEE Conference on Computer Vision and Pattern Recognition, Salt Lake City, UT, USA, 18–23 June 2018; pp. 4490–4499. [Google Scholar]
- Krispel, G.; Opitz, M.; Waltner, G.; Possegger, H.; Bischof, H. Fuseseg: Lidar point cloud segmentation fusing multi-modal data. In Proceedings of the IEEE/CVF Winter Conference on Applications of Computer Vision, Snowmass Village, CO, USA, 1–5 March 2020; pp. 1874–1883. [Google Scholar]
- Ku, J.; Mozifian, M.; Lee, J.; Harakeh, A.; Waslander, S.L. Joint 3D proposal generation and object detection from view aggregation. In Proceedings of the 2018 IEEE/RSJ International Conference on Intelligent Robots and Systems (IROS), Madrid, Spain, 1–5 October 2018; pp. 1–8. [Google Scholar]
- Zhang, Z.; Liang, Z.; Zhang, M.; Zhao, X.; Li, H.; Yang, M.; Tan, W.; Pu, S. RangeLVDet: Boosting 3D object detection in LiDAR with range image and RGB image. IEEE Sens. J. 2021, 22, 1391–1403. [Google Scholar] [CrossRef] [Scilit]
- Huang, J.; Huang, G.; Zhu, Z.; Ye, Y.; Du, D. Bevdet: High-performance multi-camera 3D object detection in bird-eye-view. arXiv 2021, arXiv:2112.11790. [Google Scholar]
- Li, Y.; Chen, Y.; Qi, X.; Li, Z.; Sun, J.; Jia, J. Unifying voxel-based representation with transformer for 3D object detection. Adv. Neural Inf. Process. Syst. 2022, 35, 18442–18455. [Google Scholar]
- Chen, Q.; Sun, L.; Wang, Z.; Jia, K.; Yuille, A. Object as hotspots: An anchor-free 3D object detection approach via firing of hotspots. In European Conference on Computer Vision; Springer: Cham, Switzerland, 2020; pp. 68–84. [Google Scholar]
- Fei, J.; Chen, W.; Heidenreich, P.; Wirges, S.; Stiller, C. SemanticVoxels: Sequential fusion for 3D pedestrian detection using LiDAR point cloud and semantic segmentation. In Proceedings of the 2020 IEEE International conference on multisensor fusion and integration for intelligent systems (MFI), Karlsruhe, Germany, 14–16 September 2020; pp. 185–190. [Google Scholar]
- Liang, T.; Xie, H.; Yu, K.; Xia, Z.; Lin, Z.; Wang, Y.; Tang, T.; Wang, B.; Tang, Z. Bevfusion: A simple and robust lidar-camera fusion framework. Adv. Neural Inf. Process. Syst. 2022, 35, 10421–10434. [Google Scholar]
- Deng, J.; Shi, S.; Li, P.; Zhou, W.; Zhang, Y.; Li, H. Voxel r-cnn: Towards high performance voxel-based 3D object detection. Proc. AAAI Conf. Artif. Intell. 2021, 35, 1201–1209. [Google Scholar] [CrossRef] [Scilit]
- Qi, C.R.; Yi, L.; Su, H.; Guibas, L.J. Pointnet++: Deep hierarchical feature learning on point sets in a metric space. In Proceedings of the Advances in Neural Information Processing Systems, Long Beach, CA, USA, 4–9 December 2017. Volume 30. [Google Scholar]
- Shi, S.; Wang, X.; Li, H. Pointrcnn: 3D object proposal generation and detection from point cloud. In Proceedings of the IEEE/CVF Conference on Computer Vision and Pattern Recognition, Long Beach, CA, USA, 15–20 June 2019; pp. 770–779. [Google Scholar]
- Yang, Z.; Sun, Y.; Liu, S.; Jia, J. 3DSSD: Point-based 3D single stage object detector. In Proceedings of the IEEE/CVF Conference on Computer Vision and Pattern Recognition, Seattle, WA, USA, 13–19 June 2020; pp. 11040–11048. [Google Scholar]
- Yan, Y.; Mao, Y.; Li, B. Second: Sparsely embedded convolutional detection. Sensors 2018, 18, 3337. [Google Scholar] [CrossRef] [Scilit]
- Lang, A.H.; Vora, S.; Caesar, H.; Zhou, L.; Yang, J.; Beijbom, O. Pointpillars: Fast encoders for object detection from point clouds. In Proceedings of the IEEE/CVF Conference on Computer Vision and Pattern Recognition, Long Beach, CA, USA, 15–20 June 2019; pp. 12697–12705. [Google Scholar]
- Yang, B.; Luo, W.; Urtasun, R. Pixor: Real-time 3D object detection from point clouds. In Proceedings of the IEEE Conference on Computer Vision and Pattern Recognition, Salt Lake City, UT, USA, 18–23 June 2018; pp. 7652–7660. [Google Scholar]
- Zhou, Y.; Sun, P.; Zhang, Y.; Anguelov, D.; Gao, J.; Ouyang, T.; Guo, J.; Ngiam, J.; Vasudevan, V. End-to-end multi-view fusion for 3D object detection in lidar point clouds. In Proceedings of the Conference on Robot Learning, PMLR, Virtual, 16–18 November 2020; pp. 923–932. [Google Scholar]
- Meyer, G.P.; Laddha, A.; Kee, E.; Vallespi-Gonzalez, C.; Wellington, C.K. Lasernet: An efficient probabilistic 3D object detector for autonomous driving. In Proceedings of the IEEE/CVF Conference on Computer Vision and Pattern Recognition, Long Beach, CA, USA, 15–20 June 2019; pp. 12677–12686. [Google Scholar]
- Yoo, J.H.; Kim, Y.; Kim, J.; Choi, J.W. 3D-CVF: Generating joint camera and LiDAR features using cross-view spatial feature fusion for 3D object detection. In European Conference on Computer Vision; Springer: Cham, Switzerland, 2020; pp. 720–736. [Google Scholar]
- Lin, Z.; Liu, Z.; Xia, Z.; Wang, X.; Wang, Y.; Qi, S.; Dong, Y.; Dong, N.; Zhang, L.; Zhu, C. Rcbevdet: Radar-camera fusion in bird’s eye view for 3D object detection. In Proceedings of the IEEE/CVF Conference on Computer Vision and Pattern Recognition, Seattle, WA, USA, 16–22 June 2024; pp. 14928–14937. [Google Scholar]
- Pang, S.; Morris, D.; Radha, H. CLOCs: Camera-LiDAR object candidates fusion for 3D object detection. In Proceedings of the 2020 IEEE/RSJ International Conference on Intelligent Robots and Systems (IROS), Las Vegas, NV, USA, 25–29 October 2020; pp. 10386–10393. [Google Scholar]
- Wu, X.; Peng, L.; Yang, H.; Xie, L.; Huang, C.; Deng, C.; Liu, H.; Cai, D. Sparse fuse dense: Towards high quality 3D detection with depth completion. In Proceedings of the IEEE/CVF Conference on Computer Vision and Pattern Recognition, New Orleans, LA, USA, 18–24 June 2022; pp. 5418–5427. [Google Scholar]
- Wu, H.; Wen, C.; Shi, S.; Li, X.; Wang, C. Virtual sparse convolution for multimodal 3D object detection. In Proceedings of the IEEE/CVF Conference on Computer Vision and Pattern Recognition, Vancouver, BC, Canada, 17–24 June 2023; pp. 21653–21662. [Google Scholar]
- Gu, Z.; Ma, J.; Huang, Y.; Wei, H.; Chen, Z.; Zhang, H.; Hong, W. HGSFusion: Radar-camera fusion with hybrid generation and synchronization for 3D object detection. Proc. AAAI Conf. Artif. Intell. 2025, 39, 3185–3193. [Google Scholar] [CrossRef] [Scilit]
- Cheng, X.; Wang, P.; Guan, C.; Yang, R. Cspn++: Learning context and resource aware convolutional spatial propagation networks for depth completion. Proc. AAAI Conf. Artif. Intell. 2020, 34, 10615–10622. [Google Scholar] [CrossRef] [Scilit]
- Zhang, Y.; Guo, X.; Poggi, M.; Zhu, Z.; Huang, G.; Mattoccia, S. Completionformer: Depth completion with convolutions and vision transformers. In Proceedings of the IEEE/CVF Conference on Computer Vision and Pattern Recognition, Vancouver, BC, Canada, 17–24 June 2023; pp. 18527–18536. [Google Scholar]
- Long, C.; Zhang, W.; Chen, Z.; Wang, H.; Liu, Y.; Tong, P.; Cao, Z.; Dong, Z.; Yang, B. SparseDC: Depth completion from sparse and non-uniform inputs. Inf. Fusion 2024, 110, 102470. [Google Scholar] [CrossRef] [Scilit]
- Shi, Y.; Singh, M.K.; Cai, H.; Porikli, F. Decotr: Enhancing depth completion with 2D and 3D attentions. In Proceedings of the IEEE/CVF Conference on Computer Vision and Pattern Recognition, Seattle, WA, USA, 16–22 June 2024; pp. 10736–10746. [Google Scholar]
- Yan, Z.; Lin, Y.; Wang, K.; Zheng, Y.; Wang, Y.; Zhang, Z.; Li, J.; Yang, J. Tri-perspective view decomposition for geometry-aware depth completion. In Proceedings of the IEEE/CVF Conference on Computer Vision and Pattern Recognition, Seattle, WA, USA, 16–22 June 2024; pp. 4874–4884. [Google Scholar]
- Teutscher, D.; Mangat, P.; Wasenmüller, O. PDC: Piecewise depth completion utilizing superpixels. In Proceedings of the 2021 IEEE International Intelligent Transportation Systems Conference (ITSC), Indianapolis, IN, USA, 19–22 September 2021; pp. 2752–2758. [Google Scholar]
- Geiger, A.; Lenz, P.; Stiller, C.; Urtasun, R. Vision meets robotics: The kitti dataset. Int. J. Robot. Res. 2013, 32, 1231–1237. [Google Scholar] [CrossRef] [Scilit]
- Hu, M.; Wang, S.; Li, B.; Ning, S.; Fan, L.; Gong, X. Penet: Towards precise and efficient image guided depth completion. In Proceedings of the 2021 IEEE International Conference on Robotics and Automation (ICRA), Xi’an, China, 30 May–5 June 2021; pp. 13656–13662. [Google Scholar]
- Xu, Q.; Zhong, Y.; Neumann, U. Behind the curtain: Learning occluded shapes for 3D object detection. Proc. AAAI Conf. Artif. Intell. 2022, 36, 2893–2901. [Google Scholar] [CrossRef] [Scilit]
- Wu, H.; Deng, J.; Wen, C.; Li, X.; Wang, C.; Li, J. CasA: A cascade attention network for 3-D object detection from LiDAR point clouds. IEEE Trans. Geosci. Remote Sens. 2022, 60, 1–11. [Google Scholar] [CrossRef] [Scilit]
- Liu, L.; Song, Z.; Xia, Q.; Jia, F.; Jia, C.; Yang, L.; Gong, Y.; Pan, H. Sparsedet: A simple and effective framework for fully sparse lidar-based 3D object detection. IEEE Trans. Geosci. Remote Sens. 2024, 62, 1–14. [Google Scholar] [CrossRef] [Scilit]
- Mushtaq, H.; Deng, X.; Jiang, P.; Wan, S.; Ali, M.; Ullah, I. GFA-SMT: Geometric Feature Aggregation and Self-Attention in a Multi-Head Transformer for 3D Object Detection in Autonomous Vehicles. IEEE Trans. Intell. Transp. Syst. 2024, 26, 3557–3573. [Google Scholar] [CrossRef] [Scilit]
- Chen, X.; Zhang, T.; Wang, Y.; Wang, Y.; Zhao, H. FUTR3D: A unified sensor fusion framework for 3D detection. In Proceedings of the IEEE/CVF Conference on Computer Vision and Pattern Recognition, Vancouver, BC, Canada, 17–24 June 2023; pp. 172–181. [Google Scholar]
- Zhu, H.; Deng, J.; Zhang, Y.; Ji, J.; Mao, Q.; Li, H.; Zhang, Y. VPFNet: Improving 3D object detection with virtual point based LiDAR and stereo data fusion. IEEE Trans. Multimed. 2022, 25, 5291–5304. [Google Scholar] [CrossRef] [Scilit]
- Wang, C.H.; Chen, H.W.; Chen, Y.; Hsiao, P.Y.; Fu, L.C. VoPiFNet: Voxel-pixel fusion network for multi-class 3D object detection. IEEE Trans. Intell. Transp. Syst. 2024, 25, 8527–8537. [Google Scholar] [CrossRef] [Scilit]

Disclaimer/Publisher’s Note: The statements, opinions and data contained in all publications are solely those of the individual author(s) and contributor(s) and not of MDPI and/or the editor(s). MDPI and/or the editor(s) disclaim responsibility for any injury to people or property resulting from any ideas, methods, instructions or products referred to in the content. |
© 2025 by the authors. Licensee MDPI, Basel, Switzerland. This article is an open access article distributed under the terms and conditions of the Creative Commons Attribution (CC BY) license.