


Abstract
The high accessibility and interconnectedness of social media platforms have led to their increasing exploitation as tools for criminal activity. A notable example of such digital sexual offenses is the “Nth Room” case, in which sexually exploitative content and illegal recordings were unlawfully distributed on platforms such as X, Telegram, and Discord. Despite amendments to legislations, including the Sexual Violence Punishment Act and Youth Protection Act, aimed at preventing the recurrence of incidents, these crimes continue to persist. Perpetrators employ tactics such as the repeated creation and deletion of accounts, which complicate efforts to track and apprehend them. Consequently, there is an urgent need to develop advanced cyber investigation technologies capable of effectively monitoring sexual crimes posted on social media. This study aimed to propose a novel cyber investigation technology designed to trace criminal organizations by collecting tweets related to sexual crimes from X, which is the most frequently used social media platform for such content in Korea, and subsequently constructing a knowledge graph. Slang terms commonly associated with sexual crimes on X were employed as search keywords to collect relevant tweets. The knowledge graph is then generated based on three key elements extracted from the tweets: hashtags, words, and URL/invite codes. This graph serves as a tool for tracking the criminal networks involved in the distribution of sexually exploitative content and unauthorized recordings. Furthermore, to enhance tracking efficiency, an optimization model was developed to generate knowledge graphs from various analytical perspectives. In this study, to evaluate the performance of the proposed technology, a dataset of 3387 tweets was collected using an X crawler. Knowledge graphs were generated and optimized through both single and combined analyses of the three key elements, demonstrating the effectiveness of the proposed technology in tracking criminal organizations engaged in sexual crimes.
1. Introduction
Social media platforms, such as X (formerly Twitter), Facebook, and Instagram, are widely used services where users can share information and opinions, thereby expanding their interpersonal networks. Although these platforms facilitate communication and information exchange among users with shared interests, thereby enhancing social connectivity, they are also vulnerable to exploitation for various criminal activities. Such activities include digital sex crimes, drug trafficking, personal information leaks, and dissemination of malicious software. Notably, digital sex crimes, in particular—such as the distribution of sexually exploitative content, illegal recordings, and advertisements for illegal prostitution—have persisted as a significant social issue since the “Nth Room” incident [1]. The “Nth Room” case serves as a prominent example of digital sex crime, where perpetrators used social media platforms like X to identify victims and subsequently lured them into using instant messaging services such as Telegram and Discord. In these instances, perpetrators coerced individuals into creating sexually exploitative content or illegally disseminating such content without consent. Despite the implementation of the “Nth Room Prevention Act,” which expanded the scope of penalties for online sex crime and required internet service providers to promptly remove sexually exploitative content and illegal recordings upon discovery, these crimes continue to persist. Criminals have developed methods to circumvent cyber investigation technologies, such as repeatedly creating and closing multiple accounts or exploiting legal loopholes to perpetuate the distribution of illicit content [2]. In particular, X, in comparison to other major social media platforms, has relatively lenient content regulations, resulting in a high prevalence of adult content—approximately 13% of all content posted on X falls into this category. This characteristic positions X as a significant platform for posts related to sexual crimes. Furthermore, X provides a conducive environment for the dissemination of digital sex crime content, such as illegal recordings, which can inflict considerable psychological and social harm on victims [3,4]. The incidence of online sex crimes has more than doubled in 2022 compared with previous years [5]. Previous studies have attempted to address the issue of digital sex crimes by collecting data through surface web and deep web crawling techniques. However, these approaches have limitations when applied to collecting digital sex crime data from social media platforms. Moreover, prior research has primarily analyzed trends in sex crimes rather than developing cyber investigation technologies to track actual criminal activities. In this study, we developed a crawling technique to collect sex crime data from X, a social media platform where such content is frequently posted. Additionally, we proposed a knowledge graph generation technique aimed at tracking criminal organizations based on the collected data. To collect relevant sex crime data, we used frequently used slang related to sex crimes on X as search keywords to identify relevant tweets. Additionally, we collected user information, such as account IDs, nicknames, and account creation dates. Subsequently, we performed a similarity analysis and knowledge modeling centered on three key elements from the tweets: text, hashtags, and URLs/invitation codes. This process facilitates the tracking of criminal activities and the creation of a knowledge graph that aids in identifying criminal organizations involved in sex crimes. To evaluate the performance of the proposed tracking method, we analyzed the collected tweets to identify criminal organizations and proposed optimization methods to enhance tracking efficiency based on the analysis results. By setting thresholds for individual elements among the three key elements of tweets, we tracked major criminal organizations from an optimized analytical perspective. Moreover, tracking performance can be further improved through the integration of multiple elements.
This paper is organized as follows: Section 2 reviews current research trends in social media crawling and the utilization of knowledge graphs. Section 3 describes the development of the proposed crawling technology for collecting sexual crime data from X and the techniques employed to generate knowledge graphs to track criminal networks. In Section 4, we apply the proposed technology to collect actual tweets related to sexual crimes and analyze the results of tracking criminal networks based on the generated knowledge graphs. Section 5 presents the development of a model aimed at enhancing the efficiency of tracking criminal networks on X, including an analysis of the model’s optimization results for practical applications in cyber investigations. Additionally, Section 6 evaluates the tracking results of criminal networks using the combined optimized models. Finally, Section 7 presents the conclusions of the study and suggests directions for future research.
2. Related Research
2.1. Cyber Investigation Research Based on Crime Crawling in Social Media
Crawling refers to the act of systematically collecting and analyzing publicly available data from websites or social media platforms. It is primarily used to gather and analyze information on political and social issues, such as presidential candidates and COVID-19, from social media. However, the high accessibility and anonymity by social media platforms also enable cybercriminals to post tweets related to criminal activities. This underscores the need for research into advanced crawling techniques specifically designed to detect and prevent crimes on social media.
Among the various types of crimes on social media, research on sexual crimes includes studies that have focused on collecting tweets containing keywords related to the sexual exploitation of minors on X. These studies employed machine learning algorithms, such as support vector machines (SVM) and naive Bayes, to identify tweets associated with minor sexual exploitation [6]. Another study involved collecting tweets containing obscene content on X, performing text analysis using term frequency-inverse document frequency (TF-IDF), and identifying tweets with obscene content through the application of SVM and naive Bayes algorithms [7].
In the context of drug-related crimes, research has been conducted to collect user accounts and tweets related to illegal drugs on X. This research identified drug-related accounts using n-gram-based preprocessing and a logistic regression (LR) model [8]. Additionally, another study focused on tweets containing drug prescription abuse on X, analyzing the diffusion patterns of these tweets through social network analysis and machine learning techniques [9].
Regarding financial fraud, studies have involved the collection of phishing data from various social media platforms, including X, Facebook, and Instagram. These studies employed social network analysis and machine learning techniques to detect phishing attacks [10]. Additional research focused on collecting tweets containing scam-related keywords on X and identifying scam tweets using text mining techniques [11]. Additionally, images such as credit card logos, ISIS logos, and Guy Fawkes masks were collected from X and Facebook, and crime-related images were identified through training with a convolutional neural network (CNN) [12].
Furthermore, research on crime-related crawling has addressed various other aspects. For instance, a previous study integrated weather data with sentiment analysis of positive and negative emotions collected from X to predict the likelihood of theft incidents [13]. Another study analyzed the fuzzy relationships between cyber-terror keywords collected from X to identify key community users [14]. Further research has focused on detecting early signs of organized human trafficking by collecting publicly available data from the web and social media using formal concept analysis and natural language processing (NLP) [15]. Additionally, previous studies have collected data related to scams, hacking, and cybercrimes on X, and they analyzed the primary tactics of these cybercrimes using techniques such as TF-IDF, multinomial naive Bayes (MNB), SVM, and K-nearest neighbors (KNN) [16]. Additionally, research has identified influential users by collecting data containing keywords related to illegal transactions, including human trafficking, drug trafficking, and arms trafficking in cyberspace, utilizing sentiment analysis and social network analysis [17].
To address the challenge of identifying organized criminal accounts rather than isolated posts, recent work has focused on fraudulent account detection in social media by integrating deep learning architectures with hyperparameter optimization. For example, some studies have proposed hybrid transformer-based models that combine temporal convolutional networks, generative adversarial network-based data augmentation, and autoencoder-based dimensionality reduction to handle high-dimensional and highly imbalanced behavioral data, while meta-heuristic optimizers are employed to tune key hyperparameters [18]. These approaches have achieved high ROC–AUC and F1-scores on benchmark datasets, demonstrating the potential for automated account-level detection that complements our graph-based organizational tracking approach.
Building on traditional machine learning approaches, large language models (LLMs) have increasingly been employed to analyze unstructured data in security- and harm-related domains. Recent surveys have shown that LLMs can be integrated with static and dynamic analysis pipelines to support vulnerability detection, malware analysis, and hybrid reasoning over complex code-level representations [19]. More relevant to social media crime detection, LLM-based encoders combined with gradient-boosting classifiers have been applied to counseling and abuse-related text data, achieving competitive accuracy and F1-scores in the early detection of child abuse cases [20]. These advances suggest that future extensions of our knowledge graph framework could incorporate LLM-based text analysis to enhance the semantic understanding of criminal content patterns beyond keyword matching and structural analysis.
Although traditional research on crime-related crawling—including recent advances in LLM-based analysis and deep learning fraud detection—primarily emphasizes classifying collected data or accounts as criminal in nature, this study differentiates itself by developing techniques to identify and track criminal organizations through the analysis of relational patterns within the collected data.
2.2. Research on Knowledge Graph-Based Data Analysis
A knowledge graph is a visual representation that illustrates the relationships between entities or links in a knowledge base. Research involving knowledge graphs typically aims to construct these graphs to facilitate search and query functions, perform network analysis based on text mining, and perform detection and prediction tasks. For example, some studies have constructed knowledge graphs to support information retrieval and query processes. Notable examples include a study that developed a programming knowledge graph using educational data to assist students in programming education [21]. Another study developed a knowledge graph that integrates medical knowledge on public health to provide comprehensive public health information [22]. A previous study developed a research project knowledge graph using data on university researchers and their projects to create a query system for networks, organizations, keywords, and research interests [23]. Additionally, another study employed BibTex metadata to build a book recommendation knowledge graph, which led to the development of a system for recommending books to users based on authors and book types [24].
Some studies have focused on constructing knowledge graphs to perform text mining-based network analysis. For example, one study developed a knowledge graph that includes four biological components—genes, proteins, domains, and diseases—and employed degree centrality to identify influential domain nodes [25]. Another study constructed a knowledge graph to map mention relationships among X users and analyzed user influence through degree and closeness centrality measures [26].
Other studies have employed knowledge graphs for detection and prediction tasks. For example, one study used human trafficking data to calculate the similarity between image and text data, identify common entities, and detect human trafficking communities using a knowledge graph [27]. Another study constructed a knowledge graph from global terrorism data and employed machine learning techniques to predict terrorist attacks [28]. In the field of financial crime, research has employed knowledge graphs based on phone numbers, IDs, and bank account data to aid criminal investigations [29]. Similarly, a knowledge graph derived from call data record data, which included text and call information, was used to identify perpetrators of financial crimes [30]. Further research developed a knowledge graph using bank transaction data and analyzed key patterns of bank fraud using community detection algorithms [31]. Finally, a study gathered data with money laundering keywords from Tencent QQ, analyzed the behavioral patterns and community structures of malicious accounts through clustering, and detected these accounts using SVM, LR, and random forest models [32].
Beyond social media analytics, research on secure data management in large-scale IoT environments has explored blockchain-enabled architectures for trustworthy storage and sharing of sensitive information. Some studies have proposed decentralized storage layers that employ practical Byzantine fault tolerance–based consensus and reputation-driven mechanisms to guarantee data integrity, accountability, and controlled access without relying on a centralized auditor [33]. While these approaches primarily target IoT and cloud services, the principles of secure, auditable data storage are equally critical when managing evidential data extracted from criminal investigations on social media platforms. Our knowledge graph-based system similarly requires robust data integrity and privacy-preserving mechanisms to ensure that collected evidence remains tamper-proof and admissible for law enforcement purposes.
Traditionally, research on knowledge graphs has primarily focused on educational, social, and medical data rather than criminal data. In the field of criminal investigation, studies have primarily used surface web data or public datasets. Furthermore, studies involving social media data have mainly focused on analyzing crime patterns or identifying criminal accounts through data analysis for knowledge graph construction. While recent advances in LLMs, deep learning-based fraud detection, and secure data management provide valuable tools for processing criminal data, these approaches typically operate at the individual post or account level. In contrast, this study uniquely focuses on tracking criminal organizations through network-level analysis. We propose techniques for knowledge graph analysis and optimization that identify criminal organizations by analyzing tweets related to sexual crimes on social media platform X. By examining details from tweet authors and content elements, our approach reveals the structural connections between seemingly independent accounts and activities, enabling investigators to understand the organizational structure behind distributed criminal operations.
3. Design of a Sexual Crime Tweet Crawler and Knowledge Graph
In this section, we analyze the elements that can be collected from X to design a tweet crawler intended for generating a knowledge graph to track sexual crimes. We then proceed with modeling to create a knowledge graph using the designed crawler.
3.1. Design of the Sexual Crime Tweet Crawler
To track criminal organizations involved in sexual crimes on X, it is important to identify accounts and tweets associated with similar criminal activities by crawling X. In this study, we developed a crawler using the X API to collect user account information and tweet data, as depicted in Table 1.
Table 1.
Crawling Elements for Tracking Criminal Organization on X.
The similarity between accounts can be evaluated by analyzing user account information, including ID, nickname, account creation date, and profile description. In addition, the similarity of criminal activities can be evaluated by analyzing tweet data. Among the elements crawled from X, the tweet content includes three key elements essential for tracking criminal organizations, as depicted in Table 2.
Table 2.
Three Key Elements for Tracking Criminal Organizations.
A hashtag is an element included in tweets to increase the visibility of content related to sexual crime to users. The word element consists of segments within a tweet, typically individual words or phrases, which are used for distributing sexually exploitative content or advertising illegal prostitution. URLs and invitation codes pertain to open chatroom addresses and user accounts on instant messaging services such as Telegram, Discord, Line, and KakaoTalk, which are used to attract users to these platforms.
In this study, the words, hashtags, and URLs/invitation codes included in tweets are defined as the three crucial elements for tracking criminal organizations involved in sexual crimes. The knowledge graph created in this research is structured around these elements to trace similar criminal activities.
3.2. Knowledge Graph Modeling for Tracking Sexual Crimes
To effectively employ user account information and tweet data collected from X to track criminal organizations involved in sexual crimes, it is essential to first accumulate and process the collected data as knowledge. Then, a knowledge graph must be created to systematically convey the analysis results, thereby enabling effective planning of tracking strategies.
A knowledge graph represents knowledge through vertices, which denote entities, and edges, which illustrate the connections between these entities. In this study, we created a knowledge graph by representing each crawling element from Table 1 as a vertex, thereby illustrating the connections between sexual crime-related accounts and tweets.
Table 3 presents the crawling elements represented as vertices in the knowledge graph for tracking criminal organizations involved in sexual crimes.
Table 3.
Definition of the Five Types of Vertices in the Knowledge Graph for Tracking Criminal Organizations.
represents a tweet object posted by a user, which may involve activities such as the distribution of sexually exploitative content or the advertisement of illegal prostitution. represents the user object that authored tweets related to sexual crimes. is a shared object category for hashtags, words, and URLs/invitation codes included in tweets, which are further represented by , , and . represents a vertex representing hashtags included in tweets that increase the exposure of sexual crime-related content. represents individual words in the tweets, which are segmented into units using a morphological analyzer, and signifies a vertex representing open chatroom addresses and account IDs, which are used to attract users to instant messaging platforms, such as Telegram, Discord, and KakaoTalk. Each vertex in the knowledge graph can have properties that provide specific information about the entity it represents. In this study, we defined the properties for the five vertices as listed in Table 4.
Table 4.
Property Definitions by Vertex Type in the Knowledge Graph for Tracking Criminal Organizations.
To illustrate the relationships between the five vertices in the knowledge graph used for tracking sexual crimes, this study defines two types of edges, as outlined in Table 5.
Table 5.
Definition of the Two Types of Edges in the Knowledge Graph for Tracking Criminal Organizations.
The mathematical formula for depicting the knowledge graph, designed to track criminal organizations involved in sexual crimes using the previously defined vertices and edges, is presented in Equation (1).
Equation (1). Definition of the Knowledge Graph G for Tracking Criminal Organizations.
Given that the knowledge graph for tracking criminal organizations involved in sexual crimes is based on tweets collected using sexual crime-related slang as search keywords on X, it must contain at least one and the corresponding who posted it. Additionally, as each collected tweet includes at least one of the search keywords—whether in the form of a hashtag, word, URL, or invitation code—the knowledge graph must contain at least one , , or . To illustrate the process of generating the knowledge graph, Table 6 presents Group A, which comprises two words and one URL or invitation code centered around , and Group B, which comprises two words and one hashtag centered around .
Table 6.
Example of Sexual Crime Tweet Data.
The who posted the establishes an relationship with the , while the hashtags, words, URLs, and invitation codes contained in the tweet create an relationship between and , , or . The knowledge graph generated based on Table 6 is illustrated in Figure 1.
Figure 1.
Example of modeling a knowledge graph for sexual crime. * Parts of the domain or identifier are anonymized to protect sensitive information.
When expressed as a knowledge graph as defined in this paper, the result is given in Equation (2).
Equation (2). Definition of the Knowledge Graph G for Figure 1.
4. Crawling of Sexual Crime Tweets and Knowledge Graph Generation
In this section, we use the tweet crawler and criminal organization tracking graph designed in Section 3 to gather actual tweets. These tweets are then stored and processed within a Neo4j-based graph database management system to generate a knowledge graph to track sexual crimes. Neo4j, with its data model comprising nodes, relationships, and properties, provides functionalities that enable efficient storage and querying of complex relational data. These capabilities are especially useful for analyzing social network data, such as Twitter, and monitoring user behavioral patterns related to sexual crimes [34].
4.1. Crawling Sexual Crime Tweets
To gather tweets related to the distribution of sexually exploitative content, advertisements for prostitution, and other sexual crimes, it is imperative to choose various slang terms as search keywords.
In this study, six representative slang terms commonly used on X for distributing sexually exploitative material were selected: “kw1”, “kw2”, “kw3”, and “kw4” in Appendix A which are associated with the distribution of such content, and “kw5” and “kw6”, which are used to attract users to instant messaging platforms such as Telegram for the dissemination of sexually exploitative material. Tweets were collected from 13 August to 17 August 2023, using these six terms, resulting in a total of 3387 tweets, as detailed in Table 7.
Table 7.
Number of Crawling Elements Collected by Search Keywords.
All collected data consisted of publicly posted tweets accessible through X’s standard API without authentication requirements. To protect user privacy, all account identifiers (IDs, nicknames) presented in this manuscript are partially masked using asterisks (e.g., ‘k*****6′). No direct messages, private account content, or personal identifiable information (PII) beyond public usernames were accessed. Tweet content containing URLs and invitation codes was analyzed solely for structural patterns rather than individual victim identification.
Data collection was conducted in accordance with X’s Developer Agreement and Policy, which permits academic research use of publicly available data. The study focuses on criminal actor behavior patterns rather than content distribution or victim identification, aligning with platform policies prohibiting abuse while allowing legitimate research. Collection was limited to the aforementioned 5-day window to minimize data retention and focused exclusively on accounts actively promoting illegal content through public advertising behavior.
As some users posted multiple tweets, the number of distinct users is lower than the total number of tweets. Additionally, the similarity in the number of hashtags and words included in the tweets indicates that tweet authors often include hashtags to maximize their visibility. Many tweets are composed entirely of hashtags. URLs and invitation codes, which are employed to attract users to instant messaging services, appear less frequently in tweets—typically appearing 0–2 times per tweet—resulting in a lower overall count compared to hashtags and words.
Table 8 displays the top 10 most frequently occurring hashtags, words, and URLs/invitation codes found in the collected tweets.
Table 8.
Top 10 Most Frequent Hashtags, Words, URLs/Invitation Codes.
Among the hashtags, terms such as “kw7”, “kw9”, and “kw10” were frequently found in tweets related to sexual crimes, even though they were not part of the original search keywords. This suggests that additional key terms for identifying sexual crime tweets can be discovered via crawling. Regarding words, terms such as “kw3”, “kw1”, “kw14”, and “kw8”, which are related to sexual crimes, appeared frequently, along with terms such as “kw15”, “kw20”, and “kw19”, which are associated with instant messaging services. The collected tweets also included account and website address information used to attract users to instant messaging services. Among the top 10 entries, 9 were LINE accounts and 1 was Telegram’s open chatroom address.
By examining the hashtags, words, and URLs/invitation codes found in the collected tweets, it is possible to identify user accounts suspected of belonging to the same criminal organization. In this study, we created a knowledge graph to track criminal organizations involved in sexual crimes on X using this data.
4.2. Generation and Analysis of a Knowledge Graph for Tracking Sexual Crimes
In this study, we created a knowledge graph focused on objects, which encompass hashtags, words, and URLs/invitation codes, as defined in Section 3. This knowledge graph is utilized to cluster tweets and identify criminal organizations involved in sexual crimes.
4.2.1. Clustering Tweets Based on
The knowledge graph created around examines the hashtags in tweets and clusters those that share the same hashtags, thus identifying tweets associated with the same organization. Figure 2 displays the knowledge graph formed from the collected tweets centered on , revealing a distinct division into two main sections, labeled as Section A and Section B.
Figure 2.
—Centered knowledge graph for tracking criminal organizations.
Section A presents a region rich in tweets relevant to tracking criminal organizations, with clusters emerging around the most frequently used hashtags, as illustrated in Table 8. For example, Cluster 1 in Section A is formed around hashtags such as “kw2” and “kw9” and is connected to Cluster 2, which is centered around hashtags like “kw7” and “kw1”. These connections extend into larger, higher-level clusters within Section A. Conversely, Section B comprises clusters in which tweets either lack hashtags or are centered around hashtags unrelated to sexual crimes. Although the content of these tweets includes keywords related to sexual crimes, the hashtags do not reflect this nature. For instance, Cluster 3 in Section B is formed around celebrity-related hashtags such as “kw21”, “kw22”, and kw23”. Although these tweets are not directly related to sexual crimes, they were collected due to the inclusion of sexual crime-related keywords such as “kw3” in their content.
4.2.2. Clustering Tweets Based on
The knowledge graph centered around focuses on the words used within the tweet content, forming clusters based on the occurrence of the same words. This method helps identify tweets that are likely associated with the same organization. Figure 3 shows the knowledge graph generated using from the collected tweets. Similar to Figure 2, this graph is divided into two sections, Section A and Section B.
Figure 3.
-Centered knowledge graph for tracking criminal organizations.
Section A contains tweet clusters formed based on the most frequently occurring words listed in Table 8. For example, Cluster 1 is centered around high-frequency words such as “kw8” and “kw14”. A single tweet can contain multiple words; thus, tweets that include frequently occurring words like “kw3” and “kw19” are clustered together, creating larger, higher-level clusters in Section A. Section B contains clusters in which sexual crime-related keywords appear only in hashtags and not in the main tweet content. Alternatively, these clusters may form when part of a specific word in the tweet content matches a sexual crime keyword, leading to its collection. For instance, Cluster 2 in Section B comprises tweets that contain only high-frequency hashtags like “kw7” and “kw3”, with no corresponding words in the tweet content. Therefore, these clusters are composed solely of and , with no present.
4.2.3. Clustering Tweets Based on
The knowledge graph centered around focuses on clustering tweets that share the same URL and invitation codes, enabling the identification of the same organization. Figure 4 shows the knowledge graph generated from the collected tweets centered around the . This graph is divided into two sections: Section A contains clusters in which multiple tweets distribute the same URL or invitation code, forming clusters that are significant for tracking sexual crimes, and Section B contains clusters that are less meaningful for tracking purposes. These clusters form when only a few tweets distribute specific URLs or invitation codes or when there is an absence of altogether.
Figure 4.
-Centered knowledge graph for tracking criminal organizations.
Cluster 1 in Section A is formed around the most frequently occurring URL and invitation code, specifically the LINE invitation code “k***8”, as listed in Table 8. An analysis of the 126 tweets associated with “k***8” revealed that these tweets were connected to only 19 unique user nicknames. This indicates that, despite the involvement of 126 different X accounts in disseminating the LINE invitation code “k***8”, these accounts are likely operated by the same individual or organization.
4.2.4. Limitations of the Knowledge Graph for Tracking Criminal Organizations Involved in Sexual Crimes
The collection of actual sexual crime-related tweets demonstrated the effectiveness of knowledge graphs generated around , , and for tracking criminal organizations, as confirmed through graph analysis. However, as observed in Section B of Figure 2, Figure 3 and Figure 4, these graphs also contain clusters that lack substantive significance. Such occurrences occur when the central vertices contain insufficient data or when the number of tweet vertices connected to the central vertices is limited, resulting in a relative lack of useful information for tracking purposes. Therefore, it is important to optimize the knowledge graph generation process by extracting valuable information from the collected sexual crime tweets. In this study, we have developed an optimization model aimed at selecting key vertices that are essential for effective tracking during the knowledge graph generation stage.
4.3. Manual Labeling for Ground-Truth Construction
To quantitatively evaluate the performance of the proposed tracking method and validate the optimized knowledge graph, we established a ground-truth dataset of criminal organizations. Since no public dataset exists for sexual offenses on social media due to privacy and legal constraints, we performed a rigorous manual labeling process on the collected corpus of 3387 tweets. This process followed a two-stage hierarchical protocol designed to combine objective identifiers with contextual pattern analysis.
In the first stage, we formed initial clusters using explicit linkage evidence derived from the crawler’s key elements. Tweets were automatically grouped if they shared identical external contact points, specifically URLs or invitation codes for instant messaging platforms (e.g., Telegram, LINE, Discord). This grouping relies on the assumption that tweets advertising the exact same access channel originate from the same underlying organization. Additionally, all tweets posted by the same unique user account were aggregated into single user-centric groups. This stage produced a baseline set of clusters based on undeniable direct connections.
Subsequently, in the second stage, we manually inspected the initial clusters to identify and merge fragmented clusters belonging to the same criminal organization. To facilitate this inspection, we visualized the network using a Force-Directed Layout algorithm, which naturally positioned related clusters in close proximity based on their interaction density. This heuristic refinement addresses cases where a single organization operates multiple accounts or utilizes different URLs to evade detection. Two researchers independently examined the clusters based on five heuristic criteria: (i) hashtag sequences, which involve the similarity in the combination and ordering of hashtags ; (ii) lexical and syntactic patterns, such as the usage of distinctive vocabulary or identical sentence templates; (iii) account naming conventions, focusing on systematic patterns in user nicknames or IDs (e.g., sequential naming); (iv) temporal synchronization, where tweets appear in bursts across different accounts within short time windows ; and (v) multimedia and content consistency, such as the reuse of identical promotional images. Clusters exhibiting strong evidence of organizational continuity based on these criteria were merged. Any disagreements during the labeling process were resolved through cross-verification to minimize subjectivity.
Through this procedure, we finalized the ground-truth dataset, distinguishing independent criminal organizations from individual activities. The statistical summary of the constructed ground-truth dataset is presented in Table 9.
Table 9.
Statistical Summary of Ground-Truth Dataset by Organization Size.
As presented in Table 9, a total of 205 criminal organization clusters were identified through manual labeling. These comprise 6 large-scale organizations (50 or more tweets), 26 medium-scale organizations (10–49 tweets), and 173 small-scale organizations (2–9 tweets). Additionally, 1187 tweets were classified as individual activities, as no evidence of organized behavior was identified. Although large-scale organizations account for only approximately 2.9% of all identified clusters, they represent 50.5% (1029 tweets) of the total tweets attributed to organizations. This disparity suggests that a small number of large-scale entities play a central role in the dissemination of sexual crime-related content.
Notably, the average number of hashtags per tweet was highest for medium-scale organizations at 11.86, indicating that these groups adopt intensive hashtag utilization strategies to maximize content exposure. In contrast, large-scale organizations exhibited a relatively lower average of 5.36 hashtags per tweet. This can be attributed to their established networks and follower bases, which allow for effective content dissemination without heavy reliance on keyword flooding. Regarding word usage, medium-scale organizations demonstrated the highest average of 10.13 words per tweet, followed by small-scale organizations (8.70) and large-scale organizations (4.80). This pattern suggests that large-scale organizations tend to rely more on hashtag-driven propagation with minimal textual content, whereas medium-scale organizations employ more text-rich strategies to attract users.
5. Design of an Optimization Model for the Knowledge Graph in Tracking Criminal Organizations Involved in Sexual Crimes
In this section, we developed an optimization model by performing property and relationship filtering centered on , , and . The objective is to generate and validate an optimized knowledge graph that enhances the effectiveness of tracking criminal organizations involved in sexual crimes.
5.1. Knowledge Graph Optimization Model
To improve the efficiency of tracking criminal organizations involved in sexual crimes on X, it is essential to create an optimized knowledge graph that can extract meaningful information based on . In this study, we introduce four types of filters—, , , and —to develop this optimized knowledge graph. The implementation of this optimization model was executed using Neo4j Cypher queries. The mathematical definitions and operational principles for each filter are defined as follows. Complete Neo4j Cypher implementations, including graph schema definitions and executable query templates for all four filters, are provided in Appendix B for reproducibility.
is a filter that selects from the knowledge graph , as detailed in Section 4, where the number of connected to surpasses a specified . The filtered knowledge graph is then generated as defined in Equation (3).
Equation (3). Definition of Knowledge Graph .
is a filter designed to examine the unique slang used by criminal organizations by treating the most frequently occurring , such as “kw7” and “kw2”, as stop words. This filter enhances by eliminating and the edges (, ) associated with these terms, leading to the generation of , as defined in Equation (4).
Equation (4). Definition of Knowledge Graph .
Filter operates under the assumption that tweets distributed by the same criminal organization will demonstrate a high degree of content similarity. This filter examines the similarity of content across all tweets and selects those tweets that demonstrate a high degree of similarity with multiple other tweets. As described in Equation (5), for each in , the set of relationships between and is generated, and the similarity between these sets is measured using Jaccard similarity. Tweet pairs with a similarity score exceeding are selected and compiled into . Subsequently, tweets within that appear in pairs equal to or exceeding are selected and considered as tweets likely posted by the criminal organization, resulting in the generation of .
Equation (5). Definition of Knowledge Graph .
Filter is intended to refine the URLs and invitation codes distributed by criminal organizations or individuals within the knowledge graph , as developed in Section 4. This filter identifies , where the number of connected surpasses a specific , resulting in the formation of , as defined in Equation (6).
Equation (6). Definition of Knowledge Graph .
The four proposed types of filters are used to identify highly significant tweets within the knowledge graph . As shown in Figure 5, various filters are applied based on the used as the selection criterion.
Figure 5.
Optimization model centered on , , and .
The in Filters , , and , as well as and in , serve as benchmark values for selecting tweets of high importance. The creation of , , , and relies on these predefined . Hence, it is essential to analyze different values to determine the optimal criteria for tracking the same criminal organization.
5.2. Analysis of the Filtering-Based Optimization Model
In this section, we present the values for each filter in the proposed optimization model aimed at tracking the same criminal organization, with the goal of establishing the optimal criteria. As detailed in Table 10, the levels are categorized into low, mid, and high. Increasing the allows the optimization model to select tweets of greater importance within the knowledge graph. This enhances the clarity of cluster boundaries in the knowledge graph, thereby improving the efficiency of tracking the same criminal organization. However, setting the higher than the maximum values specified in Table 10 may lead to excessive filtering of tweets, which may result in the failure to form meaningful clusters.
Table 10.
for Each Optimization Model.
Using the detailed in Table 10, this study aims to derive the optimal values that enhance the tracking efficiency of the knowledge graph centered around .
5.2.1. Optimization Model for the Knowledge Graph Centered on Hashtags
To propose the optimal combination of Filters , , and for enhancing the tracking efficiency of criminal organizations based on , this study sequentially derives the optimal for , , and in a three-step process. Step 1 involves determining the optimal for by generating the knowledge graph based on the number of connected to in the knowledge graph . As shown in Table 10, the is set to 1, 3, and 5. The final knowledge graph , generated using these settings, is compared and examined. A of 1 includes all tweets with at least one hashtag in the knowledge graph , whereas a of 5 includes only those tweets that contain five or more hashtags. Step 2 focuses on deriving the optimal for , which filters out common hashtags such as “kw7” and “kw2” based on their frequency in sexual crime-related tweets. As depicted in Table 10, the is set to 0, 5, 10, and 15. The knowledge graph is generated accordingly, where a of 0 means that even the most frequent hashtags are not filtered out, whereas a of 15 filters out the top 15 most frequent hashtags from the knowledge graph . Finally, Step 3 focuses on finding the optimal for , which evaluates the similarity between hashtags in tweets and clusters those with high similarity into a single criminal organization cluster. This step is divided into two sub-steps. Step 3-(a) derives the optimal , and Step 3-(b) determines the optimal . In Step 3-(a), the values for are set to 0.7, 0.8, and 0.9, and the knowledge graph is generated based on , which selects tweet pairs with 70%, 80%, or 90% similarity in hashtag composition, and then compared and analyzed. In Step 3-(b), is set to values of 1, 5, and 10, and the knowledge graphs generated are then compared and analyzed with respect to the selection of tweets featuring similar hashtag compositions. Ultimately, by applying the optimal for , , and , which are derived through these three steps, it is possible to generate an optimal knowledge graph, denoted as . The resulting from this optimization process is advantageous as it effectively delineates the boundaries of criminal organization clusters while minimizing over-filtering, thus resulting in a knowledge graph with minimal clustering errors. The process of determining the optimal for in Step 1 is shown in Figure 6.
Figure 6.
Scenario for determining the optimal in a -centered knowledge graph.
To focus on the changes in the knowledge graph resulting from variations in the , it is necessary to fix the for and at specific values. As shown in Figure 7, when the for and are fixed at their minimum values, the knowledge graph hardly changes even in different settings. Therefore, in this study, the for and , as depicted in Figure 6, are set to their maximum values to accurately determine the optimal .
Figure 7.
Scenario applying the minimum to determine the optimal in a -centered knowledge graph—(a) = 1, (b) = 3, (c) = 5.
The final knowledge graph generated with set to 1, 3, and 5, respectively, is shown in Figure 8.
Figure 8.
Scenario for determining the optimal in a -centered knowledge graph—(a) = 1, (b) = 3, (c) = 5.
In Figure 8a, where all containing at least one hashtag are included, the knowledge graph may contain a substantial number of tweets that, whereas using hashtags common to sexual crime clusters, are not necessarily related to sexual crimes. As shown in Figure 8b,c, increasing the allows for the exclusion of unrelated tweets, thereby refining the focus on those specifically related to sexual crimes. However, setting the excessively high, as demonstrated in Figure 8c, with a of 5, can lead to the removal of clusters that use 3 or 4 hashtags. Clusters 1 through 8 in Figure 8a,b, which include tweets with 3 or 4 hashtags, are eliminated in Figure 8c, resulting in a knowledge graph that is less effective for crime tracking. Thus, the optimal for generating is determined to be 3, as applied in Figure 8b.
Table 11 presents the quantitative analysis results regarding variations in the . As the increased from 1 to 3, the minimum cluster size rose from 1 to 10. This quantitatively supports the finding that tweets unrelated to sexual crimes were effectively filtered, as visually observed in Figure 8a. Conversely, when the was set to 5, the number of tweets decreased by 23.7% (from 649 to 495) compared to 3. This quantitative decline confirms the omission of clusters 1–8, which was previously observed in Figure 8c.
Table 11.
Quantitative Analysis of Clustering Results by in -Centered Knowledge Graph.
In Step 2, as illustrated in Figure 9, following the determination of the as 3 from Step 1, the optimal is determined. The is again set to its maximum value, in which is consistent with Step 1.
Figure 9.
Scenario for determining the optimal in a -centered knowledge graph.
Figure 10 shows the knowledge graph generated for various values.
Figure 10.
Scenario for determining the optimal in a -centered knowledge graph—(a) = 0, (b) = 5, (c) = 10, (d) = 15.
In Figure 10a, the knowledge graph is generated without filtering any of the most frequently used hashtags related to sexual crimes, leading to the formation of a single large cluster in Section A. This outcome is due to the inclusion of common sexual crime-related slang, such as “kw7”, “kw9”, and “kw2”, as hashtags in most sexual crime-related tweets. Figure 10b displays the knowledge graph after filtering out the top 5 most frequent hashtags. This filtering results in the large cluster in Section A being divided into several smaller clusters. Figure 10c extends this filtering to the top 10 most frequent hashtags, thereby clarifying the boundaries between clusters in Sections B and C, which were less distinct in Figure 10b. Analysis of clusters 1, 2, and 3 in Section B reveals that these clusters not only exhibit similar patterns of such as “kw24”, “kw25”, and “kw26”, but also share many common under , such as “kw27”, “kw28”, and “kw29”. This suggests that clusters 1, 2, and 3 are likely related and may represent tweets from the same criminal organization. Furthermore, in clusters 4 and 5 of Section C, the presence of identical strongly suggests that these clusters comprise tweets from the same organization. Figure 10d, which filters out the top 15 most frequent hashtags, shows that while clusters in Sections B and C are even more distinctly separated than in Figure 10c, the removal of mediating hashtags in clusters 2 and 5 leads to a loss of connectivity with adjacent clusters. This disconnection can result in the misidentification of adjacent clusters that were previously thought to be related, thereby diminishing their effectiveness as indicators in criminal tracking. Hence, Figure 10c is more appropriate as a knowledge graph for crime tracking purposes. Therefore, this study determines that a value of 10 is optimal for , and is generated based on this value.
The quantitative results in Table 12 complement this visual analysis. As the increases from 10 to 15, the filter—designed to remove high-frequency hashtags—becomes more lenient, leading to an increase in the total number of tweets from 617 to 649. At 10, the average number of hashtags per tweet decreased to 5.83, while the minimum cluster size was maintained at 10. This quantitatively supports the clarification of cluster boundaries observed in Sections B and C of Figure 10c.
Table 12.
Quantitative Analysis of Clustering Results by in -Centered Knowledge Graph.
Step 3 comprises two sub-steps: Step 3-(a), which seeks to identify the optimal , and Step 3-(b), which aims to determine the optimal . In Step 3-(a), as depicted in Figure 11, the optimal for is established by measuring the similarity of hashtags using Jaccard similarity to generate the set of tweet pairs .
Figure 11.
Scenario for determining the optimal in a -centered knowledge graph.
Figure 12 illustrates the knowledge graph generated according to different values for the filter.
Figure 12.
Scenario for determining the optimal in a -centered knowledge graph—(a) = 0.7, (b) = 0.8, (c) = 0.9.
In Figure 12, Figure 12a,b illustrate the knowledge graphs created by setting the to 0.7 and 0.8, respectively. In Figure 12b, the A region observed in Figure 12a is divided into three smaller clusters. A detailed analysis of each cluster reveals that they consist of tweets containing identical and , indicating that these clusters are related. In Figure 12c, where is set to 0.9, clusters 5, 6, and 7 are formed similarly to those in Figure 12b. Nevertheless, setting too high leads to excessive filtering of from the knowledge graph, which proves problematic. Consequently, clusters 1, 2, 3, and 4, which were present in Figure 12a,b, are excluded in Figure 12c, reducing the graph’s effectiveness for tracking criminal organizations. Therefore, this study concludes that the optimal value is 0.8.
As shown in Table 13, when was set to 0.9, the number of clusters decreased to 20, and the average cluster size increased to 30.85. This corresponds to the exclusion of clusters 1, 2, 3, and 4, as observed in Figure 12c. At 0.8, a balance between the number of clusters (23) and average cluster size (27.30) was maintained, quantitatively confirming that both comprehensiveness and precision in criminal organization tracking can be achieved simultaneously.
Table 13.
Quantitative Analysis of Clustering Results by in -Centered Knowledge Graph.
In Step 3-(b), as depicted in Figure 13, the optimal is determined by identifying tweet clusters with similar hashtag compositions, using the optimal derived in the previous steps.
Figure 13.
Scenario for determining the optimal in a -centered knowledge graph.
Figure 14 shows the knowledge graph generated using different values for the filter.
Figure 14.
Scenario for determining the optimal in a -centered knowledge graph—(a) = 1, (b) = 5, (c) = 10.
In Figure 14, Figure 14a–c denote knowledge graphs where is selected based on the number of times it appears in , which comprises tweet pairs with a hashtag similarity exceeding . Specifically, these parts correspond to selections, where appears at least 1, 5, and 10 times. In Section A, Figure 14a displays a single large cluster, whereas Figure 14c depicts three smaller clusters. Figure 14b shows an intermediate result where the cluster size in Section A is reduced compared to Figure 14a, but lower-level clusters that could help identify the same organization are not formed, as seen in Figure 14c. Thus, for Section A, a of 10 or higher, as depicted in Figure 14c, is deemed optimal for effective crime tracking. In Section B, Figure 14a forms a single large cluster, making it challenging to distinguish the same organization. Conversely, Figure 14b,c clearly define sub-clusters. However, in Figure 14c, applying a high excludes too many , causing the disappearance of clusters identified in Figure 14b. Therefore, for Section B, a of 5 or higher, as depicted in Figure 14b, is deemed optimal for the knowledge graph. In summary, setting the slightly higher, as in Figure 14b,c, is more effective in filtering out unnecessary individuals or small organizations compared to the lower setting in Figure 14a. However, an excessively high may also filter out medium-sized criminal organizations, thereby eliminating valuable clues for crime tracking. Therefore, setting an appropriate is crucial and should be based on the analytical perspective.
Table 14 illustrates the changes in clustering characteristics according to variations in . At 1, 115 clusters were formed, including many representing individual-level activities. In contrast, at 10, the number of clusters converged to 23, with the minimum cluster size rising to 5. In the visual analysis of Figure 14, 10 was determined to be appropriate for Section A, while 5 was deemed suitable for Section B. Table 14 quantitatively confirms that at 5, the minimum cluster size remains at 1, which enables the inclusion of small- to medium-scale organizations that might otherwise be filtered out.
Table 14.
Quantitative Analysis of Clustering Results by in -Centered Knowledge Graph.
The optimal for each filter, determined through the three-step process to create the most effective knowledge graph for tracking criminal organizations based on , are summarized in Figure 15.
Figure 15.
Optimal for the -centered knowledge graph.
To validate the effectiveness of the proposed boundary-based clustering model optimized through the , , and filtering process, a comparative analysis was conducted against standard clustering algorithms using the optimal derived in the previous sections ( = 3, = 10, = 0.8, = 10) as illustrated in Figure 16. After generating the optimized knowledge graph by applying these filters, the resulting clusters were evaluated against a ground-truth dataset constructed via manual labeling, as well as clusters generated by standard algorithms such as Agglomerative Clustering and K-Means Clustering.
Figure 16.
Comparison of Clustering Results for -Centered Knowledge Graph: (a) Manual labeling, (b) Agglomerative Clustering, and (c) K-Means Clustering.
As presented in Figure 16a, the manual labeling process identified five clearly distinct clusters (1–5), each representing a separate criminal organization. However, the automated algorithms exhibited limitations in distinguishing these boundaries. Specifically, Agglomerative Clustering (Figure 16b) merged clusters 1 and 3 from the manual labeling into a single group in the region marked as Cluster A. These tweets shared high-frequency hashtags such as “kw27” and “kw28”, leading the algorithm to classify them as belonging to the same organization. Detailed analysis, however, revealed that each cluster possessed organization-specific unique hashtags and distinct patterns, confirming that they represent clearly distinguishable organizations. Similarly, in K-Means clustering (Figure 16c), a partial merging of clusters 4 and 5 was observed in the region marked as Cluster B. This misclassification can be attributed to the overestimation of high-frequency common hashtags, a limitation often observed in Euclidean distance-based clustering methods. These results demonstrate that while standard algorithms may group data based on statistical similarity, they struggle to capture the contextual nuances that define the actual boundaries of criminal organizations in social media analysis.
5.2.2. Optimization Model for the Knowledge Graph Centered on Words
To track criminal organizations by analyzing the words in tweet content, which are broken down into word units (), this study sequentially determines the optimal for , , and in three steps, similar to the approach used for in Section 5.2.1.
Step 1 involves determining the optimal for generating the knowledge graph by analyzing the number of connected to in the knowledge graph . As shown in Figure 17, the is set to 1, 3, and 5. To accurately assess the impact of variations in the on the knowledge graph, it is important to fix the and at their maximum values. If the for and are instead set to their minimum values, the knowledge graph will not undergo significant changes despite adjustments to the , as shown in Figure 7.
Figure 17.
Scenario for determining the optimal in a -centered knowledge graph.
Figure 18 illustrates the knowledge graph generated using different values.
Figure 18.
Scenario for deriving the optimal in a -centered knowledge graph—(a) = 1, (b) = 3, (c) = 5.
In Figure 18, Figure 18a includes all containing at least one , whereas Figure 18b selects only those that contain three or more . In Figure 18b, clusters 1 and 5, which were present in Figure 18a, have been removed. A detailed analysis of the removed clusters 1 and 5 shows that Cluster 1 was formed around keywords that included some terms related to sexual crimes, but the tweets themselves were not related to sexual crimes. Cluster 5, which was centered around the word “kw18” might have been considered a sexual crime cluster, but it was composed of tweets posted by individuals rather than an organized group, justifying its exclusion from the knowledge graph. Generally, tweets with only one are more often characterized by multiple hashtags rather than by their textual content, making it more appropriate to analyze such tweets using , as in Section 5.2.1, rather than . If the is set too high, as shown in Figure 18c, where only with five or more are included, all clusters (1 through 6) are filtered out, making the knowledge graph ineffective for tracking criminal organizations. Thus, the optimal for generating is determined to be 3, as applied in Figure 18b.
According to the quantitative analysis results in Table 15, as the increased from 1 to 3, the minimum cluster size rose from 1 to 9, and the number of clusters decreased from 19 to 15. This quantitatively supports the validity of removing clusters 1 and 5, as visually confirmed in Figure 18b. At 5, the number of clusters further decreased to 12. This reduction quantitatively confirms the filtering of clusters 1–6 observed in Figure 18c, indicating potential information loss at higher .
Table 15.
Quantitative Analysis of Clustering Results by in -Centered Knowledge Graph.
In Step 2, as illustrated in Figure 19, the is set to the optimal value of 3 obtained in Step 1. The goal here is to determine the best from the values 0, 5, 10, and 15.
Figure 19.
Scenario for determining the optimal in a -centered knowledge graph.
Step 2 considers the appropriateness of filtering commonly used sexual crime keywords to create a knowledge graph that accurately mirrors the characteristics of criminal organizations, which allows effective clustering. Figure 20 shows the knowledge graph created based on different values.
Figure 20.
Scenario for deriving the optimal in a -centered knowledge graph—(a) = 0, (b) = 5, (c) = 10, (d) = 15.
In Figure 20, Figure 20a represents a knowledge graph generated without filtering any of the most frequent , resulting in the formation of adjacent sub-clusters 1, 2, 3, and 4 in Section A. However, a detailed analysis of each cluster revealed that, except for Cluster 3, Clusters 1, 2, and 4 contained the same such as “kw30” and the same such as “kw3” and “kw31”. This indicates that Cluster 3 is associated with a different organization than clusters 1, 2, and 4, which implies that Figure 20a with a set to 0 is not appropriate. Conversely, Figure 20b, which filters the top 5 most frequent , demonstrates that Cluster 3 is entirely separated from clusters 1, 2, and 4, making it more suitable than Figure 20a. Meanwhile, Figure 20c,d, which filter the top 10 and 15 most frequent , respectively, lead to the exclusion of Cluster 5, which disseminates illegal adult websites, thereby making them less suitable for crime tracking. Therefore, after a thorough analysis of the collected data, this study concludes that Figure 20b provides the most appropriate knowledge graph while maintaining suitable connections between clusters and without over-filtering crime organization clusters. Consequently, the optimal was identified as 5.
In Table 16, the effect of the filter in the -based analysis appears relatively gradual compared to the analysis. The variation in the number of clusters remains within the range of 14–15 across changes. This stability is attributed to the more diverse distribution of words extracted from tweet content compared to hashtags, as well as their lower dependence on specific high-frequency words. At 5, the average number of words per tweet was appropriately maintained at 9.71, quantitatively supporting the separation between cluster 3 and clusters 1, 2, and 4, as confirmed in Figure 20b.
Table 16.
Quantitative Analysis of Clustering Results by in -Centered Knowledge Graph.
In Step 3-(a), as shown in Figure 21, the objective is to measure the similarity between based on and select tweet pairs with similarity exceeding the . This step is intended to determine the optimal .
Figure 21.
Scenario for determining the optimal in a -centered knowledge graph.
Figure 22 shows the knowledge graph generated with varying values for the filter.
Figure 22.
Scenario to determine the optimal in a -centered knowledge graph—(a) = 0.7, (b) = 0.8, (c) = 0.9.
In Figure 22, Figure 22a,b show knowledge graphs generated with set to 0.7 and 0.8, respectively. It is evident that the size of Cluster 4 in Figure 22b is smaller than that in Figure 22a. Cluster 4 is associated with tweets promoting illegal adult websites and involve multiple accounts. Nevertheless, an analysis of the revealed that these tweets were disseminated by an individual using multiple accounts. Despite the reduction in cluster size in Figure 22b compared to Figure 22a, the identified criminal organization remained consistent, indicating that the refined graph in Figure 22b is more efficient for crime tracking. When a higher of 0.9 is applied, as shown in Figure 22c, clusters 1, 2, and 3—previously identified as part of the criminal organization—are excluded from the knowledge graph, which makes it ineffective for crime tracking. Therefore, the optimal for Step 3-(a) was determined to be 0.8.
The results in Table 17 quantitatively complement the visual analysis in Figure 22. At 0.8, the minimum cluster size increased from 2 to 9, effectively excluding individual tweets that coincidentally shared similar words. At 0.9, the total number of tweets decreased by 52.6% (from 418 to 222) compared to 0.7. This sharp decline quantitatively confirms the omission of clusters 1, 2, and 3, which was observed in Figure 22c.
Table 17.
Quantitative analysis of clustering results by in -centered knowledge graph.
In Step 3-(b), as shown in Figure 23, the objective was to determine the optimal to identify tweet clusters with similar compositions.
Figure 23.
Scenario for determining the optimal in a -centered knowledge.
Figure 24 shows the knowledge graph generated with varying values for the filter.
Figure 24.
Scenario for determining the optimal in a -centered knowledge graph—(a) = 1, (b) = 5, (c) = 10.
In Figure 24, Figure 24a–c denote knowledge graphs where is selected based on the number of times it appears in pairs within , specifically appearing at least 1, 5, and 10 times, respectively. In Section A, Figure 24b reveals 10 sub-clusters that are not identifiable in Figure 24a. In Figure 24a, the overlap of keywords in tweets from individuals or small organizations with those from medium to large organizations strengthens cluster connections. However, in Figure 24c, where the is set higher than in Figure 24b, excessive filtering of results in the disappearance of clusters 1 through 10, which were identified as criminal organizations in Figure 24b. Therefore, for Section A, Figure 24b with a of 5 or higher is deemed optimal. In Section B, clusters 11 and 12 are visible in Figure 24c but not in Figure 24a,b. A detailed analysis of clusters 11 and 12 shows that Cluster 11 pertains to a crime where an instant messenger LINE account is advertised through tweets to attract consumers of sexually exploitative content. Conversely, Cluster 12, which includes the keyword “kw3” as a search term, was found not to be related to sexual crime, making the division into two sub-clusters, as shown in Figure 24c, appropriate. Therefore, unlike Section A, for Section B, Figure 24c with a of 10 or higher is deemed the optimal knowledge graph.
Table 18 illustrates the clustering characteristics according to variations in . At 5, the average cluster size reached its highest value of 29.12, indicating that medium- to large-scale organizations were effectively distinguished, corresponding to the 10 sub-clusters identified in Section A of Figure 24b. Conversely, at 10, the number of clusters decreased to 17, and the minimum cluster size rose to 9. This quantitatively confirms the filtering of clusters 1–10, as observed in Figure 24c.
Table 18.
Quantitative Analysis of Clustering Results by in -Centered Knowledge Graph.
To create the most efficient knowledge graph for tracking criminal organizations based on , the optimal for each filter, determined through the three-step process, are summarized in Figure 25.
Figure 25.
Optimal for the -centered knowledge graph.
To validate the effectiveness of the proposed boundary-based clustering model optimized through the , , and filtering process, a comparative analysis was conducted against standard clustering algorithms using the optimal derived in the previous sections ( = 3, = 5, = 0.8, = 10). After generating the optimized knowledge graph by applying these filters, the resulting clusters were evaluated against a ground-truth dataset constructed via manual labeling, as well as clusters generated by standard algorithms such as Agglomerative Clustering and K-Means Clustering, as illustrated in Figure 26.
Figure 26.
Comparison of Clustering Results for -Centered Knowledge Graph: (a) Manual labeling, (b) Agglomerative Clustering, and (c) K-Means Clustering.
Figure 26 presents a comparison of the clustering algorithm results for the -centered knowledge graph. As shown in Figure 26a, manual labeling identified three independent clusters (1, 2, and 3). However, Agglomerative Clustering (Figure 26b) merged clusters 1 and 2 into a single organization in the region marked as Cluster B, maintaining only cluster 3 as a separate group. This tendency was more pronounced in K-Means clustering (Figure 26c), where all three clusters (1, 2, and 3) were integrated into a single organization in the region marked as Cluster A.
These three clusters shared common sexual crime-related keywords, such as “kw28” and “kw32”, and were all engaged in promoting LINE IDs. This overlap led the automated algorithms to classify them as activities of the same organization. However, manual verification revealed that each organization exhibited unique text patterns. Furthermore, no evidence supporting their classification as a single organization was found in terms of hashtag combinations, nickname patterns, or user account characteristics. These organization-specific unique patterns form the actual boundaries between clusters—boundaries that cannot be accurately identified solely based on the frequency of common keyword occurrences. These results suggest that automated clustering algorithms alone have limitations in capturing the qualitative differences between organizations when tracking sexual crime networks.
5.2.3. Optimization Model for the Knowledge Graph Centered on URLs/Codes
denotes the URLs and invitation codes for instant messenger access included in tweets. Clusters formed around the same within the knowledge graph can be distinctly identified as belonging to the same organization. A knowledge graph focused on can be created by applying only to , as depicted in Figure 5. Filter selects only those connected to a number of times greater than or equal to the . In this study, as shown in Figure 27, the is set at 1, 5, and 10 to generate the knowledge graph . The resulting graphs are then compared and analyzed to determine the optimal .
Figure 27.
Scenario for determining the optimal in a —centered knowledge graph.
Figure 28 illustrates the knowledge graph generated with varying values.
Figure 28.
Scenario for deriving the optimal in a —centered knowledge graph—(a) = 1, (b) = 5, (c) = 10.
In Figure 28c, clusters are formed around particular URLs and invitation codes that are disseminated in 10 or more tweets, resulting in 13 clusters (1–13). Cluster 1 is further divided into two sub-clusters, 1-1 and 1-2, with 1-1 comprise 177 tweets sharing the LINE account “kc****” and 1-2 encompasses 63 tweets sharing the LINE account “kc***”. Cluster 2 consists of 98 tweets that share a URL for a sexual crime-related Telegram open chat room. Similarly, clusters 3–13 also feature LINE and Telegram accounts disseminated across 10 or more tweets. In Figure 28b, clusters 14 through 35 are added, representing URLs and invitation codes disseminated in 5 to 9 tweets. Figure 28a displays a total of 154 additional clusters, including 107 clusters formed by URLs and invitation codes disseminated in only one tweet. Although Figure 28c is effective for identifying large-scale criminal organizations, it has the drawback of filtering out smaller organizations from the knowledge graph, which may lead to their exclusion from investigation. Consequently, it is important to set the according to the investigative perspective to generate the knowledge graph . In this study, an of 5 is determined to be the optimal value for identifying medium to large-scale criminal organizations.
6. Discussion
In Section 5, we generated knowledge graphs focusing on elements such as , , and and established the optimal for effectively monitoring the same criminal organization. Although knowledge graphs based on specific elements have been proven effective for clustering criminal organizations, integrating two or more elements may uncover additional criminal organizations not identified using a graph centered on a single . Figure 29 illustrates a portion of the optimized knowledge graph created based on , as discussed in Section 5.2.3.
Figure 29.
A subset of clusters from the optimized -centered knowledge graph .
The knowledge graph contains four clusters centered around the elements labeled A–F. As detailed in Section 5, these four clusters are identified as different criminal organizations. However, when this graph is integrated with the knowledge graph optimized around , as shown in Section 5.2.1, the clusters A through F are consolidated into a single large cluster, as depicted in Figure 30.
Figure 30.
Merging the optimized centered on with the optimized centered on .
A detailed analysis of clusters 2 and 3 in Figure 29 reveals that many tweets within these clusters share identical elements and sequences of hashtags. Additionally, multiple tweets with identical content were found across clusters 1, 3, and 4. This supports the justification for combining clusters 1, 2, 3, and 4 into a single cluster, as shown in Figure 30. In conclusion, generating knowledge graphs centered on individual elements allows us to estimate the same criminal organization from a vast collection of tweets. Subsequently, to finalize the identification of the criminal organization, a knowledge graph that integrates two or more effective elements can be created. This approach allows for more accurate identification and clustering of criminal organizations.
The filter-based optimization model and quantitative indicators proposed in this study are not intended to provide definitive automated answers to investigators; rather, they are designed to function as tools that support more effective criminal investigation analysis. In real-world investigative environments, the final decision regarding whether to classify adjacent clusters as a single organization or separate entities must rely on the professional judgment of investigators. Therefore, the boundary-based knowledge graph proposed in this study aims to provide an analytical environment where investigators can visually comprehend the relationships between clusters and explore potential inter-organizational associations through connecting elements such as shared hashtags, words, and URLs/invitation codes. This approach assists investigators in identifying criminal organizations more accurately by combining their domain knowledge and contextual judgment with the system’s output, rather than relying entirely on automated clustering results.
7. Conclusions
As cybercrimes exploit social media platform increase, there is a growing demand for advanced cyber investigation methods that leverage social media data analysis. This study focused on X, a platform on which significant amounts of digital sexual crime content are disseminated, to create a collection and tracking system aimed at identifying digital sexual crime organizations. Six commonly used slang terms related to sexual crimes were used as search keywords on X to collect data, resulting in the collection of 3387 tweets. Three key elements—hashtags, words, and URLs/invitation codes—were identified to track sexual crime organizations, and these elements were extracted from each tweet. Hashtags were identified as elements used to increase the visibility of illegal content posts to potential consumers. Words were parsed into distinct lexical units within the tweet’s text, while URLs/invitation codes were associated with open chatroom URLs or user accounts on instant messaging services such as Telegram and LINE, which are used to attract users. A knowledge graph was created by defining user accounts, tweets, hashtags, words, and URLs/invitation codes as vertices and modeling the relationships between these vertices as edges. To extract meaningful information to track sexual crime organizations from the knowledge graph, it is essential to optimize the graph based on an analytical focus. This study developed and optimized knowledge graphs centered around each key element to facilitate the clustering of sexual crime organizations and validated the clustering results by analyzing the vertices and edges of each cluster. Furthermore, this study examined the relationships between adjacent clusters to validate the proposed knowledge graph-based system for tracking sexual crime organizations. Additionally, the study investigated the generation of knowledge graphs that combined two or more key elements, thereby enabling the identification of higher-level criminal organizations that might not be detected using single-element-focused knowledge graphs. The tweet collection and tracking system developed in this study to identify sexual crime organizations is applicable not only to X but also to various other social media platforms. It can serve as a cyber investigation tool to track organizations involved in the dissemination of sexual crime content, illegal prostitution advertisements, deepfake-based synthetic images of ordinary people and celebrities, and the dissemination of sexually exploitative content and illegal recordings via instant messaging services.
Future efforts will focus on securing additional criminal evidence related to the organizations identified in this study by collecting data from instant messaging services, such as Telegram and LINE. Future research will focus on linking and analyzing data collected from social media and instant messaging platforms to accurately identify and apprehend these criminal organizations.
Author Contributions
Conceptualization, H.-W.L. and J.K.; Methodology, H.-W.L. and J.K.; Software, H.-W.L.; Validation, H.-W.L.; Formal analysis, H.-W.L.; Investigation, H.-W.L. and S.-B.L.; Resources, J.K.; Data curation, H.-W.L.; Writing—original draft, H.-W.L., S.-B.L. and J.K.; Writing—review and editing, H.-W.L. and J.K.; Visualization, H.-W.L.; Supervision, J.K.; Project administration, J.K.; Funding acquisition, J.K. All authors have read and agreed to the published version of the manuscript.
Funding
This work was supported by the Tech. Challenge for Future Program Policing (www.kipot.or.kr), funded by the Ministry of Science and ICT (MSIT, Korea) and the Korean National Police Agency (KNPA, Korea). Project Name: Development of Active Dark Web Information Collection, Analysis and Tracking Technology to Prevent Dark Web Crime. Project Number: RS-2023-00244362.
Institutional Review Board Statement
Ethical review and approval were waived for this study due to this study analyzed publicly available social media data without direct human subject interaction, personally identifiable information collection, or intervention. Data collection focused on criminal actor behavior patterns consistent with academic research exemptions under the university’s IRB policy and Korean Bioethics and Safety Act, which exclude publicly posted online content analysis from review requirements when no individual-level identification or contact occurs.
Informed Consent Statement
Not applicable.
Data Availability Statement
The data presented in this study are restricted. Raw tweet data cannot be publicly shared due to X’s terms of service and privacy considerations for individuals mentioned in criminal content. Graph-level statistics and anonymized cluster examples are available in the manuscript.
Conflicts of Interest
The authors declare no conflicts of interest. The funders had no role in the design of the study; in the collection, analyses, or interpretation of data; in the writing of the manuscript; or in the decision to publish the results.
Appendix A
This appendix provides definitions and explanations of the specific keywords (kw1–kw31) used in this study.
Table A1.
Keyword definitions and meanings.
Appendix B
This appendix provides the Neo4j Cypher query implementations used to construct and optimize the knowledge graphs presented in this study. All queries follow the mathematical definitions in Section 5.1. Note that some advanced collection operations (e.g., intersection, union) require the APOC (Awesome Procedures on Cypher) plugin installed in the Neo4j environment. Parameters enclosed in braces (e.g., {}) represent variable inputs determined by the optimization steps.
Appendix B.1. Knowledge Graph Schema Definition
The knowledge graph is constructed with five vertex types and three relationship types, as defined in Table 3, Table 4 and Table 5.
Appendix B.1.1. Vertex Creation
| // Tweet vertex with properties MERGE (tweet:Tweet {Post_ID: row.PostID}) ON CREATE SET tweet.Content = row.Content, tweet.Date = row.Timestamp // User vertex with properties MERGE (user:User {ID: row.AuthorID}) ON CREATE SET user.Name = row.Nickname, user.CreateDate = row.AccountCreationDate // Type vertices (Hashtag, Word, URL_Code) MERGE (ht:Hashtag {Hashtag: tag}) MERGE (kw:Word {Word: keyword}) MERGE (lc:URL_Code {Link: code}) |
Appendix B.1.2. Relationship Creation
| // POST relationship: User→Tweet MERGE (user)-[:POST]->(tweet) // INCLUDE relationships: Tweet→Type MERGE (tweet)-[:INCLUDE]->(ht) // Tweet→Hashtag MERGE (tweet)-[:INCLUDE]->(kw) // Tweet→Word MERGE (tweet)-[:INCLUDE]->(lc) // Tweet→URL_Code |
Appendix B.1.3. Frequency and Weight Calculation
| // Calculate frequency and inverse-frequency weight for all Type vertices MATCH (type) // Apply to Hashtag, Word, or URL_Code WHERE type:Hashtag OR type:Word OR type:URL_Code WITH type, size([(type)<-[:INCLUDE]-(t:Tweet) | t]) AS frequency SET type.Frequency = frequency, type.Weight = 1.0/log(1 + frequency) |
Appendix B.2. Filter : Tweet Content Density Selection
Purpose: Select tweets containing ≥ number of Type vertices ().
Implementation
| // Specify target type: {Hashtag} or {Word} MATCH (t:Tweet)-[:INCLUDE]->(type:{Hashtag|Word}) WITH t, COUNT(DISTINCT type) AS num_types WHERE num_types >= {} RETURN t |
Appendix B.3. Filter : High-Frequency Stopword Removal
Purpose: Remove top-N most frequent Type vertices from .
Implementation
| // Step 1: Identify high-frequency Type vertices // Specify target type: {Hashtag} or {Word} MATCH (type:{Hashtag|Word}) WITH type ORDER BY type.Frequency DESC LIMIT {N} WITH COLLECT(type) AS stopwords // Step 2: Filter relationships excluding stopwords MATCH (t:Tweet)-[r:INCLUDE]->(type:{Hashtag|Word}) WHERE NOT type IN stopwords RETURN t, type |
Appendix B.4. Filter : Similarity-Based Tweet Clustering
Purpose: Select tweets with high content similarity using weighted Jaccard similarity.
Appendix B.4.1. Step 3-(a): Compute Tweet Pair Similarity
| // Initialize similarity count MATCH (t:Tweet) SET t.SimilarityCount = 0; // Select tweet pairs sharing Type vertices from G_F2 // Specify target type: {Hashtag} or {Word} MATCH (t1:Tweet)-[:INCLUDE]->(type:{Hashtag|Word}) MATCH (t2:Tweet)-[:INCLUDE]->(type:{Hashtag|Word}) WHERE id(t1) < id(t2) // Collect Type vertices for each tweet WITH t1, t2w MATCH (t1)-[:INCLUDE]->(type1:{Hashtag|Word}) MATCH (t2)-[:INCLUDE]->(type2:{Hashtag|Word}) WITH t1, t2, COLLECT(DISTINCT type1) AS types1, COLLECT(DISTINCT type2) AS types2 // Calculate intersection (I) and union (U) WITH t1, t2, apoc.coll.intersection(types1, types2) AS intersectionTypes, apoc.coll.union(types1, types2) AS unionTypes // Calculate weighted Jaccard similarity: Σ(weight(x) for x in I)/Σ(weight(x) for x in U) WITH t1, t2, REDUCE(w = 0, type IN intersectionTypes|w + type.Weight) AS intersectionWeight, REDUCE(w = 0, type IN unionTypes|w + type.Weight) AS unionWeight // Compute similarity as per Equation (5) WITH t1, t2, CASE WHEN unionWeight = 0 THEN 0 ELSE intersectionWeight/unionWeight END AS similarity WHERE similarity >= {} // Update similarity count for both tweets SET t1.SimilarityCount = t1.SimilarityCount + 1, t2.SimilarityCount = t2.SimilarityCount + 1 |
Appendix B.4.2. Step 3-(b): Select Tweets with High Similarity Frequency
| // Select tweets appearing in multiple similar pairs MATCH (t: Tweet) WHERE t.SimilarityCount >= {} OPTIONAL MATCH (t)-[:INCLUDE]->(type:{Hashtag|Word}) OPTIONAL MATCH (t)<-[:POST]-(user:User) RETURN t, COLLECT(DISTINCT type) AS types, user |
Appendix B.5. Filter : URL/Code-Based Organization Identification
Purpose: Select URL_Code vertices connecting ≥ tweets (organization indicator).
Implementation
| // Find URL_Code vertices with multiple connected tweets MATCH (tweet:Tweet)-[:INCLUDE]->(lc:URL_Code) MATCH (user:User)-[:POST]->(tweet) // Group by URL_Code and count connections WITH lc, COLLECT(DISTINCT tweet) AS tweets, COLLECT(DISTINCT user) AS users WHERE size(tweets) >= {} // Return organization cluster RETURN lc, tweets, users |
References
- Lowy Institute. The Nth Room Case: Modern Slavery in the Digital Space. Available online: https://www.lowyinstitute.org/the-interpreter/nth-room-case-modern-slavery-digital-space (accessed on 20 November 2025).
- The UOS Times. A Review on the Nth Room Case: An Analysis of Digital Sex Crimes. Available online: https://times.uos.ac.kr/news/articleView.html?idxno=10012 (accessed on 20 November 2025).
- Social Media Victims Law Center. Sexual Assault and Digital Violence. Available online: https://socialmediavictims.org/sexual-violence/sexual-assault/ (accessed on 20 November 2025).
- Business Insider. Twitter’s Explicit Content Issue Is Growing, Internal Documents Show. Available online: https://www.businessinsider.com/nsfw-not-safe-for-work-explicit-content-twitter-growing-internal-2022-10 (accessed on 20 November 2025).
- The Korea Times. Rise in Online Sexual Crimes. Available online: https://www.koreatimes.co.kr/www/nation/2024/08/113_373475.html (accessed on 20 November 2025).
- Hernández-Álvarez, M. Detection of Possible Human Trafficking in Twitter. In Proceedings of the 2019 International Conference on Information Systems and Software Technologies (ICI2ST), Quito, Ecuador, 13–15 November 2019; pp. 187–191. [Google Scholar] [CrossRef] [Scilit]
- Izzah, N.; Budi, I.; Louvan, S. Classification of Pornographic Content on Twitter Using Support Vector Machine and Naive Bayes. In Proceedings of the 2018 4th International Conference on Computer and Technology Applications (ICCTA), Istanbul, Turkey, 3–5 May 2018; pp. 156–160. [Google Scholar] [CrossRef] [Scilit]
- Petrou, D.; Martinez-Gil, V.; Castillo, F.; Tunc, C.; Bryce, R. Twitter Account Analysis for Drug Involvement Detection. In Proceedings of the 2023 3rd Intelligent Cybersecurity Conference (ICSC), San Antonio, TX, USA, 23–25 October 2023; pp. 9–16. [Google Scholar] [CrossRef] [Scilit]
- Sequeira, R.; Gayen, A.; Ganguly, N.; Dandapat, S.K.; Chandra, J. A Large-Scale Study of the Twitter Follower Network to Characterize the Spread of Prescription Drug Abuse Tweets. IEEE Trans. Comput. Soc. Syst. 2019, 6, 1232–1244. [Google Scholar] [CrossRef] [Scilit]
- Ermawan, A.T.; Mantoro, T.; Ayu, M.A.; Maarif, H.A.Q. Crawling Data with Social Network Analysis to Detect Accounts Spreading Phishing on Social Media Indonesia. In Proceedings of the 2023 International Conference on Technology, Engineering, and Computing Applications (ICTECA), Semarang, Indonesia, 20–22 December 2023; pp. 1–6. [Google Scholar] [CrossRef] [Scilit]
- Ulfatriyani, H.; Nugroho, H.A.; Soesanti, I. Implementing Term Frequency–Inverse Term Frequency at Tweets in Indonesian Fraud Crime Cases. In Proceedings of the 2020 3rd International Conference on Information and Communications Technology (ICOIACT), Yogyakarta, Indonesia, 24–25 November 2020; pp. 185–190. [Google Scholar] [CrossRef] [Scilit]
- Chitrakar, P.; Zhang, C.; Warner, G.; Liao, X. Social Media Image Retrieval Using Distilled Convolutional Neural Network for Suspicious e-Crime and Terrorist Account Detection. In Proceedings of the 2016 IEEE International Symposium on Multimedia (ISM), San Jose, CA, USA, 11–13 December 2016; pp. 493–498. [Google Scholar] [CrossRef] [Scilit]
- Chen, X.; Cho, Y.; Jang, S.Y. Crime Prediction Using Twitter Sentiment and Weather. In Proceedings of the 2015 Systems and Information Engineering Design Symposium (SIEDS), Charlottesville, VA, USA, 24 April 2015; pp. 63–68. [Google Scholar] [CrossRef] [Scilit]
- Cahyana, N.; Munir, R. Community and Important Actors Analysis with Different Keywords in Social Network. In Proceedings of the 2017 3rd International Conference on Science in Information Technology (ICSITech), Bandung, Indonesia, 25–26 October 2017; pp. 498–502. [Google Scholar] [CrossRef] [Scilit]
- Andrews, S.; Brewster, B.; Day, T. Organised Crime and Social Media: A System for Detecting, Corroborating and Visualising Weak Signals of Organised Crime Online. Secur. Inform. 2018, 7, 3. [Google Scholar] [CrossRef] [Scilit]
- Abbass, Z.; Ali, Z.; Ali, M.; Akbar, B.; Saleem, A. A Framework to Predict Social Crime through Twitter Tweets Using Machine Learning. In Proceedings of the 2020 IEEE 14th International Conference on Semantic Computing (ICSC), San Diego, CA, USA, 3–5 February 2020; pp. 363–368. [Google Scholar] [CrossRef] [Scilit]
- Chung, W.; Mustaine, E.; Zeng, D. Criminal Intelligence Surveillance and Monitoring on Social Media: Cases of Cyber-Trafficking. In Proceedings of the 2017 IEEE International Conference on Intelligence and Security Informatics (ISI), Beijing, China, 22–24 July 2017; pp. 191–193. [Google Scholar] [CrossRef] [Scilit]
- Shukla, P.K.; Veerasamy, B.D.; Alduaiji, N.; Addula, S.R.; Pandey, A.; Shukla, P.K. Fraudulent Account Detection in Social Media Using Hybrid Deep Transformer Model and Hyperparameter Optimization. Sci. Rep. 2025, 15, 38447. [Google Scholar] [CrossRef] [Scilit] [PubMed]
- Wang, J.; Ni, T.; Lee, W.-B.; Zhao, Q. A Contemporary Survey of Large Language Model Assisted Program Analysis. arXiv 2025, arXiv:2502.18474. [Google Scholar] [CrossRef] [Scilit]
- Lee, J.-H.; Kim, C.-R.; Kim, C.-K. Detection of Child Abuse Using LLM and XGBoost. In Proceedings of the 16th International Conference on Ubiquitous and Future Networks (ICUFN), Lisbon, Portugal, 8–11 July 2025; IEEE: New York, NY, USA, 2025; pp. 633–638. [Google Scholar] [CrossRef] [Scilit]
- Liu, L. Construction of Programming Knowledge Graph Based on Student Knowledge Needs. In Proceedings of the 2024 4th International Conference on Consumer Electronics and Computer Engineering (ICCECE), Guangzhou, China, 12–14 January 2024; pp. 120–123. [Google Scholar] [CrossRef] [Scilit]
- Majdalawieh, M.; Al Sabbah, H.; Hani, A.B.; Adedugbe, O.; Benkhelifa, E. Semantic Knowledge Graphs for Scalable Knowledge Discovery and Acquisition in Public Health. In Proceedings of the 2023 20th ACS/IEEE International Conference on Computer Systems and Applications (AICCSA), Giza, Egypt, 4–7 December 2023; pp. 1–6. [Google Scholar] [CrossRef] [Scilit]
- Afandi, M.I.; Wahyuni, E.D. University Research Graph Database for Efficient Multi-Perspective Data Analysis Using Neo4j. In Proceedings of the 2020 6th Information Technology International Seminar (ITIS), Surabaya, Indonesia, 14–16 October 2020; pp. 286–290. [Google Scholar] [CrossRef] [Scilit]
- Dharmawan, I.N.P.W.; Sarno, R. Book Recommendation Using Neo4j Graph Database in BibTeX Book Metadata. In Proceedings of the 2017 3rd International Conference on Science in Information Technology (ICSITech), Bandung, Indonesia, 25–26 October 2017; pp. 47–52. [Google Scholar] [CrossRef] [Scilit]
- Elmoselhy, A.M.; Ramadan, E. Utilizing Graph Database for Inferring Domain–Disease Associations. In Proceedings of the 2019 International Conference on Advances in the Emerging Computing Technologies (AECT), Al Madinah Al Munawwarah, Saudi Arabia, 10 February 2020; pp. 1–6. [Google Scholar] [CrossRef] [Scilit]
- Nalwoga Lutu, P.E. Using Twitter Mentions and a Graph Database to Analyse Social Network Centrality. In Proceedings of the 2019 6th International Conference on Soft Computing & Machine Intelligence (ISCMI), Johannesburg, South Africa, 19–20 November 2019; pp. 155–159. [Google Scholar] [CrossRef] [Scilit]
- Szekely, P.; Knoblock, C.A.; Slepicka, J.; Philpot, A.; Singh, A.; Yin, C.; Kapoor, D.; Natarajan, P.; Marcu, D.; Knight, K.; et al. Building and Using a Knowledge Graph to Combat Human Trafficking. In The Semantic Web—ISWC 2015; Arenas, M., Corcho, O., Simperl, E., Strohmaier, M., d’Aquin, M., Srinivas, K., Groth, P., Dumontier, M., Heflin, J., Thirunarayan, K., et al., Eds.; Springer: Cham, Switzerland, 2015; Volume 9367, pp. 205–221. [Google Scholar] [CrossRef] [Scilit]
- Raj, A.; Somani, S.B. Predicting Terror Attacks Using Neo4j Sandbox and Machine Learning Algorithms. In Proceedings of the 2022 6th International Conference on Computing, Communication, Control and Automation (ICCUBEA), Pune, India, 26–27 August 2022; pp. 1–6. [Google Scholar] [CrossRef] [Scilit]
- Bhardwaj, A.; Kaushik, K. Investigate Financial Crime Patterns Using Graph Databases. IT Prof. 2022, 24, 27–36. [Google Scholar] [CrossRef] [Scilit]
- Geepalla, E.; Abuhamoud, N. Analysis CDR for Crime Investigation Using Graph-Based Method (Neo4j). In Proceedings of the International Conference on Technical Sciences (ICST2019), Tripoli, Libya, 4–6 March 2019; Volume 4, pp. 1–6. [Google Scholar]
- Sarma, D.; Alam, W.; Saha, I.; Alam, M.N.; Alam, M.J.; Hossain, S. Bank Fraud Detection Using Community Detection Algorithm. In Proceedings of the 2020 Second International Conference on Inventive Research in Computing Applications (ICIRCA), Coimbatore, India, 15–17 July 2020; pp. 642–646. [Google Scholar] [CrossRef] [Scilit]
- Zhou, Y.; Wang, X.; Zhang, J.; Zhang, P.; Liu, L.; Jin, H.; Jin, H. Analyzing and Detecting Money-Laundering Accounts in Online Social Networks. IEEE Netw. 2018, 32, 115–121. [Google Scholar] [CrossRef] [Scilit]
- Pawar, P.; Kumar, D.; Kasula, V.K.; Yadulla, A.R.; Bhuvanesh, A.; Keerthanadevi, R. Exploring Blockchain-Enabled Secure Storage and Trusted Data Sharing Mechanisms in IoT Systems. In Proceedings of the IEEE International Conference on Interdisciplinary Approaches in Technology and Management for Social Innovation (IATMSI), Gwalior, India, 6–8 March 2025; IEEE: New York, NY, USA, 2025. [Google Scholar] [CrossRef] [Scilit]
- Neo4j. Neo4j Graph Database Platform. Available online: https://neo4j.com/ (accessed on 20 November 2025).
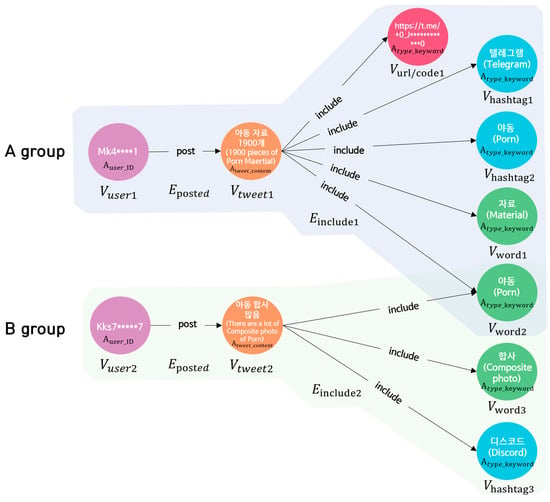
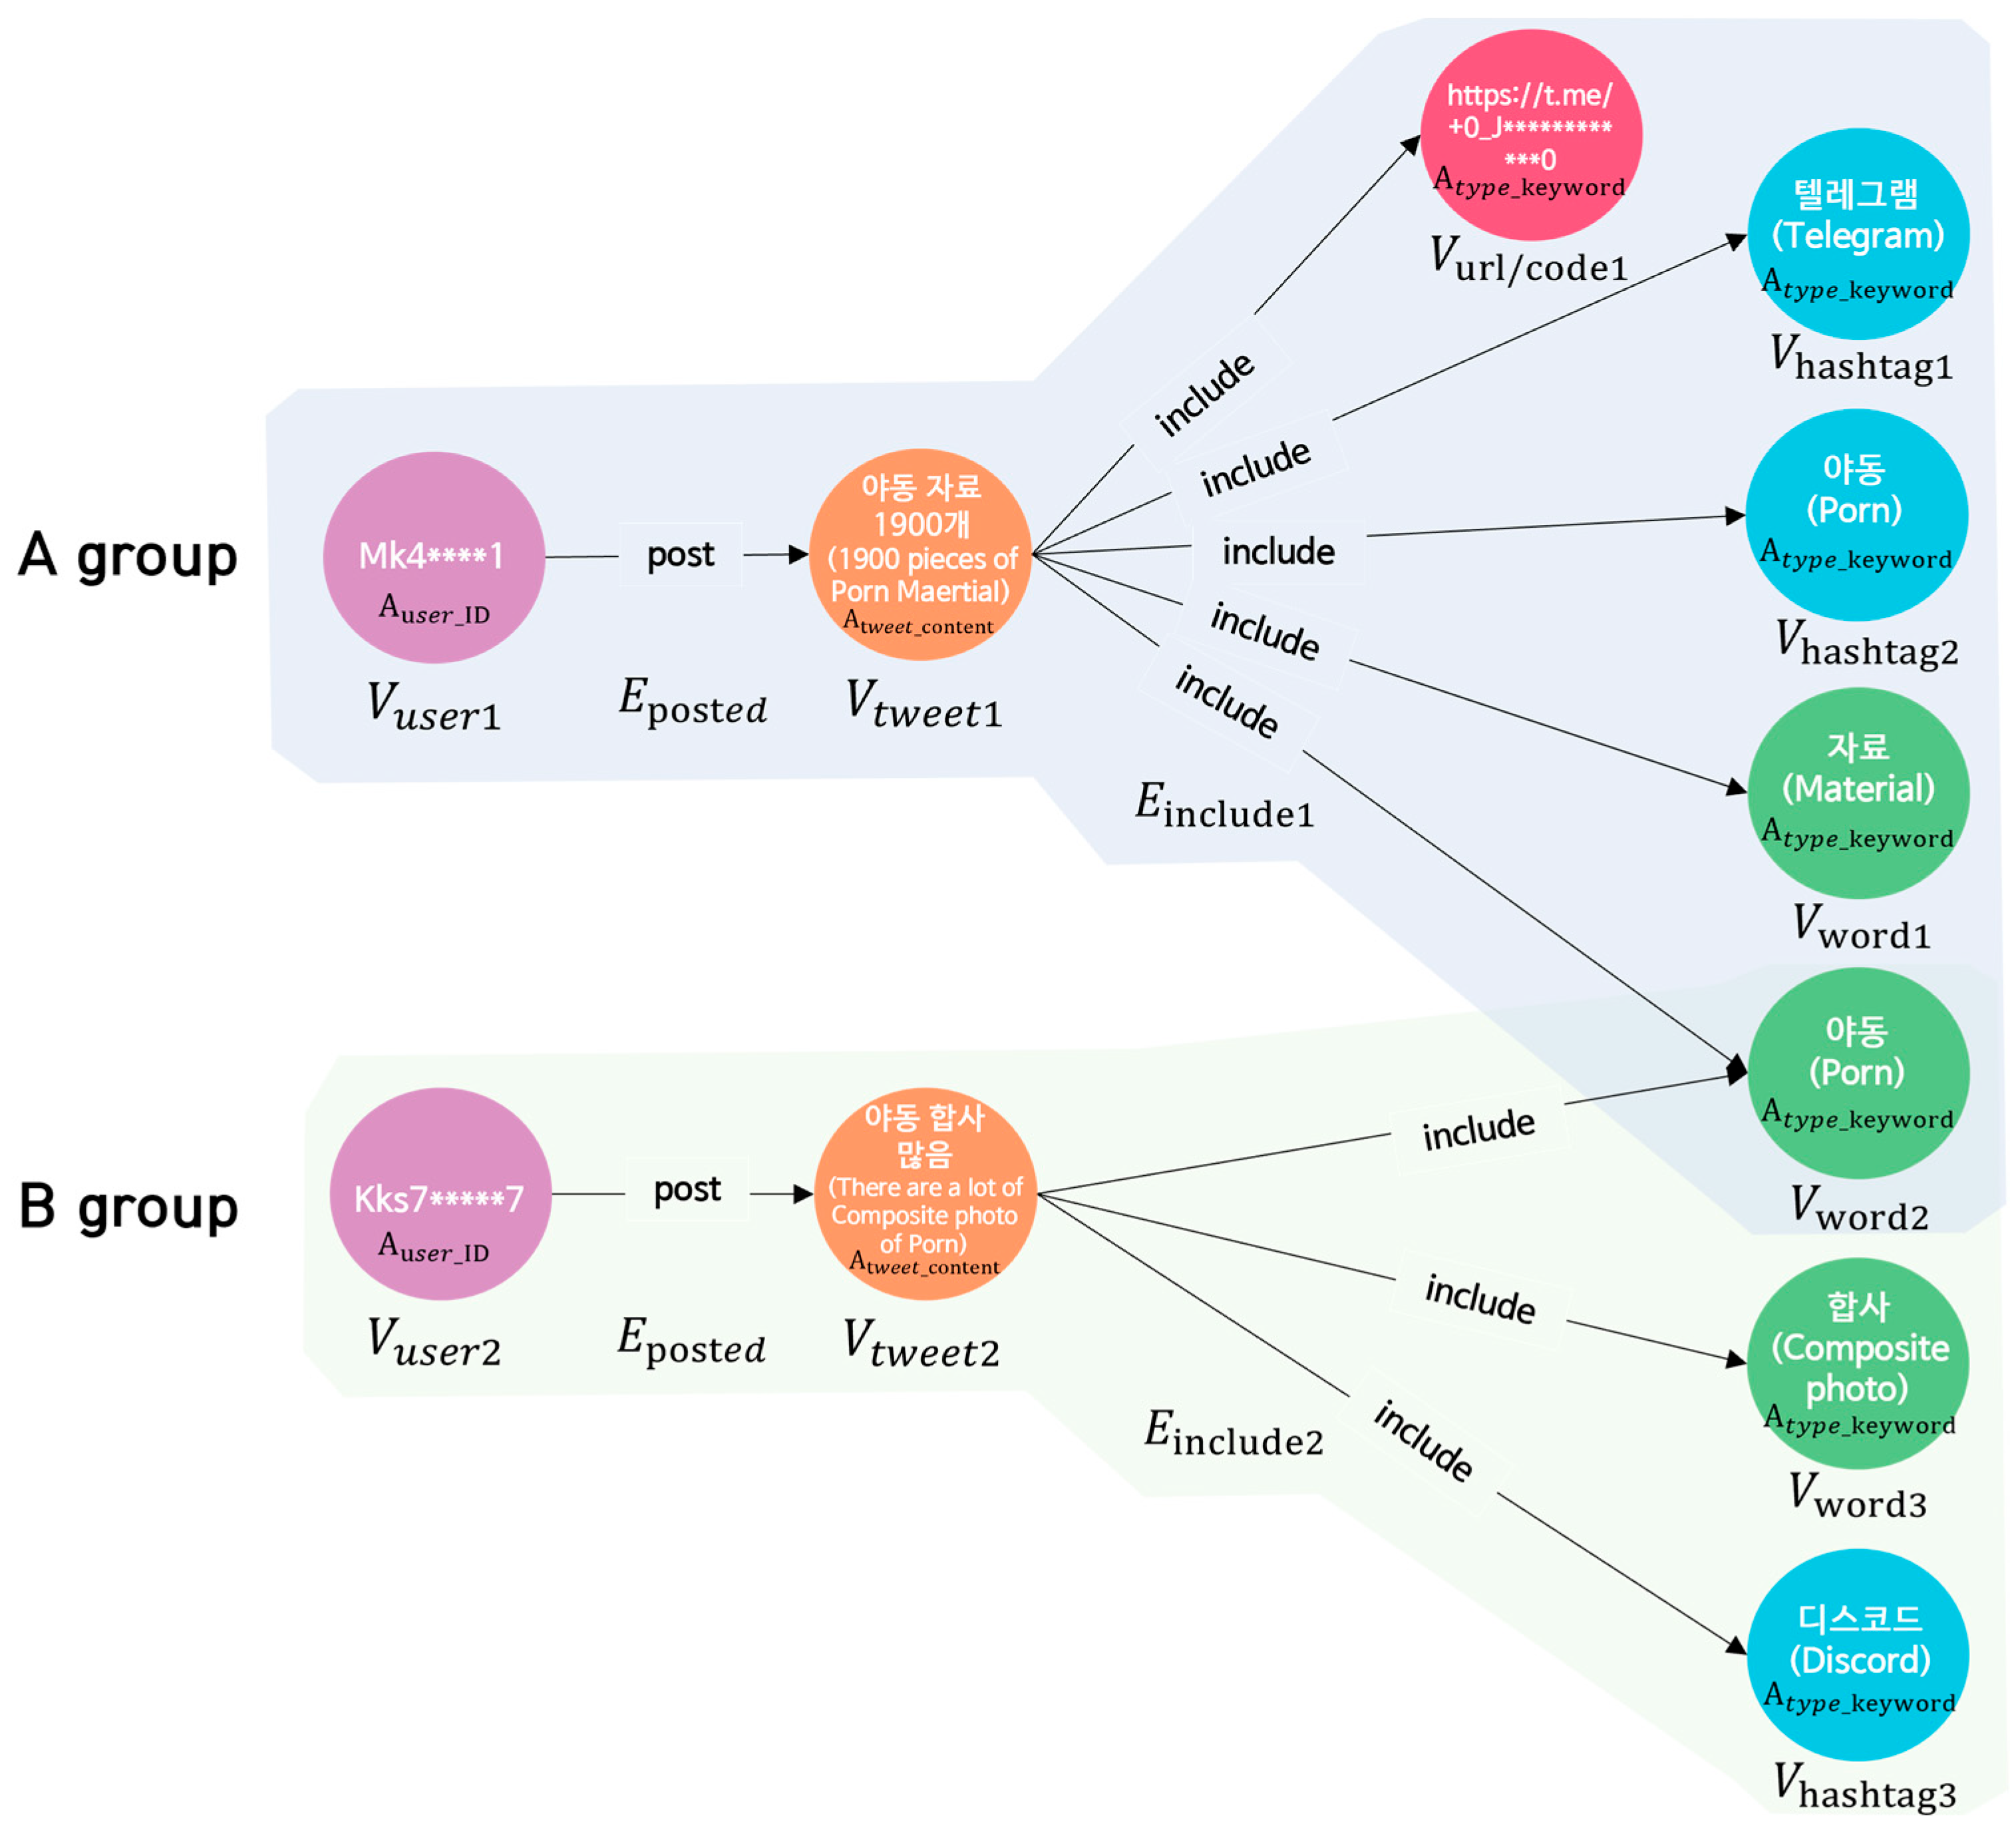
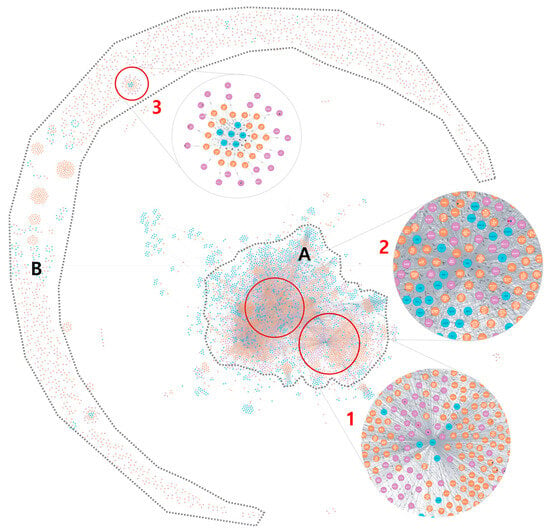
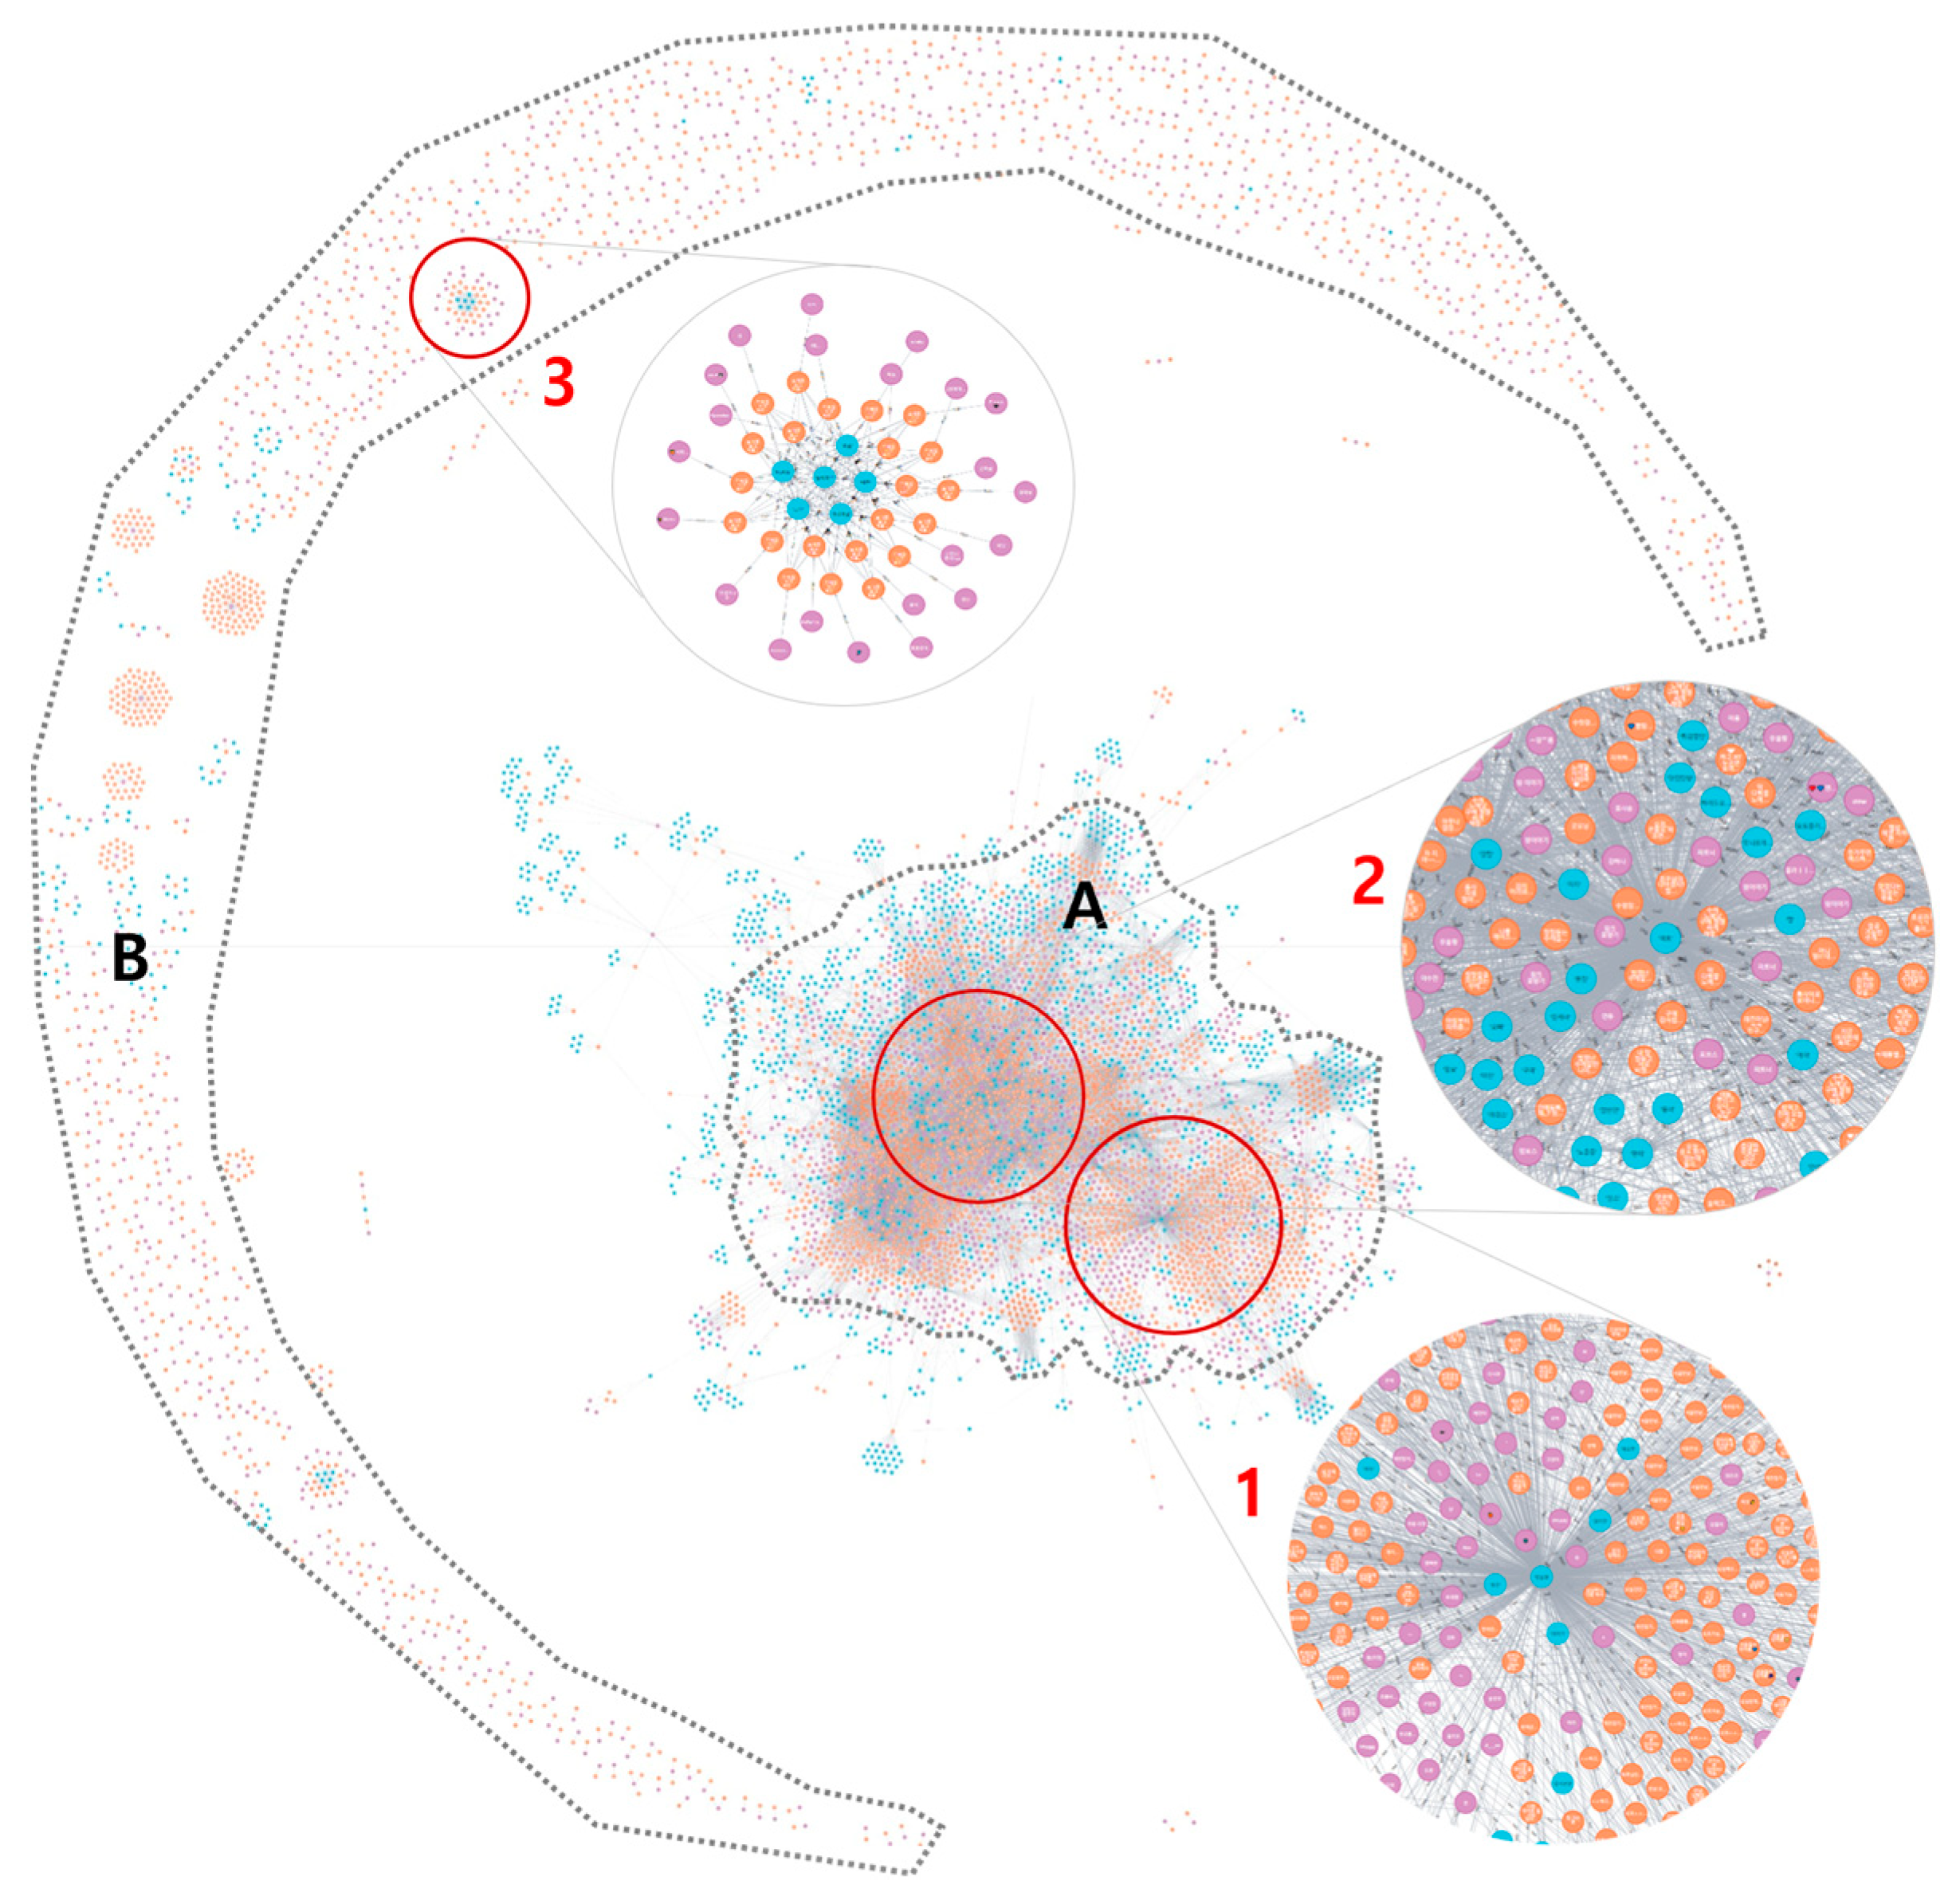
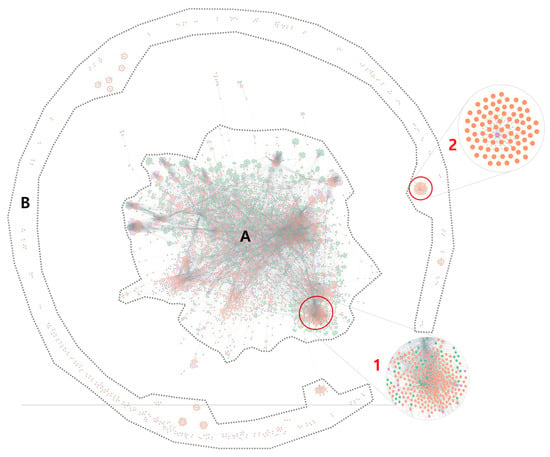
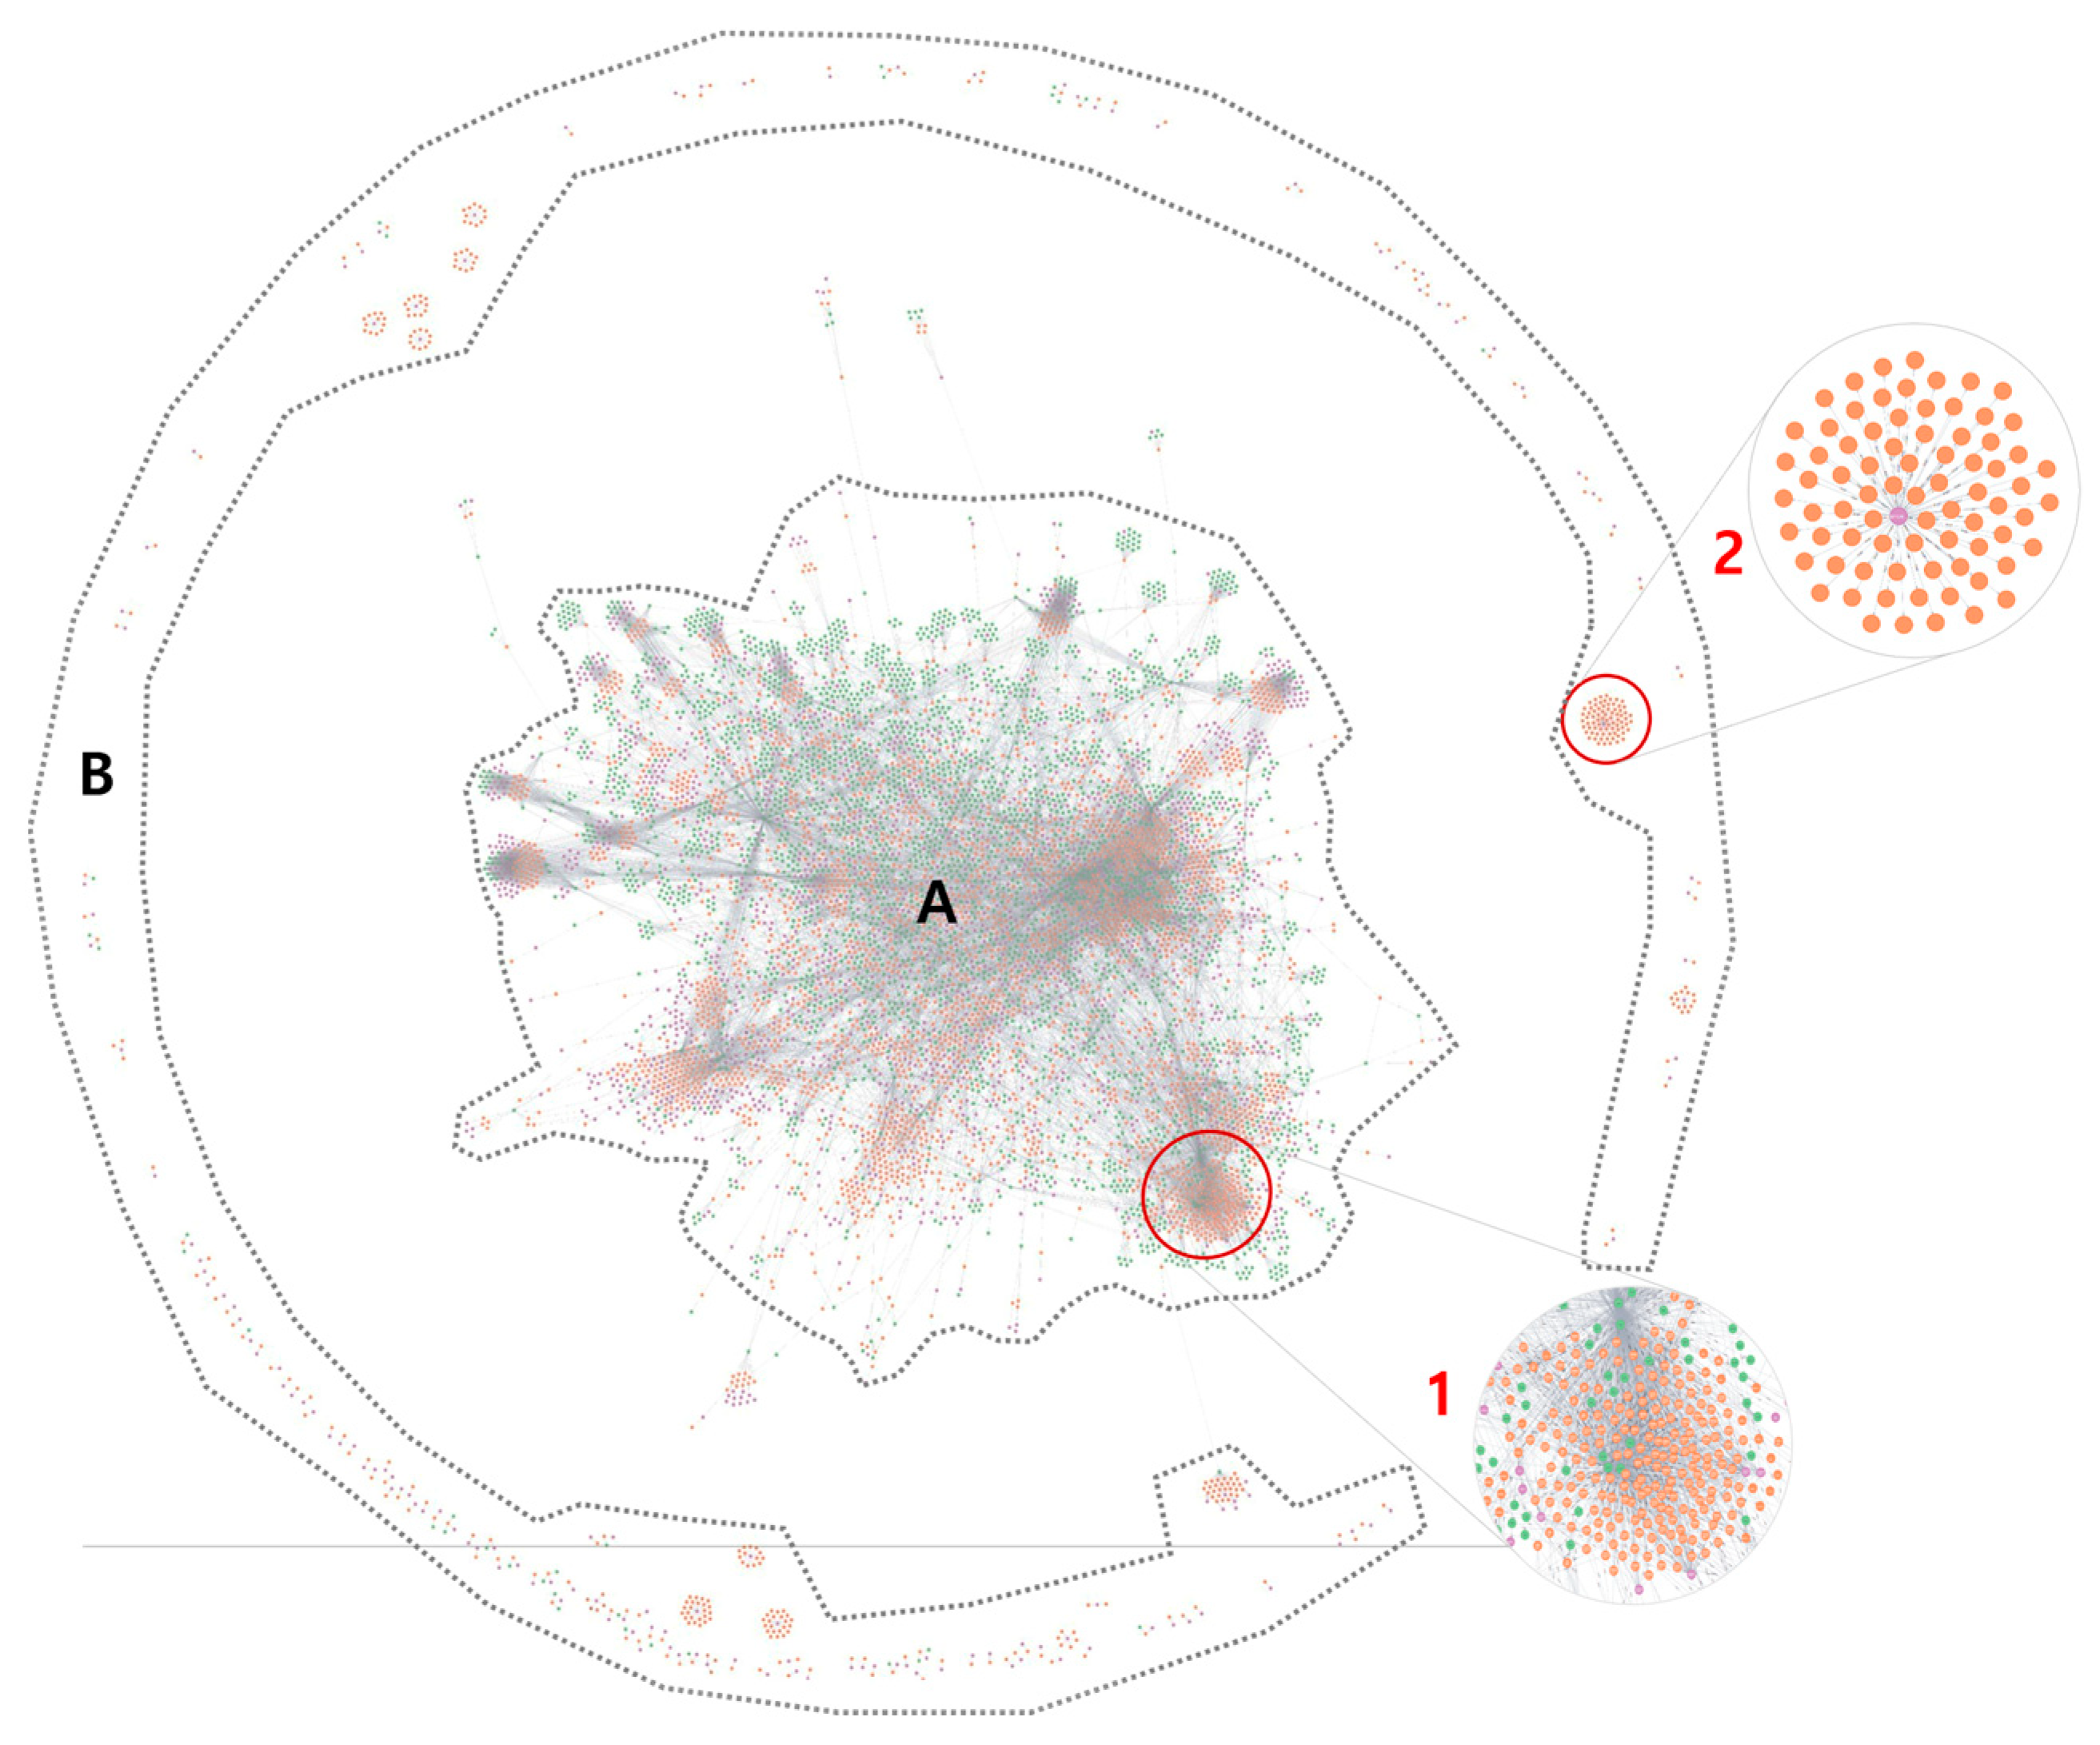
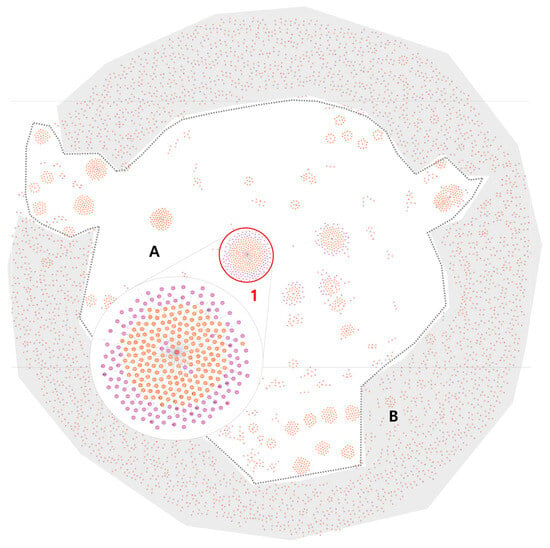
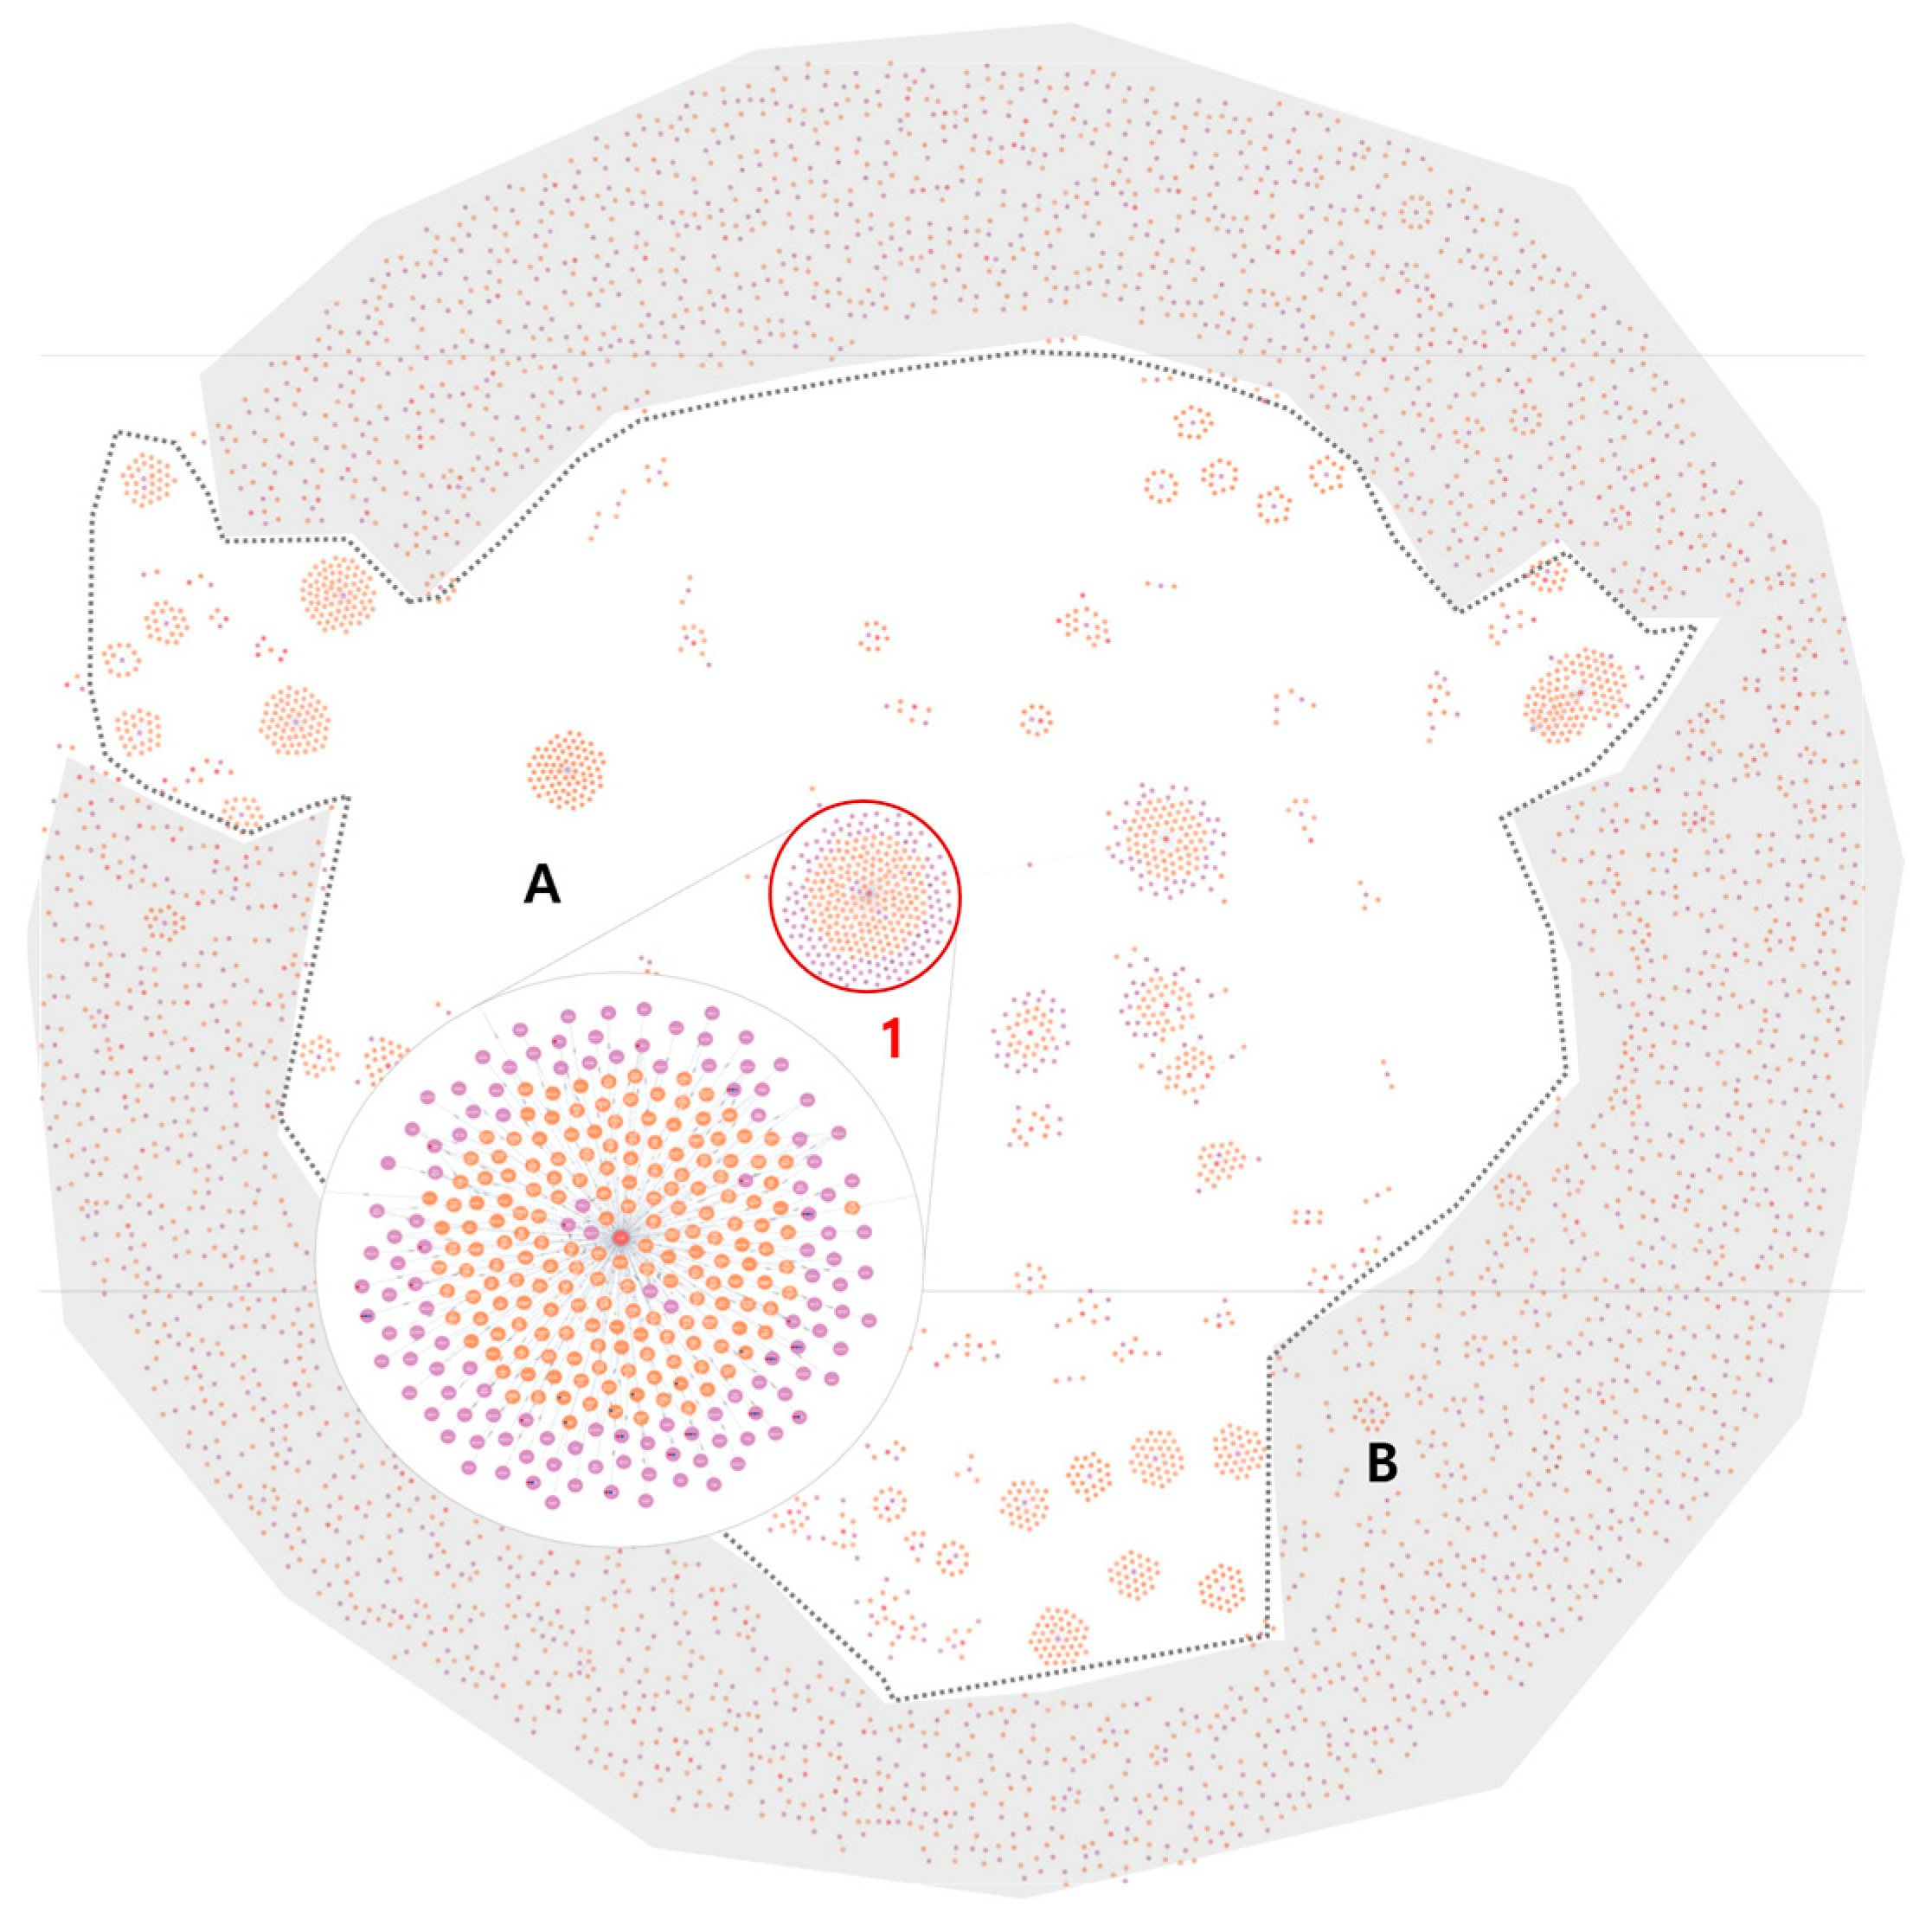
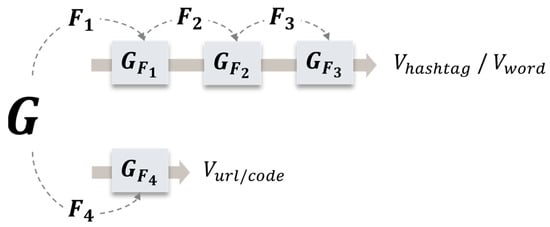
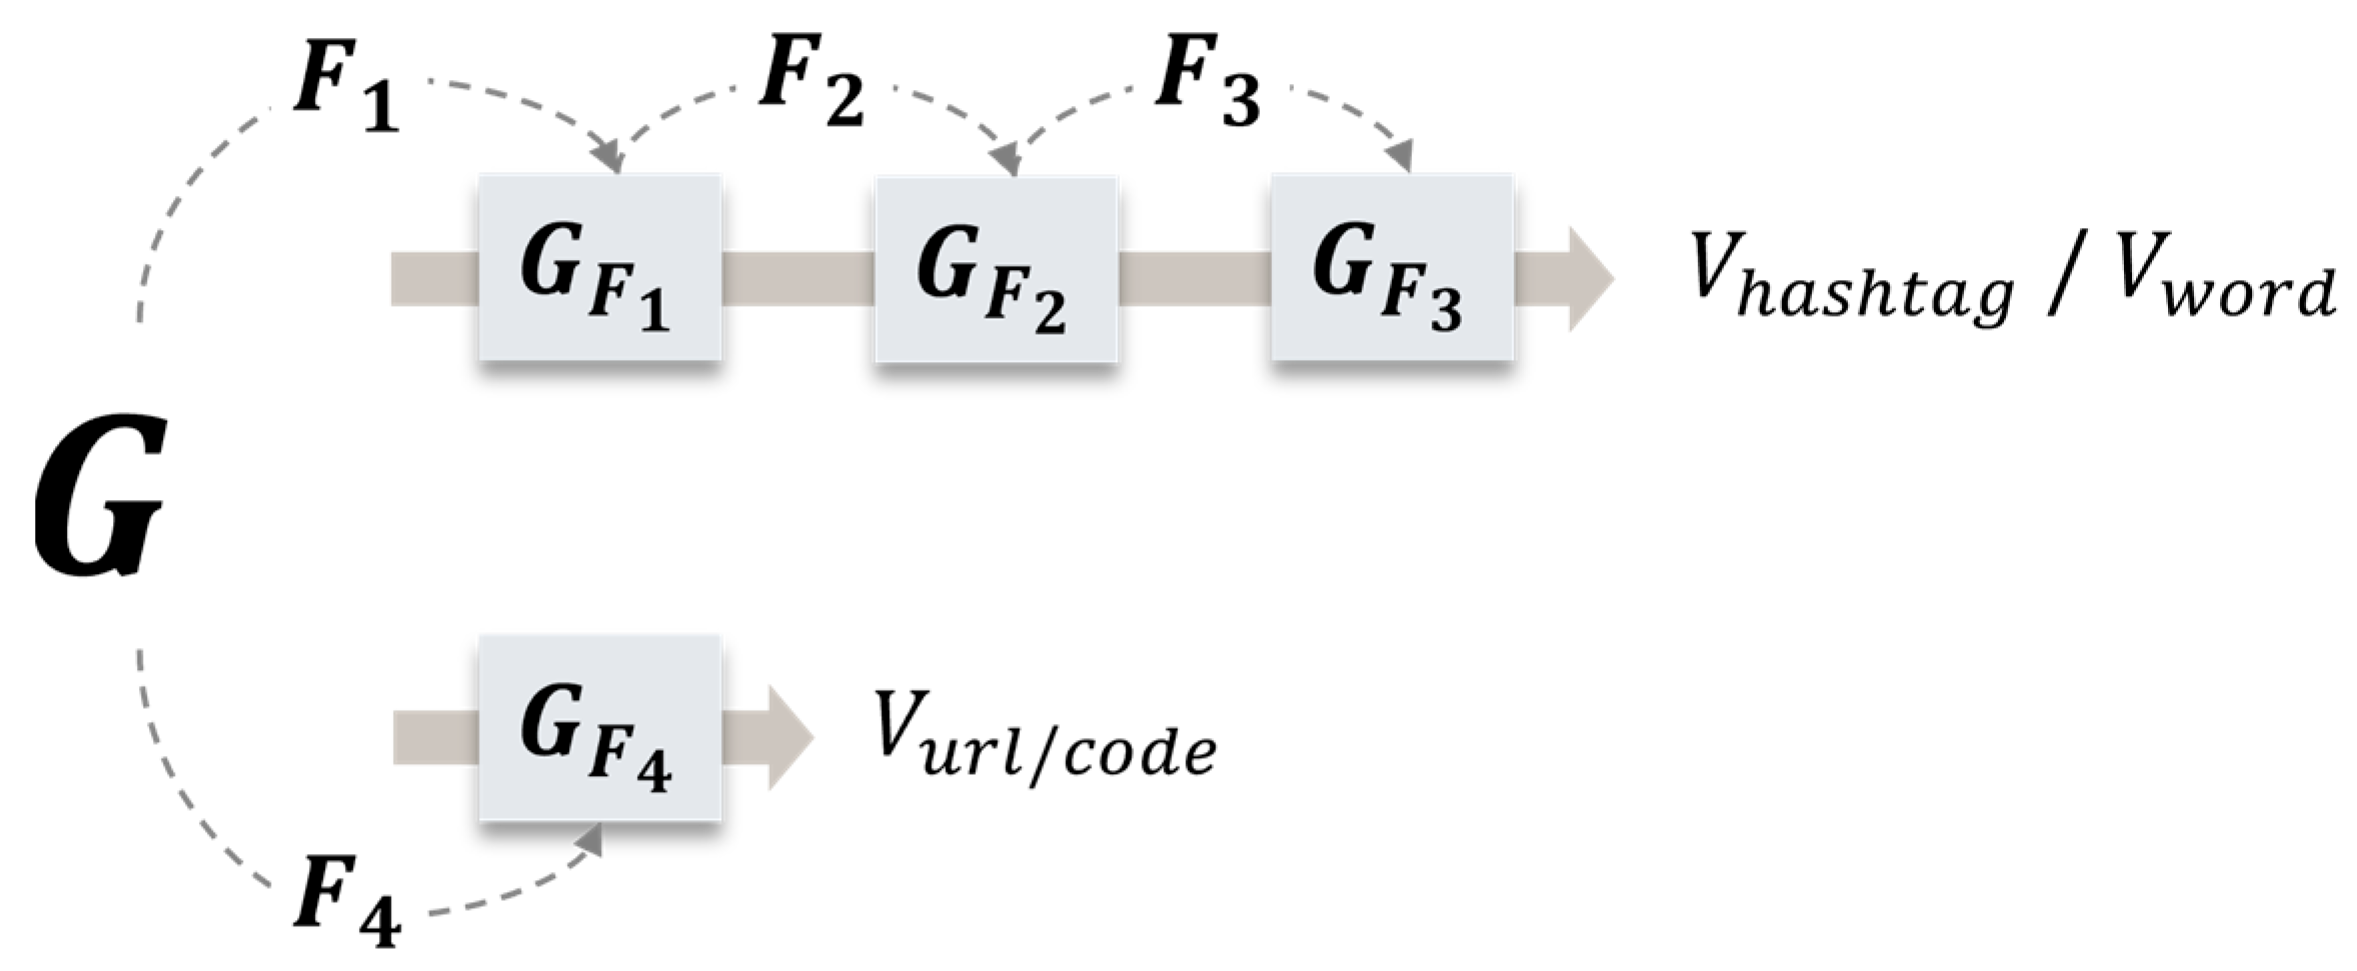
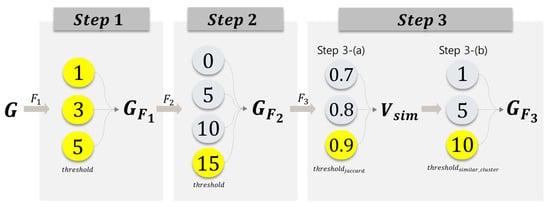
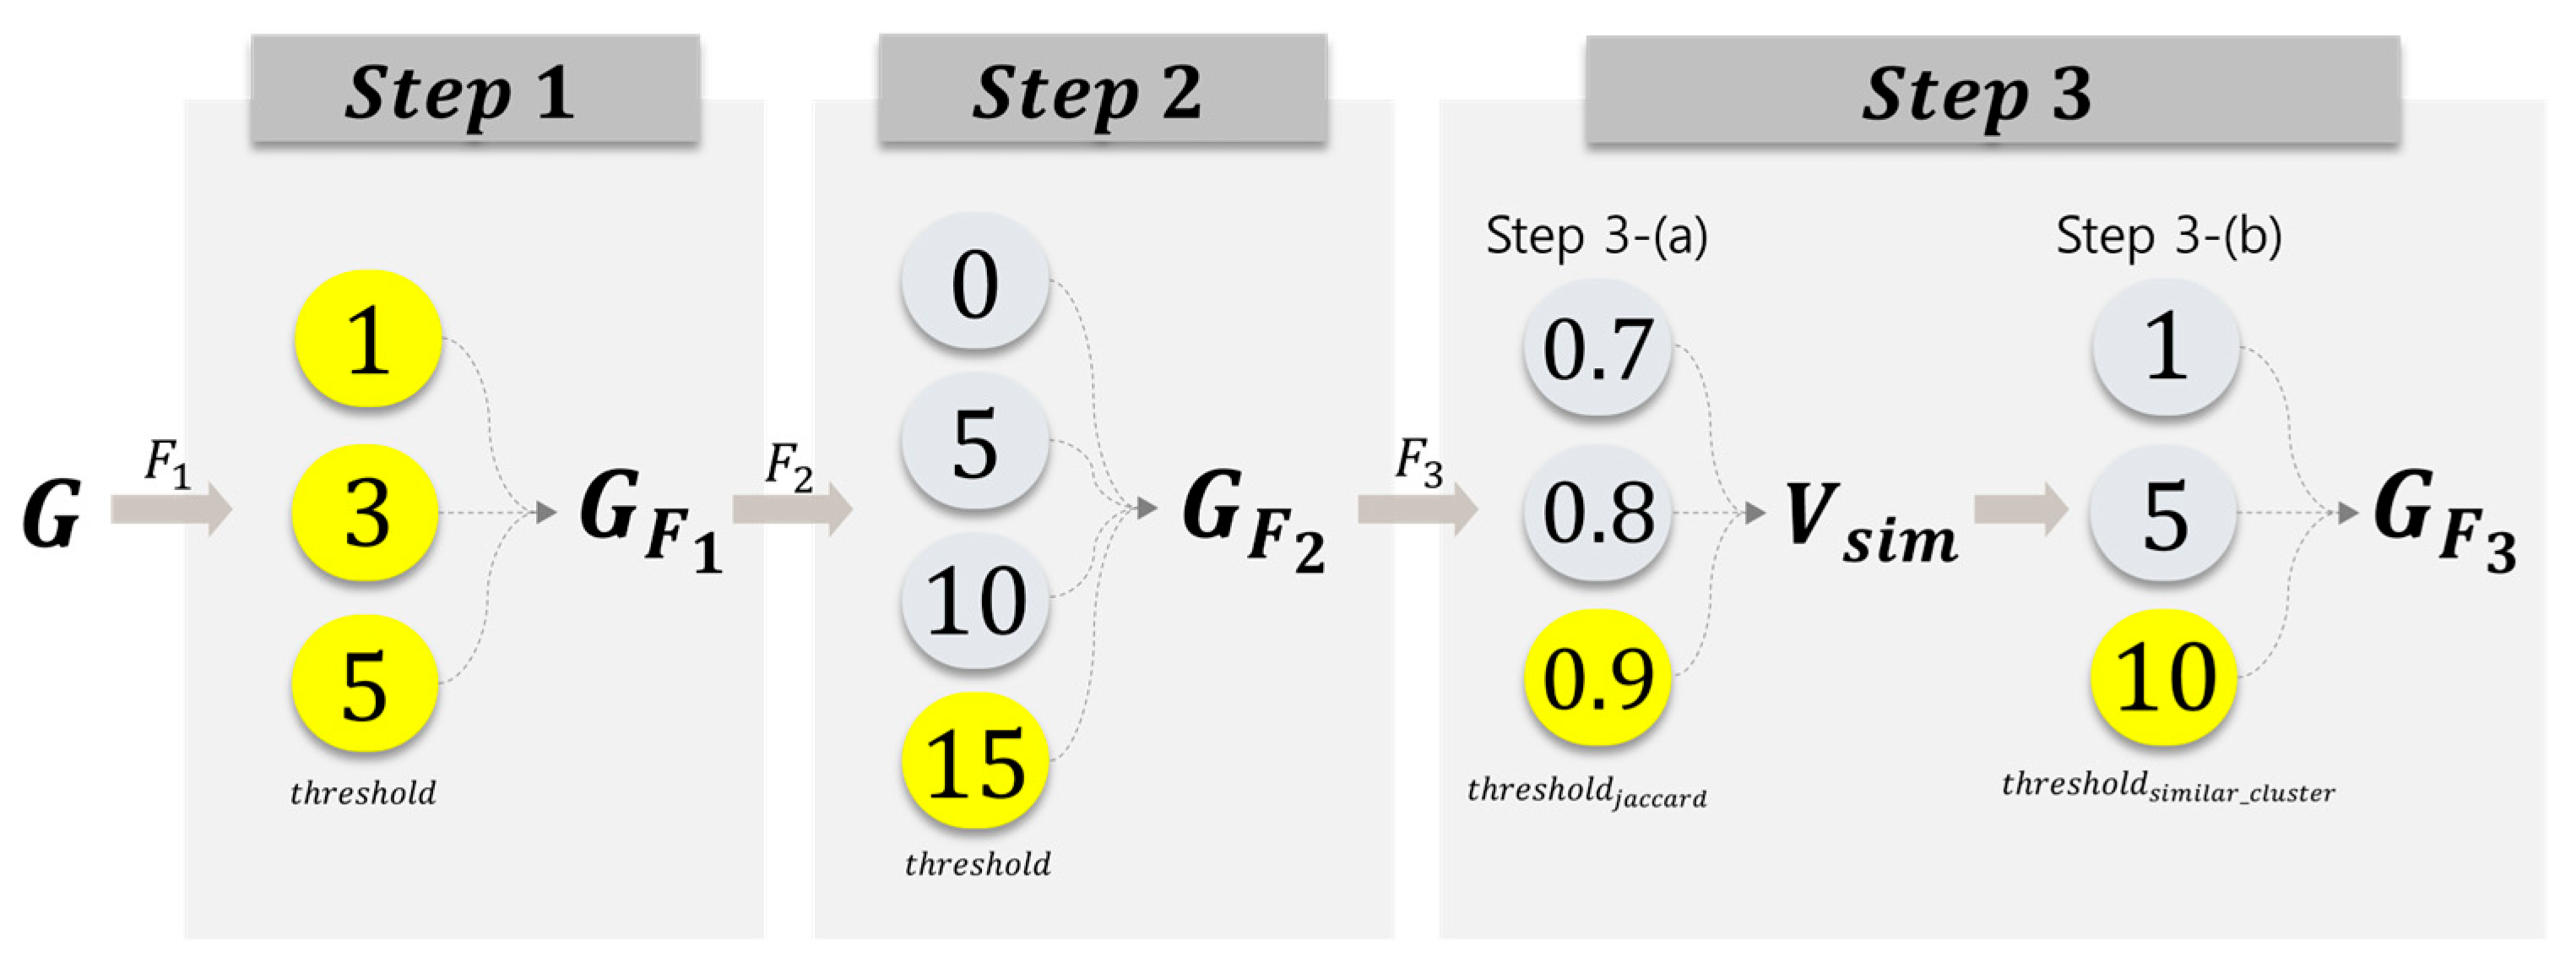
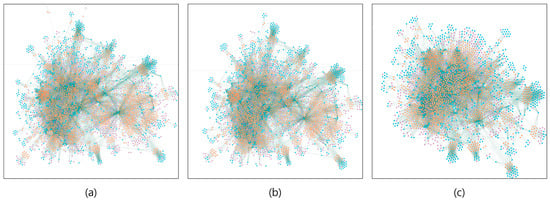
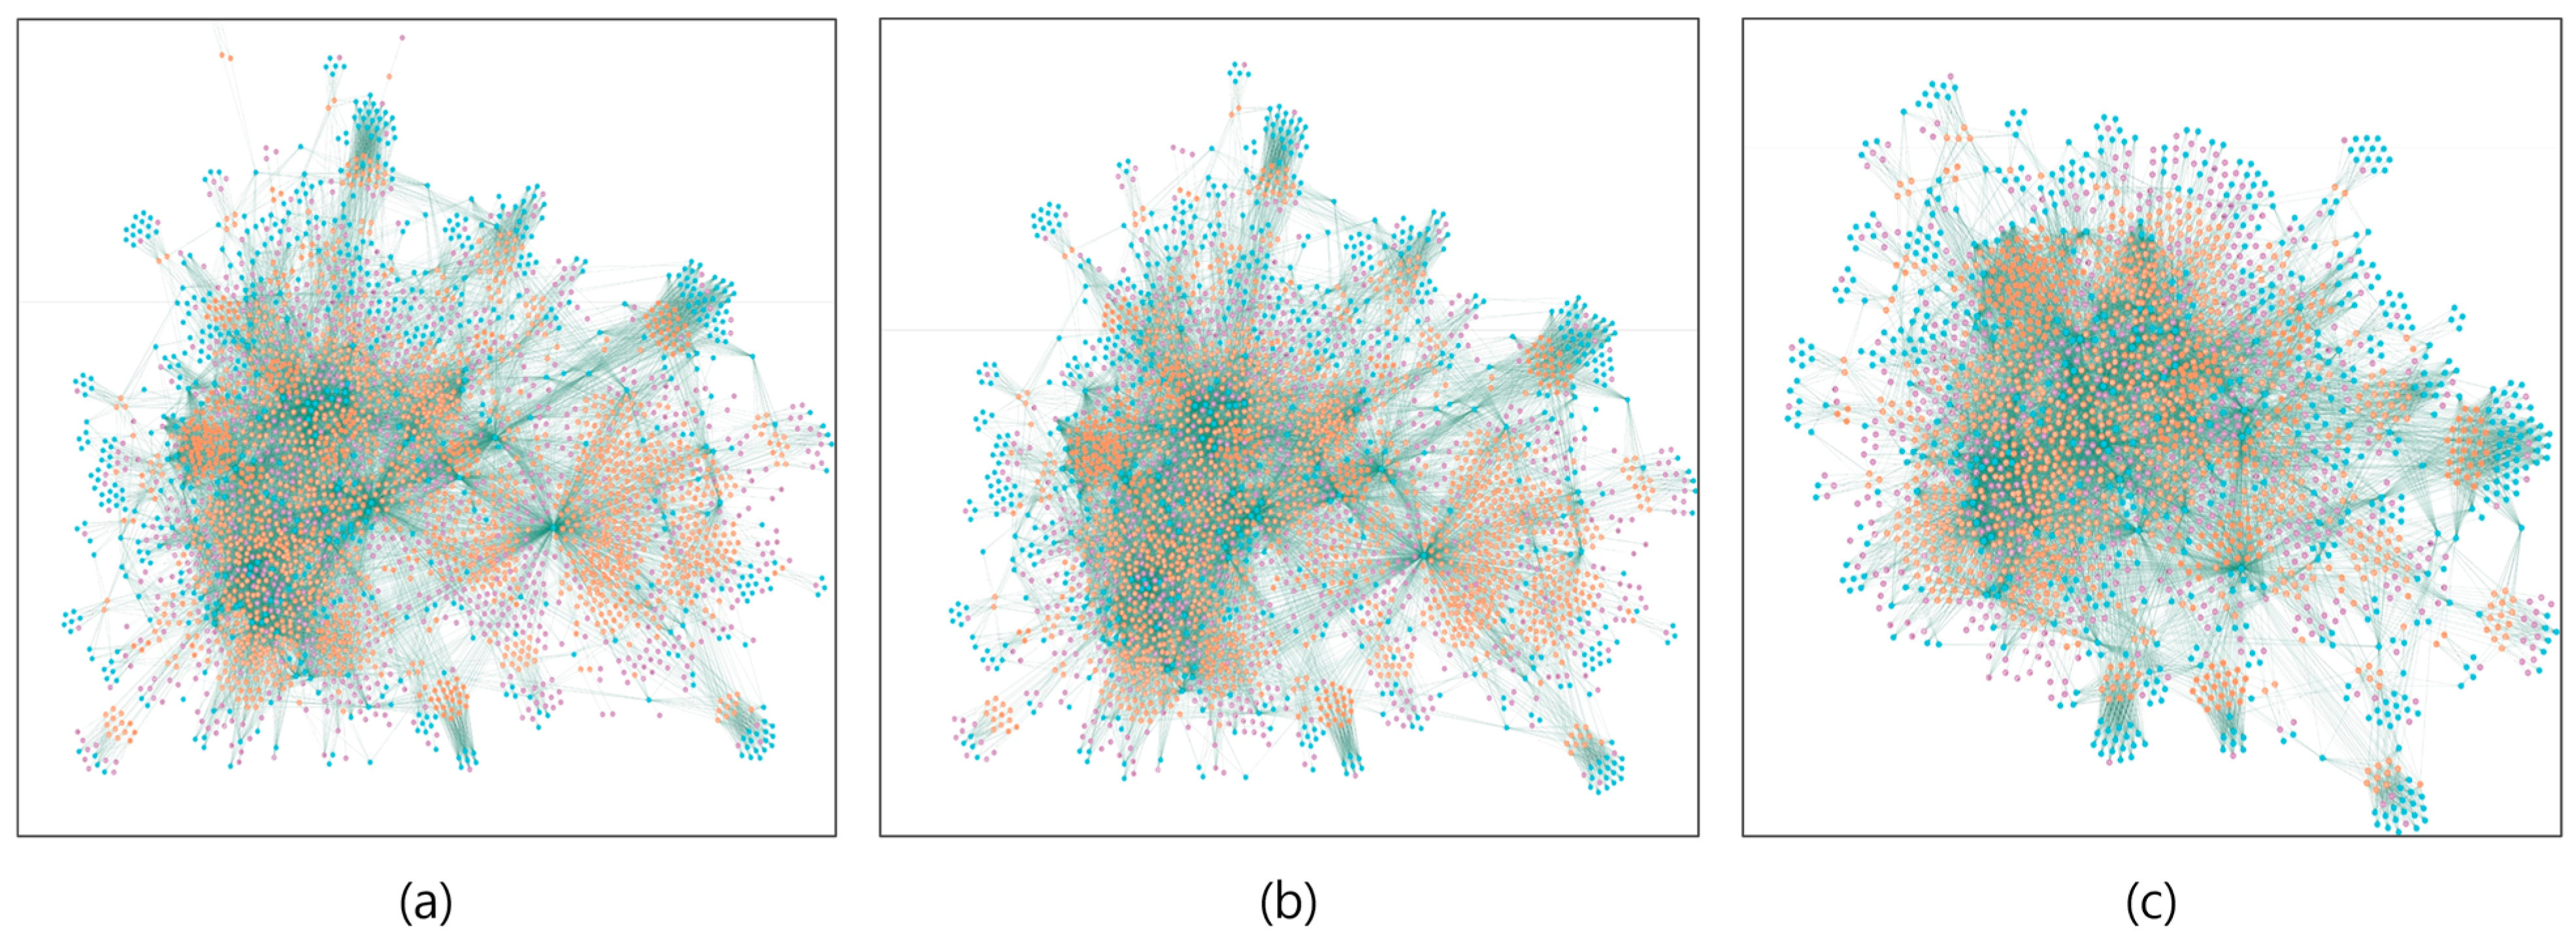
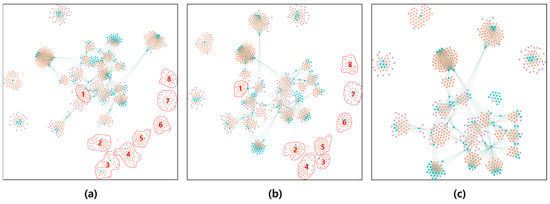
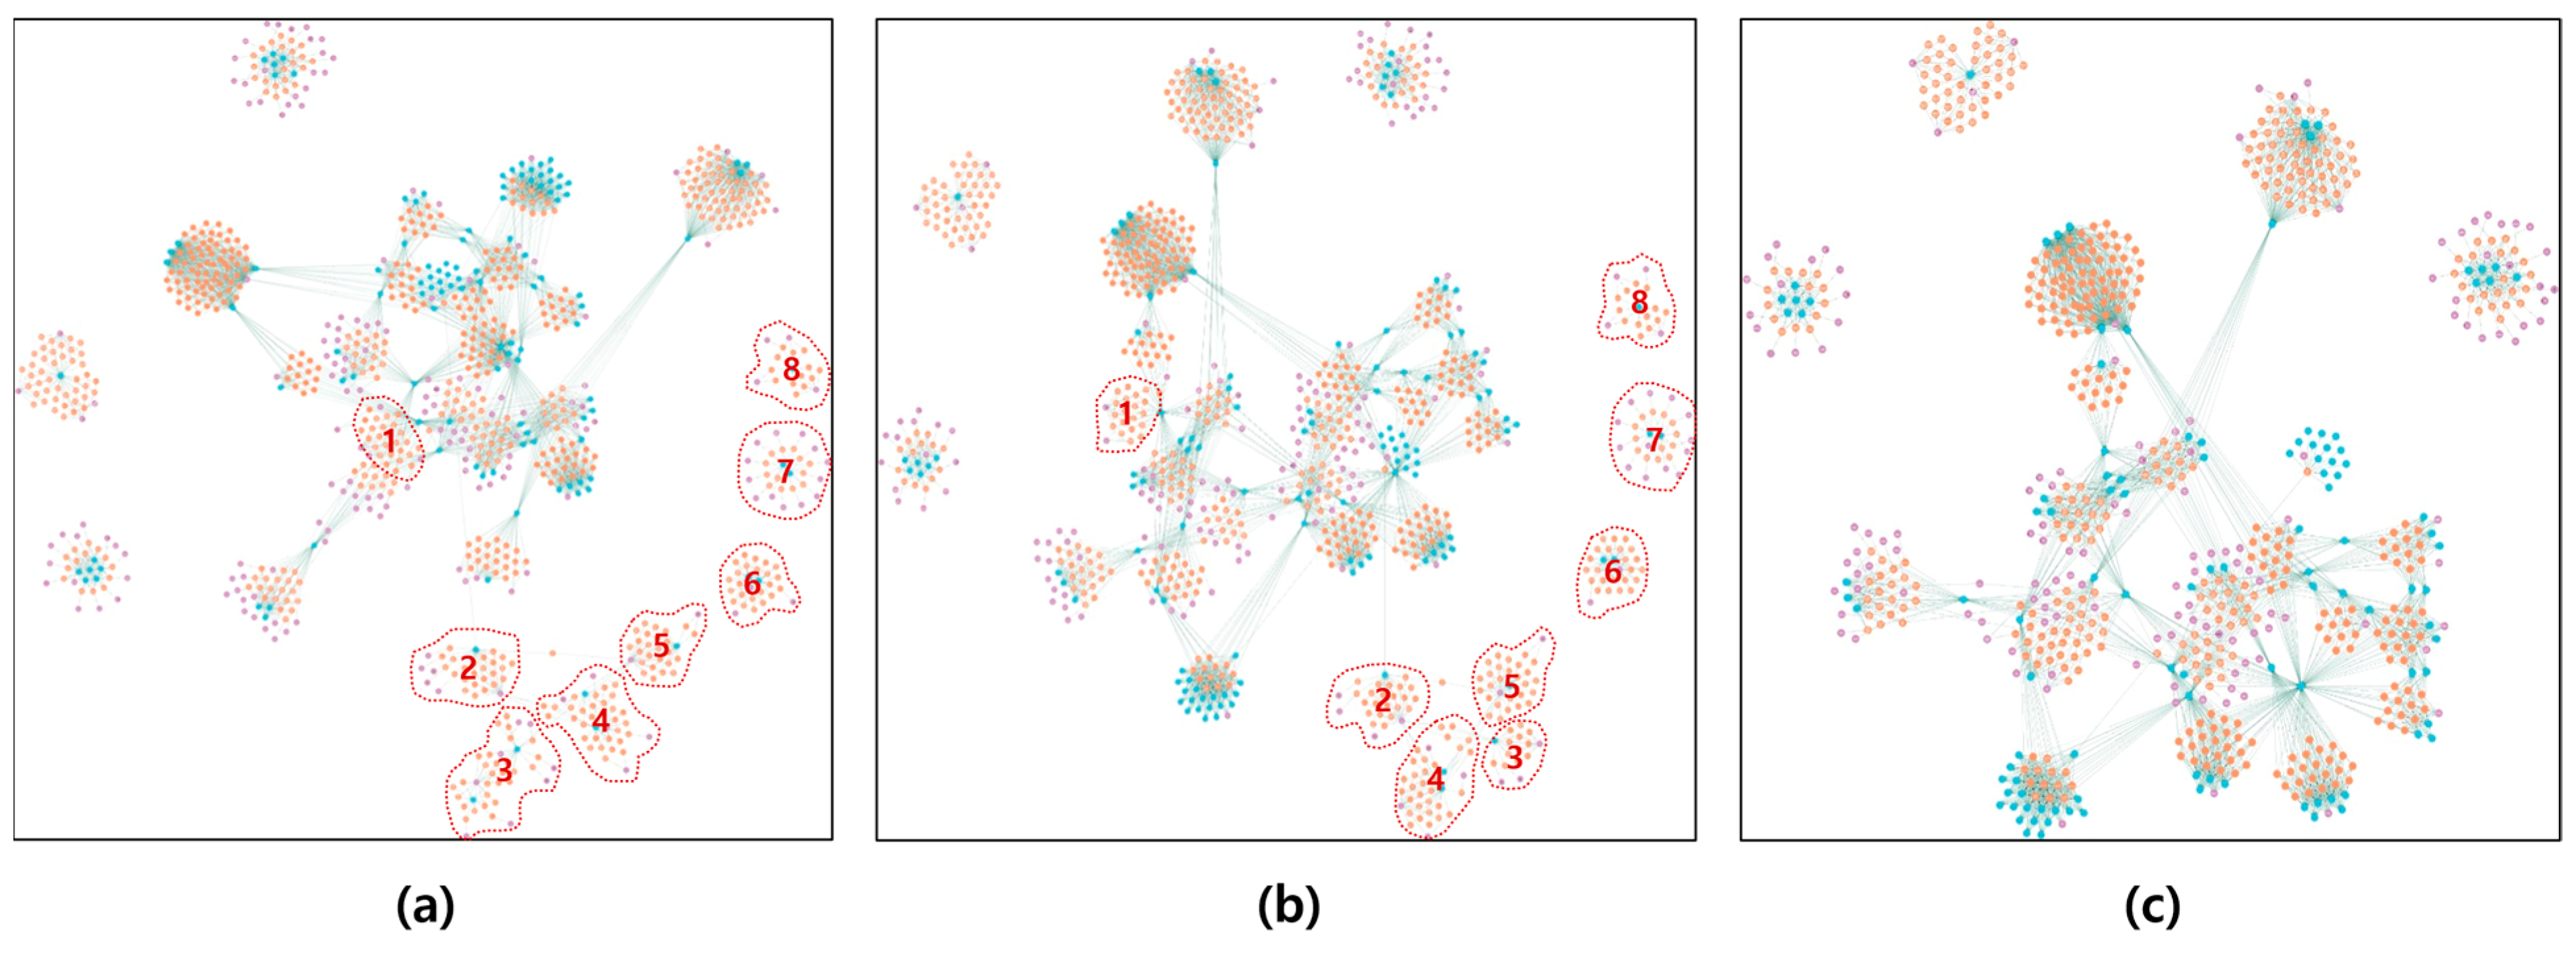
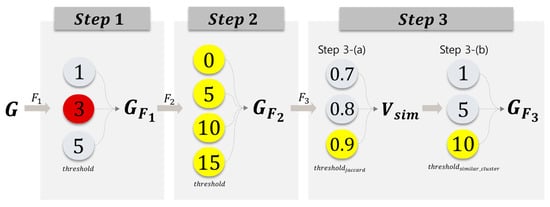
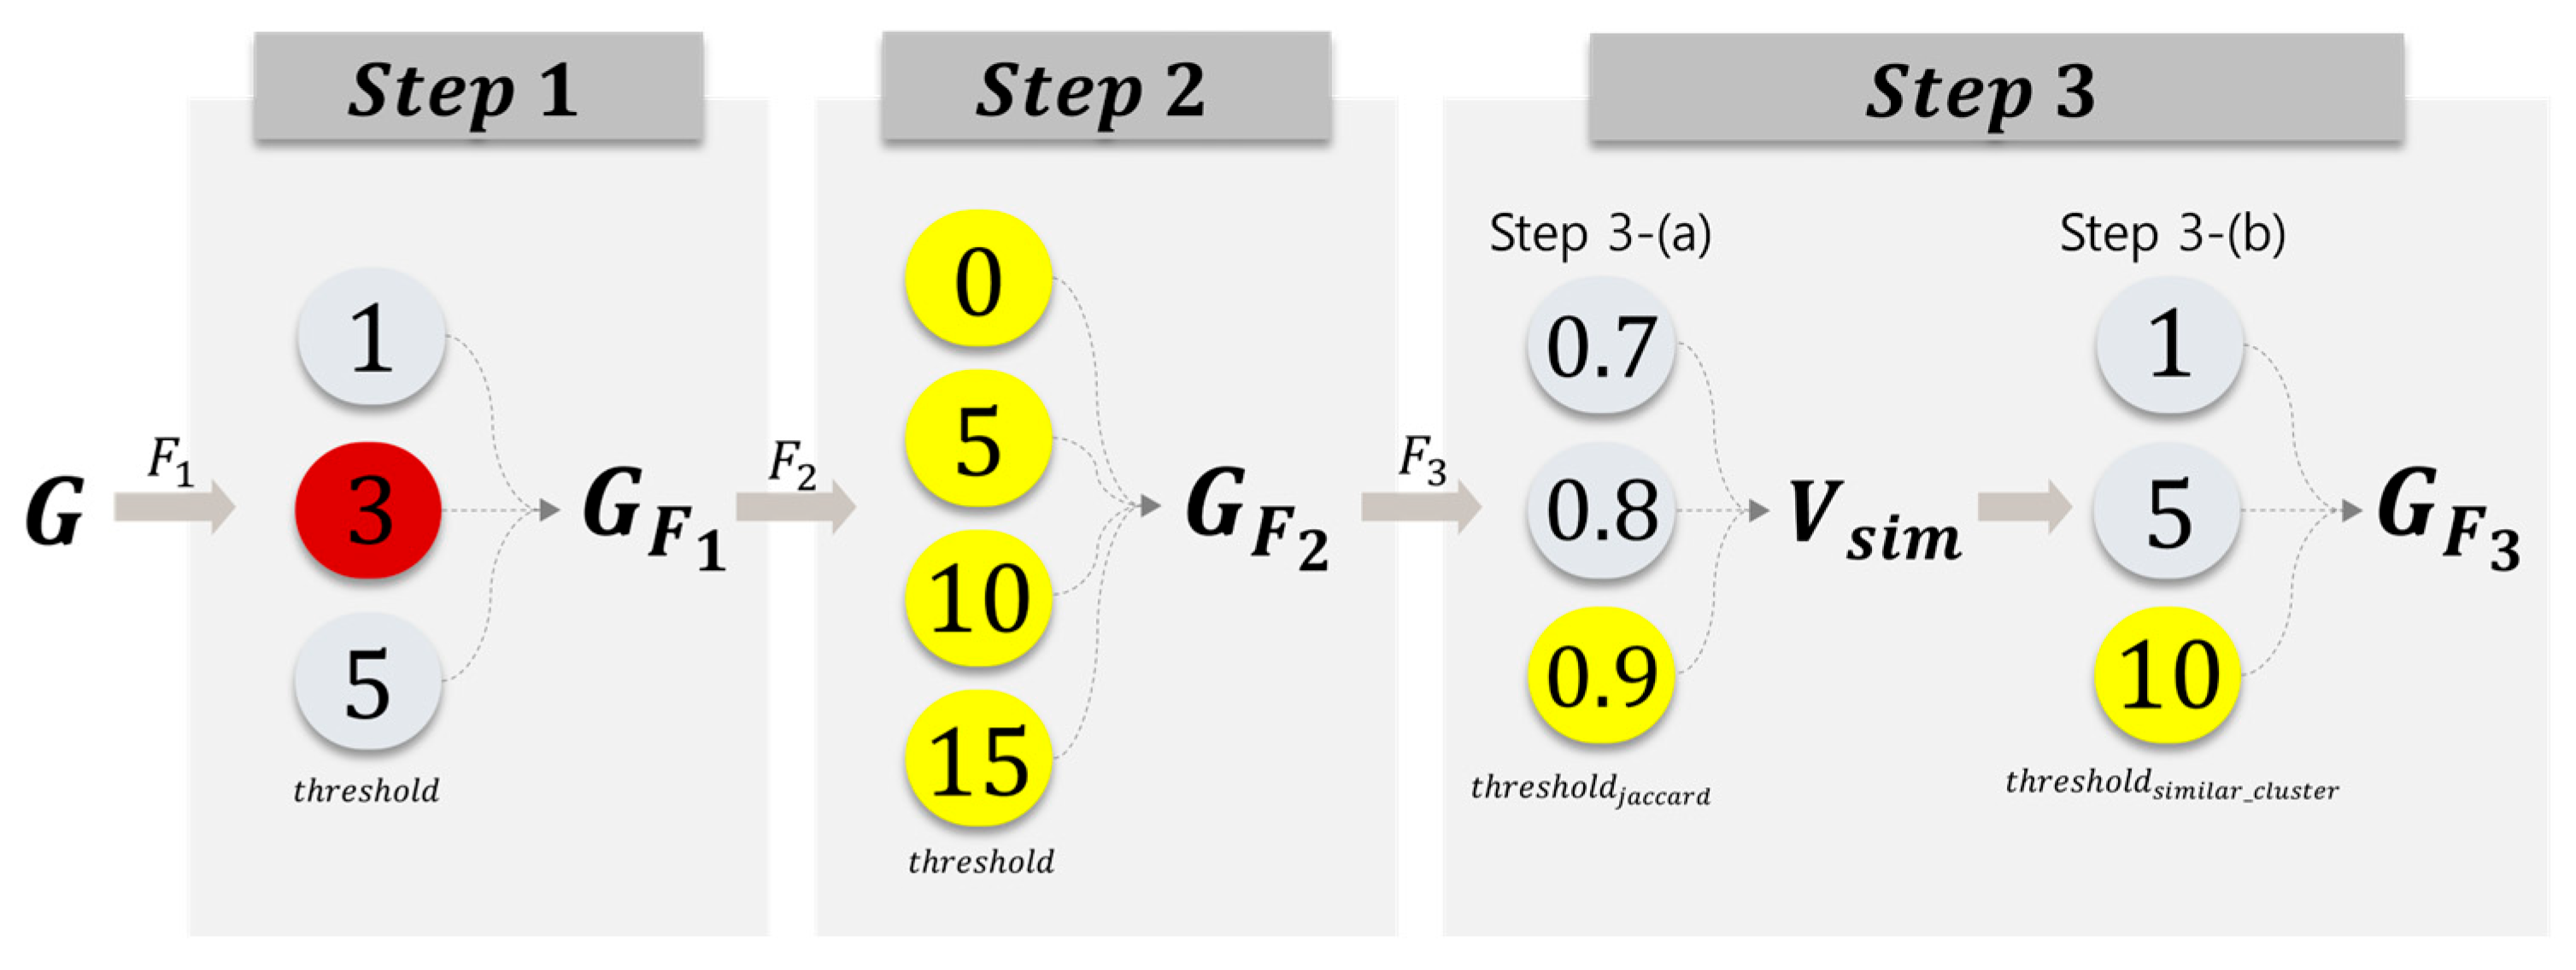
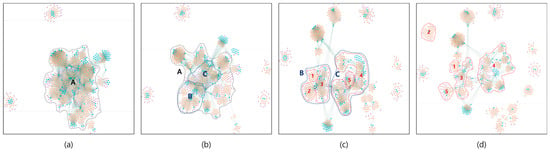
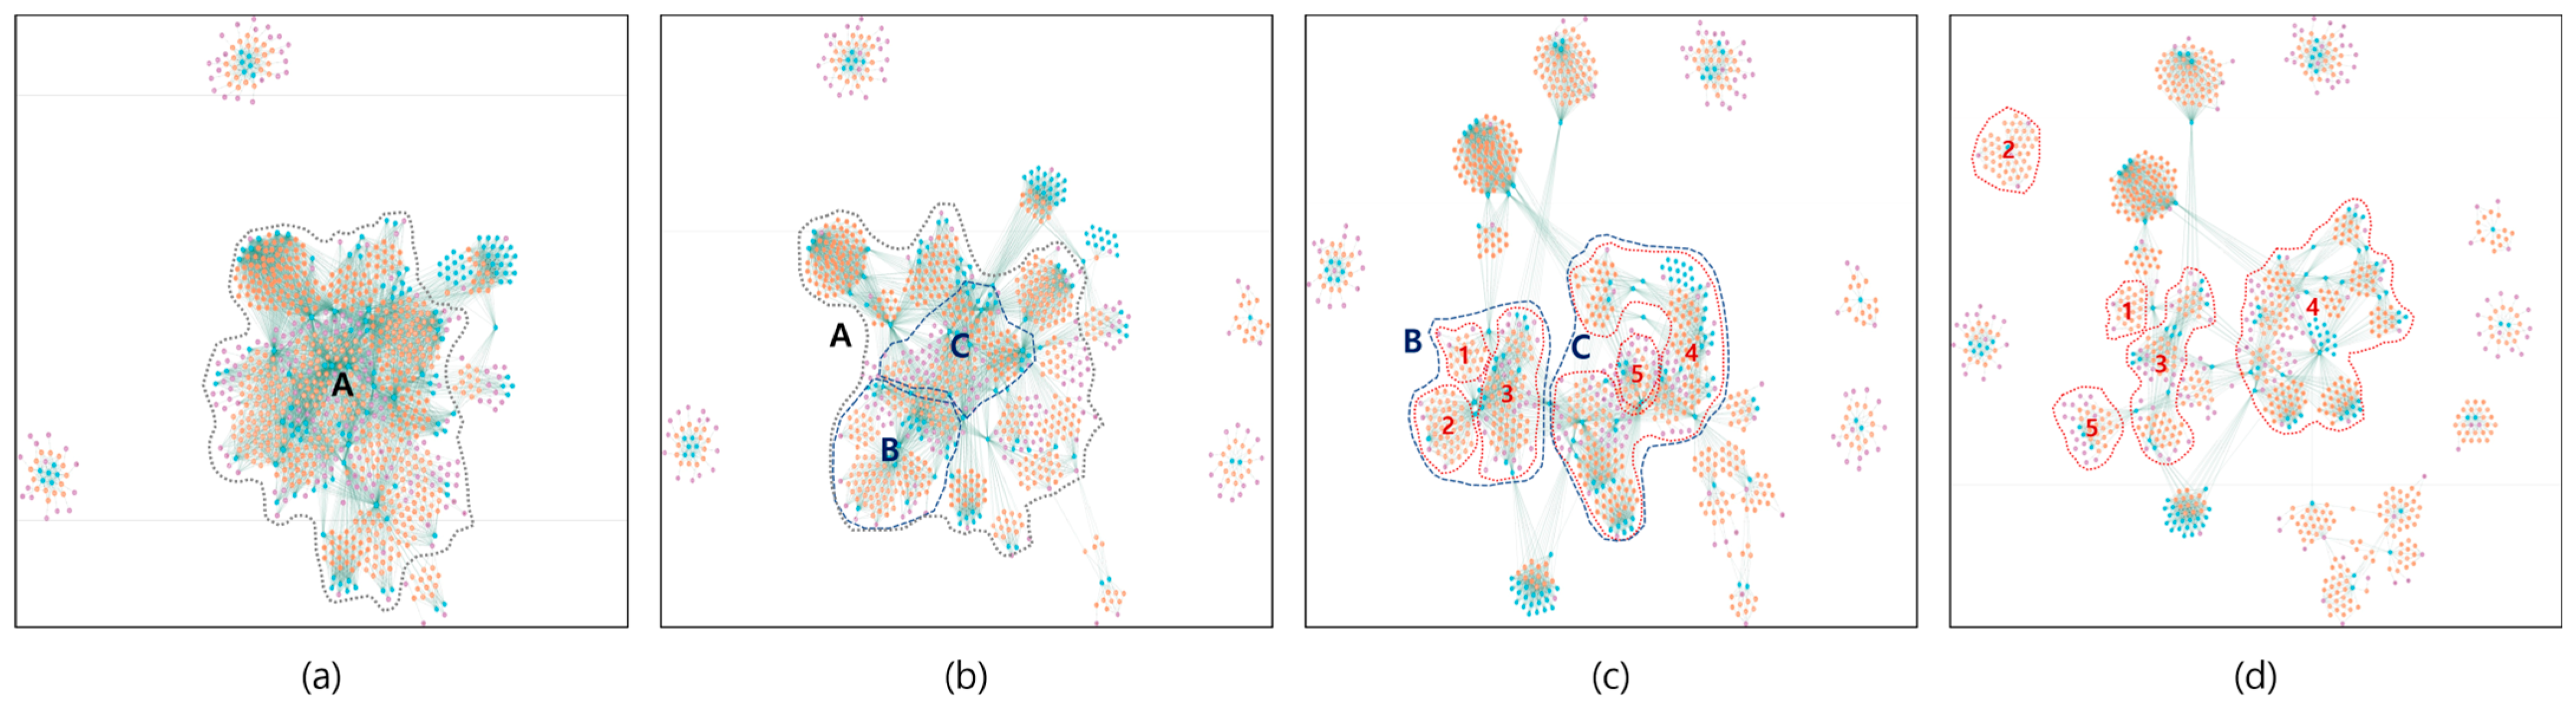
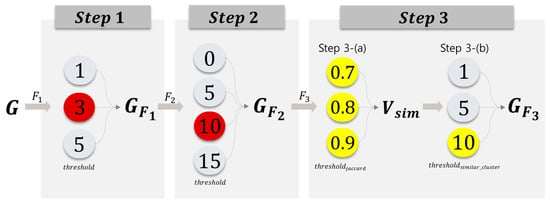
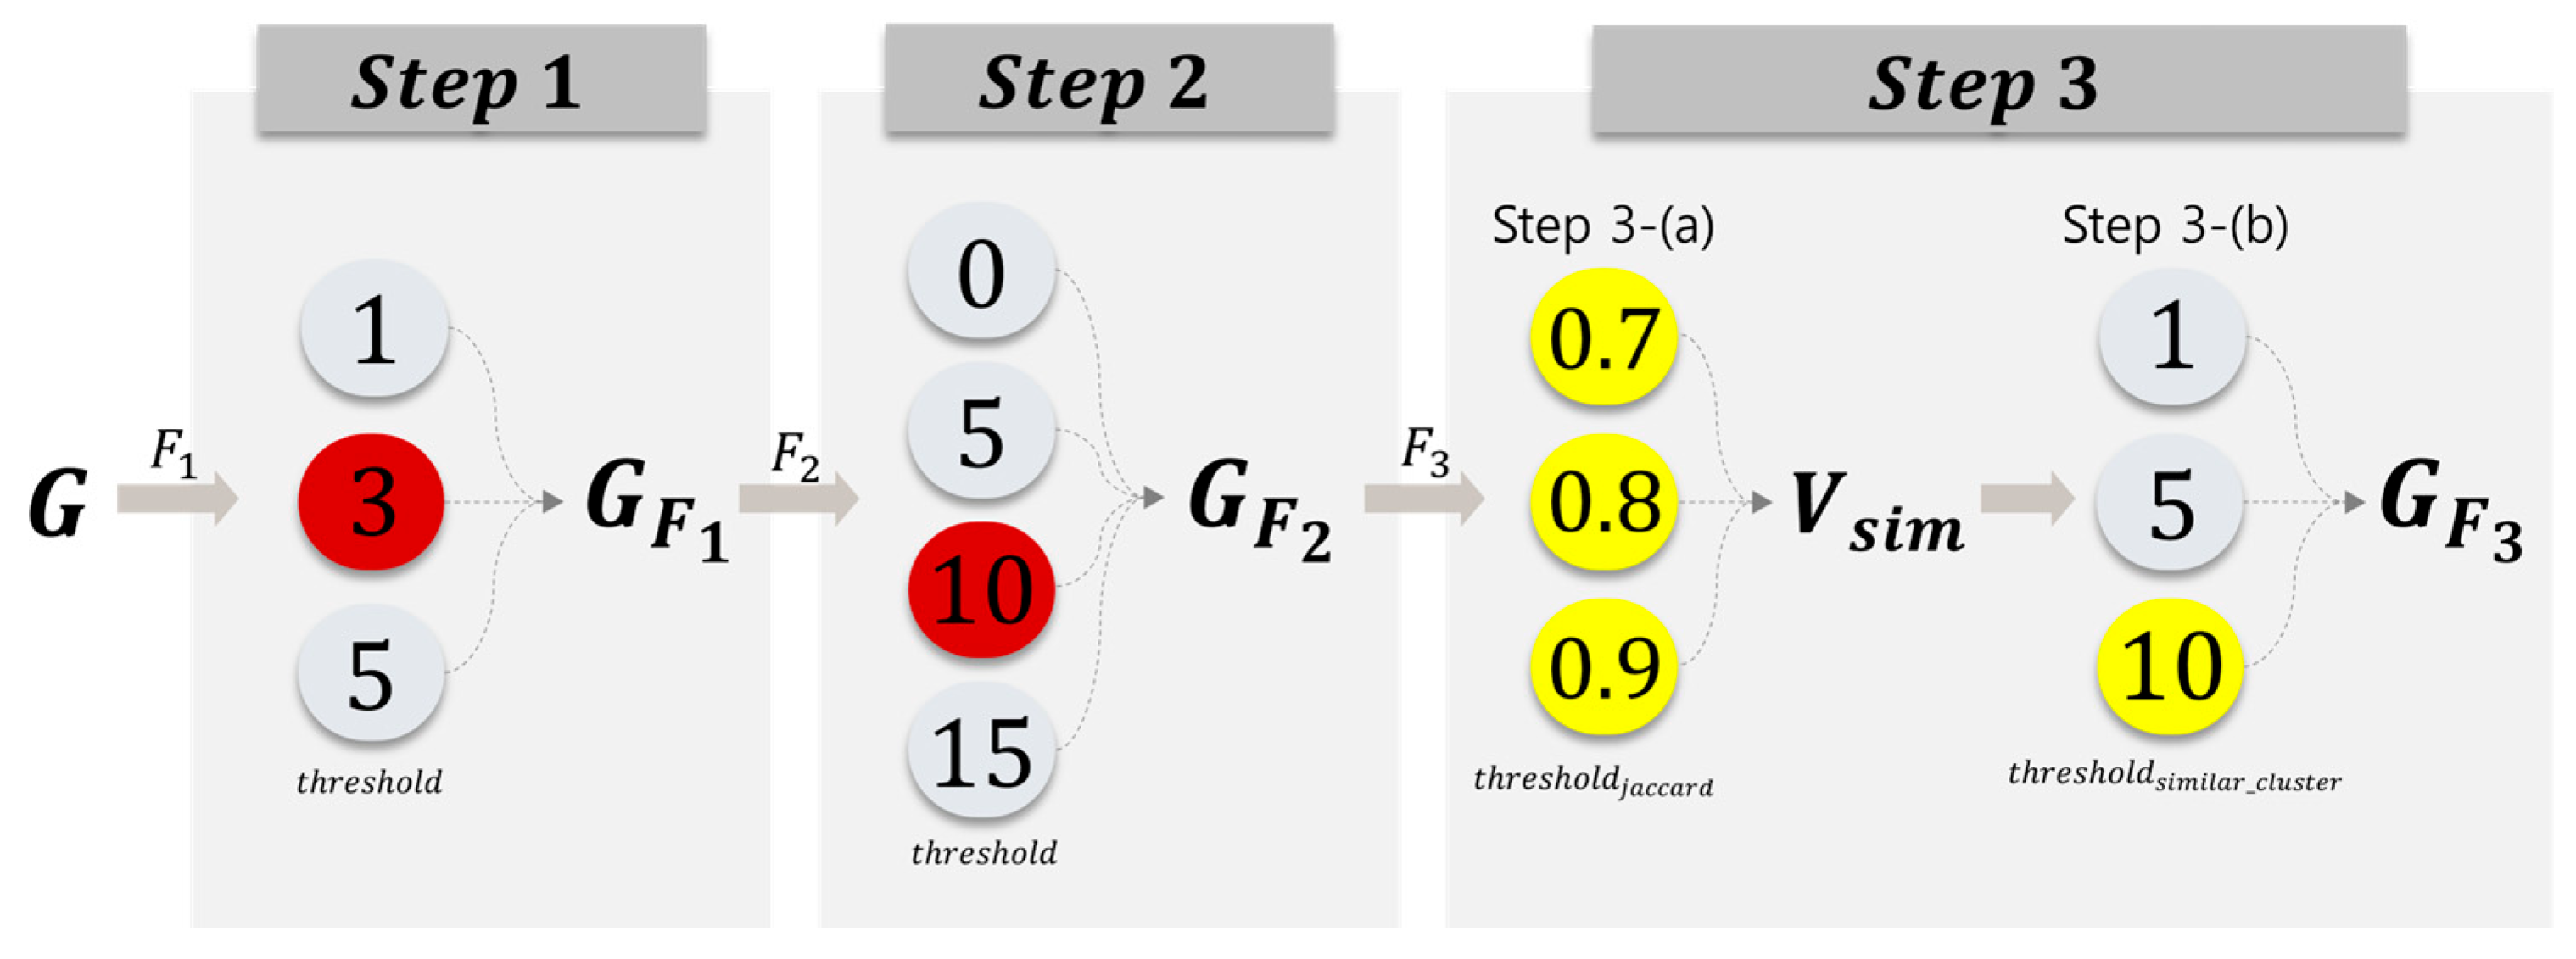
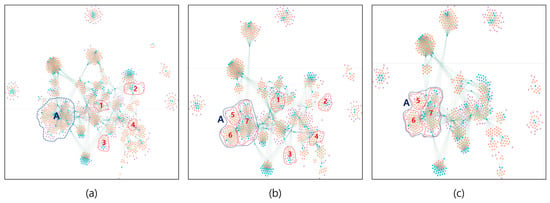
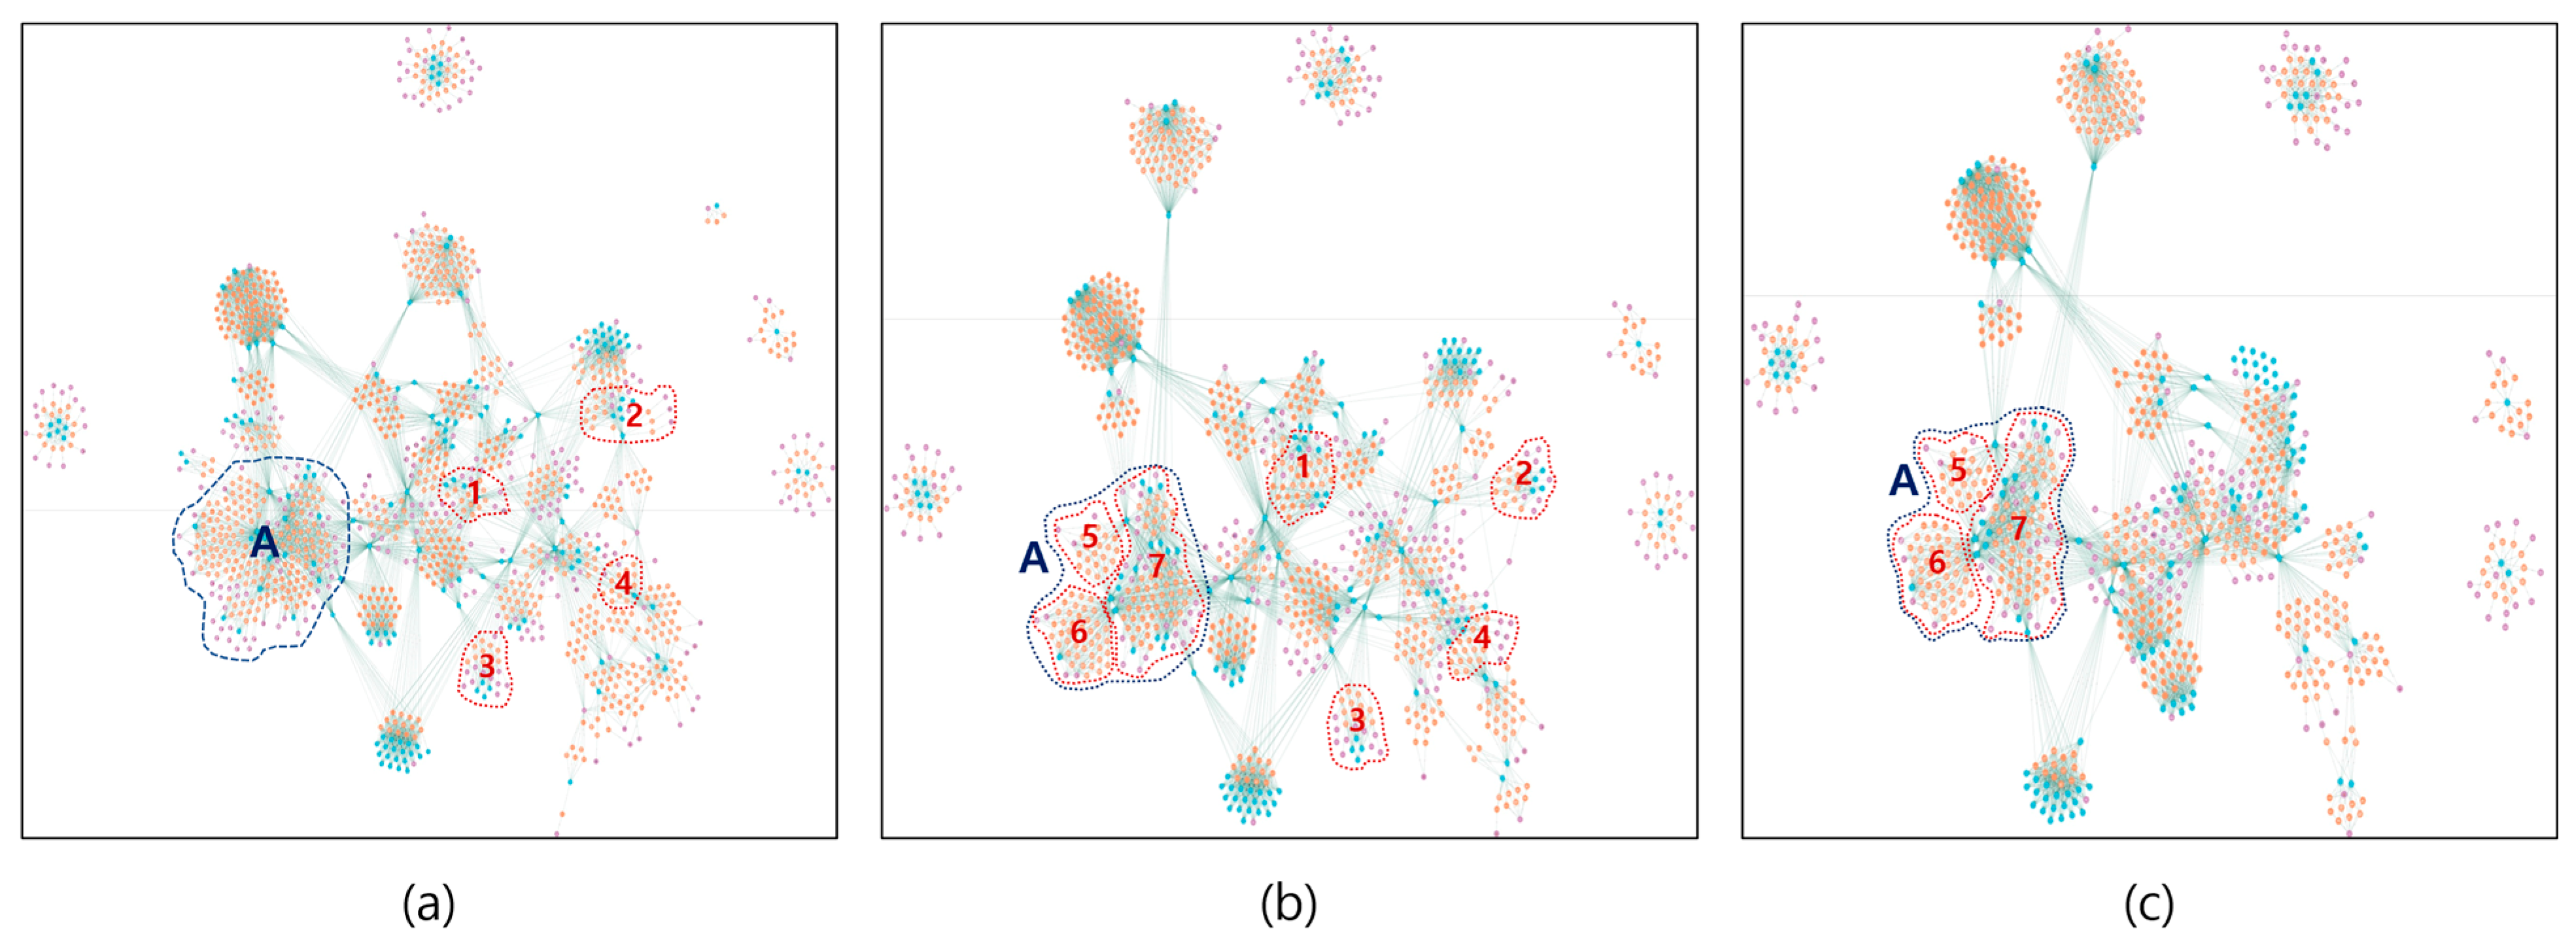
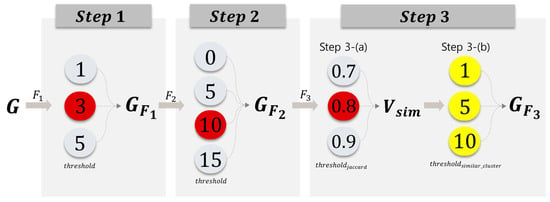
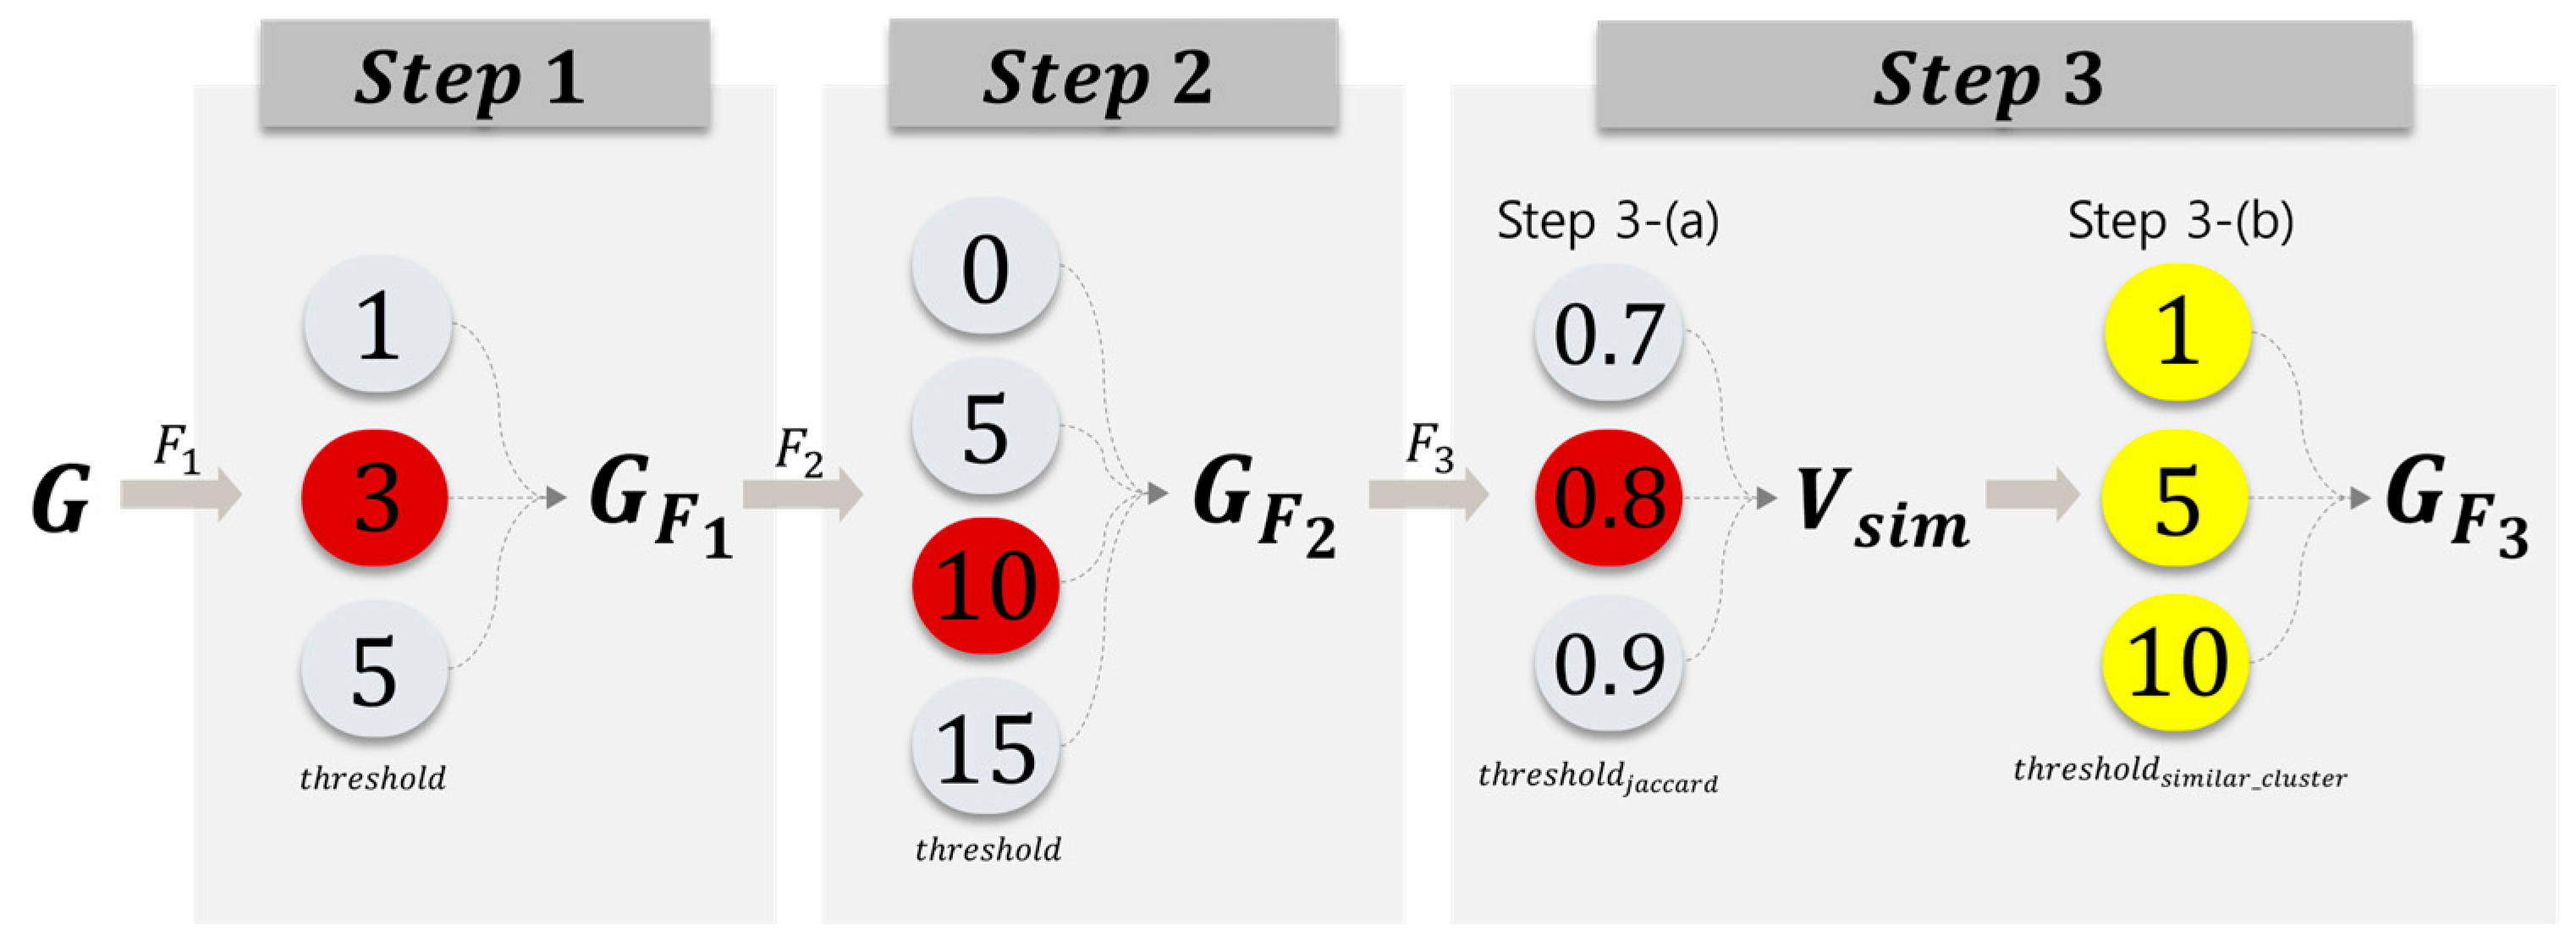
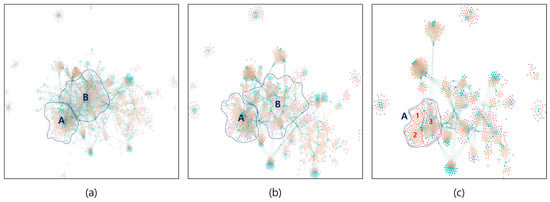
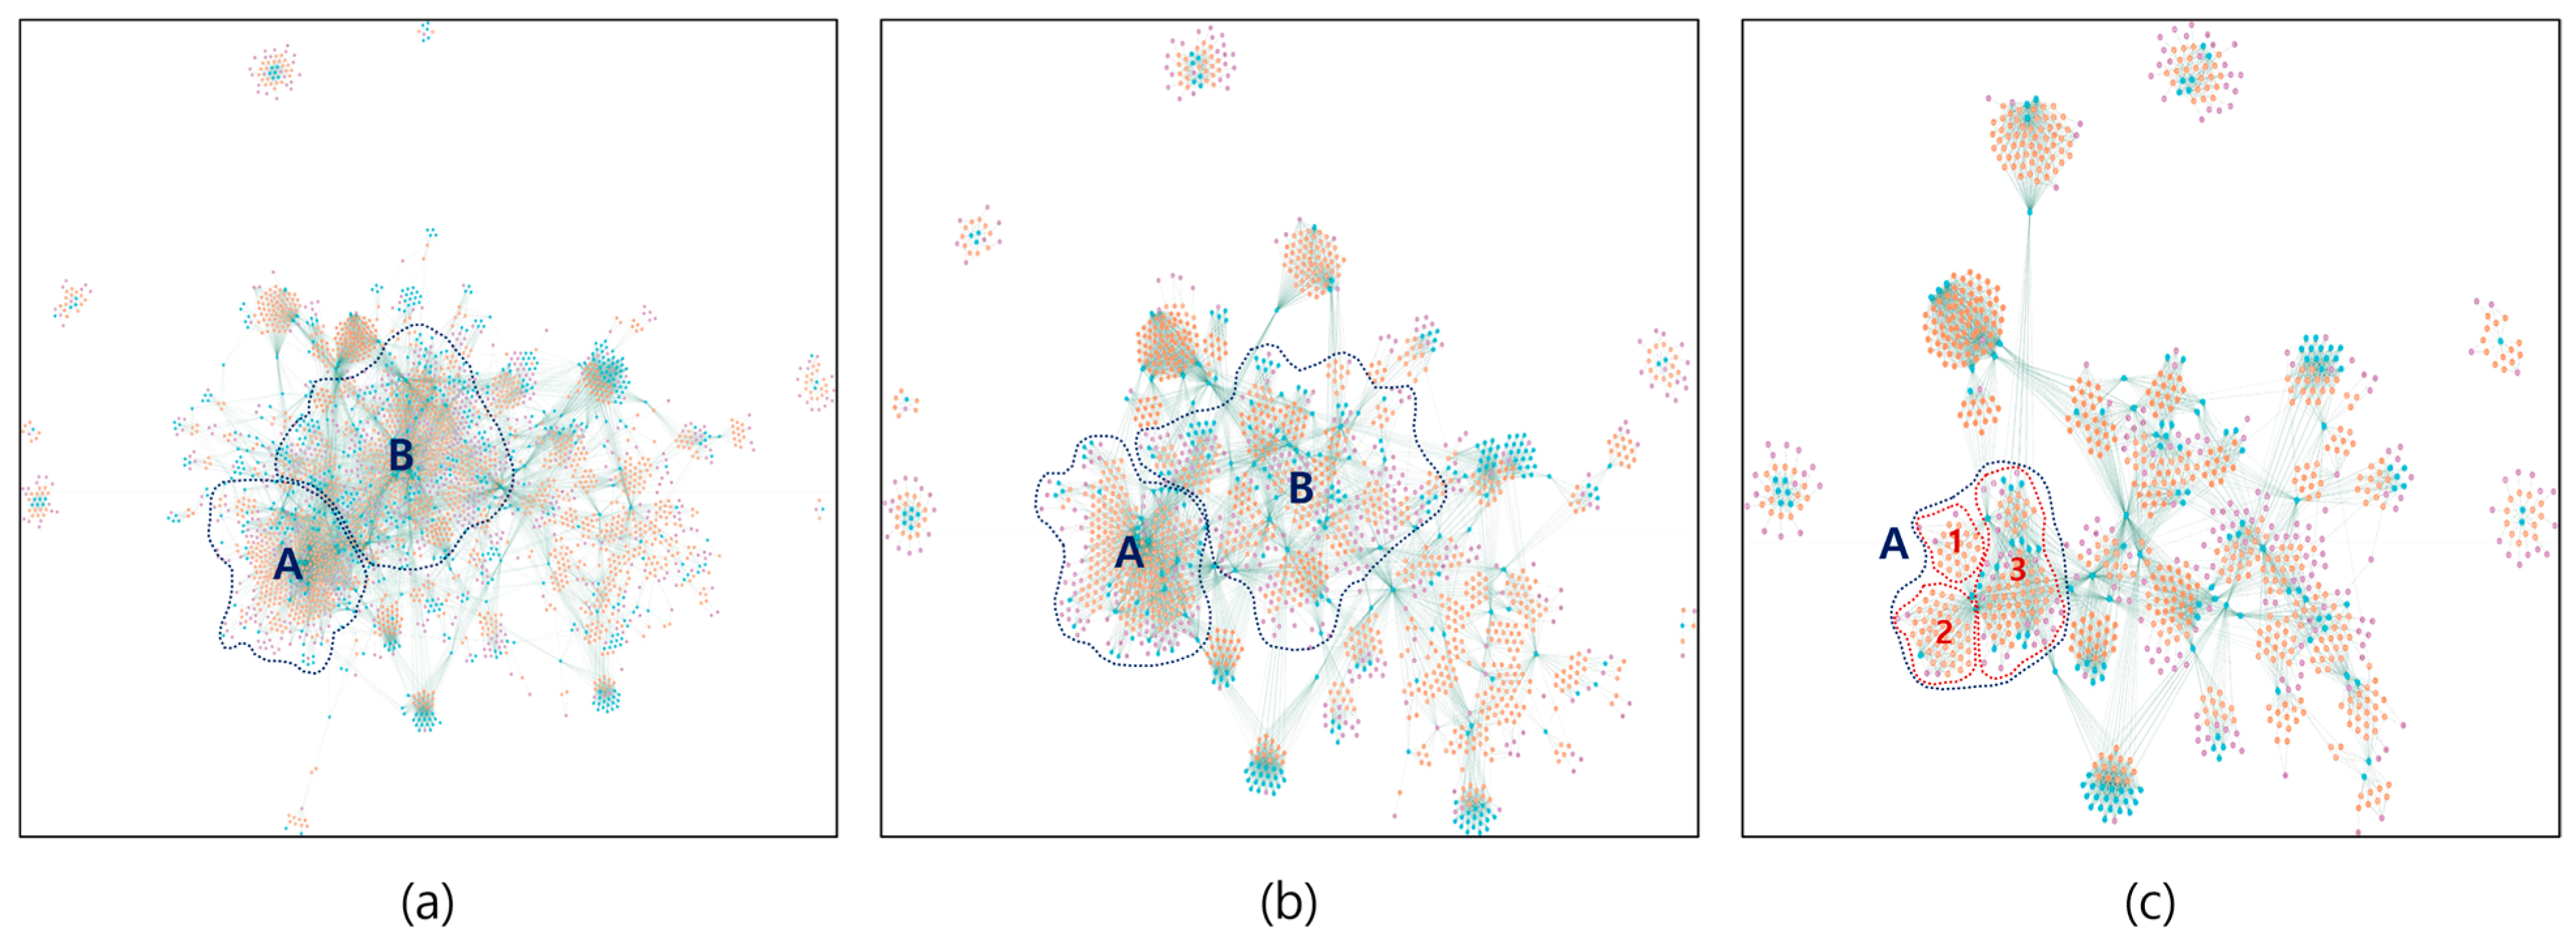
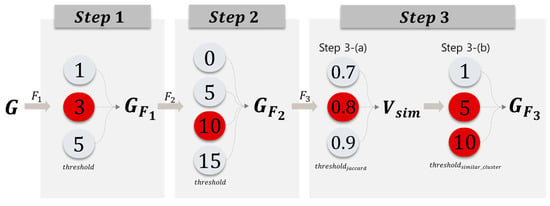
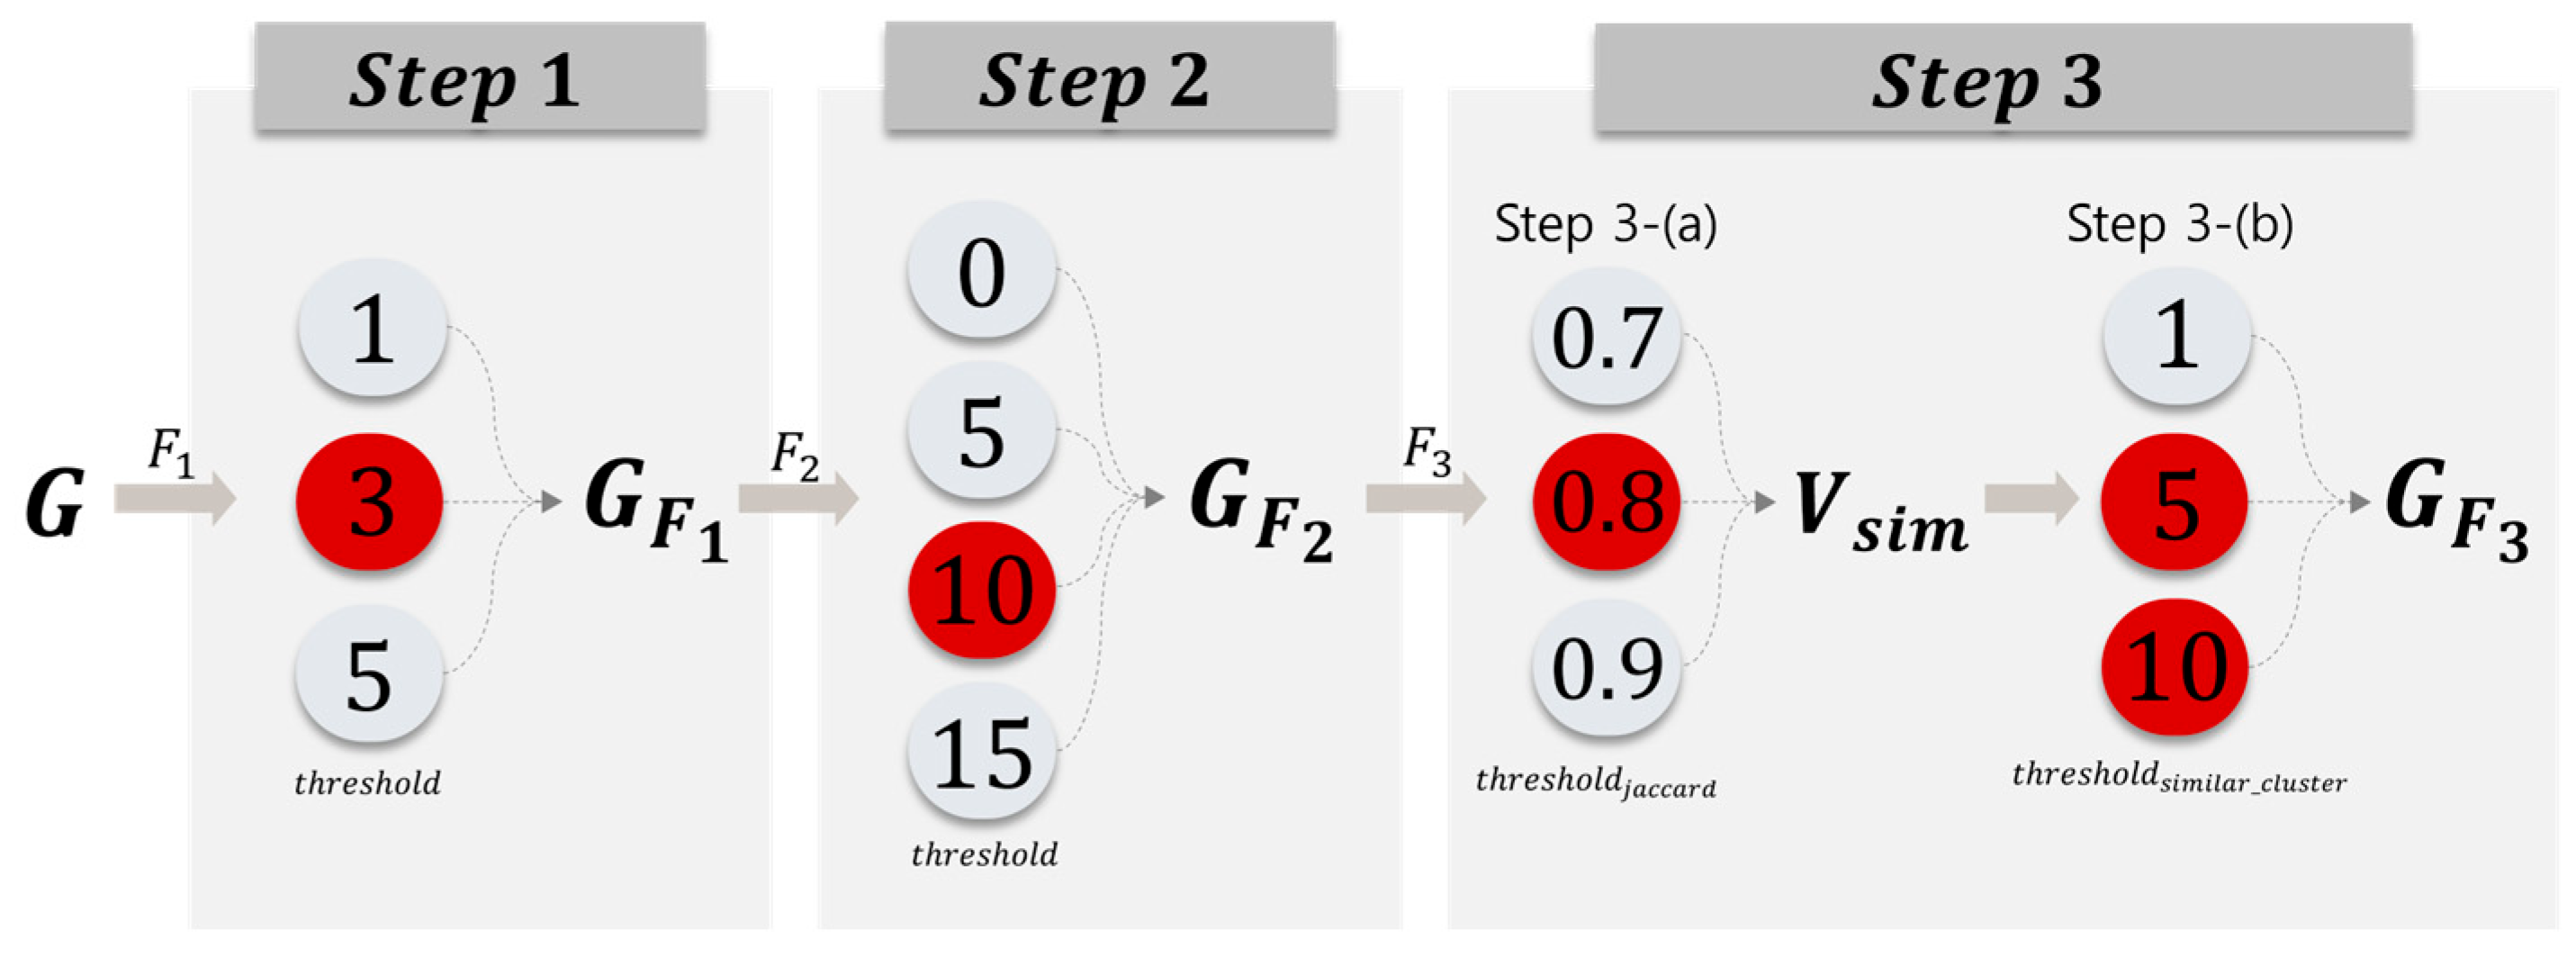
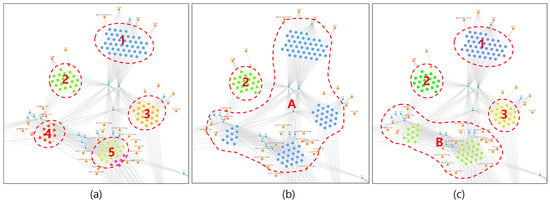
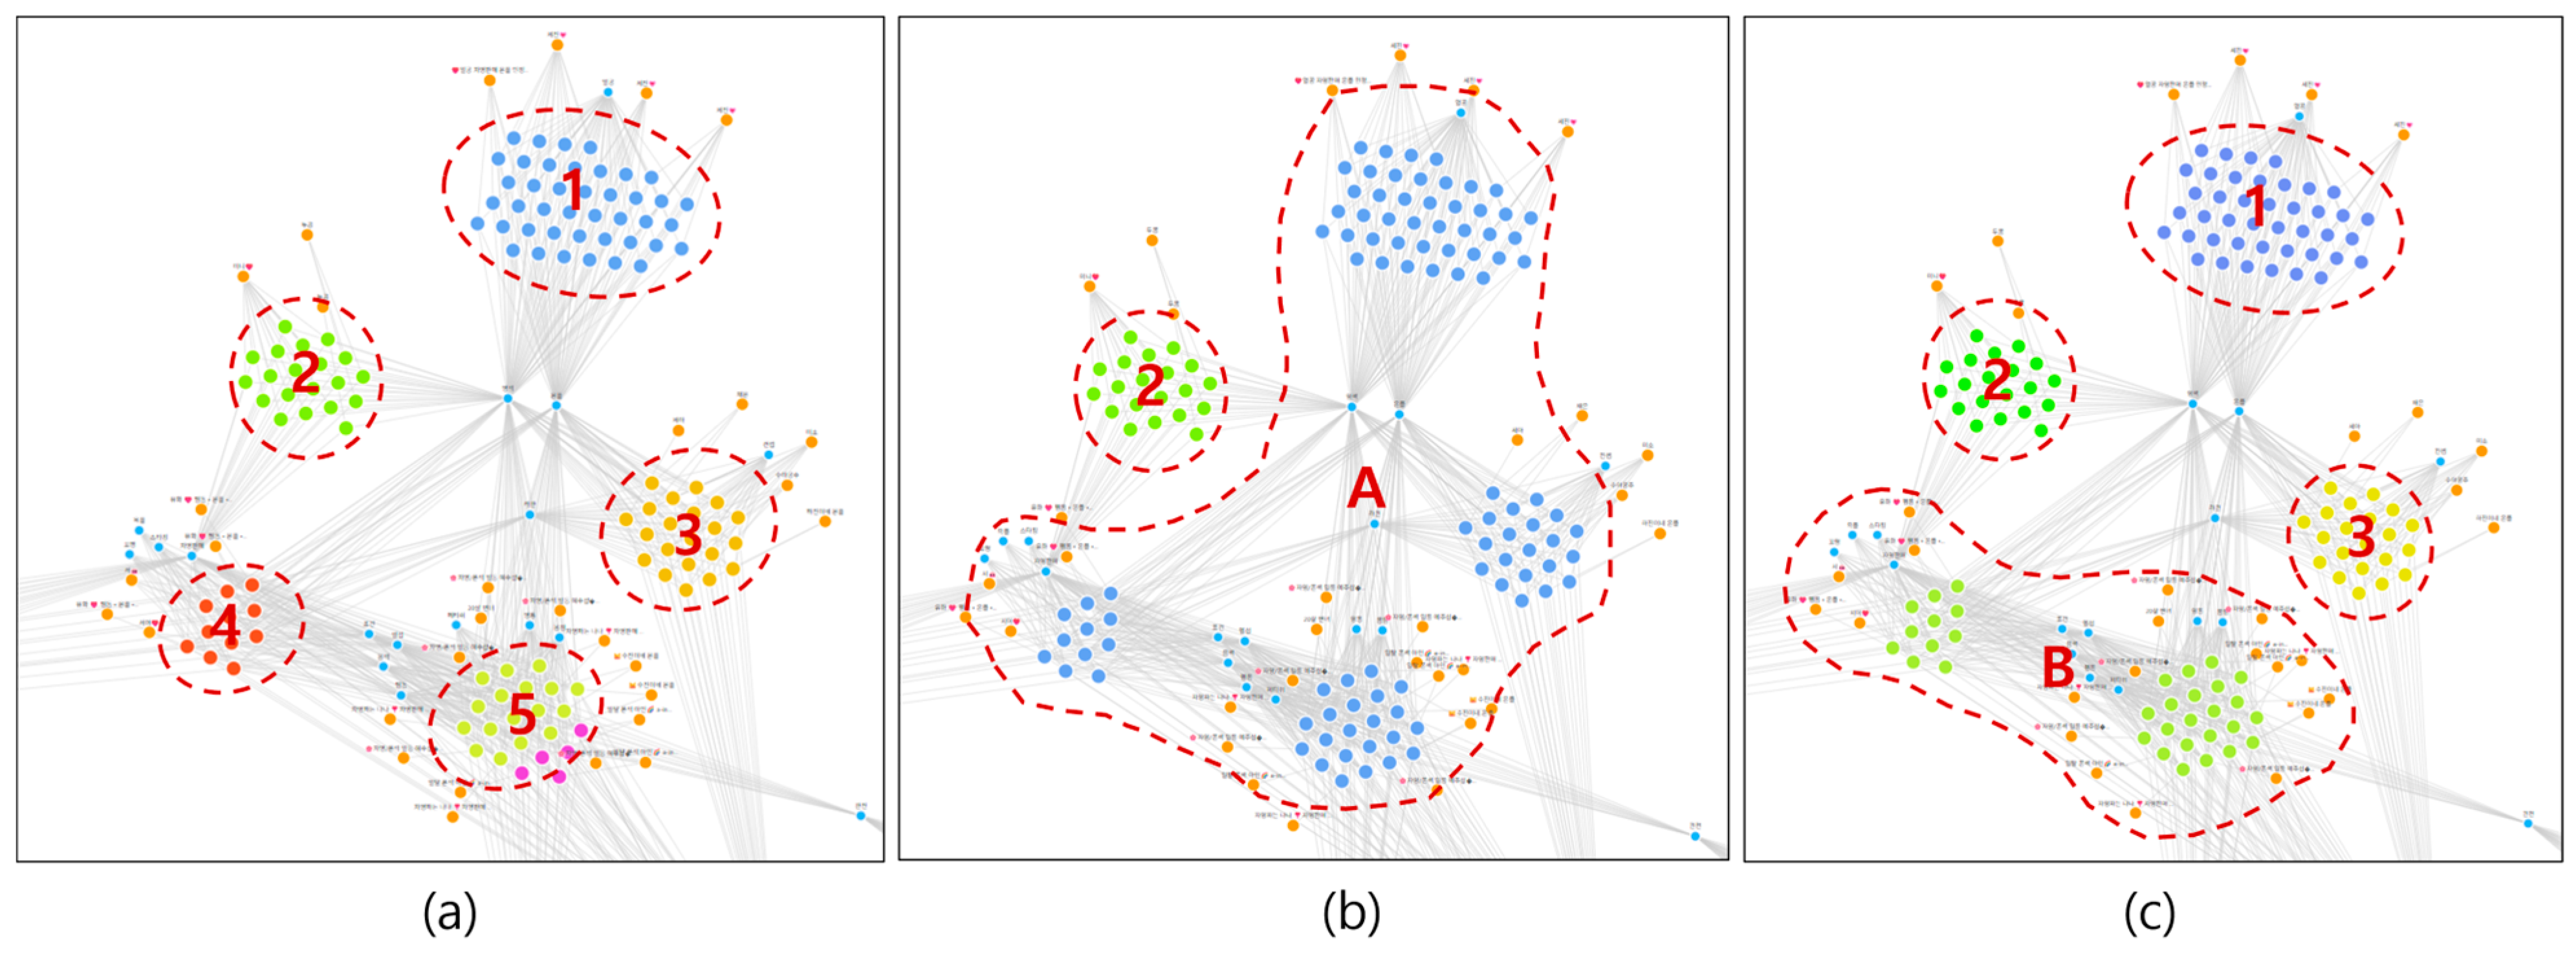
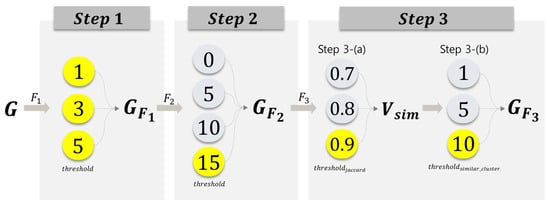
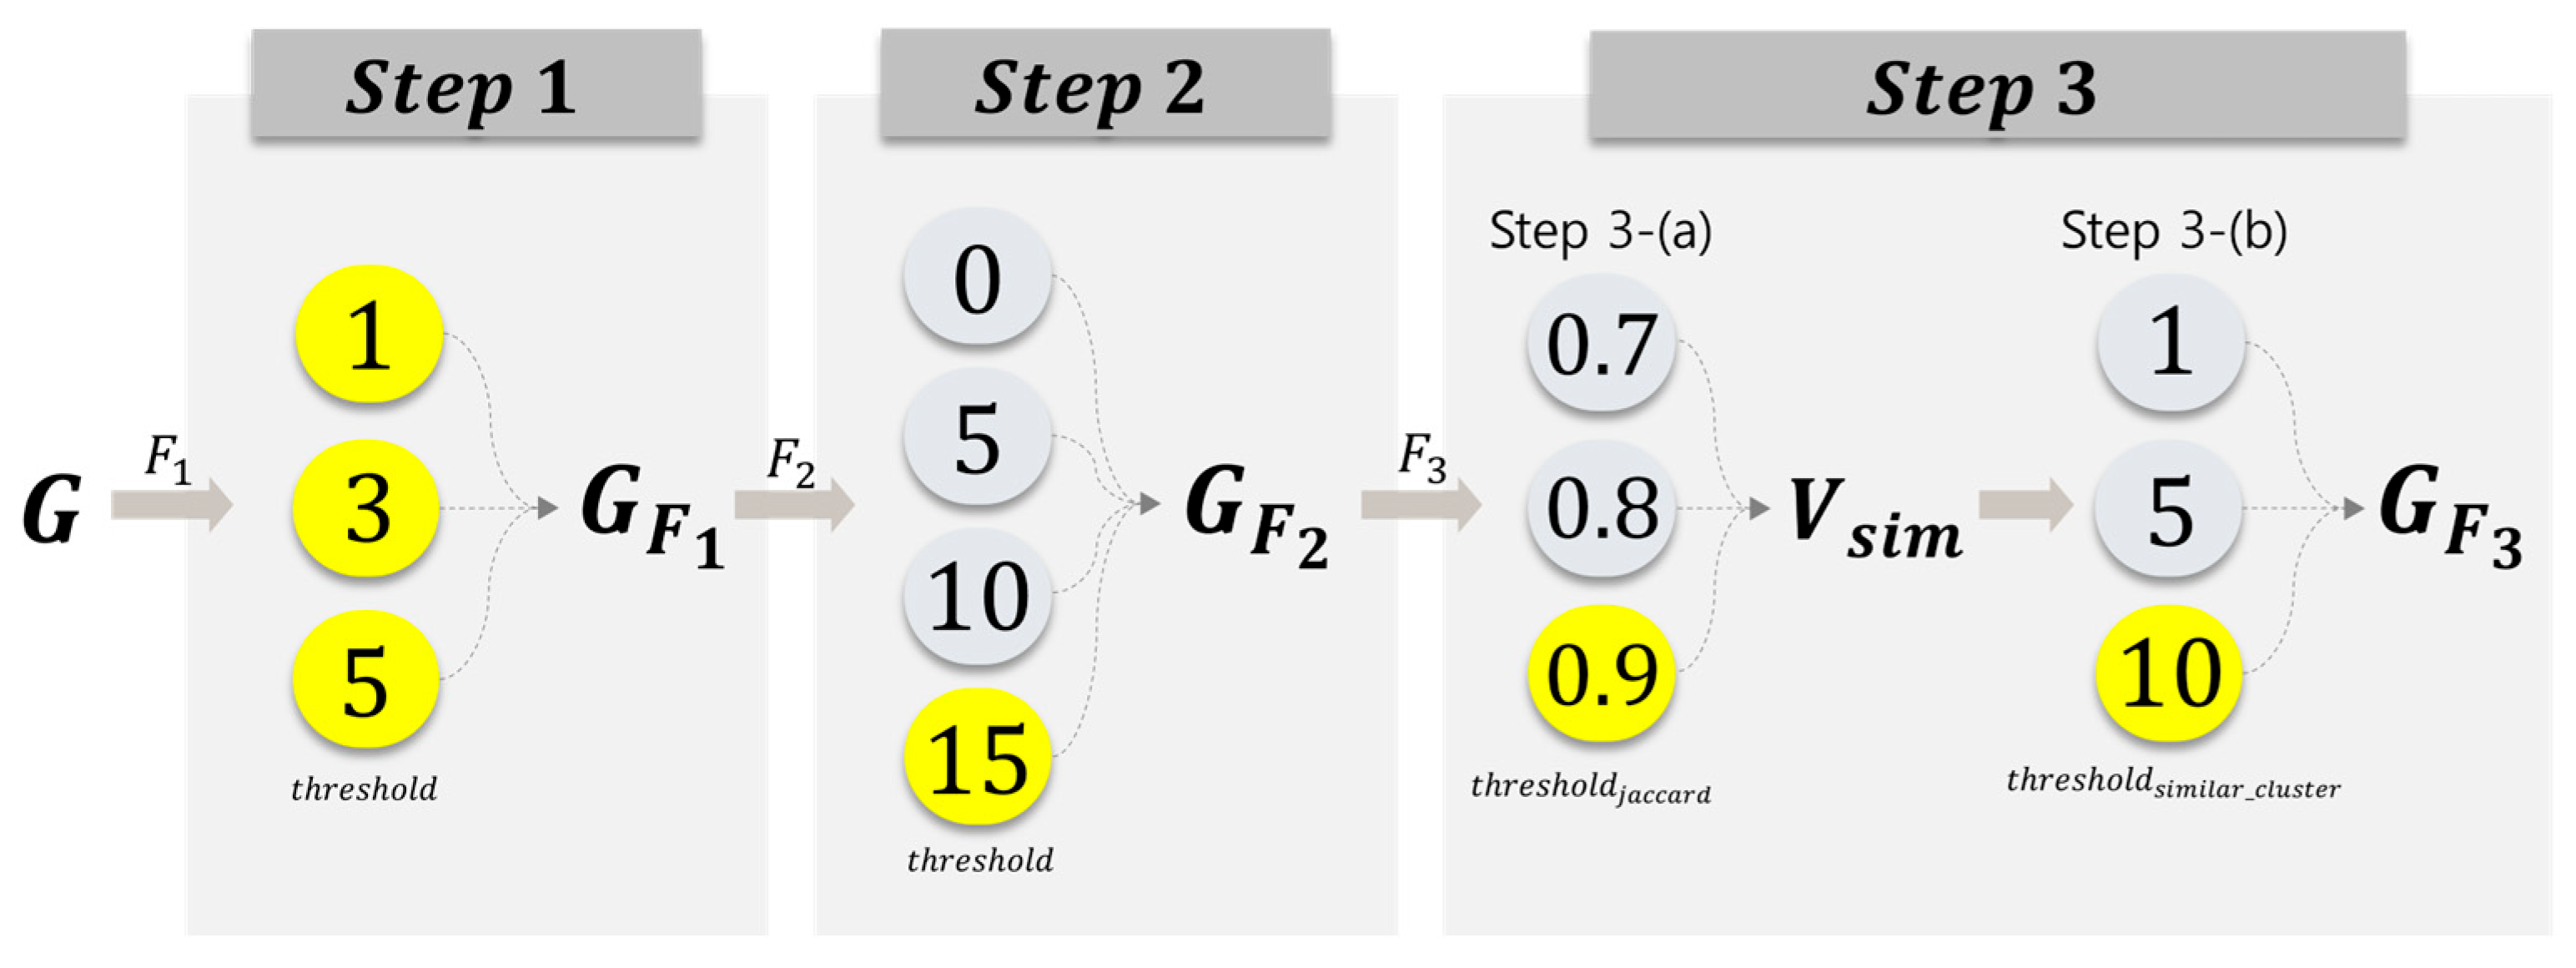
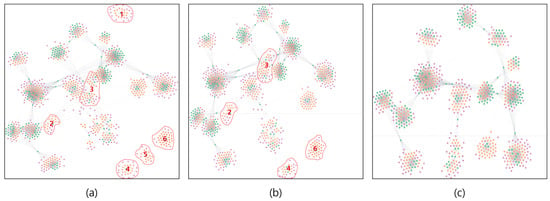
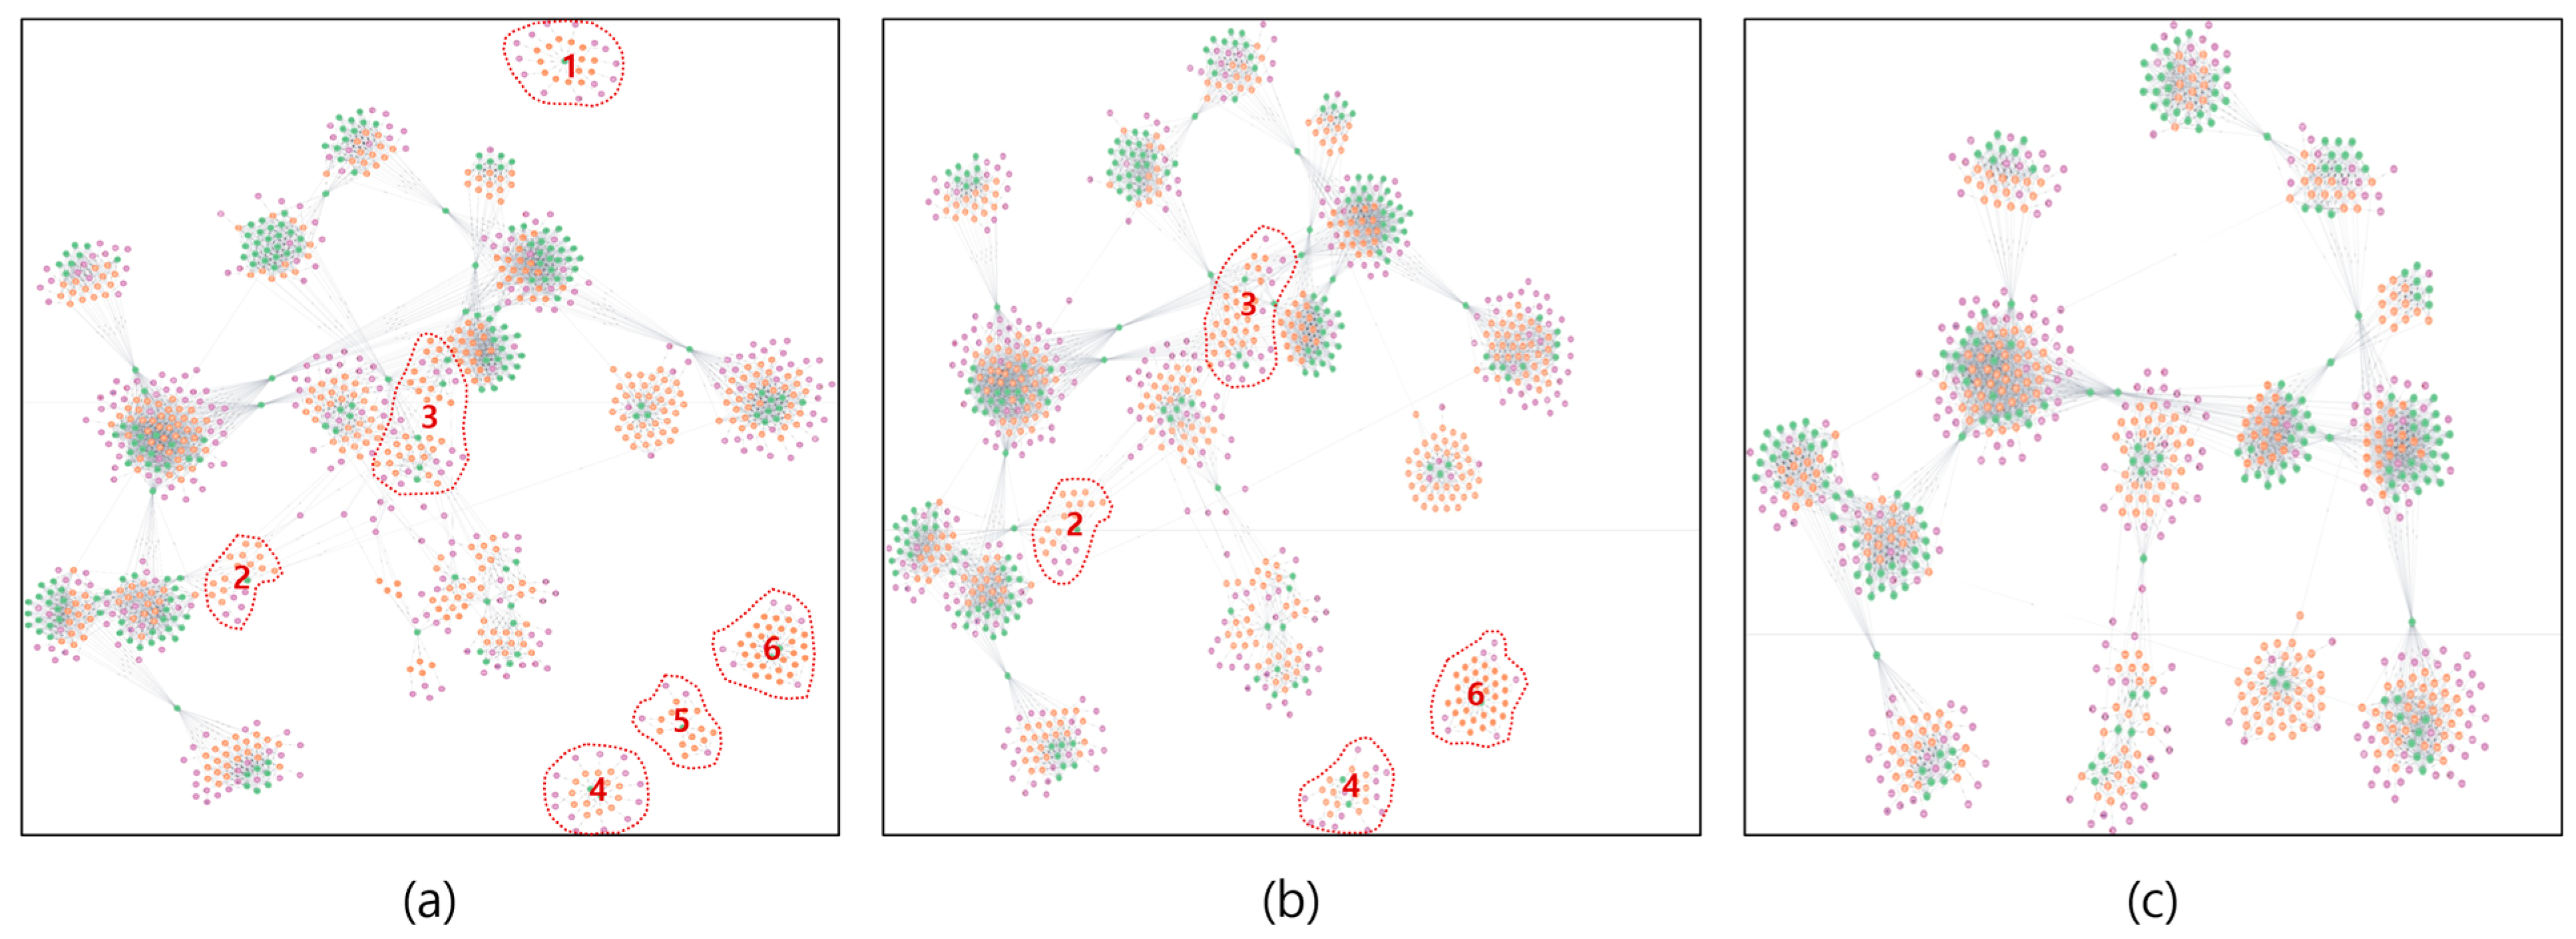
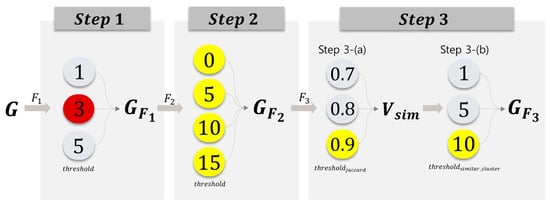
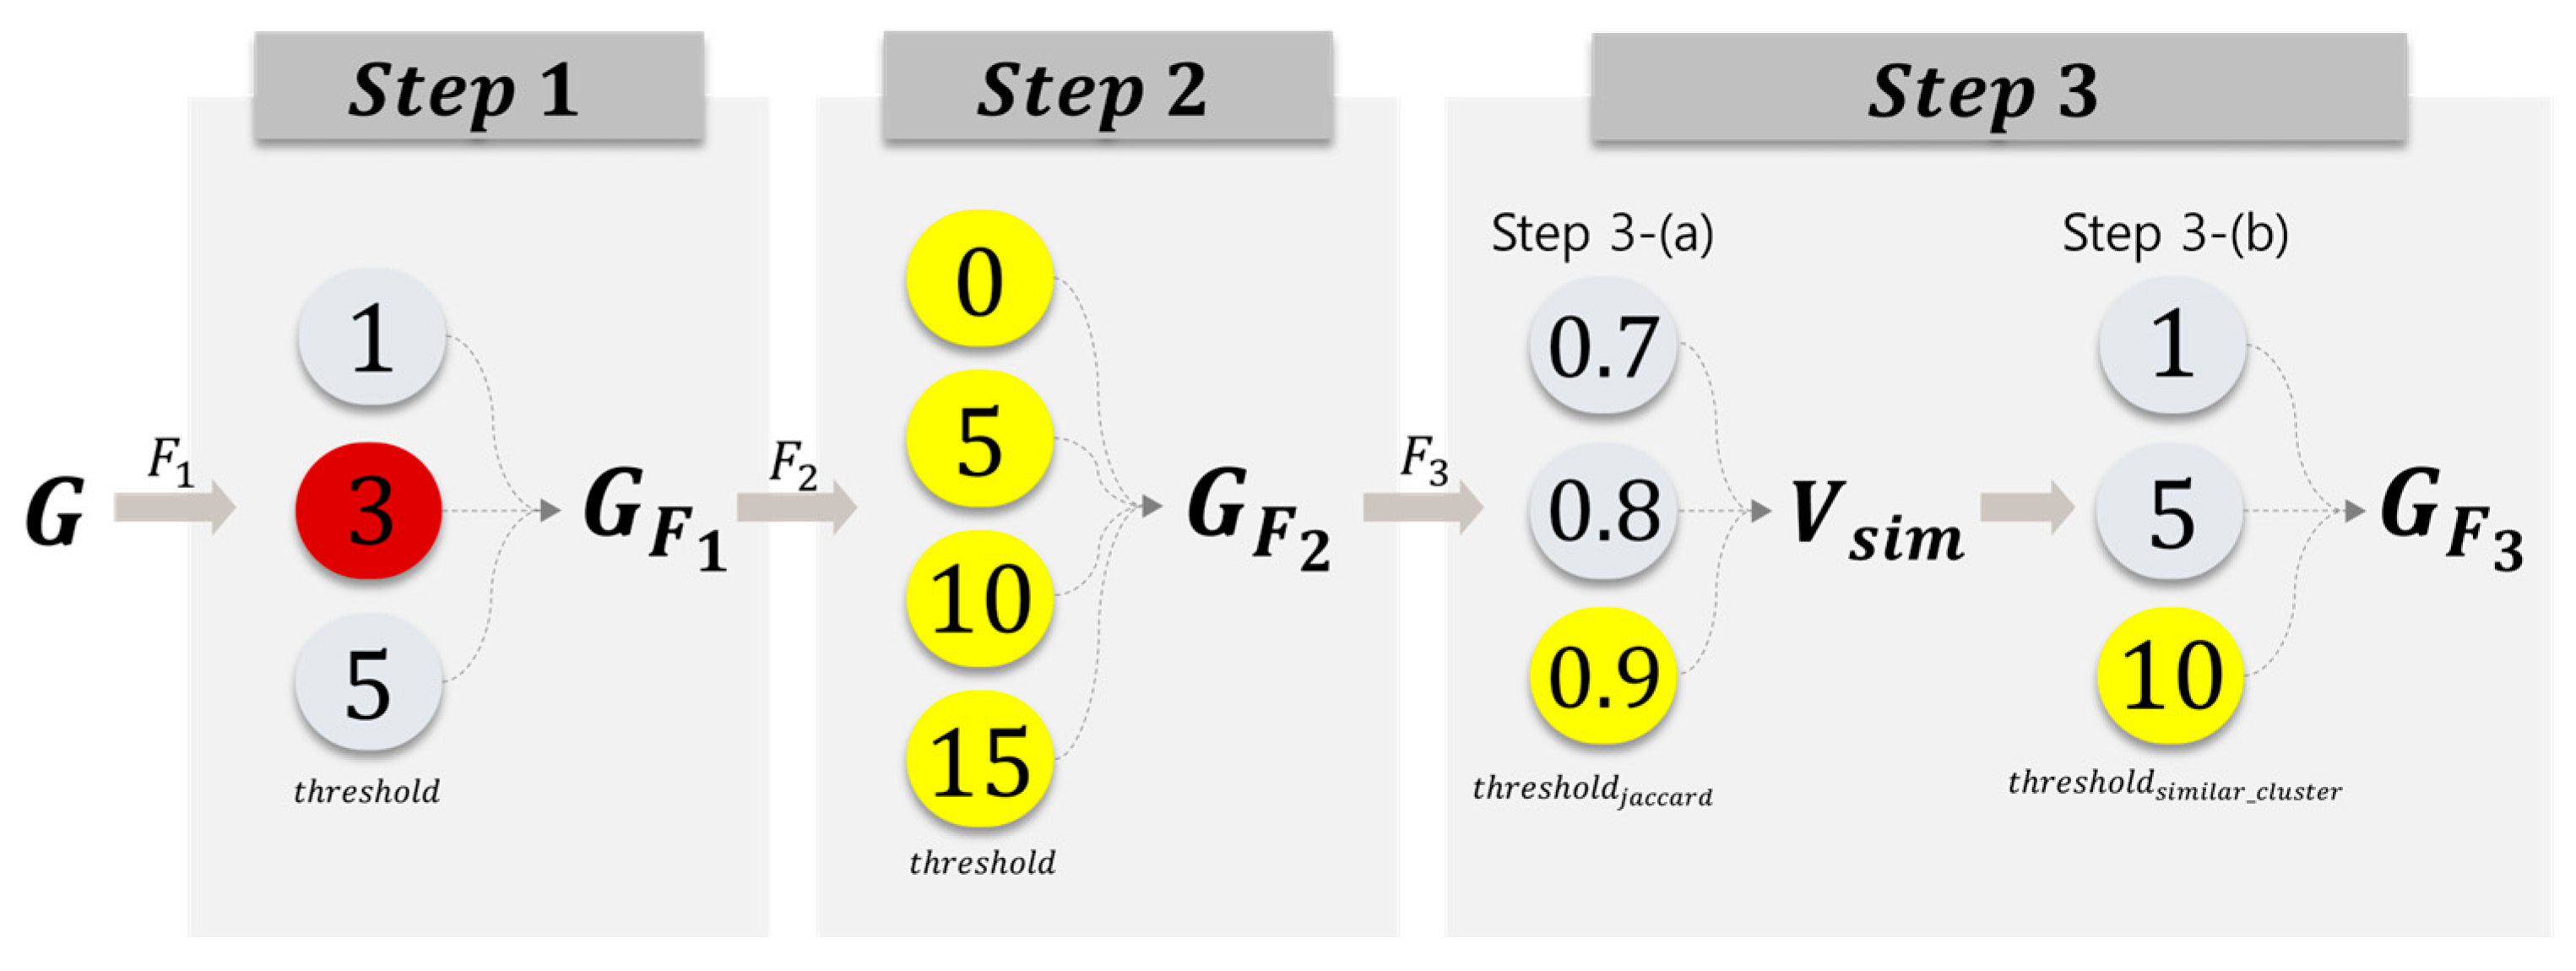
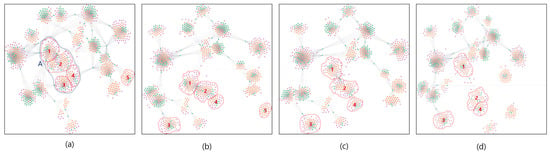
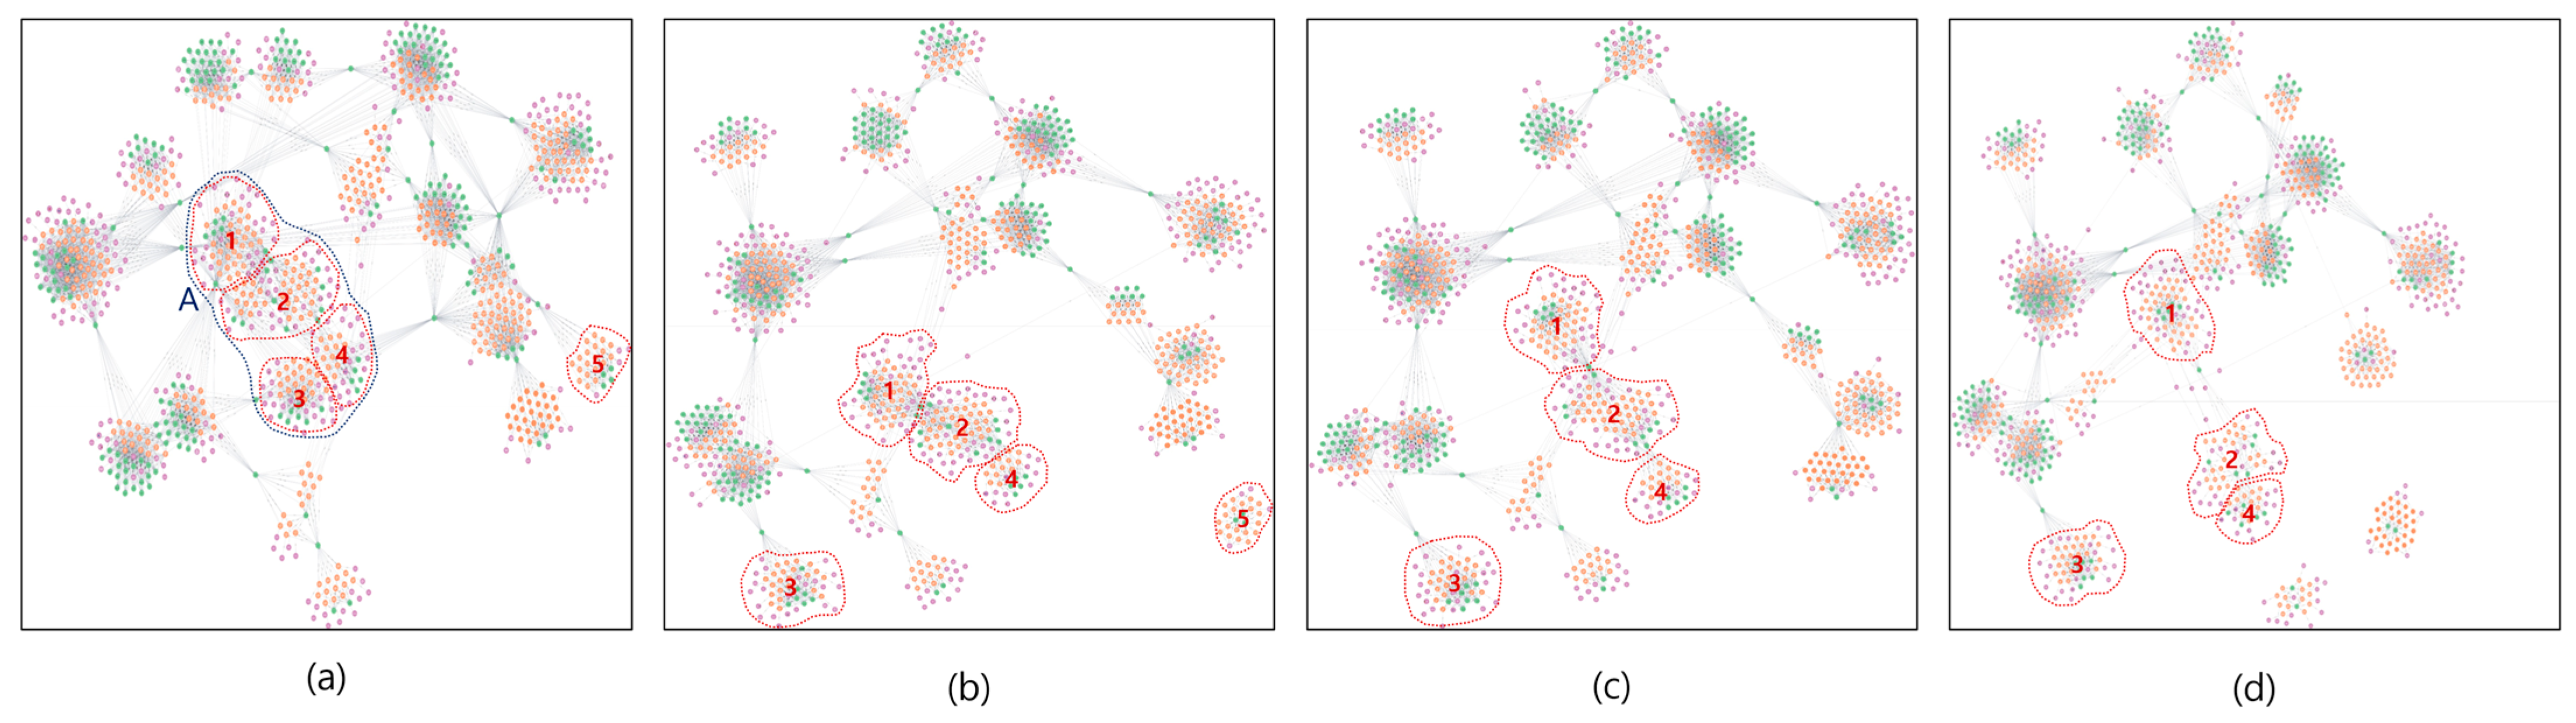
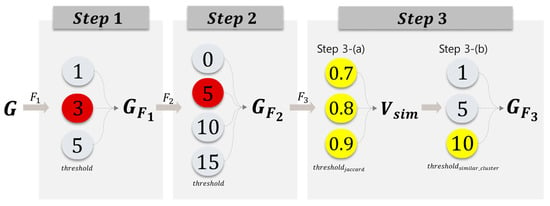
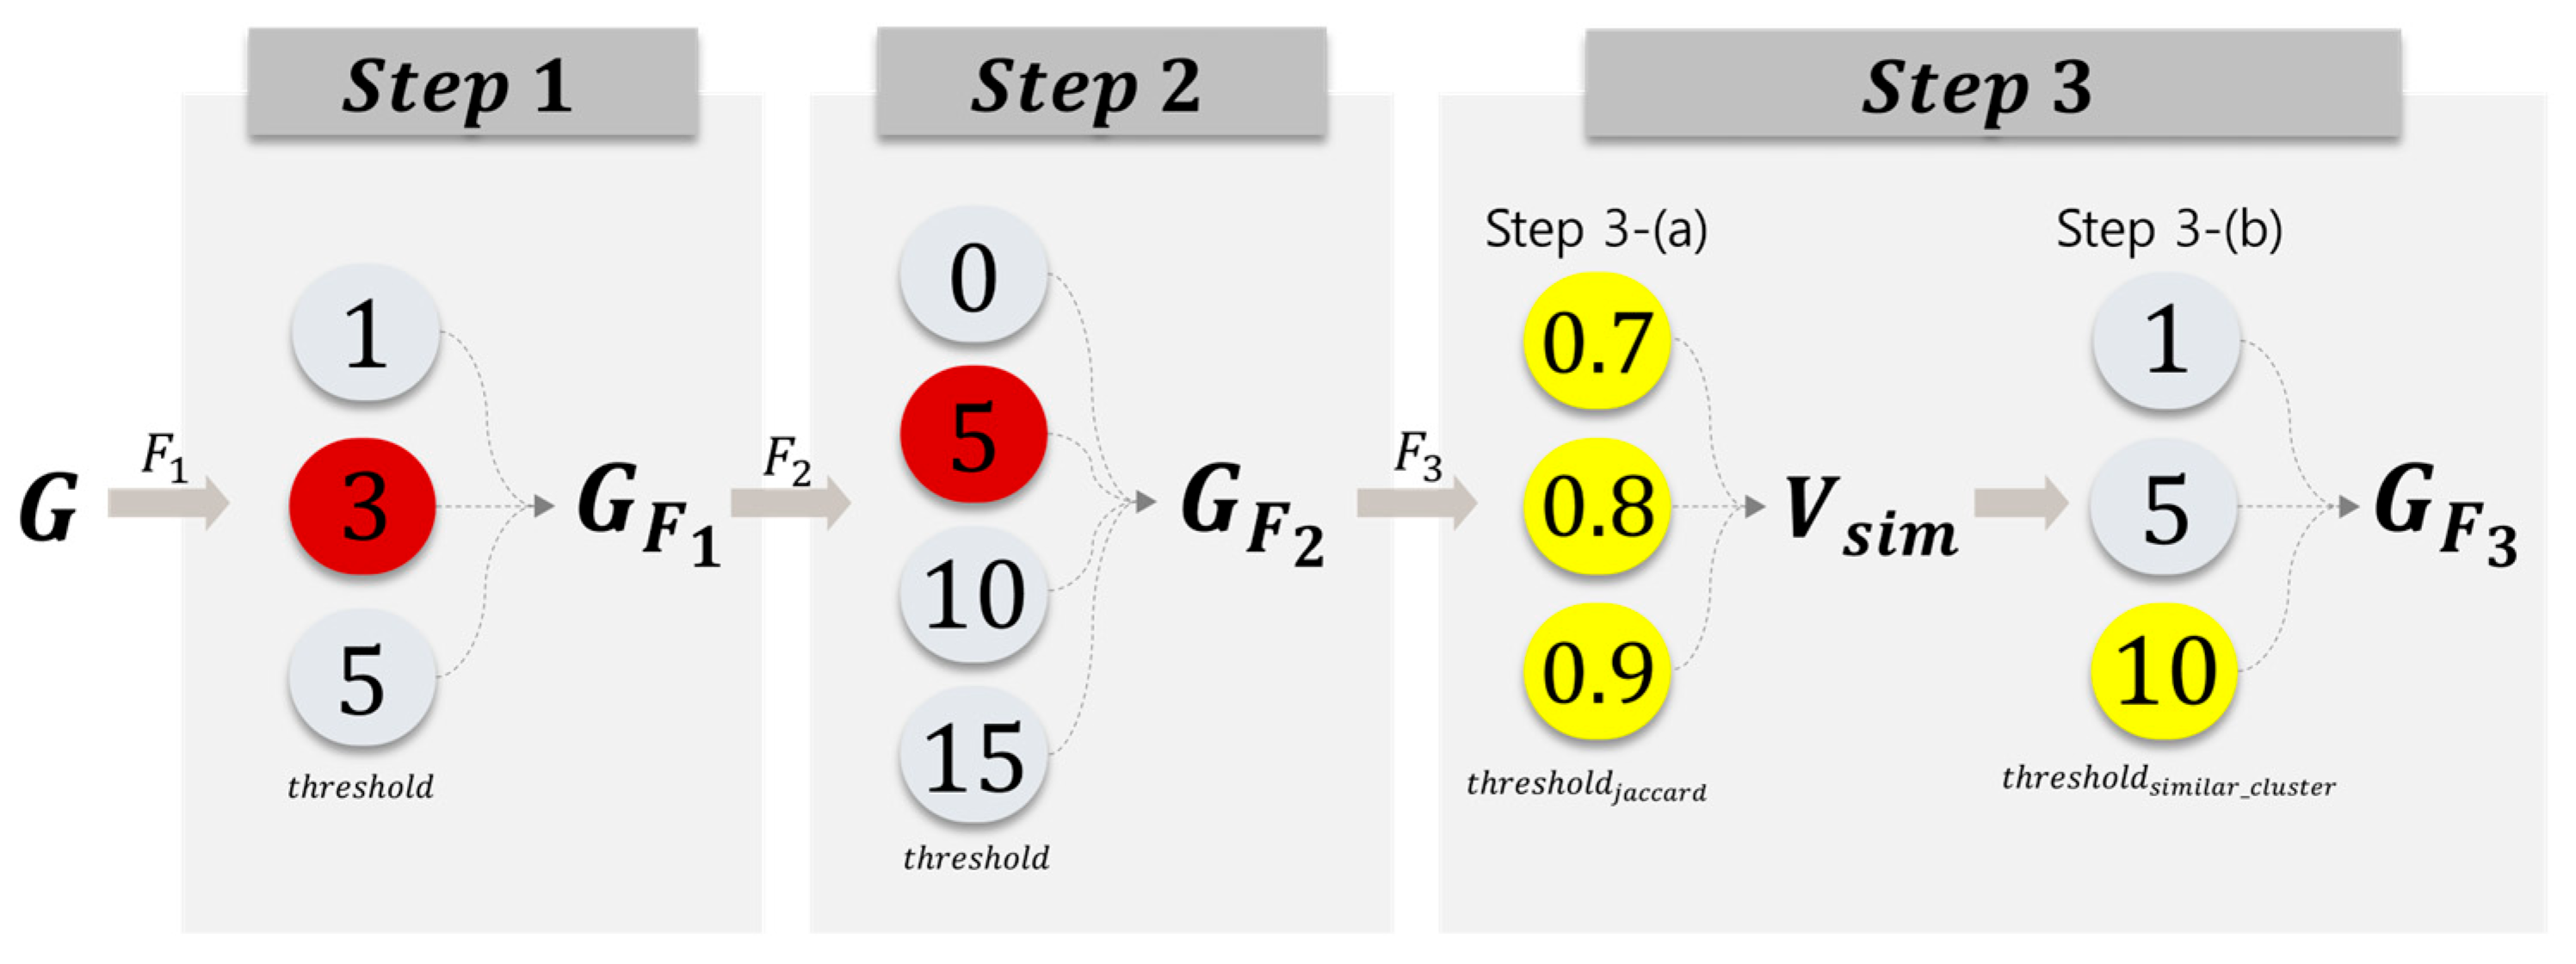
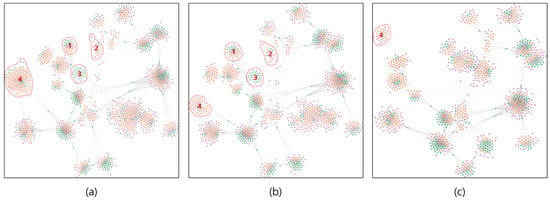
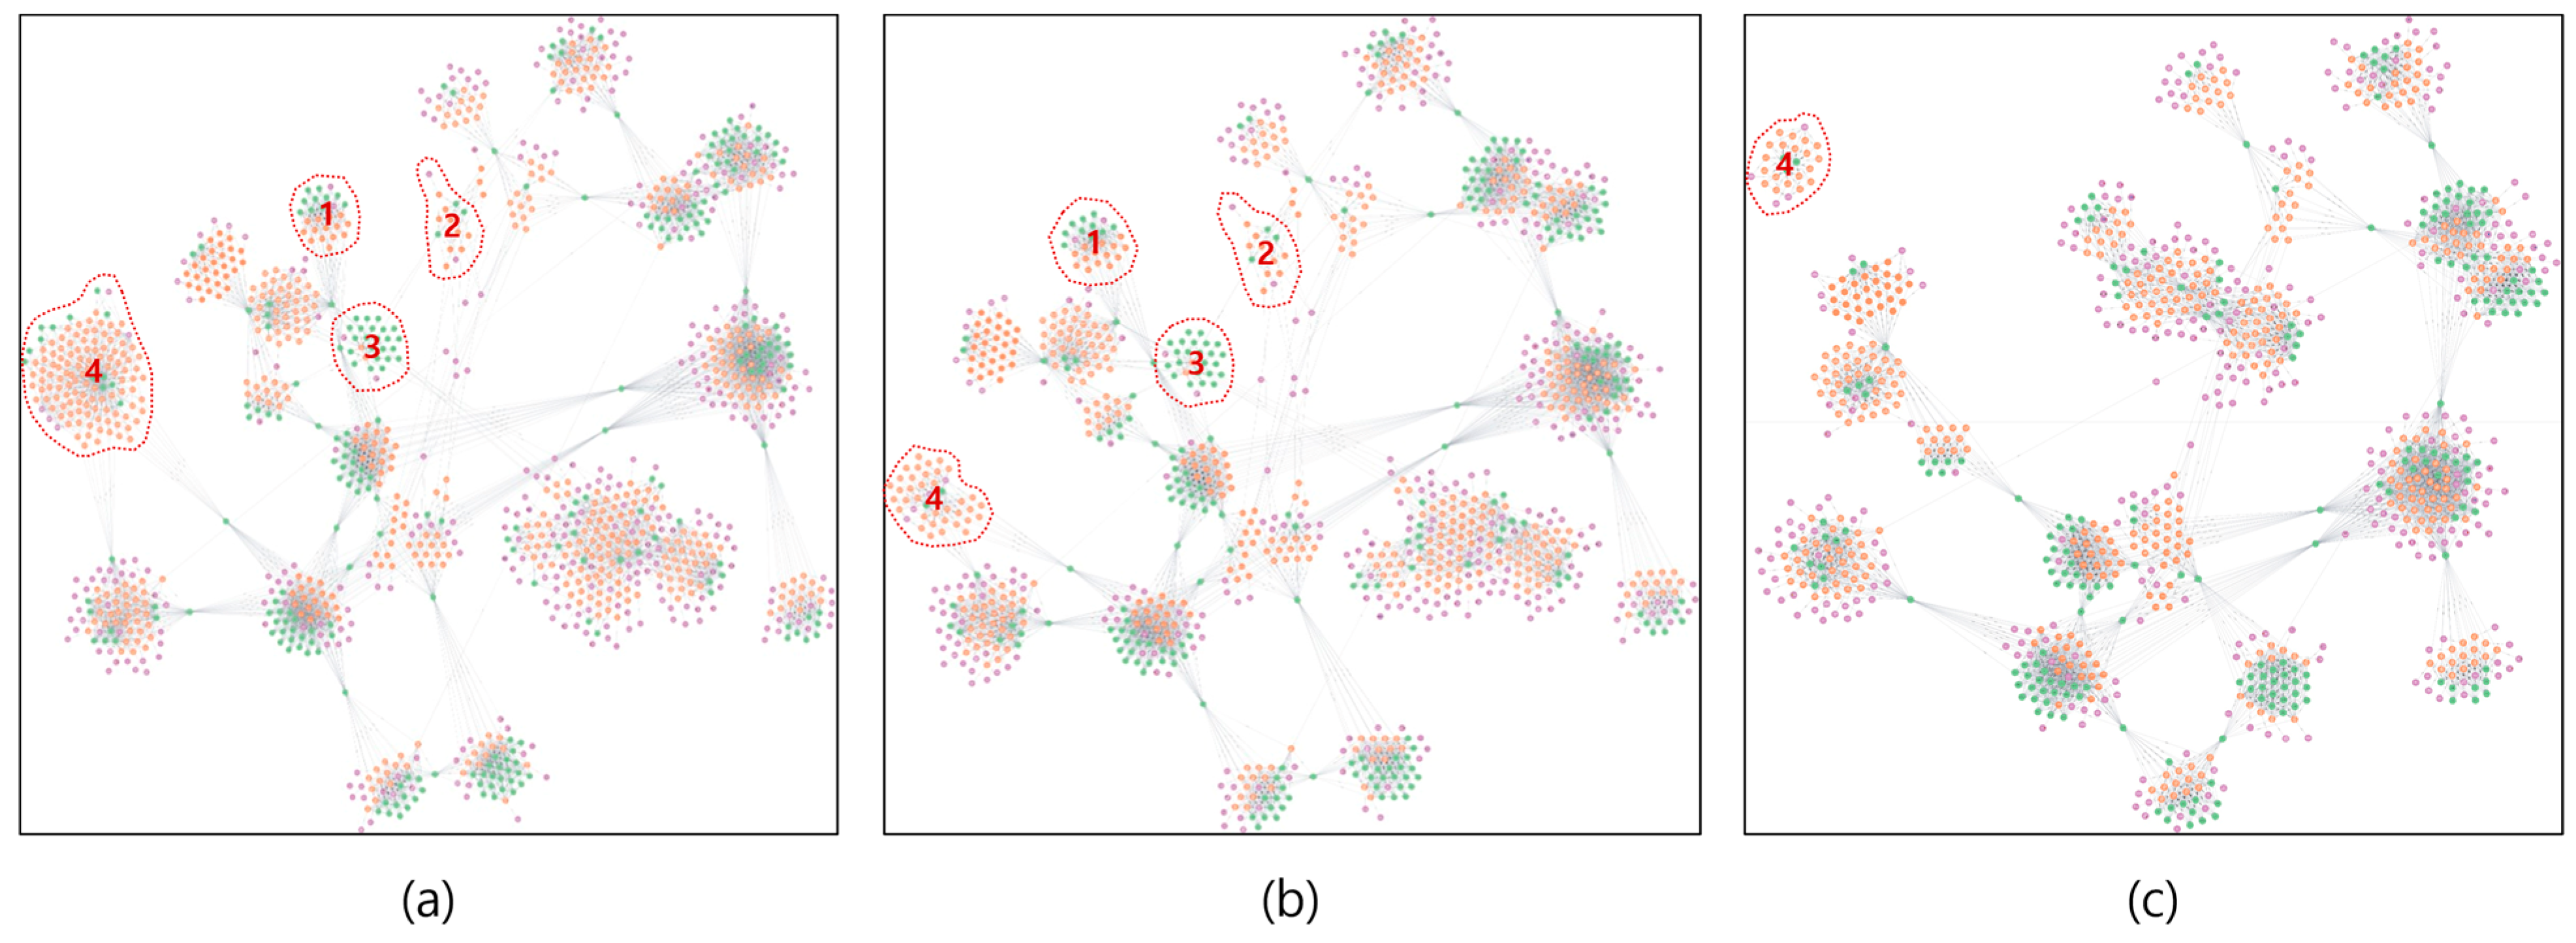
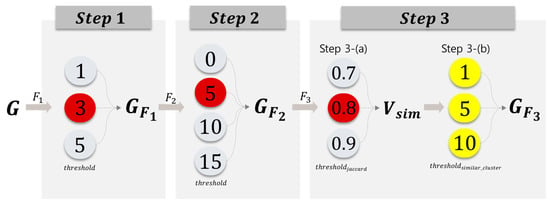
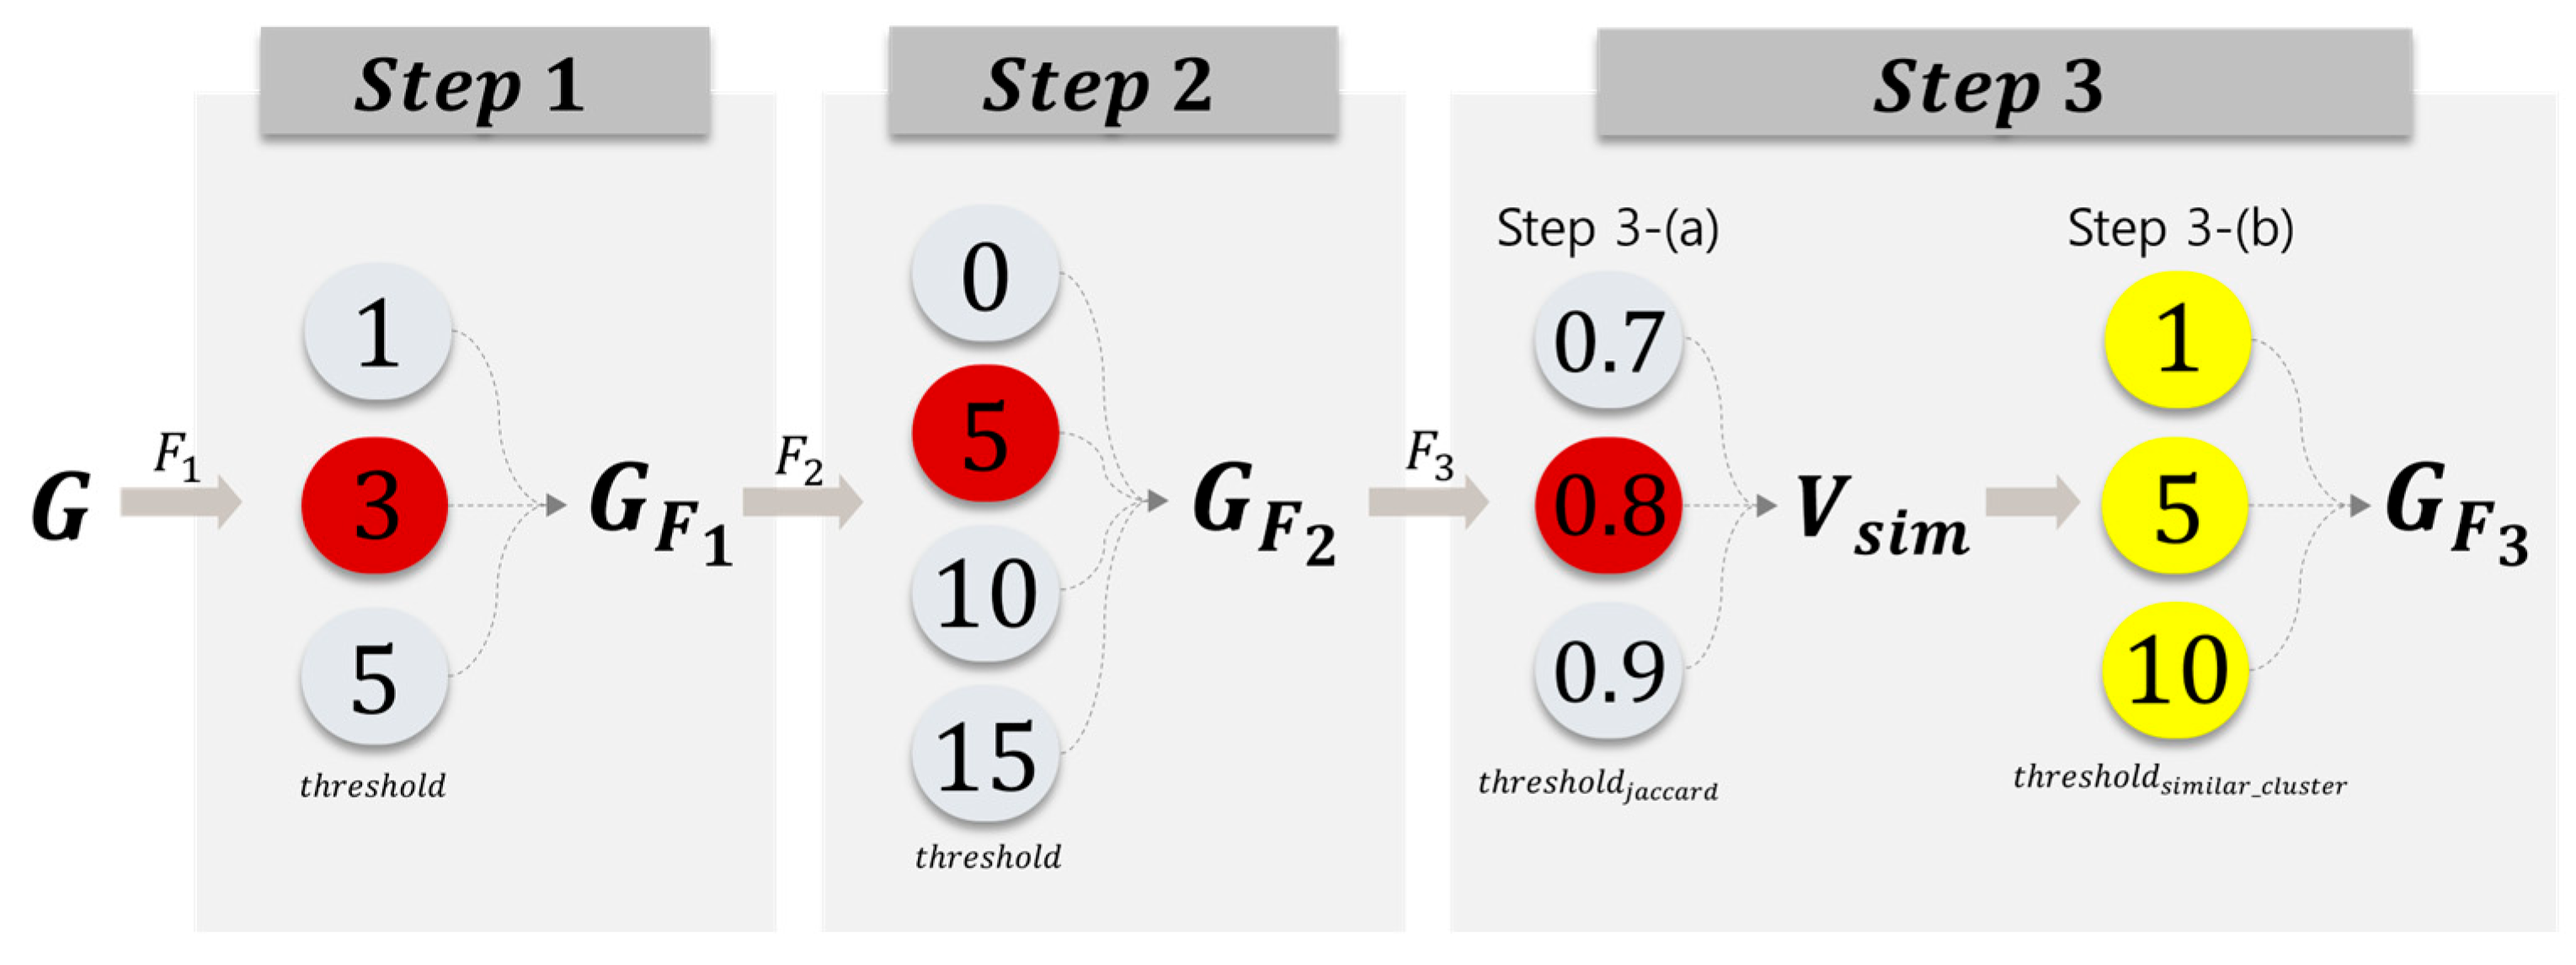
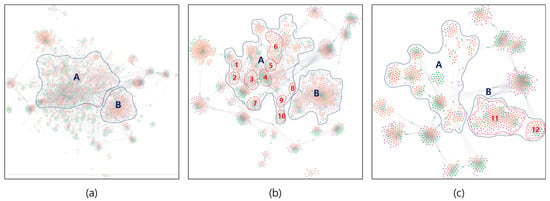
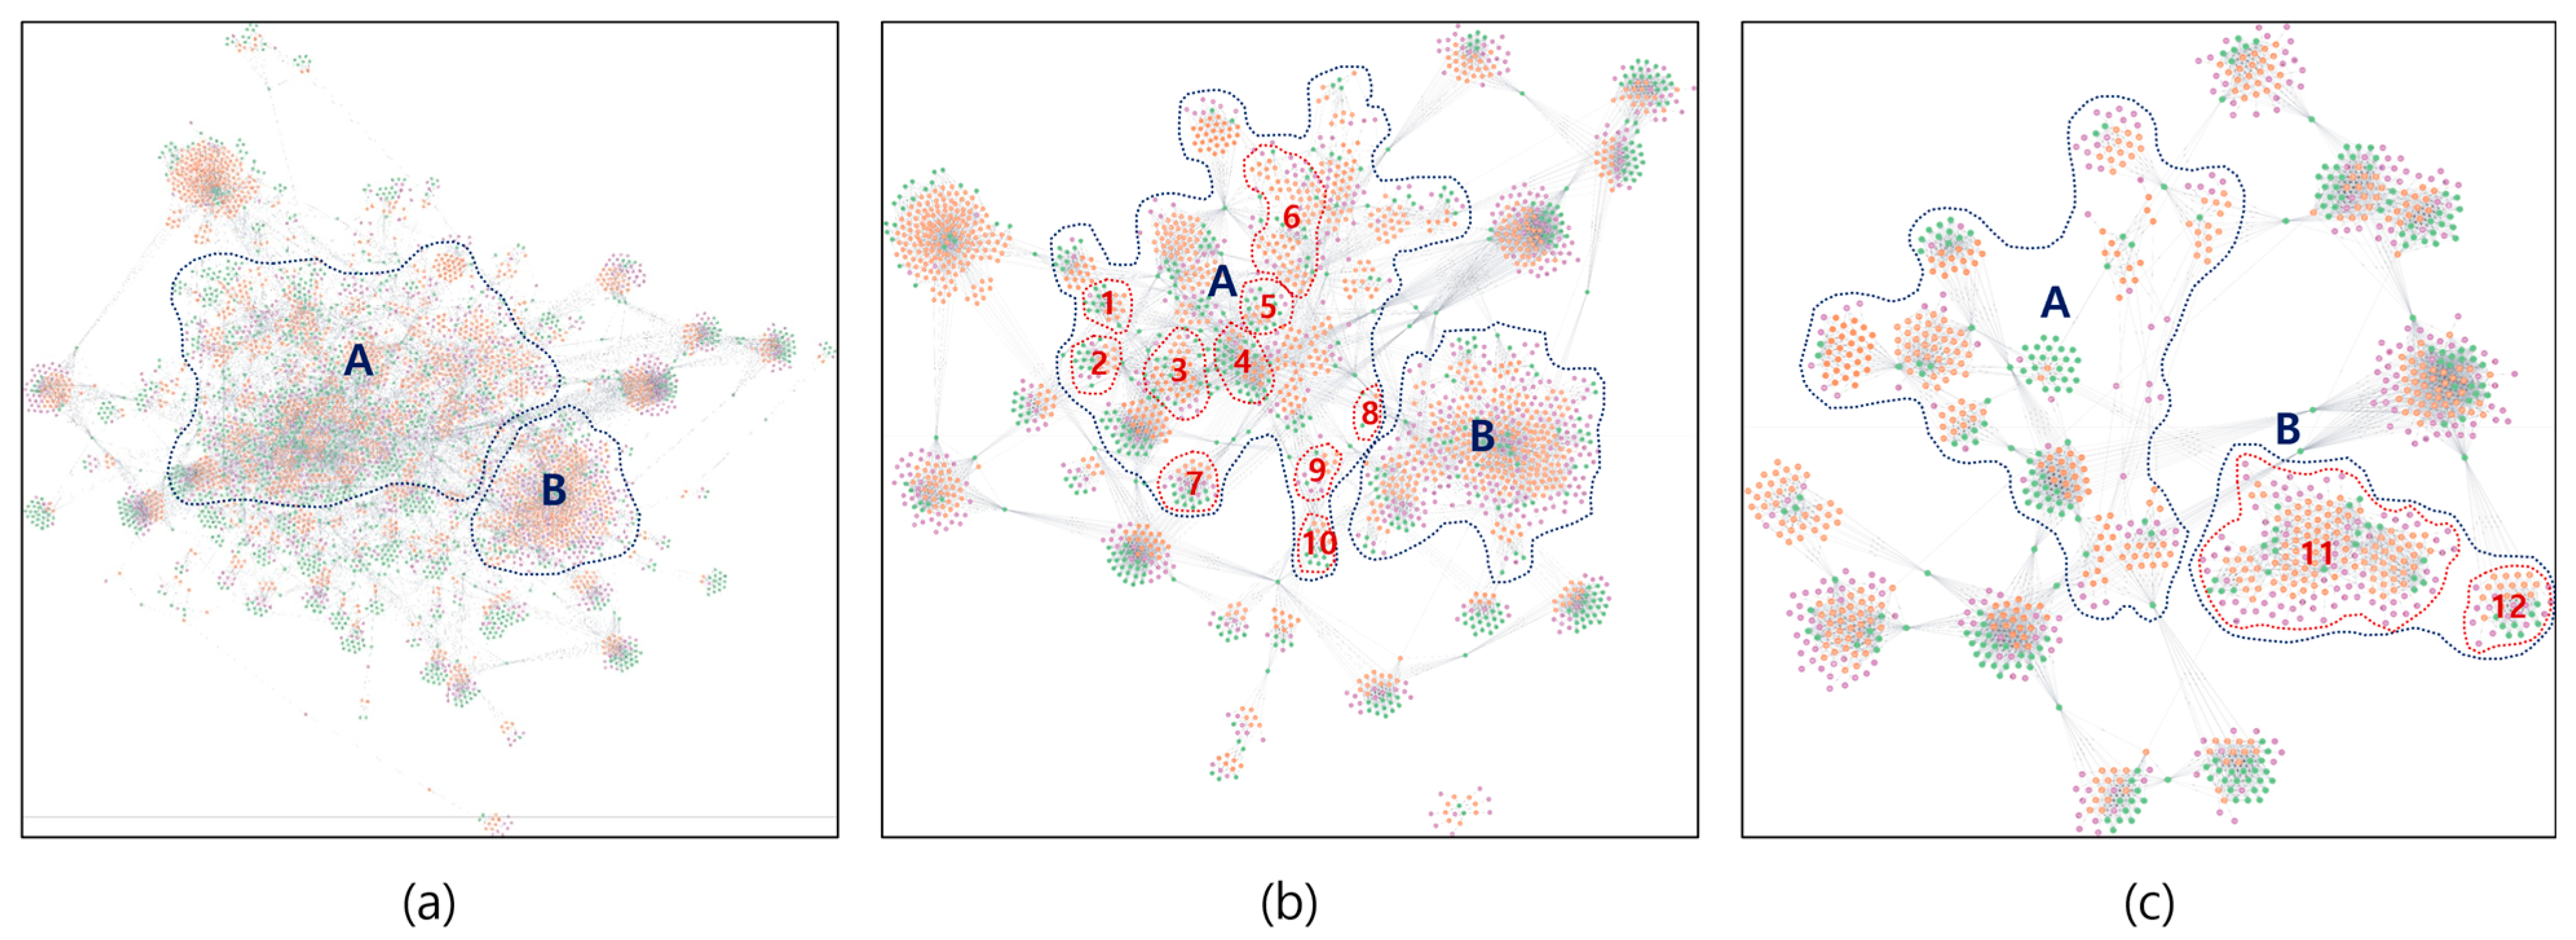
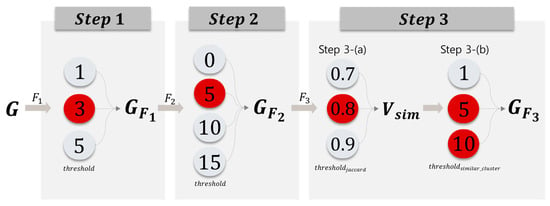
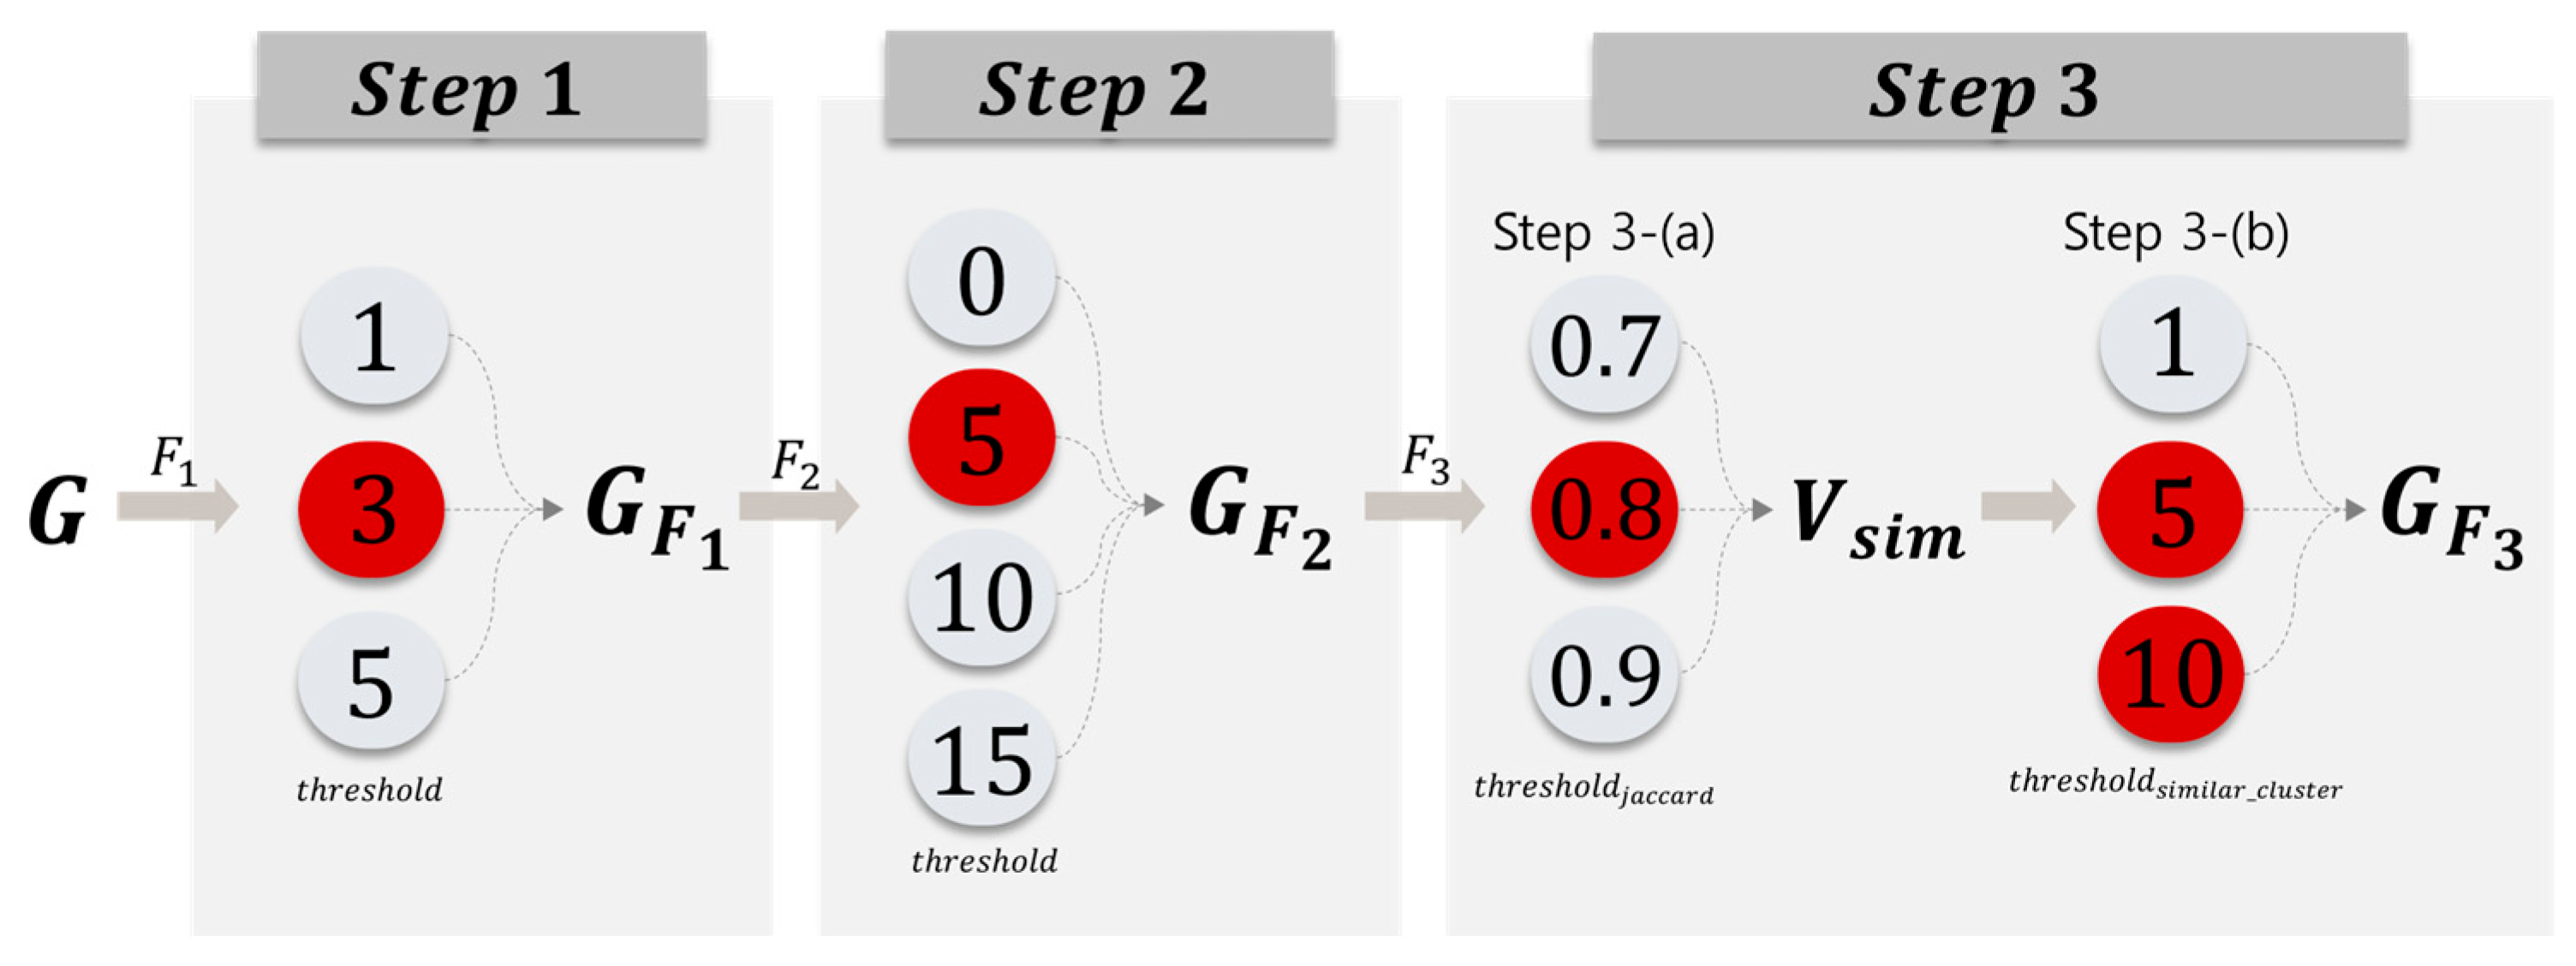
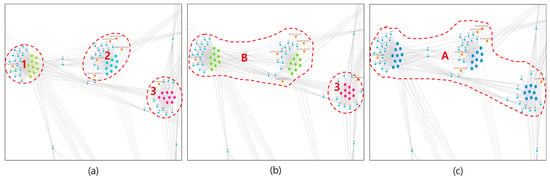
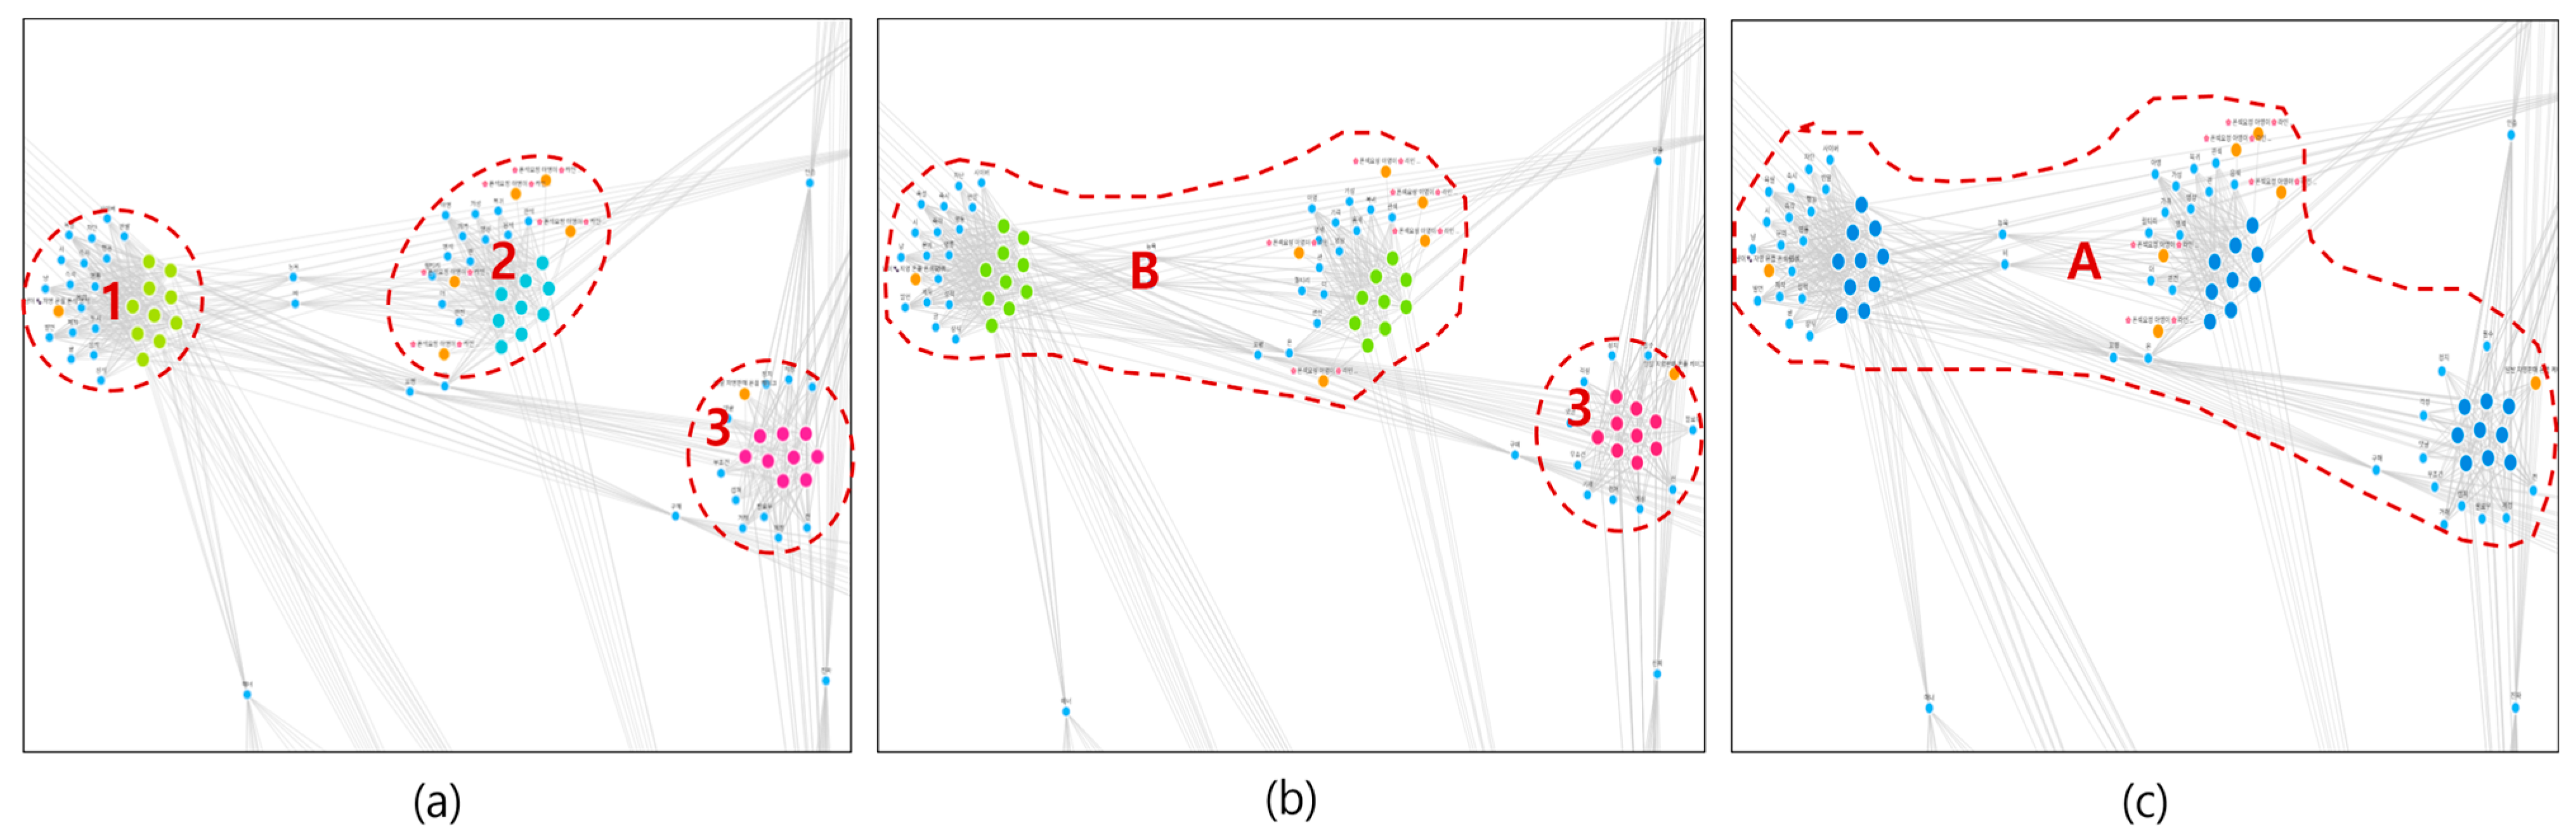
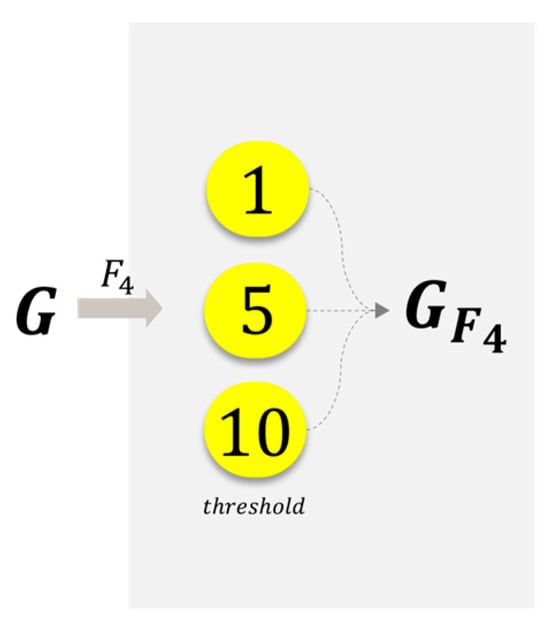
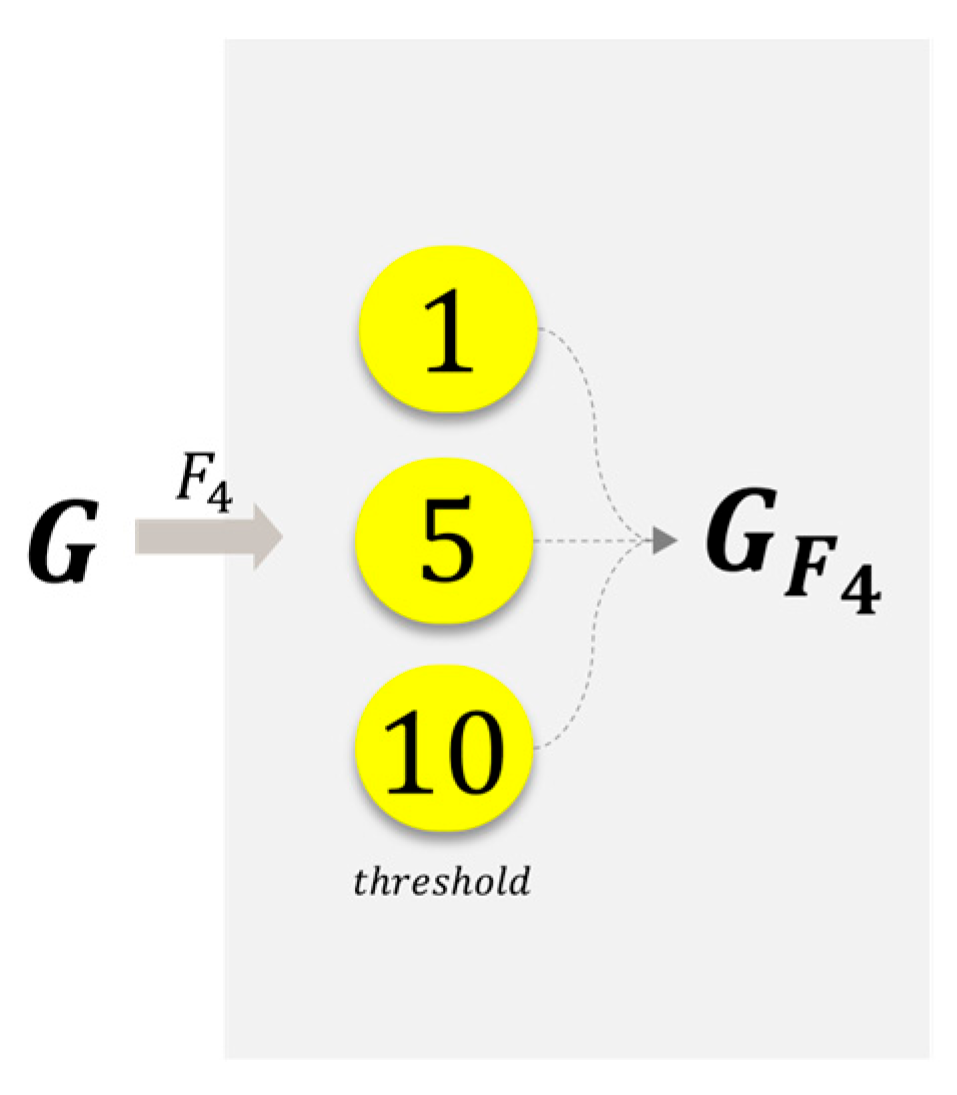
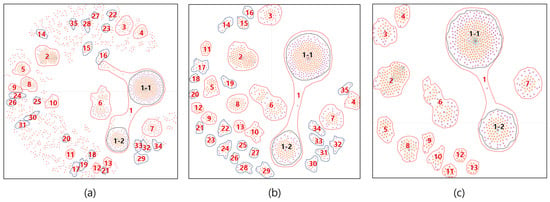
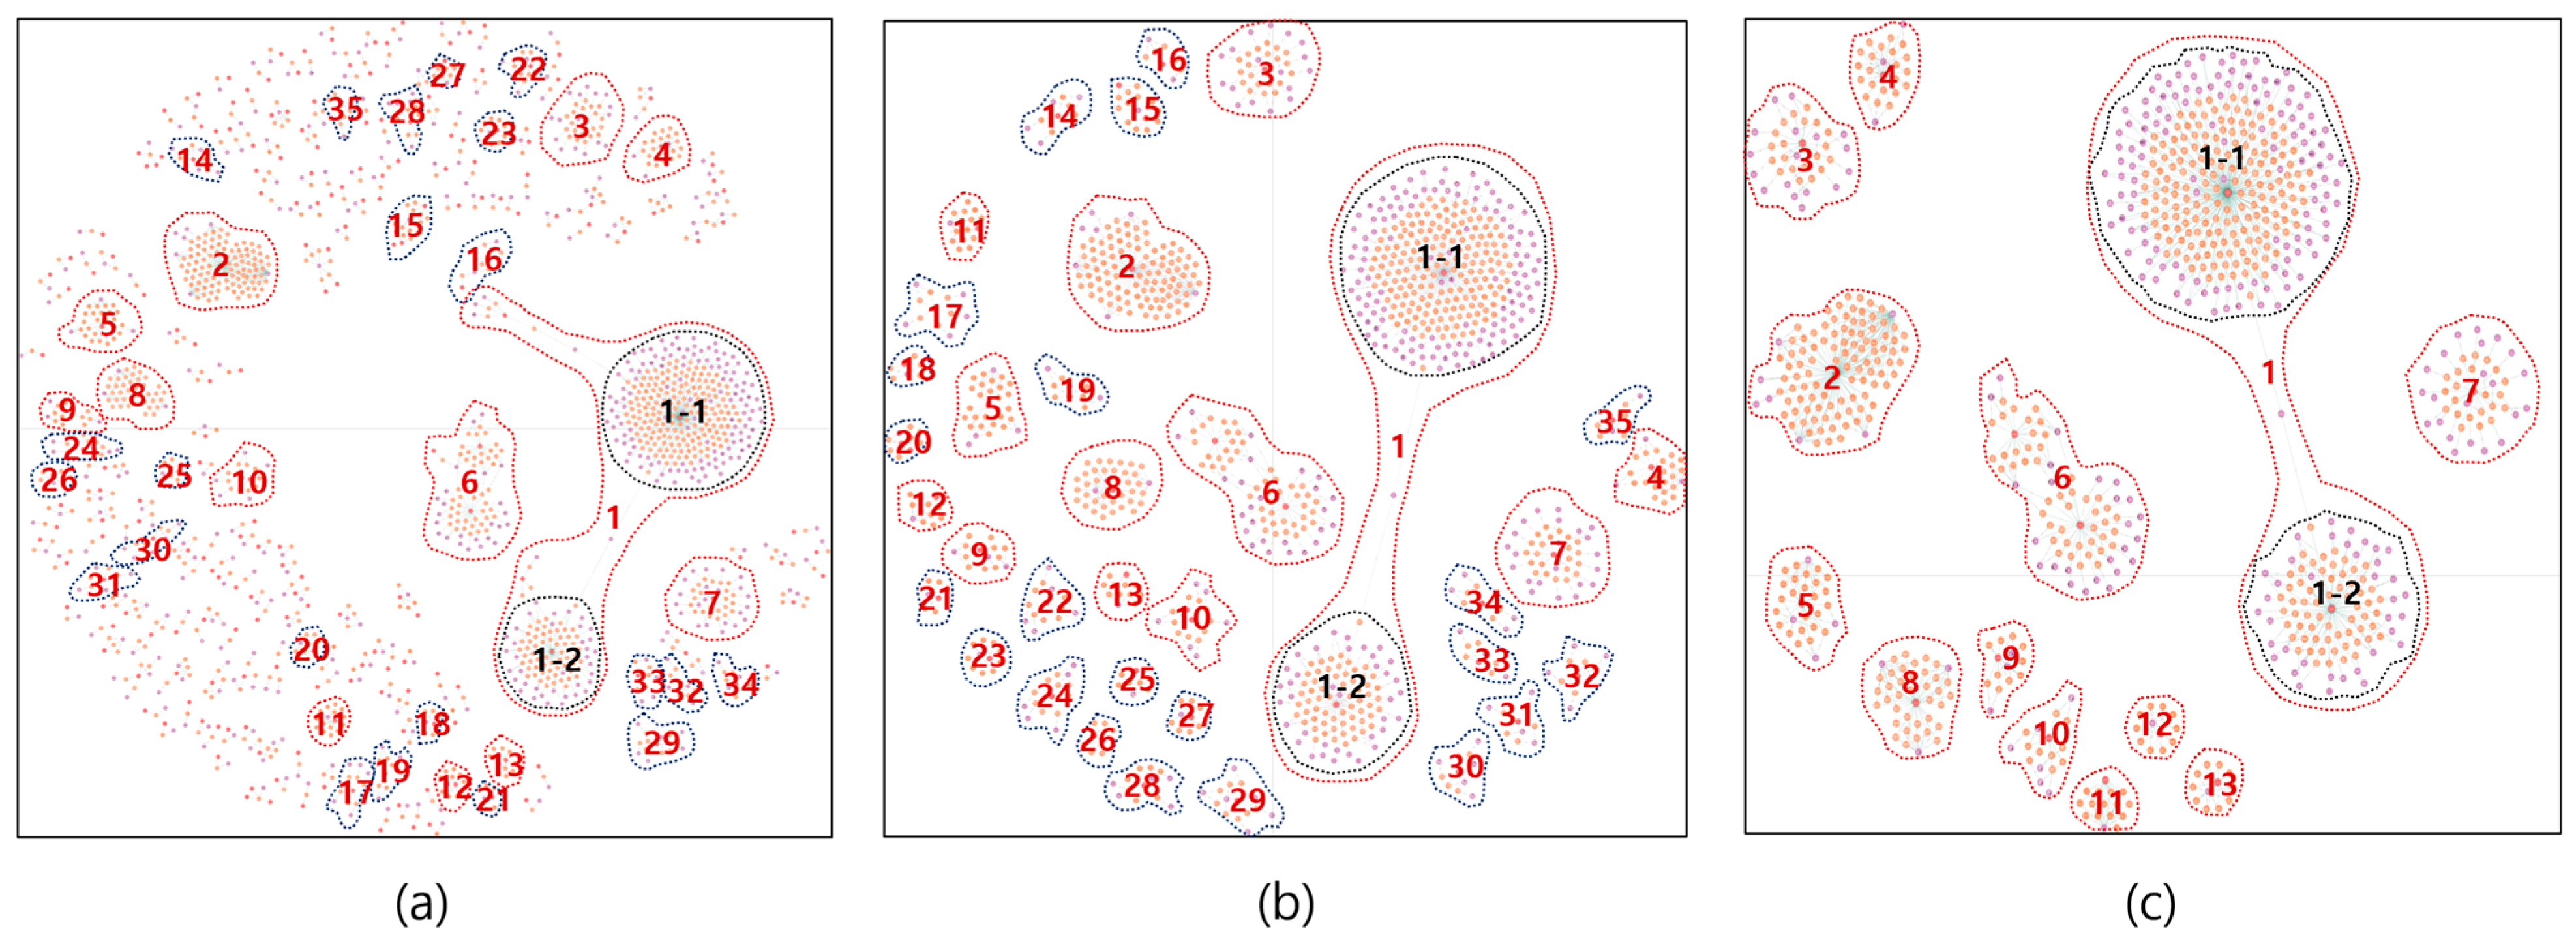
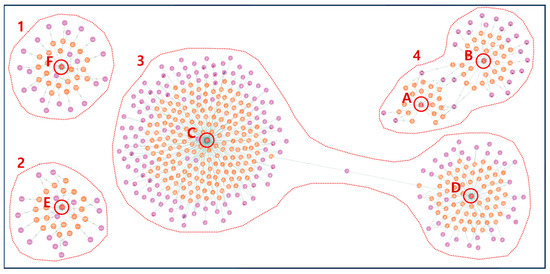
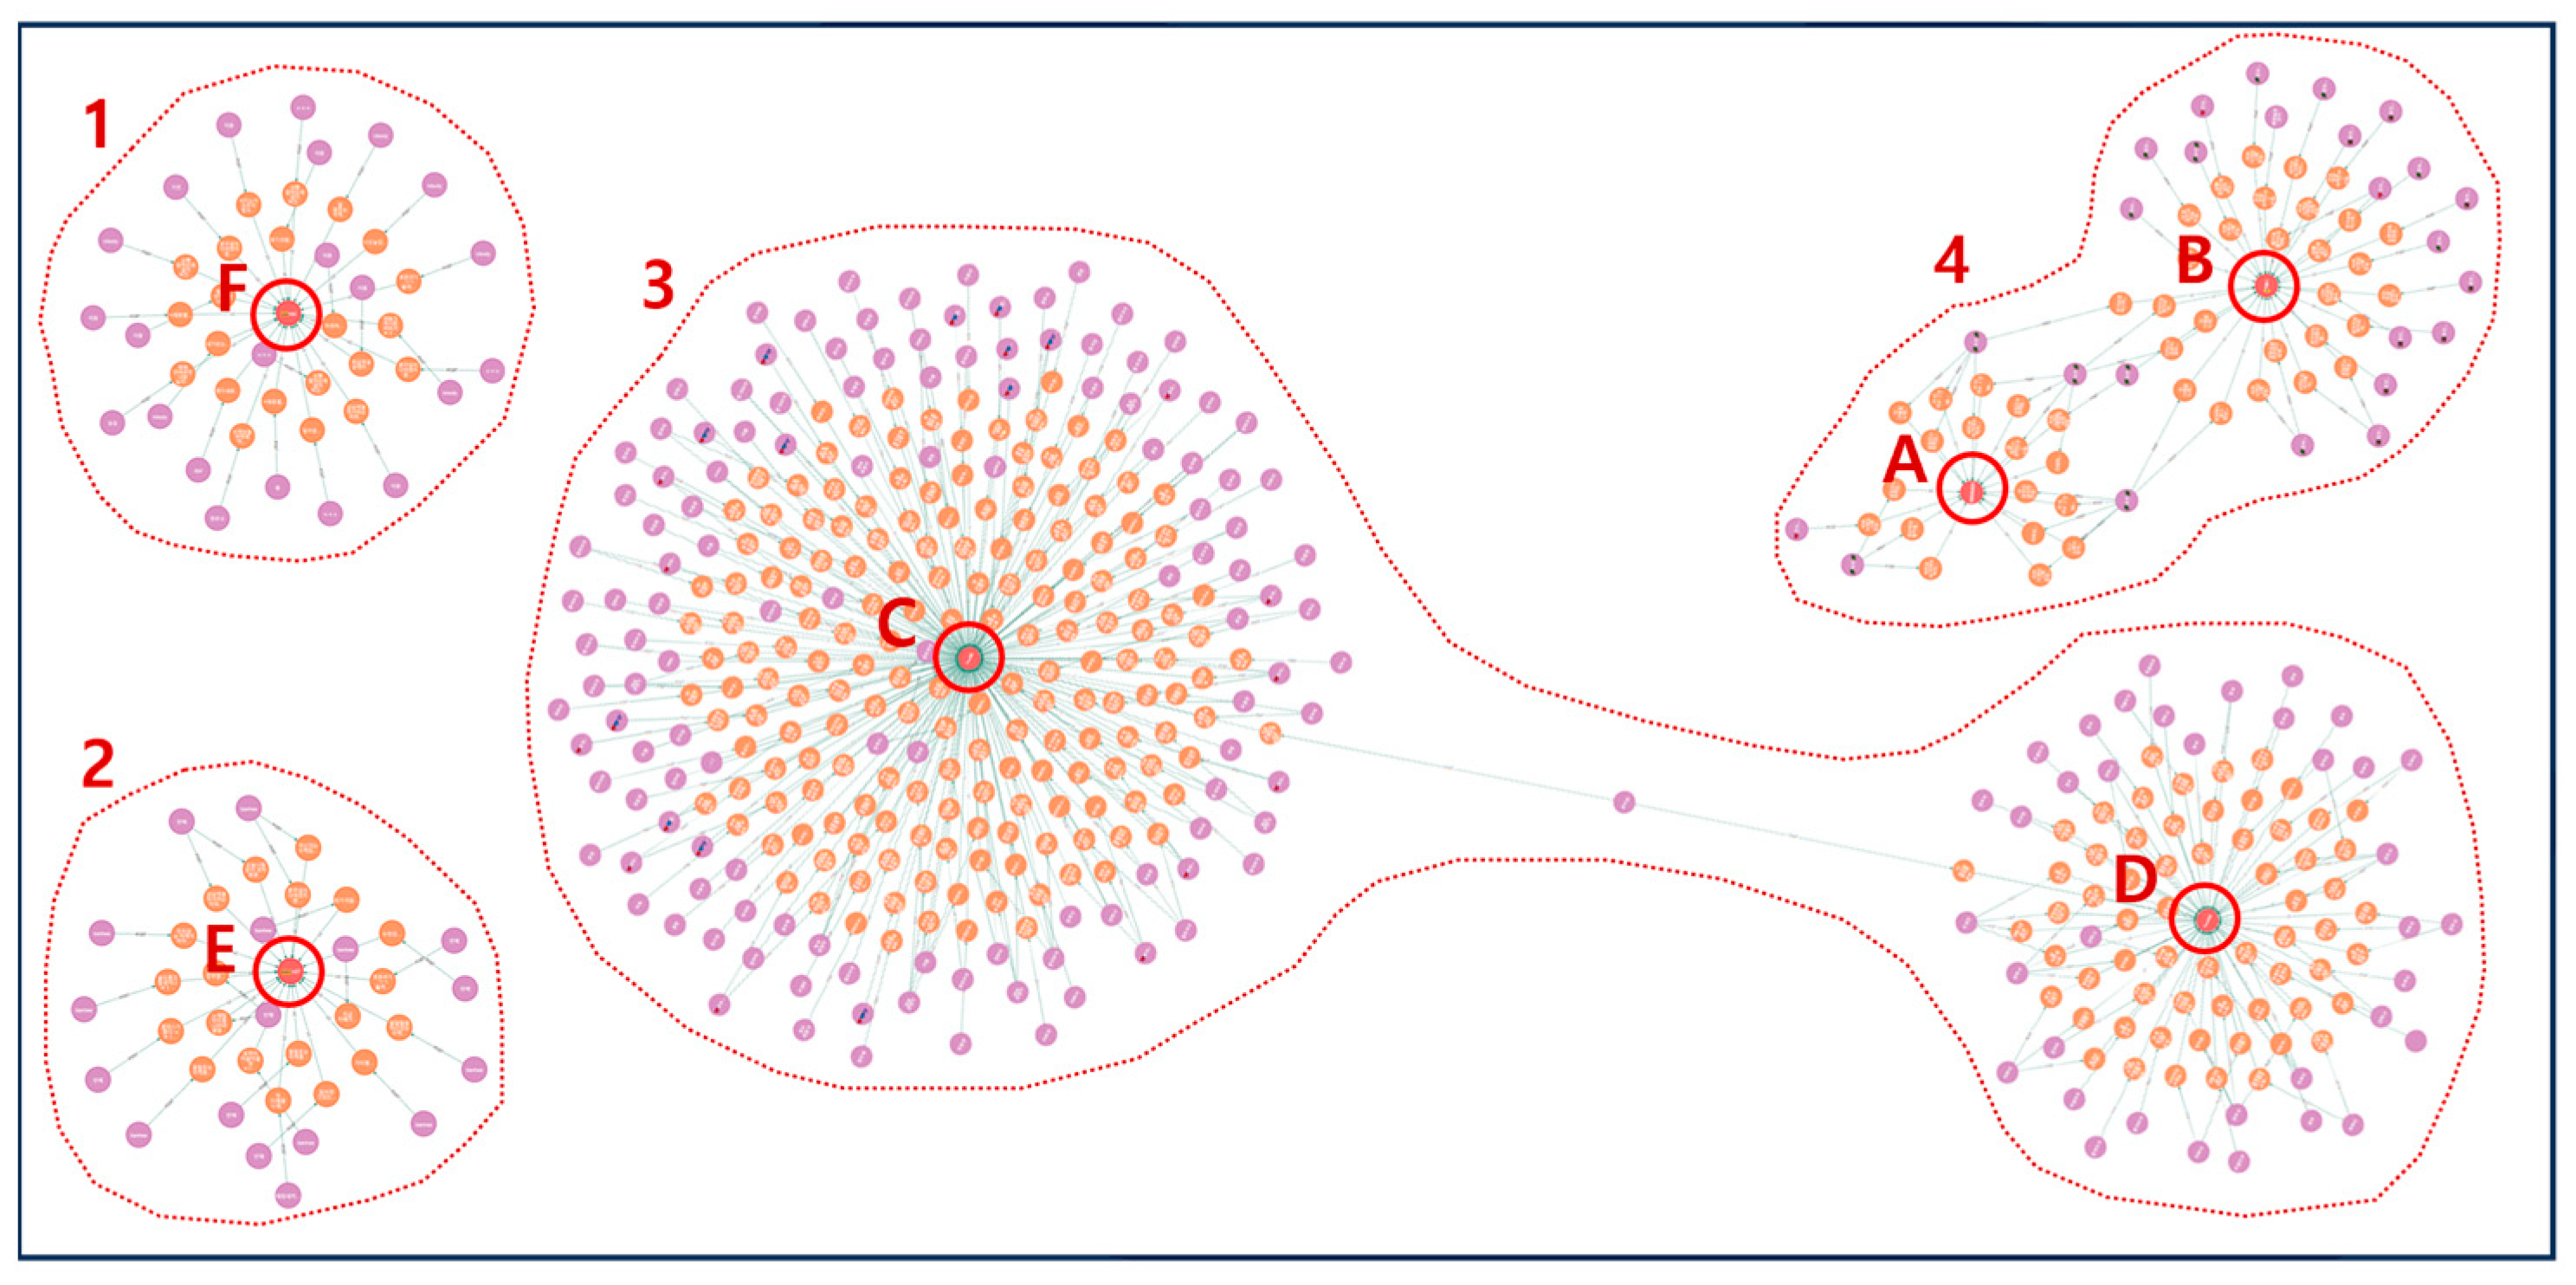
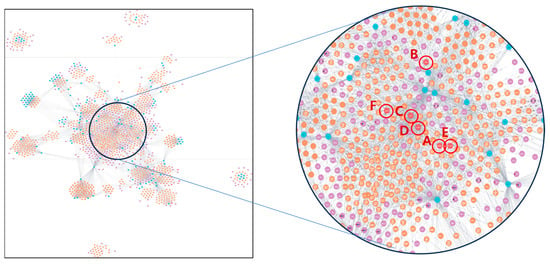
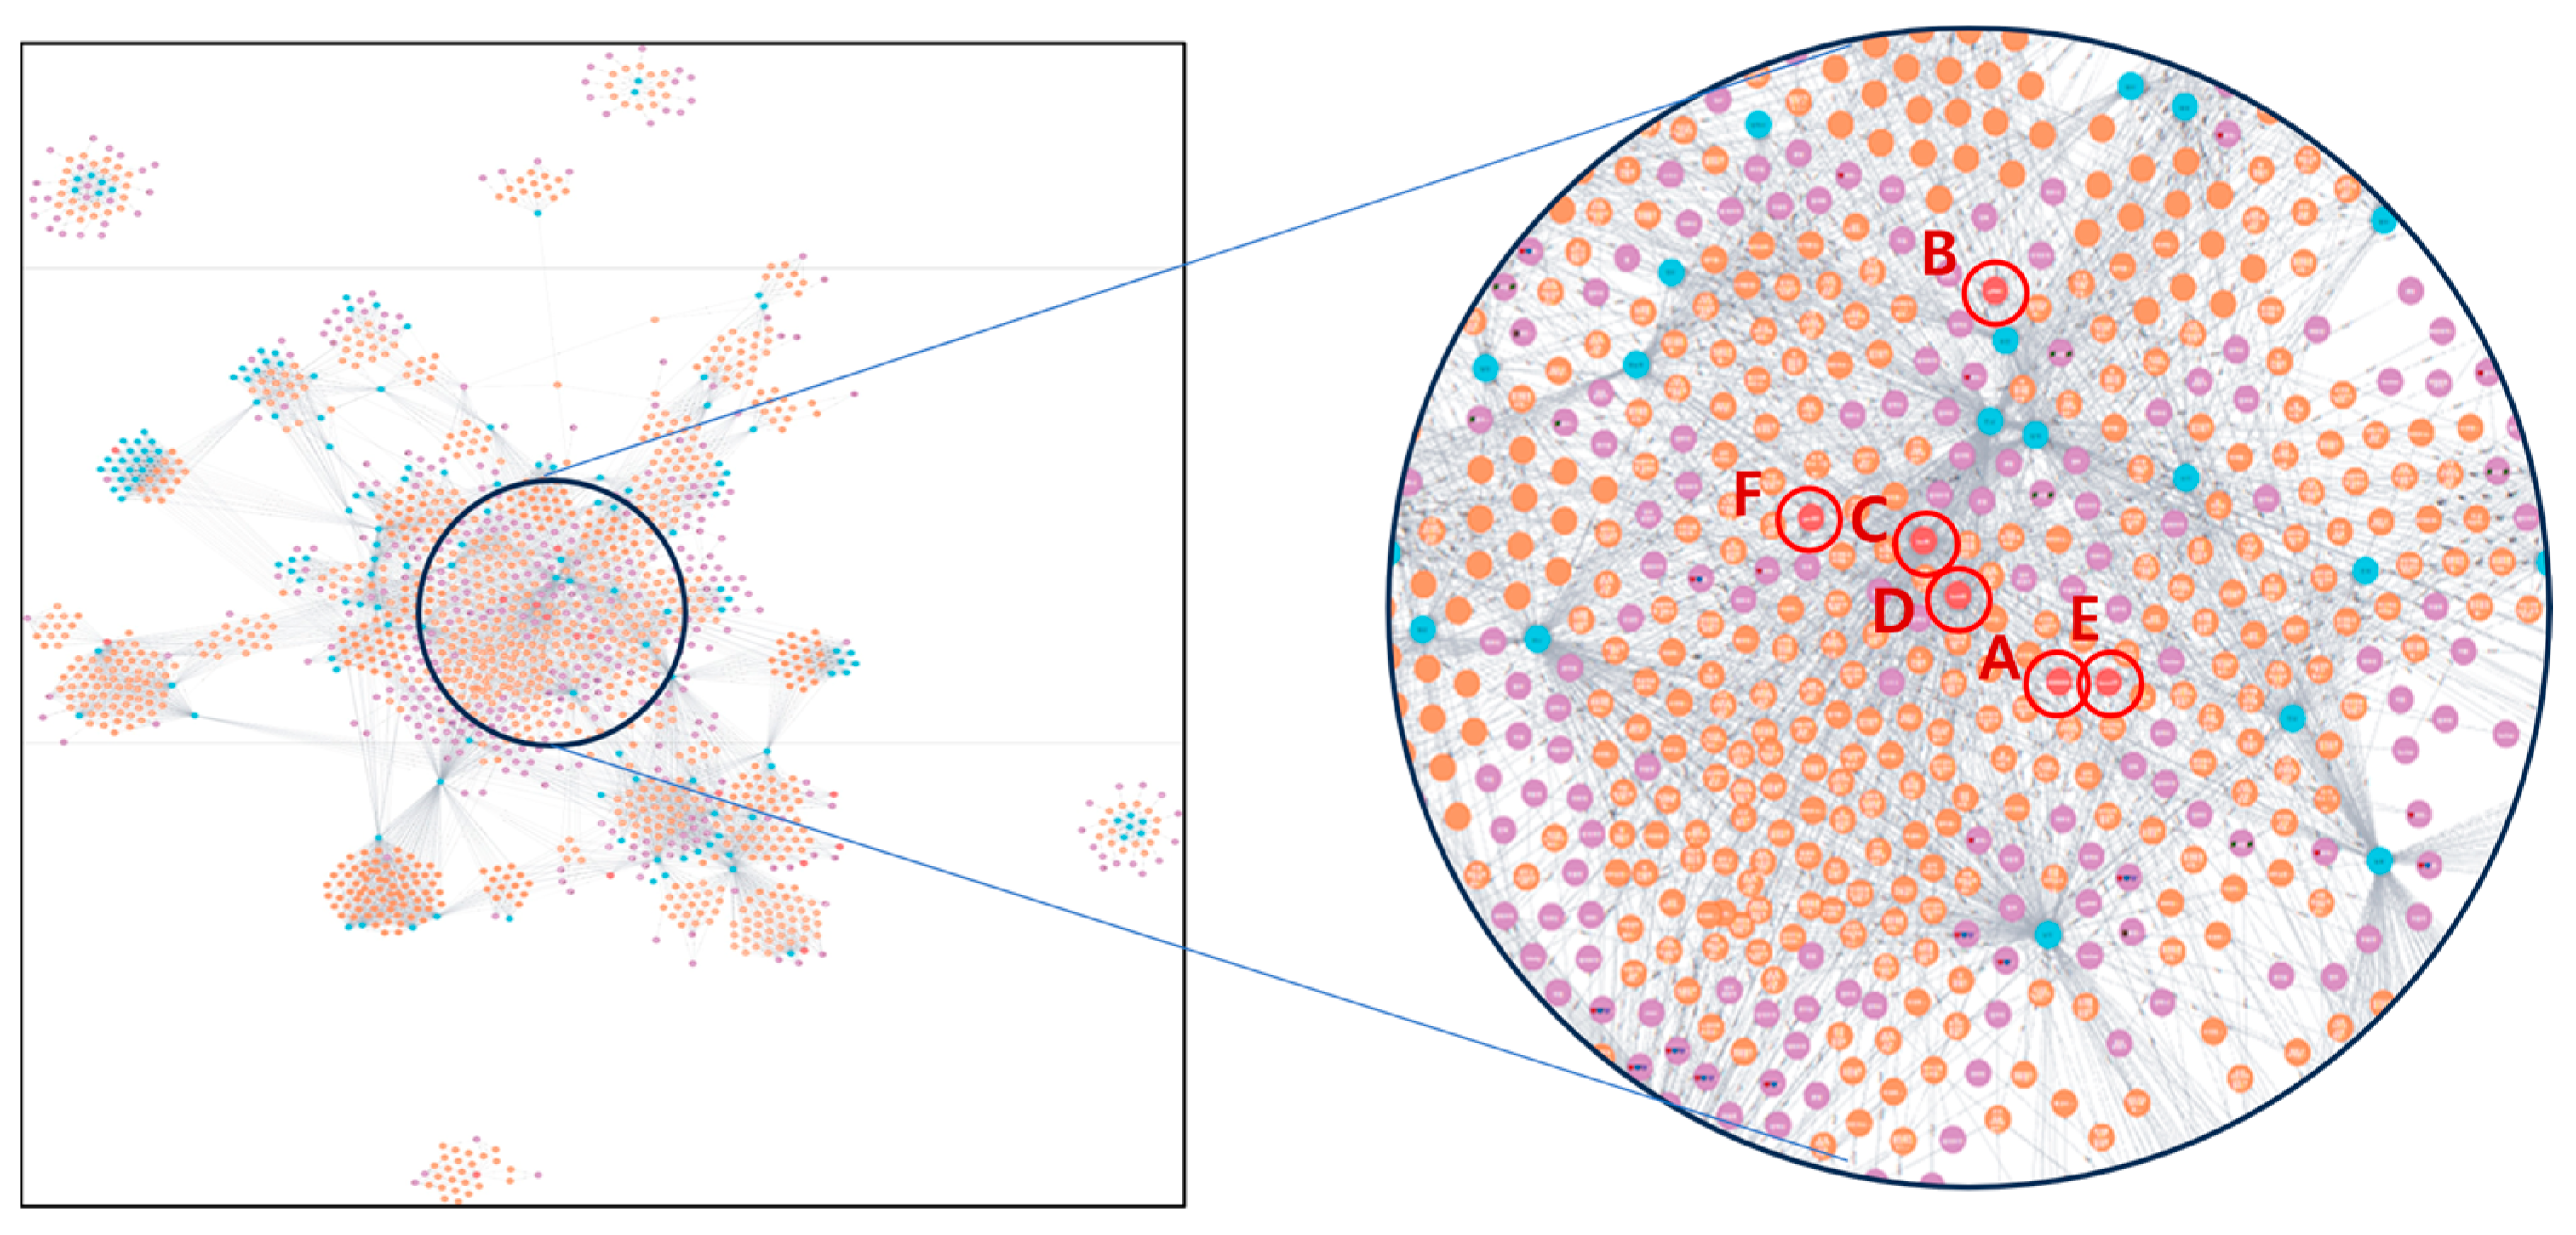

Disclaimer/Publisher’s Note: The statements, opinions and data contained in all publications are solely those of the individual author(s) and contributor(s) and not of MDPI and/or the editor(s). MDPI and/or the editor(s) disclaim responsibility for any injury to people or property resulting from any ideas, methods, instructions or products referred to in the content. |
© 2025 by the authors. Licensee MDPI, Basel, Switzerland. This article is an open access article distributed under the terms and conditions of the Creative Commons Attribution (CC BY) license.