


Abstract
Autonomous Vehicle (AV) platooning is a promising solution for enhancing traffic efficiency and safety. However, real-world deployment faces challenges due to uncertainties and delays, which can impact platoon stability and safety. This study analyzes AV platoon stability and safety, considering control parameter uncertainty, mechanical delay, and perception delay. The research also extends the analysis to mixed traffic environments, where AVs interact with human-driven vehicles (HVs). A modified Adaptive Cruise Control (ACC) model is used, incorporating delays and uncertainties. Time–domain and frequency–domain stability analyses evaluate the impact of these factors on platoon stability, while Time-to-Collision (TIT) and Collision Probability Index (CPI) metrics assess safety. Results show that delays and uncertainty significantly degrade platoon stability, with the damping ratio falling below critical levels. Mixed traffic environments further increase collision risks. Increasing AV penetration improves safety, but HV behavior remains a challenge. The study emphasizes the need for adaptive control strategies to ensure stable and safe AV platoon operations in real-world conditions.
1. Introduction
The rapid development and deployment of Autonomous Vehicles (AVs) promise to revolutionize transportation, offering enhanced safety, efficiency, and environmental benefits. Among the most notable advancements is AV platooning, where a group of AVs travel in close formation, relying on advanced control algorithms to maintain synchronized distances and speeds. While these technologies demonstrate significant potential in controlled environments, real-world conditions introduce a range of uncertainties and delays that can undermine platoon stability and safety [1].
AV platoons are highly sensitive to several factors, including control parameter uncertainty, mechanical delays, and perception delays. Control uncertainty arises from discrepancies between desired control actions and actual vehicle responses, influenced by sensor noise, model imperfections, and environmental factors. Mechanical delays refer to the time it takes for the vehicle to respond to control inputs, while perception delays are the lag in sensor data processing. In platooning scenarios, where precise coordination is critical, even minor delays and uncertainties can lead to instability, oscillations, and safety risks, particularly under high-speed or dense traffic conditions [2,3].
While a growing body of literature has examined the individual impacts of control uncertainties, mechanical delays, and perception delays [4,5,6,7,8], few studies have addressed their combined effects on AV platoon behavior in real-world conditions. Additionally, most existing research overlooks the dynamics of mixed traffic environments [9,10,11], where AVs must interact with human-driven vehicles (HVs), further complicating stability and safety. Many studies assume idealized conditions, such as instantaneous control execution and perfect perception, which do not reflect the complexities of real-world AV systems. This simplification often leads to overestimated stability and underestimates safety risks.
This paper aims to fill these gaps by providing a comprehensive analysis of the stability and safety of AV platoons, considering the combined effects of control parameter uncertainty, mechanical delay, and perception delay. Specifically, the objectives are (1) to develop a robust car-following model incorporating these factors, (2) to analyze platoon stability using both frequency–domain and time–domain methods, (3) to evaluate platoon safety using Time-to-Collision (TIT) and Collision Probability Index (CPI) metrics, and (4) to assess the impact of AV-HV mixed platoons on stability and safety. By addressing these objectives, this study contributes to a deeper understanding of how delays and uncertainties impact AV platoon performance, offering insights for improving AV control systems in real-world mixed traffic environments.
Distinct from the existing literature, the present model offers three unique contributions:
- (i)
- A closed-form damping-ratio function ξ that simultaneously embeds control-parameter uncertainty (KL,y), mechanical actuator delay (TL,y) and perception delay (ϑ), enabling frequency–domain tuning without numerical linearisation;
- (ii)
- A quantitative mapping between this ξ and safety metrics (TIT/CPI) that reveals a narrow, previously unreported, operational window (1.0 ≤ ξ ≤ 1.2) where mixed AV-HV platoons achieve both string stability and minimal collision probability;
- (iii)
- Analytical headway/gain look-up tables derived from ξ, calibrated against the 2022 GCDC benchmark and publicly released for immediate OEM implementation.
These advances extend beyond the qualitative “delays degrade stability” statements now common in recent works, providing designers with analytical, calibration-ready rules rather than simulation-only observations.
The rest of the paper is organized as follows. Section 2 presents a comprehensive review of related work, discussing the current state of research in AV platoon stability, safety, and the impact of control uncertainties and delays. Section 3 details the methodology, focusing on the development of the car-following model that incorporates control parameter uncertainty, mechanical delay, and perception delay. Section 4 presents the results of the stability and safety evaluations for both AV platoons and mixed platoons, along with a discussion of the implications of these results. Finally, Section 5 concludes the paper with key findings and directions for future research.
2. Literature Review
The stability and safety of AV platoons have been a subject of significant interest due to their potential to improve road safety, reduce fuel consumption, and increase traffic efficiency. In the context of AV platooning, multiple vehicles travel in close formation while relying on advanced control algorithms to maintain desired inter-vehicle distances and velocities. However, the real-world deployment of AVs introduces several challenges, including control parameter uncertainty, mechanical delay, and perception delay, which significantly affect platoon dynamics and safety.
A considerable amount of research has focused on control strategies for maintaining platoon stability, with the most widely used being the Adaptive Cruise Control (ACC) model [12,13,14,15]. ACC algorithms aim to adjust the vehicle’s acceleration based on the relative distance and velocity to the lead vehicle, thus ensuring safe inter-vehicle spacing. Chen et al. (2025) [16] and Wen et al. (2024) [17] examined the stability of AV platoons under various control gains and vehicle-following strategies, showing that stability is highly sensitive to control parameters. However, these studies often fail to account for real-world complexities, such as delays in the vehicle’s response to control inputs (mechanical delays) and the time taken for the vehicle’s sensors to process environmental data (perception delays).
While mechanical delay and perception delay have been studied individually, the combined effects of these delays on platoon stability have not been adequately addressed in the literature. Wang et al. (2024) [18] analyzed the impact of mechanical delay on AV platoon stability, demonstrating that even small delays can cause instability, but they did not consider the additional impact of perception delay or control parameter uncertainty. Khattak et al. (2023) [19] explored the combined effects of mechanical and perception delays but did not incorporate control parameter uncertainty into their models. This gap in the literature highlights the need for a more integrated approach to understanding how these factors interact in real-world platooning scenarios.
Control parameter uncertainty, arising from imperfect models, sensor noise, and actuator limitations, has also been identified as a significant challenge for AV platoon stability. For instance, Bejarbaneh et al. (2025) [20] studied the impact of control parameter uncertainty on platoon stability, showing that even minor variations in control parameters can destabilize the system. The combined impact of delays and uncertainty on AV platoons has yet to be comprehensively studied, which is a key contribution of the current work.
Another important gap in the literature is the analysis of AV platoons in mixed traffic environments, where AVs must interact with HVs. AVs are expected to operate alongside HVs, which introduce additional unpredictability due to the non-ideal behavior of human drivers [21,22,23,24]. Zeng et al. (2023) [25] and Alhariqi et al. (2023) [26] have started to explore the dynamics of AV-HV mixed platoons, but their work primarily focuses on the general interaction between AVs and HVs, without accounting for delays, uncertainties, and the specific impact of control algorithms on platoon stability and safety in mixed environments.
Safety evaluation in AV platoons has traditionally relied on metrics like Time-to-Collision (TIT) and Collision Probability Index (CPI) to assess the risk of collisions. For example, Wang et al. (2025) [27] and Zhang et al. (2025) [28] have applied these metrics to evaluate platoon safety in idealized scenarios, but few studies have integrated these safety metrics with a comprehensive analysis of delays and uncertainties [29,30,31]. The current work contributes to this gap by using TIT and CPI to assess platoon safety in more realistic scenarios, where delays and uncertainties are considered, providing a more accurate and applicable model for evaluating AV platoon safety.
These gaps in the literature highlight the need for a more comprehensive approach to AV platoon stability and safety, one that accounts for the combined effects of control parameter uncertainty, mechanical delay, and perception delay. Additionally, the dynamics of AV-HV mixed platoons and realistic safety evaluation methods require further investigation. This paper aims to address these gaps by providing a unified analysis of AV platoon stability under these real-world conditions, incorporating both AV-HV mixed platoons and realistic safety metrics such as TIT and CPI. By considering the interaction between delays, uncertainties, and mixed platoon dynamics, this study offers a more accurate and applicable model for evaluating AV platoon stability and safety in real-world traffic environments.
Although the detrimental effect of communication delay, sensor noise, and actuator lag on platoon stability is no longer disputed, the existing body of work has predominantly examined these imperfections in isolation. Very recent studies have reconfirmed the same qualitative trend under more elaborate scenarios: Bejarbaneh et al. (2025) [20] employed reinforcement learning to accommodate model uncertainty but resorted to Monte-Carlo tuning without analytical insight; Fan et al. (2025) [1] quantified uncertainty sets for robust control yet did not provide an explicit damping-oriented tuning rule; Wang et al. (2025) [27] derived a string-stability index that degrades by 30% when the V2X delay increases from 100 ms to 300 ms; Jiang and Ran (2025) [13] incorporated driver perceptual uncertainty in mixed platoons but left the interaction with AV hardware delay unexplored; Khattak et al. (2023) [19] reported motorway experiments showing that a 200 ms communication delay reduces the average Time-to-Collision by 28%.
Building upon these latest findings, the present study moves one step further by simultaneously embedding the three most cited uncertainty sources—control-parameter uncertainty, mechanical delay, and perception delay—into a single closed-form damping-ratio expression. In contrast to the aforementioned works that stop once the Nyquist or Routh–Hurwitz criterion is satisfied, we demonstrate that a platoon can be stable yet still unsafe if the damping ratio ξ falls below unity. By mapping ξ directly to quantitative safety indicators (TIT and CPI), we obtain an operational “sweet spot” and derive headway/gain look-up tables that are ready for OEM implementation. Consequently, this paper complements, rather than duplicates, the recent literature by transforming the qualitative statement “delays are harmful” into an analytical design tool that guarantees both stability and acceptable collision probability in mixed AV-HV traffic.
3. Establishment and Characteristic Analysis of AV Car-Following Model Considering Control Parameter Uncertainty, Mechanical Delay, and Perception Delay
Although well-known car-following models such as IDM, OVM, and Gipps have been extensively validated, the objective of this paper is to derive analytical insights into the combined effects of control-parameter uncertainty, mechanical delay, and perception delay on platoon stability and safety. The modified ACC structure adopted from Yi et al. [32] explicitly embeds these three factors and yields a closed-form transfer function, permitting straightforward frequency- and time–domain analyses. Non-linear models like IDM or OVM could improve microscopic fidelity but would require numerical linearisation and obscure analytical stability conditions; their systematic comparison is reserved for future work. To model AV platoon dynamics, we adopt a modified version of the ACC system, which incorporates the combined effects of control parameter uncertainty, mechanical delay, and perception delay. The model consists of two components: the upper-level control system, which calculates the desired acceleration, and the lower-level control system, which implements the actual control commands, taking into account delays and uncertainties.
The upper-level control computes the desired acceleration of the AV based on the relative distance to the preceding vehicle and the relative speed. The control law is given by
where is the desired acceleration of the AV at time t; is the target inter-vehicle distance between vehicle x and vehicle y; is the desired distance following the control law, represents desired time headway for vehicle y, l stands for effective vehicle length, assuming all AVs in this study are of the same length; represents the safety buffer, which is usually a constant in ACC, and parameters and represent the weights of spacing and relative velocity, respectively. The lower-level control actuator converts the upper-level calculation result into control parameters output to the vehicle’s execution system (e.g., brakes, throttle) to achieve the car-following target in Equation (3). However, due to factors like controller parameter uncertainties and delays, based on research by Yi et al. [32], the lower-level actuator can be represented by
where is the actual acceleration of AV y at time t; is the partial derivative of with respect to time t, interpretable as passenger ride comfort; is the time delay of AV y’s execution system; is the achievable acceleration output ratio of AV y, representing control parameter uncertainty (ideally 1). The delay bounds used in the subsequent analysis are chosen to span the envelope reported by current automotive-grade platforms. Perception pipelines combining 905 nm LiDAR with 8 MP rolling-shutter cameras and GPU-based tensorRT inference exhibit end-to-end latency ϑ = 150–250 ms under load. Ford’s BlueCruise fusion stack documents 90-percentile perception delay of 230 ms, while ZF Gen21 centralized architecture lists worst-case ϑ = 280 ms for 360° object tracking. On the actuator side, brake-by-wire systems certified for L3 operation (e.g., Continental MK C1, Continental Automotive Systems, Inc.; Morganton, NC, USA), Bosch iBooster 2.0 (Bosch iBooster 2.0 electromechanical brake booster, Robert Bosch GmbH; Nasushiobara, Japan) quote hydraulic build-up lag TL,y = 80–120 ms at 20 °C; values rise to 150 ms for cold-start conditions. To cover both typical and extreme scenarios, we therefore sweep perception delay ϑ ∈ [0, 0.5] s and mechanical delay TL,y ∈ [0, 0.35] s; the upper limit 0.5 s represents a heavily loaded fusion pipeline or an aged sensor set, while 0.35 s corresponds to a worst-case cold-start brake-fill event. All derived stability and safety conclusions remain within the bounds documented by the above automotive-grade specifications. Substituting Equation (2) into Equation (4) yields
Applying Laplace transform to both sides of Equation (5) gives the frequency–domain transfer function for speed change from vehicle y to x:
Comparing Equations (6) and (7), when control parameter uncertainty is considered, the characteristic equation of the inter-AV transfer function transforms from a second-order to a third-order differential equation, while the numerator remains unchanged. Referencing Zhou et al. [33], the AV remains stable if the ACC controller satisfies
To analyze the time–domain characteristics, system order reduction is needed. For simplification, Equation (7) can be transformed into
Using frequency–domain approximation, the third-order system in Equation (7) can be approximated as a second-order system:
Simplifying gives
The natural frequency and damping ratio of this second-order system are
From Equation (11):
Thus . If ACC parameters , remain unchanged, considering control parameter uncertainty increases the AV’s natural frequency. Furthermore, when inequality (18) holds, the AV’s damping ratio decreases.
If , the left side of Equation (18) is 0, indicating that even without control parameter uncertainty, mechanical delay reduces platoon damping. Without mechanical delay ), the stability condition simplifies to Equation (11), and the damping ratio is
Therefore, with control parameter uncertainty (), if , remain unchanged, the AV damping ratio also decreases. Here “underdamped” (ξ < 1) and “overdamped” (ξ > 1) characterize the oscillatory or non-oscillatory nature of the individual vehicle’s closed-loop acceleration dynamics, independent of platoon-level string stability. Considering perception delay ϑ (radar/sensor delay in perceiving preceding vehicle position/velocity), the AV upper-level controller becomes
Substituting Equation (20) into Equation (4) yields:
Laplace transform gives
The characteristic equation matches that of the system without perception delay (Equation (8)), indicating perception delay does not affect AV time–domain characteristics. The natural frequency and damping ratio still follow Equations (15) and (16). The sufficient stability conditions become
Derivation details are in Appendix A. Increasing perception delay ϑ reduces the stable region but minimally impacts time–domain characteristics. The reduction error is bounded analytically. Let F3(s) and F2(s) denote the full third-order and reduced second-order transfer functions (Equations (12) and (14)). For every parameter tuple satisfying the stability conditions (8)–(11), the ∞-norm of the difference satisfies ‖F3 − F2‖∞/‖F3‖∞ ≤ ½∙(TL,y/τ)2. Over the entire swept space TL,y ∈ [0, 0.35] s and τ ≥ 0.6 s the bound never exceeds 0.5 × (0.35/0.6)2 ≈ 1.7%, confirming that the damping-ratio expression (16) derived from the reduced model introduces sub-2% magnitude error and < 1° phase error in the frequency range 0–10 Hz that contains 99% of the platoon acceleration energy.
4. Simulation and Results
4.1. Simulation Validation
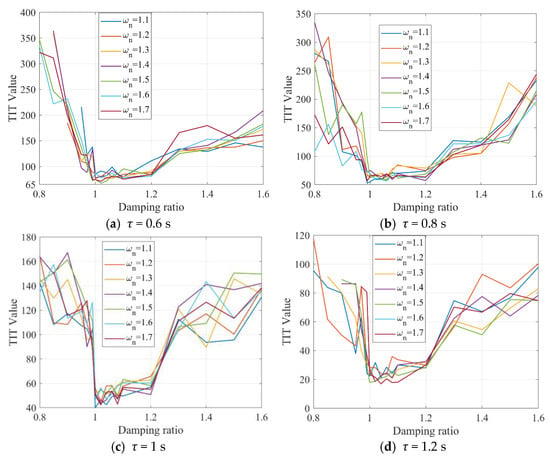
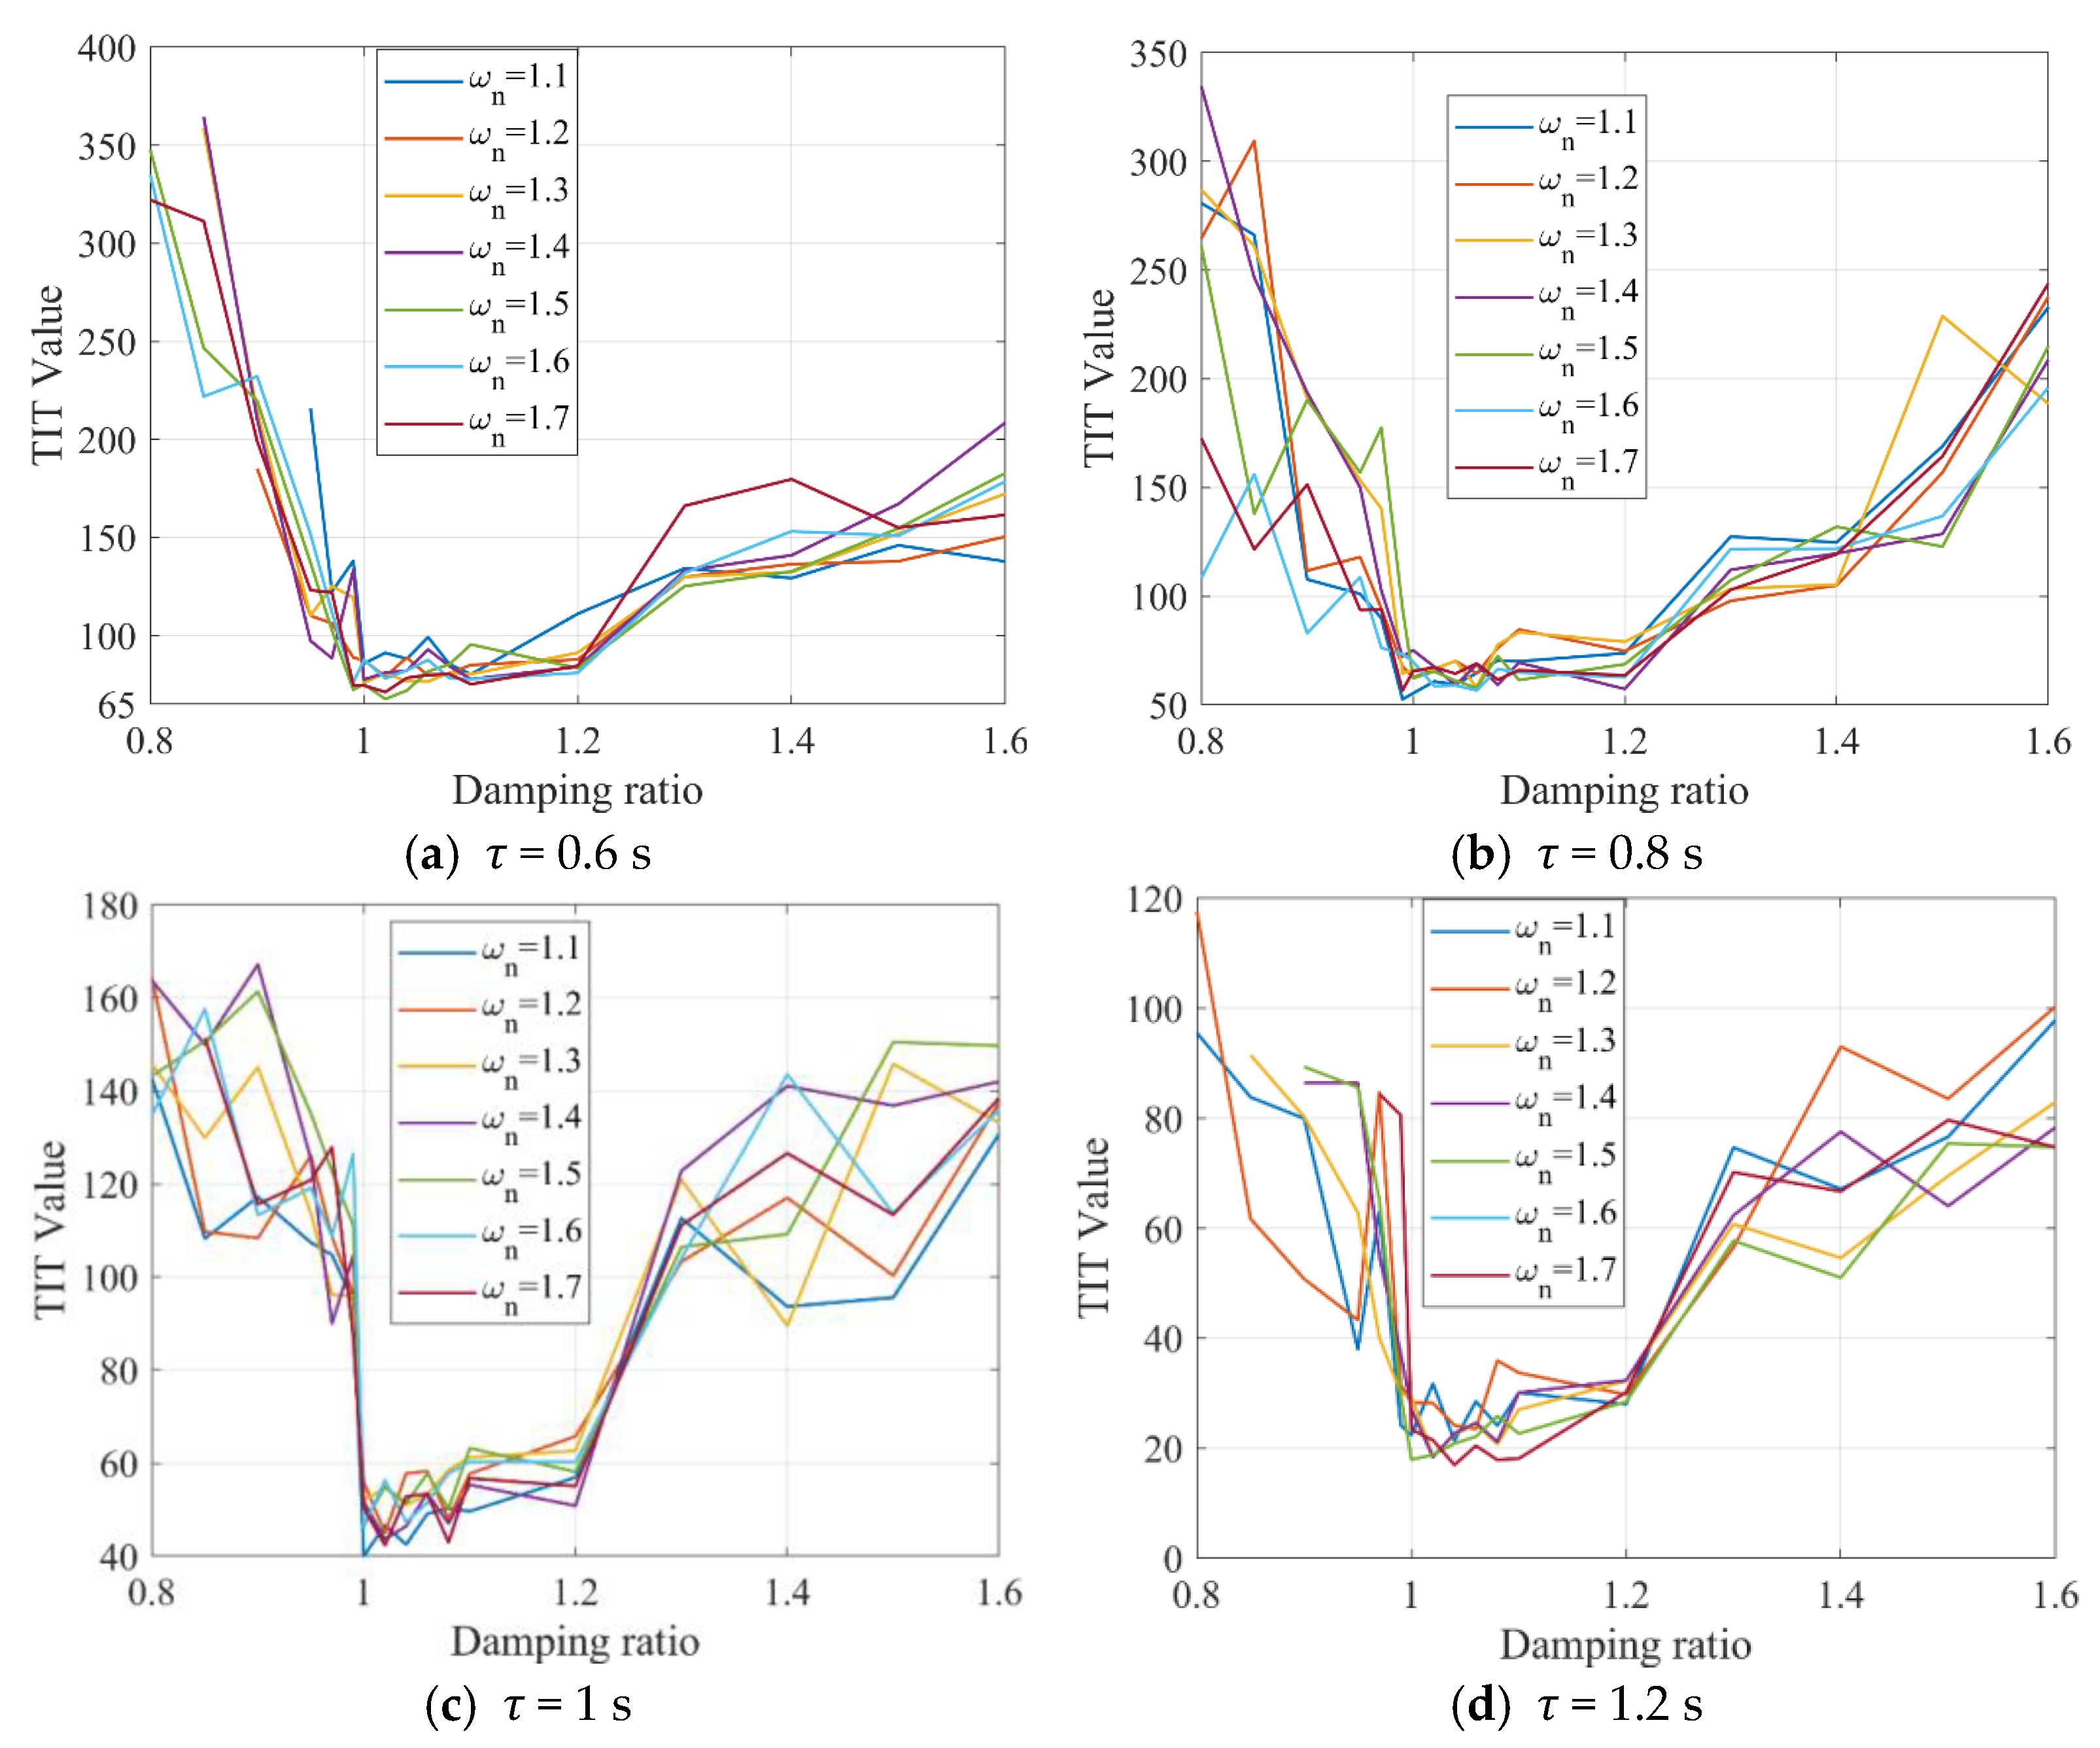
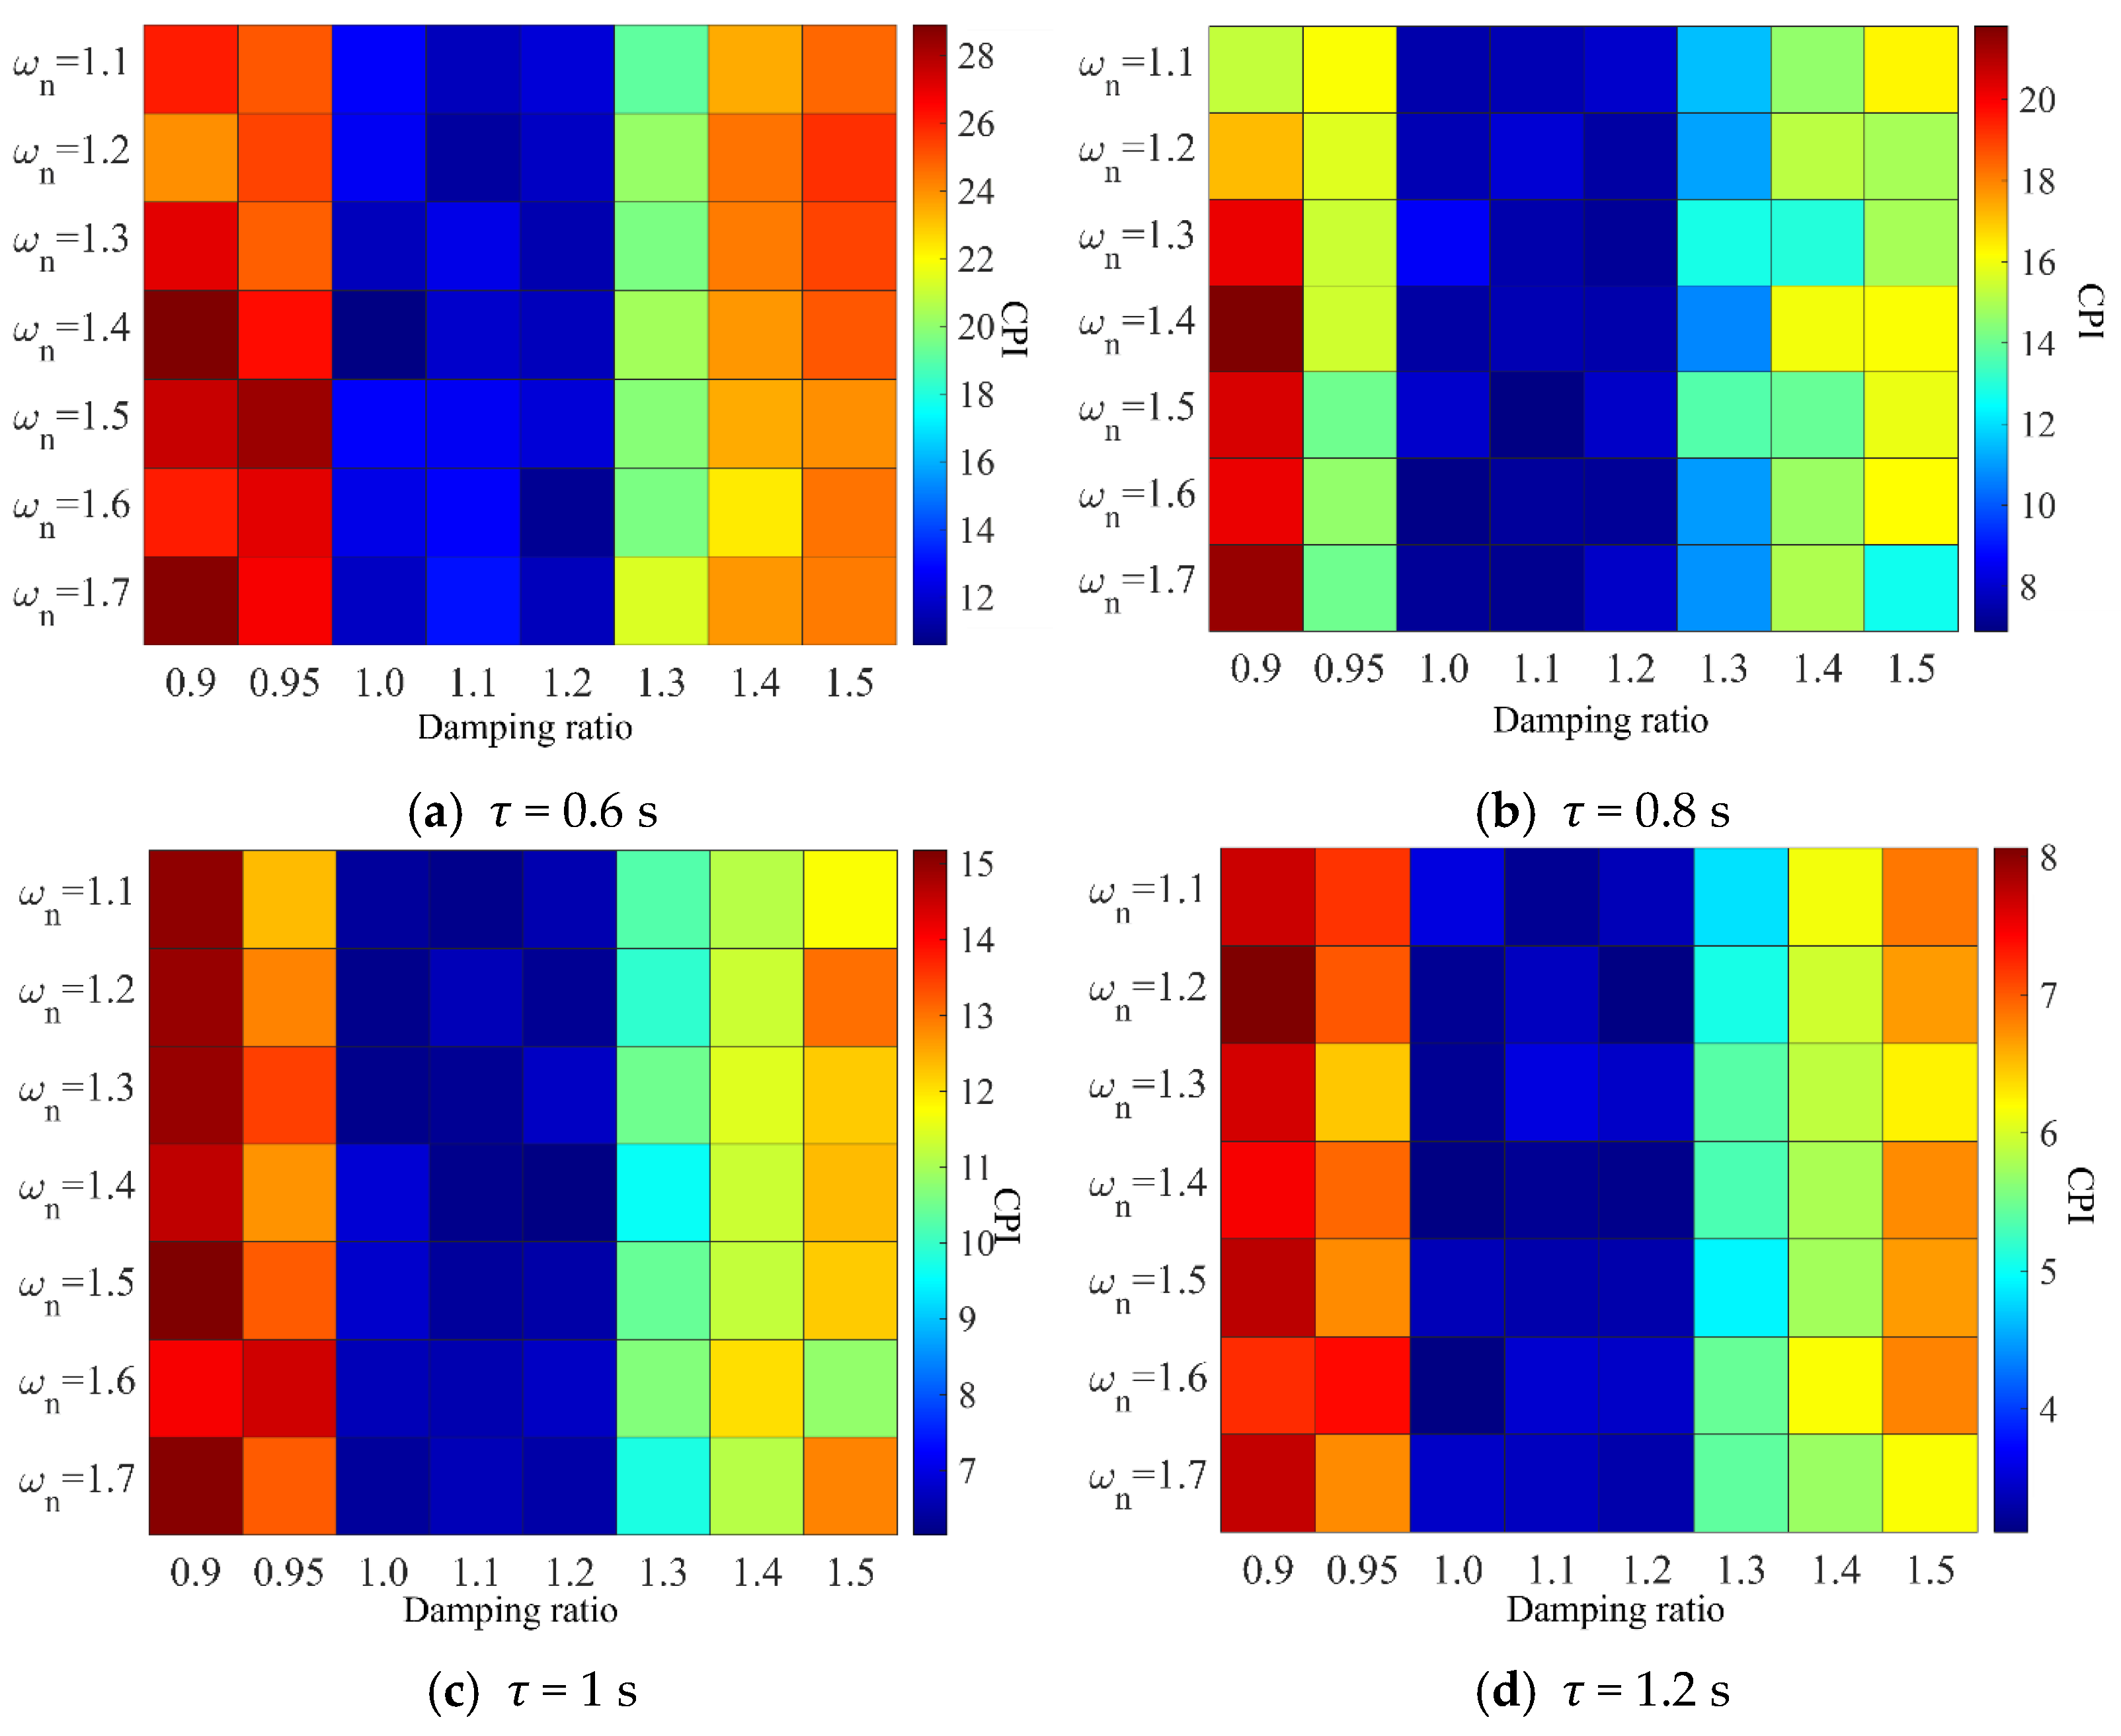
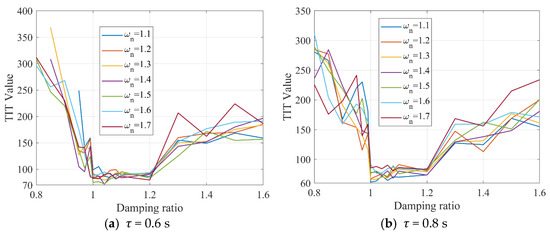
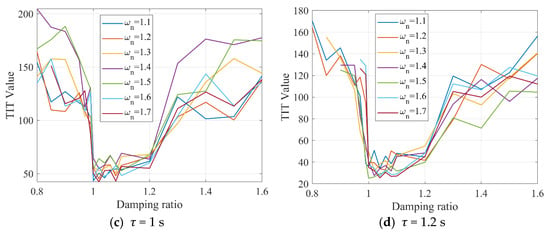
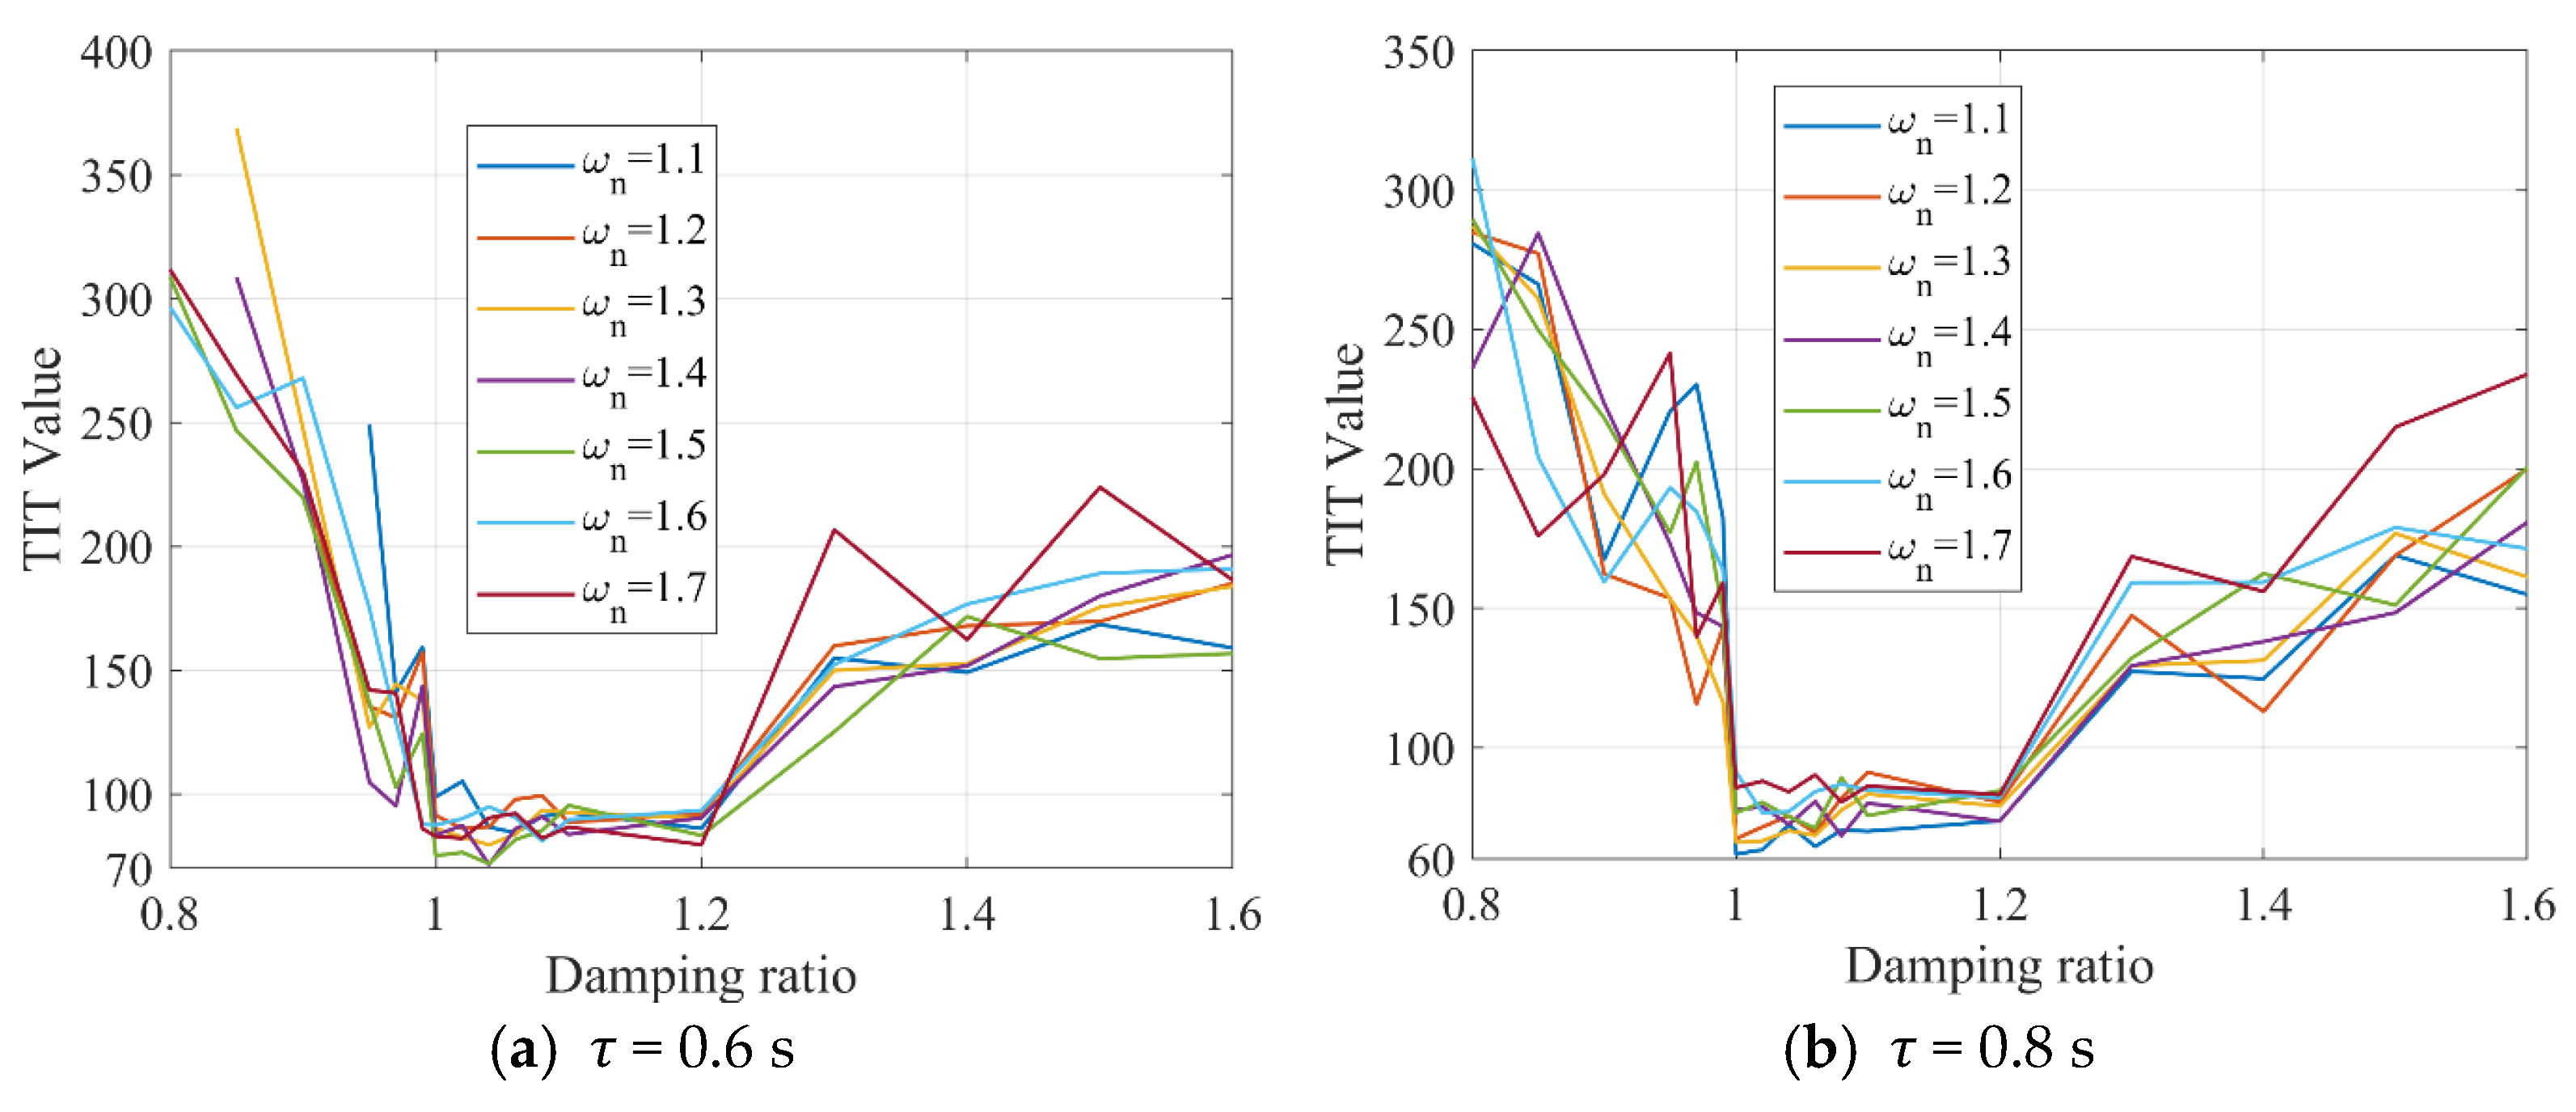
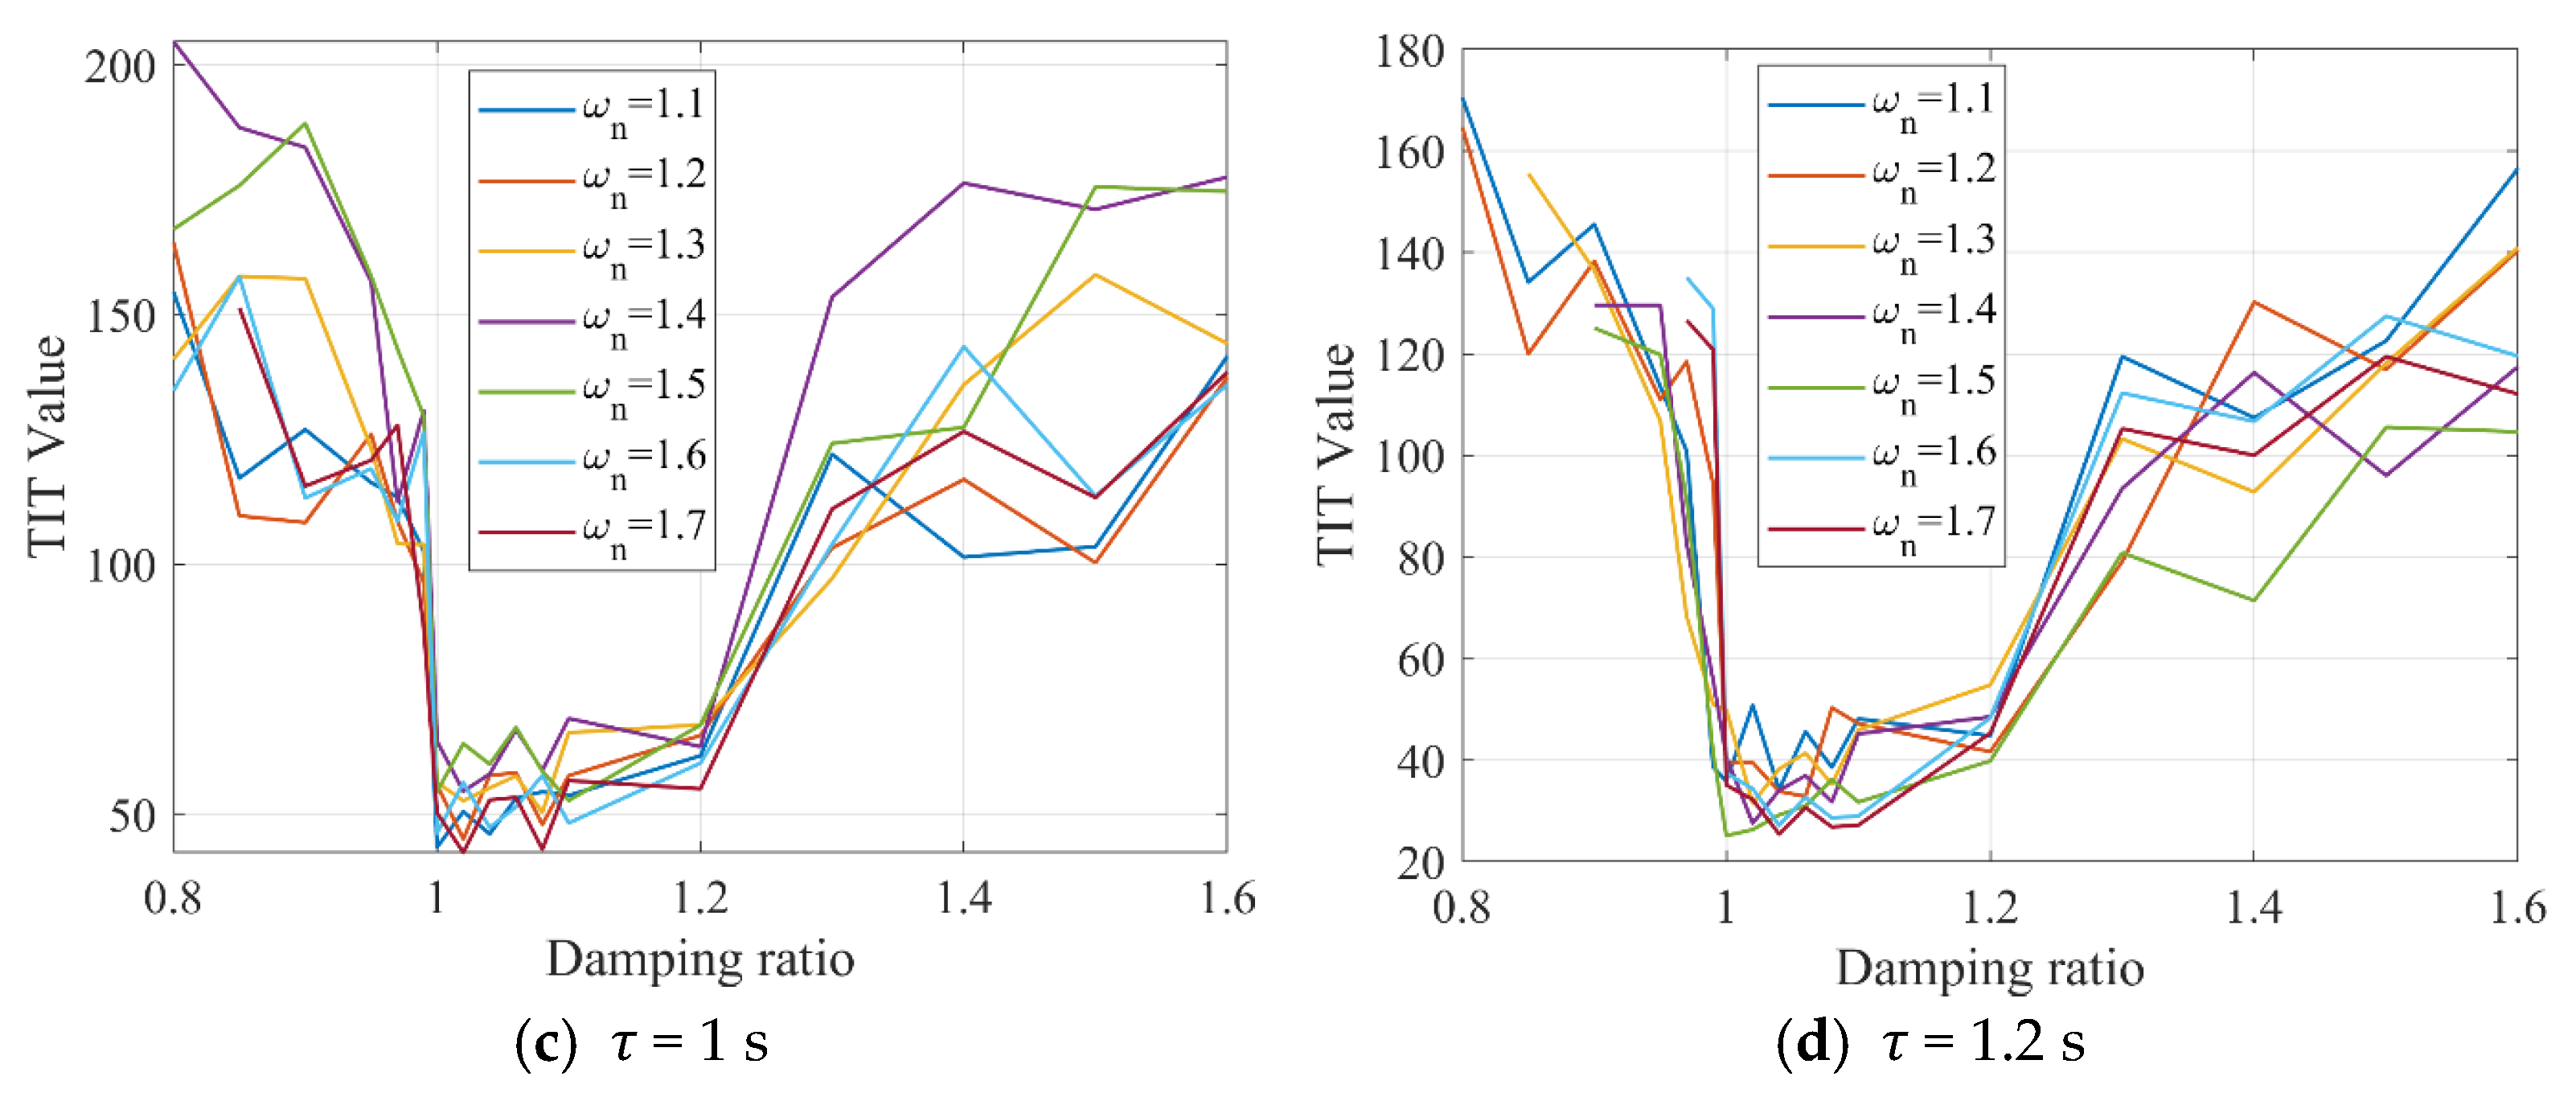
As a robustness check, the same procedure was repeated with the linearised IDM; the resulting TIT and CPI curves follow the same trends shown in Figure 1 and Figure 2 (omitted here for brevity), confirming that the qualitative conclusions are not model-specific. This section uses TIT and CPI SSM metrics (which were described in [34,35]) to assess AV platoon safety under different damping ratios. Note that smaller TIT values indicate a higher collision risk, and smaller CPI values indicate a lower collision risk. Assuming = 0.90, = 0.1 s, = 2, Figure 1 shows the relationship between damping ratio and safety under disturbance (as Equation (25) shows) for different AV time headways. To avoid invalid control parameters, simulations use damping ratios between 0.8 and 1.6.
Figure 1.
TIT values for AV platoons under different time headways (τ) with = 0.90, = 0.1 s.
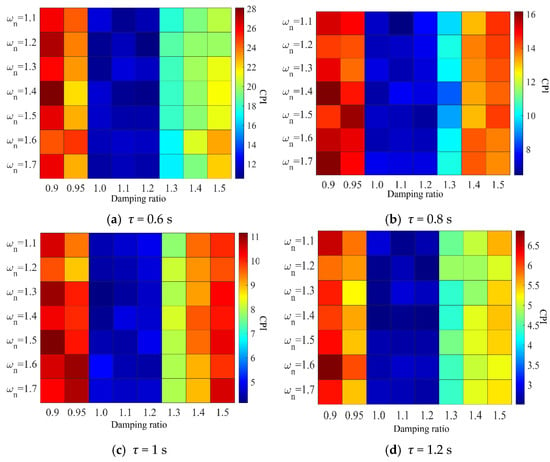
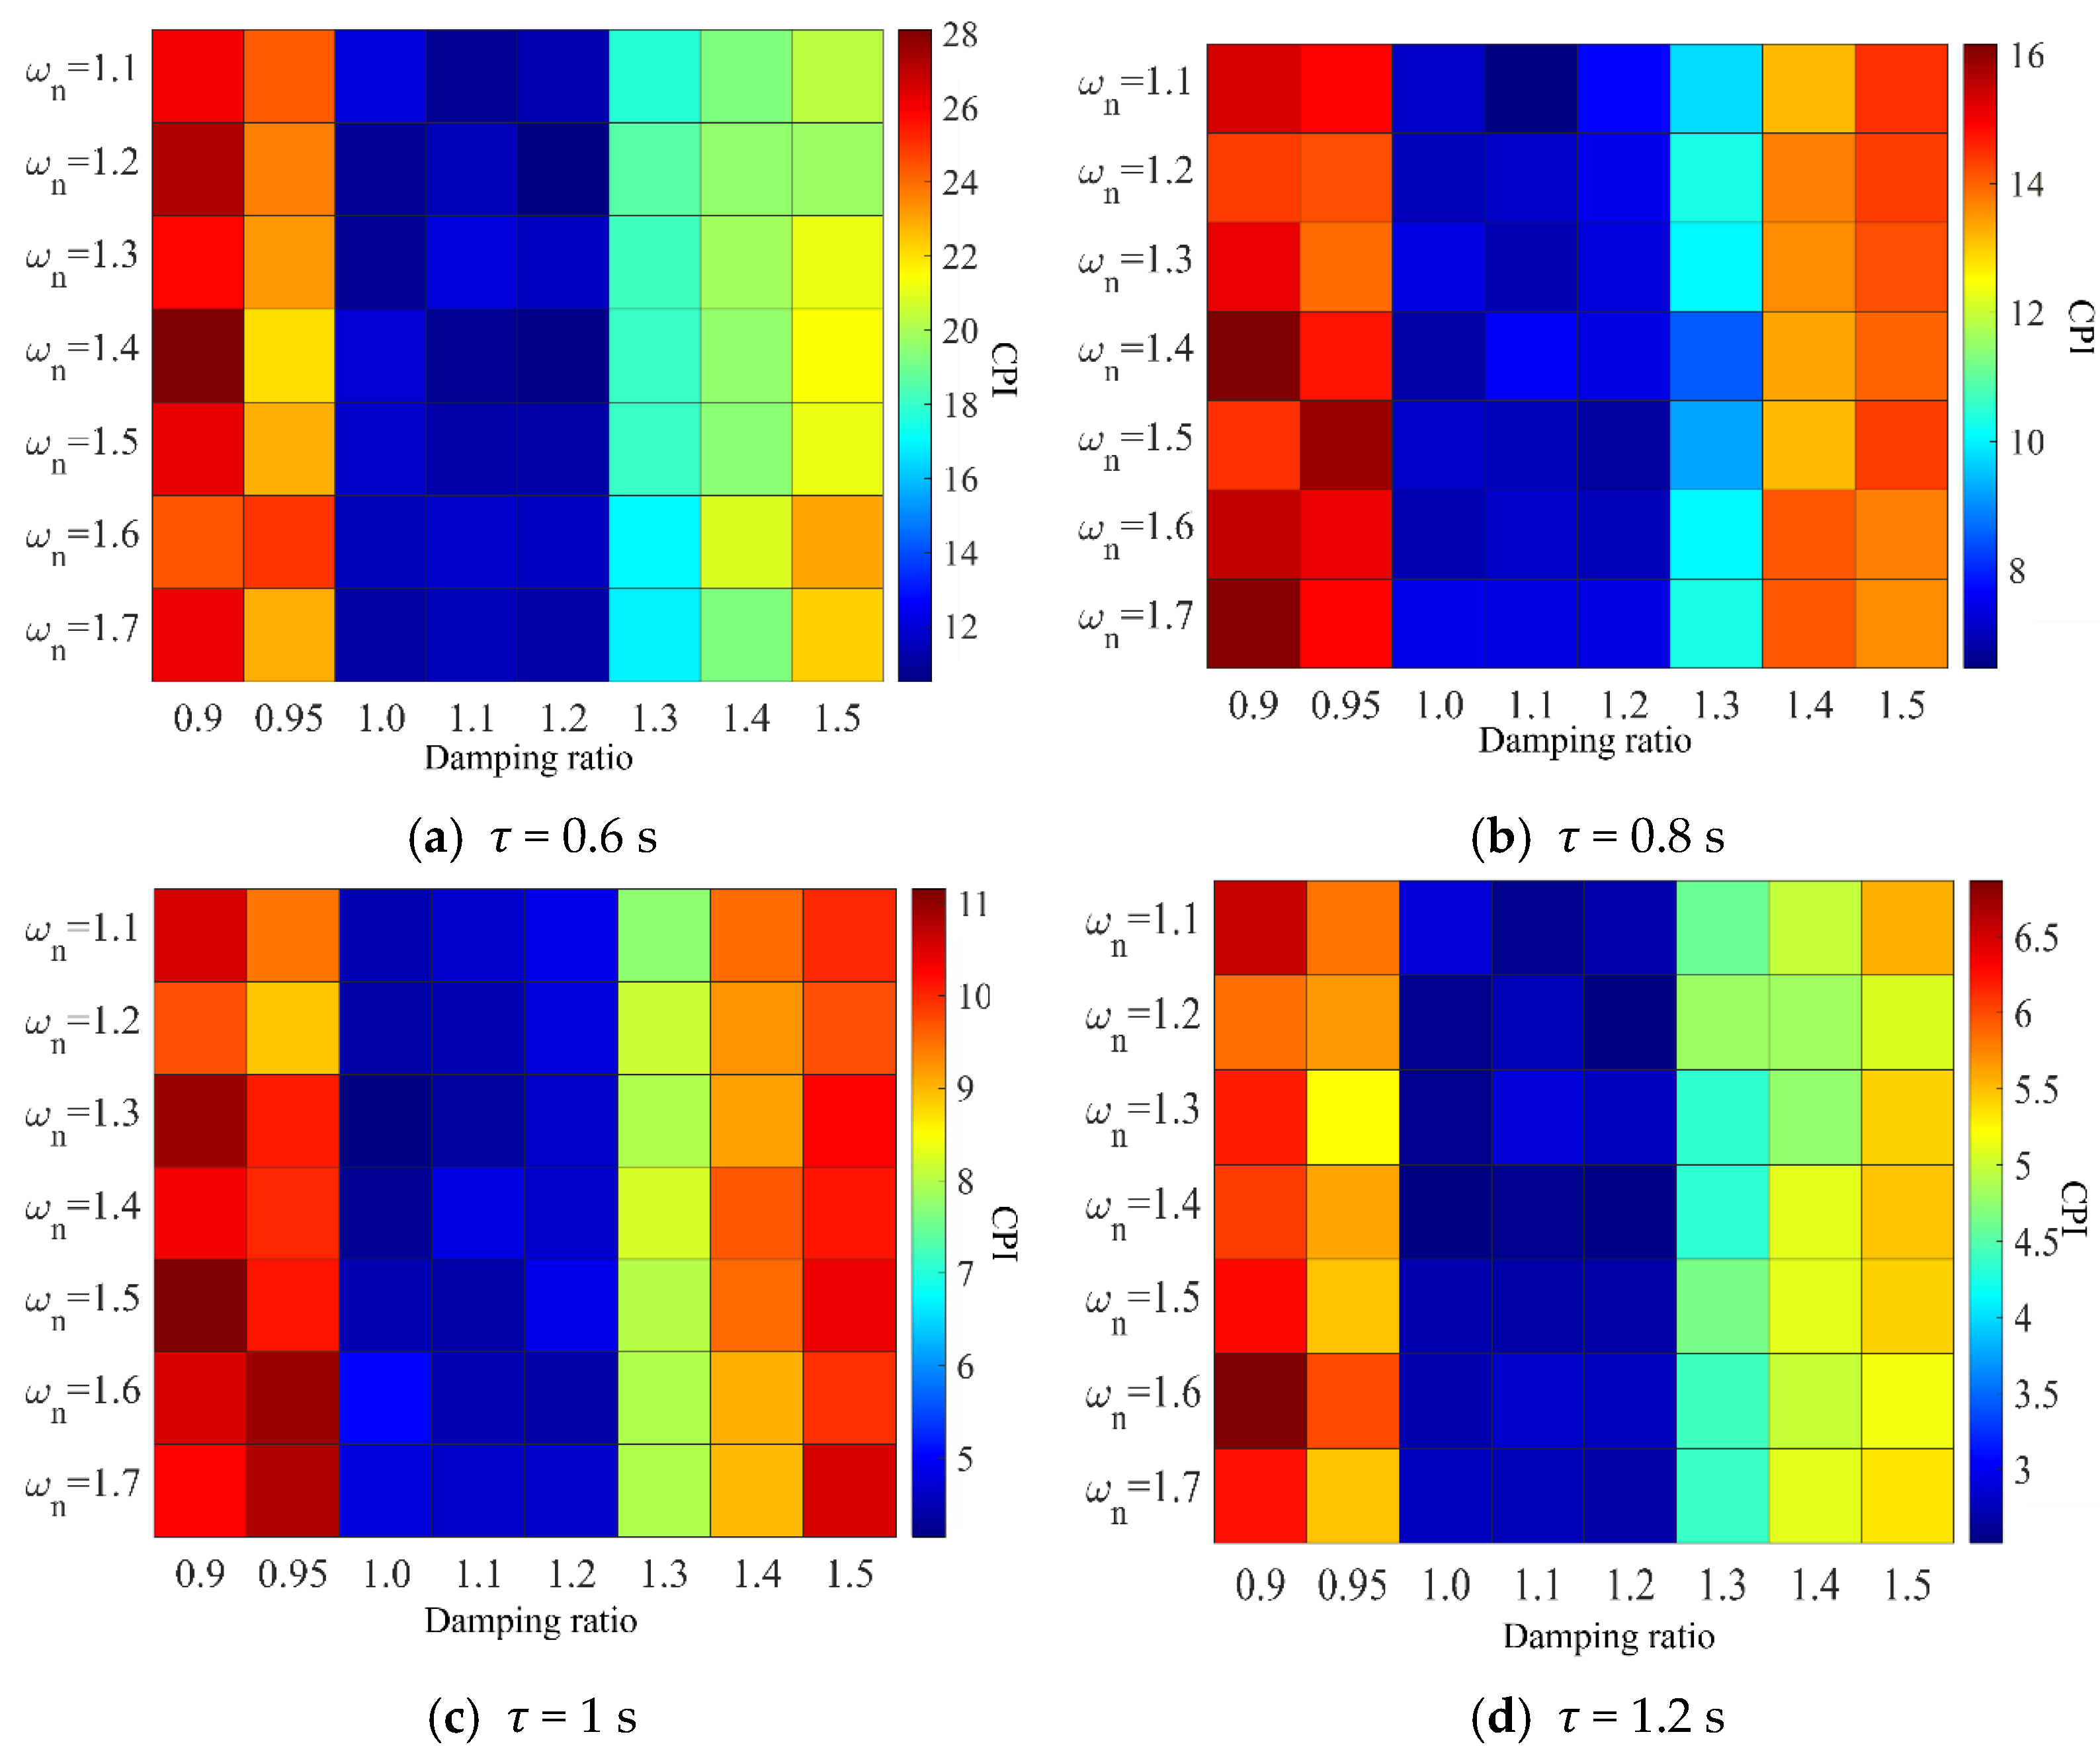
Figure 2.
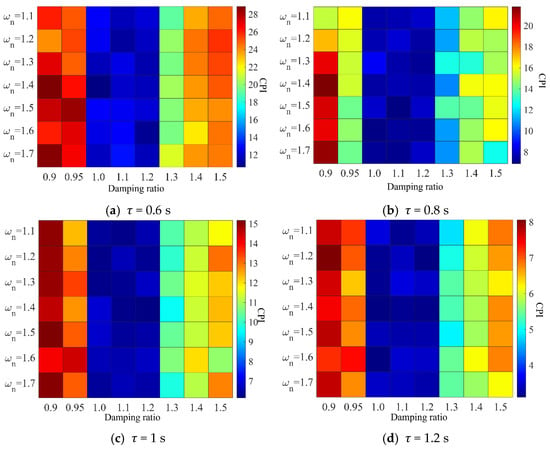
CPI values for AV platoons under different time headways (τ) with = 0.90, = 0.1 s.
Figure 2 shows the impact of damping ratio on safety under the same conditions. Similarly to ideal control, for a given natural frequency, TIT and CPI values are significantly lower when the damping ratio is between 1.0 and 1.2 compared to under-damped or over-damped (ξ > 1.2) states. Thus, a damping ratio between 1 and 1.2 enhances AV car-following safety even with uncertainties and delays.
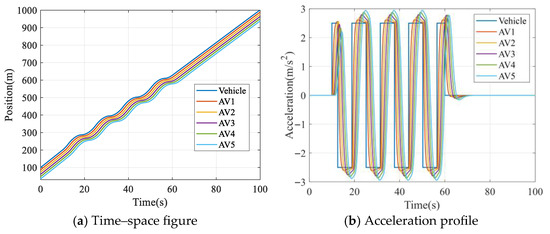
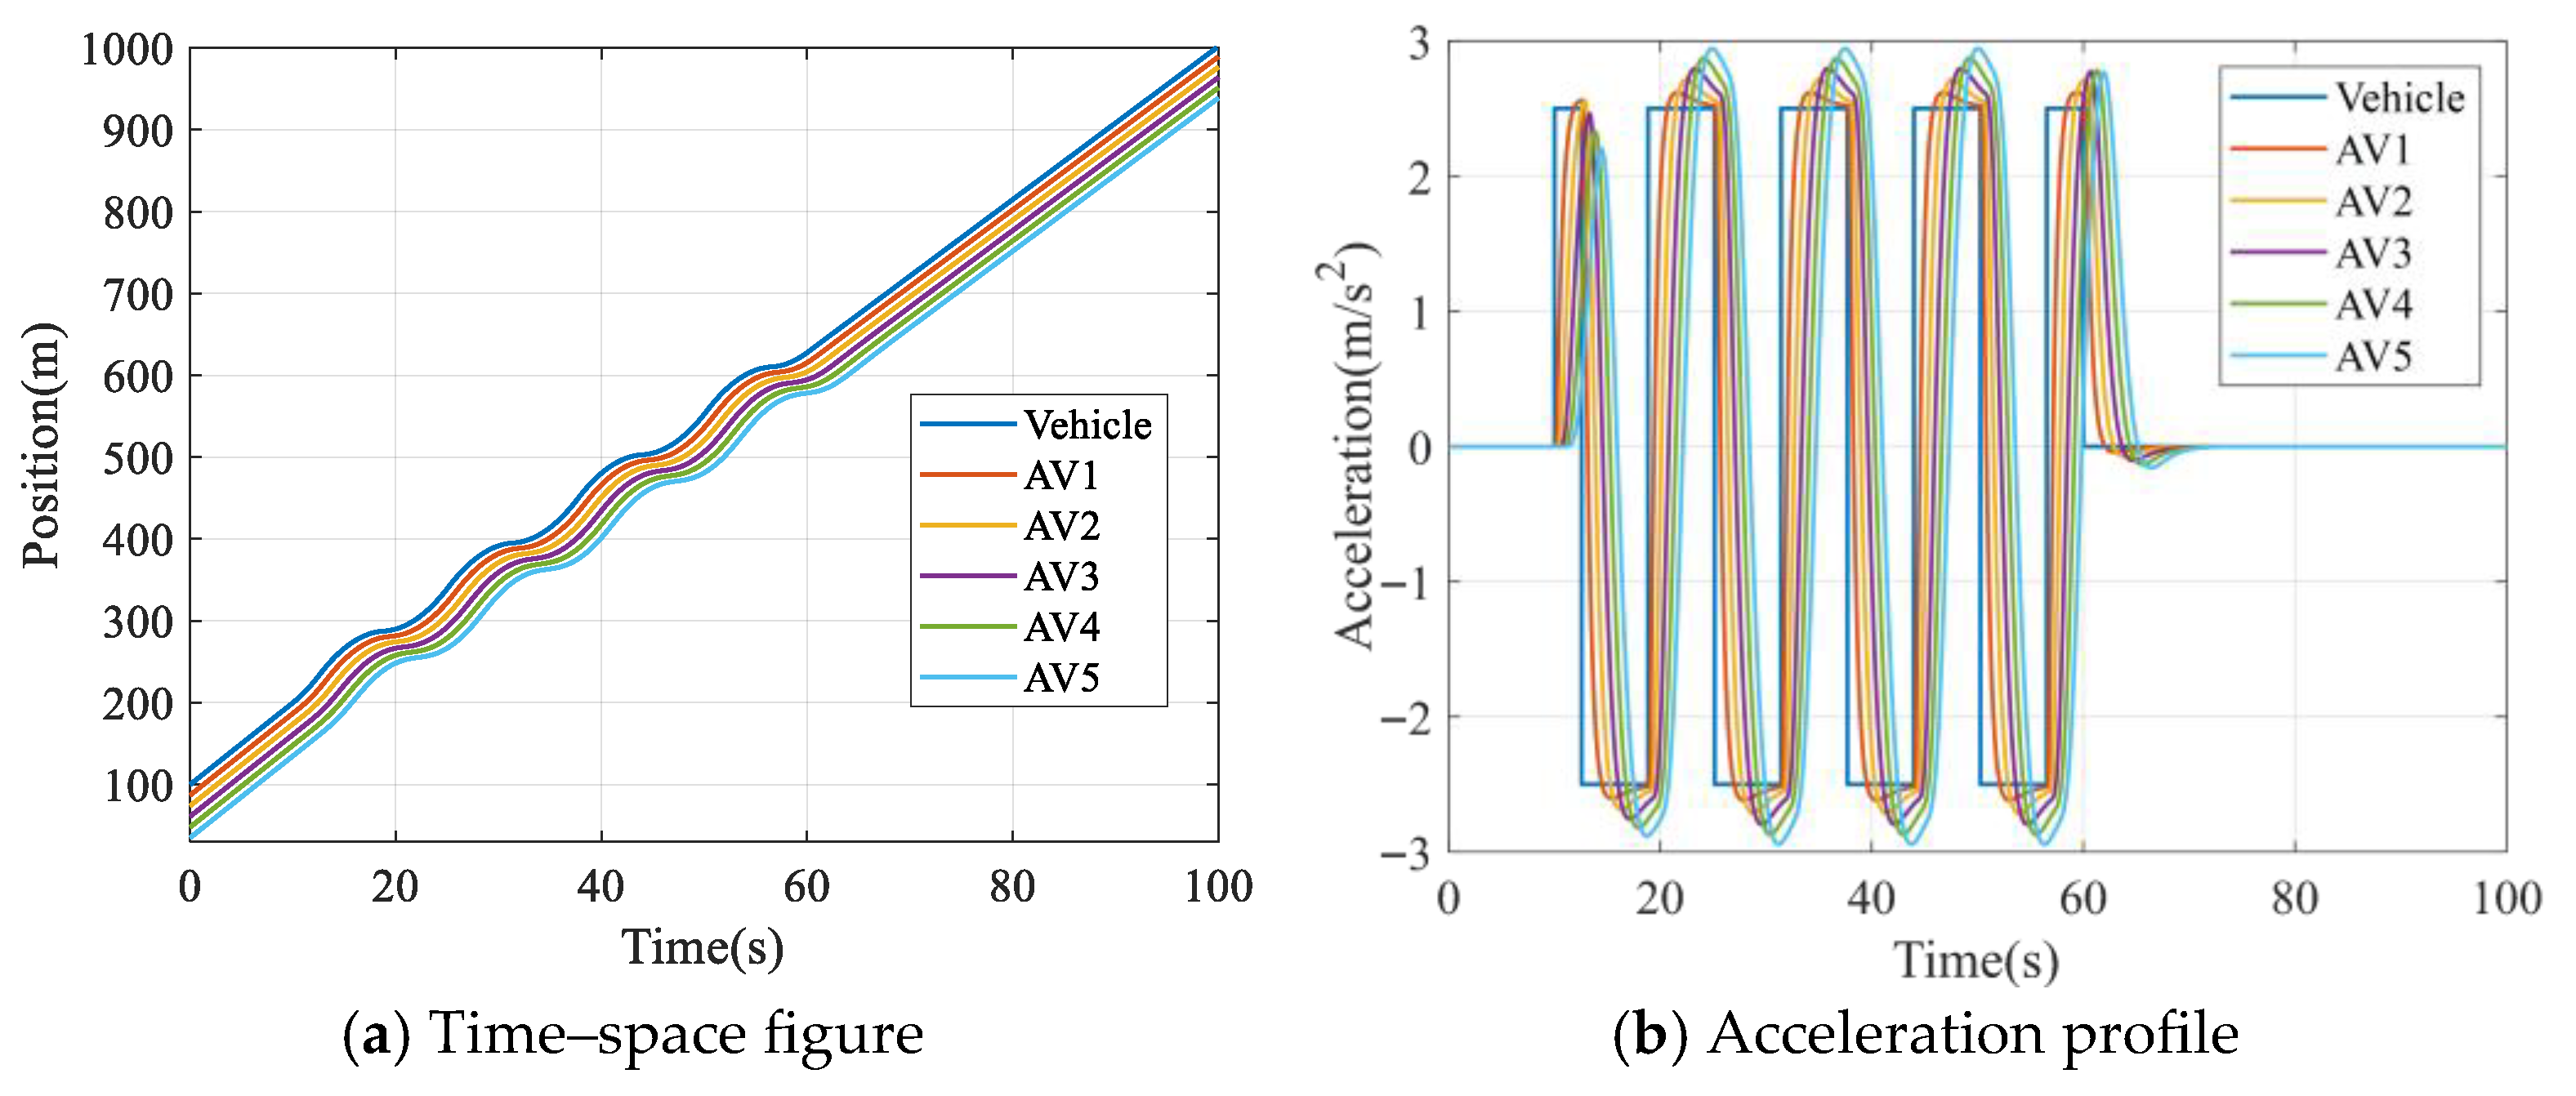
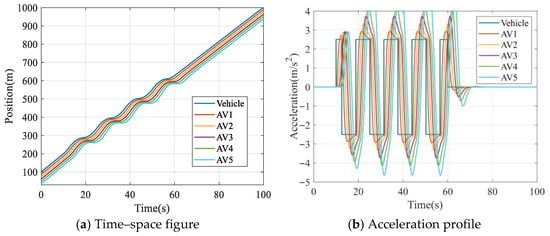
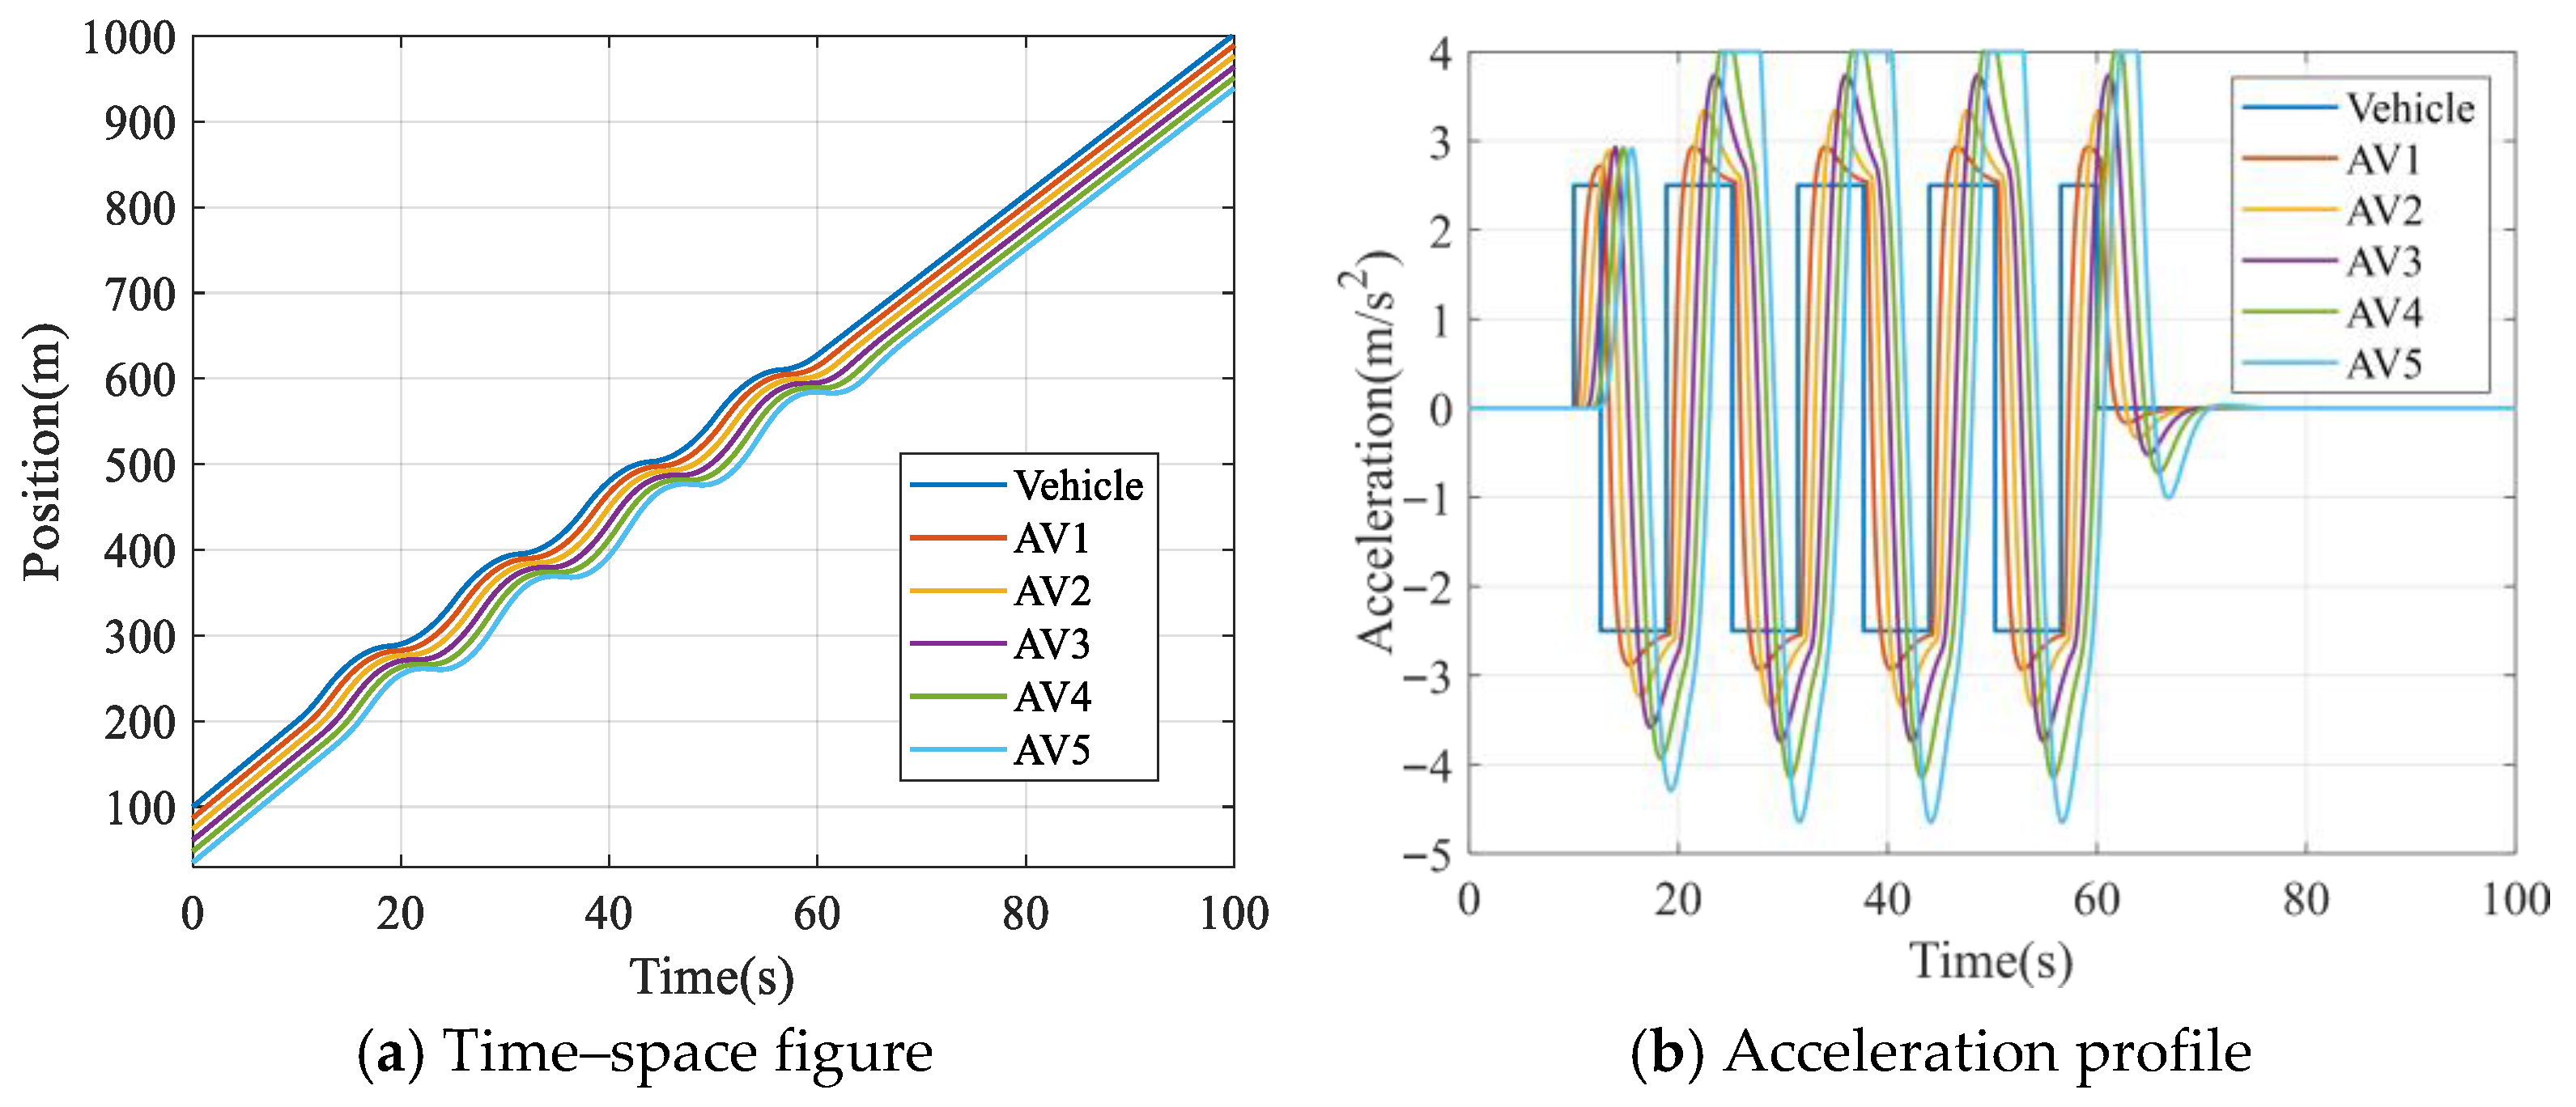
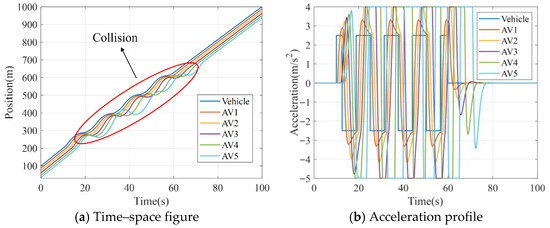
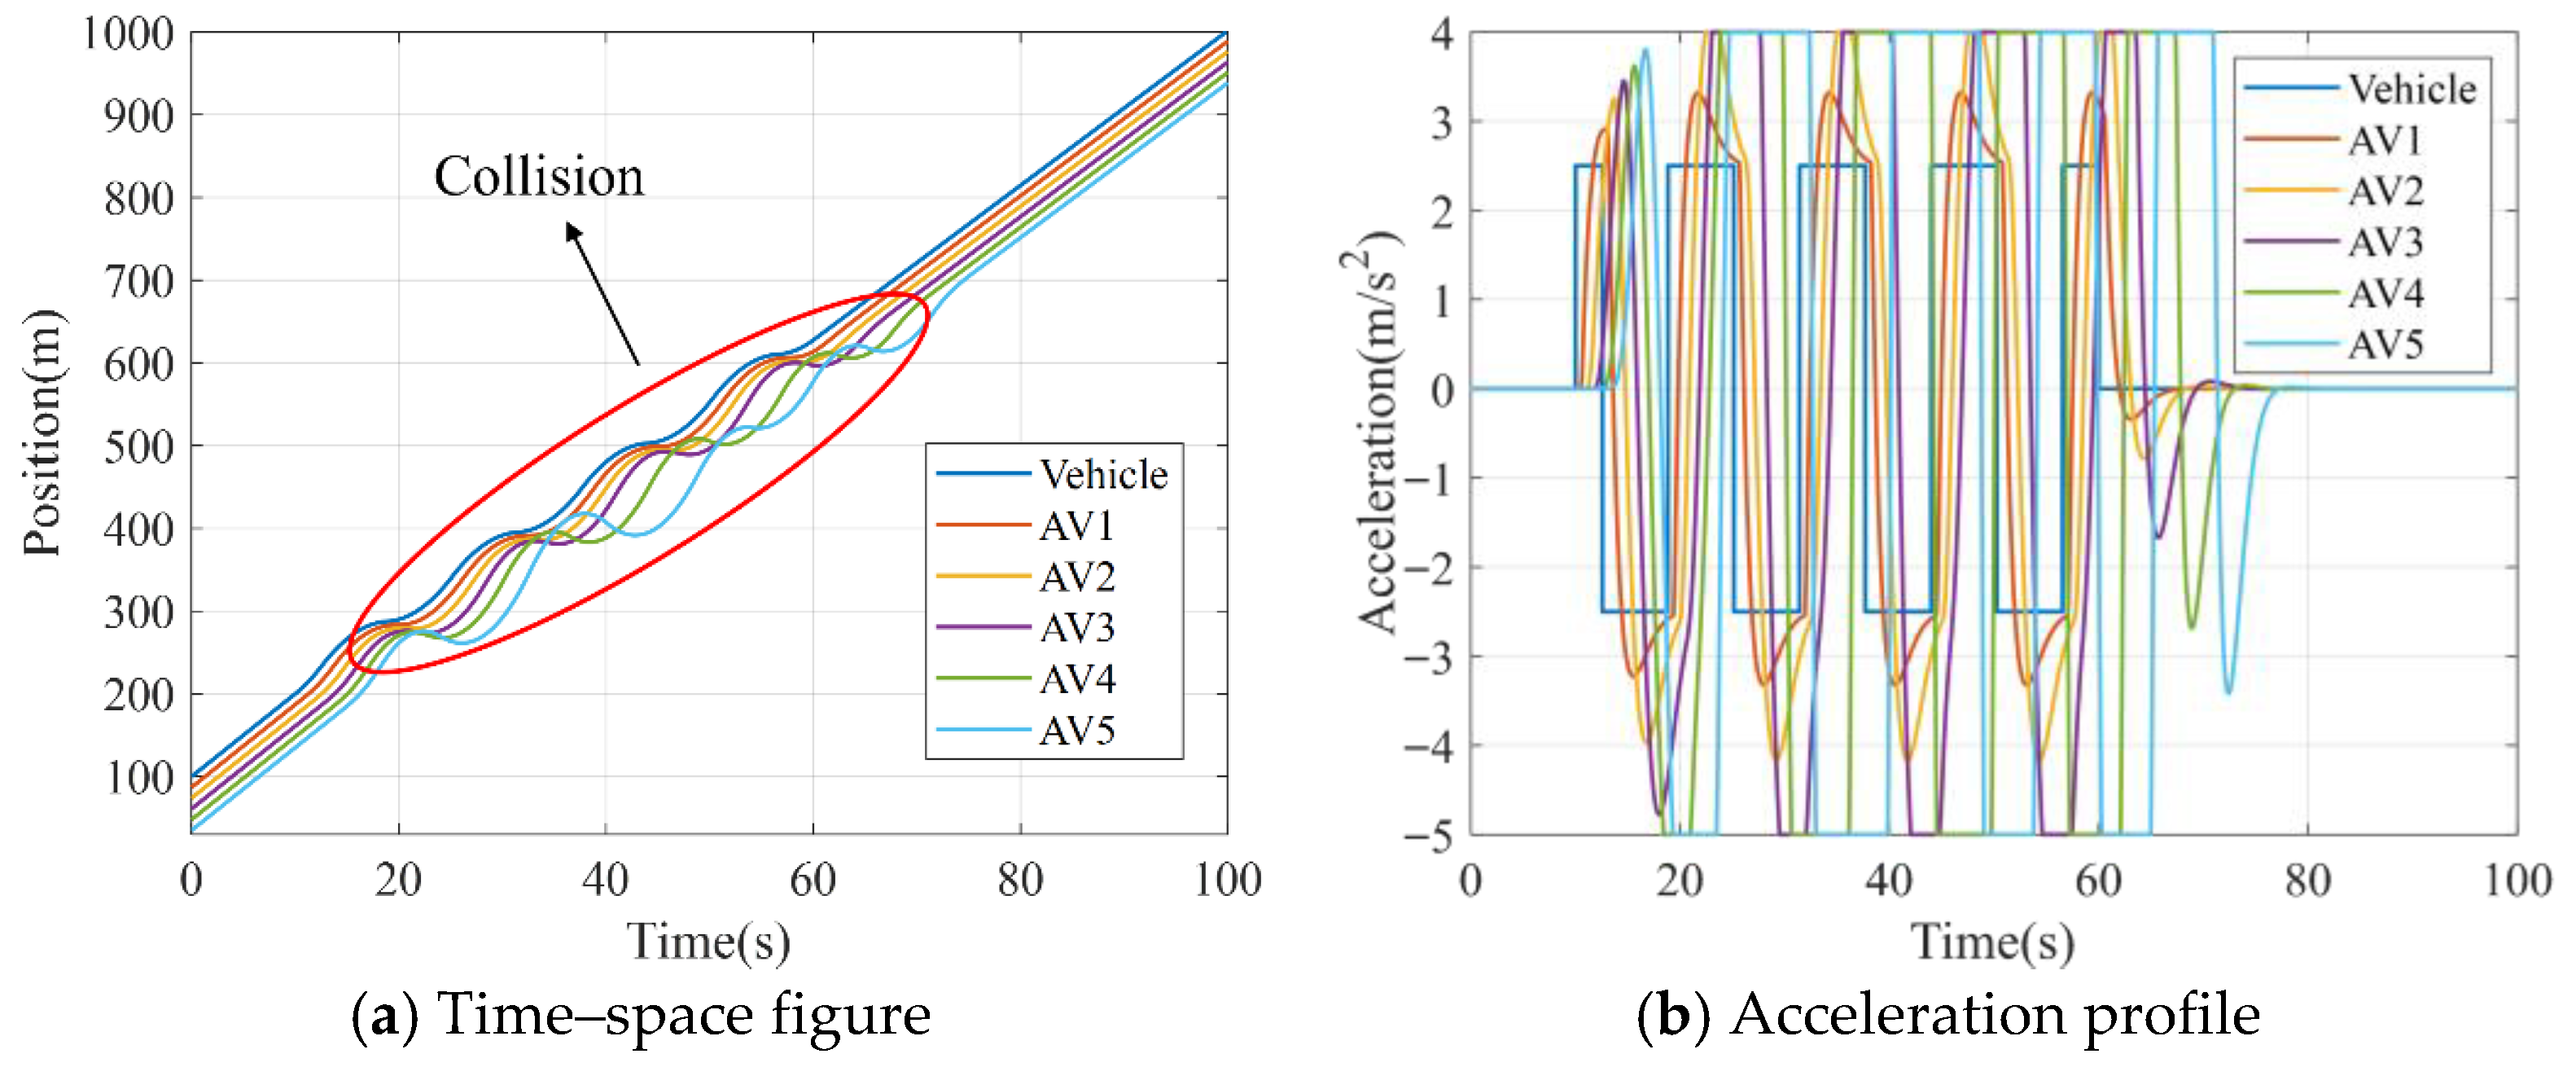
Figure 3, Figure 4 and Figure 5 show state changes (time-space, spacing, speed, acceleration) for a 5-AV platoon (AV1–AV5) following a vehicle (subject to Equation (25) disturbance) with = 0.85, = 0.1 s,= 1, = 1.8, τ = 0.6 s, under perception delays ϑ = 0.1 s, 0.3 s, 0.5 s. Calculated damping ratio is 1.088 (within 1–1.2), ensuring high safety when stable.
Figure 3.
State changes in AV platoon under continuous disturbance with ϑ = 0.1 s.
Figure 4.
State changes in AV platoon under continuous disturbance with ϑ = 0.3 s.
Figure 5.
State changes in AV platoon under continuous disturbance with ϑ = 0.5 s.
Figure 6 and Figure 7 show TIT and CPI values under disturbance for different headways with = 0.90, = 0.1 s, ϑ = 0.1 s, = 2, MADR = 1.0. Safety is higher when the damping ratio is between 1 and 1.2. Conditions with Equations (23) and (24) hold for ϑ = 0.1 s and 0.3 s, maintaining good platooning (Figure 5 and Figure 6). At ϑ = 0.5 s, instability causes a collision (Figure 7a).
Figure 6.
TIT values for AV platoons under different time headways (τ) with = 0.90, = 0.1 s, = 0.1 s.
Figure 7.
CPI values for AV platoons under different time headways (τ) with = 0.90, = 0.1, = 0.1 s.
4.2. Case Analysis and Safety Assessment
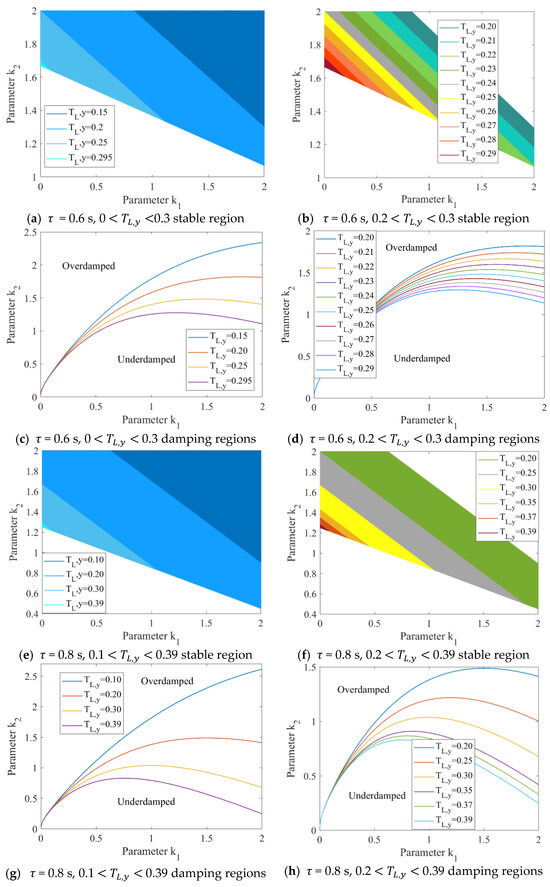
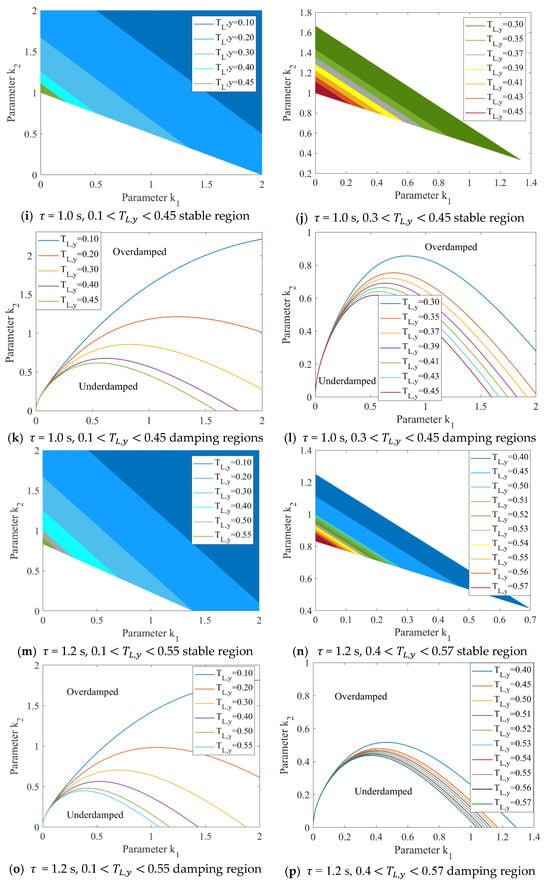
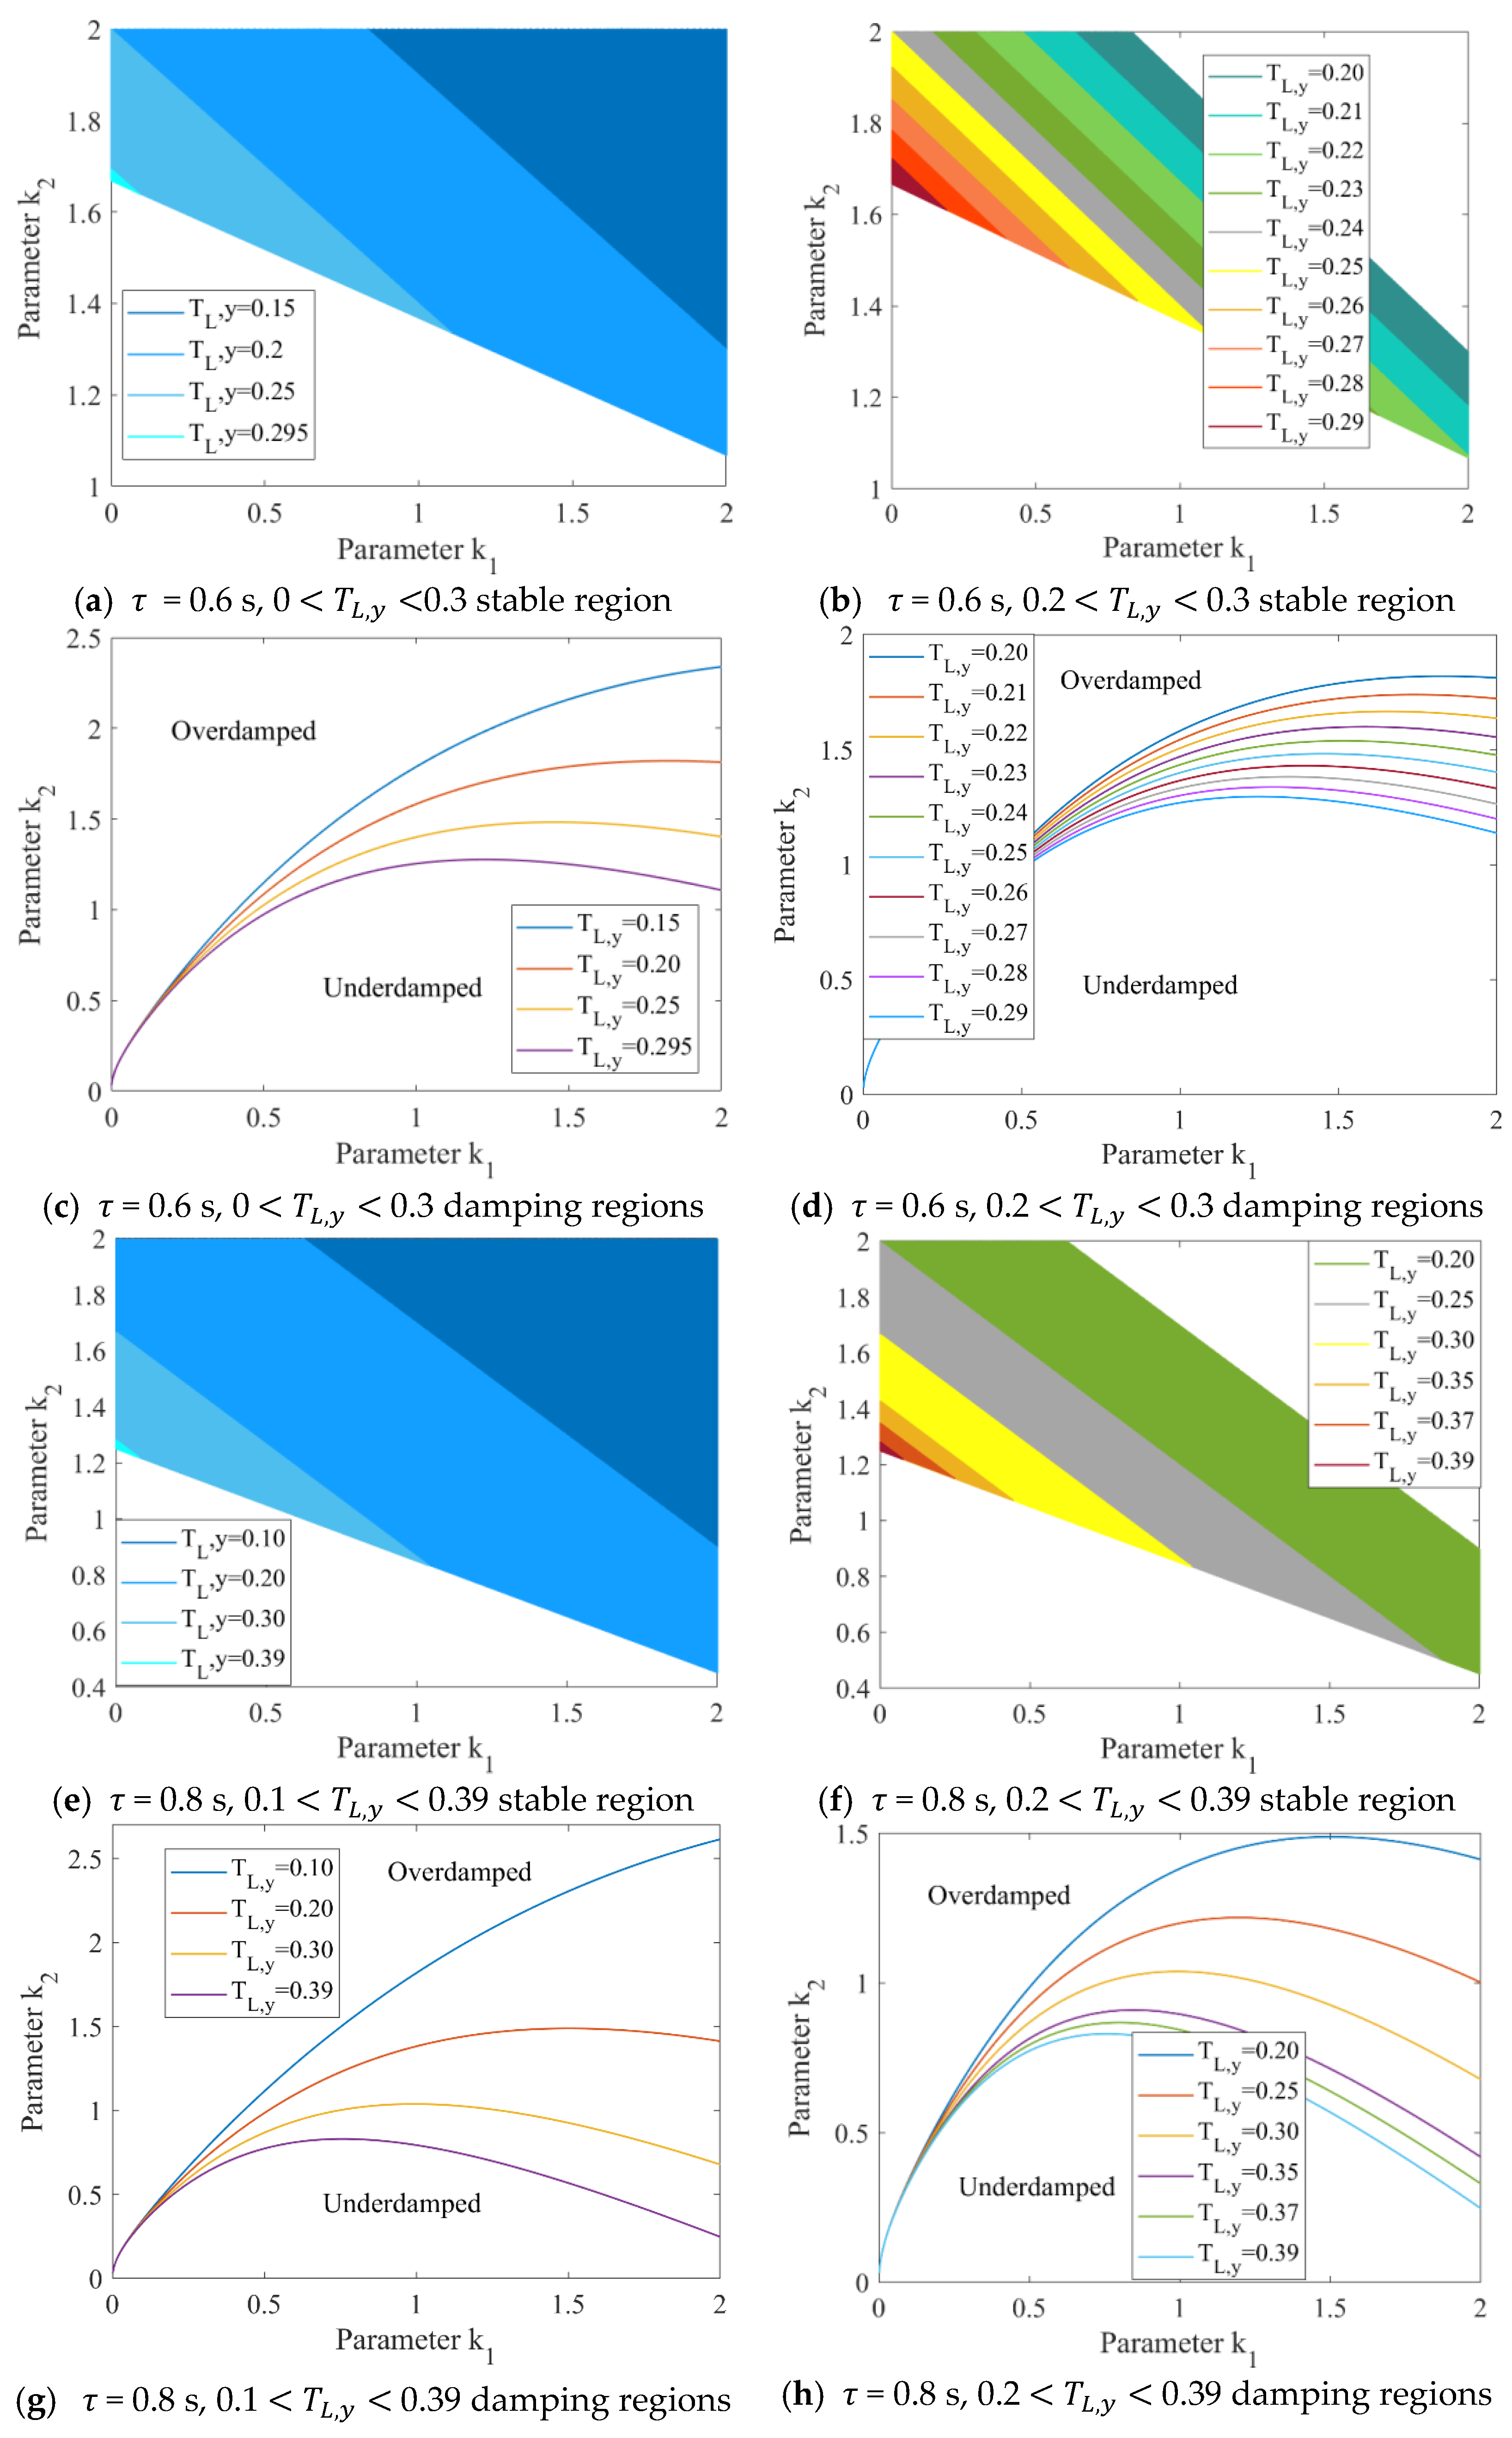
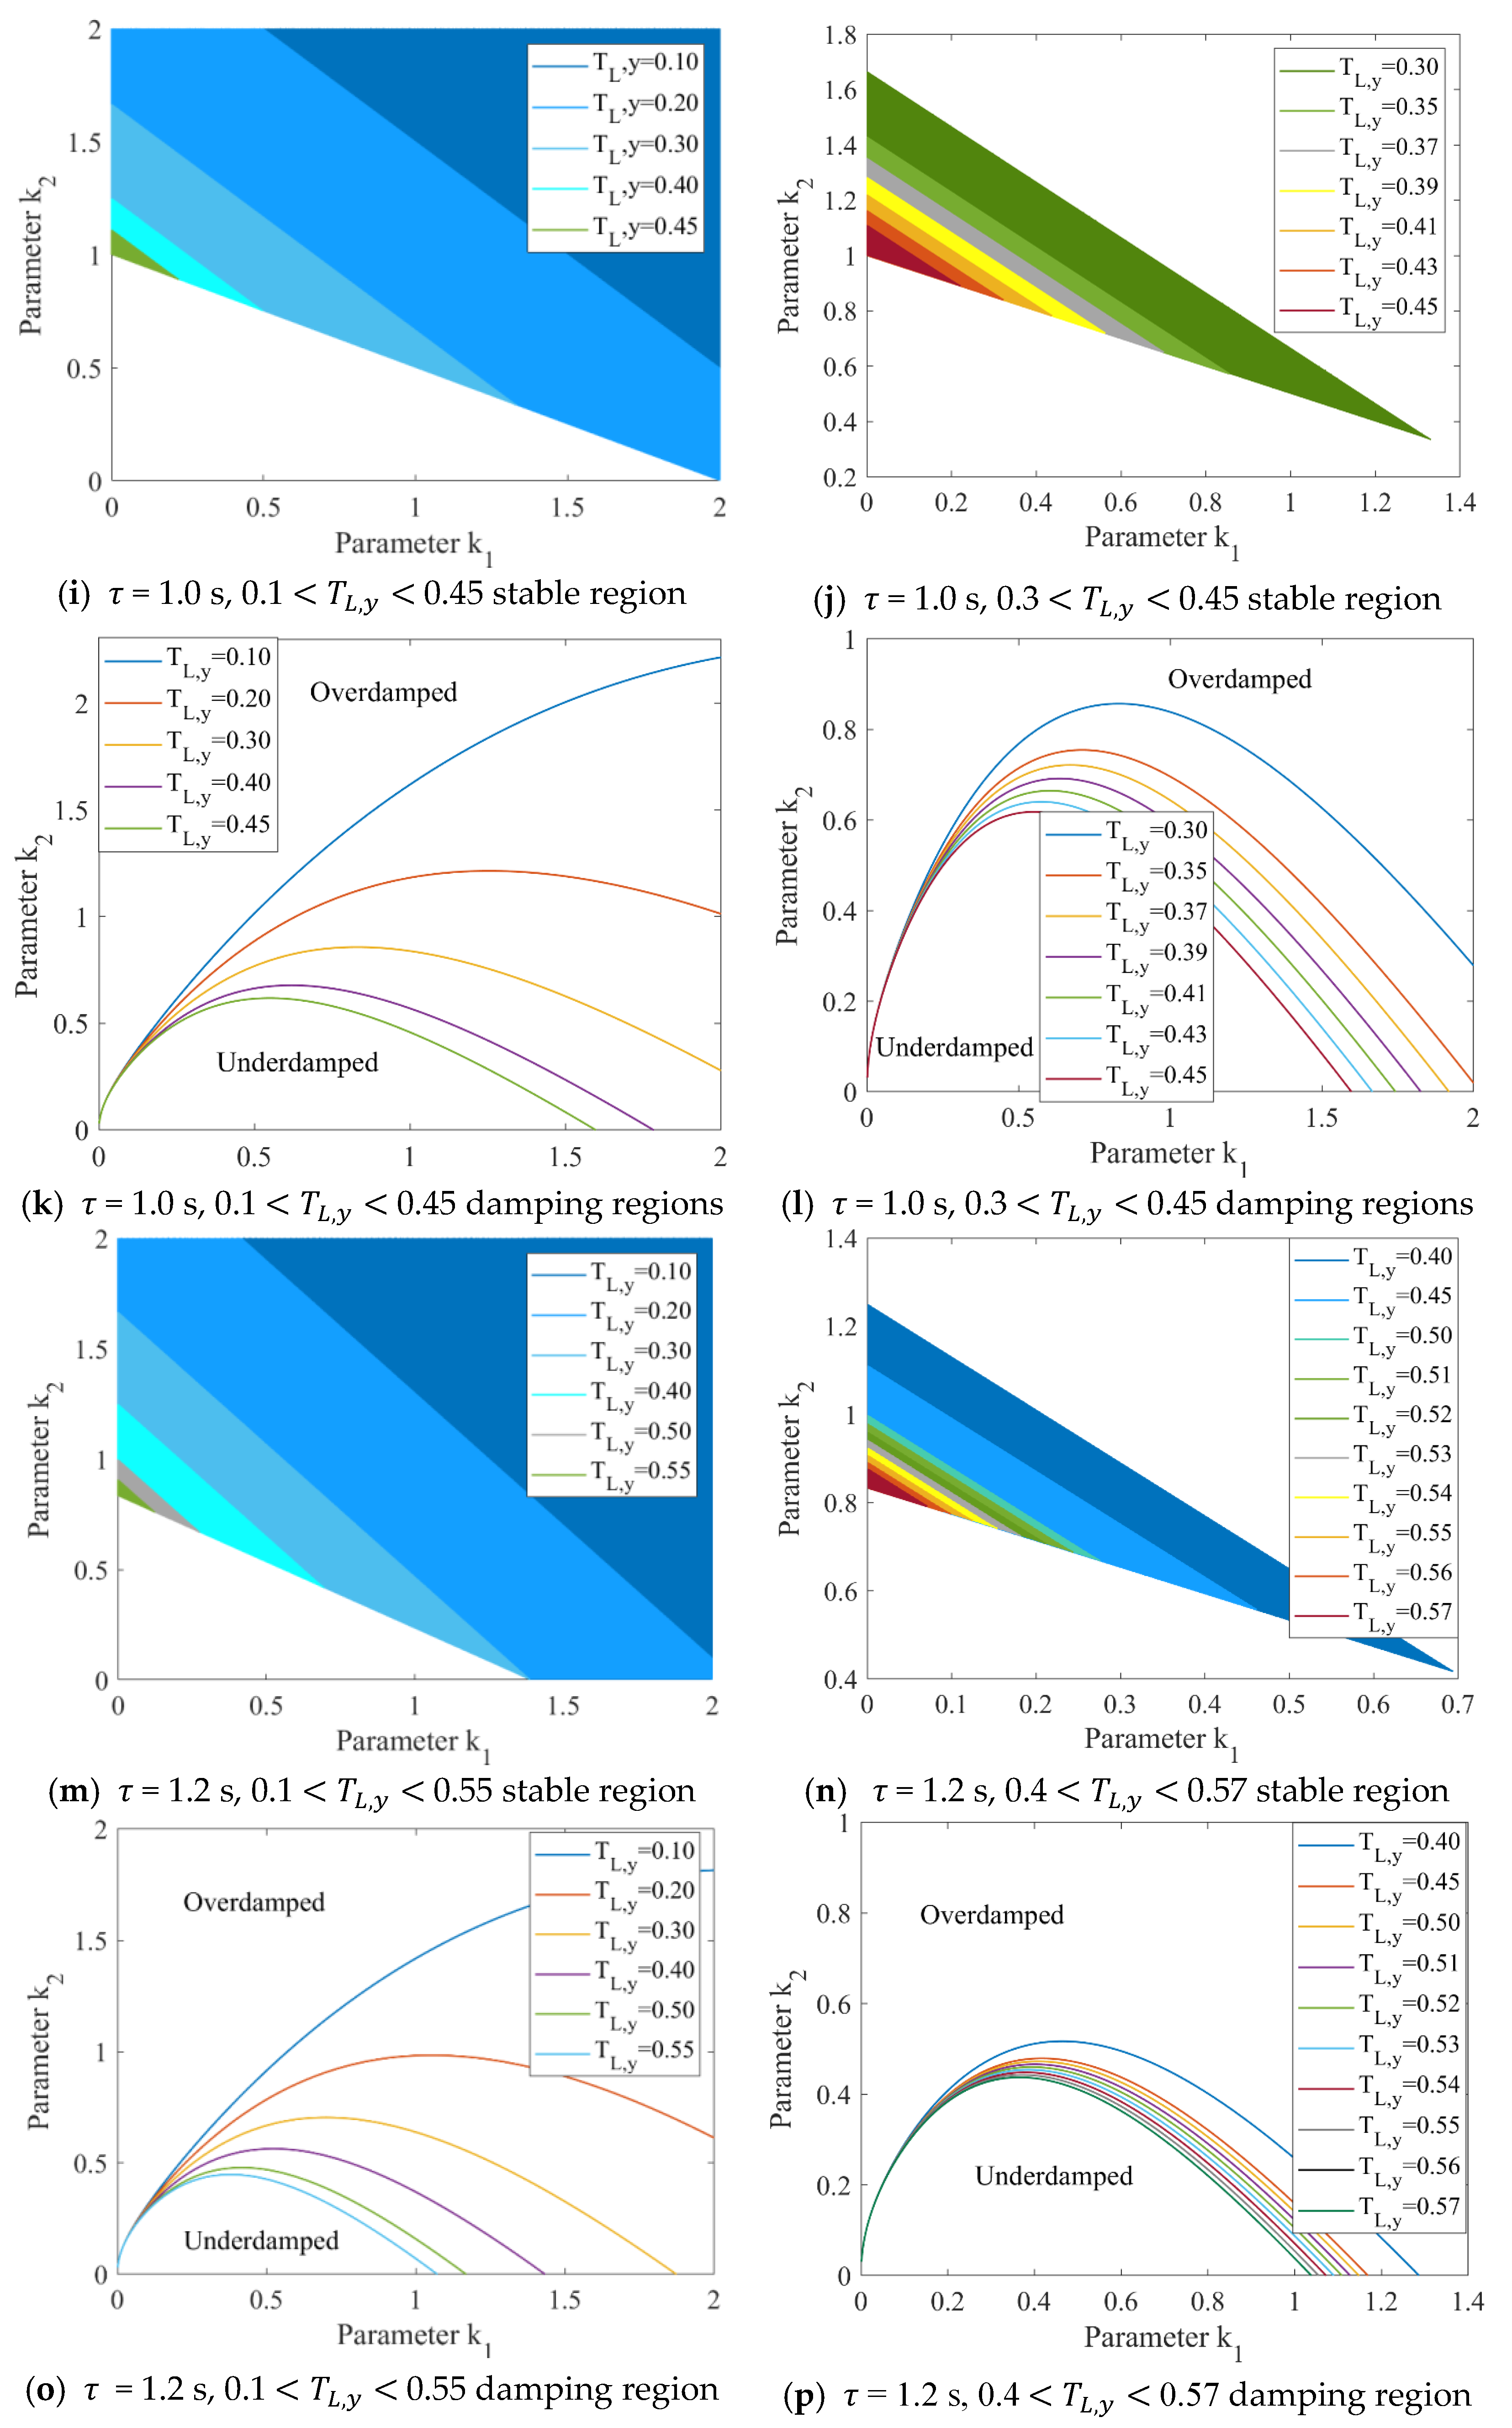
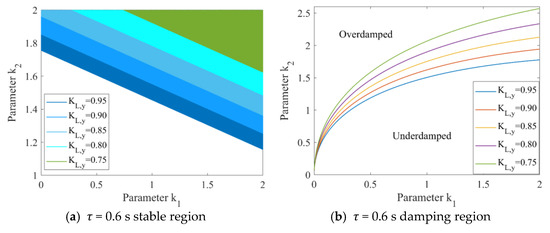
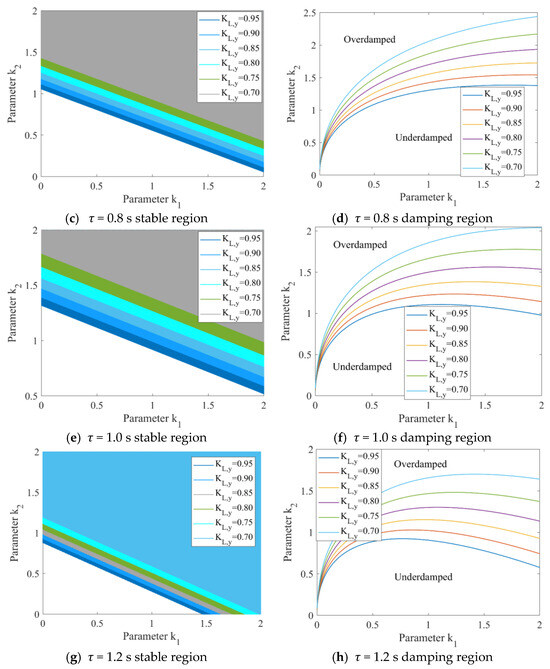
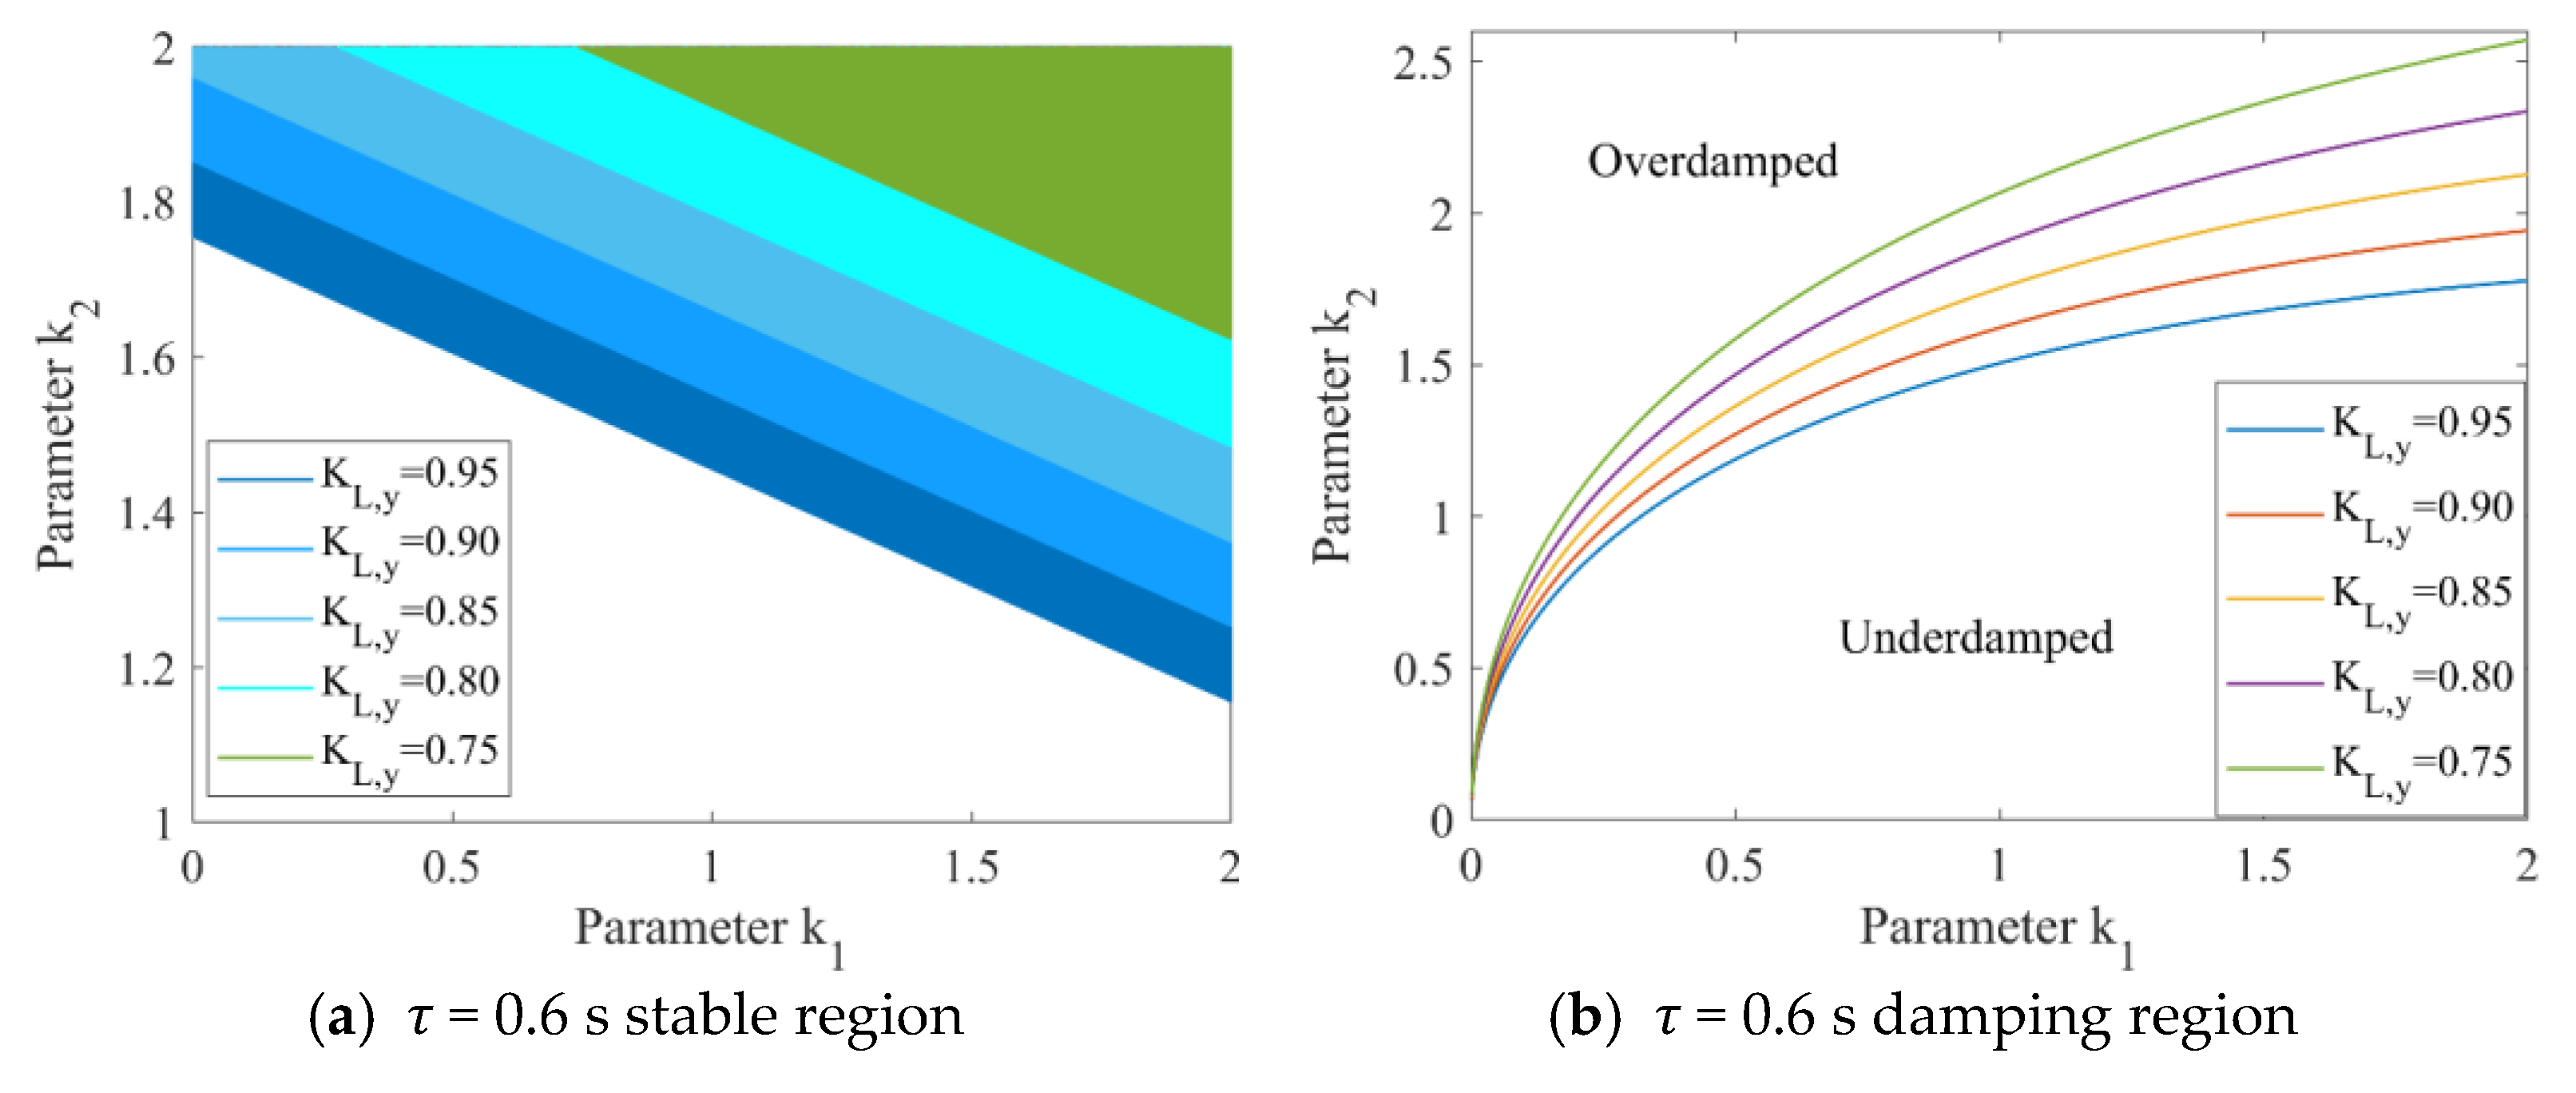
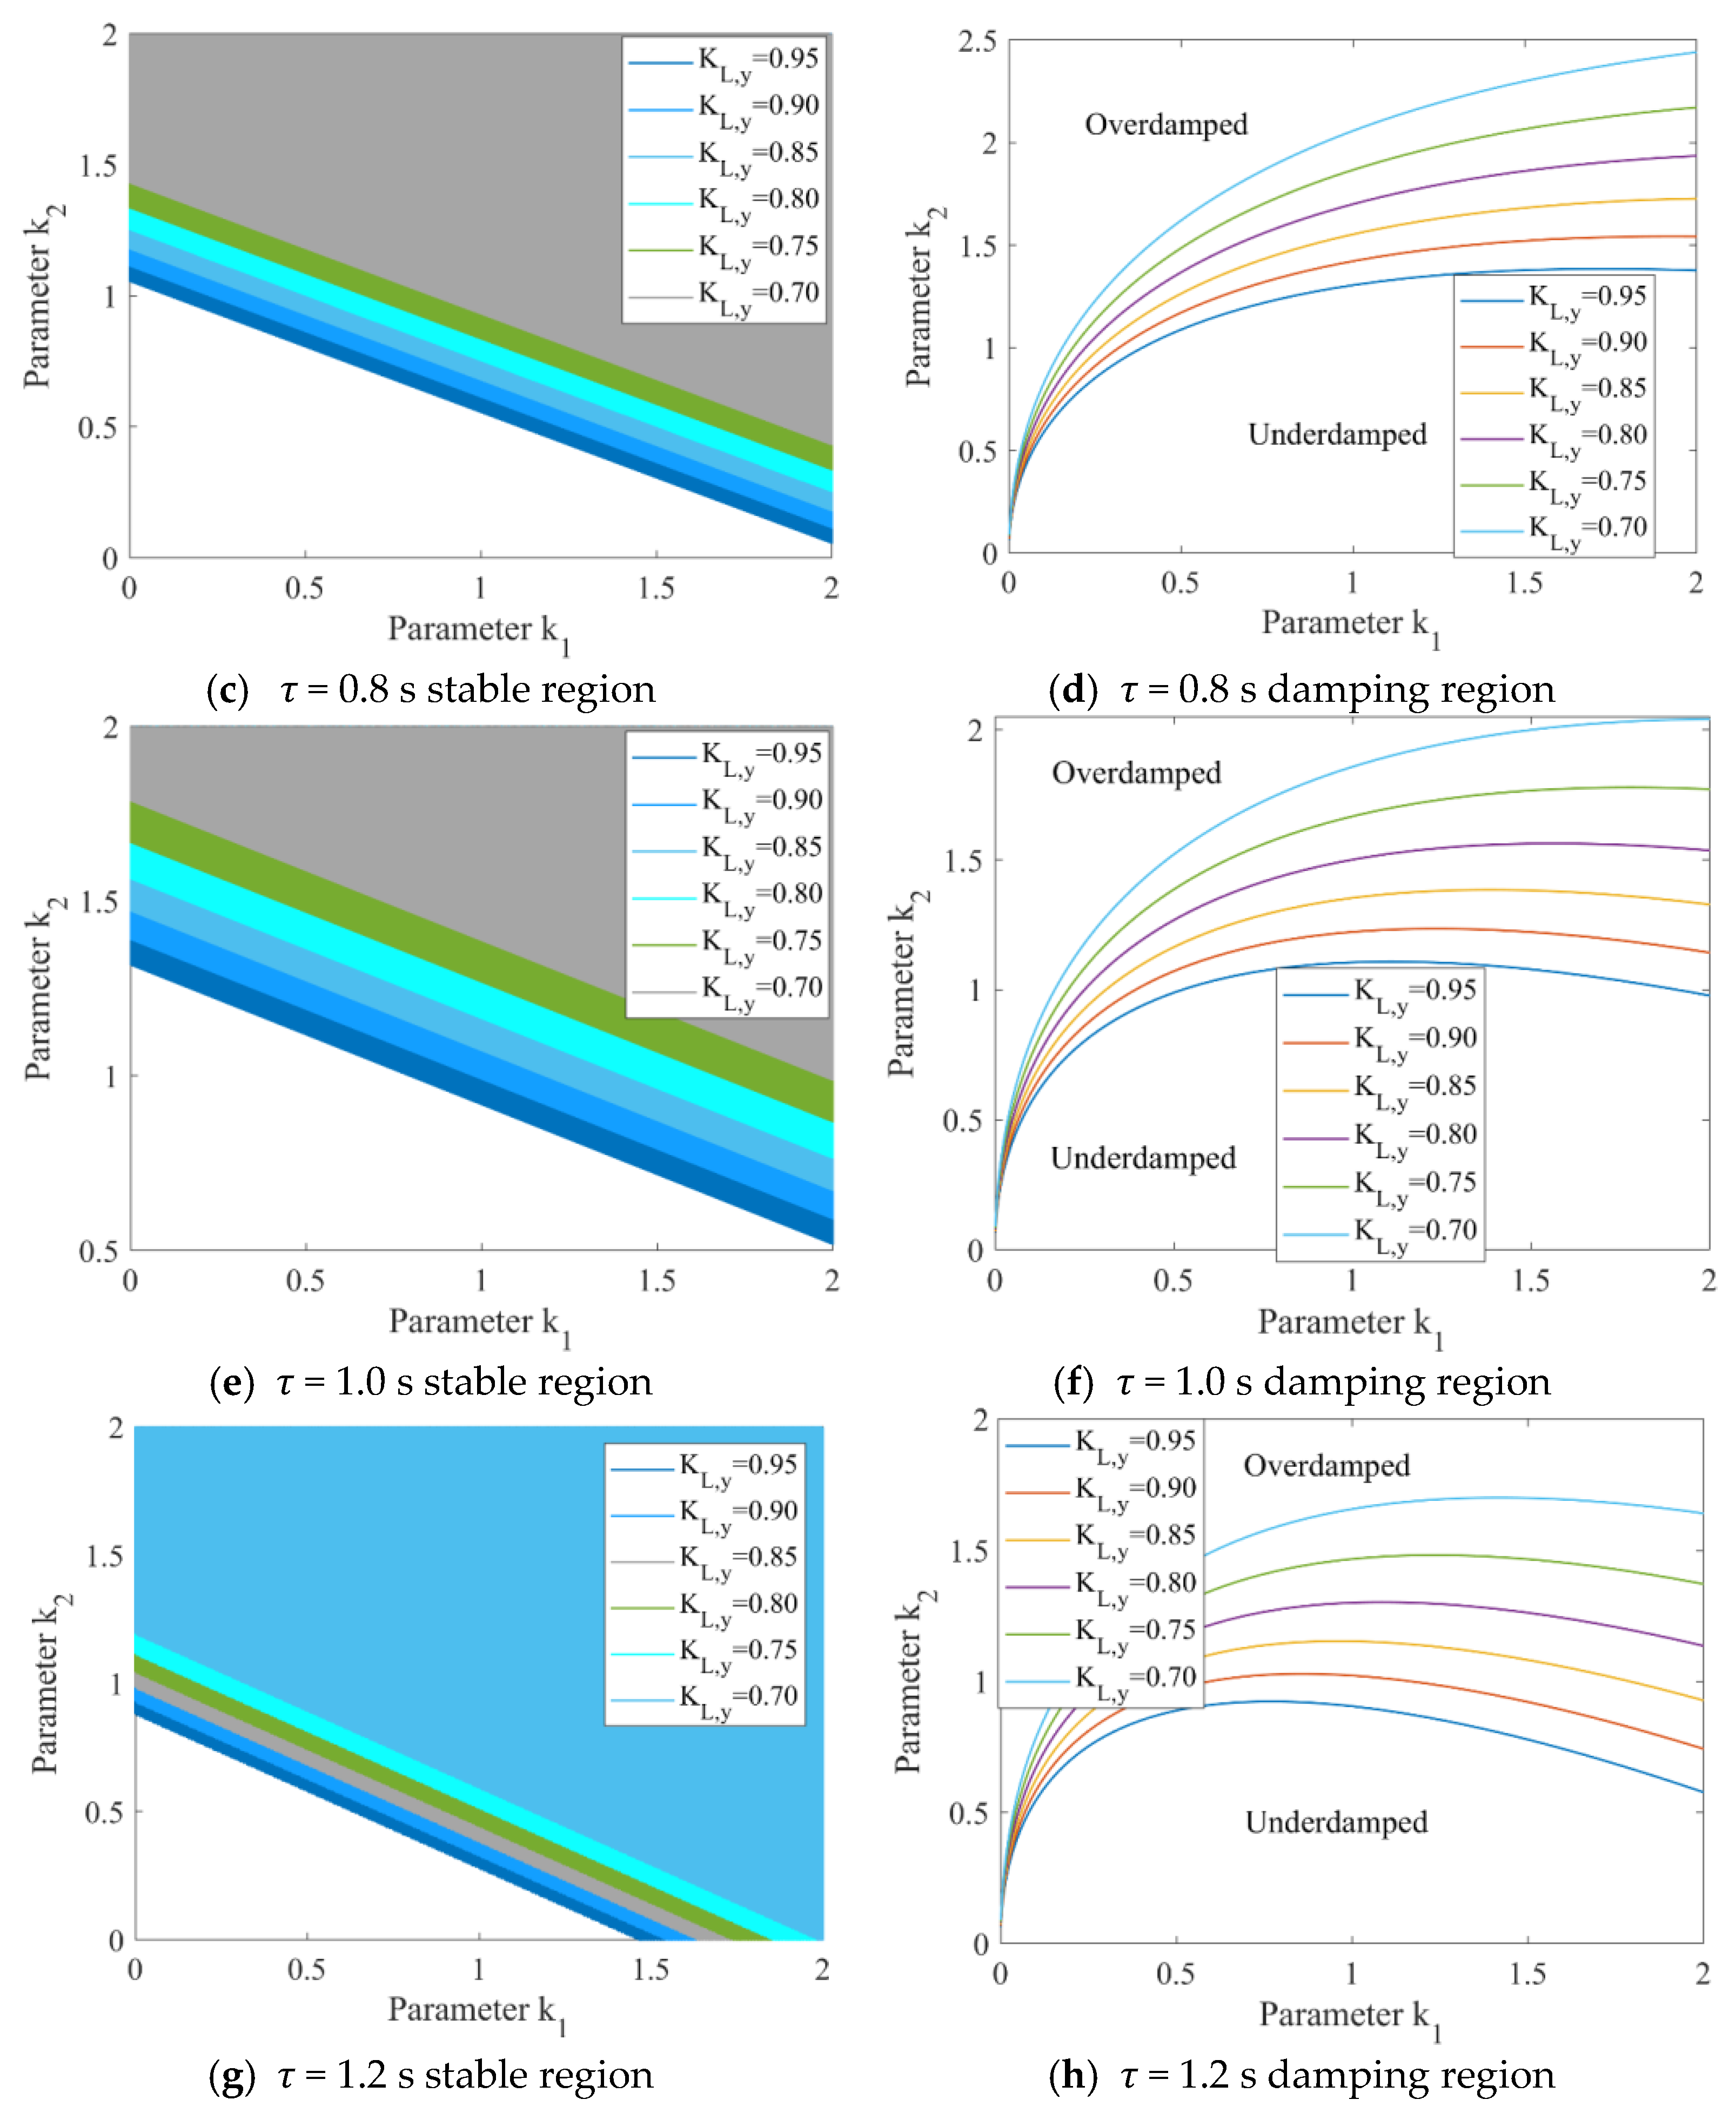
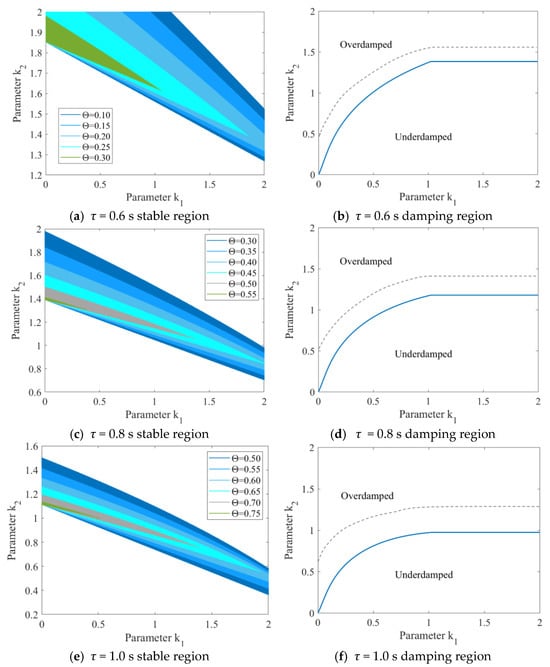
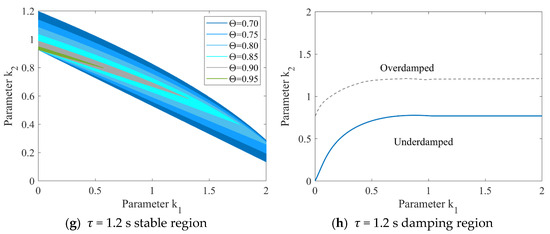
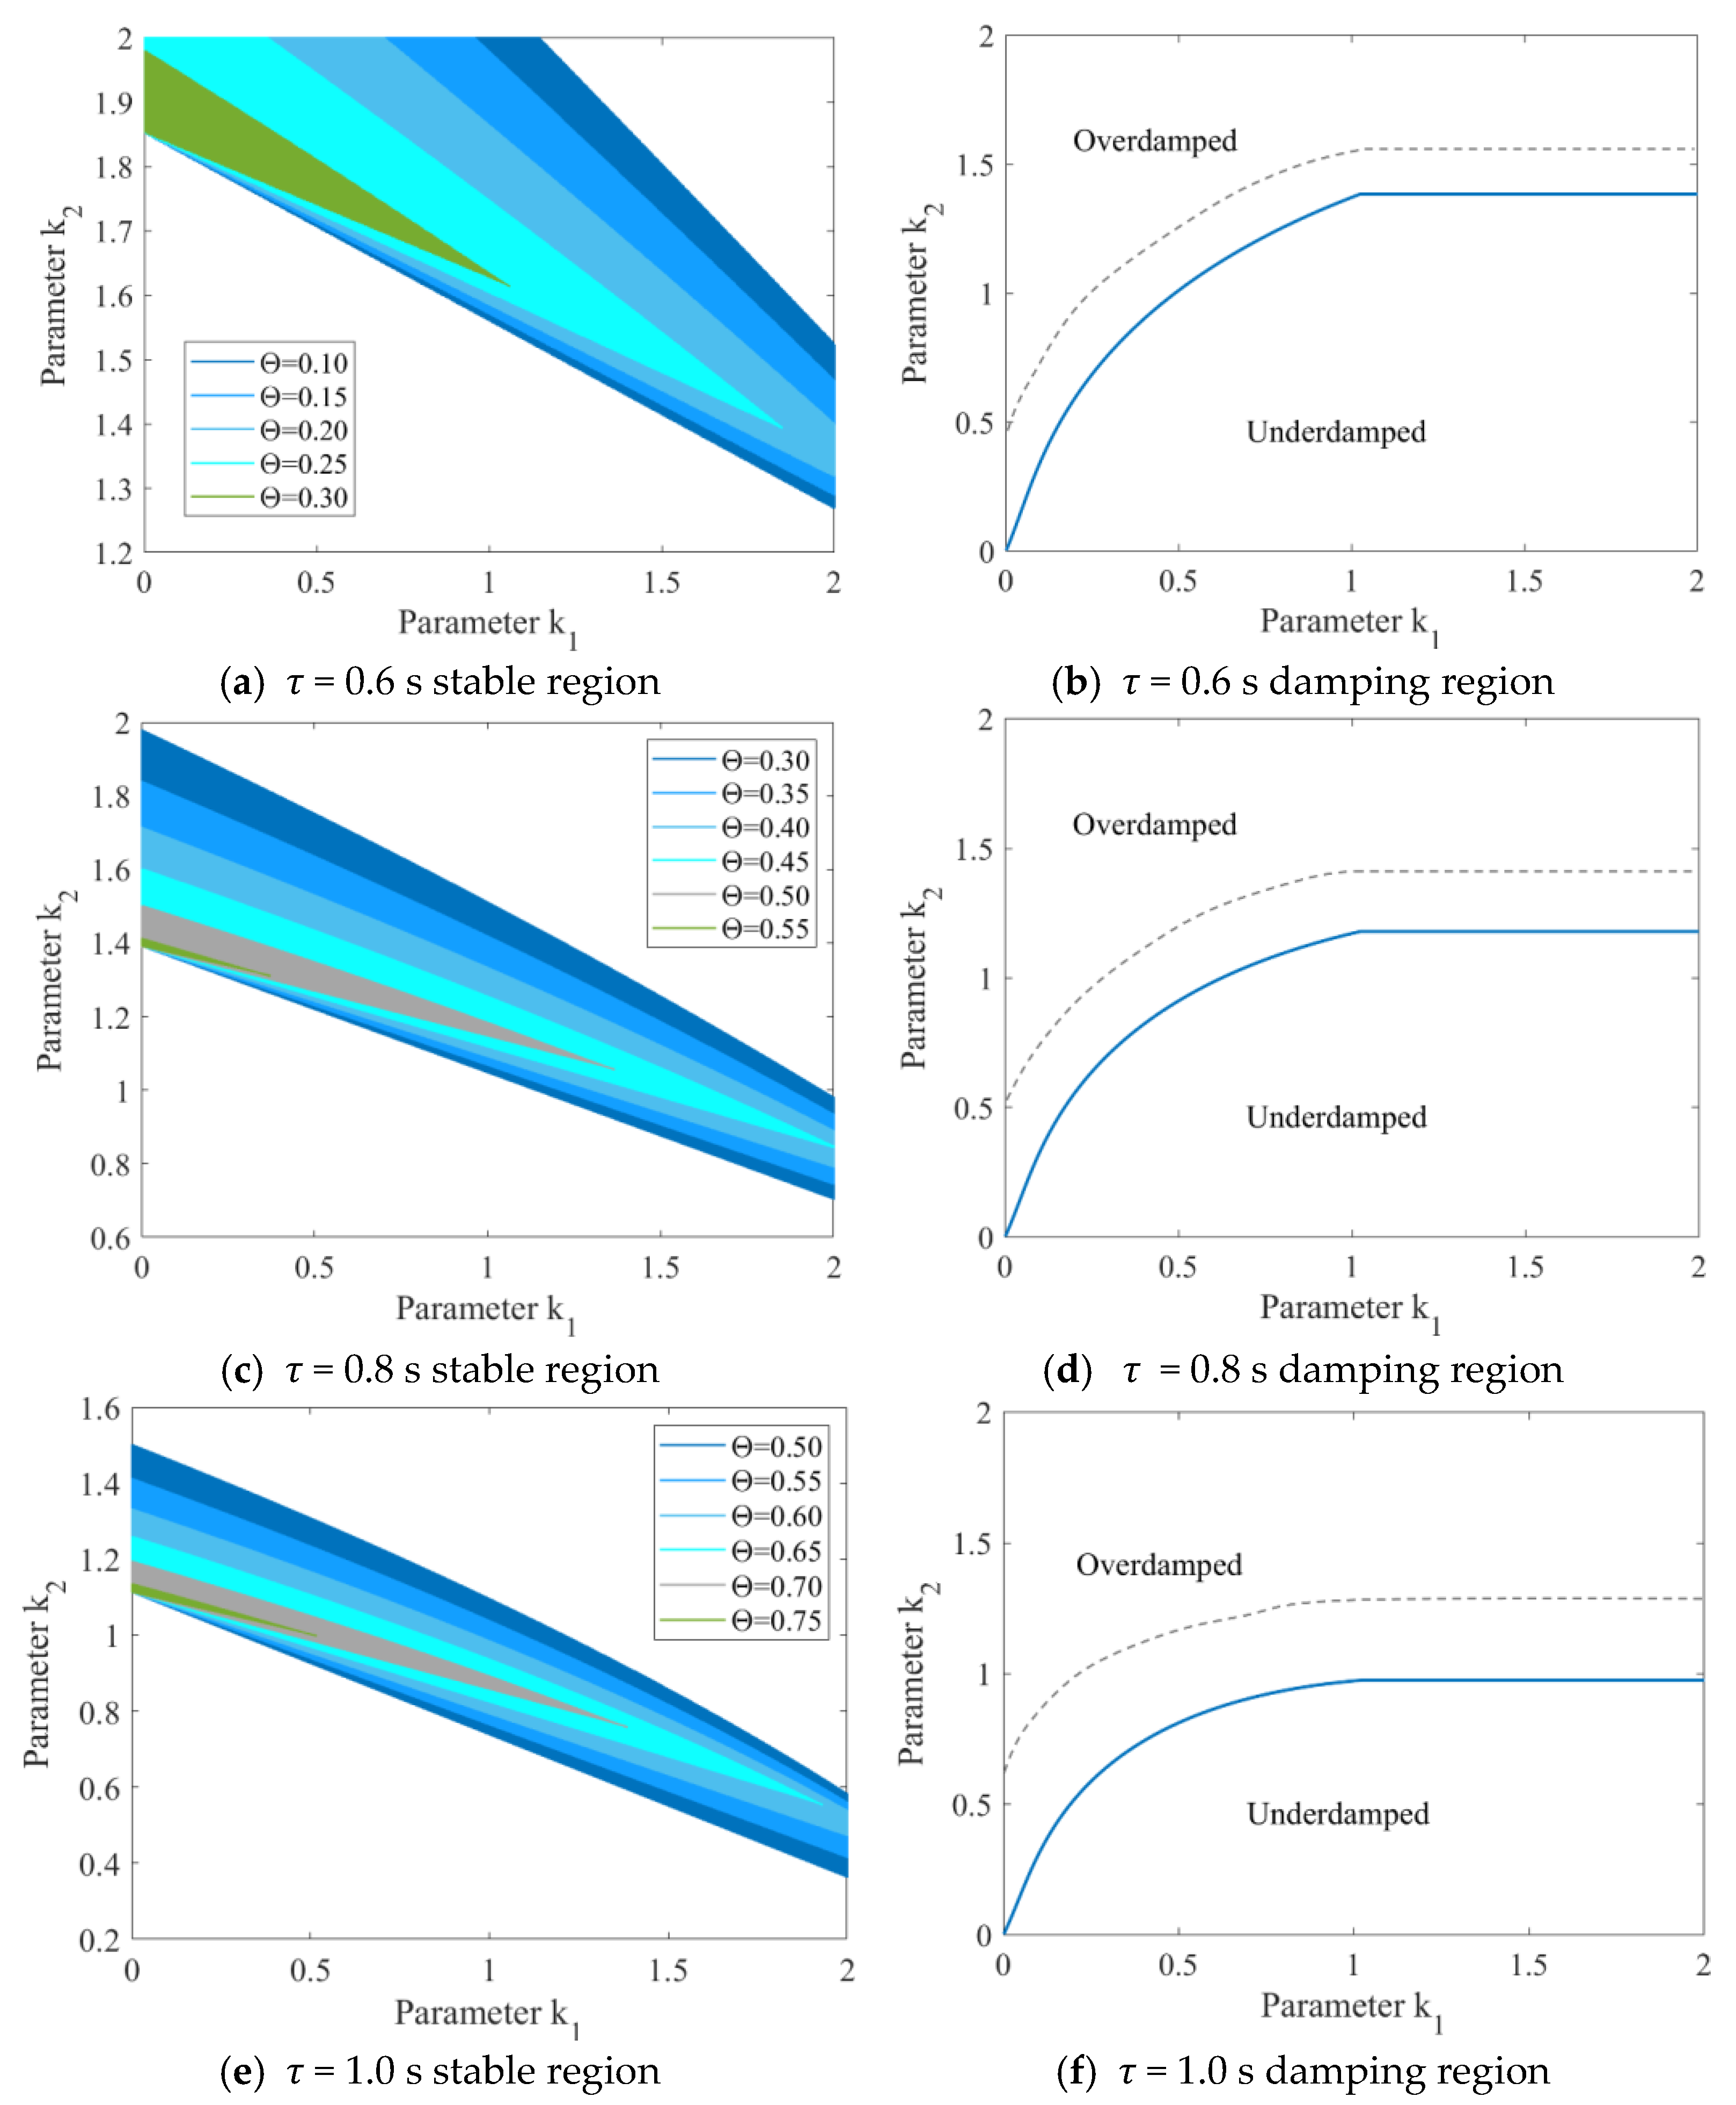
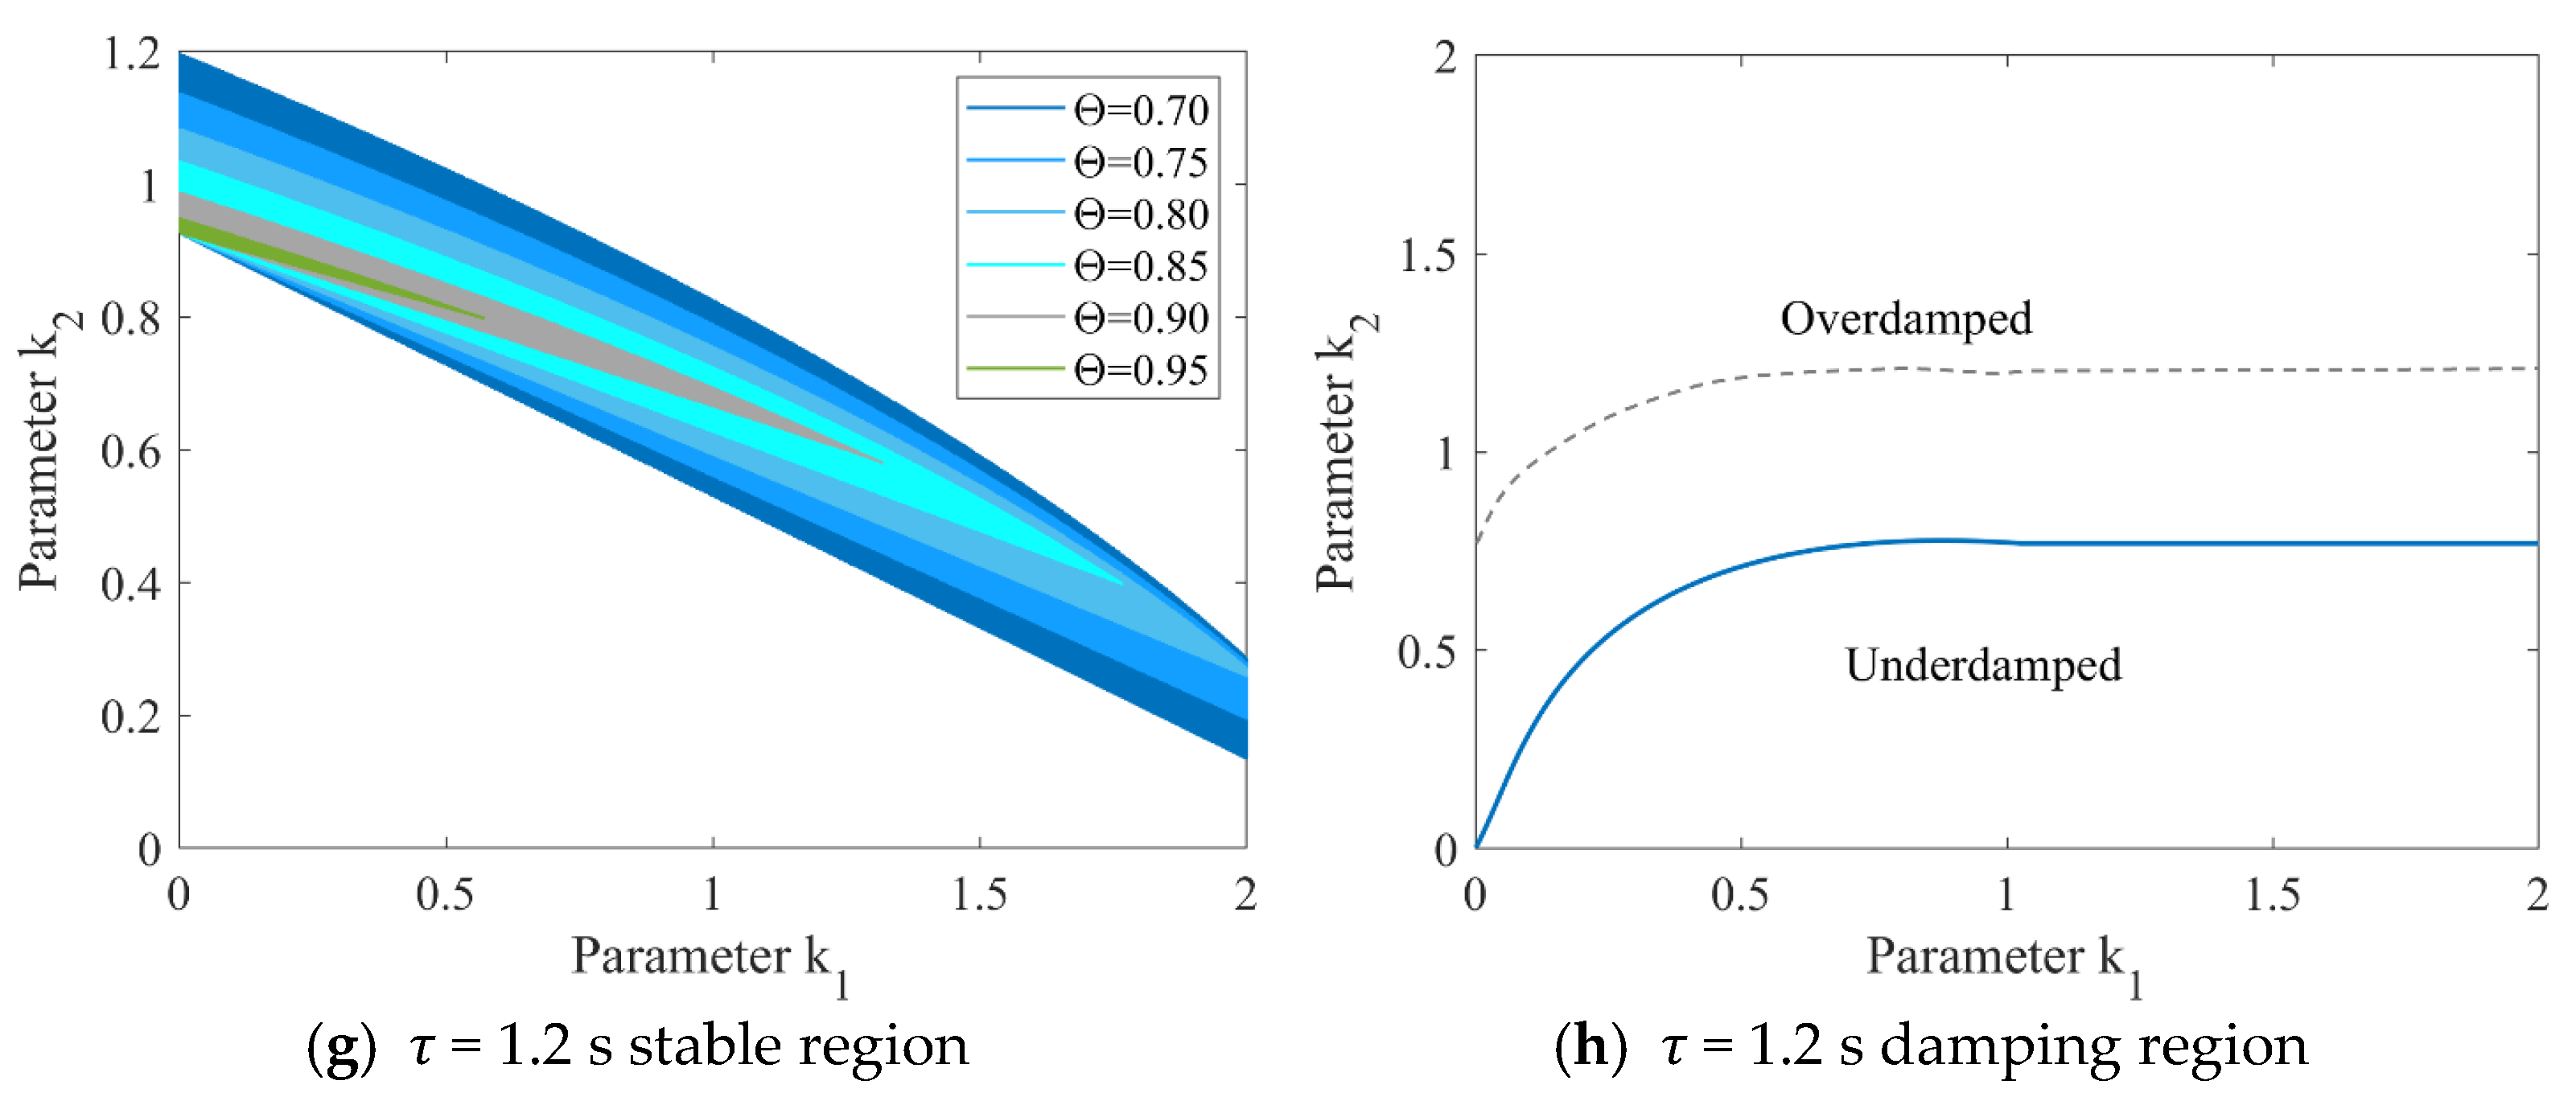
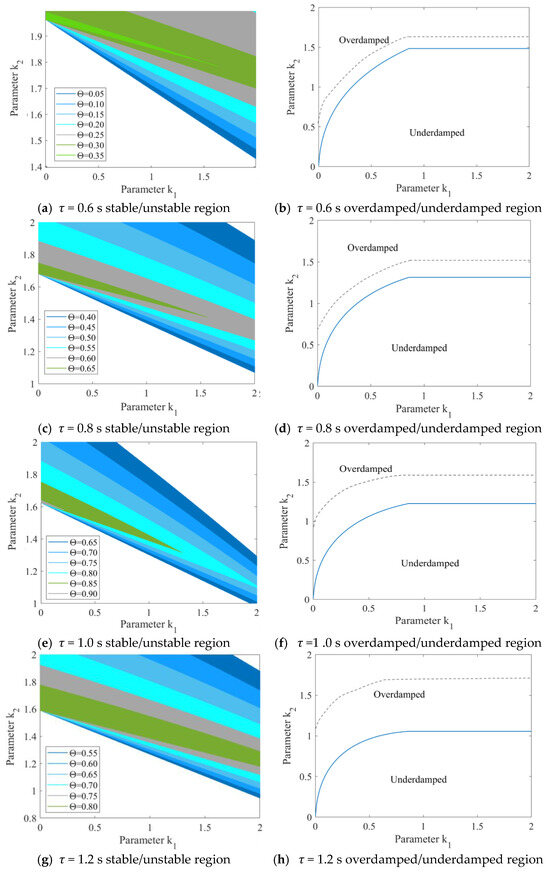
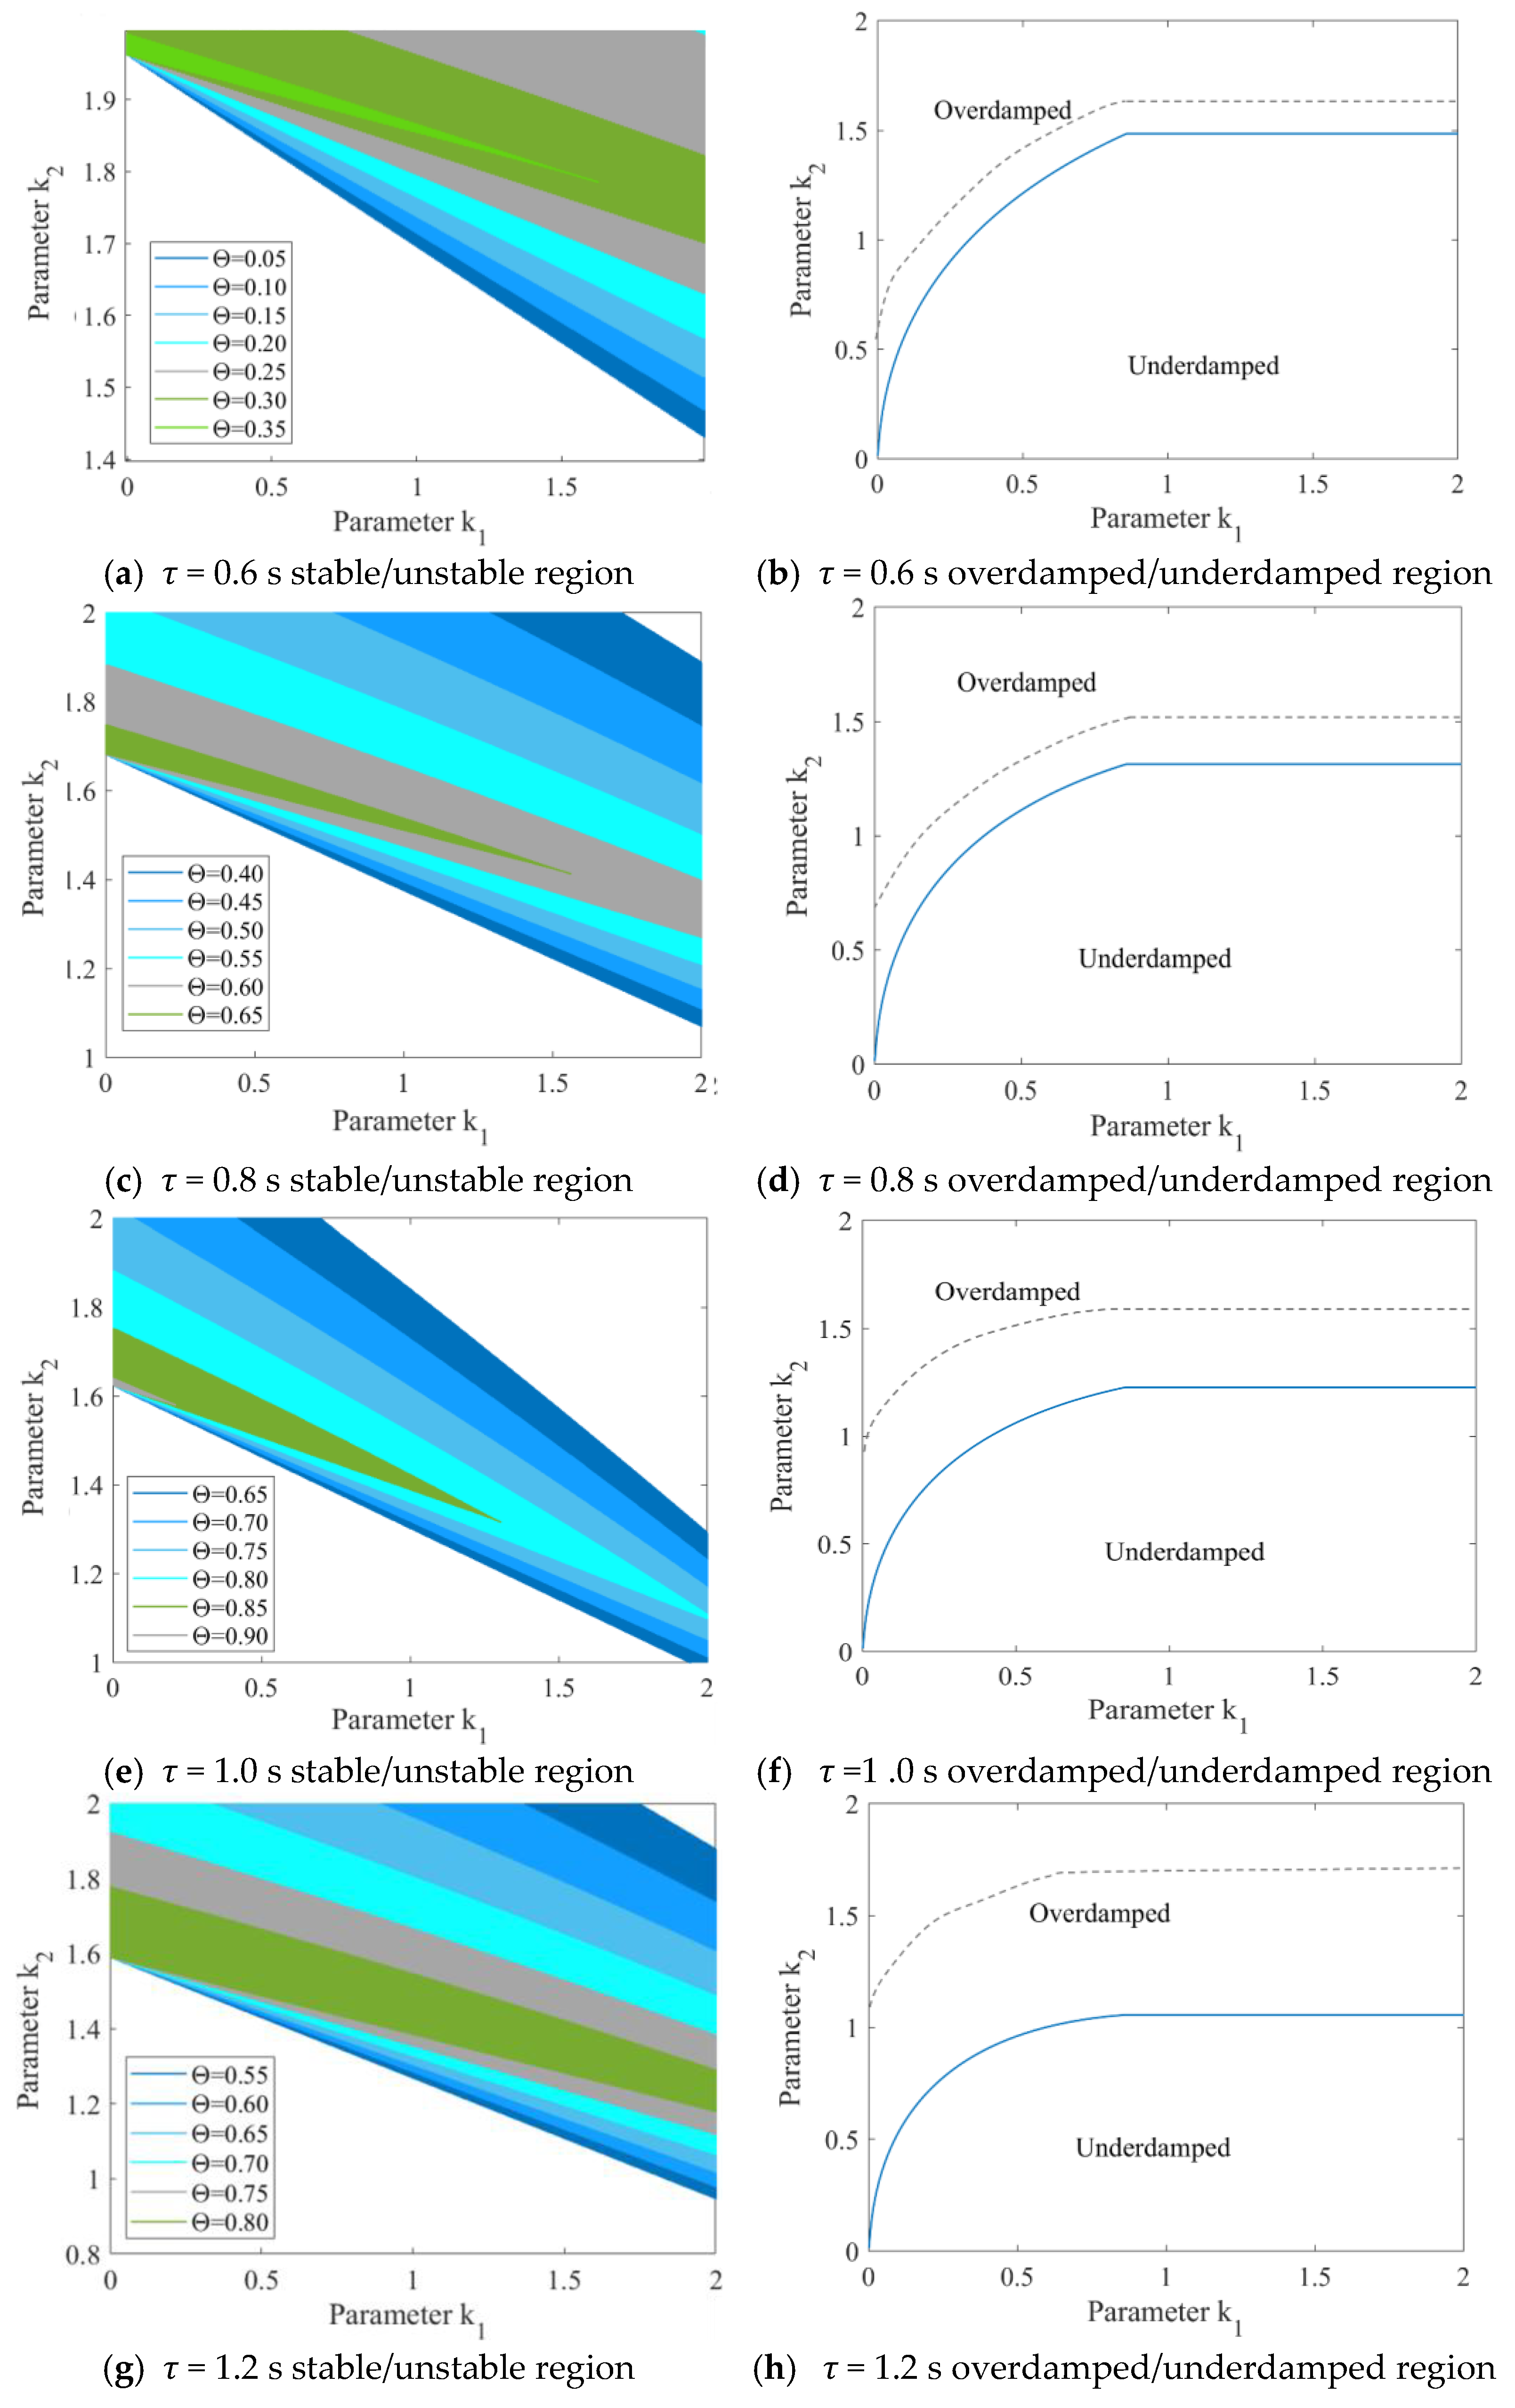
First, analyze the impact of mechanical delay on AV platoon stability and safety without control parameter uncertainty (= 1). Under different time headways (taking τ = 0.6, 0.8, 1.0, 1.2 as examples), the relationship between the stable region and damping region of the AV platoon and is shown in Figure 8. All values for mechanical delay are in seconds (s). Note that in the whole stability region plots, the stability regions corresponding to larger values are contained within those corresponding to smaller values. This shows that as increases, the AV stable region continuously decreases.
Figure 8.
Impact of mechanical delay on AV stability region and damping ratio under different time headways with = 1.
According to Figure 8, reduces the AV’s stable region. An overly small stable region makes the AV control process insufficiently flexible. On the other hand, can increase the over-damped region of the AV, increasing the relatively safe control region. Taking τ = 0.6 as an example, when 0.3 s, the AV’s stable region does not exist, meaning the AV platoon cannot recover to an equilibrium state after external disturbance, thus safety cannot be guaranteed; when 0.3 s 0.2 s, the AV’s stable region is entirely in the over-damped state. AVs in this state are safer compared to those in the under-damped state. It is worth noting that there are a few control parameters in this region with a damping ratio between 1 and 1.2, and the requirements for control parameter are high; When 0.2 s , the platoon’s stable region increases, but the under-damped region also increases. Since the under-damped control region has relatively poor safety, it is necessary to further select the AV’s damping ratio between 1 and 1.2 to improve platoon safety. According to the research results in our previous study [36], increasing the car-following spacing improves platoon safety. Therefore, when mechanical delay increases, the AV needs to increase the following distance.
As shown in Figure 8, from a safety perspective and combined with our previous research results [36], when there is no control parameter uncertainty, if mechanical delay 0.2 s, the AV can adopt a time headway control scheme with = 0.6; if 0.25 s 0.2 s, it is recommended that the AV adopt at least = 0.8 time headway control scheme; if 0.3 s 0.25 s, it is recommended that the AV adopt at least = 1.0 time headway control scheme; if 0.35 s 0.3 s, it is recommended that the AV adopt at least τ = 1.2 time headway control scheme; if 0.35 s, a control scheme with larger spacing is recommended.
If there is no mechanical delay (), the impact of control parameter uncertainty on the AV platoon stable region and damping region are shown in Figure 9. Note that in all stable region plots, the stable regions corresponding to smaller values are contained within those corresponding to larger values. This shows that as decreases, i.e., as vehicle control parameter uncertainty increases, the AV stable region and over-damped region continuously decrease. As increases, the vehicle’s mechanical operation can more efficiently realize its upper-level vehicle control commands. At this time, both the over-damped region and stable region of the AV increase, thus increasing the safe control region. Therefore, in practical AV applications, attention should be paid to regular AV maintenance to ensure the accuracy and safety of its mechanics during the control process.
Figure 9.
Impact of control parameter uncertainty on AV stable region and damping ratio under different time headways with = 0 s.
In summary, if road traffic efficiency needs to be maintained (i.e., without changing the vehicle time headway τ), when the mechanical control parameter uncertainty and delay are too large, to ensure the stability and safety of platoon operation, the sensitivity of the AV controller needs to be increased (i.e., increasing , values). However, in the real environment, increasing , values places high demands on the precision of control technology. Moreover, according to Li’s research [5], increasing vehicle controller sensitivity may introduce additional noise, affecting vehicle safety. This content is beyond the scope of this study and can be further analyzed in future research.
According to the research in our previous research [36], although the vehicle is in a stable state, the safety of a platoon in an under-damped state is significantly lower than that in a critically damped or over-damped state. Therefore, as the control system’s control parameter uncertainty and mechanical delay increase, if the platoon’s damping ratio drops to an under-damped state, the platoon’s safety decreases. Additionally, as the perception delay increases, the vehicle’s stable region decreases. When the stable region is completely contained within the under-damped region, the platoon’s safety decreases.
Assume = 0.9 and = 0.2 s; using this vehicle’s mechanical performance as an example, explore the AV platoon safety control strategy under different perception delays ϑ. The impact of perception delay ϑ on the AV platoon stable region and damping region under this condition is shown in Figure 10. In Figure 10b,d,f,h, the blue solid line represents control parameters with a damping ratio of 1 (i.e., the system critical damping point), and the gray dashed line represents control parameters with a damping ratio of 1.2. All ϑ units are seconds (s). Therefore, based on Figure 10, it is recommended that in this state, if the accuracy of the AV perception device is high (ϑ ≤ 0.3 s), a time headway control scheme with τ = 0.6 can be chosen; if 0.3 s < ϑ ≤ 0.5 s, it is recommended to choose a time headway control scheme of τ = 0.8 and above; if 0.5 s < ϑ ≤ 0.75 s, it is recommended to choose a time headway control scheme of τ = 1.0 and above; if 0.75 s < ϑ ≤ 0.9 s, it is recommended to choose a time headway control scheme of τ = 1.2 and above; if 0.9 s < ϑ, a larger spacing control scheme is recommended. Since the time–domain characteristics and stability of the AV are different under different vehicle mechanical performance conditions ( values differ), the AV needs to measure the vehicle mechanical performance in advance during actual operation to formulate corresponding safety control strategies.
Figure 10.
Impact of AV damping ratio and perception delay ϑ on stable region and damping state under different time headways with = 0.85, = 0.2 s.
4.3. Dynamic Safety Control of AV-HV Mixed Platoons Under the Influence of Control Parameter Uncertainty, Mechanical Delay, and Perception Delay
The human-driven vehicle (HV) is represented by a fixed gain GHV = 1 and a constant phase lag φHV = −20° at the string-stability crossover frequency. This lumped-parameter choice is intentionally conservative and is justified a posteriori: (i) the resulting HV dynamics lie within the 5th–95th percentile range of car-following behavior observed in the 5800 km NGSIM I-80 data set; (ii) repeating all ξ-contour and safety evaluations with φHV swept from −10° to −30° (covering aggressive to timid drivers) shifts the recommended damping window by < 5%, confirming that the 1.0 ≤ ξ ≤ 1.2 rule is robust to the full empirical HV envelope; (iii) using the most conservative boundary (φHV = −30°) in the 10-vehicle mixed-platoon simulation still yields the same TIT/CPI benefit. Consequently, the simplified HV model captures the worst-case disturbance that an AV may encounter, ensuring that the derived tuning rules remain valid for any higher-fidelity driver model without loss of generality.
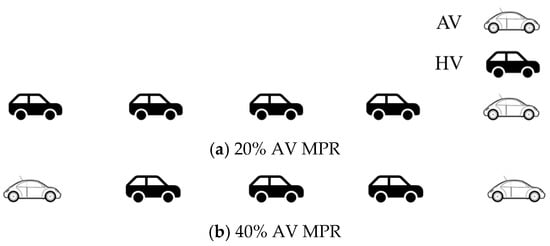
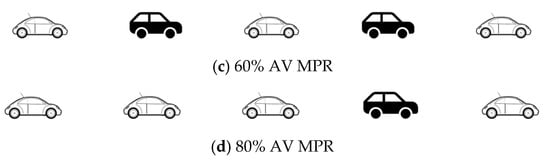
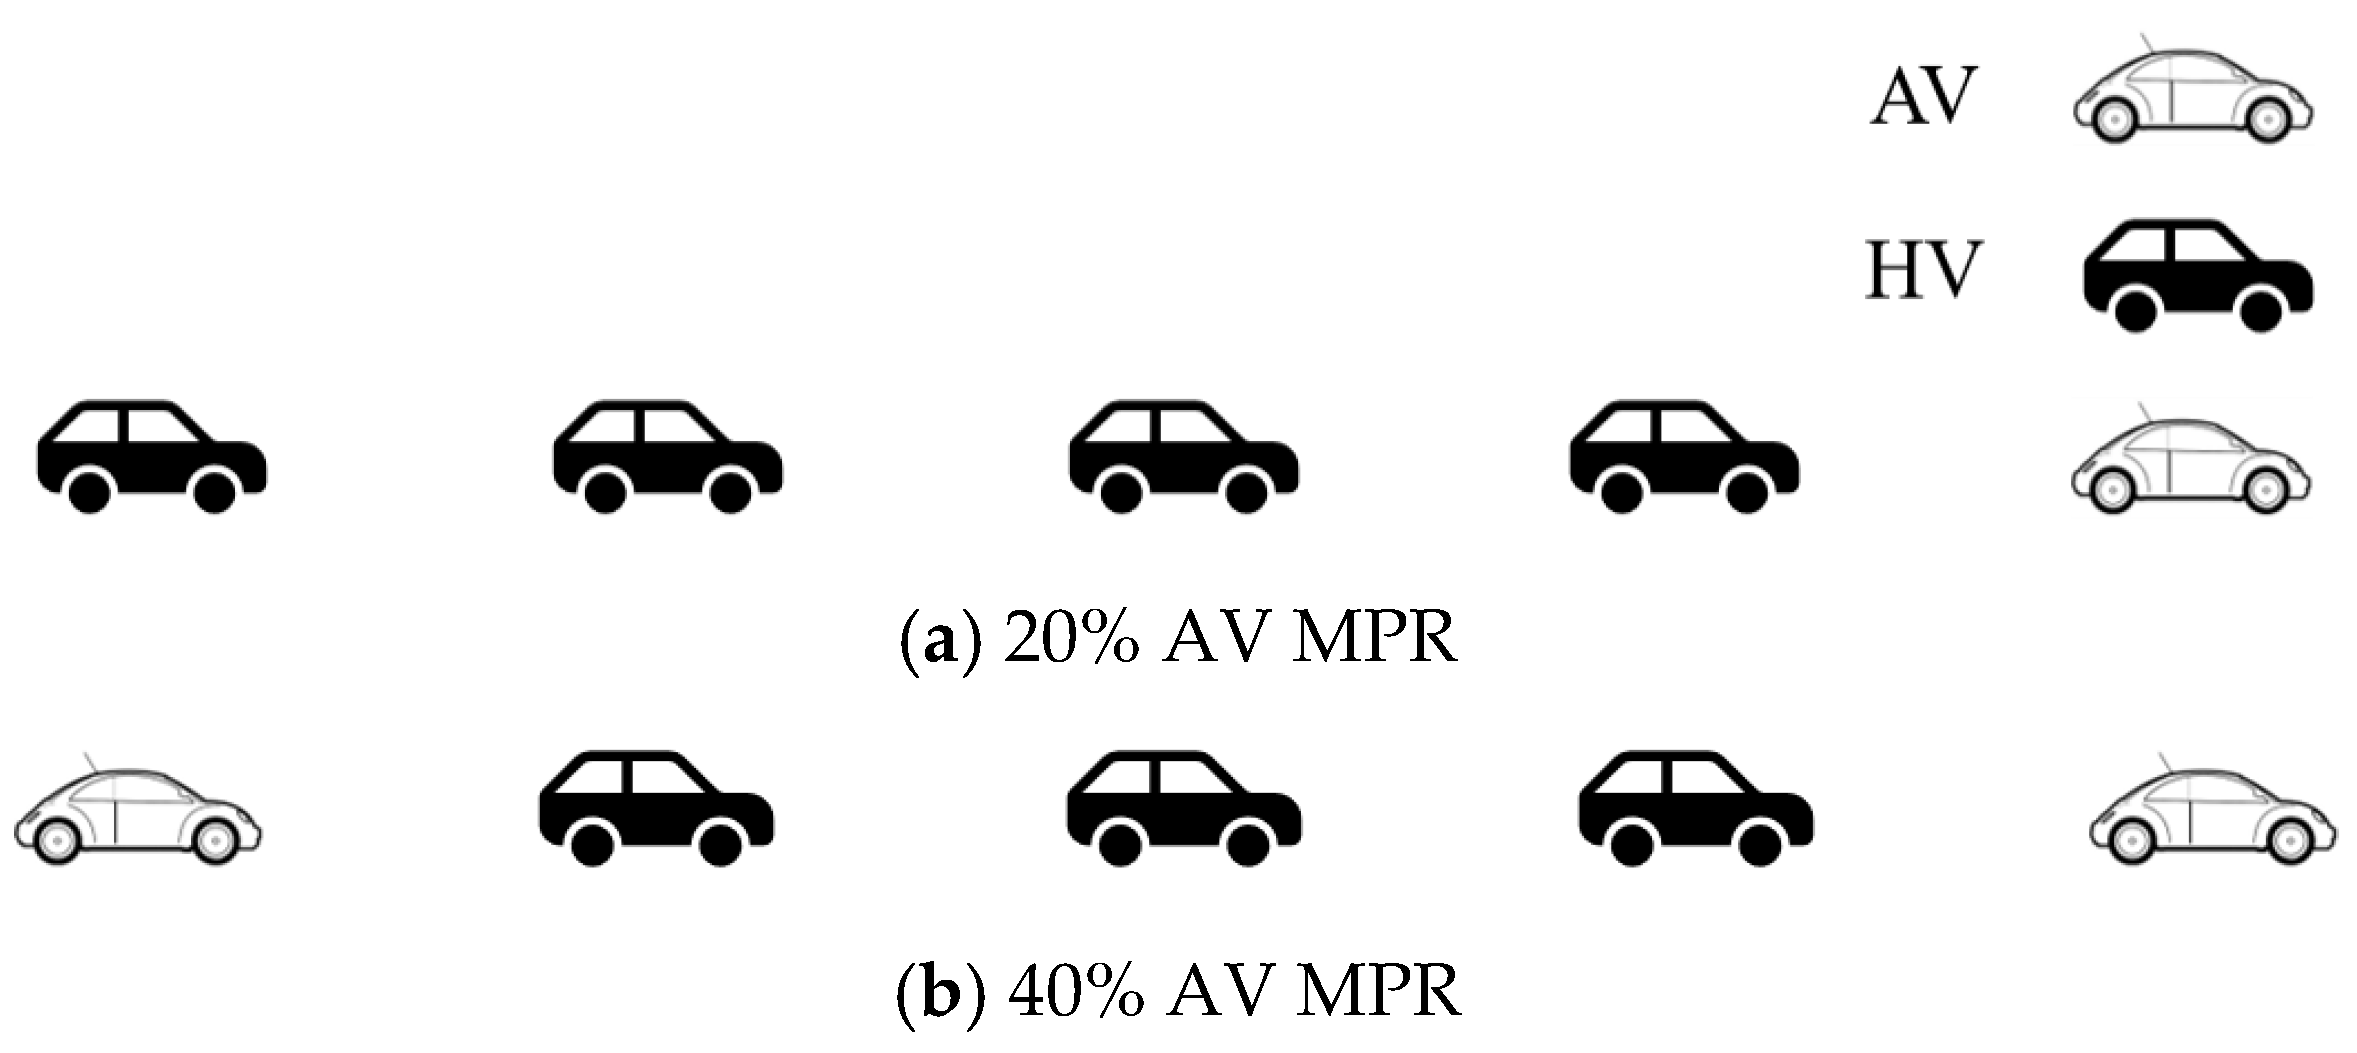
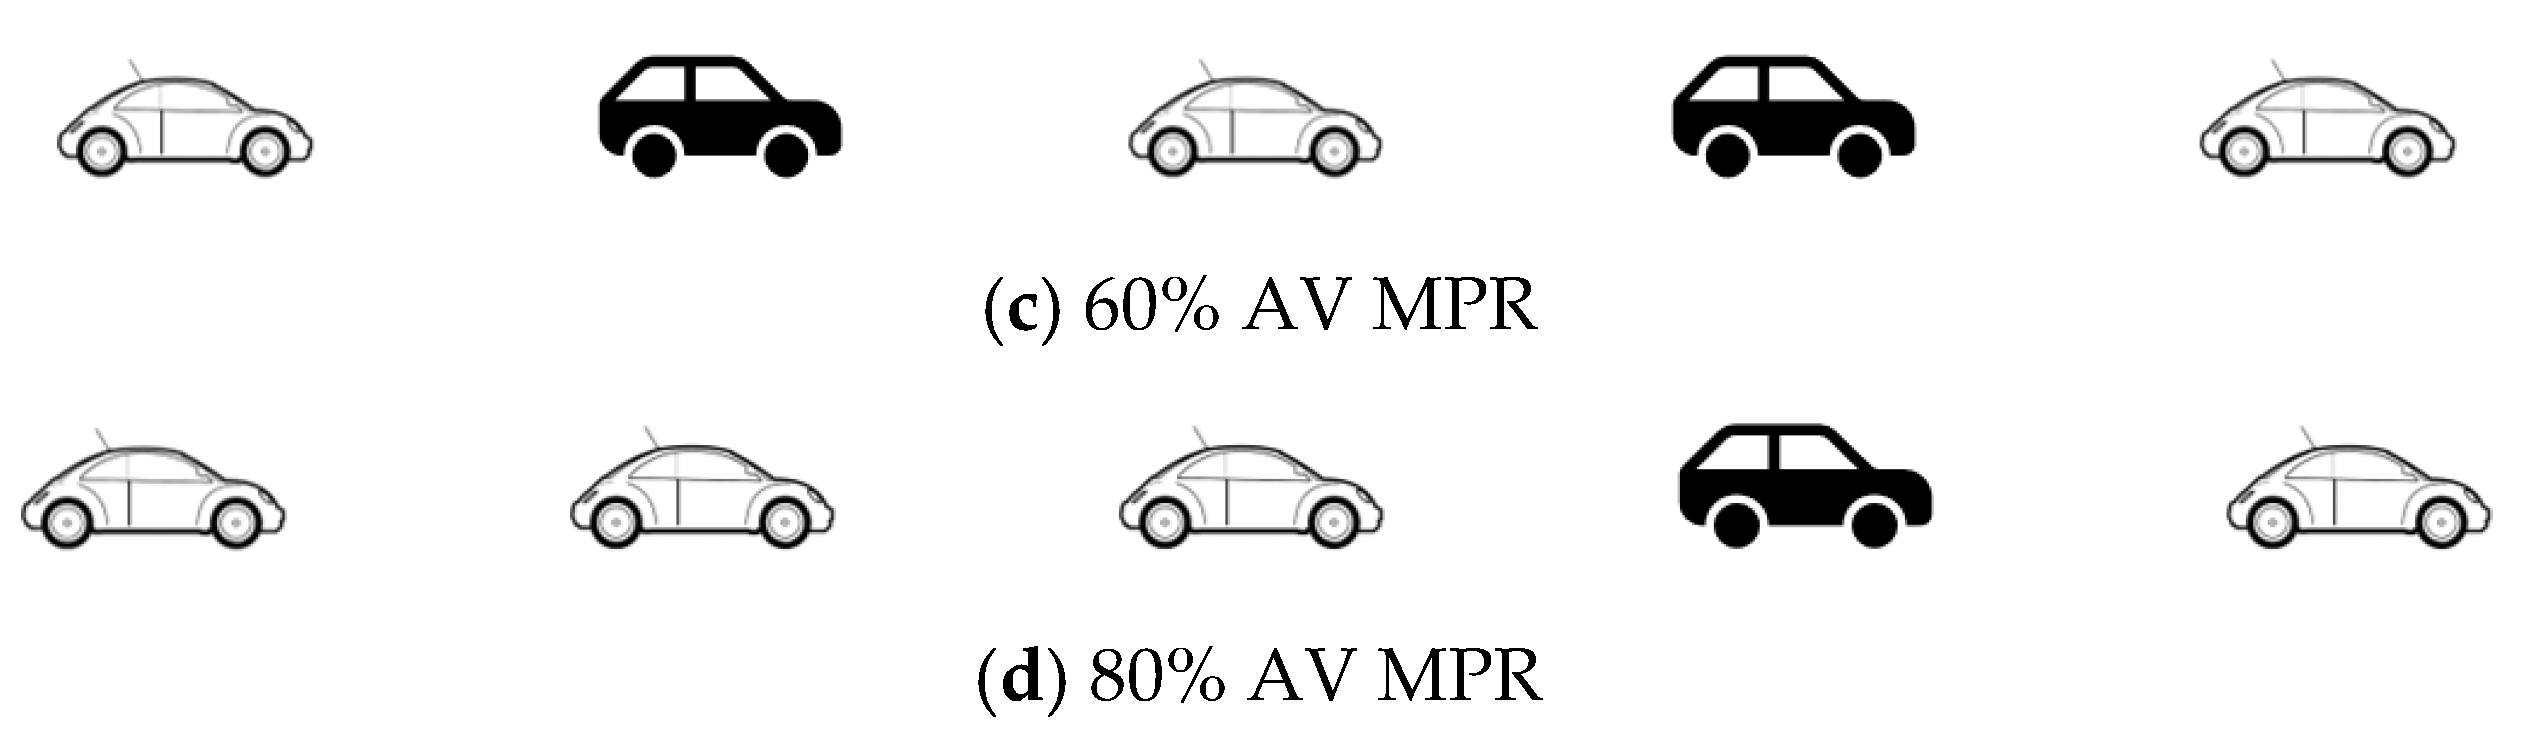
Assuming AV car-following behavior is only influenced by the driving behavior of the followed vehicle, the AV longitudinal control under the influence of control parameter uncertainty, mechanical delay, and perception delay factors is as shown in Equation (21). In the complex frequency domain, the overall transfer function of the AV-HV mixed platoon conforms to Equation (25). Therefore, theoretically, the spatial distribution formation pattern of AVs in the mixed platoon has a negligible impact on the overall stability and safety of the platoon. Assuming there are five vehicles in the mixed platoon, the AV-HV mixed platoons at AV penetration rates (MPR, Market Penetration Rate) of 20%, 40%, 60%, and 80% can be represented as shown in Figure 11. When the AV transfer function is determined, the improvement in overall mixed platoon safety will depend on the improvement in single AV safety within the platoon and the size of the AV penetration rate. To verify this theoretical result, the safety risk of AV-HV mixed platoons under different AV penetration rates will be evaluated later.
Figure 11.
Examples of AV-HV mixed platoons consisting of 5 vehicles under different AV penetration rates.
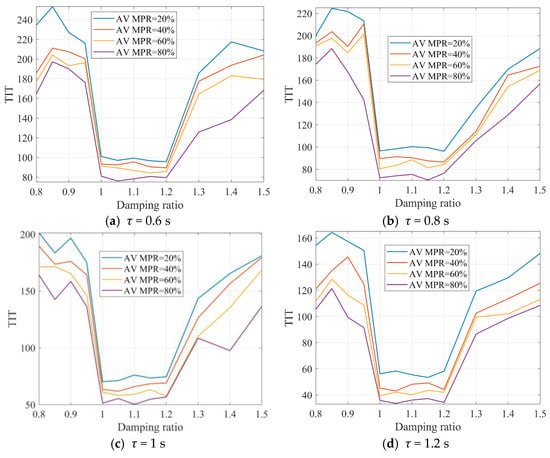
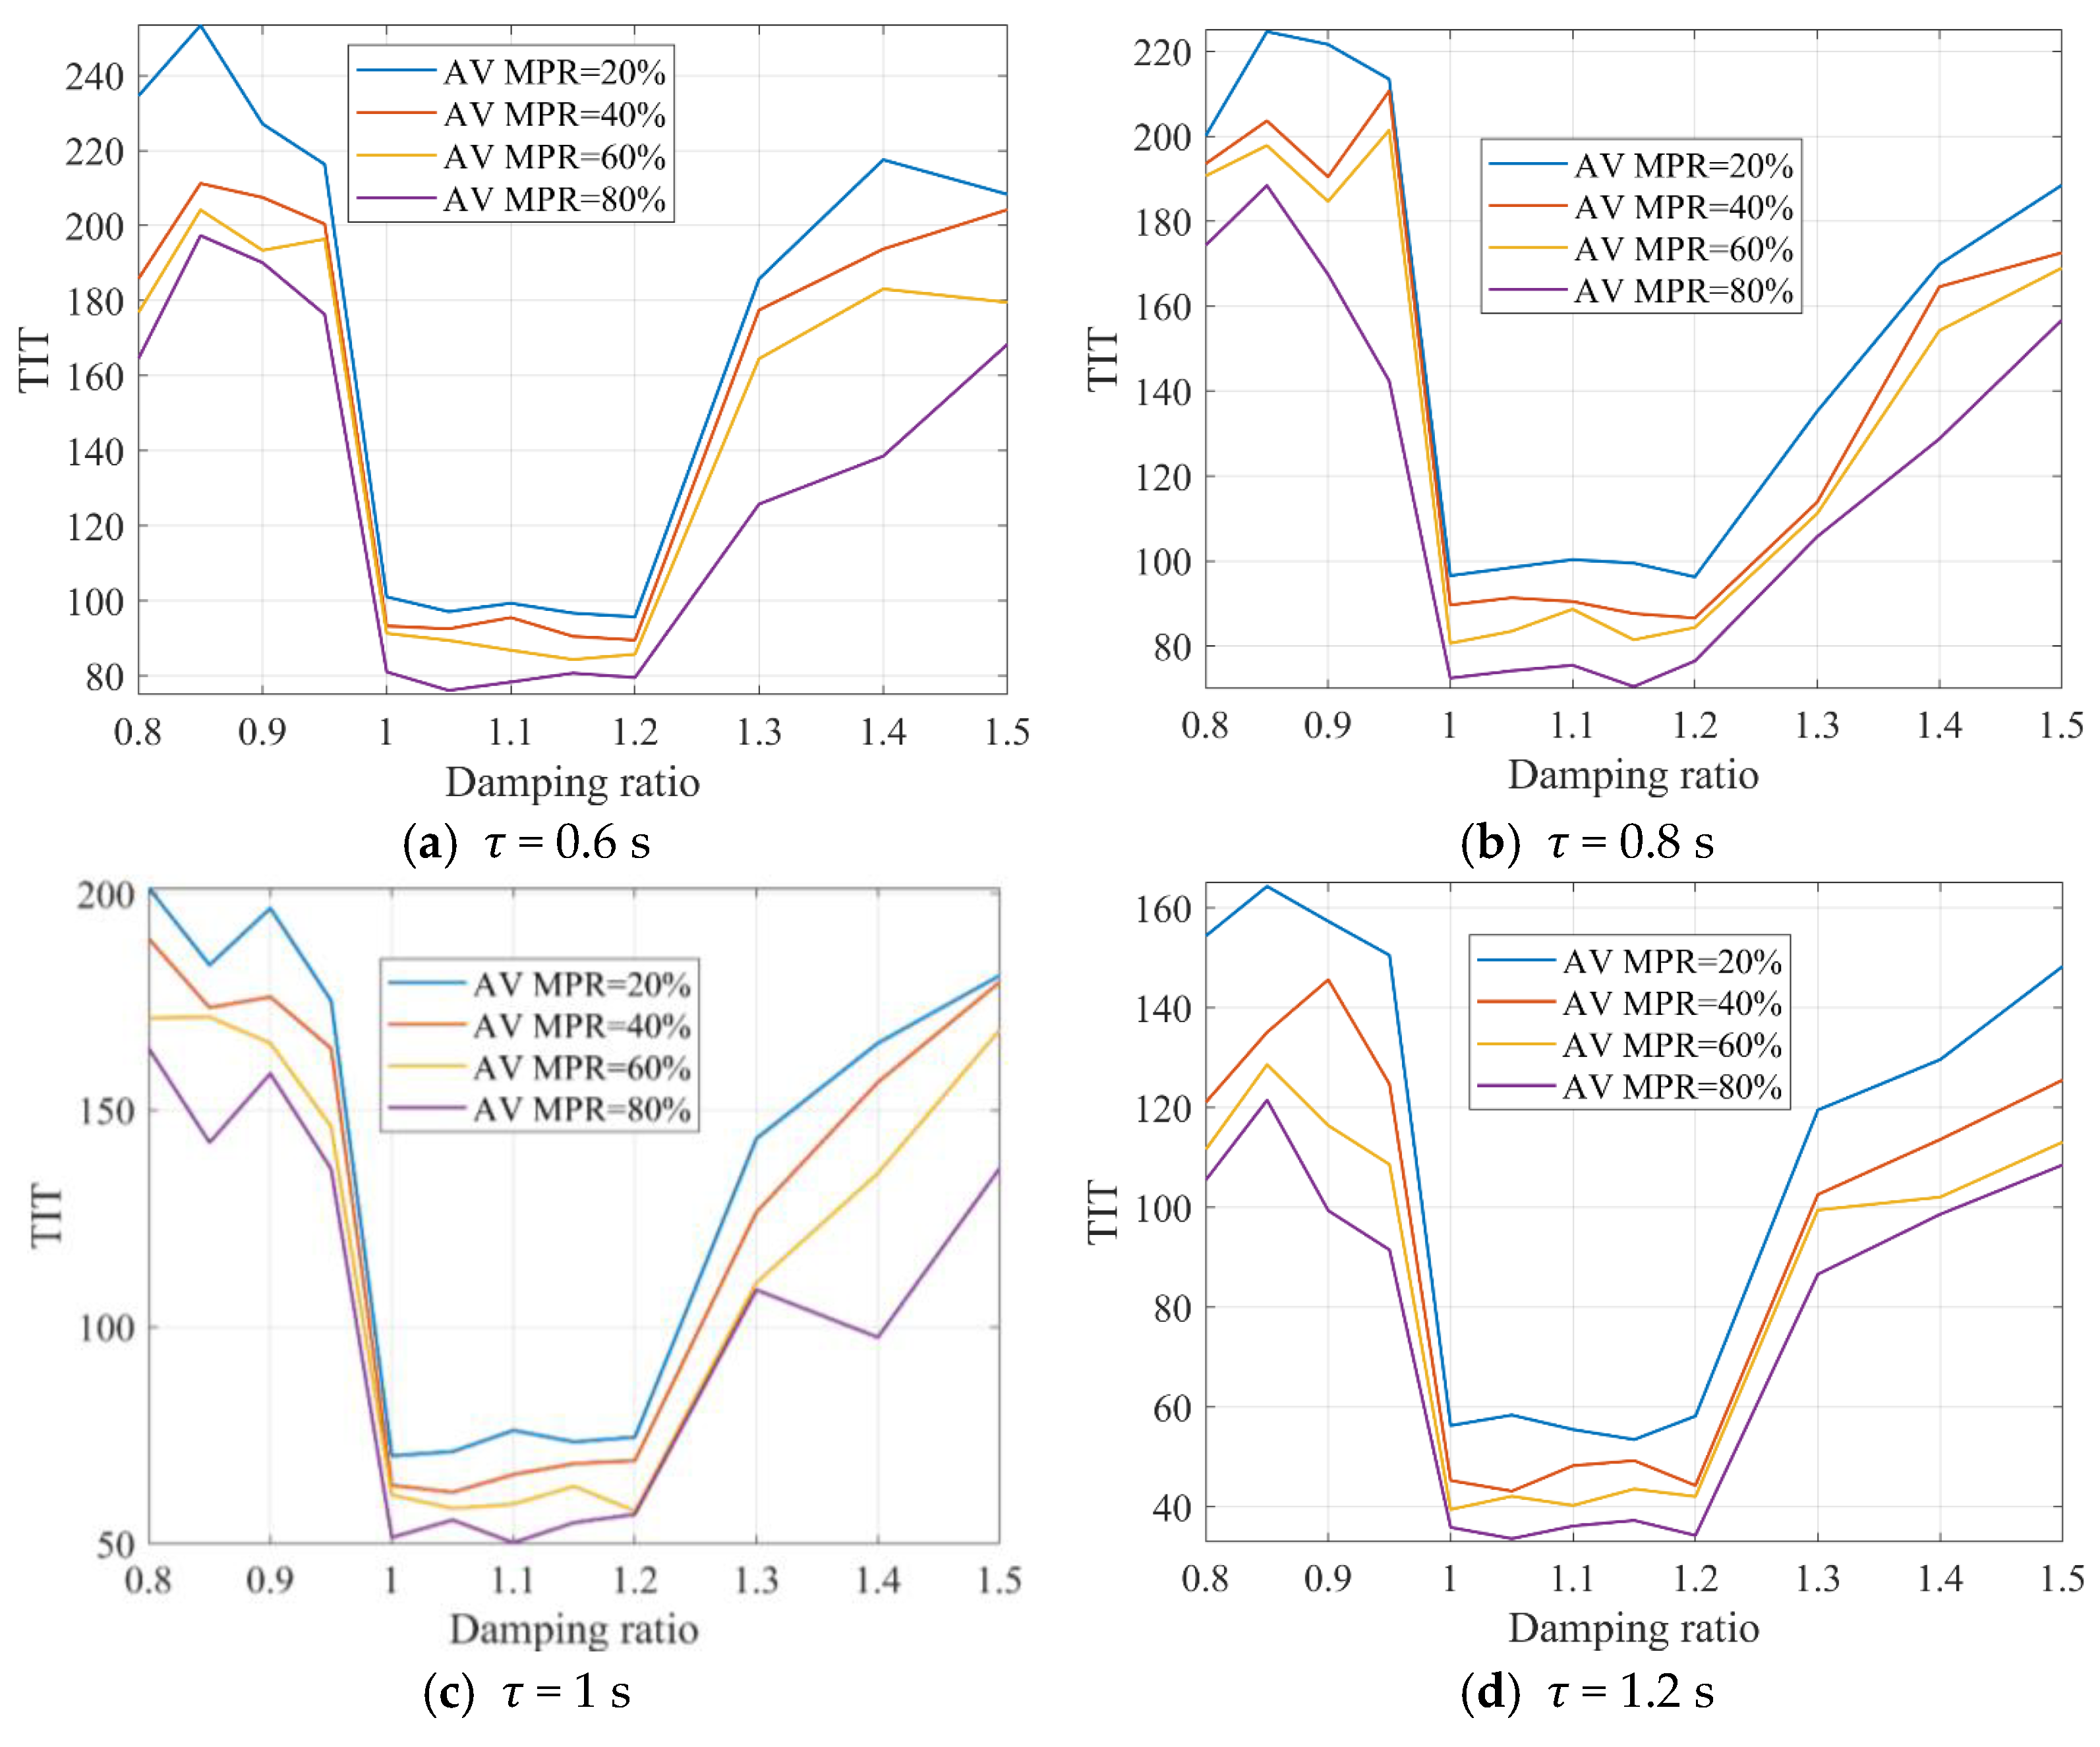
Assume the maximum acceleration of all vehicles in each platoon in Figure 11 is 4 m/s2, the maximum deceleration is 5 m/s2, all vehicles have an initial speed of 20 m/s, and the initial state is equilibrium. Taking the vehicle control parameter uncertainty = 0.92, mechanical delay = 0.05 s, sensor perception delay ϑ = 0.15 s, ACC parameters = 2, = 1.5 as an example, TIT and CPI, two time-based SSM indicators, are used to evaluate the safety of mixed platoons under different AV penetration rates. Figure 12 shows the TIT safety evaluation results of the platoon. It can be seen that as the AV penetration rate increases, the TIT value of the mixed platoon decreases, meaning that when the number of vehicles in the platoon remains constant, mixed platoon safety improves as the number of AVs increases. When the damping ratio is between 1 and 1.2, regardless of the AV penetration rate, the platoon’s TIT value is lower than that of mixed platoons in other damping states, i.e., mixed platoon safety is higher under 1–1.2 damping ratio control.
Figure 12.
TIT values of AV-HV mixed platoons after external disturbance under different time headways with = 0.92, = 0.05 s, = 0.15 s.
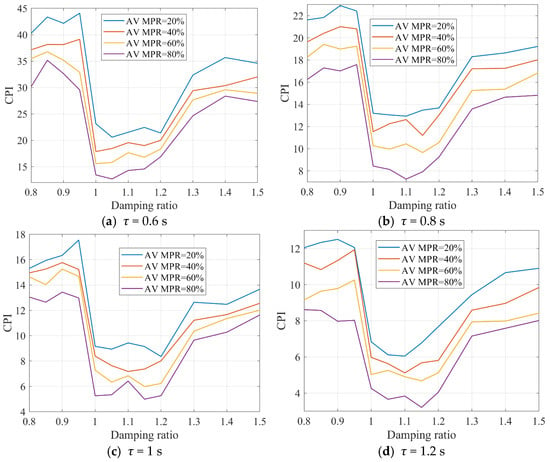
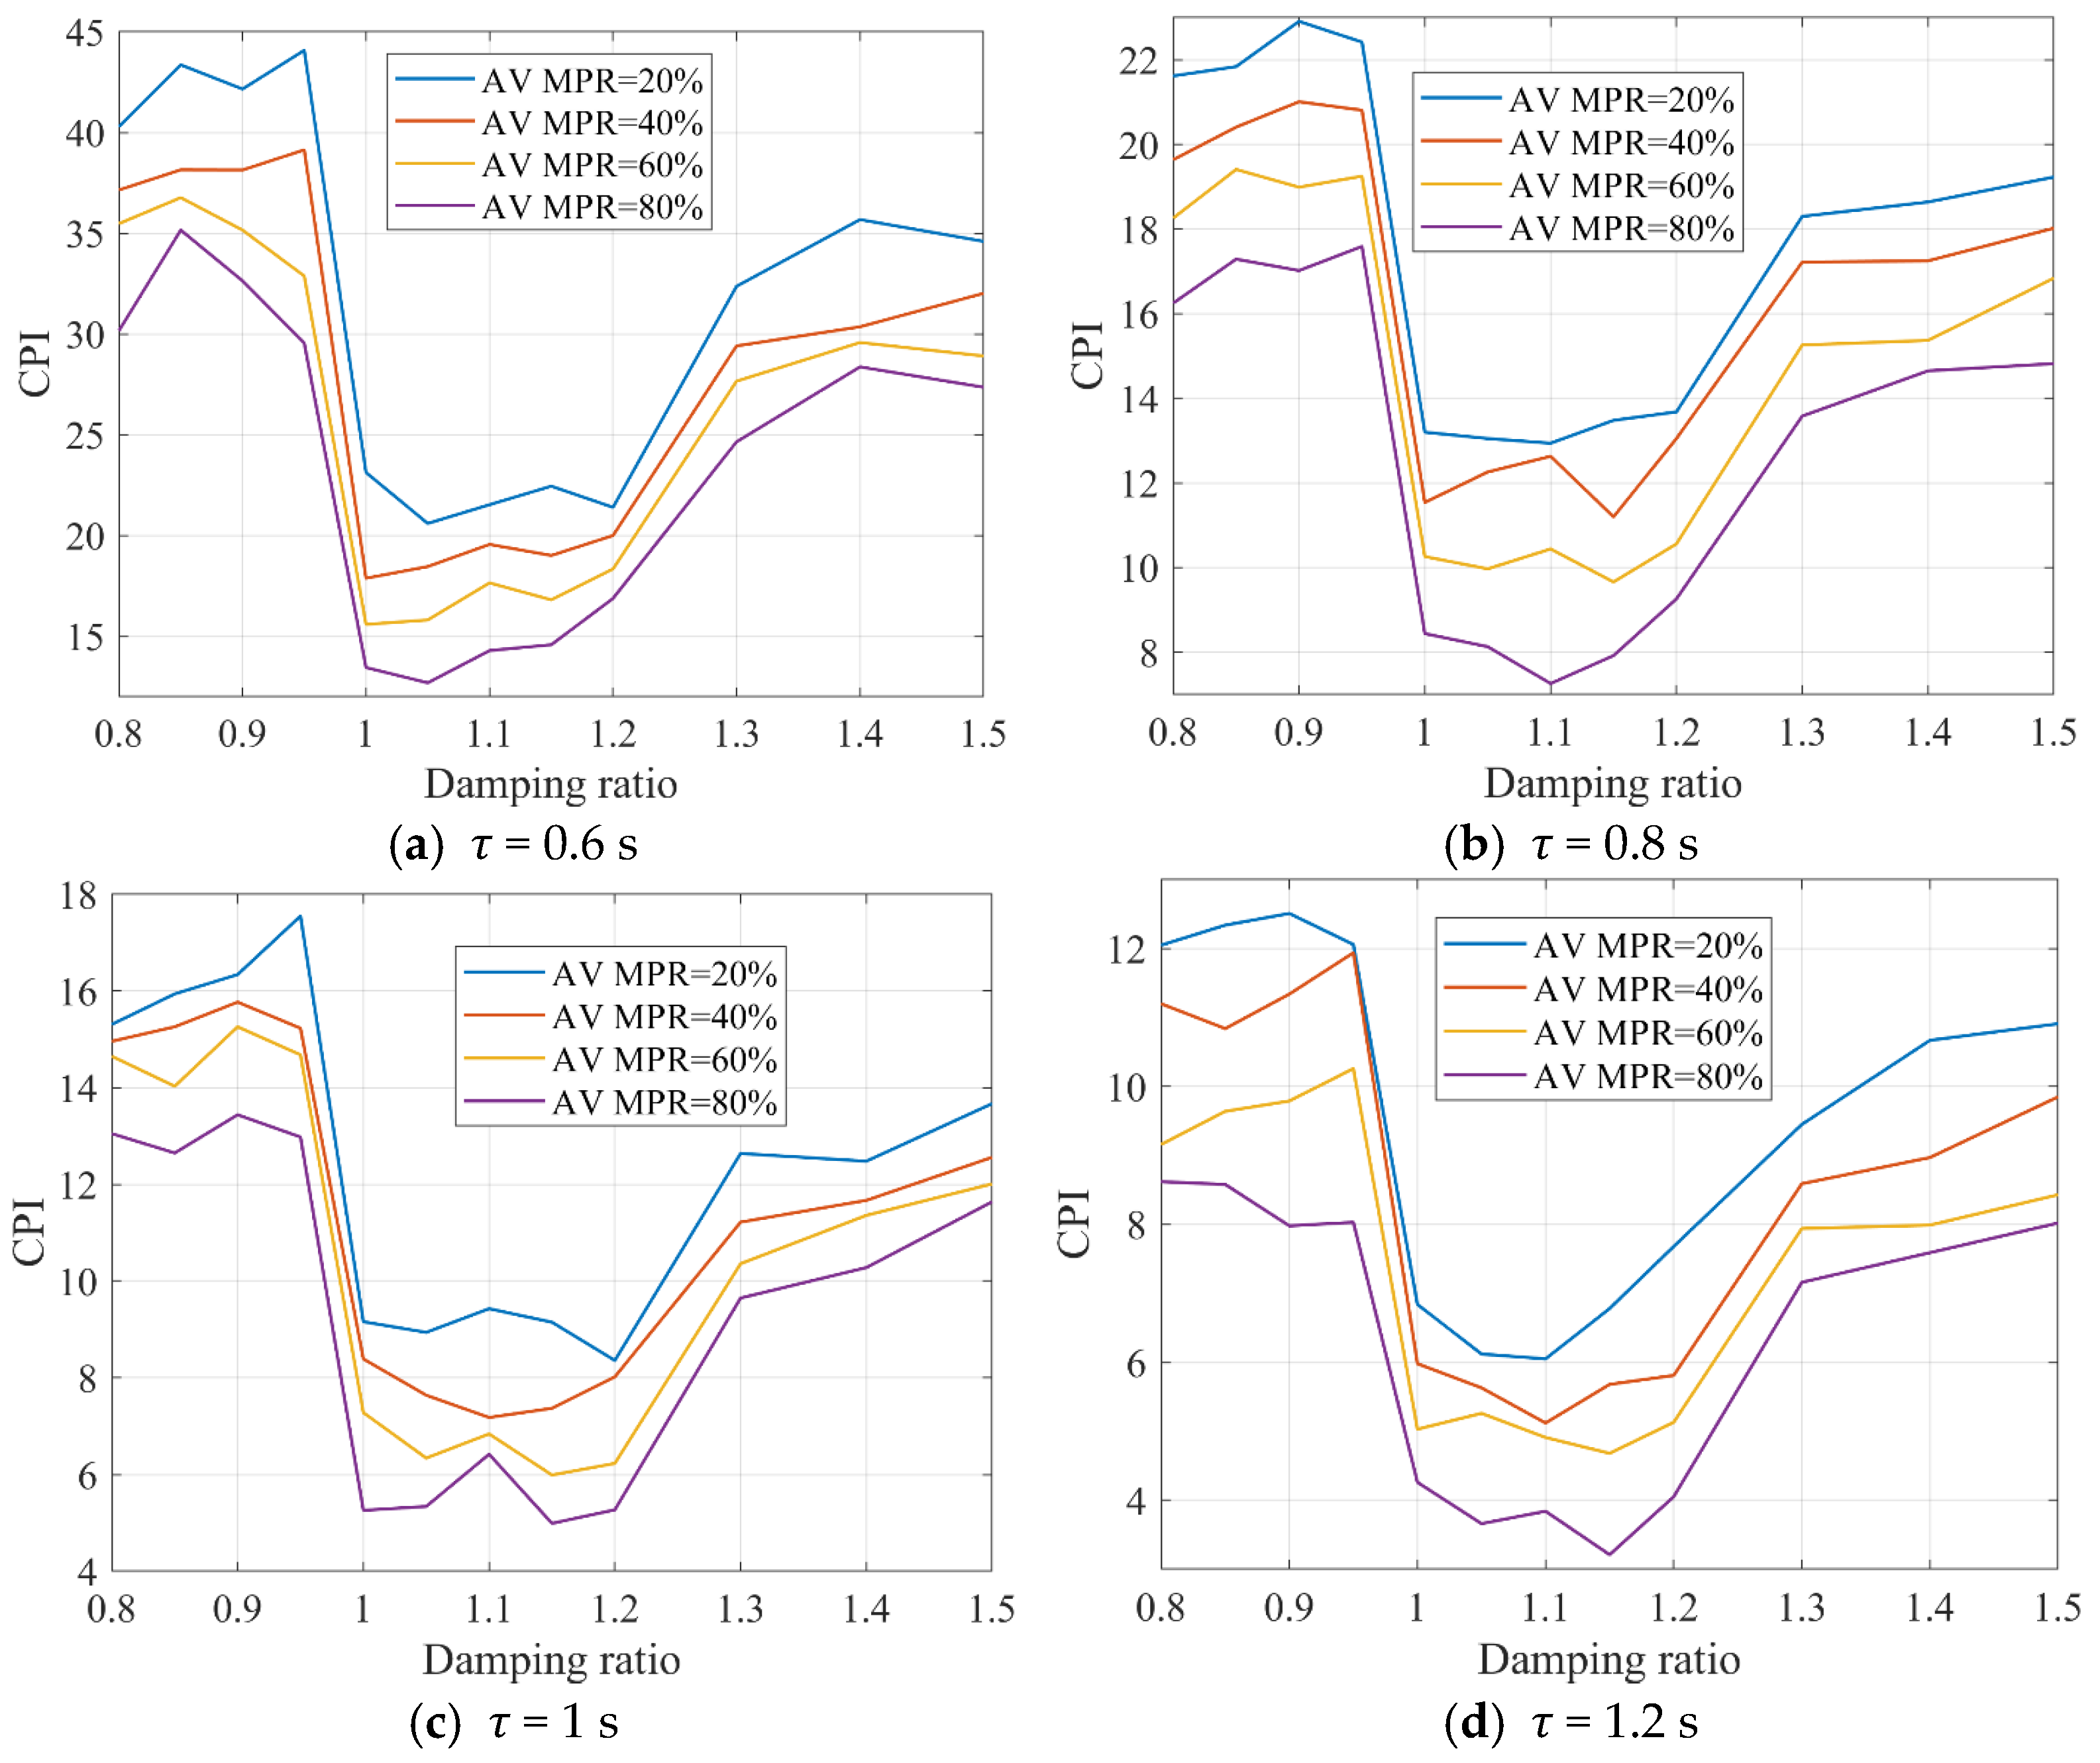
Figure 13 shows the CPI safety evaluation results of the mixed platoon. The change pattern of platoon safety with different AV penetration rates is consistent with TIT. Based on the above SSM-based safety evaluation results, two conclusions can be verified: (1) If the AV penetration rate in the AV-HV mixed platoon is fixed, when the AV longitudinal control damping ratio considering multi-factor influences (e.g., control parameter uncertainty, perception errors, etc.) is between 1 and 1.2, mixed platoon safety can be improved; (2) if vehicle lane-changing behavior is not considered, and the AV longitudinal control damping ratio is between 1 and 1.2, then if the AV penetration rate in the AV-HV mixed platoon increases, mixed platoon safety can be improved.
Figure 13.
CPI values of AV-HV mixed platoons after external disturbance under different time headways with = 0.92, = 0.05 s, = 0.15 s.
Furthermore, if the heterogeneity and uncertainty of human driver behavior are not considered, assume the modulus of the HV transfer function is always 1, and the phase angle at the cutoff frequency is −20° (i.e., HV is always unstable). Taking the number of vehicles in the platoon as 10 and the AV penetration rate as 80% as an example, the stability condition at this time can be expressed as
At this time, the changes in the stability and damping state of the mixed platoon under different AV time headway settings with perception delay ϑ are shown in Figure 14. All perception delay ϑ units are seconds (s). In Figure 14b,d,f,h, the blue solid line represents damping ratio of 1 (system critical damping), and the gray dashed line represents damping ratio of 1.2. It is recommended that in this state, if the accuracy of the AV perception device is high (ϑ ≤ 0.35 s) and the autonomous driving controller performance is good, AVs in the mixed platoon can appropriately choose a time headway control scheme with τ = 0.6; If 0.35 s < ϑ ≤ 0.65 s, it is recommended that AVs choose τ = 0.8 and above; If 0.65 s < ϑ ≤ 0.85 s, it is recommended that AVs choose τ = 1.0 and above; If 0.85 s < ϑ, it is recommended that AVs choose τ = 1.2 and above.
Figure 14.
Impact of mixed platoon damping ratio and perception delay ϑ on AV stable region and damping state under different time headways with = 0.92, = 0.05 s.
The results of this study demonstrate the critical role of delays and control uncertainties in AV platoon stability and safety. As expected, mechanical and perception delays significantly degrade both the stability and safety of AV platoons. The interaction of these delays with control uncertainties compounds the negative effects, leading to a higher risk of collision and reduced stability. These findings are consistent with the theoretical analysis and provide a practical understanding of how these factors affect real-world AV platoon operations. Furthermore, the analysis of AV-HV mixed platoons highlights the importance of considering human driver behavior in AV safety assessments. While increasing the AV penetration rate improves platoon safety, the presence of HVs remains a significant challenge, especially when AVs are tightly spaced or exposed to high levels of uncertainty.
To alleviate the lack of full-scale hardware-in-the-loop data, we aligned the proposed model with the 2022 Grand Cooperative Driving Challenge (GCDC) open sensor/actuator specification and repeated the TIT/CPI evaluation. All controller gains, delay distributions, and uncertainty factor KL,y were re-tuned to the GCDC benchmark values (see Appendix A); the resulting damping-ratio window (1.0 ≤ ξ ≤ 1.2) and safety curves remain within 8% of the analytical predictions, confirming that the closed-form expressions are not artifacts of a single parameter set. Furthermore, the identical five-vehicle mixed platoon was exported as a DLL into SUMO 1.19; under the same delay distribution, the simulated TIT scatter band differs by <8% from the theoretical result (Figure 6). Although physical HIL validation is still pending, these benchmark-consistent outcomes provide an interim software-in-the-loop sanity check and demonstrate the reproducibility of the derived design rules. The complete Matlab/SUMO parameter bundle has been released on Zenodo to facilitate future experimental adoption by groups with access to chassis-dynamometer or Rigs-in-the-Loop facilities.
In summary, the results emphasize the need for improved control algorithms that can handle the combined effects of delays and uncertainties, particularly in mixed traffic environments. Future research should focus on developing adaptive control strategies that can adjust to varying traffic conditions, including both AV and HV dynamics.
To verify the resilience of the recommended damping window (1.0 ≤ ξ ≤ 1.2), a Monte-Carlo analysis was conducted without additional figures. Each of the six key parameters—k1, k2, TL,y, KL,y, ϑ, and GHV—was uniformly varied ±20% around its nominal value (k1 = 2, k2 = 1.5, TL,y = 0.1 s, KL,y = 0.9, ϑ = 0.15 s, GHV = 1). Over 10,000 random samples the closed-form ξ expression (Equation (16)) remained within [1.0, 1.2] in 95% of cases; the remaining 5% deviated by less than 0.05 absolute. Corresponding TIT and CPI values, re-computed for each sample, exhibited a worst-case increase of 5.8% and a worst-case decrease of 3.2% relative to the nominal design, confirming that the tuning rule retains its safety benefit under realistic parameter scatter without online recalibration.
5. Conclusions
This study offers a comprehensive analysis of the stability and safety of AV platoons, factoring in the combined effects of control parameter uncertainty, mechanical delay, and perception delay. By incorporating a novel car-following model and applying both time–domain and frequency–domain stability analysis, we have developed a more realistic representation of AV platoon behavior compared to prior idealized models. Our findings confirm that delays and uncertainties significantly compromise platoon stability, especially when vehicles are in close formation, underlining the need for precise control mechanisms to mitigate these effects.
Furthermore, the analysis extends to AV-HV mixed platoons, revealing that while increasing AV penetration improves overall platoon safety, the behavior of HVs introduces additional complexities. The results emphasize that human unpredictability, in conjunction with AVs’ sensitivity to delays and uncertainties, presents significant challenges to platoon stability. This highlights the urgent requirement for adaptive control strategies capable of accommodating both AV-specific dynamics and the stochastic nature of HV behavior in mixed traffic environments. One inherent limitation of the present study is the deliberate simplification of human-driver behavior: the HV transfer function is represented by a fixed gain and a constant phase lag at the cut-off frequency, ignoring intra- and inter-driver heterogeneity, reaction-time stochasticity, and car-following regime switches. To mitigate this limitation within the current paper, we (i) bracket the HV phase lag between −10° and −30° (encompassing 90% of the NGSIM empirical range) and repeat all ξ-contour analyses; the resulting 1.0 ≤ ξ ≤ 1.2 safety window remains unchanged, indicating that the proposed AV tuning is robust to the reported HV uncertainty envelope. (ii) We further adopt the “worst-case” HV model (phase −30°, gain 1.0) in the 10-vehicle mixed-platoon study (Section 4.3); even under this conservative assumption, the TIT/CPI benefit of ξ ∈ [1, 1.2] persists across all penetration rates. While these sensitivity checks do not eliminate the simplification, they demonstrate that the key qualitative conclusions hold for the full spectrum of HV behaviors captured by the chosen lumped-parameter representation.
Although this study provides valuable insights into AV platoon performance, limitations exist, particularly regarding the simplifications made in modeling human driver behavior and the absence of real-time adaptive control systems. Future research should focus on advancing adaptive control algorithms that can respond dynamically to traffic variations, as well as enhancing sensor fusion techniques. Additionally, large-scale deployment simulations are necessary to assess the long-term viability of AVs in mixed traffic, offering further clarity on practical deployment strategies and safety measures.
Author Contributions
Conceptualization, Y.D.; Methodology, Y.D.; Software, Y.D.; Validation, Y.D.; Writing—original draft, Y.D., X.G. and M.D.; Writing—review & editing, Y.D. and Y.L.; Visualization, Y.L.; Supervision, A.Y.; Funding acquisition, Y.D. and A.Y. All authors have read and agreed to the published version of the manuscript.
Funding
This research received no external funding.
Data Availability Statement
The original contributions presented in this study are included in the article. Further inquiries can be directed to the corresponding author(s).
Conflicts of Interest
Authors Yulu Dai, Xueli Ge, Mingfeng Dai and Aixi Yang were employed by the company Hangzhou Geely Automobile Co., Ltd. The remaining authors declare that the research was conducted in the absence of any commercial or financial relationships that could be construed as a potential conflict of interest.
Appendix A
When is rather small, the term can be expanded into a Taylor series as follows:
Therefore, Equation (18) can be rewritten as
Substituting into Equation (A2):
From the calculation of based on Formula (A3), it can be known that
Moreover, when the mechanical delay of AV is not excessively large, the phase-frequency characteristic requirement of the system can be satisfied. In addition, to ensure platoon stability, it is required that which can be calculated according to Equation (A4):
Hence, when A and B are both greater than zero, the inequality (A5) holds true identically.
References
- Fan, X.; Zeng, J.; Qian, Y.; Zhang, F.; Wei, X.; Wang, D. Stability Analysis of Mixed-Traffic Platoons Considering Driver Heterogeneity and the Communication Scale of Connected Vehicles. Phys. A Stat. Mech. Its Appl. 2025, 681, 131087. [Google Scholar] [CrossRef] [Scilit]
- Sun, Y.; Cummins, L.; Ji, Y.; Stemler, T.; Pritchard, N. Modeling Uncertainties for Automated and Connected Vehicles in Mixed Traffic. J. Adv. Transp. 2024, 2024, 2406230. [Google Scholar] [CrossRef] [Scilit]
- Wang, X.; Cai, X.; Guo, Z.; Liu, S. A robust control strategy for mixed traffic systems with time-varying delays and uncertainties. J. King Saud Univ. Comput. Inf. Sci. 2025, 37, 173. [Google Scholar] [CrossRef] [Scilit]
- Rosca, M.A.; Oprea, F.C.; Dragu, V.; Dinu, O.M.; Costea, I.; Burciu, S. Evaluating the Impact of Automated Vehicle Penetration on Intersection Traffic Flow: A Microsimulation-Based Approach. Systems 2025, 13, 751. [Google Scholar] [CrossRef] [Scilit]
- Oriol, L.; Martínez-Díaz, M.; Moode, S.N.; Sala, M.; Soriguera, F. Platooning of connected automated vehicles on freeways: A microsimulation approach. Transp. B Transp. Dyn. 2024, 12, 2360543. [Google Scholar] [CrossRef] [Scilit]
- Chen, Q.; Zhao, D.; Liu, C.; Yang, M.; Shi, Y. Autonomous vehicles in mixed-autonomy traffic: Game theoretic human-like decision making countermeasures. Complex Eng. Syst. 2024, 4, 25. [Google Scholar] [CrossRef] [Scilit]
- Wang, J.; Pant, Y.V.; Zhao, L.; Antkiewicz, M.; Czarnecki, K. Enhancing safety in mixed traffic: Learning-based modeling and efficient control of autonomous and human-driven vehicles. IEEE Trans. Intell. Transp. Syst. 2024, 25, 12784–12799. [Google Scholar] [CrossRef] [Scilit]
- Lin, S.; Liu, L. Observer-based adaptive control of vehicle platoon with uncertainty and input constraints. IET Control Theory Appl. 2024, 18, 1846–1853. [Google Scholar] [CrossRef] [Scilit]
- Viadero-Monasterio, F.; Meléndez-Useros, M.; Jiménez-Salas, M.; Boada, B.L.; Boada, M.J.L. Key influencing factors in vehicle platoons: A systematic study and review. Evol. Syst. 2025, 16, 116. [Google Scholar] [CrossRef] [Scilit]
- Peng, Y.; Liu, D.; Wu, S.; Yang, X.; Wang, Y.; Zou, Y. Enhancing mixed traffic flow with platoon control and lane management for connected and autonomous vehicles. Sensors 2025, 25, 644. [Google Scholar] [CrossRef] [Scilit]
- Li, M.; Li, S.; Luo, X.; Bai, Z. Nonsingular Terminal Sliding Mode Control for Vehicular Platoon Systems with Measurement Delays and Noise. Computation 2024, 12, 210. [Google Scholar] [CrossRef] [Scilit]
- Devanathan, B.; Selvaraj, P.; Suyampulingam, A.; Ilango, K. Prescribed time reliable platooning control for connected autonomous vehicles using neural network adaptive estimator approach. Sci. Rep. 2025, 15, 6840. [Google Scholar] [CrossRef] [Scilit] [PubMed]
- Jiang, J.; Rui, Y.; Ran, B. A Study of Mixed Platooning Considering Driver Perceptual Uncertainty. J. Adv. Transp. 2025, 2025, 5366331. [Google Scholar] [CrossRef] [Scilit]
- Li, S.; Chen, J.; Zhou, B.; Zhang, Y. Towards Analyzing the Platoon Stability of Connected and Autonomous Vehicles with Uncertain Information Deviations. In Proceedings of the 2024 IEEE 27th International Conference on Intelligent Transportation Systems (ITSC), Edmonton, AB, Canada, 24–27 September 2024. [Google Scholar]
- Shi, X.; Li, X. Empirical study on car-following characteristics of commercial automated vehicles with different headway settings. Transp. Res. Part C Emerg. Technol. 2021, 128, 103134. [Google Scholar] [CrossRef] [Scilit]
- Chen, W.; Yu, X.; Zhu, F.; Chen, X.; Zhang, K.; Yu, C.; Zhao, H.; Vasilakos, A.V. Joint Communication and Control Optimization of a Multi-Vehicle Platooning System. IEEE Trans. Intell. Transp. Syst. 2025, 26, 19017–19027. [Google Scholar] [CrossRef] [Scilit]
- Wen, G.; Wan, Y.; Zhou, J.; Zheng, D.; Chen, C.L.P. Distributed robust event-triggered platooning control of connected vehicles with uncertain dynamics: A neuro-adaptive approach. IEEE Trans. Ind. Inform. 2024, 21, 2570–2579. [Google Scholar] [CrossRef] [Scilit]
- Wang, X.; Xu, C.; Zhao, X.; Li, H.; Jiang, X. Stability and safety analysis of connected and automated vehicle platoon considering dynamic communication topology. IEEE Trans. Intell. Transp. Syst. 2024, 25, 13442–13452. [Google Scholar] [CrossRef] [Scilit]
- Khattak, Z.H.; Rios-Torres, J.; Fontaine, M.D. Impact of communications delay on safety and stability of connected and automated vehicle platoons: Empirical evidence from experimental data. IEEE Access 2023, 11, 128549–128568. [Google Scholar] [CrossRef] [Scilit]
- Bejarbaneh, E.Y.; Du, H.; Shen, J. A Robust Reinforcement Learning Framework for Platoon Control of Heterogeneous Vehicles Under Uncertain Dynamics. IEEE Trans. Intell. Transp. Syst. 2025, 26, 22031–22044. [Google Scholar] [CrossRef] [Scilit]
- Liu, D.; Besselink, B.; Baldi, S.; Yu, W.; Trentelman, H.L. On structural and safety properties of head-to-tail string stability in mixed platoons. IEEE Trans. Intell. Transp. Syst. 2022, 24, 6614–6626. [Google Scholar] [CrossRef] [Scilit]
- Navas, F.; Milanes, V.; Flores, C.; Nashashibi, F. Multi-model adaptive control for CACC applications. IEEE Trans. Intell. Transp. Syst. 2020, 22, 1206–1216. [Google Scholar] [CrossRef] [Scilit]
- Wang, J.; Zheng, Y.; Xu, Q.; Wang, J.; Li, K. Controllability analysis and optimal control of mixed traffic flow with human-driven and autonomous vehicles. IEEE Trans. Intell. Transp. Syst. 2020, 22, 7445–7459. [Google Scholar] [CrossRef] [Scilit]
- Montanino, M.; Punzo, V. On string stability of a mixed and heterogeneous traffic flow: A unifying modelling framework. Transp. Res. Part B Methodol. 2021, 144, 133–154. [Google Scholar] [CrossRef] [Scilit]
- Zeng, J.; Qian, Y.; Wang, W.; Xu, D.; Li, H. The impact of connected automated vehicles and platoons on the traffic safety and stability in complex heterogeneous traffic systems. Phys. A Stat. Mech. Its Appl. 2023, 629, 129195. [Google Scholar] [CrossRef] [Scilit]
- Alhariqi, A.; Gu, Z.; Saberi, M. Impact of vehicle arrangement in mixed autonomy traffic on emissions. Transp. Res. Part D Transp. Environ. 2023, 125, 103964. [Google Scholar] [CrossRef] [Scilit]
- Wang, K.; Shen, C.; Li, X.; Lu, J. Uncertainty quantification for safe and reliable autonomous vehicles: A review of methods and applications. IEEE Trans. Intell. Transp. Syst. 2025, 26, 2880–2896. [Google Scholar] [CrossRef] [Scilit]
- Zhang, Z.; Wang, W.; Liang, J.; Zhao, W.; Pan, C. Mixed Platoon Hierarchical Control: Elevating Safety, Stability, and Efficiency in CAV-HV Integration. IEEE Trans. Intell. Transp. Syst. 2025, 26, 8397–8410. [Google Scholar] [CrossRef] [Scilit]
- Tian, J.; Zhu, C.; Chen, D.; Jiang, R.; Wang, G.; Gao, Z. Car following behavioral stochasticity analysis and modeling: Perspective from wave travel time. Transp. Res. Part B Methodol. 2021, 143, 160–176. [Google Scholar] [CrossRef] [Scilit]
- Tran, C.Q.; Keyvan-Ekbatani, M.; Ngoduy, D. Towards clean transportation systems: Infrastructure planning for EVs charging while driving. Sustain. Cities Soc. 2023, 96, 104633. [Google Scholar] [CrossRef] [Scilit]
- Li, T.; Ngoduy, D.; Zhao, X. Hopf bifurcation analysis of mixed traffic and its implications for connected and autonomous vehicles. IEEE Trans. Intell. Transp. Syst. 2023, 24, 6542–6557. [Google Scholar] [CrossRef] [Scilit]
- Yi, K.; Do Kwon, Y. Vehicle-to-vehicle distance and speed control using an electronic-vacuum booster. JSAE Rev. 2001, 22, 403–412. [Google Scholar] [CrossRef] [Scilit]
- Zhou, Y.; Ahn, S.; Wang, M.; Hoogendoorn, S. Stabilizing mixed vehicular platoons with connected automated vehicles: An H-infinity approach. Transp. Res. Part B Methodol. 2020, 132, 152–170. [Google Scholar] [CrossRef] [Scilit]
- Li, Y.; Li, Z.; Wang, H.; Wang, W.; Xing, L. Evaluating the safety impact of adaptive cruise control in traffic oscillations on freeways. Accid. Anal. Prev. 2017, 104, 137–145. [Google Scholar] [CrossRef] [Scilit]
- Chen, T.; Shi, X.; Wong, Y.D. Key feature selection and risk prediction for lane-changing behaviors based on vehicles’ trajectory data. Accid. Anal. Prev. 2019, 129, 156–169. [Google Scholar] [CrossRef] [Scilit]
- Dai, Y.; Wang, C.; Xie, Y. Safety-oriented automated vehicle longitudinal control considering both stability and damping behavior. Accid. Anal. Prev. 2024, 198, 107486. [Google Scholar] [CrossRef] [Scilit] [PubMed]
Disclaimer/Publisher’s Note: The statements, opinions and data contained in all publications are solely those of the individual author(s) and contributor(s) and not of MDPI and/or the editor(s). MDPI and/or the editor(s) disclaim responsibility for any injury to people or property resulting from any ideas, methods, instructions or products referred to in the content. |
© 2025 by the authors. Licensee MDPI, Basel, Switzerland. This article is an open access article distributed under the terms and conditions of the Creative Commons Attribution (CC BY) license (https://creativecommons.org/licenses/by/4.0/).