


Abstract
Distance learning has made learning possible for those who cannot attend traditional courses, especially in pandemic periods. This type of learning, however, faces a challenge in keeping students engaged and interested. Furthermore, it is important to identify students who are in need of help to ensure that their progress does not deteriorate. First, the research identifies students’ engagement based on their behaviors in Virtual Learning Environment (VLE) and their performances in assessments. This research goal is to investigate the association/relationship between demographic characteristics and engagement level. It identifies less engaged students by using an unsupervised clustering model based on VLE interactions and assessments of submission-derived features. According to results, the two-level clustering model outperforms other models in regard to cluster separation using silhouette coefficient. Apriori algorithm is utilized to obtain a set of rules that connect demographic features to student engagement. Results show gender, highest education, studied credits, and number of previous attempts have positive correlation with engagement level in distance-based learning.
1. Introduction
The spread of technology around the world and the increase in access to information has led to the popularity of distance learning since it enables people to learn new skills without a physical mentor. Distance learning may contribute significantly to the concept of big data as more students access educational materials online. As a result, data analytics and educational data mining are becoming increasingly important in the field of online learning in order to make use of the expanding amount of acquired data. However, distance learning faces a real challenge in keeping students motivated and engaged and preventing them from feeling alienated. For example, the dropout rate at the Open University (OU) in the UK [1] was as high as 78%. OU is the source of the dataset for the current study. An OECD report also showed that only 31% of Australian students completed a four-year degree program, while 71% of graduates in the UK completed their degrees and 49% of graduates in the United States completed their degrees [2]. Motivating students is crucial since students may feel discouraged if they perceive they are not learning at the same pace as their classmates, especially when there is little or no face-to-face interaction with instructors or classmates [3,4,5]. In addition, studies show that students’ engagement with course content has a significant influence on their career decisions in the future [6]. Instructors must therefore find ways to motivate and engage students.
Moreover, the associations between student engagement level and their demographic features are investigated in this paper. To the best of our knowledge, none of the previous works consider the association between demographics and engagement through a set of engagement metrics in distance learning. Besides, in this study, we designed a clustering model to best identify students’ engagement levels. Using the Apriori association rules algorithm, this paper explores the relationship between engagement metrics, total engagement level, and demographics.
This paper is organized as follows: Section 2 gives a brief background summary of the field of distance-based education, the association rules and Apriori algorithm, and K-means algorithm. Section 3 then presents some of the related work. Section 4 describes the dataset and the methodology used. Section 5 discusses the experiments conducted and the resulting association rules. Lastly, Section 6 concludes the paper.
2. Related Topics Background
2.1. Distance Learning
Distance learning (DE) platforms have become more popular in higher education institutions and have been growing in many forms such as Massive Open Online Courses (MOOCs), Virtual Learning Environment (VLE), and Modular Object-Oriented Dynamic Learning Environments. People can access these platforms in order to learn new skills without needing to take part in traditional classroom settings. Due to an increasing number of students accessing educational material online, these platforms generate a great deal of data as well. Consequently, learning analytics and educational data mining are considered crucial to using the increasing amount of collected data. Education data mining is one area where analyzing data is used to enhance the learning process and improve the performance of students [7]. DE describes the effort of providing access to learning for distant learners. DE can be defined as follows: instruction occurs between two parties (a learner and an instructor), takes place at different times and places, and involves the use of a variety of instructional materials [8].
2.2. Association Rules and Apriori Algorithm
Association rules are rule-based machine learning algorithms used to find interesting relationships between large database items [9]. Based on occurrences of other items, association rules produce rules that can predict the occurrence of an item [10]. It can be defined formally as follows [11]:
Let be a set of d attributes called items and be a set of n transactions called the database. Each transaction in comprises a subset of the items that appear in I. A rule is defined as X where X, Y ⊆ I, itemsets that are disjoint, i.e., X ∩ Y = ∅. Alternatively, rules can also be viewed as predictable transactions within a database. The antecedent and the consequent of the rule are called X and Y, respectively.
In a distance learning environment, association rules can be useful for detecting associations between various features in the dataset. In particular, they can be applied to correlate student behavior data with demographic information to identify features that have a positive or negative impact on student engagement.
To measure how important and interesting a rule is, the following measures have been proposed and used, mainly:
- Support: the support of an itemset is its frequency within the database. Alternately, it can be expressed as the fraction of transactions that have an itemset. The support of an itemset X within a set of transactions is calculated as follows [9]:
Confidence: the confidence of a rule is gauged by how often the rule appears in the database. According to the formal definition, it can be calculated as the proportion of transactions that contain both itemsets X and Y, as compared to transactions that contain only X [9].
- Lift: an association rule’s lift is a measure of how interesting it is. It determines how likely the rule is to occur as compared to the likelihood of its antecedent and consequent being independent. The lift of an association rule is defined as [10]:
When a lift is 1, it can be assumed that the two itemsets comprising a rule are independent. Hence, the rule tying them together is not really a rule. If, however, the lift is >1, it is implied that the two itemsets are dependent upon each other. Thus, the corresponding rule might be useful for predicting future occurrences of the consequent if the antecedent occurs. The lift importance comes from considering the whole transactions database in addition to the confidence of the rule.
Association rules are applied on categorical datasets and have been considered for a variety of applications [9]. Many association rule algorithms have been proposed, but the most popular is Apriori algorithm, which will be explained in the following section.
2.3. Apriori Algorithm
Apriori is a bottom-up approach that uses breadth-first to identify a set of association rules based on the frequency of the itemsets. Given a threshold C, the algorithm finds the itemsets that occur not less than C transactions in the database [12]. A frequent subset is extended in each iteration by one item as the algorithm follows the bottom-up approach. The algorithm first finds singleton and removes the itemsets that have a frequency lower than the given threshold and it continues until no newer itemsets are discovered. The length of the itemset is then incremented by 1, and the same process is repeated. This process will stop when the itemsets are not extending.
Apriori is popular among association rule algorithms due to its ease of implementation and parallelization, as well as its use of big itemsets [12]. This algorithm does have some shortcomings, however. A major issue in this approach is that it involves numerous database searches to generate the rules because of the itemset extension feature.
2.4. K-Means Algorithm
A K-means algorithm is one of the most popular unsupervised clustering algorithms, which is both simple and powerful. By calculating the centroid of the cluster and locating its closest points, it groups the data into K clusters. The algorithm works by minimizing a cost function, which is below, through a similarity metric such as Euclidean distance.
Cost function computes the squared distance between each example in the dataset and the cluster it was assigned to, [13].
This method is employed in this study to group together students that have similar profiles of online activity and interaction into one level of engagement.
3. Related Work and Contribution
3.1. Student Engagement and Metrics
Several studies have investigated student engagement levels and the methods for identifying and determining them. As an example, students were classified into three levels of engagement: high, nominal, and low [14,15]. Furthermore, students’ posts were classified into five categories, using the SQUAD method: Suggestion, Question, Unclassified, Answer, and Delivery [14]. Students were scored for each post belonging to one of the categories, and the total score determined their engagement in the course. Nevertheless, the study ignored other possible metrics such as how often students interacted with the material and how much effort they had put forth to evaluate engagement. Alternatively, a three-level model was adopted to classify a custom images dataset portraying various engagement levels [15]. Image recognition and support vector machines were used to classify the new images. The main drawback of the study is that some students may not have cameras in their devices, so it will not be practical in real-time scenarios. A five-level model was also adopted to classify students into one of the following classes: Authentic engagement, Ritual compliance, Passive compliance, Retreatism, and Rebellion [16]. Yet, the model gave instructions to the instructors for evaluating student engagement based on in-class interaction, so it is difficult to be adopted in a distance-based setting.
Various engagement metrics have been utilized and proposed in the literature to measure/identify the student engagement levels [17,18,19]. To determine the student engagement levels, “Classroom Survey of Student Engagement (CLASSE)” model was used in addition to frequency-based metrics that were proposed in the study [17]. CLASSE measured questions asked, participation, interactions with the instructor, and time spent on the course. In contrast, another study used number of content views, number of posts in discussion, and assignment completion indicator as engagement metrics in a three-level model to determine students’ engagement level in a Massive Open Online Course (MOOC) [19]. The literature provided an idea about the kind of engagement metrics to be used as representative of student engagement in distance learning. In this study, two kinds of engagement metrics are considered: interaction-based metrics and time-based metrics (binary indicator of on-time assessment submission). Utilizing these metrics, students’ engagement can be predicted based on their interactions with course materials and other students through the Virtual Learning Environment (VLE) along with being on time to complete course tasks.
3.2. Engagement and Demographics
Some previous research has studied the relation between demographics and engagement. For example, student engagement differences were investigated, as well as in relation to student achievement. It was found that student engagement differs by gender [20]. In another study, the relationship between minority status and student engagement was also examined. It was determined whether the amount of time and energy invested in educational practices differed between students from different racial and ethnic groups [21]. Moreover, student engagement was also examined using statistical methods in an e-learning environment [22]. The study determined that variables such as class size, course design, teacher participation, student gender, and student age must be taken into account when evaluating student engagement.
Most of the past engagement research, on the other hand, has focused on conventional education in schools and universities, ignoring student engagement on distance-learning platforms. In addition, previous student engagement research has relied on statistical analysis, questionnaires, and qualitative methodologies; yet, these statistical approaches are unable to uncover hidden knowledge in student data. In addition, it is challenging to generalize and scale qualitative and statistical approaches. Questionnaires are ineffective for gauging student engagement as participants may not be able to understand the questions, and surveys take a long time to complete.
First, the current study uses engagement metrics to design an appropriate engagement level model to be used for predicting student engagement. Then, it studies the relationship between demographic characteristics and engagement levels. It does so by employing machine learning and data mining techniques.
3.3. Contribution
The contribution of this paper can be summarized as follows:
- Providing frequency-based and time-based metrics to gauge student engagement in distance learning, especially VLE.
- Determining the best engagement level model and the metrics which are representative of student engagement in distance learning.
- Studying the relationship between the obtained engagement levels and students’ demographic characteristics.
4. Research Methodology
The Knowledge Discovery in Database (KDD) methodology is utilized in this study to extract relevant insights from the data. We applied these steps on the data: selection and understanding, preprocessing and transformation, modelling, and evaluation.
4.1. Data Understanding
Data for this study is obtained from Open University (OU) courses, one of the largest distance-based universities. The goal of developing the Open University Learning Analytics (OULA) dataset was to support the learning analytics and educational data mining research fields [23]. OULA includes information about 22 courses that were delivered between 2013 and 2014, including the following: 32,593 students, their interactions logged with the VLE represented by daily summaries of student clicks (10,655,280 entries), and their assessment results. The courses belong to two disciplines: “Social sciences” and “Science, Technology, Engineering and Mathematics”. In OU, modules represent courses, and they can be presented many times during the year. To differentiate between various presentations of the module, the year and starting month are used to name the module. If a module presentation ends with A, it means it starts in January; if it ends with B, it means it starts in February. For example, “2013J” means the presentation started in October 2013. In this study, the “FFF” model with “2014B” presentation is investigated. The module belongs to the “Science, Technology, Engineering and Mathematics” category. In total, 1500 students were enrolled in the module, but 123 students dropped out of the module before starting day, i.e., 0, so they were filtered out. Moreover, all VLE log entries that were recorded before the start of the course were filtered out. There is a log of the learner’s activities associated with every enrolment which includes watching lecture videos, responding to course problems, submitting assessments, accessing modules, discussing in forums, etc. The module has 685,274 VLE interactions with 475 learning activities, and its duration is 241 days.
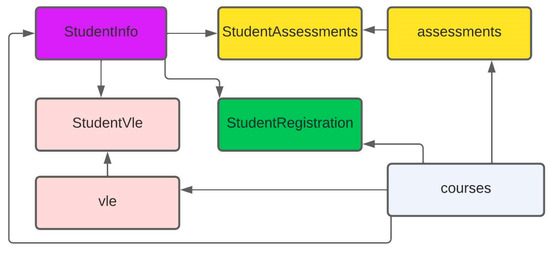
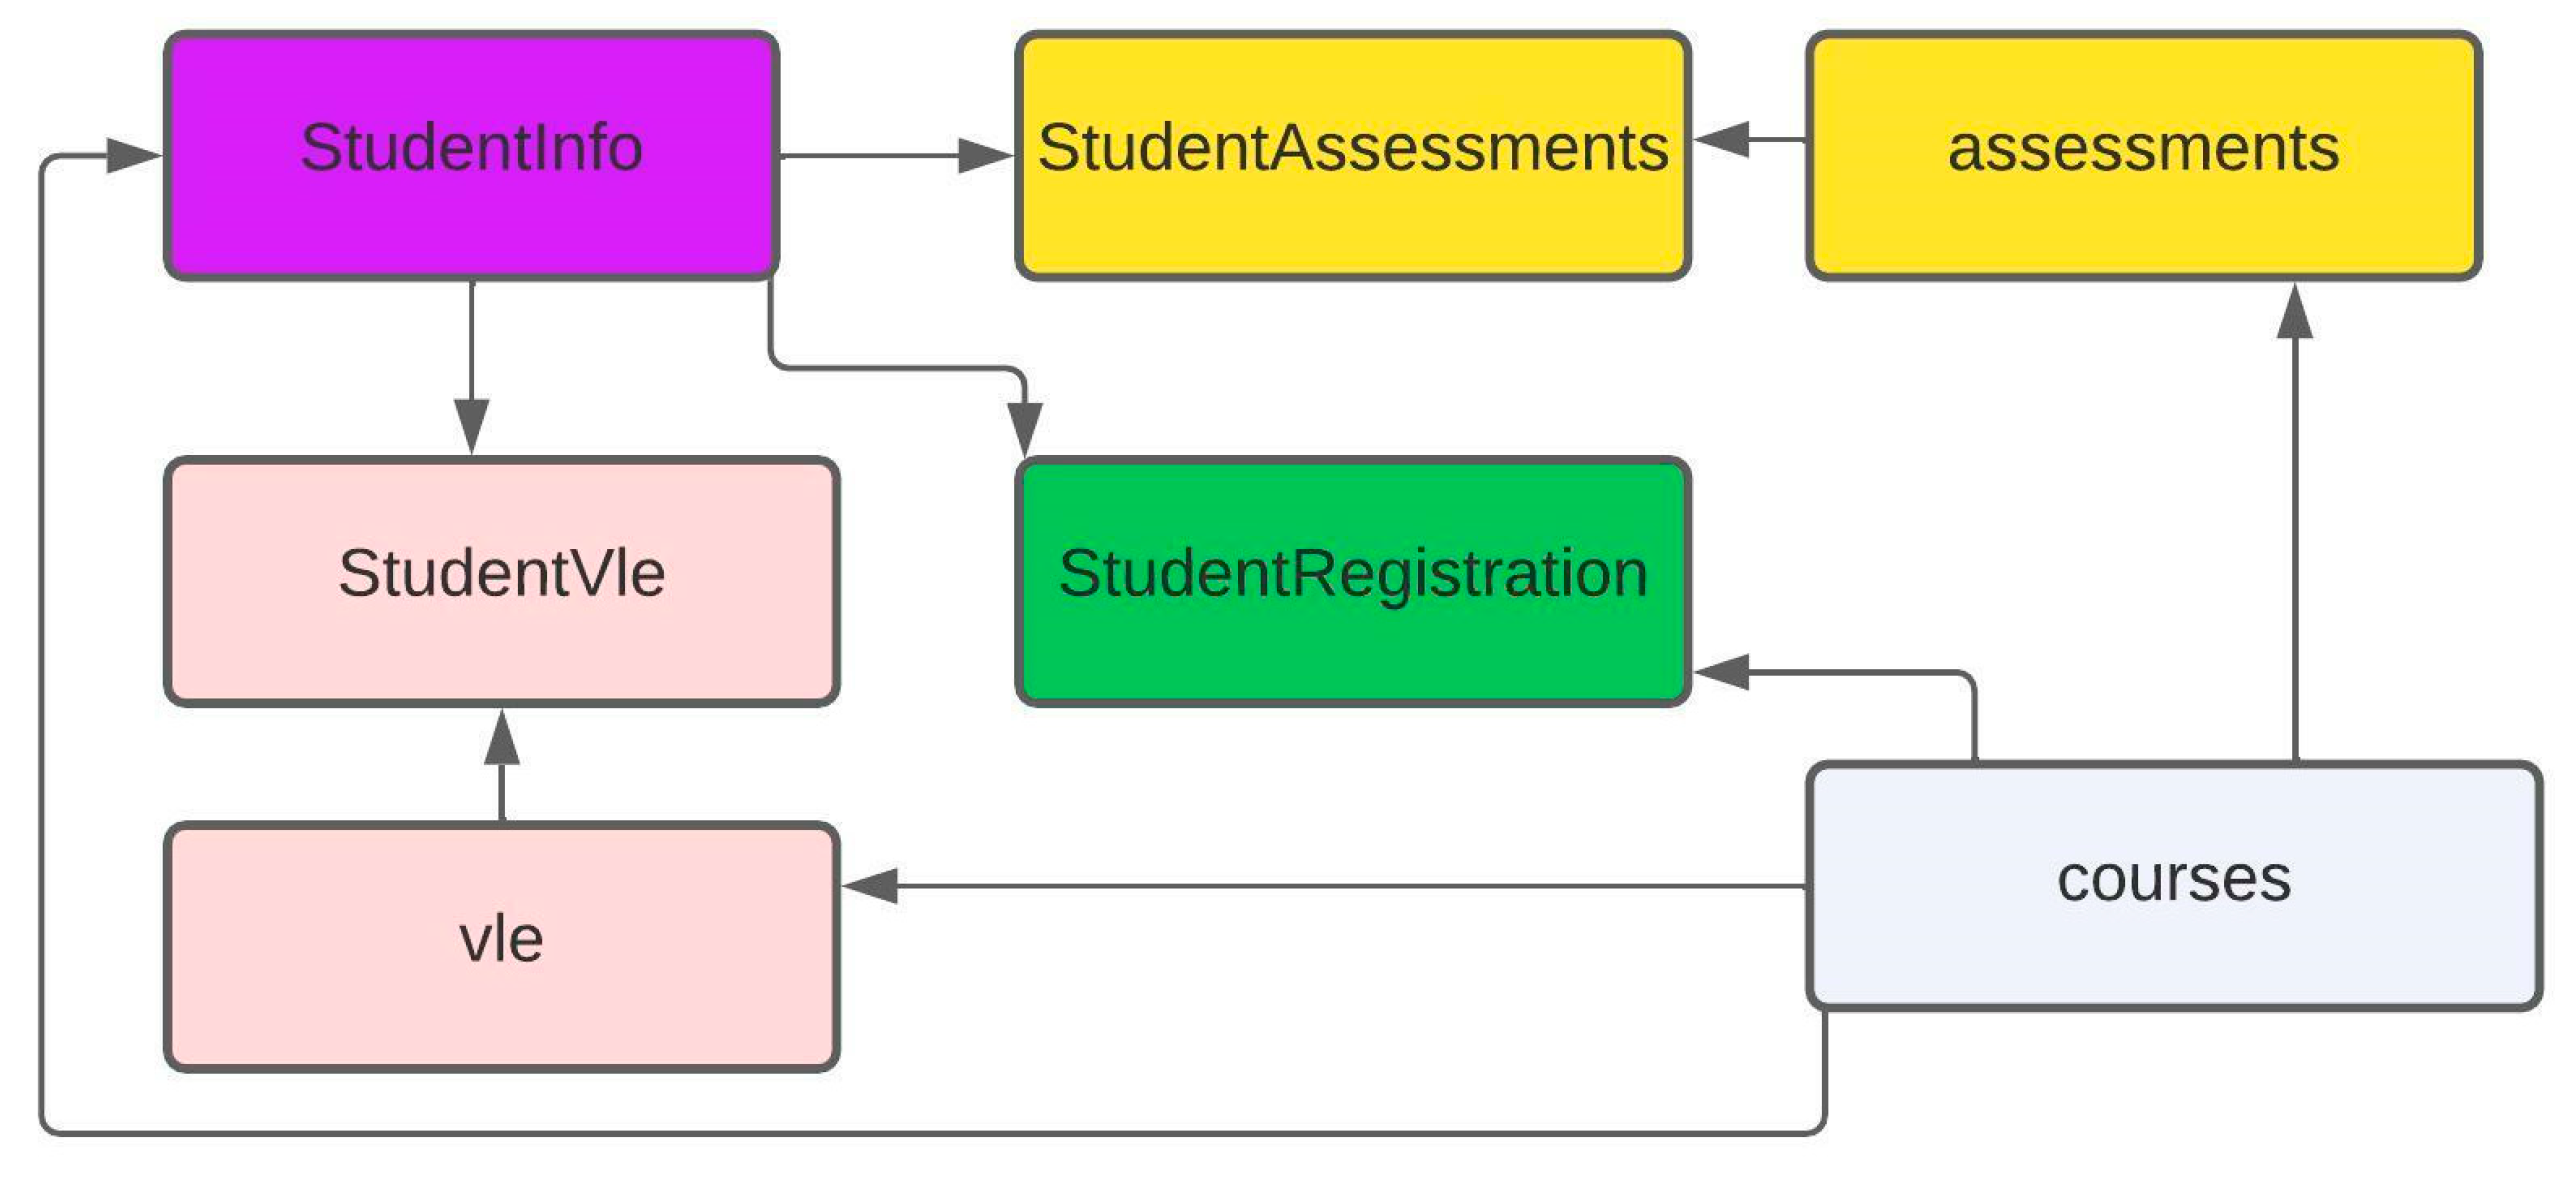
In Figure 1, StudentInfo refers to the table of demographic features that are considered in this study. The demographic characteristics are:
Figure 1.
OU dataset structure.
- Gender: student’s gender.
- Age band: student age; the values are 0–35, 35–55, and 55≤.
- Highest education level: the student’s highest education level on entry: “A Level or Equivalent”, “HE Qualification”, “Lower Than A Level”, “No Formal quals”, and “Post Graduate Qualification”.
- Region: geographic territory where the student lived when they took the module.
- Number of previous attempts: number of times the student had attempted the module before.
- Studied credits: total credits for all modules that the student is studying currently.
- IMD band: indicates multiple deprivation index of the student’s residence.
- Disability: disability status, yes or no.
4.2. Data Preprocessing and Transformation
OULA dataset cannot be used directly as inputs to machine learning techniques. There are seven different CSV files containing information about students’ demographics, assessment scores, and interactions with the VLEs as shown in Figure 1. Using Python and Pandas, the dataset was transformed from relational database tables to tabular structure data representing the desired engagement metrics. We transferred the data in a form in which the index of a row represents a student ID and each column represents a student feature. There are two types of features: interaction features (number of clicks) with a specific website, and performance features (assessment scores). Each interaction column is an activity type, and it represents total click numbers in all learning sites that belong to the activity in the log files. The module under study includes 15 activities such as page, glossary, forum, etc. For performance features, the module had three types of assessments, namely: Tutor Marked Assessment (TMA), Computer Marked Assessment (CMA), and Final Exam (Exam). There are five TMA assessments that were due on different days, and one final exam that was on the final day. In this study, CMA assessments were not considered because they have 0 weights, and exam was also not considered. Table 1 presents the newly calculated data features in this study in addition to their descriptions. All the new features are of type Numeric.
Table 1.
New dataset transformed features.
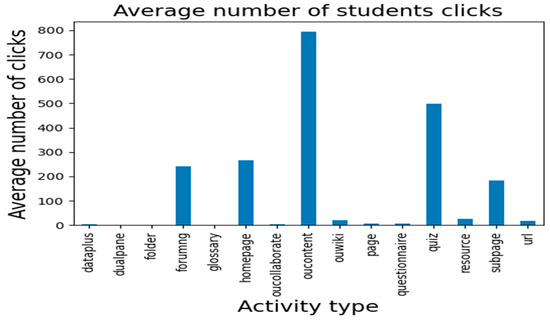
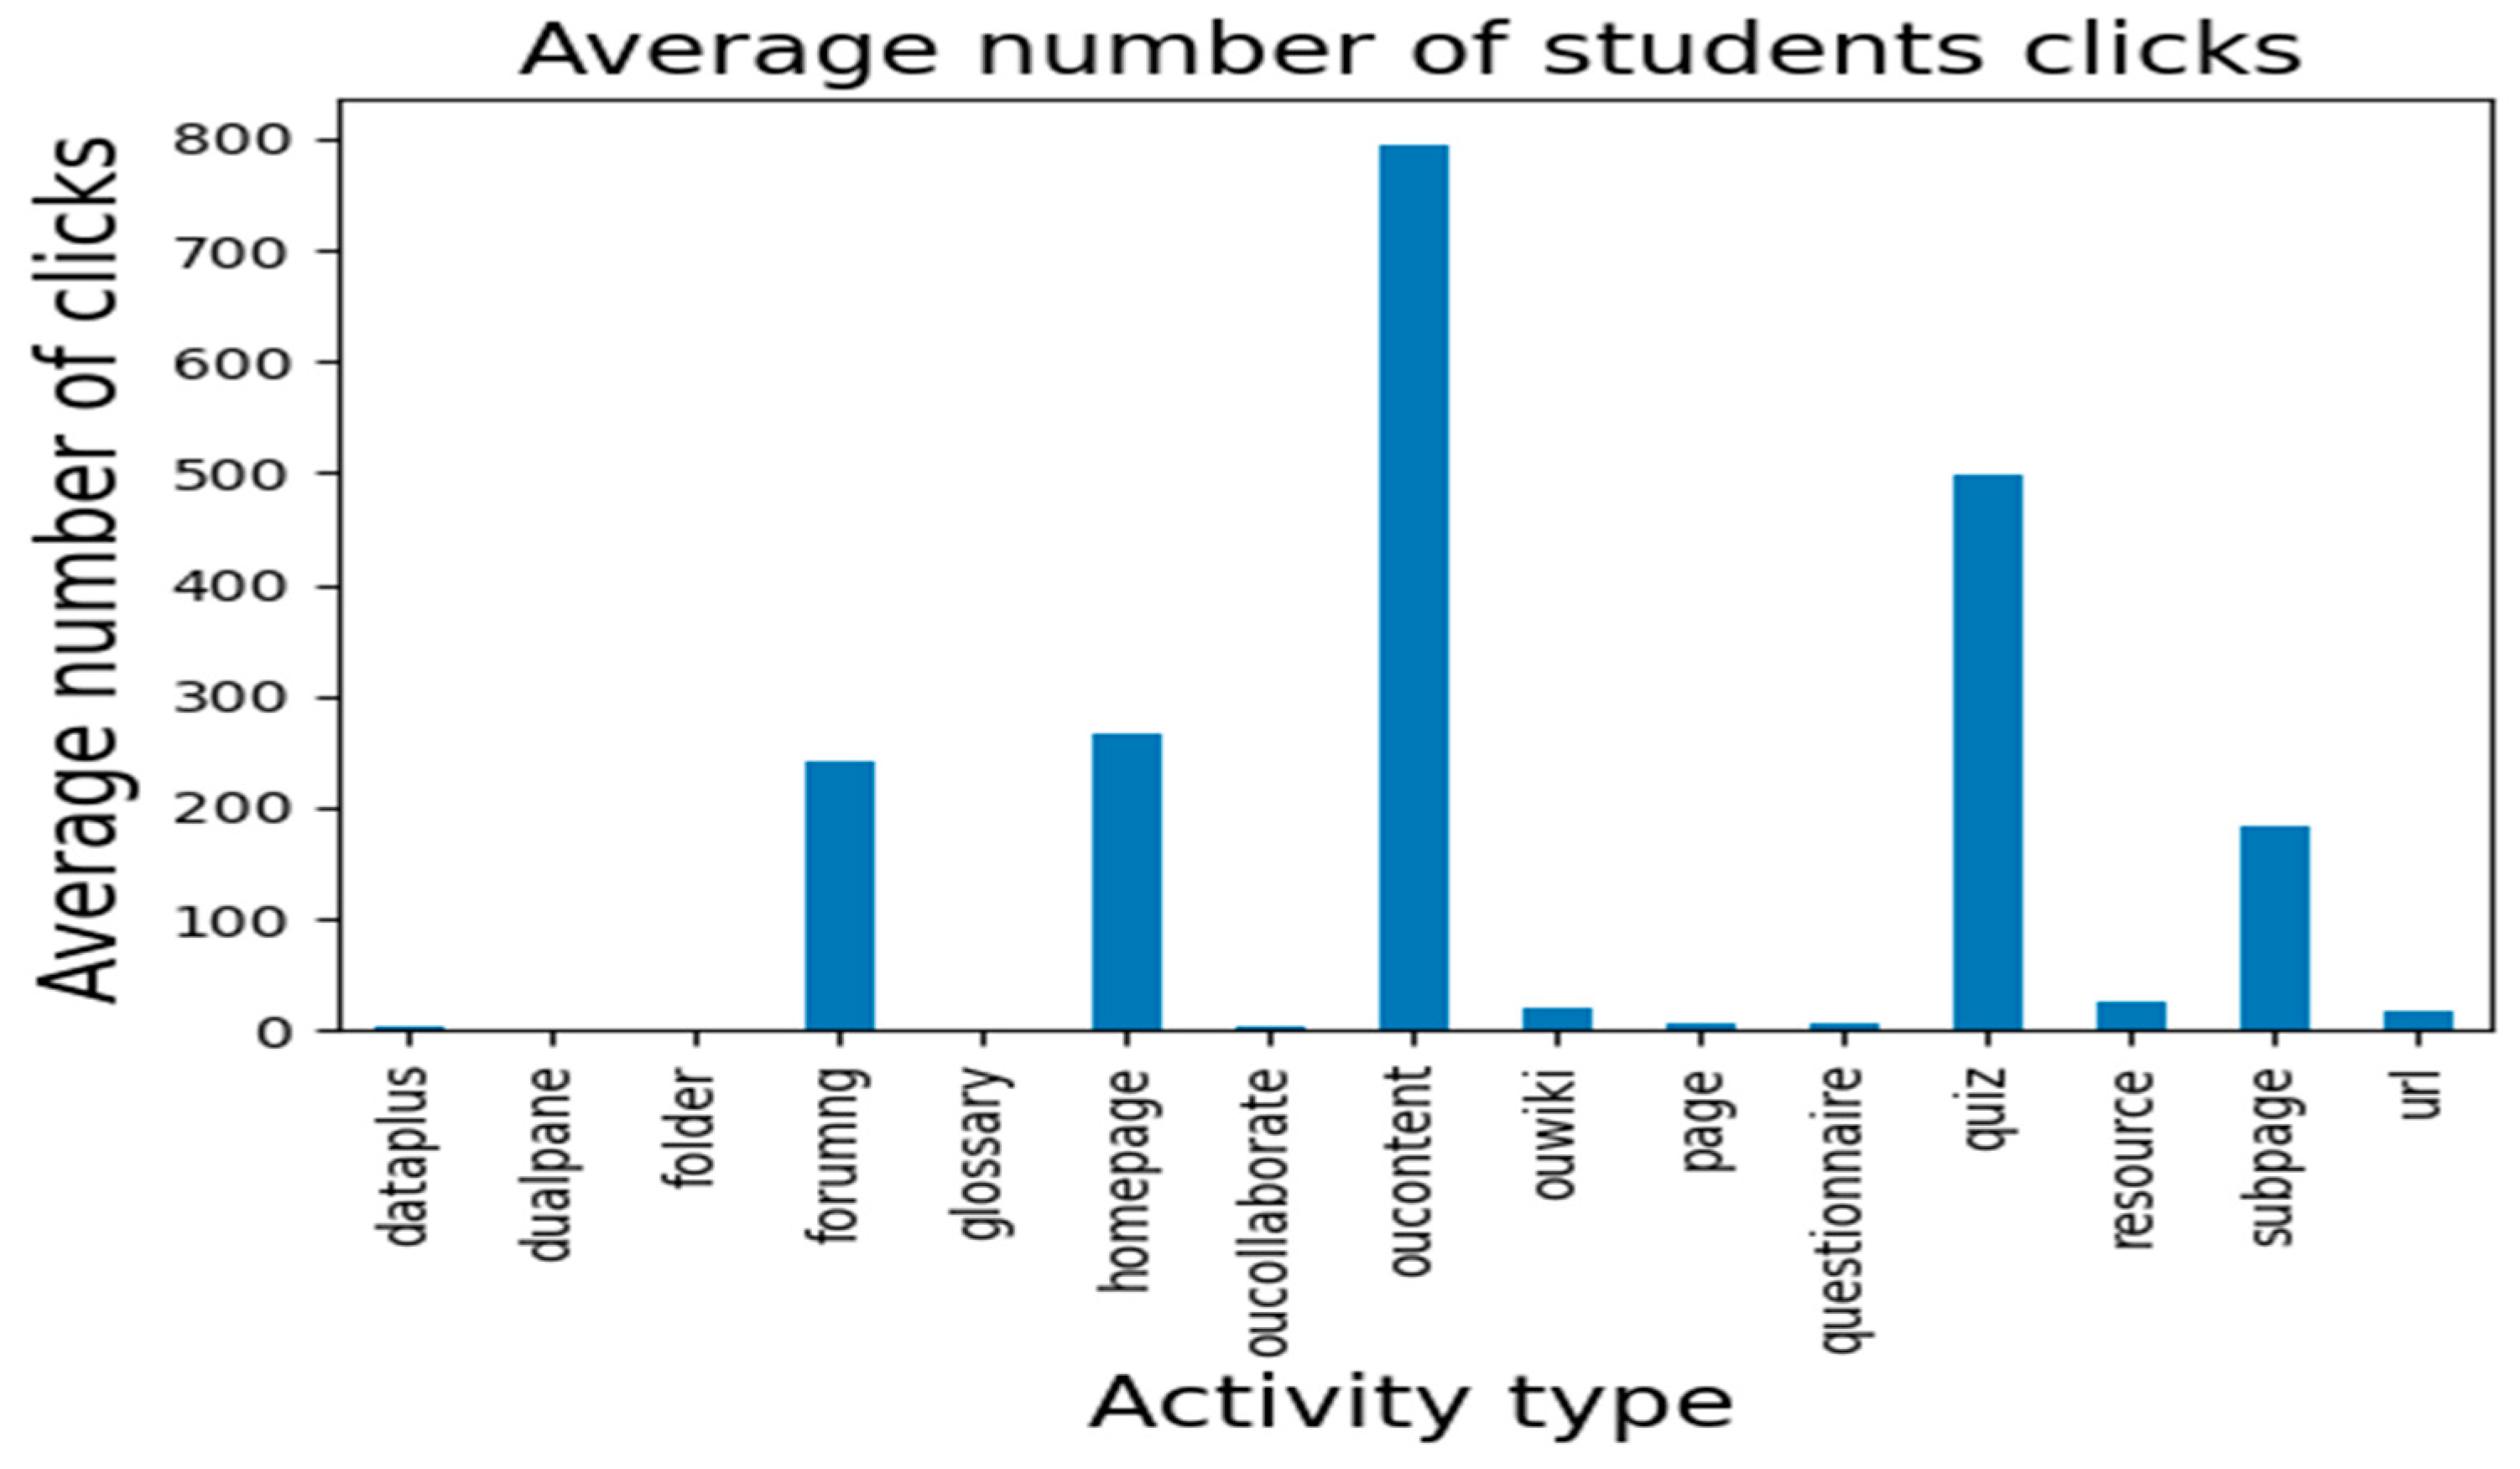
To illustrate the importance of the behavioral features (total click per activity type) in predicting engagement levels, they are visualized in Figure 2, and accordingly, only forumng, oucontent, homepage, quiz, and subpage are considered for further analysis.
Figure 2.
Student logins mean for each course activity.
4.3. Modelling
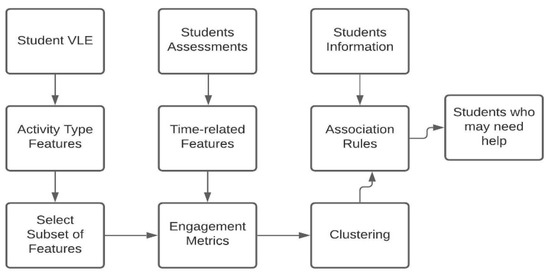
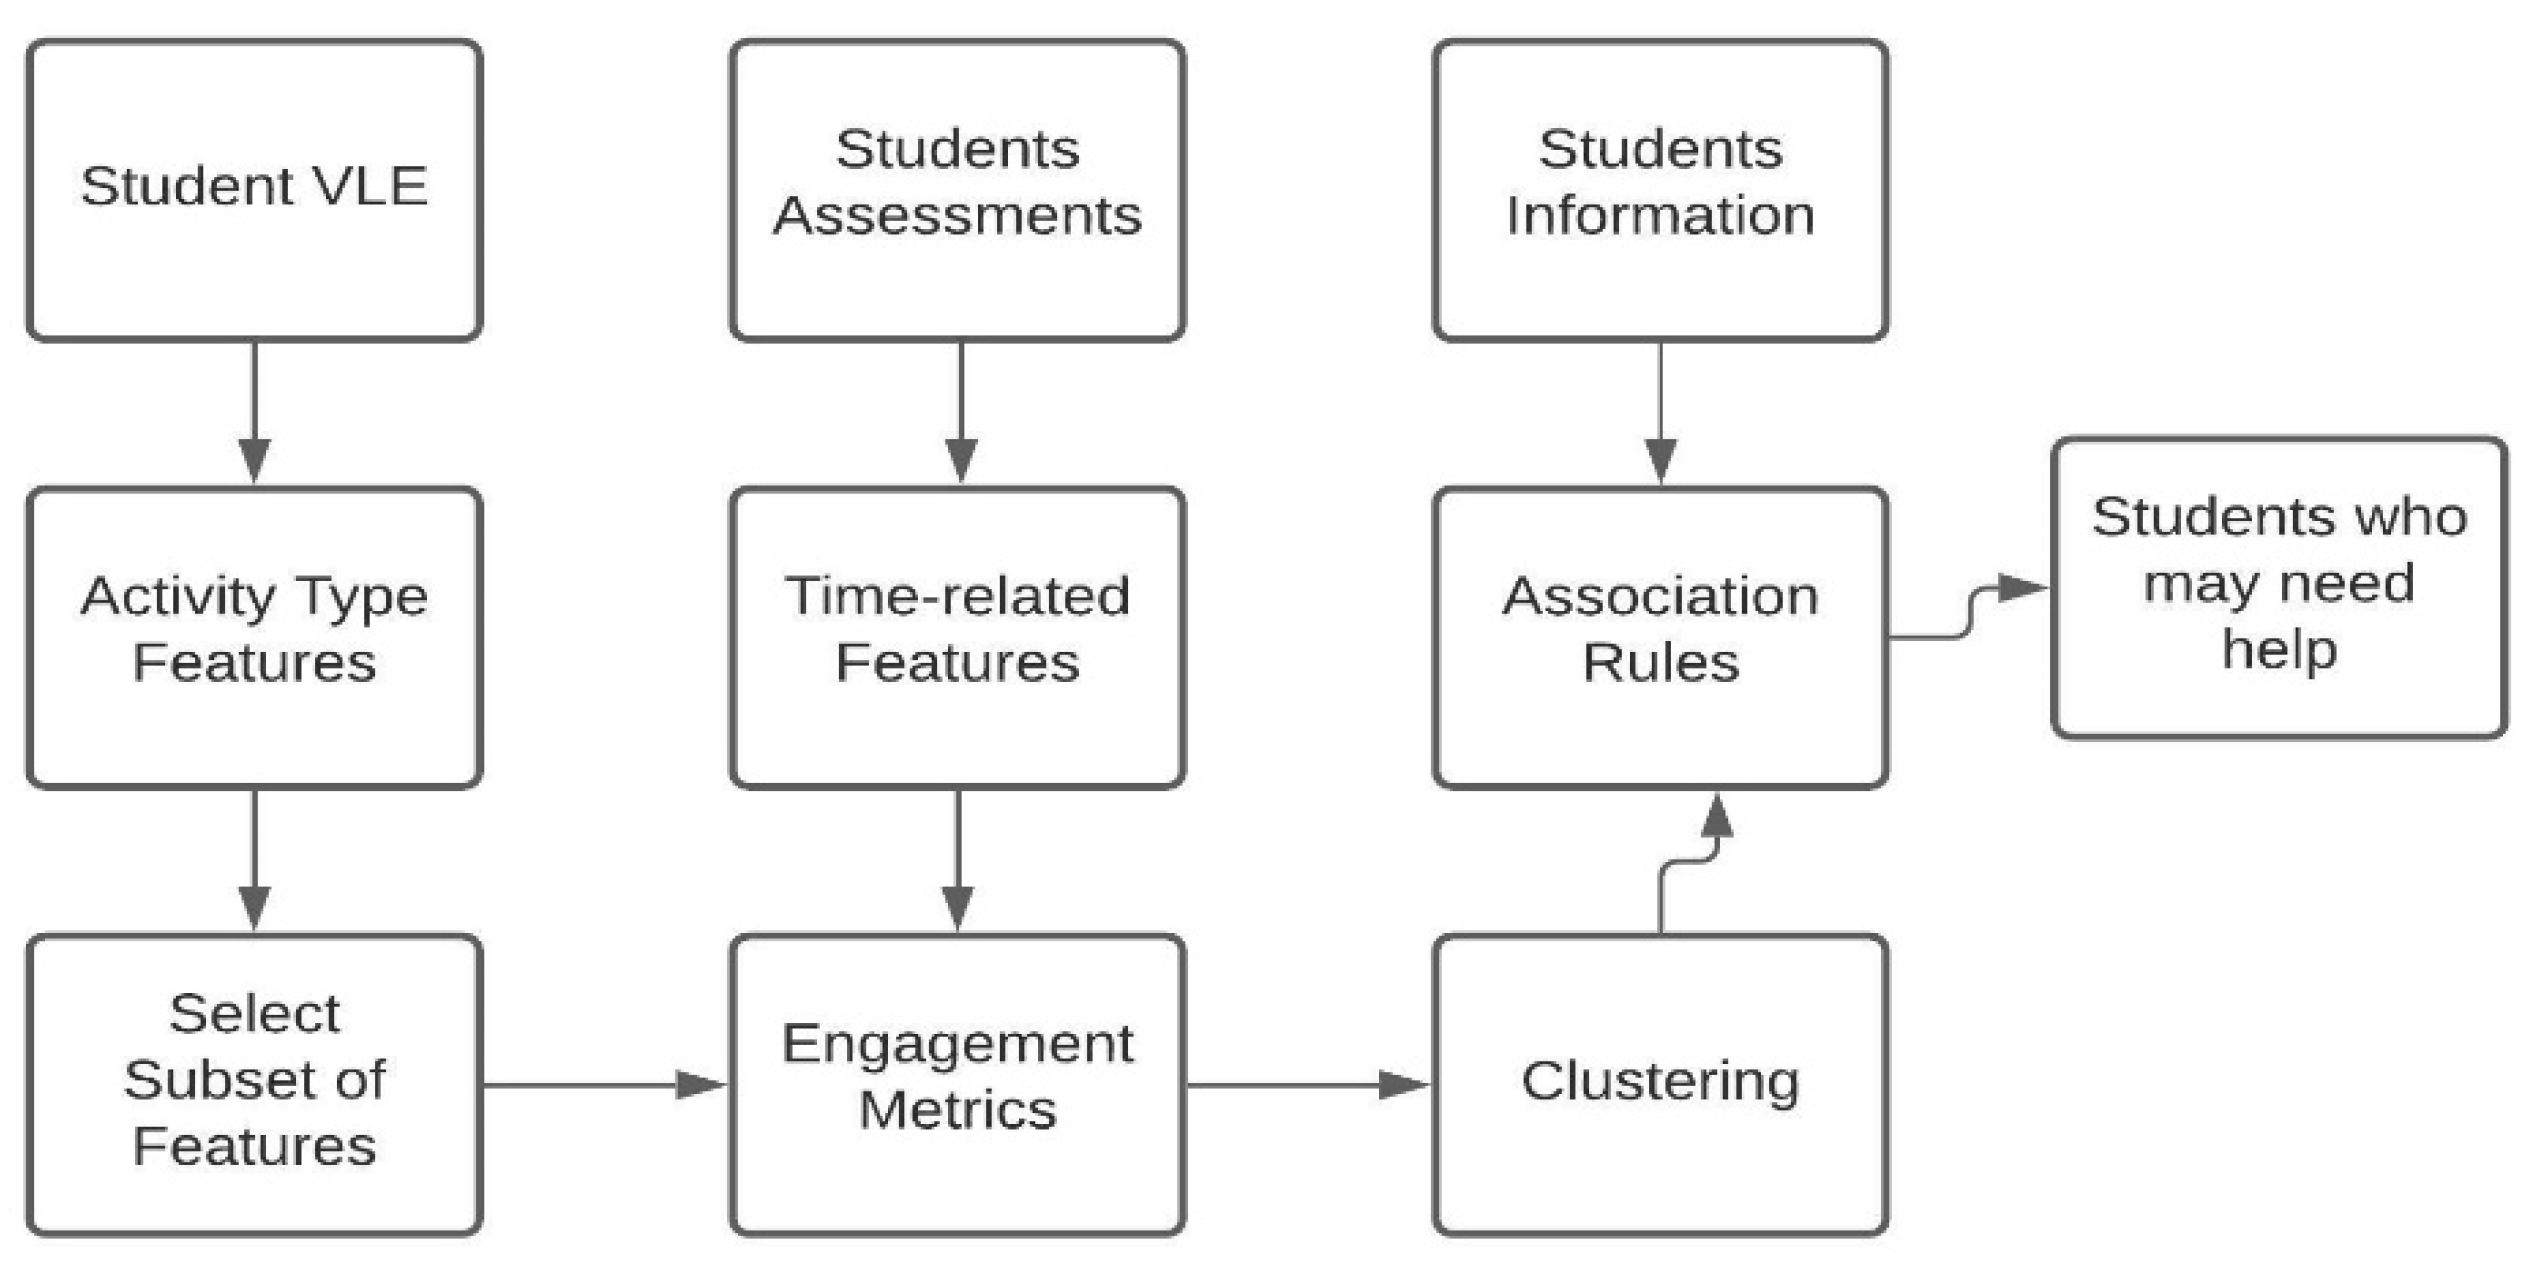
The final transformed data are provided as input to K-means algorithm. K-means was run using k values 2, 3, and 5. The algorithm maximum iteration was set to 25. The details about association rules, minimum support, and confidence values will be provided in the next sections. Figure 3 illustrates the predictive model followed in this study. The model can be integrated in the OU system to identify students who may need help.
Figure 3.
Proposed VLE analytical model.
4.4. Evaluation
In this study, the silhouette coefficient is used as a metric to evaluate clustering. This can be used to determine if clusters are properly separated and do not overlap. In order to find better-defined clusters, it calculates the mean distance between data points. The appropriate clustering configuration values are in the range: (−1 to 1); 1 means perfect separated clusters and −1 means intertwined clusters.
5. Results and Discussion and Limitations
This section explains the obtained results and answers the research questions.
5.1. Engagement Level Model
To choose an appropriate engagement level for this study, K-means algorithm was run with k values equal to 2, 3, and 5 to create three engagement models. To choose the best model, models were compared based on Silhouette scores: 0.555 for two-level model, 0.502 for three-level, and 0.446 for five-level. Since the two-level model was higher, it was considered here. Table 2 shows two-level clustering model centroids, the best model. Highly engaged students exhibit higher interaction rates and lower latency times. This is expected because engaged students tend to access module sites often and participate more. However, for TMA assessments that were due on 129 and 171 days, it seems they did not submit assignments earlier as expected to stay up to date with the requirements and not fall behind. The main reason for this is that OU did not assign penalties for late submissions, so they took their time to submit the assessments. It can be seen that a number of interaction-based metrics are more representative of students’ engagement because the two clusters have totally different values. Furthermore, a 5% significance level t-test was performed to determine if the clusters were statistically different. T-test results showed that the two clusters are statistically different in 9 out of 10 features. ‘
Table 2.
Best clustering model centroids.
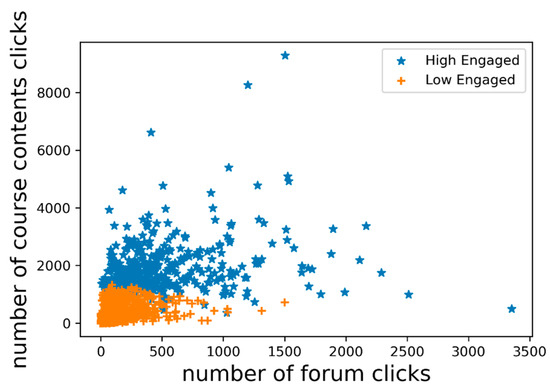
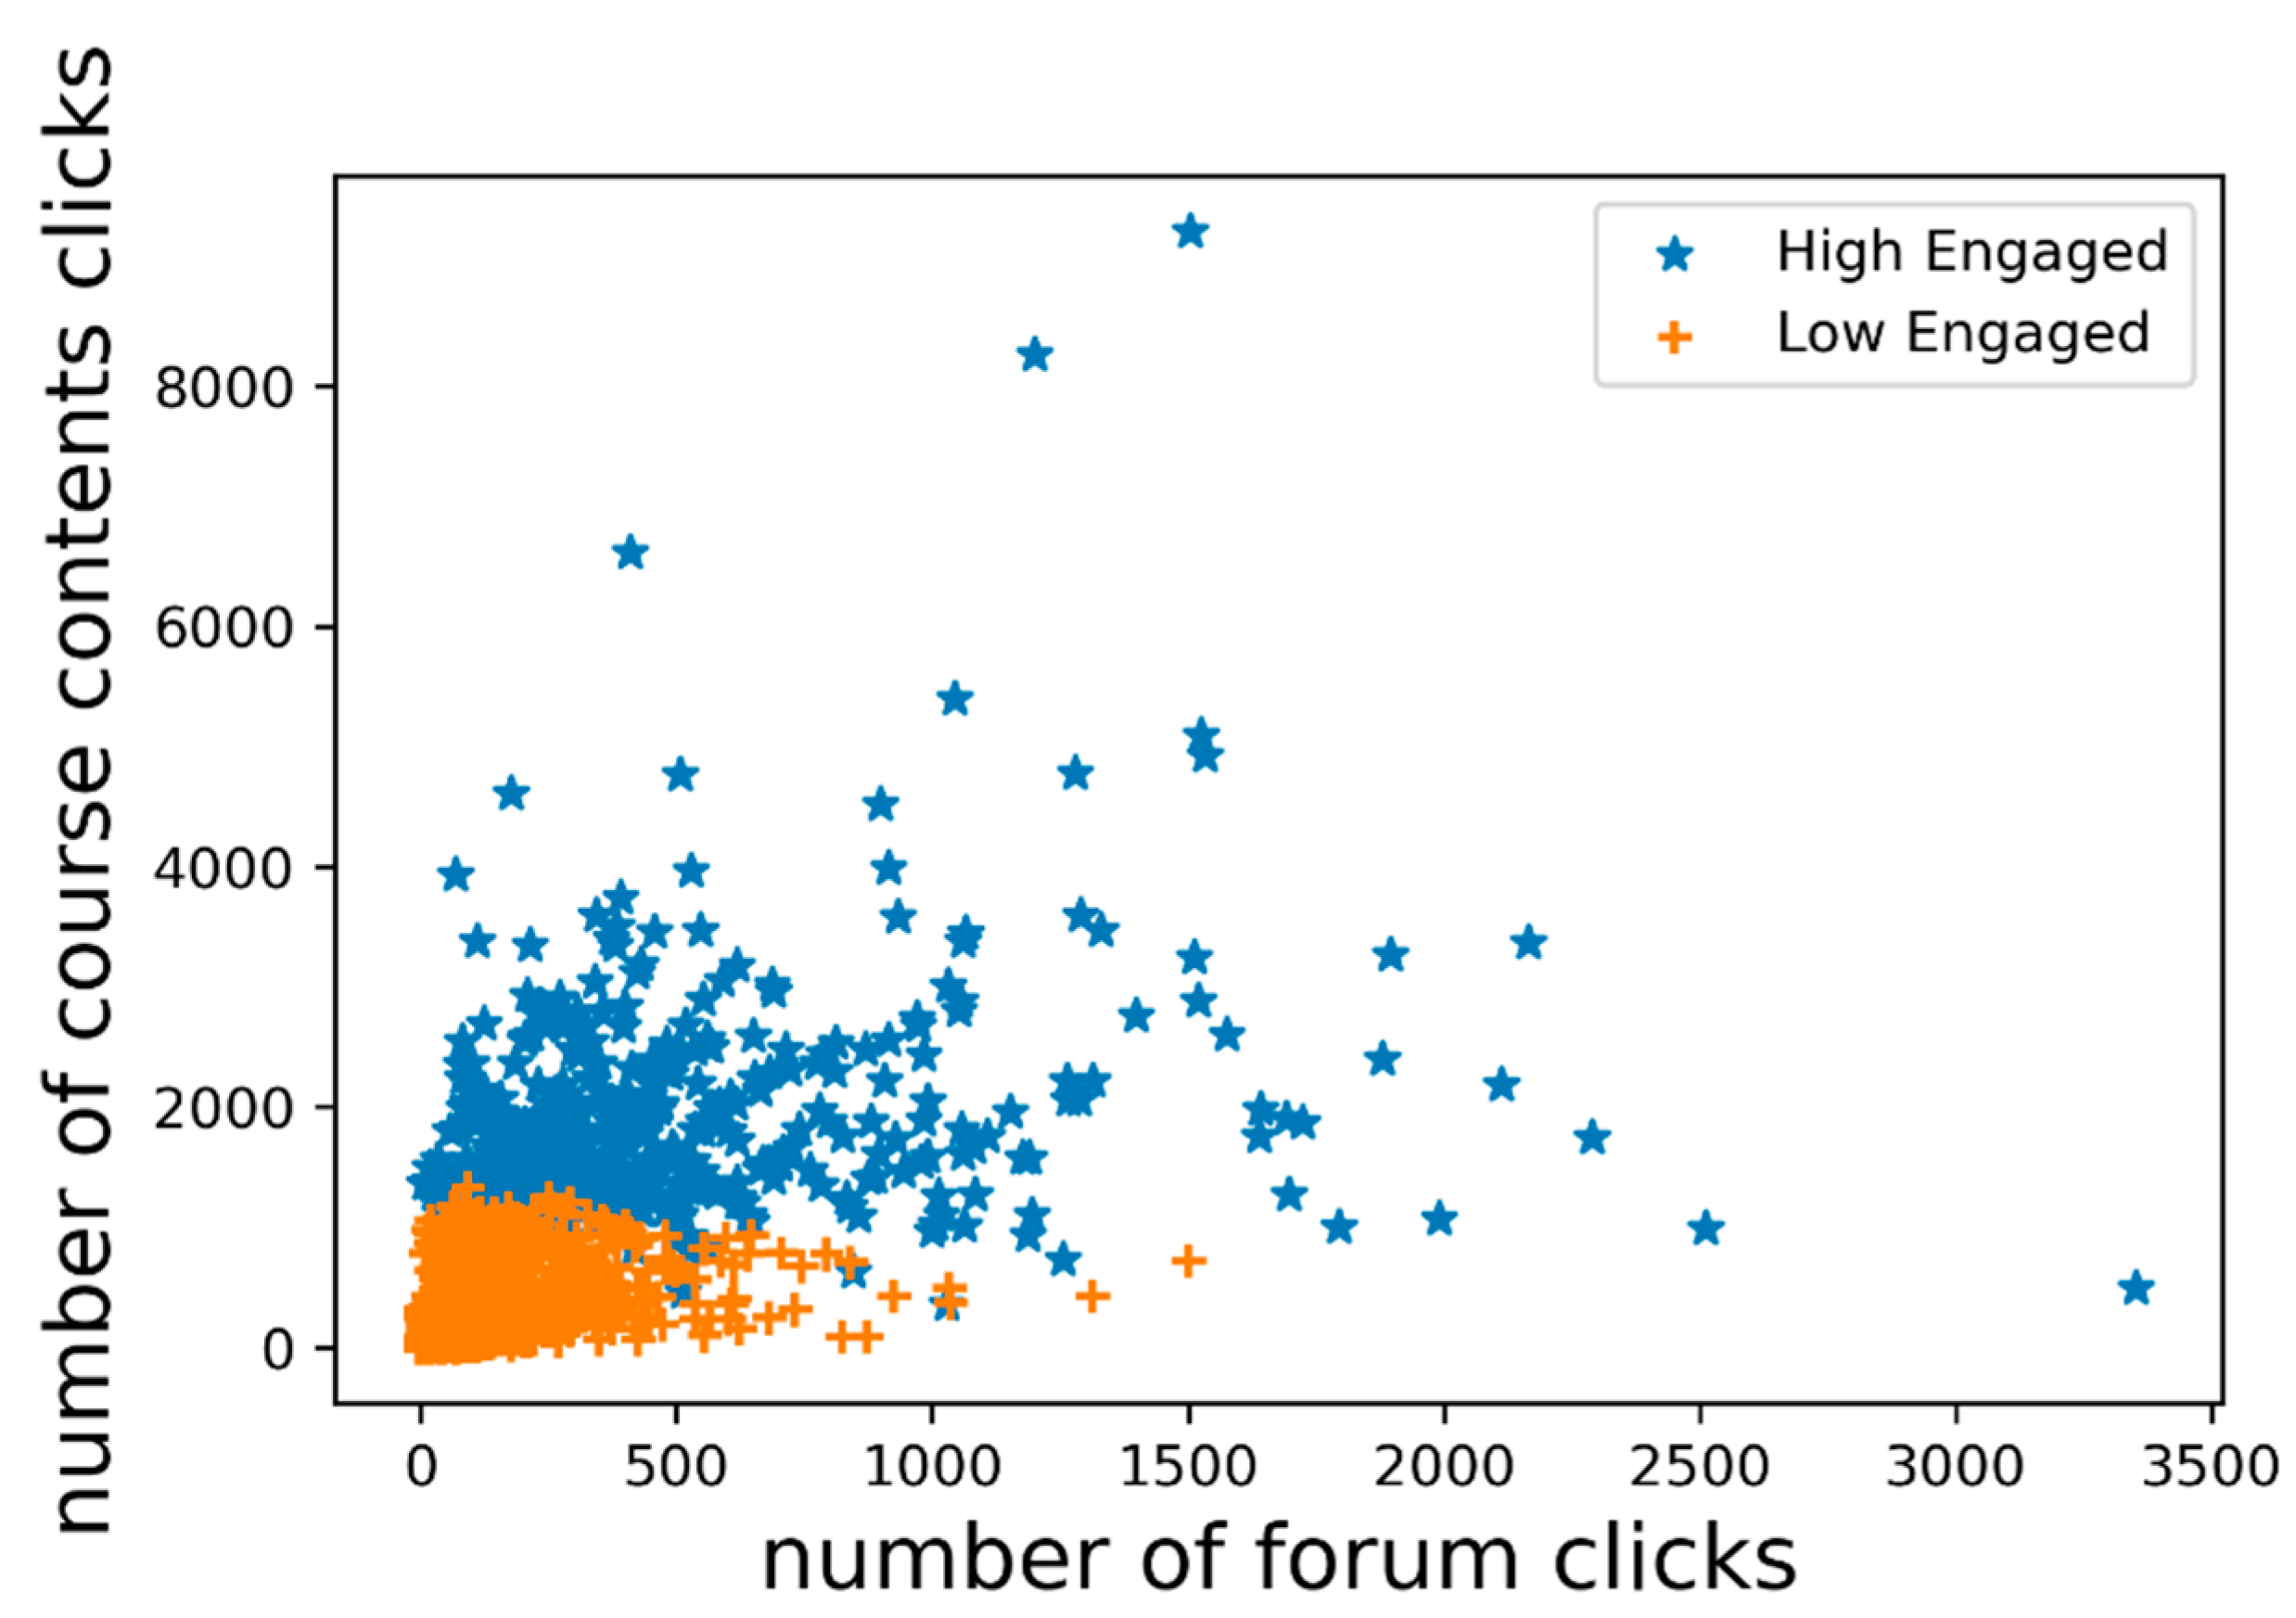
To further emphasize the results of the two-level model, Figure 4 plots the number of clicks on discussion topics in the module and the total clicks on module contents. As shown, students who are highly engaged had higher clicks on course activities. However, forum interaction seems to be similar for both clusters. This means students tend to participate less in the discussion forums.
Figure 4.
Forum interaction vs. course content interaction for two-level engagement model.
5.2. Demographics and Engagement Relation
In this study, a minimum support of 0.1 was used. This means the rule would be considered if it has appeared at least 10% of the time, in order to generate the association rules. For confidence, the minimum value used was 0.9, i.e., to ensure the rule is appropriate. These values were not chosen arbitrarily but to ensure there are frequent rules that are interesting enough to be used in educational settings [24].
- Studied credits = 60 & Disability = N & Number of previous attempts = 0 → Engagement level = H:
This rule had a support = 0.17. This means 17% of the students that were categorized as highly engaged had 60 as studied credits, N as disability, 0 previous attempts. The rule’s confidence was 0.95 and its lift was 1.17. This means 95% of students with the above-mentioned values were highly engaged. The lift value shows there is a positive correlation between the antecedent and consequent of the rule.
- Disability = N & Studied credits = 60 & Age band = 0–35 & Number of previous attempts = 0 → Engagement level = H:
This rule had a support = 0.11. This means 11% of the students that were categorized as highly engaged had “Lower Than A Level” as highest education, 60 as studied credits, and the maximum range of their ages was 35. The rule’s confidence was 0.95 and its lift was 1.16. This implies 95% of students with the above-mentioned values were highly engaged. The lift value also shows there is a positive correlation between the antecedent and consequent of the rule.
- Studied credits = 60 & Gender = Male & Number of previous attempts = 0 → Engagement level = H:
This rule includes gender with value of male. Its values are 0.15 support, 0.95 confidence, and 1.16 lift. It also shows a positive correlation.
- Number of previous attempts = 0 & Disability = N & education = A Level or Equivalent→Engagement level = H:
This rule had a support of 0.11, confidence of 0.92, and lift of 1.02.
The single-item rules were filtered out in addition to those rules with confidence values less than 0.9. The most frequently appearing features in the rules are gender with value of “Male”, highest education with value “A Level or Equivalent”, studied credits with value of 60, disability with value of “N”, and number of previous attempts with value of 0. Hence, these features are more correlated with engagement. On the other hand, students with highest education value as “Lower Than A Level”, and 60 as number of studied credits were less engaged, with lift value of 1.14. Another rule with 1.14 lift categorized less engaged students if they had same values above and age range as 0–35. As a result, these attributes of those values can be used as predictors of students that may need help based on their course engagement.
5.3. Limitations
The log data do not include information about navigation from one site to another, so it is not possible to measure the time a student spent on the module sites accurately. Having no penalty for late task submission made it difficult to include the average time to submit an assessment as a feature which would be useful for interpreting the results of engagement models (i.e., two, three, and five).
6. Conclusions
Abundance of technology has led to popularity of online education. However, it is a big challenge to keep learners engaged and motivated because they can often feel isolated and disconnected. This paper investigated engagement metrics and levels in distance-based education. Student clickstream density and on-time submission were calculated and combined to form a new dataset composed of 10 features. After determining the best engagement model for the dataset using Silhouette coefficient (two-level clustering model), we also explored the association between demographics and engagement level. The demographics studied were gender, region, highest education, indices of multiple deprivation (IMD), age band, number of previous attempts of the course, studied credits number, and disability. The results link gender, highest education, studied credits, and number of previous attempts with high engagement levels. This means these characteristics can be used as predictors of student engagement. At the same time, some values of these features are indicators of less engaged students, especially when they appear together in the rule such as “Lower Than A Level” for highest education, 60 for student credits, and 0–35 for age band. Hence, this can be used to identify the unengaged students that may need help with the course. Consequently, such characteristics should be controlled during a module.
Even though the methodology of this study does not provide a way to determine the quality of engagement in distance learning environments, it can provide a basis for identifying unengaged students through their online behaviors. By relying on these cues as a guide to identify students who are disengaged, instructors will have the opportunity to communicate directly with these students on an individual basis to discuss any possible issues that might harm their performance or lower their motivation.
Several ideas can be explored as future work. It would be beneficial to also collect and consider the average time per session, as well as the time spent on the course, as a measure of the students’ engagement. Ideally, OU’s VLE should record the timespans for when students log in to the module and when they log out. This would also make it easier for instructors to identify unengaged students earlier instead of waiting until much later in the course. Another direction is to investigate the impact of provided engagement metrics on the student performance. It may be helpful to further investigate the relationship between the metrics and grades that students receive in order to obtain a clearer understanding of the effects of each metric on overall student performance. Moreover, the K-prototype algorithm can be used as a student engagement model since it works with mixed data types for comparisons with K-means models [25,26].
Author Contributions
Conceptualization, M.J.; methodology, M.J.; software, M.J.; validation, M.J.; formal analysis, M.J.; investigation, M.J.; resources, M.J.; data curation, M.J.; writing—original draft preparation, M.J.; writing—review and editing, V.S. and V.S.; visualization, M.J.; supervision, V.S.; All authors have read and agreed to the published version of the manuscript.
Funding
This work was supported by Stipendium Hungaricum education scholarship programme of the Hungarian Government.
Data Availability Statement
Kuzilek, J.; Hlosta, M.; Zdrahal, Z. Open university learning analytics dataset; https://analyse.kmi.open.ac.uk/open_dataset; https://doi.org/10.1038/sdata.2017.171 (accessed on 25 February 2022).
Conflicts of Interest
The authors declare no conflict of interest.
References
- Tan, M.; Shao, P. Prediction of Student Dropout in E-Learning Program Through the Use of Machine Learning Method. Int. J. Emerg. Technol. Learn. 2015, 10, 11–17. [Google Scholar] [CrossRef] [Scilit]
- OECD. Education at a Glance 2014: OECD Indicators; OECD Publishing: Paris, France, 2014. [Google Scholar] [CrossRef] [Scilit]
- eLearning Industry. Available online: https://elearningindustry.com/e-learning-challenges-and-solutions (accessed on 3 February 2022).
- Handelsman, M.; Briggs, W.; Sullivan, N.; Towler, A. A Measure of College Student Course Engagement. J. Educ. Res. 2005, 98, 184–192. [Google Scholar] [CrossRef] [Scilit]
- Wang, M.; Eccles, J. School context, achievement motivation, and academic engagement: A longitudinal study of school engagement using a multidimensional perspective. J. Learn. Instr. 2013, 28, 12–23. [Google Scholar] [CrossRef] [Scilit]
- Kori, K.; Pedaste, M.; Altin, H.; Tõnisson, E.; Palts, T. Factors that influence students’ motivation to start and to continue studying information technology in Estonia. IEEE Trans. Educ. 2016, 59, 255–262. [Google Scholar] [CrossRef] [Scilit]
- Kaur, G.; Singh, W. Prediction of Student Performance Using Weka Tool. Int. J. Eng. Sci. 2016, 17, 8–16. [Google Scholar]
- Sisman-Ugur, S.; Kurubacak, G. Handbook of Research on Learning in the Age of Transhumanism, 1st ed.; IGI Global: Hershy, PA, USA, 2019. [Google Scholar]
- Piatetsky-Shapiro, G. Discovery, analysis, and presentation of strong rules. Knowl. Discov. Databases 1991, 248, 229–238. [Google Scholar]
- Tan, P.; Steinbach, M.; Karpate, A.; Kumar, V. Introduction to Data Mining, 2nd ed.; Pearson: New York, NY, USA, 2018. [Google Scholar]
- Agrawal, R.; Imielinski, T.; Swami, A. Mining association rules’ between sets of items in large databases. In Proceedings of the 1993 ACM SIGMOD International Conference on Management of Data, Washington, DC, USA, 1 June 1993. [Google Scholar] [CrossRef] [Scilit]
- Agrawal, R.; Srikant, R. Fast algorithms for mining association rules. In Proceedings of the 20th International Conference on Very Large Data Bases, San Francisco, CA, USA, 12 September 1994. [Google Scholar]
- Xie, T.; Liu, R.; Wei, Z. Improvement of the Fast Clustering Algorithm Improved by-Means in the Big Data. Appl. Math. Nonlinear Sci. 2020, 5, 1–10. [Google Scholar] [CrossRef] [Scilit]
- Oriogun, P. Towards understanding online learning levels of engagement using the SQUAD approach to CMC discourse. Australas. J. Educ. Technol. 2003, 19, 371–387. [Google Scholar] [CrossRef] [Scilit]
- Kamath, A.; Biswas, A.; Balasubramanian, V. A crowdsourced approach to student engagement recognition in e-learning environments. In Proceedings of the 2016 IEEE Winter Conference on Applications of Computer Vision, Lake Placid, NY, USA, 26 May 2016. [Google Scholar]
- Schlechty, P.C. Engaging Students: The Next Level of Working on the Work, 1st ed.; John Wiley & Sons: Hoboken, NJ, USA, 2011; pp. 3–13. [Google Scholar]
- Reid, L. Redesigning a Large Lecture Course for Student Engagement: Process and Outcomes. Can. J. Scholarsh. Teach. Learn. 2012, 3. [Google Scholar] [CrossRef] [Scilit]
- Koster, A.; Primo, T.; Oliveira, A.; Koch, F. Toward measuring student engagement: A data-driven approach. In Proceedings of the 13th International Conference on Intelligent Tutoring Systems, Zagreb, Croatia, 7–10 June 2016. [Google Scholar]
- Ramesh, A.; Goldwasser, D.; Huang, B.; Daumé, H., III; Getoor, L. Modeling learner engagement in MOOCs using probabilistic soft logic. In Proceedings of the NIPS Workshop on Data Driven Education, Lake Tahoe, NV, USA, 9–10 December 2013. [Google Scholar]
- Sontam, V.; Gabriel, G. Student engagement at a large suburban community college: Gender and race differences. Community Coll. J. Res. Pract. 2012, 36, 808–820. [Google Scholar] [CrossRef] [Scilit]
- Greene, T.G.; Marti, C.N.; McClenney, K. The effort—Outcome gap: Differences for African American and Hispanic community college students in student engagement and academic achievement. J. High. Educ. 2008, 79, 513–539. [Google Scholar] [CrossRef] [Scilit]
- Beer, C. Online Student Engagement: New Measures for New Methods. Master’s Dissertation, CQ University, Rockhampton, QLD, Australia, 2010. Unpublished work. [Google Scholar]
- Kuzilek, J.; Hlosta, M.; Zdrahal, Z. Open university learning analytics dataset. Sci. Data 2017, 4, 1–8. [Google Scholar] [CrossRef] [Scilit] [PubMed]
- Ougiaroglou, S.; Paschalis, G. Association rules mining from the educational data of ESOG web-based application. In Proceedings of the IFIP International Conference on Artificial Intelligence Applications and Innovations, Heidelberg/Berlin, Germany, 27 September 2012. [Google Scholar]
- Jawthari, M.; Stoffová, V. Predicting students’ academic performance using a modified kNN algorithm. Pollack Period. 2021, 16, 20–26. [Google Scholar] [CrossRef] [Scilit]
- Madhuri, R.; Murty, M.R.; Murthy, J.V.R.; Reddy, P.V.G.D.; Satapathy, S.C. Cluster analysis on different data sets using K-modes and K-prototype algorithms. In ICT and Critical Infrastructure. In Proceedings of the 48th Annual Convention of Computer Society of India, Visakhapatnam, India, 13–15 December 2013. [Google Scholar]

Publisher’s Note: MDPI stays neutral with regard to jurisdictional claims in published maps and institutional affiliations. |
© 2022 by the authors. Licensee MDPI, Basel, Switzerland. This article is an open access article distributed under the terms and conditions of the Creative Commons Attribution (CC BY) license (https://creativecommons.org/licenses/by/4.0/).