


Abstract
This study optimized a Thai herbal blend inhibiting tyrosinase and evaluated its delivery in niosomal serum versus a corresponding non-niosomal (free extract) serum. The physicochemical properties, antioxidant and tyrosinase-inhibitory activities, stability, and clinical effects of the two serums were assessed in an 8-week study in healthy volunteers. Herbal combinations were screened using a two-level, five-factor design with tyrosinase inhibition as the response, and the optimized extract ratio (3:2:3:2:2, w/w) was incorporated into conventional, liposomal, and niosomal formulations. Vesicle characterization and in vitro performance supported the niosomal serum for clinical comparison with the corresponding non-niosomal product. The niosomal serum showed appreciable DPPH radical-scavenging activity (IC50 32 mg/mL), whereas the conventional serum exhibited the highest tyrosinase inhibition (IC50 8.3 mg/mL). Clinically, 30 of 50 randomized volunteers completed the 8-week trial and were included in the efficacy analysis. The niosomal serum produced more consistent improvements in skin hydration and transepidermal water loss, with significant benefits over the non-niosomal (free extract) serum at selected mid-to-late time points. Erythema decreased significantly with both formulations, whereas melanin reduction was modest. These findings support the use of niosomal formulations containing combined Thai herbal extracts as a practical strategy to enhance moisturization and barrier support in skincare formulations.
1. Introduction
Thailand is located on the Indochina Peninsula in Southeast Asia. It has a tropical climate with high temperatures and plenty of sunshine throughout the year. In tropical countries, chronic exposure to ultraviolet radiation may lead to uneven skin tone and increased production of melanin. Hyperpigmentation is a common cosmetic problem. Botanical alternatives have been investigated due to irritation and long-term tolerability concerns of conventional skin-lightening products, which are mainly based on synthetic tyrosinase inhibitors and antioxidants. Thai medicinal plants are promising sources of phenolic compounds, flavonoids, vitamin C, and other phytochemicals with antioxidant and tyrosinase-inhibitory potentials.
Thai medicinal plants are a valuable but underutilized source of bioactive compounds with tyrosinase-inhibitory and antioxidant properties [1,2,3,4]. The species generally used are Phyllanthus emblica [5], Millingtonia hortensis [6], Artocarpus lakoocha [7,8], Centella asiatica [9], and Pluchea indica [10]. They are known to have strong tyrosinase-inhibitory and antioxidant activities because of the presence of a variety of phenolic and flavonoid [11,12] and vitamin C constituents [13].
P. emblica is rich in ascorbic acid and phenolics such as gallic acid, ellagic acid, emblicanin A and B, and flavonoids (e.g., quercetin) [14], possessing potent antioxidant and tyrosinase inhibitory activities [15]. The compounds scavenge free radicals and inhibit melanogenesis by inhibiting tyrosinase and tyrosinase-related proteins, supporting their use as multifunctional anti-aging and skin-brightening agents [16,17]. Flavonoids and phenolic compounds are widely distributed in M. hortensis flowers, pods and seeds. The ethanolic extracts of inner pods and seeds exhibited significant DPPH radical-scavenging activity and significant inhibition of mushroom tyrosinase [18], indicating dual antioxidant and depigmenting potential [19]. It is thought that these bioactive flavonoids alleviate skin damage mediated by oxidative stress and modulate the melanin biosynthesis pathways. The heartwood of A. lakoocha provides oxyresveratrol as a major stilbene, along with other phenolic constituents, showing very strong tyrosinase inhibition [20] and antioxidant activities [21]. The oxyresveratrol-rich extracts [22] can reduce melanin production in vitro and in vivo and have anti-inflammatory [23] and photoprotective effects, thereby establishing this herb as an important whitening and anti-aging active in Thai cosmeceuticals. C. asiatica has triterpenes, including asiaticoside, madecassoside, asiatic acid, and madecassic acid [24], which attenuate inflammation, protect against oxidative stress, and promote wound healing [25]. These agents protect against oxidative stress induced by UV radiation, stimulate collagen synthesis and enhance the barrier function of the skin, and then modulate melanogenesis and photoaging [26]. Phenolics and flavonoids are abundant in P. indica, particularly derivatives of dicaffeoylquinic acid, such as 4,5-O-dicaffeoylquinic acid [27]. These constituents are very effective in scavenging radicals and preventing lipid peroxidation. P. indica extracts can reduce oxidative damage and have been found to influence enzyme systems involved in inflammation [28] and pigmentation, thus supporting their use as antioxidant and anti-tyrosinase agents [29]. In addition to these five core herbs, Terminalia chebula was selected as a supplementary antioxidant co-ingredient based on literature reports of strong radical-scavenging and barrier-supporting effects. Unlike the five-herb core blend, T. chebula was not included in the factorial optimization but was incorporated at a fixed level in the final serum formulations to provide general antioxidant support.
Although these single-herb effects are promising, systematic investigations of multi-herb combinations remain limited, and few studies apply statistical experimental design to identify interaction patterns among more than two Thai herbs. In many cases, numerous herbal skincare products experience insufficient quality control, safety assessment, and clinical efficacy data, which compromise their scientific credibility and international competitiveness. To bridge these gaps, strategies are required to (i) enhance combined inhibition of tyrosinase and antioxidant protection, (ii) utilize advanced dermal delivery systems to improve the stability and skin targeting of phytochemicals, and (iii) generate robust in vitro and clinical evidence. These phytochemicals act in a complementary manner to protect against oxidative stress and UV-induced melanin production, the two main culprits behind darkened skin, uneven skin tone, and premature aging. Furthermore, the combination of different herbal extracts may exert combined effects on tyrosinase inhibition and antioxidant activity, which may be more effective than single-herb products. Each plant extract has a different effect on oxidative stress and melanin production inhibition, and the optimal combination may enhance tyrosinase inhibition compared with individual extracts. Nevertheless, the traditional trial-and-error formulation methods often do not lead to the optimal ratio, and the combinations may not fully utilize the combined effects of the herbal extracts. Thus, a complete statistical experimental design, such as a two-level factorial design with five factors and response surface methodology, is required to systematically investigate the interaction effects of the extracts and to determine the most potent combinations.
Serums are attractive for facial skin care as they can deliver high doses of active ingredients in light, fast-absorbing formulations. Advances in nanotechnology have enabled the incorporation of bioactives into vesicular systems, which may enhance deposition in skin, physical and chemical stability, and controlled release of sensitive compounds. Niosomes are vesicular carrier systems that offer advantages in dermal delivery, including enhanced stability, improved skin deposition, and controlled release of active compounds. They are composed of nonionic surfactants and cholesterol, are biocompatible, are relatively easy to prepare, and can prolong residence time in the stratum corneum, making them particularly suitable for cosmetic applications.
In this context, the present study developed a Thai herbal facial serum containing five selected species, namely Phyllanthus emblica, Millingtonia hortensis, Artocarpus lakoocha, Centella asiatica, and Pluchea indica, together with Terminalia chebula as a supportive antioxidant co-ingredient. These herbs are widely used in Thai traditional medicine and are known for their tyrosinase-inhibitory, antioxidant, and barrier-supporting effects. A two-level, five-factor factorial design was applied to optimize the core five-herb ratio and explore interaction effects among them, and the optimized blend was incorporated into conventional, liposomal, and niosomal serum formulations for physicochemical and in vitro evaluation. Finally, an exploratory clinical study compared niosomal and non-niosomal serums over 8 weeks with respect to skin hydration, transepidermal water loss, melanin index, and erythema in healthy Thai adults to assess their potential to gently improve moisturization and pigmentation and to increase the cosmetic value of Thai botanical resources.
The present work is intended as an exploratory step towards Thai herbal cosmeceuticals by combining, within a single study, (i) factorial screening of Thai herbal extracts to identify an empirically selected core ratio, (ii) parallel formulation of this multi-herb blend into conventional and niosomal facial serums with matched herbal payloads, and (iii) integrated assessment of physicochemical properties, stress stability, in vitro antioxidant and tyrosinase-inhibitory activities, and 8-week human skin parameter changes under randomized conditions. Within this framework, the study aims to provide preliminary evidence for the practical potential of combined Thai herbal extracts in vesicular and non-vesicular serum formats, rather than to present a fully validated optimized formulation.
2. Materials and Methods
2.1. Plant Materials and Preparation of Raw Crude Extracts
The herbal materials used in this study consisted of M. hortensis flowers, A. lakoocha heartwood, P. indica leaves, C. asiatica aerial parts, and P. emblica fruits. All plant materials intended for laboratory extraction were purchased from Chaokrompoe Herbal Shop, located at 229–231 Chakrawat Road, Chakrawat Subdistrict, Samphan-thawong District, Bangkok 10100, Thailand. Botanical authentication of the raw materials was performed using their macroscopic and microscopic features to confirm their identity based on scientific names. The plant materials were thoroughly cleaned to remove dust and other extraneous matter and dried in a hot-air oven below 50 °C to prevent loss of phytochemicals before extraction.
Separately, commercially prepared herbal extracts were also used in this study to compare their qualitative and spectral characteristics with those of the laboratory-extracted samples. These included M. hortensis flower extract, C. asiatica extract, P. indica leaf extract, and P. emblica fruit extract supplied by Chiang Mai Plant Extracts Research Center, Suthep Subdistrict, Mueang Chiang Mai District, Chiang Mai 50100, Thailand. In addition, A. lakoocha wood extract was obtained from DD Group Trading Co., Ltd. (DD Herbs and Chemicals, 311 Lanluang Road, Wat Sommanat Subdistrict, Pom Prap Sattru Phai District, Bangkok 10100, Thailand), while Terminalia chebula extract was purchased from Orca Innovation Ltd., 153/17 Moo 3, Plaithong Subdistrict, Bang Kruai District, Nonthaburi 11130, Thailand.
Five Thai medicinal plants, namely M. hortensis flowers, A. lakoocha heartwood, P. indica leaves, C. asiatica aerial parts, and P. emblica fruits, were ground into fine powders and passed through a 40-mesh stainless steel sieve. Each herb was weighed and placed separately into a glass beaker. Each dried plant material was extracted by maceration in 95% ethanol using an ultrasonic bath. For each batch, approximately 100 g of dried powder were mixed with 1000 mL of solvent (solid-to-solvent ratio ≈ 1:10, w/v) in a glass beaker. The suspensions were sonicated in an ultrasonic bath (frequency 40 kHz, nominal power 100 W) at 50 °C for a total of 3 h, implemented as three consecutive 1 h cycles with gentle stirring between cycles. After extraction, the mixtures were filtered through filter paper, and the filtrates were concentrated under reduced pressure using a rotary evaporator (Hei-VAP Value, Heidolph Instruments, Schwabach, Germany) at 50 °C, 209 mbar, and 50 rpm, followed by drying in an incubator at 50 °C until constant weight was obtained. For each herb, extracts were prepared in at least 3 independent batches to ensure reproducibility of the crude extract characteristics.
The resulting semi-solid residues were further vacuum-dried to constant weight. Extraction yield was determined from the ratio of dried extract to the initial dry plant powder weight. All crude ethanolic extracts were transferred into amber glass containers, labeled, and stored at 4 °C until subsequent use for in vitro assays and formulation studies. Extracts were visually inspected for uniform color and texture before use and dissolved in 95% ethanol or phosphate-buffered saline (PBS, pH 7.4) as appropriate. Reconstituted solutions were filtered through 0.45 µm membrane filters to ensure clarity and sterility. All prepared and commercial extracts were maintained under controlled conditions to prevent oxidation and maintain phytochemical stability throughout the experimental period.
2.2. Fourier Transform Infrared Spectroscopy (FTIR) Analysis
Fourier transform infrared spectroscopy (FTIR) was used to compare the chemical profiles of commercial herbal extracts with those of in-house extracts. Commercial extracts of the fruit of P. emblica, aerial parts of C. asiatica, leaves of P. indica, and flowers of M. hortensis were purchased from Chiang Mai Plant Extract Research Center (Chiang Mai, Thailand), and heartwood extract of A. lakoocha was purchased from DD Herbs and Chemicals (Bangkok, Thailand).
All samples were analyzed using a Fourier-transform infrared spectrophotometer (FTIR) (VERTEX 70, Bruker, Ettlingen, Germany). The extracts were properly prepared (in the form of pure films or in suitable matrices, depending on the physical form), and the infrared absorption spectra were recorded within a selected wavelength range according to the instrument settings. The obtained spectra were processed and recorded using the software of the instrument, and characteristic absorption bands were assigned to the major functional groups present in each extract.
The FTIR spectra of commercial and laboratory-prepared extracts were compared for overall spectral pattern, peak position, and relative intensity of the key bands to evaluate the similarity of their chemical fingerprints, with special attention to the functional group regions corresponding to hydroxyl, carbonyl, aromatic, and other characteristic vibrations associated with phenols, flavonoids, and other plant compounds. This qualitative comparison was used to confirm the consistency of the herbal extracts and to support their applications in subsequent formulation and biological evaluation.
2.3. Tyrosinase Inhibition Assay of Herbal Extracts
Tyrosinase inhibitory activity of individual plant extracts and their combinations was evaluated using a dopachrome-based L-DOPA assay in 96-well microplates adapted from Fan et al. [30] with kojic acid as a positive control. All reactions (200 µL) were carried out in 0.02 M sodium phosphate buffer (pH 6.8) containing mushroom tyrosinase and L-DOPA as the substrate. In brief, 150 µL of buffer and 50 µL of tyrosinase solution were mixed with 50 µL of ethanol (control) or 50 µL of plant extract/mixture at test concentration, and corresponding blanks without enzyme were prepared in parallel. After pre-incubation at 37 °C for 20 min, 50 µL of L-DOPA (1.62 mM) was added to start the reaction, and absorbance at 490 nm was recorded after 60 min using a microplate reader (BioTek Instruments, Winooski, VT, USA).
For the extract screening and design experiments, the percentage of tyrosinase inhibition was calculated from the endpoint absorbance values according to
where is the absorbance of the control reaction (enzyme + substrate + solvent) and is the absorbance of the reaction containing the herbal extract or extract mixture. All measurements were carried out in triplicate and expressed as mean ± SD.
2.4. Tyrosinase Inhibition by the Combined Five Herb Extract Blend
A two-level factorial design comprising 32 experimental runs was generated using Design-Expert software (version 6.0.5) to evaluate the effects of five extract factors on tyrosinase inhibition. A reduced factorial model containing selected main effects, two-factor interactions, and three-factor interactions was fitted to the response. Model adequacy was evaluated using analysis of variance (ANOVA), R2, adjusted R2, predicted R2, coefficient of variation (CV), predicted residual error sum of squares (PRESS), and adequate precision. Because the design included no replicated design points or center points, a formal lack-of-fit test could not be estimated independently from pure error. The response variable was the percentage inhibition of mushroom tyrosinase obtained from the microplate assay (Section 2.3). In the Design-Expert software output, these five factors (A–E) were internally labelled with extract codes M, P, K, MP, and B, respectively, corresponding to A. lakoocha (M), P. indica (P), C. asiatica (K), P. emblica (MP), and M. hortensis (B).
2.5. Preparation of Liposomes and Niosomes Containing Thai Herbal Extracts
Liposomes containing the Thai herbal extracts were prepared using the thin-film hydration method, adapted from Mawazi et al. [31], and in accordance with the general principles outlined in the FDA liposome guidance. Cholesterol and phospholipids were mixed at a 1:1 weight ratio and dissolved in a mixture of ethanol and chloroform (1:1, v/v) in a 1000 mL round-bottom flask. Lecithin (soy phosphatidylcholine, purity ≥ 95%, Sigma-Aldrich, St. Louis, MO, USA; cat. no. L-α-PC) was used as the phospholipid component in the liposomal formulation. The organic solvent was removed using a rotary evaporator (Hei-VAP Value, Heidolph Instruments, Schwabach, Germany) at 50 °C and 50 rpm under reduced pressure until a thin, dry lipid film formed on the inner wall of the flask. The hydrated dispersions were subsequently held at 40–50 °C with gentle stirring in a fume hood for at least 30 min to allow residual chloroform to evaporate, and no solvent odor was observed in the final products.
A mixed herbal extract solution of M. hortensis, A. lakoocha, P. indica, C. asiatica, and P. emblica was prepared in phosphate-buffered saline (PBS, pH 7.4) at a fixed total extract concentration, using the optimized ratio of 3:2:3:2:2 (w/w) for A. lakoocha, P. indica, C. asiatica, P. emblica, and M. hortensis, respectively. This aqueous herbal solution was added to the flask containing the lipid film, and the flask was gently shaken and swirled to hydrate the film until complete detachment and dispersion were achieved, forming multilamellar liposomal vesicles. The resulting dispersion was further size-reduced using an ultrasonic bath sonicator (Model 410HTDD, Shenzhen, China) for 15 min to obtain smaller liposomes. The liposomal formulation was stored at 4 °C until further characterization and use in subsequent studies.
Niosomes dispersions containing the Thai herbal extracts were prepared by the thin-film hydration method [32], using Span 60 and cholesterol as vesicle-forming components in line with established niosomal protocols. Cholesterol and Span 60 (1:1, w/w) were dissolved in ethanol: chloroform (1:1, v/v) in a 1000 mL round-bottom flask, and the organic solvent was removed under reduced pressure using a rotary evaporator (Hei-VAP Value, Heidolph Instruments, Schwabach, Germany) at 50 °C and 50 rpm until a uniform thin surfactant–cholesterol film formed on the flask wall.
The same mixed herbal extract solution used for the liposomal formulation (fixed total extract concentration in PBS, with A. lakoocha, P. indica, C. asiatica, P. emblica, and M. hortensis at the optimized ratio of 3:2:3:2:2, w/w) was then added to hydrate the dry film, and the flask was gently agitated to promote niosome formation. The resulting dispersion was sonicated in an ultrasonic bath (Model 410HTDD, China) for 15 min to reduce vesicle size and improve homogeneity. The final niosomal formulation was stored at 4 °C until physicochemical characterization and biological evaluation. In addition to these five core herbs, T. chebula was selected as a supplementary antioxidant co-ingredient based on literature reports of strong radical-scavenging and barrier-supporting effects. Unlike the five-herb core blend, T. chebula was not included in the factorial optimization but was incorporated at a fixed level in the final serum formulations to provide general antioxidant support.
2.6. Morphological and Physicochemical Characterization of Liposomes and Niosomes
2.6.1. Transmission Electron Microscopy (TEM)
The morphology of liposomal and niosomal vesicles was determined by transmission electron microscopy (TEM) using a JEOL JEM 1400 microscope (JEOL Ltd., Tokyo, Japan). Immediately before analysis, vesicle dispersions were diluted 1:10 (v/v) with distilled water. A drop (ca. 5–10 µL) of diluted sample was carefully placed on a carbon-coated copper grid and allowed to adsorb for about 5–10 min at room temperature. Excess dispersion was carefully removed with filter paper, and the grid was then stained for 2–5 min with 1% (w/v) phosphotungstic acid solution (freshly filtered to remove the precipitate). The excess stain was blotted off, and the grids were air-dried at ambient conditions before imaging. Representative micrographs were recorded at various magnifications to evaluate vesicle shape, lamellarity, and the presence of aggregation. TEM observations were performed with technical support from the Scientific and Technological Research Equipment Centre, Chulalongkorn University, Bangkok, Thailand.
2.6.2. Particle Size Distribution and Polydispersity Index
The particle size distribution and polydispersity index (PDI) of liposomal and niosomal vesicles were determined by dynamic light scattering using a Zetasizer Ultra instrument (Malvern Instruments Ltd., Malvern, UK). Each dispersion was diluted 1:50 (v/v) with distilled water to obtain an appropriate scattering intensity, transferred into disposable cuvettes, and equilibrated at 25 ± 0.1 °C before measurement. The Z-average hydrodynamic diameter and PDI were calculated from the intensity-weighted size distributions using the instrument software. Each formulation was measured in triplicate, and results are reported as mean ± SD.
2.6.3. Zeta Potential
The surface charge (zeta potential, ZP) of the liposomal and niosomal vesicles was measured by electrophoretic light scattering using a Zetasizer Ultra instrument (Malvern Instruments Ltd., Malvern, UK). An aliquot of each dispersion was diluted with distilled water to obtain an appropriate conductivity for electrophoretic measurements, then transferred into a folded capillary cell. The measurements were performed at 25 ± 0.1 °C, and ZP values were calculated using the Smoluchowski approximation. Each formulation was performed in triplicate, and the results were reported as mean ± SD. These measurements were conducted following the in-house standard operating procedure for zeta potential determination established at the Scientific and Technological Research Equipment Centre, Chulalongkorn University.
2.7. Development of Thai Herbal Serum Formulations
Three serum formulations containing Thai herbal extracts were developed in three forms: a conventional serum with free extracts (FS), a liposomal serum (FL), and a niosomal serum (FN). The formulations contained the same total amount of the optimized five-herb core blend, composed of A. lakoocha, P. indica, C. asiatica, P. emblica, and M. hortensis in an optimized ratio of 3:2:3:2:2 (w/w), together with a fixed additional extract of T. chebula included as a supportive antioxidant ingredient. T. chebula extract was added separately as a free extract at 0.1% w/w in all formulations.
In FS, the five extracts were incorporated directly into the serum base at final concentrations of 0.75%, 0.50%, 0.75%, 0.50%, and 0.50% w/w, respectively. In FL and FN, preformed liposomal and niosomal dispersions were incorporated at 10.0% w/w to provide an equivalent final concentration of 3.0% w/w of the five-herb core blend. The liposomal dispersion was prepared with 1.0 g soy phosphatidylcholine and 1.0 g cholesterol per 100 g, whereas the niosomal dispersion contained 1.0 g Span 60 and 1.0 g cholesterol per 100 g. Both dispersions contained 30 g of the five-herb core blend per 100 g. Thus, incorporation of 10.0 g of each dispersion per 100 g of finished serum provided final concentrations of 3.0% w/w of the five-herb core blend and 0.1% w/w of cholesterol and either phosphatidylcholine or Span 60.
The serum base consisted of deionized water, humectants, a chelating agent, a polymeric thickener, Microcare PHC as the preservative system, and fragrance. In FS, the five-herb core blend was added as free extracts, whereas in FL and FN, it was incorporated as preformed liposomal and niosomal dispersions, respectively. The formulations were prepared by mixing the water phase, adding the active phase under continuous stirring, dispersing the thickener to obtain the desired serum consistency, incorporating the preservative and fragrance, adjusting the pH to 5.0, and filling the final products.
2.8. Serum Stability Testing
Stability of the Thai herbal serum formulations was evaluated by an accelerated temperature cycling test and by centrifugation, adapted from Navarro-Pérez et al. [33] with modifications for serum systems. Samples were stored at 40 °C for 24 h and then transferred to 4 °C for a further 24 h (one cycle), and this procedure was repeated for six cycles. After each cycle, the products were visually examined and compared with control samples stored at ambient temperature, recording physical appearance (homogeneity, phase separation, or sedimentation), color, and odor.
The samples were centrifuged in a benchtop centrifuge (ROTOFIX 32 A, Hettich, Kirchlengern, Germany) at 6000 rpm for 30 min, corresponding to approximately 5000× g, and were then visually examined for creaming, phase separation, or precipitate formation. The pH of each serum was measured at 25 ± 2 °C using a calibrated benchtop pH meter (Bench Top pH Meter, ST300, OHAUS Corporation, Parsippany, NJ, USA) equipped with a glass combination electrode after two-point calibration with pH 4.0 and 7.0 buffer solutions. pH was recorded at cycle 0 and after each temperature-cycling cycle and centrifugation to monitor potential pH drift under stress conditions. Viscosity was determined using a rotational viscometer (DV3T, AMETEK Brookfield, Middleboro, MA, USA) with spindle No. 62 at 60 rpm under the specified measurement conditions. Viscosity was measured at 25 ± 1 °C using approximately 20 mL of sample after 30 s equilibration at the selected spindle speed. The maximum change in pH (pH units) and the percentage change in viscosity relative to the values at cycle 0 were calculated for each formulation. Acceptance criteria for physical and rheological stability were established according to the IFSCC monograph [34] ‘The Fundamentals of Stability Testing,’ which recommends practical limits for cosmetic products based on preservation of critical quality attributes. In line with these recommendations, the serum formulations were considered stable if pH remained within 5.4–5.6 (corresponding to a drift of no more than ±0.1 pH units from the target pH of 5.5) and viscosity did not deviate by more than ±10% from its initial value, ensuring that sensory properties and dosing behavior remained within an acceptable range for topical serums.
2.9. DPPH Radical Scavenging Assay of Serum Formulations
The antioxidant activity of serum formulations was assayed by the DPPH radical scavenging assay. A 0.2 mM DPPH solution in ethanol was prepared and kept away from light. The three serum formulations (FS, FL, and FN) were diluted with ethanol to obtain final concentrations between 25 and 40 mg/mL. An aliquot of 200 µL of each sample solution was mixed with 200 µL of the DPPH solution in microcentrifuge tubes and incubated in the dark at room temperature for 30 min. Then the absorbance was measured at 515 nm with a UV–Vis microplate spectrophotometer [35]. All measurements were carried out in triplicate. Ascorbic acid was used as a positive control and ethanol as a negative control. The percentage of DPPH radical scavenging was calculated using the following equation:
where is the absorbance of the DPPH solution mixed with ethanol and is the absorbance of DPPH solution mixed with the sample solution. Percentage inhibition values at different sample concentrations were plotted and the concentration required to reduce the initial DPPH concentration by 50% (IC50) was determined from the linear regression of the concentration–response curve.
For the serum formulations, percentage DPPH radical scavenging at the tested concentrations was plotted against total serum concentration, and approximate IC50 values were estimated by simple linear regression within this limited concentration range. These IC50 values were used as exploratory indicators of relative antioxidant activity rather than as fully modeled dose–response parameters.
2.10. Tyrosinase Inhibition Assay of Serum Formulations
Tyrosinase inhibitory activity of the serum formulations (FS, FL, and FN) was evaluated using an L-DOPA substrate assay adapted from Fan et al. and Wang et al. [30,36] with kojic acid as the positive control. Because the serum matrices were opaque and colored, inhibition was calculated from time-dependent absorbance differences (ΔA) to correct for baseline matrix effects. The assay was performed in 96-well microplates using mushroom tyrosinase and L-DOPA in 0.02 M sodium phosphate buffer (pH 6.8). Each condition consisted of mixing 50 μL of tyrosinase solution with 150 μL of buffer and either 50 μL of ethanol (control, A) or 50 μL of serum/kojic acid solution (test, C); corresponding blanks lacking enzyme (B and D) were prepared in parallel. After pre-incubation at 37 °C for 20 min, 50 μL of L-DOPA (1.62 mM) was added to initiate the reaction, and absorbance at 490 nm was measured at 0 and 60 min with a microplate reader. The change in absorbance (ΔA) for each well was calculated as the difference between absorbance at 60 min and 0 min, and percentage tyrosinase inhibition was calculated by using the following:
where , , , and denote the ΔA values of A, B, C, and D, respectively. All measurements were performed in triplicate and expressed as mean ± SD, and IC50 values for selected single extracts and the optimized herbal combination were derived from concentration–response curves based on a kojic acid-calibrated response by nonlinear regression using appropriate curve-fitting software.
For the serum formulations, tyrosinase inhibition percentages were determined at the tested serum concentrations, and the corresponding IC50 values were approximated by linear regression of inhibition versus concentration. As for the DPPH assay, these IC50 estimates were interpreted as comparative indicators of activity under the specific assay conditions.
2.11. Clinical Evaluation of Serum Efficacy
2.11.1. Volunteer Selection
The clinical part of the study was conducted in accordance with the Declaration of Helsinki and relevant Good Clinical Practice guidelines and was approved by the Institutional Review Board/Ethics Committee of Phranakhon Rajabhat University. The study protocol and all subject-related documents were reviewed and approved under IRB No. 02.013/69 (approved on 27 March 2026). The study was registered with the Thai Clinical Trials Registry (TCTR No. TCTR20260820007, registration date: 20 August 2026). All participants provided written informed consent before undergoing any study-related procedure.
A single-blind, in vivo study was conducted in healthy male and female volunteers aged ≥18 years (n = 50). Eligible subjects had no clinical signs or history of dermatological disease (e.g., dermatitis, erythematous lesions, papules, or tinea infection), were not pregnant or breastfeeding, and had not used systemic corticosteroids, immunosuppressants, or antihistamines within 2 weeks before enrollment. All participants received oral and written information regarding the study objectives, procedures, and possible adverse effects and gave written informed consent before participation. Subjects were informed of their right to withdraw at any time without penalty. Subjects who developed product-related adverse reactions, became pregnant, or were unable to comply with study visits were withdrawn from the trial, and the study would be terminated if clinically significant product-related reactions occurred in participants.
Fitzpatrick skin type and detailed regular skincare habits (e.g., use of other facial treatments or lightening agents) were not systematically recorded and are therefore not available. Participants were instructed to avoid initiating new facial skincare products and to maintain their usual basic cleansing and sun protection practices throughout the study period as far as possible.
2.11.2. Environmental Conditions and Study Design
All instrumental skin measurements were performed under controlled environmental conditions to minimize the influence of external factors. Volunteers rested in an air-conditioned room (20 ± 2 °C, 40–60% relative humidity) for at least 30 min before measurements to allow skin equilibration. All instrumental skin measurements were performed in a clinical assessment room at the Department of Cosmetic Science, Phranakhon Rajabhat University, Bangkok, Thailand, under controlled environmental conditions to minimize the influence of external factors. This clinical trial used a randomized, single-blind, parallel-group design with a 1:1 allocation ratio between a niosomal herbal serum (FN) and a corresponding non-niosomal (free extract) herbal serum (FS). Fifty volunteers were randomly assigned in a single-blind manner to two groups: one group received the niosomal herbal serum (FN, n = 25), and the other received the non-niosomal (free extract) serum (FS, n = 25). This randomized, single-blind, parallel-group trial was reported in accordance with the CONSORT 2025 statement [37]. The completed CONSORT 2025 checklist is provided in Supplementary File S1. Participants were unaware of whether they received the niosomal or non-niosomal serum, whereas the investigators who dispensed the products and assessed outcomes were not blinded. Skin hydration (Corneometer CM 825) (Courage + Khazaka, Cologne, Germany), melanin and erythema indices (Mexameter MX 18) (Courage + Khazaka, Cologne, Germany), and transepidermal water loss (TEWL; Tewameter TM 300) (Courage + Khazaka, Cologne, Germany) were measured on the facial skin at baseline (week 0) and once weekly from week 4 to week 8 during product use. Safety and tolerability outcomes were summarized for all 50 enrolled volunteers. Descriptive statistics (mean ± SD) were used to summarize demographic characteristics and skin parameter values. Differences between paired facial sites (e.g., left vs. right) were analyzed using the paired t-test or the Wilcoxon signed-rank test, as appropriate. Between-group comparisons (FS vs. FN) at each time point were evaluated using the independent t-test or its non-parametric equivalent. In the clinical part of the study, descriptive statistics (mean ± SD) were used to summarize skin parameter values at each time point, and paired and independent t-tests (or their nonparametric equivalents) were applied to compare cheeks and treatment groups at individual time points. Given the modest sample size, the dropout rate, and the multiple site- and time-specific comparisons without formal adjustment for multiplicity, these clinical analyses were considered exploratory and hypothesis-generating rather than confirmatory, and the reported p-values should be interpreted accordingly.
2.11.3. Skin Irritation (Open Patch Test)
Primary irritation of the serum formulations was assessed by an open patch test. A 2 × 2 cm2 test area was marked on the volar forearm of each volunteer, and the skin was cleansed with water and allowed to dry. An adhesive tape patch with an opening of 2 × 2 cm2 was applied, and 50 µL of each serum formulation was placed within the test area and left in contact with the skin for 30 min. The test sites were then examined for signs of irritation or allergic reaction, and responses were graded qualitatively as no reaction, slight itching, itching with transient erythema, or pronounced erythema/edema. Only volunteers without irritation or allergic reactions proceeded to the efficacy evaluation.
2.11.4. Instrumental Assessment of Clinical Efficacy
Volunteers who showed no signs of irritation were further evaluated for the short- and long-term effects of the serum. Skin and barrier parameters were measured using a Cutometer dual MPA 580 system (Courage + Khazaka, Cologne, Germany) equipped with Corneometer CM 825, Mexameter MX 18, and Tewameter TM 300 probes. For the short-term effect, skin parameters were recorded before product application and at 5, 10, and 15 min after application on designated facial sites. For the longer-term effect, hydration, TEWL, melanin index, and erythema index were recorded at baseline and weekly for up to 8 weeks of regular product use.
Skin hydration in the stratum corneum was determined using the Corneometer CM 825. The instrument determines the water content of the superficial layers of the epidermis (approximately 10–20 µm in depth) based on capacitance and reports the result in arbitrary units (AU), where a higher value corresponds to higher hydration. TEWL was determined using the Tewameter TM 300 and reported in g/m2/h. Percentage changes from baseline were calculated to determine improvements in barrier function. Changes in skin pigmentation and erythema were quantified using the Mexameter MX 18. The instrument determines melanin based on specific wavelengths around 660 and 880 nm and erythema based on specific wavelengths around 568 and 660 nm and reports the result as melanin and erythema indices in arbitrary units. Data processing and statistical tests are described in Section 2.12.
2.12. Statistical Analysis
All data were expressed as mean ± standard deviation (SD). In vitro assays (DPPH radical scavenging, tyrosinase inhibition, and other biochemical measurements) were performed in triplicate, and IC50 values were obtained from linear regression of concentration–response curves; differences among formulations were analyzed using one-way ANOVA followed, where appropriate, by post hoc multiple comparison tests. Stability data (pH, viscosity, and physical changes over cycles) and instrumental in vivo measurements (hydration, TEWL, melanin index, and erythema index) were analyzed using paired t-tests or the Wilcoxon signed-rank test for within-subject comparisons (e.g., pre- vs. post-treatment, left vs. right side) and independent-samples t-tests (or their nonparametric equivalents) for between-group comparisons (FS vs. FN) at each time point. Normality and homogeneity of variance were assessed before applying parametric tests, and nonparametric alternatives were used when assumptions were not met. Statistical significance was set at p < 0.05. All analyses were performed using IBM SPSS Statistics (IBM Corp., Armonk, NY, USA). Efficacy outcomes were analyzed in the per-protocol population, comprising volunteers who completed the 8-week study without major protocol deviations. Participants who discontinued the study mainly did so because of scheduling constraints or inadequate adherence to product use; therefore, complete longitudinal efficacy data were unavailable for these participants. Safety and tolerability were summarized for all randomized participants (n = 50). This per-protocol approach may introduce selection bias. In addition, the statistical analysis did not fully account for within-participant correlation across repeated measurements or for multiplicity across outcomes and time points; therefore, the efficacy findings should be interpreted cautiously.
3. Results
3.1. Extraction Yield of Crude Ethanolic Herbal Extracts
Crude ethanolic extracts of five Thai medicinal plants (fruits of P. emblica, flowers of M. hortensis, heartwood of A. lakoocha, aerial parts of C. asiatica, and leaves of P. indica) were prepared with 95% ethanol. The highest yield was obtained from the extract of M. hortensis flowers (17.77% w/w of dried plant material), closely followed by C. asiatica (17.76%). Other plants were lower in extraction yield, with P. emblica, P. indica, and A. lakoocha giving 14.49%, 8.70%, and 5.74%, respectively. The slightly higher yields of M. hortensis and C. asiatica may reflect a greater presence of ethanol-soluble components, e.g., phenolics and other moderately polar metabolites, under the present extraction conditions. In contrast, the lowest yield from A. lakoocha may reflect either a lower proportion of ethanol-extractable constituents in the heartwood matrix or a stronger association of target components within the cell wall structure.
3.2. Infrared Spectroscopic Analysis of Herbal Extracts
The overall pattern and location of the bands in the key wavenumber region of the IR spectrum of the commercial and infusion extracts of the five medicinal plants were very similar, indicating similar major functional groups and key phytochemical compositions between the two sources (Figure 1). To compare the chemical fingerprints of the commercial extracts with the laboratory-prepared ethanol extracts of M. hortensis, P. indica, A. lakoocha, C. asiatica, and P. emblica, infrared spectroscopy was used.
Figure 1.
FTIR spectra of Thai herbal extracts used in this study, comparing commercial extracts (upper spectra in each panel) with 95% ethanolic macerated extracts prepared in-house (lower spectra). Panels represent (a) M. hortensis flower extract, (b) P. indica leaf extract, (c) A. lakoocha heartwood extract, (d) C. asiatica aerial-part extract, and (e) P. emblica fruit extract.
The broad and characteristic O–H stretching bands consistently detected at approximately 3400–3300 cm−1 should originate from hydroxyl groups of phenols, flavonoids, tannins, triterpenes, saponins, and related sugars, which are known to be abundant in these plants. Aliphatic C–H elongation bands at 2920–2850 cm−1 confirm the presence of lipid chains, terpenoids, and sterols, while bands in the 1650–1600 cm−1 region are caused by the elongation of conjugated and/or aromatic C=O and/or C=C polyphenols such as oxyresveratrol in A. lakoocha, terpenoids in C. asiatica, and phenolic acids in P. emblica and P. indica. Additional aromatic C=C bands at 1500–1450 cm−1 and C–O/C–O–C elongation in the 1200–1000 cm−1 range confirmed the presence of flavonoids, phenolic glycosides, and triterpene saponins, consistent with IR profiles reported for extracts from these species and related phenolic-rich plant materials [38,39,40,41].
In all cases, the spectra of commercial and laboratory-prepared extracts showed closely matching band patterns and wavenumber positions in key regions, including broad O–H stretching around 3400–3300 cm−1, aliphatic C–H stretching near 2920–2850 cm−1, conjugated C=O/C=C bands around 1650–1600 cm−1, and C–O/C–O–C stretching between 1200 and 1000 cm−1, confirming that the ethanolic maceration process yields extracts with fundamental chemical features comparable to the corresponding commercial products.
These results confirm that the ethanolic maceration process provides extracts with basic chemical features similar to those of the commercial products, supporting their use in subsequent formulation and biological studies.
3.3. Tyrosinase Inhibition by the Combined Five-Herb Extract Blend
A two-level, five-factor factorial design was employed to investigate the effects of the concentrations of A. lakoocha (A), P. indica (B), C. asiatica (C), P. emblica (D), and M. hortensis (E) on tyrosinase inhibition in their ethanolic extract mixtures, with percentage inhibition as the response. The selected factorial model was statistically significant overall (F = 2.48, p = 0.0382), with R2 = 0.5415, adjusted R2 = 0.3231, CV = 13.19%, and adequate precision = 5.558. However, the predicted R2 was negative (−0.0647), indicating limited predictive performance beyond the fitted dataset. Therefore, the model was interpreted as an empirical screening tool within the studied design space. Complete ANOVA results and model diagnostic statistics are provided in Supplementary Tables S1 and S2. Factor D (P. emblica) and the CDE interaction were significant (p = 0.0318 and p = 0.0055, respectively).
where A, B, C, D, and E denote the coded levels of A. lakoocha, P. indica, C. asiatica, P. emblica, and M. hortensis, respectively.
Despite the modest global fit, the significant CDE interaction indicated that the association of C. asiatica, P. emblica, and M. hortensis with tyrosinase inhibition depended on their combined levels within the tested design space. Based on the selected R3FI factorial model, observed response patterns, and practical formulation considerations, the 3:2:3:2:2 ratio (A. lakoocha:P. indica:C. asiatica:P. emblica:M. hortensis, w/w) was selected as an empirically derived candidate blend for further formulation studies. Figure 2 illustrates the model-predicted response surface for A. lakoocha (A) and C. asiatica (C), while the remaining factors were held at their mid-range coded settings for graphical visualization. Within the studied range, increasing both factors was associated with an overall increase in tyrosinase-inhibitory activity.
Figure 2.
Three-dimensional model-predicted response surface plot showing the effects of A. lakoocha (factor A) and C. asiatica (factor C) on tyrosinase inhibition, while P. indica (B), P. emblica (D), and M. hortensis (E) were held at their mid-range settings for graphical visualization. The model-predicted surface suggests that increasing both factors within the studied range was associated with higher predicted tyrosinase inhibition. Design-Expert factor labels: A = A. lakoocha, B = P. indica, C = C. asiatica, D = P. emblica, and E = M. hortensis.
In addition to the indications of possible interaction behavior obtained from the factorial design, the optimized combination ratio of A. lakoocha, P. indica, C. asiatica, P. emblica, and M. hortensis is mechanistically plausible when the dominant phytochemicals and their reported bioactivities are considered. A. lakoocha heartwood is rich in oxyresveratrol, a potent tyrosinase inhibitor that interacts with the copper-containing active site and reduces tyrosinase-related oxidative stress, leading to marked suppression of melanogenesis. P. emblica provides high levels of tannins and phenolic acids that inhibit multiple steps of the melanogenic cascade, including tyrosinase activity and MITF/tyrosinase-related protein expression, while also quenching superoxide and other reactive oxygen species implicated in UV-induced pigmentation.
C. asiatica provides triterpenes such as asiaticoside and asiatic acid, which are not direct tyrosinase inhibitors but can downregulate melanogenesis by modulating the expression of the MITF/tyrosinase gene and by attenuating the UV-induced oxidative and inflammatory signaling. M. hortensis and P. indica are rich in flavonoids and phenolic acids, which engage in antioxidant and anti-inflammatory activities, enhance endogenous antioxidant defenses, and reduce ROS-mediated up-regulation of melanogenic pathways. Collectively, these phytochemical profiles support a multimodal antimelanogenic concept in which the five-herb core combination may act thru at least three complementary mechanisms as schematically illustrated in Figure 3: (i) direct inhibition of tyrosinase by oxyresveratrol and P. emblica tannins, (ii) upstream downregulation of the melanogenic transcriptional machinery by C. asiatica triterpenes and P. emblica-derived polyphenols, and (iii) broad antioxidant and anti-inflammatory protection from M. hortensis and P. indica that suppresses ROS- and cytokine-driven stimulation of melanocyte activity.
Figure 3.
Literature-based proposed multimodal antimelanogenic mechanisms of the optimized five-herb combination, integrating direct tyrosinase inhibition, upstream downregulation of MITF/melanogenic genes, and antioxidant/anti-inflammatory protection against UV- and ROS-induced melanocyte activation. These pathways were not directly investigated at the cellular or molecular level in the present study and are presented as a conceptual synthesis of previously reported mechanisms.
Within this framework, the optimized 3:2:3:2:2 ratio can be interpreted as balancing a relatively high contribution from the main tyrosinase inhibitor A. lakoocha and the multifunctional antioxidant–depigmenting agent P. emblica with supportive, sub-maximal levels of C. asiatica, P. indica, and M. hortensis that primarily modulate redox and inflammatory microenvironments rather than compete for the same binding site. These diagnostics indicate limited global fit and predictive performance of the full model and highlight that the factorial design should be interpreted as an empirical screening tool rather than as a robust predictive model. This empirical framework, the apparent enhancement of tyrosinase inhibition by combinations rich in P. emblica, C. asiatica, and M. hortensis is best regarded as suggestive combined effects rather than rigorously quantified synergy, because single-extract and binary combination controls beyond the factorial runs were not performed in this study.
3.4. Structural Investigation of Liposomes and Niosomes
The optimized niosomal dispersion showed a Z-average hydrodynamic diameter of about 611 nm with a PDI of 0.62 and volume-based diameters (Dv10, Dv50, and Dv90) of 374.6, 506.3, and 709.9 nm, respectively, indicating submicrometric vesicles with a relatively broad but unimodal size distribution. The incorporation in the serum base led to a niosomal serum (FN) showing a mean diameter of 694.96 ± 9.03 nm (PDI 0.900 ± 0.162), while the liposomal serum (FL) produced significantly larger particles with a Z-average size of 2692.7 ± 150.5 nm and broad size distribution (PDI 0.973 ± 0.023). Both formulations exhibited highly negative zeta potentials (−49.19 ± 0.22 mV for FN and −52.73 ± 0.20 mV for FL), which describe the surface charge under the measurement conditions but do not, by themselves, prove long-term colloidal stability in the complex serum matrix.
Transmission electron microscopy (TEM) images showed vesicle-like structures in both systems. The niosomal formulation (Figure 4a) consisted predominantly of spherical, closed bilayer vesicles with estimated diameters of approximately 200–1000 nm. The liposomal formulation (Figure 4b) exhibited mainly spherical vesicles in a similar nominal size range, displaying multilamellar or oligolamellar structures, which are typical for phospholipid-based carriers. The apparent discrepancy between TEM and DLS for the liposomal formulation could be attributed to the differing measurement principles of the two techniques: TEM visualizes individual vesicles on a dried grid, while DLS measures the hydrodynamic diameter of dispersed particles in the serum matrix and is thus more sensitive to vesicle aggregation and hydration effects. Overall, the niosomal serum (FN) produced vesicles in the sub-micrometer range and was therefore selected for further optimization and skin-related evaluations, recognizing that both niosomal and liposomal serums were polydisperse and that the vesicle metrics in the finished serums should be interpreted as exploratory.
Figure 4.
Representative TEM images of vesicular formulations (negative staining, JEOL JEM 1400, scale bar = 200 nm): (a) niosomal formulation containing Thai herbal extracts; (b) liposomal formulation containing Thai herbal extracts. Images illustrate typical vesicle-like morphology and lamellarity under the preparation conditions.
Because the TEM micrographs were acquired on dried, negatively stained grids and were interpreted qualitatively, they do not provide quantitative statistics of lamellarity or aggregation rates, and no image-based particle counting was performed. Moreover, encapsulation efficiency, the proportion of free versus vesicle-associated extracts, and release profiles were not determined in this exploratory work. These vesicle metrics should therefore be regarded as qualitative indicators of carrier morphology rather than comprehensive nanocarrier characterization. Although both formulations were clearly polydisperse (PDI > 0.7) and thus do not represent narrowly distributed nano systems, the relatively smaller mean size and narrower distribution of the niosomal serum relative to the liposomal serum support its selection for further exploratory studies of skin permeation, moisturizing performance, and preliminary stability. More detailed investigations of aggregation and serum-matrix interference will be required to fully characterize long-term colloidal behavior.
3.5. Thai Herbal Serum Formulations
Three Thai herbal serum formulations were prepared: a non-niosomal Thai herbal serum containing free extracts (FS), a niosomal Thai herbal serum containing the herbal extract blend (FN), and a liposomal Thai herbal serum containing the herbal extract blend (FL). All formulations were light in weight with good spreadability, rapid absorption, and a non-greasy after-feel. They formed a thin, smooth film over the skin surface. FS appeared as a clear yellow gel, whereas FN and FL showed slightly opaque yellow gels due to the presence of vesicular carriers (Figure 5).
Figure 5.
Appearance of the developed Thai herbal serum formulations: (a) non-niosomal (free extract) serum FS, (b) niosomal herbal serum FN, and (c) liposomal herbal serum FL.
The aqueous base of all formulations consisted of water, humectants (glycerin and butylene glycol at low percentages around 2% w/w), panthenol (~0.5% w/w), and a low level of disodium EDTA as a chelating agent, thickened with Aristoflex® AVC and preserved with a combination of 1,2-hexanediol and Microcare® PHC. Only trace amounts of fragrance and triethanolamine (q.s.) were added for sensory adjustment and pH control.
FS contained a free blend of Thai herbal extracts (T. chebula, P. emblica, M. hortensis, C. asiatica, P. indica, and A. lakoocha) directly dispersed in the serum base. The five-herb core blend was incorporated as preformed niosomal or liposomal dispersions at 10.0% w/w in FN and FL, whereas T. chebula extract was added separately as a free extract at 0.1% w/w in all formulations. The design enabled a direct comparison of the conventional and vesicular serum systems with respect to physicochemical characteristics, stress stability, in vitro activity, and exploratory clinical skin outcomes.
3.6. Accelerated Stability Studies
The Thai herbal serum formulations were physically and rheologically stable under the tested stress conditions. It should be noted that these tests address physical and rheological stability under accelerated stress only. Real-time long-term storage (e.g., ≥3 months at ambient and refrigerated conditions) and direct chemical monitoring of key phenolic and flavonoid constituents using chromatographic or spectrophotometric methods were not performed in this study. Consequently, the present stability data should be interpreted as preliminary and do not replace formal shelf-life evaluations for future product development. No visible signs of phase separation, creaming, or sedimentation were observed in all formulations (FS, FN, and FL) after 6 cycles of heating-cooling between 40 and 4 °C compared to the samples stored at ambient temperature, with no visible color or odor changes. Consistent with the visual observations, the maximum percentage deviation in viscosity from the initial value at cycle 0 was within ±10% for all formulations, whether the herbal extract was non-niosomal (free extract) serum (FS), incorporated into niosomes (FN), or liposomes (FL) (Table 1). Furthermore, centrifugation of the stressed samples at 6000 rpm for 30 min did not lead to any phase separation or precipitate formation in any serum batch, reaffirming the robustness of the serum matrix under mechanical stress. Overall, the absence of visual phase separation and the variations in viscosity within the ±10% acceptance limit indicate that non-niosomal (free extract) serum, niosome, and liposome Thai herbal serums demonstrate satisfactory physical and rheological stability under accelerated heating-cooling and centrifugation stress, and this indicates preliminary physical and rheological stability under the tested heating–cooling and centrifugation stress conditions.
Table 1.
Viscosity of Thai herbal serum formulations stored under heating–cooling cycles or ambient conditions.
The viscosity of all Thai herbal serum formulations was essentially unchanged during storage. The maximum deviation from initial viscosity at cycle 0 did not exceed ±5.6% for either the non-niosomal (free extract) serum (FS) or FN and FL under either heating–cooling or ambient storage conditions (Table 1), which is well within the predefined ±10% acceptance limit for cosmetic emulsions and topical serums. These results indicate that the inclusion of the herbal extract into the niosome or liposome carriers did not alter the rheological stability of the serum matrix, and the viscosity profile was adequate to ensure reliable dosing and consumer acceptance under both stress (heating-cooling) and ambient storage conditions The pH of all formulations was approximately 5.5 at baseline and remained within 5.4–5.6 at all cycles, indicating minimal pH drift under the applied stress conditions and viscosity during six heating–cooling cycles and ambient storage were <10% relative to baseline values, satisfying the predefined stability acceptance criteria derived from the IFSCC monograph and indicating that the serums maintained consistent rheology and pH under stress conditions.
3.7. Antioxidant Activity of Serum Formulations by DPPH Assay
The antioxidant activities of the formulated serums were measured using the DPPH radical scavenging assay. As shown in Table 2, FN showed the lowest approximate DPPH IC50 among the tested serum formulations, with an IC50 value of 31.98 mg/mL, followed by the non-niosomal (free extract) serum FS (IC50 value of 32.36 mg/mL). In contrast, liposomal formulation FL showed the lowest activity (IC50 = 36.28 mg/mL). All formulations had reasonable potentials of antioxidant activities; however, the activities were significantly lower than the standard (ascorbic acid; IC50 = 7.75 μg/mL). The slightly enhanced DPPH radical-scavenging activity observed for FN compared with FS is consistent with the possibility that the niosomal formulation may improve the apparent solubility or microenvironment of the herbal actives. However, vesicle association, free extract fraction, and release behavior of the phytochemicals were not quantified in this study, so these mechanistic interpretations should be regarded as tentative.
Table 2.
Antioxidant activity (IC50) of Thai herbal serum formulations.
3.8. Tyrosinase Inhibitory Activity of Serum Formulations
The tyrosinase inhibitory activity of the serum formulations was determined using L-DOPA as a substrate and kojic acid as a reference inhibitor (IC50 = 0.069 mg/mL). FS showed the highest inhibition activity (IC50 = 8.3 mg/mL), while the niosome formulation (FN) and liposome formulation (FL) formulations showed inhibition activity (IC50 = 197 and 240 mg/mL, respectively). Values are the means of three independent experiments.
The lower in vitro efficacy of FN and FL might be due to the slower release or lower immediate availability of the herbal constituents present in the vesicular dispersion during the relatively short incubation periods used in the tests. From the formulation development point of view, this trade-off suggests that although FS provides increased acute enzyme inhibition in vitro, vesicular systems like FN may still provide advantages in vivo by enhancing the stability of the phytochemicals and prolonging their residence at the stratum corneum surface, with potential benefits for skin hydration and barrier support. For the delivery of active compounds from herbs into the skin, FS was therefore chosen as the non-niosomal (free extract) reference system, whereas FN represented the niosomal herbal serum incorporating the same extract blend into vesicular dispersions for clinical evaluation.
3.9. Clinical Evaluation of Serum Efficacy
The randomized population comprised 50 healthy adults, with 25 participants assigned to each group. The demographic characteristics of the randomized participants are summarized in Table 3. Instrumental skin outcomes were evaluated in the per-protocol efficacy population, comprising 15 completers in each group, and are presented in the corresponding outcome tables.
Table 3.
Demographic characteristics of randomized participants.
3.9.1. Skin Irritation Assessment
In total, fifty volunteers aged ≥18 years were randomized (FN, n = 25; FS, n = 25), and all were included in the safety population. During the open patch test, three subjects developed mild pruritic reactions (FN n = 2, FS n = 1) and were withdrawn from the efficacy evaluation but remained in the safety assessment. A further seventeen volunteers discontinued during the 8-week efficacy phase (FN n = 8, FS n = 9) because they were unable to attend scheduled visits or to maintain continuous product use. These discontinuations mainly occurred in working-age adults, leading to limited continuity of product application and follow-up measurements. Consequently, the pre-specified per-protocol efficacy analysis was conducted in the 30 completers (FN n = 15, FS n = 15), whereas safety outcomes were summarized for all 50 randomized volunteers (Figure 6).
Figure 6.
CONSORT-style participant flow diagram of the randomized clinical study. The diagram shows enrolment of 50 volunteers aged ≥18 years, randomization to the niosomal herbal serum (FN, n = 25) or the non-niosomal free extract serum (FS, n = 25), withdrawals due to mild pruritic reactions during open patch testing (FN n = 2, FS n = 1), early discontinuation or loss to follow-up during the 8-week efficacy phase because participants were unable to attend scheduled visits or maintain continuous product use (FN n = 8, FS n = 9), and the per-protocol analysis including 15 completers per group (FN n = 15, FS n = 15).
3.9.2. Short-Term Skin Hydration on the Cheeks After Product Application
In the per-protocol efficacy population of 30 completers (FS, n = 15; FN, n = 15), short-term changes in skin hydration on both cheeks were assessed at 5, 10, and 15 min after serum application using a Corneometer CM 825. The niosome-based serum (FN) induced a transient but statistically significant increase in corneometric values from baseline at specific time points (right cheek: 10 min; left cheek: 5 and 10 min; p < 0.05), whereas the non-niosomal (free extract) serum (FS) did not produce significant changes on either cheek (p > 0.05) (Table 4). These results indicate that FN can rapidly, but transiently, improve stratum corneum hydration shortly after application.
Table 4.
Short-term changes in skin hydration on the cheeks after serum application (absolute values and changes from baseline).
3.9.3. Short-Term TEWL on the Cheeks
In summary, the biophysical data suggest that FN has the potential to rapidly increase skin surface hydration with a reduction in water loss and that significant barrier improvements are expected after prolonged use, rather than immediately after application. TEWL was measured on the left cheek at 5, 10, and 15 min post-product application using the Tewameter TM300. Both formulations demonstrated a trend towards reduced TEWL from baseline at all measured time points; however, these changes were not statistically significant for serum FS (p > 0.05). For serum FN, the reduction in TEWL at 15 min was statistically significant (mean difference = −3.6 ± 6.30 g/m2·h, p = 0.04), suggesting a modest, short-term improvement in barrier function at the treated site. Detailed numerical data for skin hydration and TEWL at each time point are shown in Table 5.
Table 5.
Short-term transepidermal water loss (TEWL) on the cheeks after serum application.
Summary: Short-term biophysical tests suggested the rapid hydration of the keratin layer of the skin by the niosome-containing serum (FN), especially during the initial 10–15 min after application, while corneometric values of the formulation without niosomes (FS) showed only slight changes. Moreover, a slight decrease in TEWL was observed on both cheeks but was statistically significant only on the left cheek after 15 min of FN application, which indicates a limited but measurable short-term effect on the skin barrier function. Taken together, these observations support that FN may provide immediate skin hydration and a modest, time-limited reduction in TEWL. More effective and long-term improvements in the skin barrier function are likely to depend on the prolonged use of the product rather than a single application. Because these comparisons involve multiple cheeks and time points analyzed using separate tests, the reported p-values should be interpreted as exploratory indicators of potential treatment differences rather than confirmatory evidence of robust longitudinal effects.
3.9.4. Melanin Index on the Cheeks (8 Weeks)
Changes in melanin index on both cheeks were evaluated over 8 weeks using a Mexameter MX-18 (Table 6). On the right cheek, both FS and FN showed a general tendency toward reduced melanin index relative to baseline, but a statistically significant within-group reduction was observed only for FS at week 6 (baseline median 161.6 [IQR 130.6–223.0] vs. 133.9 [IQR 107.5–182.2]; Wilcoxon signed-rank test, p = 0.02), whereas FN did not exhibit any significant change at this or other time points (all p > 0.05). When comparing formulations, a significant between-group difference was detected only at week 6 on the right cheek, where FS produced a greater reduction in melanin index than FN (p = 0.02), while inter-group differences at weeks 5, 7, and 8 were not significant (p > 0.05), indicating broadly comparable depigmenting effects over the full 8-week period.
Table 6.
Melanin index on the cheeks during the 8-week study and statistical comparison between FS and FN (Mexameter MX-18).
On the left cheek, both formulations showed modest decreases in melanin index over time, but none of the within-group changes from baseline or between-group comparisons reached statistical significance at any time point (all p > 0.05), suggesting that FS and FN provided similar and limited depigmenting effects on this side during the study period.
3.9.5. Erythema—Right Cheek (8 Weeks)
Changes in erythema on both cheeks were assessed over 8 weeks using a Mexameter MX 18 (Table 7). On the right cheek, both FS and FN showed reduced erythema relative to baseline; however, statistically significant within-group reductions were observed for FS at weeks 6–8 and for FN at weeks 7–8, while no significant between-group differences were detected at any time point (all p > 0.05).
Table 7.
Erythema index on the cheeks during the 8-week study and statistical comparison between FS and FN.
On the left cheek, both formulations produced significant within-group reductions from week 5 onward. FS showed non-normally distributed data at week 7 and was therefore summarized as median (IQR) and analyzed using the Wilcoxon signed-rank test. In contrast, the remaining within-group comparisons were analyzed using paired t-tests. No significant differences between FS and FN were observed on the left cheek at any visit (all p > 0.05), indicating comparable anti-erythema effects for the two formulations.
3.9.6. Skin Hydration (8 Weeks)
Changes in skin hydration on both cheeks were measured using a Corneometer CM 825 hydration meter for 8 weeks (Table 8). On the right cheek, both FS and FN showed an increase in hydration compared to baseline. However, a statistically significant in-group improvement was found only in the FN group from week 6 onwards, while FS showed a slight increase at week 8 (p = 0.05). Intergroup comparisons showed a significant difference only at week 7, when FN had higher hydration than FS (p = 0.03). No significant difference was found at weeks 5, 6, or 8.
Table 8.
Skin hydration on the cheeks during the 8-week study and statistical comparison between FS and FN.
On the left cheek, both formulations showed a slight increase in hydration over time, but no in-group comparisons reached statistical significance for either FS or FN. FS data at week 6 were non-normally distributed. Therefore, the median (IQR) was summarized and analyzed using the Wilcoxon signed-rank test. Comparisons between groups showed that hydration levels were significantly higher in the FN group than in the FS group at week 6 (p = 0.04), while comparisons at week 7 were similar (p = 0.05), and subsequent measurements did not show significant differences.
3.9.7. Transepidermal Water Loss (TEWL) (8 Weeks)
Long-term changes in transepidermal water loss (TEWL) on both cheeks were evaluated over 8 weeks using a Tewameter TM300 (Table 9). On the right cheek, both FS and FN produced significant within-group reductions in TEWL from week 5 onward compared with baseline (all p < 0.05), indicating improved barrier function in both groups. In the FS group, TEWL values at weeks 5–8 were non-normally distributed and were therefore summarized as median (IQR) and analyzed using the Wilcoxon signed-rank test, whereas FN data remained approximately normal and were assessed using paired t tests. However, no significant differences between groups were observed at any visit (all p > 0.05), indicating that the barrier-strengthening effects of FS and FN on the right cheek were equivalent over 8 weeks.
Table 9.
TEWL on the cheeks during the 8-week study and statistical comparison between FS and FN.
TEWL was also significantly lower on the left cheek in FS and FN from week 5 onwards compared to baseline (all p < 0.05), confirming a sustained improvement of barrier integrity also on this side. FS data were usually normally distributed and analyzed using paired t-tests, while FN data at some visits showed non-normal distributions and were therefore reported as median (IQR) and analyzed by the Wilcoxon signed rank test. When comparisons were made independently, FN showed significantly greater reductions in TEWL compared to FS at weeks 6–8 (p ≤ 0.02), suggesting that the niosome-based formulation might provide a somewhat greater long-term barrier repair effect on the left cheek.
Overall, the niosomal serum (FN) tended to show higher hydration than the free extract serum (FS) from mid-study onwards, with several time points reaching nominal statistical significance, whereas differences in TEWL were modest and limited to selected time points.
4. Discussion
4.1. Main Findings
The factorial design not only identified a statistically optimized ratio of the five-herb core combination for tyrosinase inhibition but also aligned with a mechanistic rationale in which the blend acts through multimodal antimelanogenic pathways, as summarized in Figure 3. These phytochemical profiles suggest that the five-herb core acts via at least three complementary mechanisms: direct tyrosinase inhibition by oxyresveratrol and P. emblica tannins, upstream downregulation of melanogenic transcriptional machinery by C. asiatica triterpenes and P. emblica-derived polyphenols, and broad antioxidant/anti-inflammatory protection from M. hortensis and P. indica that dampens ROS- and cytokine-driven melanocyte activation.
Consistent with this multimodal concept, the clinical study showed more pronounced improvements in hydration and transepidermal water loss than in melanin index, suggesting that barrier strengthening and redox modulation are predominant early outcomes of the five-herb core combination and the additional T. chebula extract under the present 8-week regimen. The modest but favorable trends in melanin reduction, together with significant decreases in erythema, appear compatible with a gradual, indirect impact on melanogenesis mediated by improved barrier function, reduced oxidative stress, and attenuation of subclinical inflammation rather than a strong standalone depigmenting effect. The modest melanin changes, despite substantial in vitro tyrosinase inhibition, are unsurprising because clinical depigmentation depends on factors beyond microplate enzyme assays, including dermal penetration, epidermal turnover, UV exposure, and the 8-week treatment duration. In this study, skin permeation and ex vivo penetration was not directly assessed, so the in vitro–in vivo discrepancy should be viewed as a limitation and a key focus for future work using transdermal and ex vivo skin models.
Taken together, these observations indicate that the five-herb extract composition used in this study should be regarded as a promising candidate core blend whose interaction effects were identified within the factorial design space, while the overall in vitro and clinical outcomes reflect the combined contributions of this five-herb core, the supplementary T. chebula extract, and the serum vehicle.
4.2. Skin Hydration
The 8-week corneometric data suggest that the niosome-formulation (FN) provided a more consistent hydration benefit than the non-niosomal (free extract) serum (FS), especially on the right cheek, where significant within-group improvements were observed from week 6 onwards, and a between-group difference was observed at week 7. This pattern is consistent with the reported ability of niosomal systems to modify the skin-surface residence and delivery behavior of associated constituents. However, extract association, release behavior, and skin deposition were not directly assessed in the present study; therefore, any relationship between the niosomal serum format and the observed hydration differences remains tentative [42]. The lack of consistent superiority of FN at every visit, especially on the left cheek, may reflect substantial inter-individual variability, site-dependent differences in baseline hydration, and the relatively small per-group sample size, all of which can attenuate statistical power in cosmetic efficacy studies.
Mechanistically, the hydration response is plausibly attributable to both the vehicle and the phytochemical composition of the formulation. The serum base has humectant effects, and vesicular delivery may have increased retention and cutaneous availability of plant-derived polyphenols and triterpenes that help maintain barrier homeostasis under oxidative stress conditions [43,44]. The modest and side-dependent magnitude of change also suggests that the moisturizing effect of the formulation is real but not dominant and that longer treatment duration. Future studies should characterize vesicle size distribution, extract association, and release behavior to better understand the physicochemical properties of the niosomal serum and their potential relationship to skin-performance outcomes.
4.3. TEWL
The long-term TEWL results support the hydration findings by showing that both FS and FN improved barrier function over time. TEWL decreased markedly from week 5 onwards on the right cheek for both formulations and on the left cheek for both groups. FN showed a bigger drop in TEWL on the left cheek than FS did on the right cheek at weeks 6–8. There was no difference between the two groups on the right cheek. The present findings suggest a possible contribution of the niosomal serum format to the greater reduction in TEWL observed on the left cheek. However, because this pattern was not consistent across facial sites and the analyses were exploratory, no definitive formulation-related advantage can be concluded. This interpretation is in line with the current evidence that niosomes can improve topical performance through enhanced skin contact, altered interactions of the vesicular dispersion with the skin surface, and more efficient interaction of active compounds with the superficial epidermis [41]. Mechanistically, the reduction in TEWL observed can most likely be attributed to the combined contribution of the serum base and the antioxidant and anti-inflammatory properties of the herbal blend. C. asiatica triterpenes are well known for barrier-supportive and skin-repair effects, while phenolic-rich extracts from P. emblica, P. indica, and M. hortensis may contribute to the reduction in oxidative processes that impair epidermal integrity [42,43]. The greater response in the left cheek observed with FN may be due to the greater persistence or bioavailability of these actives at the skin surface provided by niosomal delivery. However, the side-specific effect and small cohort size should be considered with caution, and the data are best interpreted as evidence of a trend towards improved barrier repair rather than definitive proof of universal superiority.
4.4. Melanin Index
The melanin data show that depigmenting efficacy in vivo was modest over the 8 weeks, with a statistically significant within-group reduction observed only for FS on the right cheek at week 6 and no consistent superiority of FN over FS. The significance of this finding is that the optimised five-herb formulation was derived from a strong in vitro tyrosinase-inhibitory rationale, particularly the role of A. lakoocha and P. emblica [14,45,46,47], but the clinical pigmentation effect was modest. The mismatch between in vitro enzyme inhibition and in vivo facial pigmentation is not surprising because visible melanin reduction requires not only biochemical suppression of melanogenesis but also adequate skin penetration, active stability, turnover of pigmented keratinocytes, baseline sun exposure, and treatment duration [48,49,50]. The transient benefit of FS at week 6 may be a result of greater immediate availability of free phenolics in the conventional free extract serum, whereas vesicular formulations can exhibit lower short-term bioactivity when release is delayed despite other delivery advantages. The biological plausibility of the phytochemical extract system selected is further supported by the consistent superior anti-melanogenic activity of the major constituent associated with A. lakoocha, oxyresveratrol, as a potent tyrosinase inhibitor in mechanistic studies [45,46,47]. Nevertheless, the present clinical results suggest that the concentration reaching relevant epidermal targets may have been insufficient to induce a robust whitening response within 8 weeks or that the main benefit of the formula lies more in skin conditioning and anti-inflammatory support than in strong short-term depigmentation. These findings are best framed as evidence of limited but detectable pigment-modulating potential rather than as conclusive skin-lightening efficacy.
4.5. Erythema
The erythema results were more convincing than the melanin outcomes, as both formulations reduced redness over time, and significant within-group improvements were observed on both cheeks, particularly from week 5 onwards on the left cheek and from weeks 6 to 8 on the right cheek for FS. However, the absence of significant between-group differences suggests that no clear formulation-related advantage of the niosomal serum over the conventional free extract serum was demonstrated for erythema reduction under the exploratory conditions of the present study. This pattern suggests that the anti-redness activity was largely driven by the intrinsic bioactivity of the herbal combination itself, rather than by a major delivery-dependent advantage of FN. Such an interpretation is biologically plausible, as the selected Thai herbs include several classes of compounds with antioxidant and anti-inflammatory activities, including phenolic acids, flavonoids, and triterpenes, which may contribute to reducing the subclinical irritation and oxidative microinflammation associated with facial erythema. This finding is particularly relevant for C. asiatica with its triterpenes [44] associated with skin soothing and recovery, and P. emblica [14] and other similar phenolic-rich extracts that could potentially reduce oxidative triggers that maintain erythematous responses. Overall, the erythema data suggest that both formulations were well-tolerated and capable of improving visible redness over time, but do not support a specific claim for superior clinical anti-inflammatory performance of niosomal formulation.
4.6. Limitations
The present in vitro antioxidant and tyrosinase assays employed relatively short incubation times and were not designed to fully characterize release kinetics from the vesicular carriers. Future studies with extended incubation periods and more detailed mechanistic experiments on vesicle mediated release and skin deposition will be required to better relate these acute enzyme inhibition data to the sustained clinical effects observed for the niosomal serum.
The clinical statistical analysis also has important limitations. Several baseline values showed small differences between treatment groups and facial sites, and repeated measurements were analyzed using separate tests at multiple time points rather than a repeated-measures or mixed-effects model. This analytical approach does not fully account for within-subject correlation and may increase the risk of false-positive findings. Accordingly, observed time-point-specific p-values are reported as nominal and should be interpreted cautiously, and future studies with larger sample sizes will apply mixed-effects or repeated-measures models including treatment, time, treatment × time interaction, and baseline values as covariates to more rigorously evaluate longitudinal treatment effects.
This single-centre, randomized, single-blind trial included 50 volunteers, of whom only 30 completed the 8-week efficacy phase and were analysed per protocol. The relatively small sample size and per-protocol analysis may reduce the statistical power to detect modest but clinically relevant differences between formulations and increase the imprecision of effect estimates. Consequently, the findings should be interpreted with caution and regarded as exploratory, and confirmation in larger, adequately powered multicentre trials is warranted.
Supplementary Materials
The following supporting information can be downloaded at: https://www.mdpi.com/article/10.3390/cosmetics13050224/s1. Table S1: Analysis of variance for the selected R3FI factorial model of tyrosinase inhibition; Table S2: Model diagnostic statistics for the selected R3FI factorial model of tyrosinase inhibition; Supplementary File S1: Completed CONSORT 2025 checklist.
Author Contributions
Conceptualization, O.A.; methodology, O.A.; software, O.A.; validation, O.A.; formal analysis, O.A.; investigation, O.A.; resources, O.A.; data curation, J.C., W.S. and O.A.; writing—original draft preparation, O.A.; writing—review and editing, J.C., W.S. and O.A.; visualization, O.A.; supervision, O.A.; project administration, O.A.; funding acquisition, O.A.; W.S. All authors have read and agreed to the published version of the manuscript.
Funding
This research was funded by Thailand Science Research and Innovation, Grant Number 216338.
Institutional Review Board Statement
This study was conducted in accordance with the ethical standards and was approved by the Ethics Committee of Phranakhon Rajabhat University, Bangkok, Thailand (IRB No. 02.013/69; approved on 27 March 2026). The study was registered with the Thai Clinical Trials Registry (TCTR No. TCTR20260820007, registration date: 20 August 2026).
Informed Consent Statement
Informed consent was obtained from all subjects involved in the study.
Data Availability Statement
The data presented in this study are available in this article.
Acknowledgments
The authors would like to extend their sincere appreciation to the Faculty of Science and Technology, Phranakhon Rajabhat University, for their support in terms of laboratory equipment and facilities.
Conflicts of Interest
The authors declare no conflicts of interest.
References
- Chatatikun, M.; Chiabchalard, A. Thai plants with high antioxidant levels, free radical scavenging activity, anti-tyrosinase and anti-collagenase activity. BMC Complement. Altern. Med. 2017, 17, 487. [Google Scholar] [CrossRef] [Scilit]
- Sungthong, B.; Phadungkit, M. Anti-Tyrosinase and DPPH Radical Scavenging Activities of Selected Thai Herbal Extracts Traditionally Used as Skin Toner. Pharmacogn. J. 2015, 7, 97–101. [Google Scholar] [CrossRef] [Scilit]
- Saeio, K.; Chaiyana, W.; Okonogi, S. Antityrosinase and antioxidant activities of essential oils of edible Thai plants. Drug Discov. Ther. 2011, 5, 144–149. [Google Scholar] [CrossRef] [Scilit]
- Rachkeeree, A.; Kantadoung, K.; Puangpradub, R.; Suksathan, R. Phytochemicals, Antioxidants and Anti-tyrosinase Analyses of Selected Ginger Plants. Pharmacogn. J. 2020, 12, 872–883. [Google Scholar] [CrossRef] [Scilit]
- Ahmad, B.; Hafeez, N.; Rauf, A.; Bashir, S.; Linfang, H.; Rehman, M.-u.; Mubarak, M.S.; Uddin, M.S.; Bawazeer, S.; Shariati, M.A.; et al. Phyllanthus emblica: A comprehensive review of its therapeutic benefits. S. Afr. J. Bot. 2021, 138, 278–310. [Google Scholar] [CrossRef] [Scilit]
- Hullatti, P.; Raichur, U.G.; Dabadi, P.; Krupanidhi, A.M. The Indian cork tree–Millingtonia hortensis: Bridging traditional wisdom and modern medicine. Int. J. Pharmacol. Pharm. Sci. 2025, 7, 22–28. [Google Scholar] [CrossRef] [Scilit]
- Sitorus, P.; Keliat, J.M.; Asfianti, V.; Muhammad, M.; Satria, D. A Literature Review of Artocarpus lacucha Focusing on the Phytochemical Constituents and Pharmacological Properties of the Plant. Molecules 2022, 27, 6940. [Google Scholar] [CrossRef] [Scilit]
- Laovachirasuwan, P.; Phadungkit, M.; Namsawang, T.; Khumphuwiang, J.; Chaemphudsa, C. Oxyresveratrol Content and Tyrosinase Inhibitory Activity of Artocarpus lakoocha Heartwood Extract. J. Sci. Technol. Mahasarakham Univ. 2015, 34, 547–550. [Google Scholar]
- Hein, Z.M.; Gopalakrishna, P.K.; Kanuri, A.K.; Thomas, W.; Hussan, F.; Naik, V.R.; Shantakumari, N.; Che Ramli, M.D.; Mohd Moklas, M.A.; Che Mohd Nassir, C.M.N.; et al. Centella asiatica: Advances in Extraction Technologies, Phytochemistry, and Therapeutic Applications. Life 2025, 15, 1081. [Google Scholar] [CrossRef] [Scilit]
- Chan, E.W.C.; Ng, Y.K.; Wong, S.K.; Chan, H.T. Pluchea indica: An updated review of its botany, uses, bioactive compounds and pharmacological properties. Pharm. Sci. Asia 2022, 49, 77–85. [Google Scholar] [CrossRef] [Scilit]
- Zuo, A.R.; Dong, H.H.; Yu, Y.Y.; Shu, Q.L.; Zheng, L.X.; Yu, X.Y.; Cao, S.W. The antityrosinase and antioxidant activities of flavonoids dominated by the number and location of phenolic hydroxyl groups. Chin. Med. 2018, 13, 51. [Google Scholar] [CrossRef] [Scilit]
- Wang, Y.; Hao, M.M.; Sun, Y.; Wang, L.F.; Wang, H.; Zhang, Y.J.; Li, H.Y.; Zhuang, P.W.; Yang, Z. Synergistic Promotion on Tyrosinase Inhibition by Antioxidants. Molecules 2018, 23, 106. [Google Scholar] [CrossRef] [Scilit]
- Sanadi, R.M.; Deshmukh, R.S.; Kale, A.D.; Antony, V.V.; Sheikh, S. Vitamin C as a probable inhibitor of tyrosinase (Tyr) and tyrosinase-related protein-1 (TRP-1) in human gingiva: An analytical study. J. Oral. Maxillofac. Pathol. 2025, 29, 281–285. [Google Scholar] [CrossRef] [Scilit]
- Prananda, A.T.; Dalimunthe, A.; Harahap, U.; Simanjuntak, Y.; Peronika, E.; Karosekali, N.E.; Hasibuan, P.A.Z.; Syahputra, R.A.; Situmorang, P.C.; Nurkolis, F. Phyllanthus emblica: A comprehensive review of its phytochemical composition and pharmacological properties. Front. Pharmacol. 2023, 14, 1288618. [Google Scholar] [CrossRef] [Scilit]
- Chaikul, P.; Kanlayavattanakul, M.; Somkumnerd, J.; Lourith, N. Phyllanthus emblica L. (amla) branch: A safe and effective ingredient against skin aging. J. Tradit. Complement. Med. 2021, 11, 390–399. [Google Scholar] [CrossRef] [Scilit]
- Choi, M.-H.; Shin, H.-J. Anti-Melanogenesis Effect of Quercetin. Cosmetics 2016, 3, 18. [Google Scholar] [CrossRef] [Scilit]
- Mucha, M.; Skrzydlewska, E.; Gegotek, A. Natural protection against oxidative stress in human skin melanocytes. Commun. Biol. 2025, 8, 1283. [Google Scholar] [CrossRef] [Scilit]
- Janaki, A.; Kaleena, P.K.; Elumalai, D.; Hemalatha, P.; Babu, M.; Velu, K.; Sudha Ravi, R. Phytochemical Screening, Antioxidant and Antibacterial Activities of Millingtonia hortensis (L.). Int. J. Curr. Pharm. Res. 2017, 9, 162–167. [Google Scholar] [CrossRef] [Scilit]
- Kaur, P.; Chandel, M.; Gill, N.S. Millingtonia hortensis: Powerhouse for Treatment of Multiple Ailments. Int. J. Creat. Res. Thoughts 2025, 13, c947–c958. [Google Scholar]
- Tengamnuay, P.; Pengrungruangwong, K.; Pheansri, I.; Likhitwitayawuid, K. Artocarpus lakoocha heartwood extract as a novel cosmetic ingredient: Evaluation of the in vitro anti-tyrosinase and in vivo skin whitening activities. Int. J. Cosmet. Sci. 2006, 28, 269–276. [Google Scholar] [CrossRef] [Scilit]
- Singhatong, S.; Leelarungrayub, D.; Chaiyasut, C. Antioxidant and Toxicity Activities of Artocarpus lakoocha Roxb. Heartwood Extract. J. Med. Plants Res. 2010, 4, 947–953. [Google Scholar] [CrossRef]
- Trisat, K.; Limpeanchob, N. Impact of Artocarpus lakoocha heartwood extract and Oxyresveratrol on cholesterol digestion and absorption in Caco-2 cell cultures. J. Appl. Pharm. Sci. 2025, 15, 65–71. [Google Scholar] [CrossRef] [Scilit]
- Wongkattiya, N.; Sanguansermsri, P.; Fraser, I.; Shuayprom, A.; Pongmuangmul, S.; Koranee, R.; Khampan, P.; Sanguansermsri, D. Oxyresveratrol Derived from Artocarpus lakoocha Extract Represents a Potential Natural Agent for Treating Acne and Skin Inflammation. J. Appl. Pharm. Sci. 2025, 15, 50–57. [Google Scholar] [CrossRef] [Scilit]
- Zeng, W.; Li, H.; Liu, S.; Luo, Z.; Chen, J.; Zhou, J. Biosynthesis and bioactivities of triterpenoids from Centella asiatica: Challenges and opportunities. Biotechnol. Adv. 2025, 80, 108541. [Google Scholar] [CrossRef] [Scilit]
- Jiang, J.; Han, R.; Ren, H.; Yao, Y.; Jiang, W. A review of neuroprotective properties of Centella asiatica (L.) Urb. and its therapeutic effects. Ann. Med. 2025, 57, 2559122. [Google Scholar] [CrossRef] [Scilit]
- Ko, K.; Cheon, G.Y.; Ha, Y.J.; Ko, Y.R.; Kim, J.H.; Seo, D.; Park, S.Y.; Lee, B.; Hong, K.B. Enhanced Skin-Protective Effects of a Novel Centella asiatica Variety (BT-Care) Cultivated for 75 Days via Modulation of Antioxidant Defense, Collagen Synthesis, and Skin Barrier Function. J. Microbiol. Biotechnol. 2025, 35, e2504036. [Google Scholar] [CrossRef] [Scilit]
- Kongkiatpaiboon, S.; Chewchinda, S.; Vongsak, B. Optimization of extraction method and HPLC analysis of six caffeoylquinic acids in Pluchea indica leaves from different provenances in Thailand. Rev. Bras. Farmacogn. 2018, 28, 145–150. [Google Scholar] [CrossRef] [Scilit]
- Cho, J.J.; Cho, C.L.; Kao, C.L.; Chen, C.M.; Tseng, C.N.; Lee, Y.Z.; Liao, L.J.; Hong, Y.R. Crude aqueous extracts of Pluchea indica (L.) Less. inhibit proliferation and migration of cancer cells through induction of p53-dependent cell death. BMC Complement. Altern. Med. 2012, 12, 265. [Google Scholar] [CrossRef] [Scilit]
- Aishah Baharuddin, S.; Nadiah Abd Karim Shah, N.; Saiful Yazan, L.; Abd Rashed, A.; Kadota, K.; Al-Awaadh, A.M.; Aniza Yusof, Y. Optimization of Pluchea indica (L.) leaf extract using ultrasound-assisted extraction and its cytotoxicity on the HT-29 colorectal cancer cell line. Ultrason. Sonochem. 2023, 101, 106702. [Google Scholar] [CrossRef] [Scilit]
- Fan, Y.F.; Zhu, S.X.; Hou, F.B.; Zhao, D.F.; Pan, Q.S.; Xiang, Y.W.; Qian, X.K.; Ge, G.B.; Wang, P. Spectrophotometric Assays for Sensing Tyrosinase Activity and Their Applications. Biosensors 2021, 11, 290. [Google Scholar] [CrossRef] [Scilit]
- Mawazi, S.M.; Ann, T.J.; Widodo, R.T. Application of Niosomes in Cosmetics: A Systematic Review. Cosmetics 2022, 9, 127. [Google Scholar] [CrossRef] [Scilit]
- Thabet, Y.; Elsabahy, M.; Eissa, N.G. Methods for preparation of niosomes: A focus on thin-film hydration method. Methods 2022, 199, 9–15. [Google Scholar] [CrossRef] [Scilit]
- Navarro-Pérez, Y.M.; Cedeño-Linares, E.; Norman-Montenegro, O.; Ruz-Sanjuan, V.; Mondeja-Rivera, Y.; Hernández-Monzón, A.M.; González-Bedia, M.M. Prediction of the Physical Stability and Quality of O/W Cosmetic Emulsions Using Full Factorial Design. J. Pharm. Pharmacogn. Res. 2021, 9, 98–112. [Google Scholar] [CrossRef] [Scilit]
- IFSCC. The Fundamentals of Stability Testing; Micelle Press: Weymouth, UK; Cranford, NJ, USA, 1992. [Google Scholar]
- Baliyan, S.; Mukherjee, R.; Priyadarshini, A.; Vibhuti, A.; Gupta, A.; Pandey, R.P.; Chang, C.M. Determination of Antioxidants by DPPH Radical Scavenging Activity and Quantitative Phytochemical Analysis of Ficus religiosa. Molecules 2022, 27, 1326. [Google Scholar] [CrossRef] [Scilit] [PubMed]
- Wang, G.-H.; Chen, C.-Y.; Lin, C.-P.; Huang, C.-L.; Lin, C.-h.; Cheng, C.-Y.; Chung, Y.-C. Tyrosinase inhibitory and antioxidant activities of three Bifidobacterium bifidum-fermented herb extracts. Ind. Crops Prod. 2016, 89, 376–382. [Google Scholar] [CrossRef] [Scilit]
- Hopewell, S.; Chan, A.-W.; Collins, G.S.; Hróbjartsson, A.; Moher, D.; Schulz, K.F.; Tunn, R.; Aggarwal, R.; Berkwits, M.; Berlin, J.A.; et al. CONSORT 2025 Statement: Updated Guideline for Reporting Randomised Trials. BMJ 2025, 389, e081123. [Google Scholar] [CrossRef] [Scilit]
- Balkrishna, A.; Verma, S.; M, P.R.; Joshi, M.; Tomer, M.; Gohel, V.; Nain, P.; Dev, R.; Varshney, A. Comprehensive phytochemical profiling of Phyllanthus emblica L. flowers on UHPLC/MS quadrupole time of flight, HPTLC, HPLC, and NMR analytical platforms reveals functional metabolites with potent anti-inflammatory effects in human (THP-1) macrophages. Phytochem. Anal. 2025, 36, 218–233. [Google Scholar] [CrossRef] [Scilit]
- Nomi, A.G.; Handayani, H.; Khuluk, R.H.; Karomah, A.H.; Wulansari, L.; Dewi Yuliana, N.; Rohaeti, E.; Rafi, M. Antioxidant activity and metabolite changes in Centella asiatica with different drying methods using FTIR- and quantitative HPLC-based metabolomics. Int. Food Res. J. 2024, 31, 228–238. [Google Scholar] [CrossRef] [Scilit]
- Jothy, S.L.; Yeng, C.; Sasidharan, S. Chromatographic and Spectral Fingerprinting of Polyalthia longifolia, a Source of Phytochemicals. BioResources 2013, 8, 5102–5119. [Google Scholar] [CrossRef] [Scilit]
- Hasan, M.M.; Miah, M.S.; Mahmud, N.; Rashid, M.H.B.; Ghos, B.C.; Barmon, J. Phytochemical Screening, Antimicrobial Activity, TLC Profiling, FTIR-ATR Spectroscopic Analysis and GC–MS Profiling of Lepisanthes rubiginosa Leaf Extract. Results Chem. 2026, 21, 103085. [Google Scholar] [CrossRef] [Scilit]
- Schreier, H.; Bouwstra, J. Liposomes and niosomes as topical drug carriers: Dermal and transdermal drug delivery. J. Control. Release 1994, 30, 1–15. [Google Scholar] [CrossRef] [Scilit]
- Sun, B.; Wu, L.; Wu, Y.; Zhang, C.; Qin, L.; Hayashi, M.; Kudo, M.; Gao, M.; Liu, T. Therapeutic Potential of Centella asiatica and Its Triterpenes: A Review. Front. Pharmacol. 2020, 11, 568032. [Google Scholar] [CrossRef] [Scilit]
- Park, K.S. Pharmacological Effects of Centella asiatica on Skin Diseases: Evidence and Possible Mechanisms. Evid. Based Complement. Altern. Med. 2021, 2021, 5462633. [Google Scholar] [CrossRef] [Scilit]
- Buapool, D.; Mongkol, N.; Chantimal, J.; Roytrakul, S.; Srisook, E.; Srisook, K. Molecular mechanism of anti-inflammatory activity of Pluchea indica leaves in macrophages RAW 264.7 and its action in animal models ofinflammation. J. Ethnopharmacol. 2013, 146, 495–504. [Google Scholar] [CrossRef] [Scilit]
- Chatsumpun, N.; Chuanasa, T.; Sritularak, B.; Lipipun, V.; Jongbunprasert, V.; Ruchirawat, S.; Ploypradith, P.; Likhitwitayawuid, K. Oxyresveratrol: Structural Modification and Evaluation of Biological Activities. Molecules 2016, 21, 489. [Google Scholar] [CrossRef] [Scilit]
- Ashokkumar, K.; Murugan, M.; Murugesan, P.; Venkatesh, T. Millingtonia hortensis L.f. (tree jasmine): Botany, ethnopharmacology, chemical constituents, biological activities of extracts and essential oils—An updated review. Discov. Plants 2025, 2, 22. [Google Scholar] [CrossRef] [Scilit]
- Li, J.; Lin, Z.; Tang, X.; Liu, G.; Chen, Y.; Zhai, X.; Huang, Q.; Cao, Y. Oxyresveratrol extracted from Artocarpus heterophyllus Lam. inhibits tyrosinase and age pigments in vitro and in vivo. Food Funct. 2020, 11, 6595–6607. [Google Scholar] [CrossRef] [Scilit]
- Prasawang, N.; Sutjarit, N.; Sitthipunya, A.; Suwannalert, P.; Monsuwan, W.; Charoenchon, N. Inhibition of Tyrosinase and Melanogenesis by a White Mulberry Fruit Extract. Int. J. Mol. Sci. 2025, 26, 7589. [Google Scholar] [CrossRef] [Scilit]
- Mulukuri, S.N.V.L.; Munchinamane, A.P.; Madhav, S.N.V.; Kumar, P. Advances in Skin Lightening Agents: Mechanisms, Efficacy, and Safety Considerations. Int. J. Pharm. Sci. 2024, 2, 998–1019. [Google Scholar] [CrossRef]
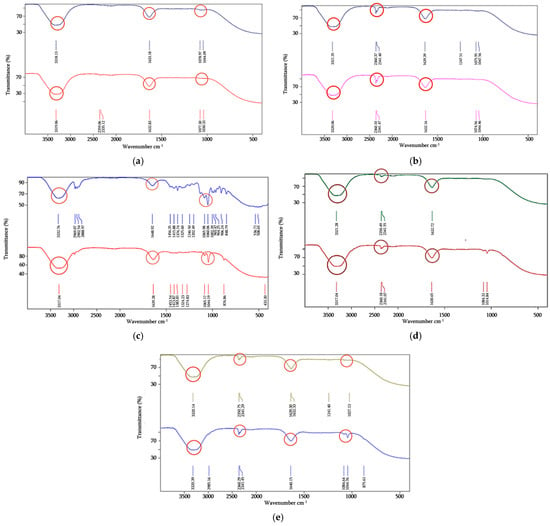
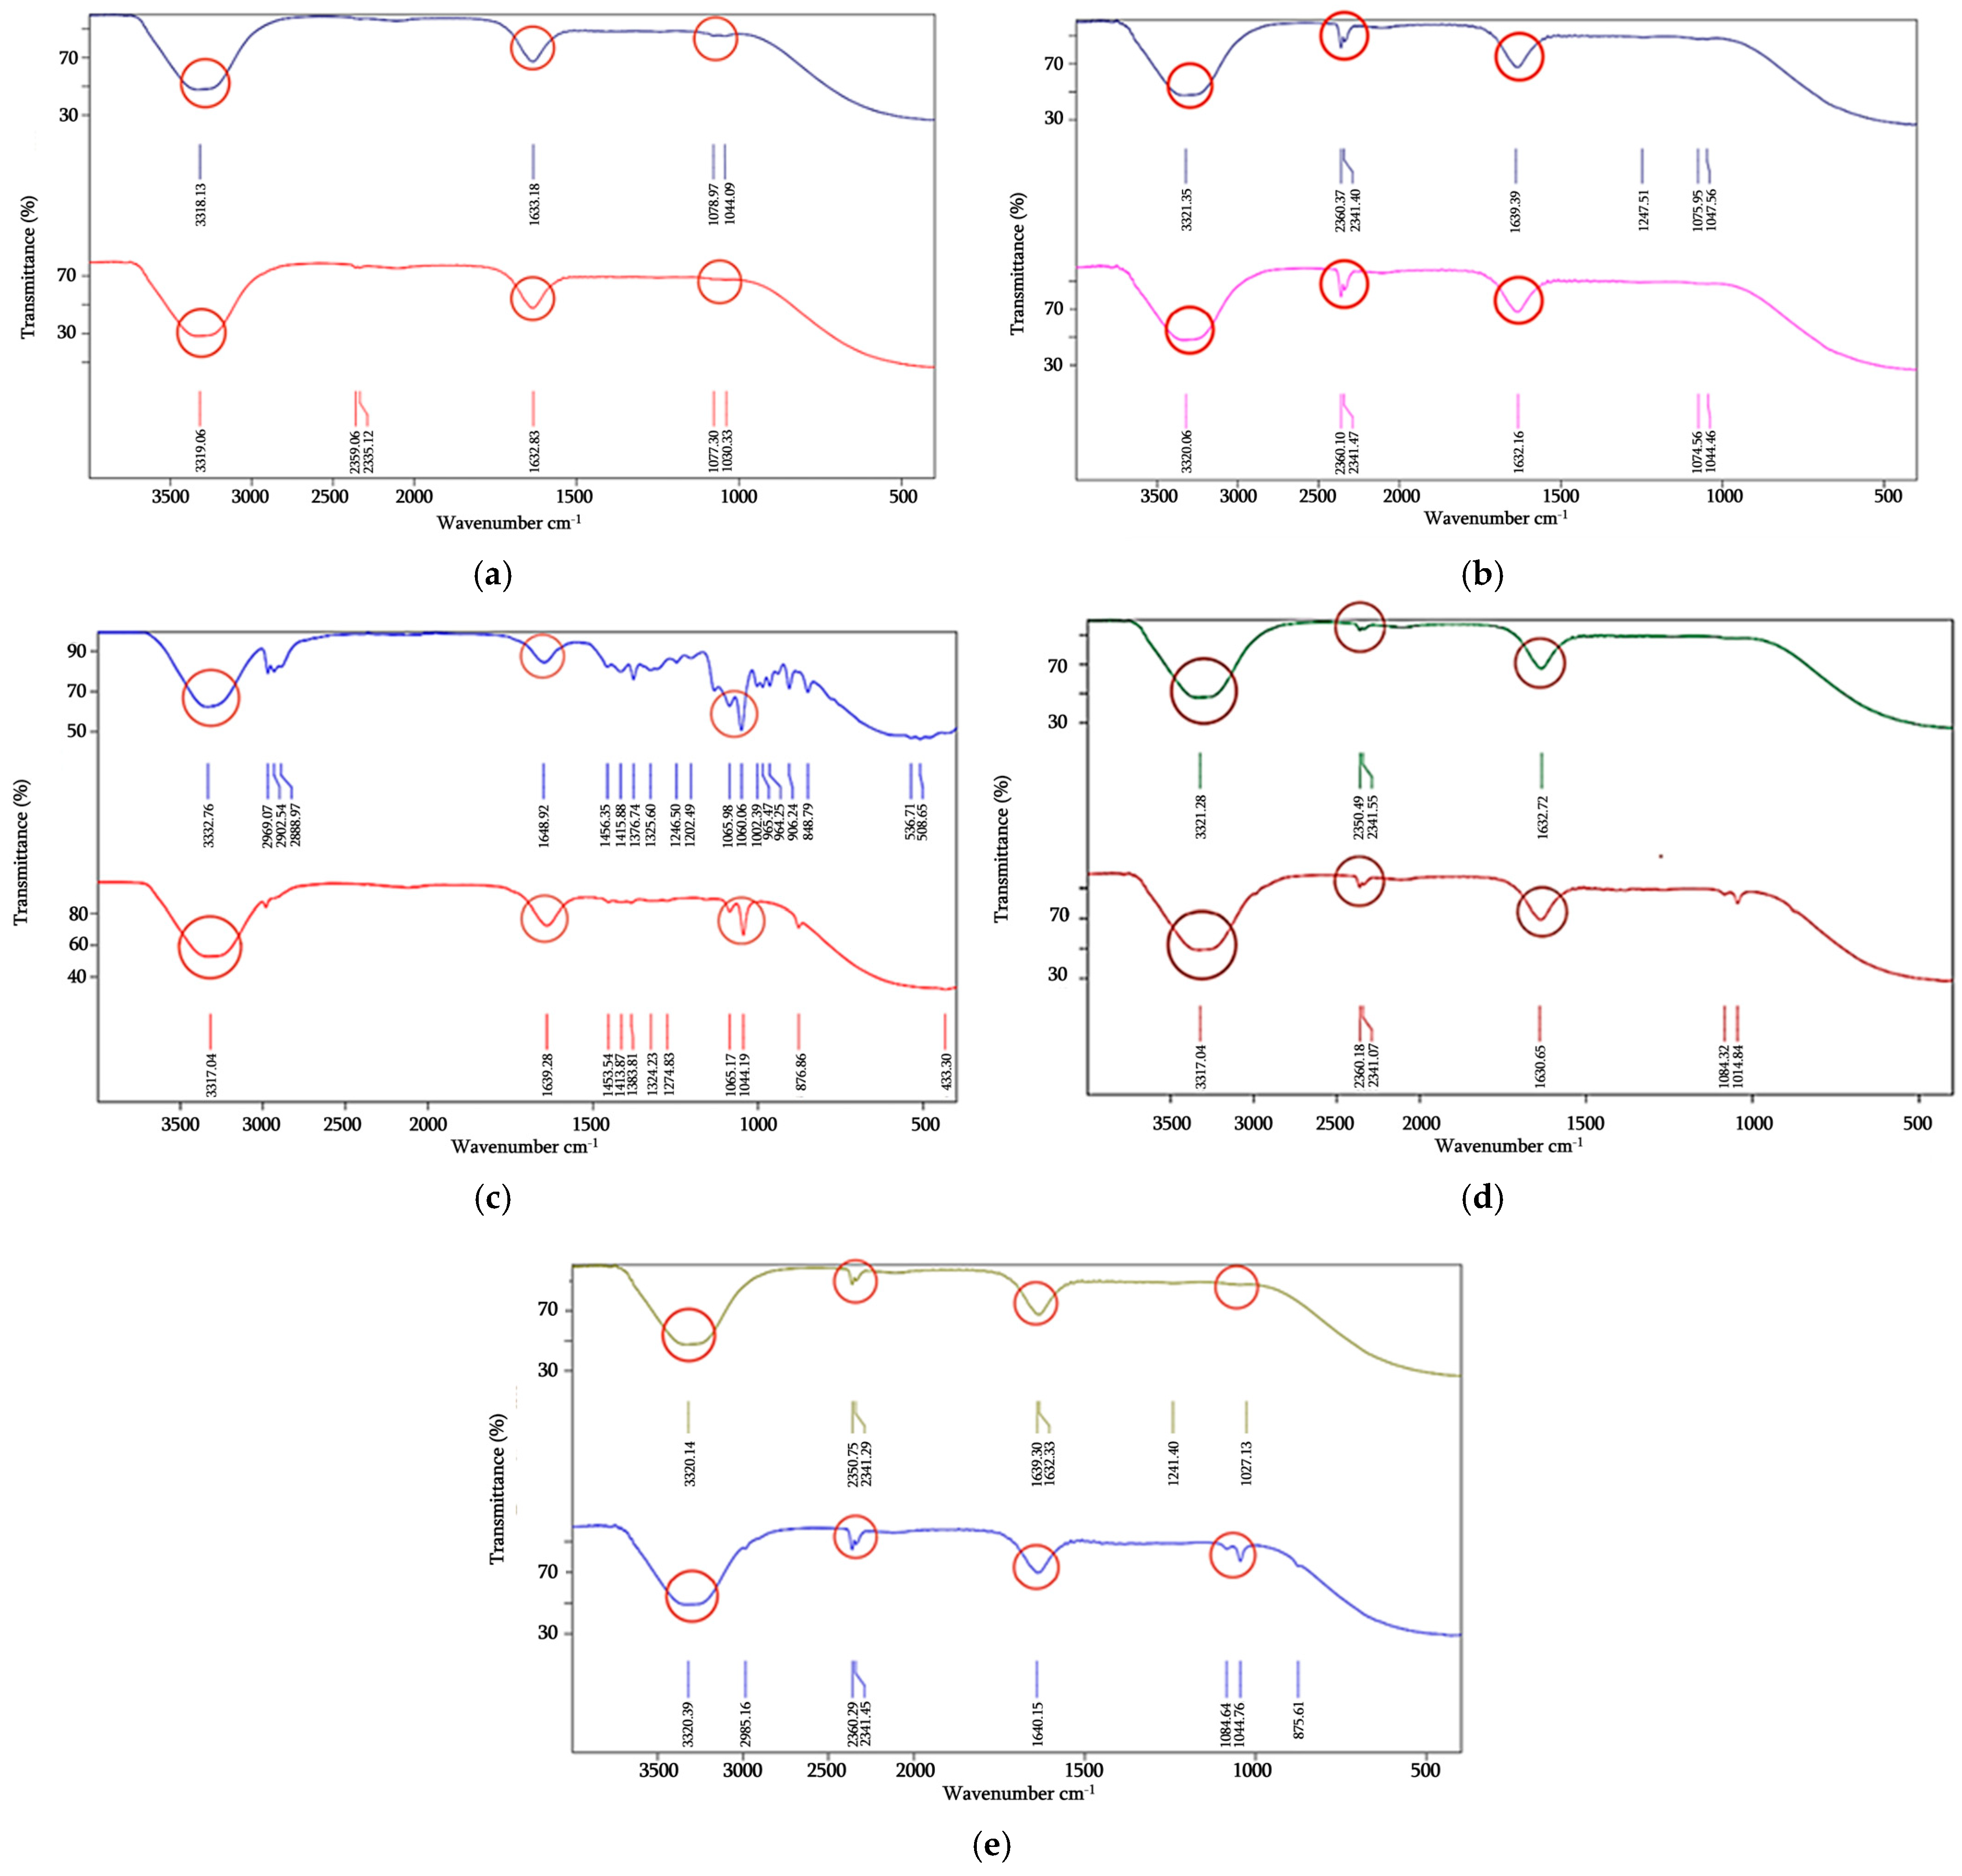
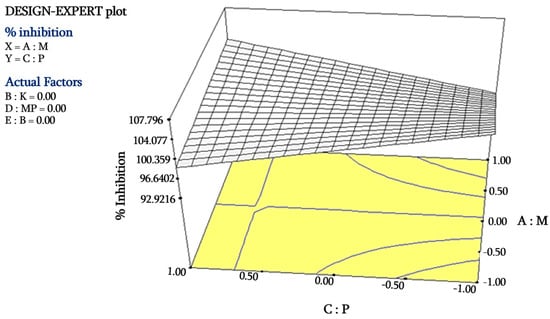
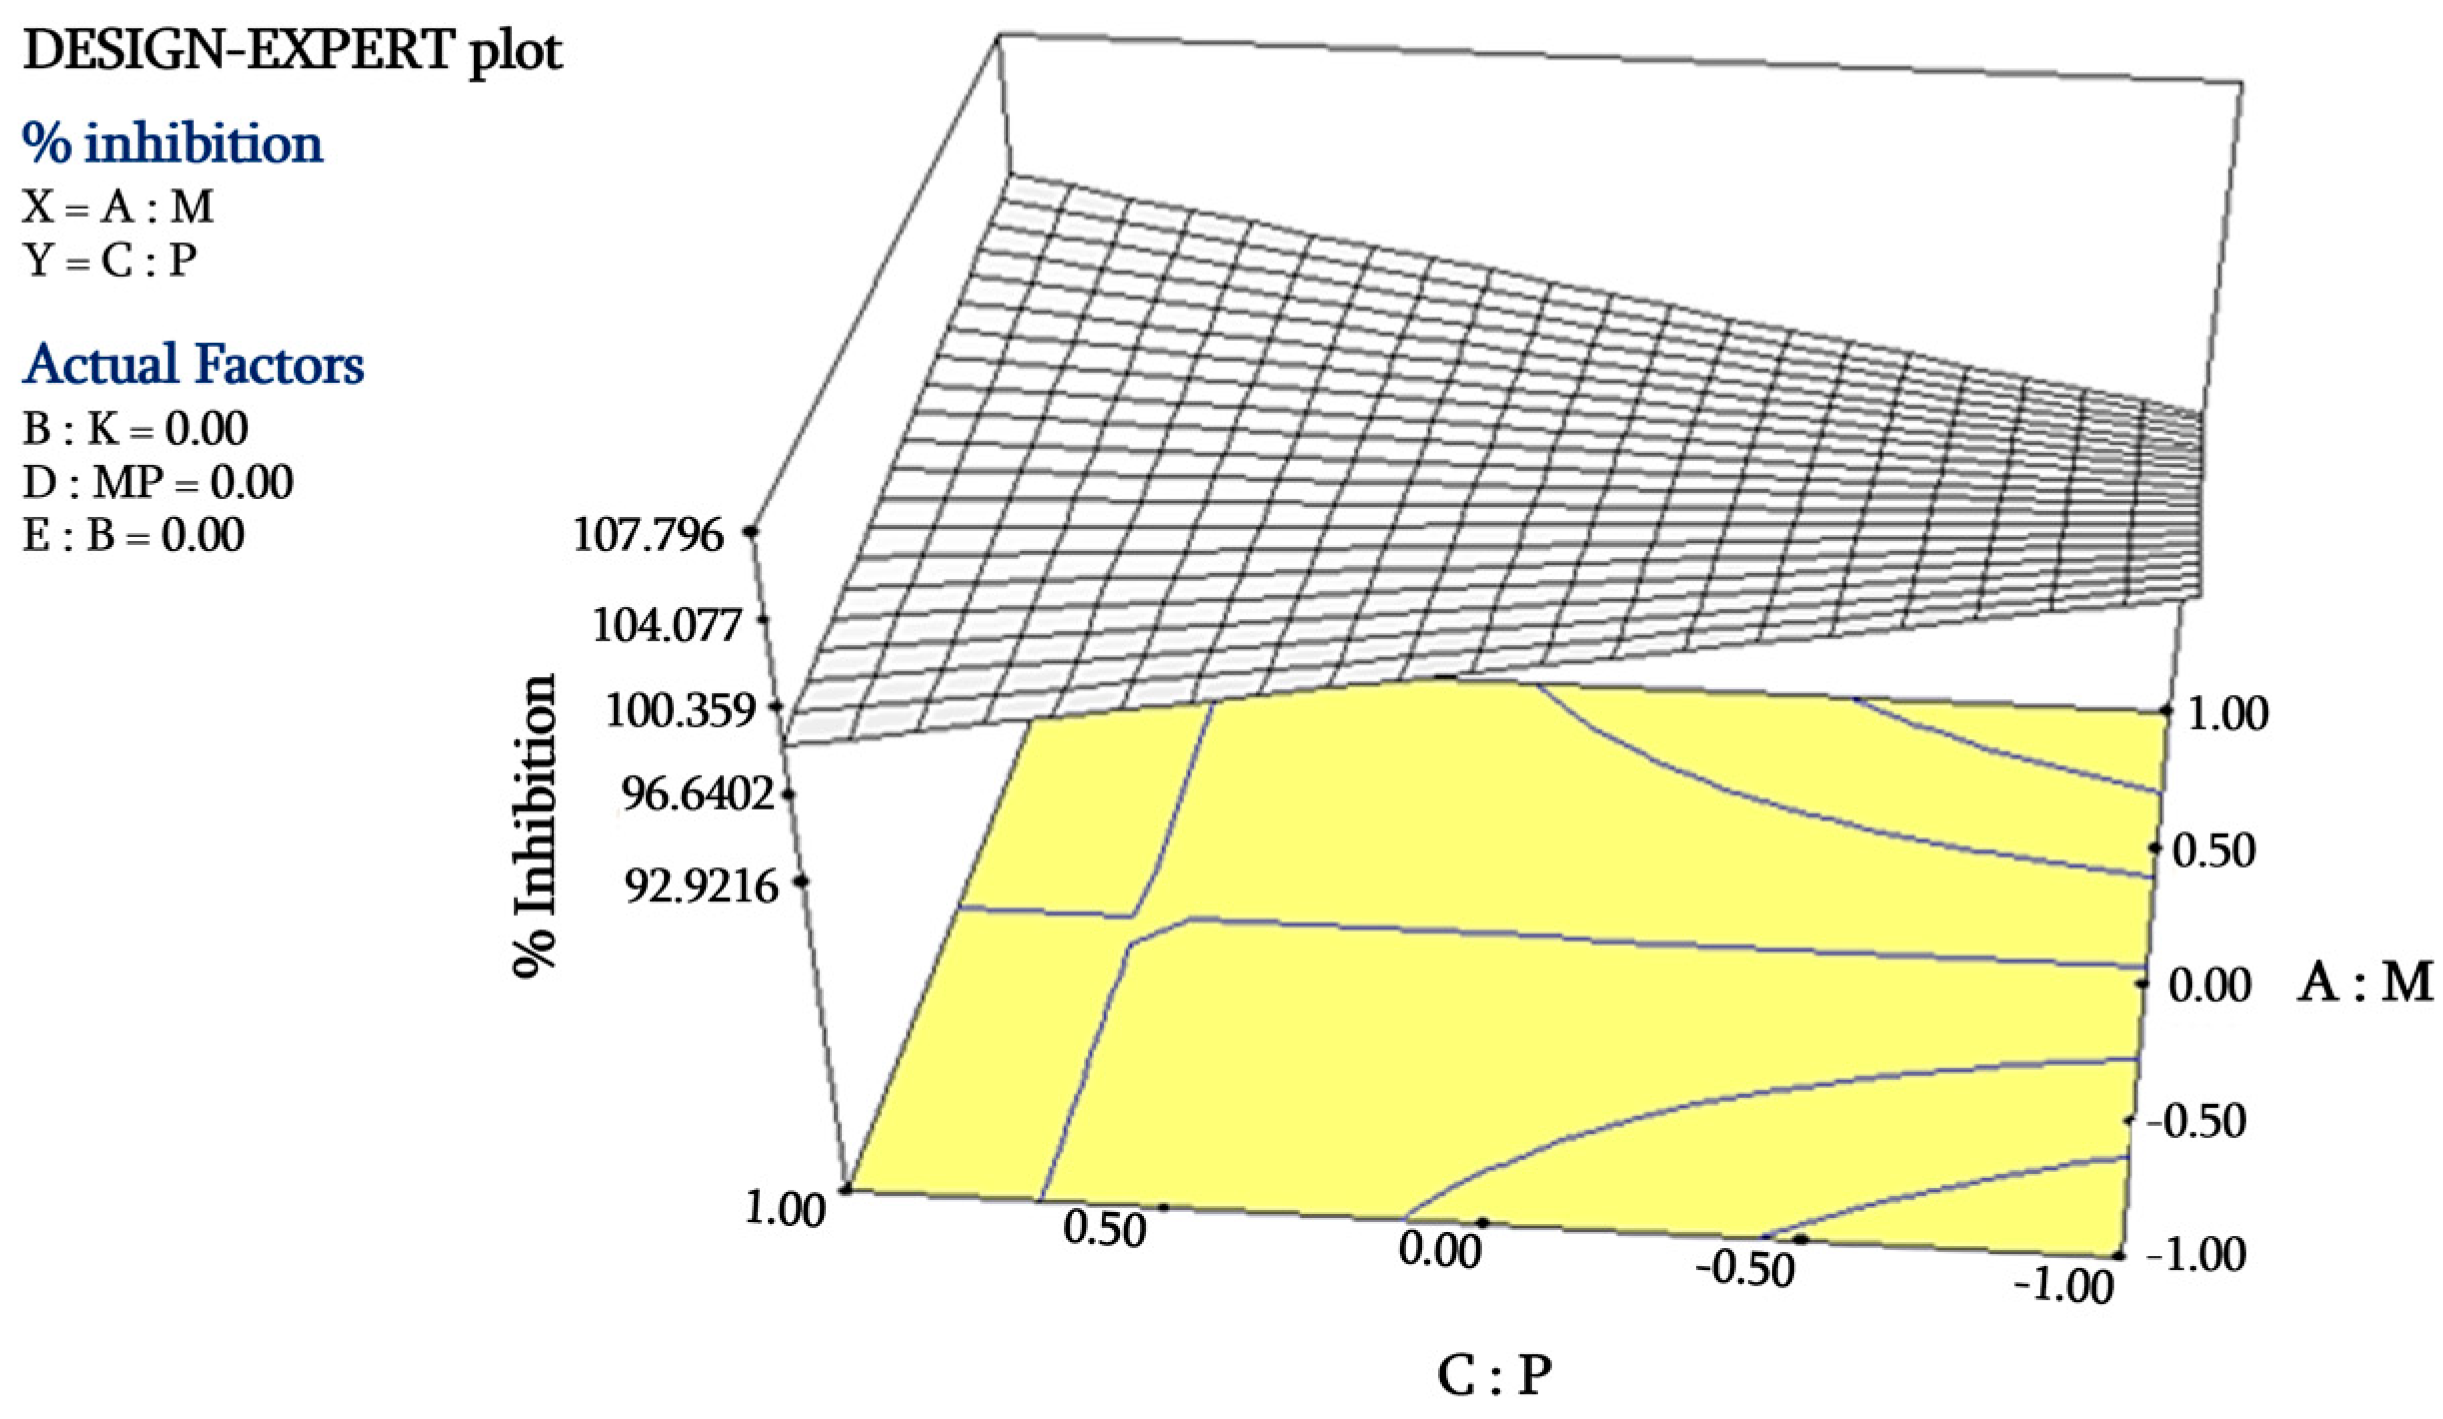
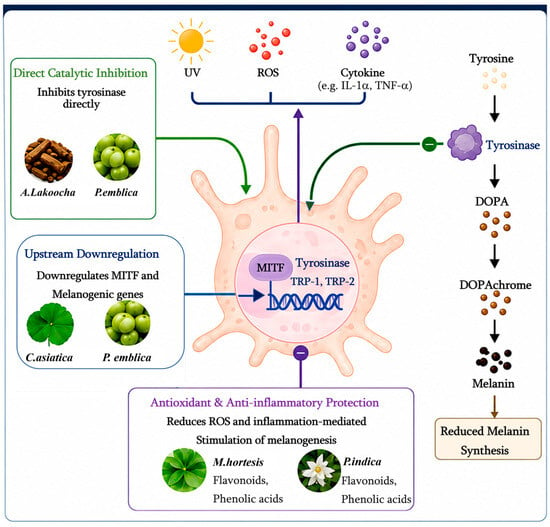
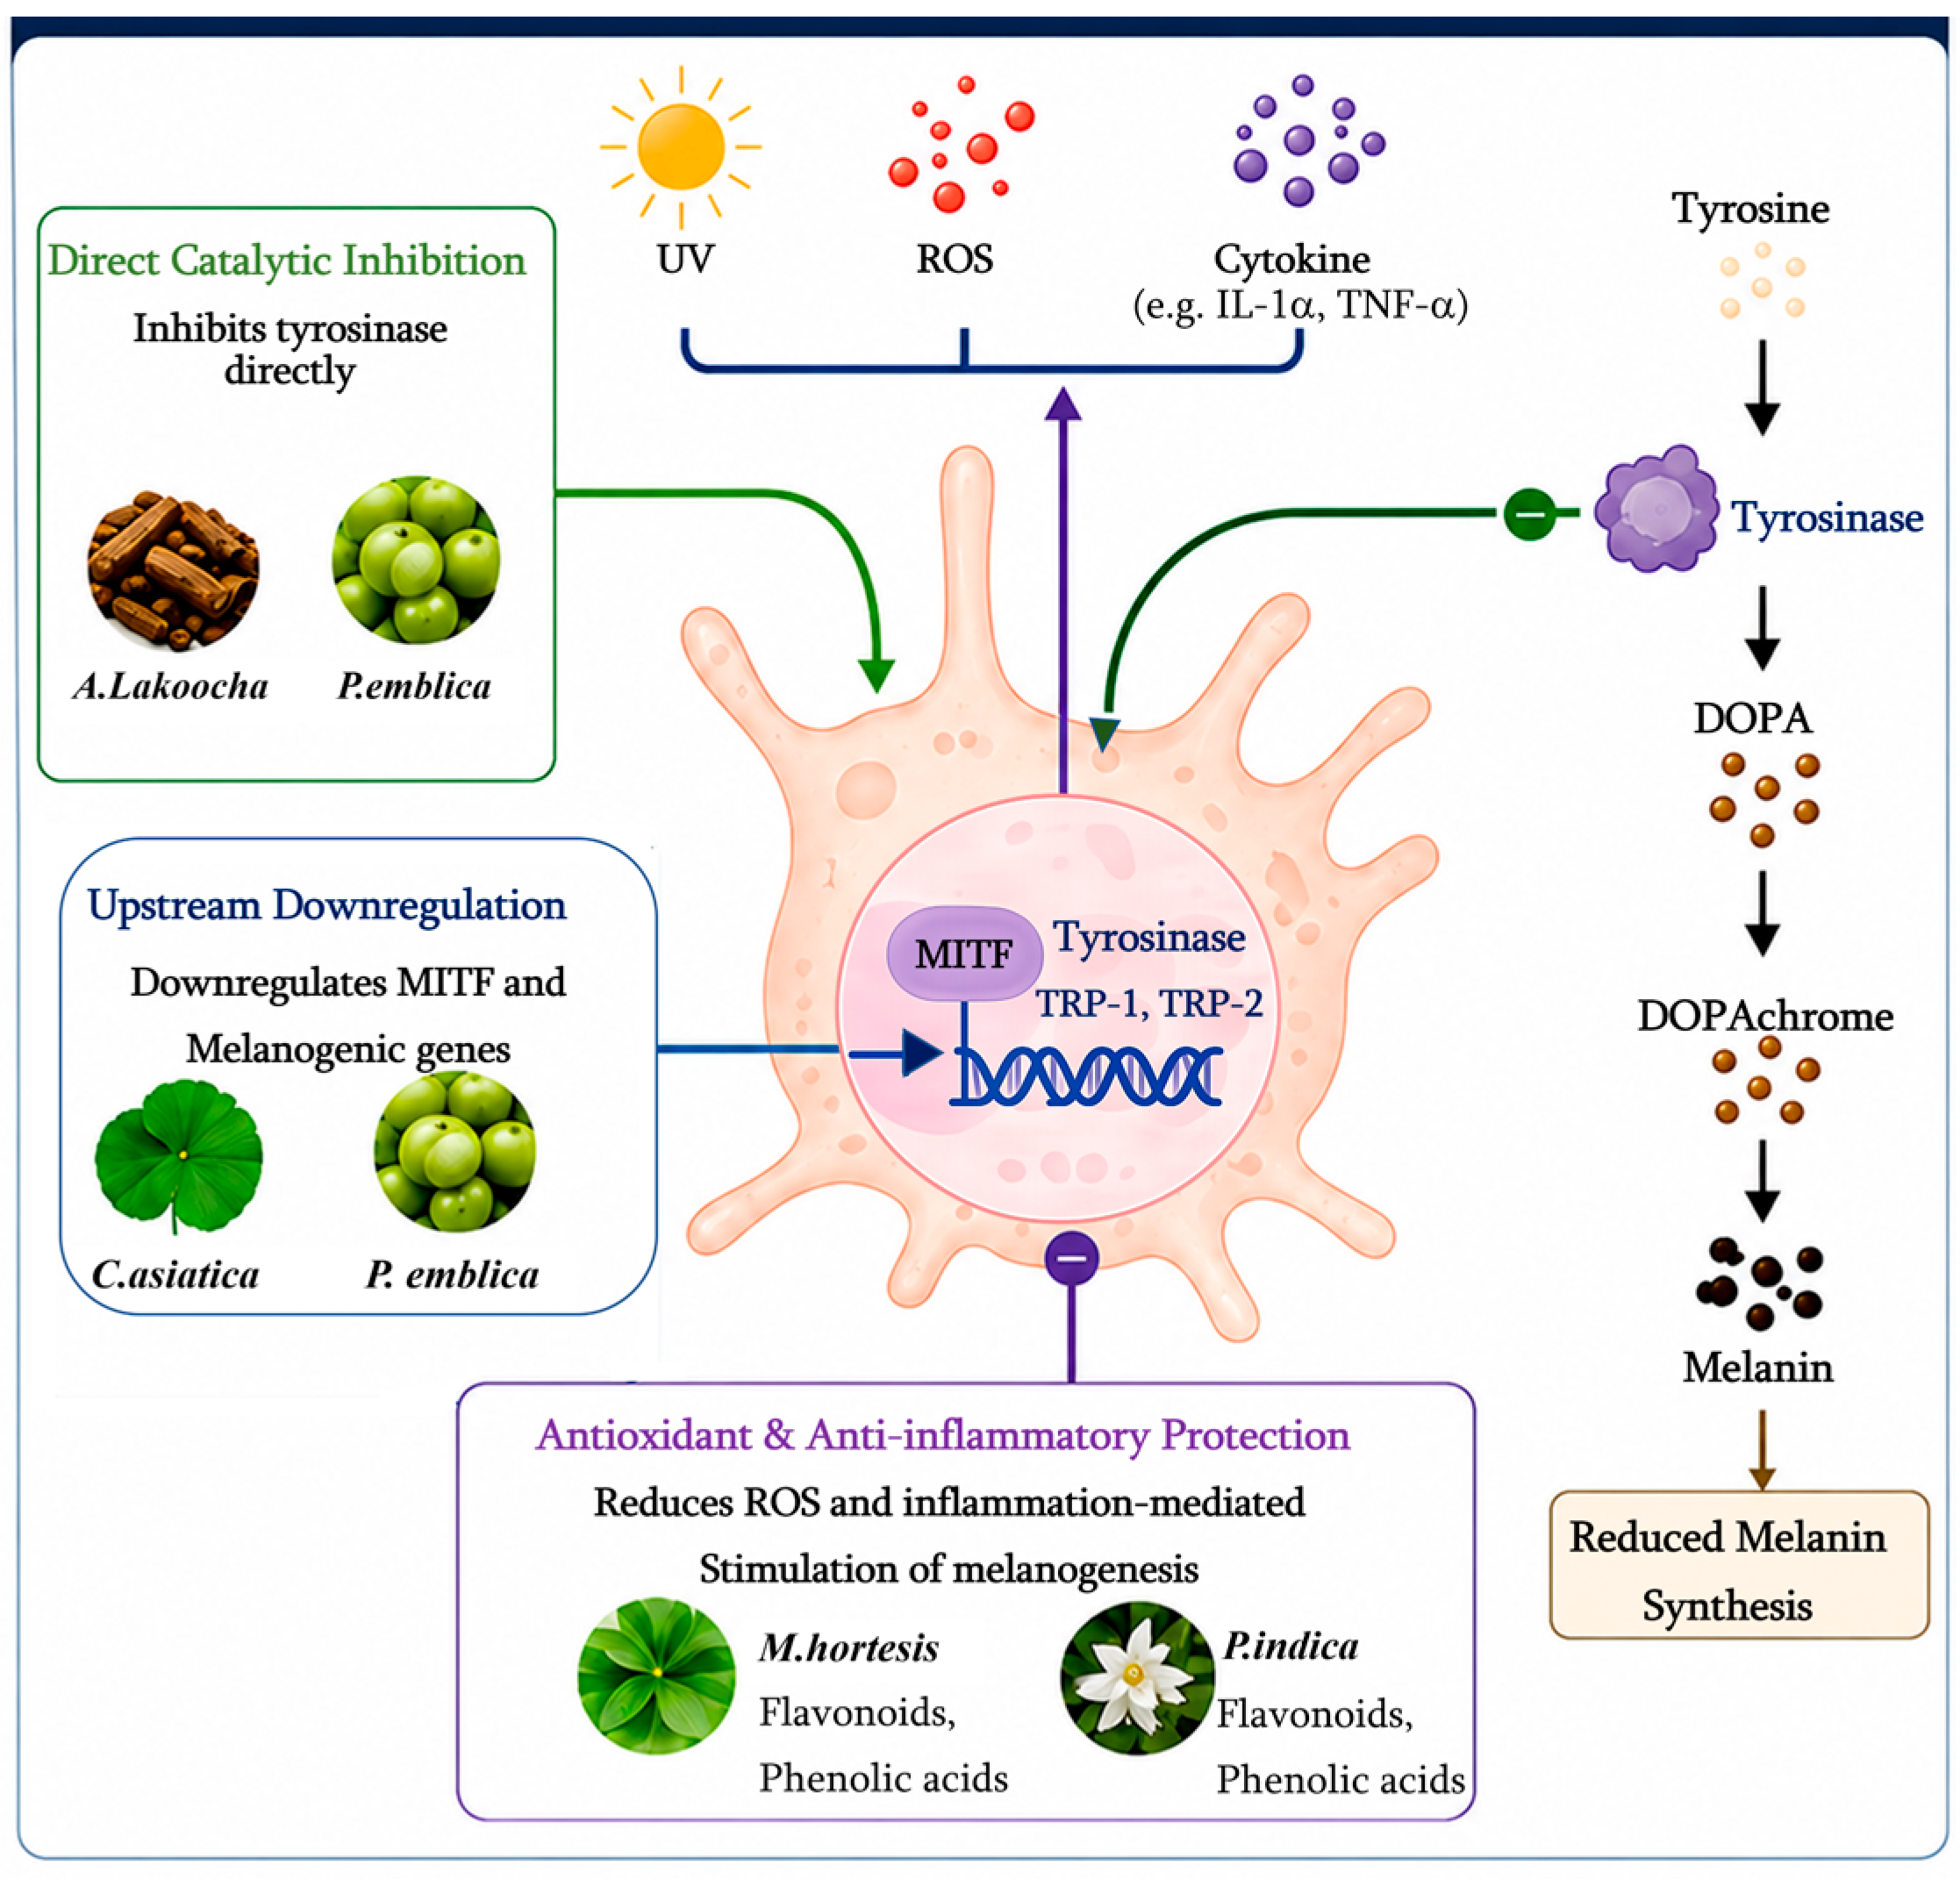
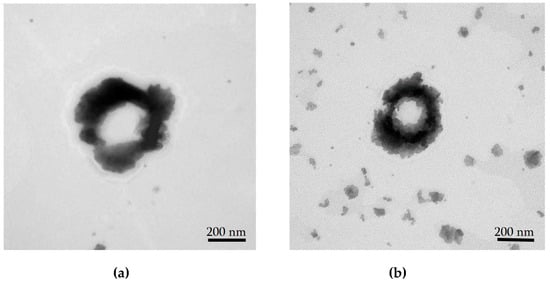
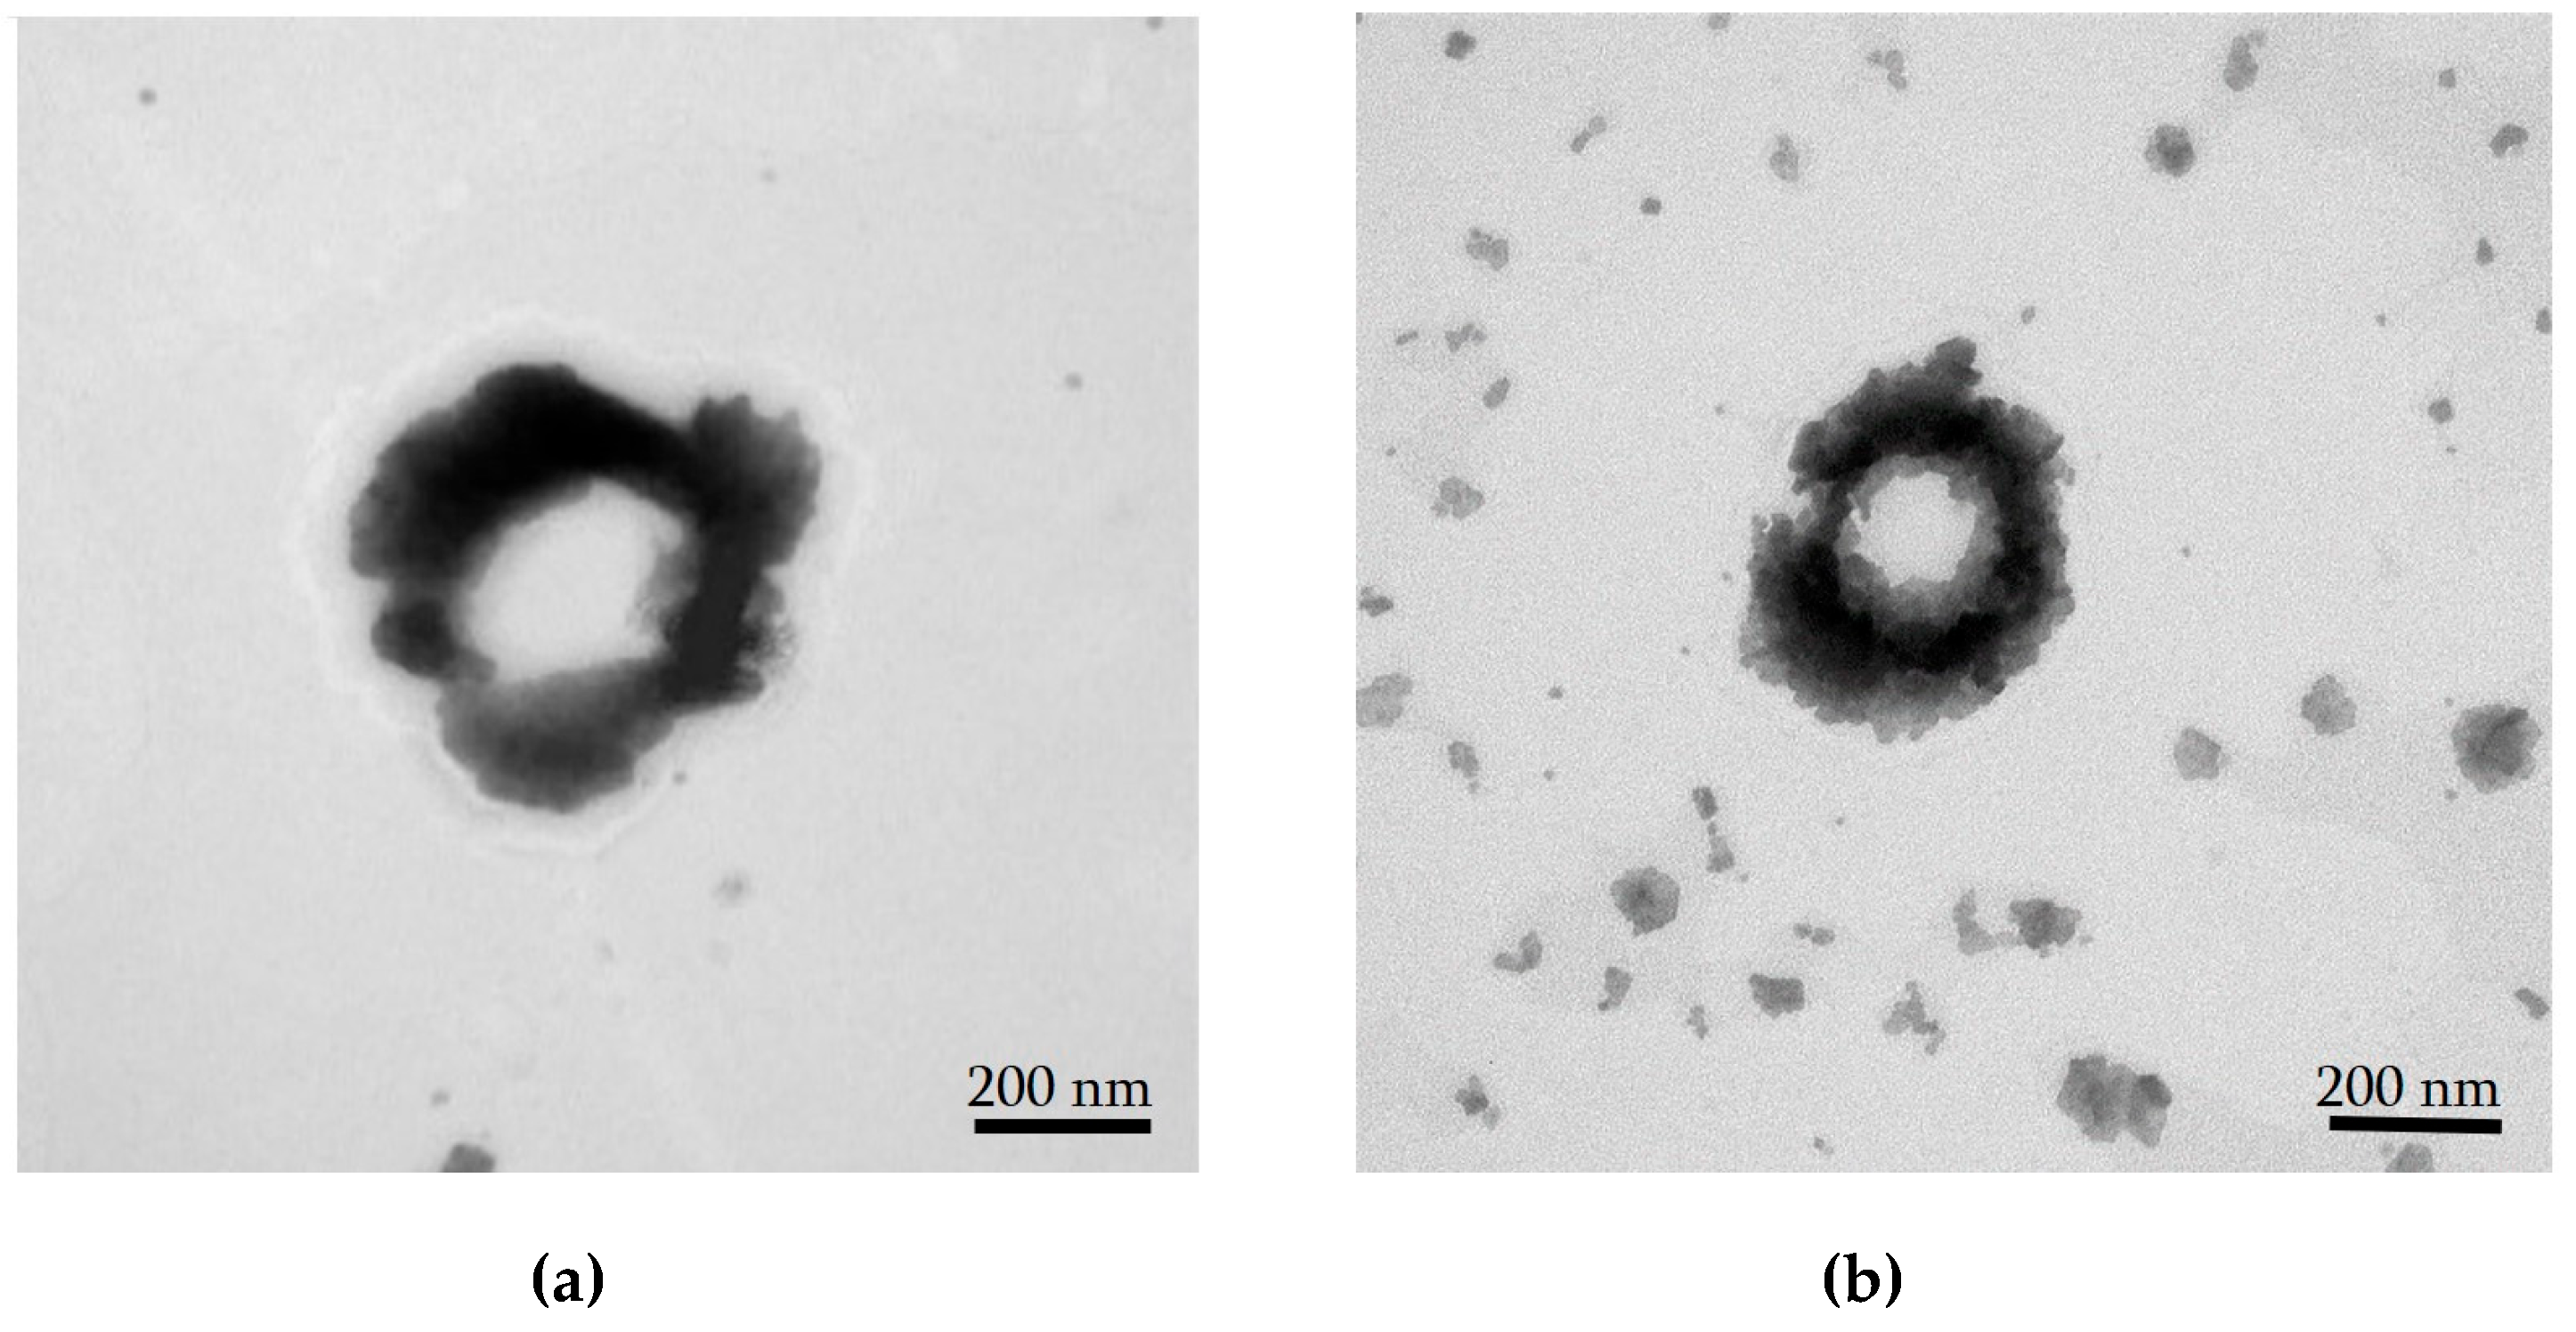
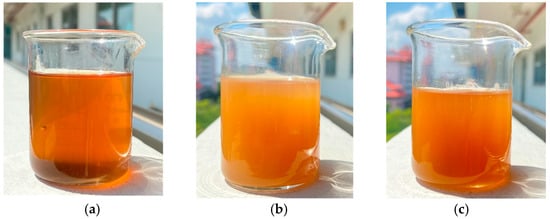
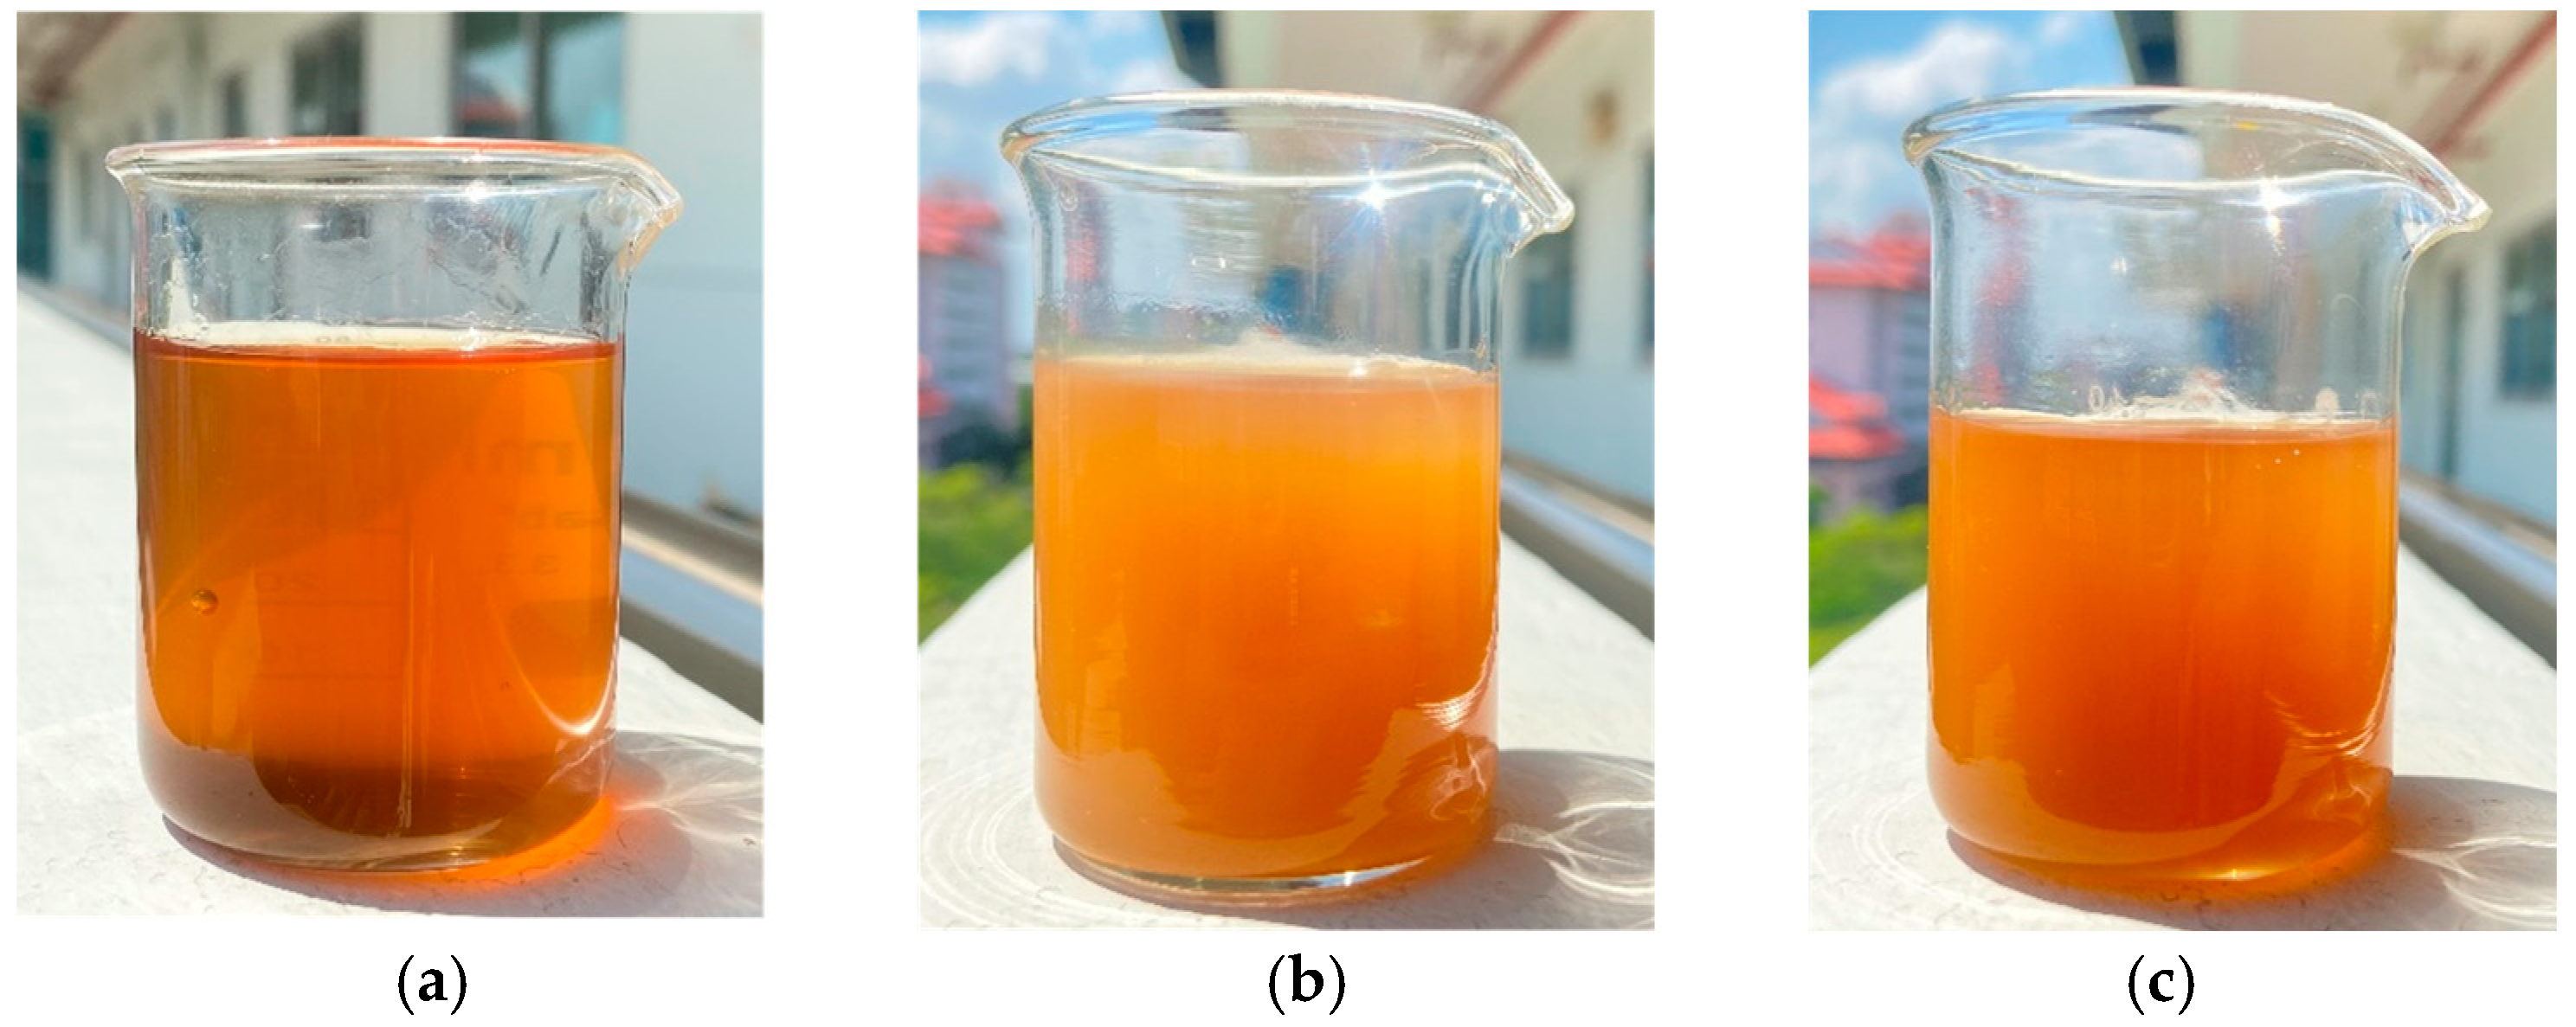
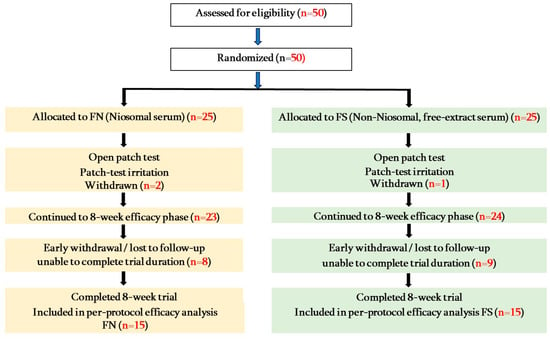
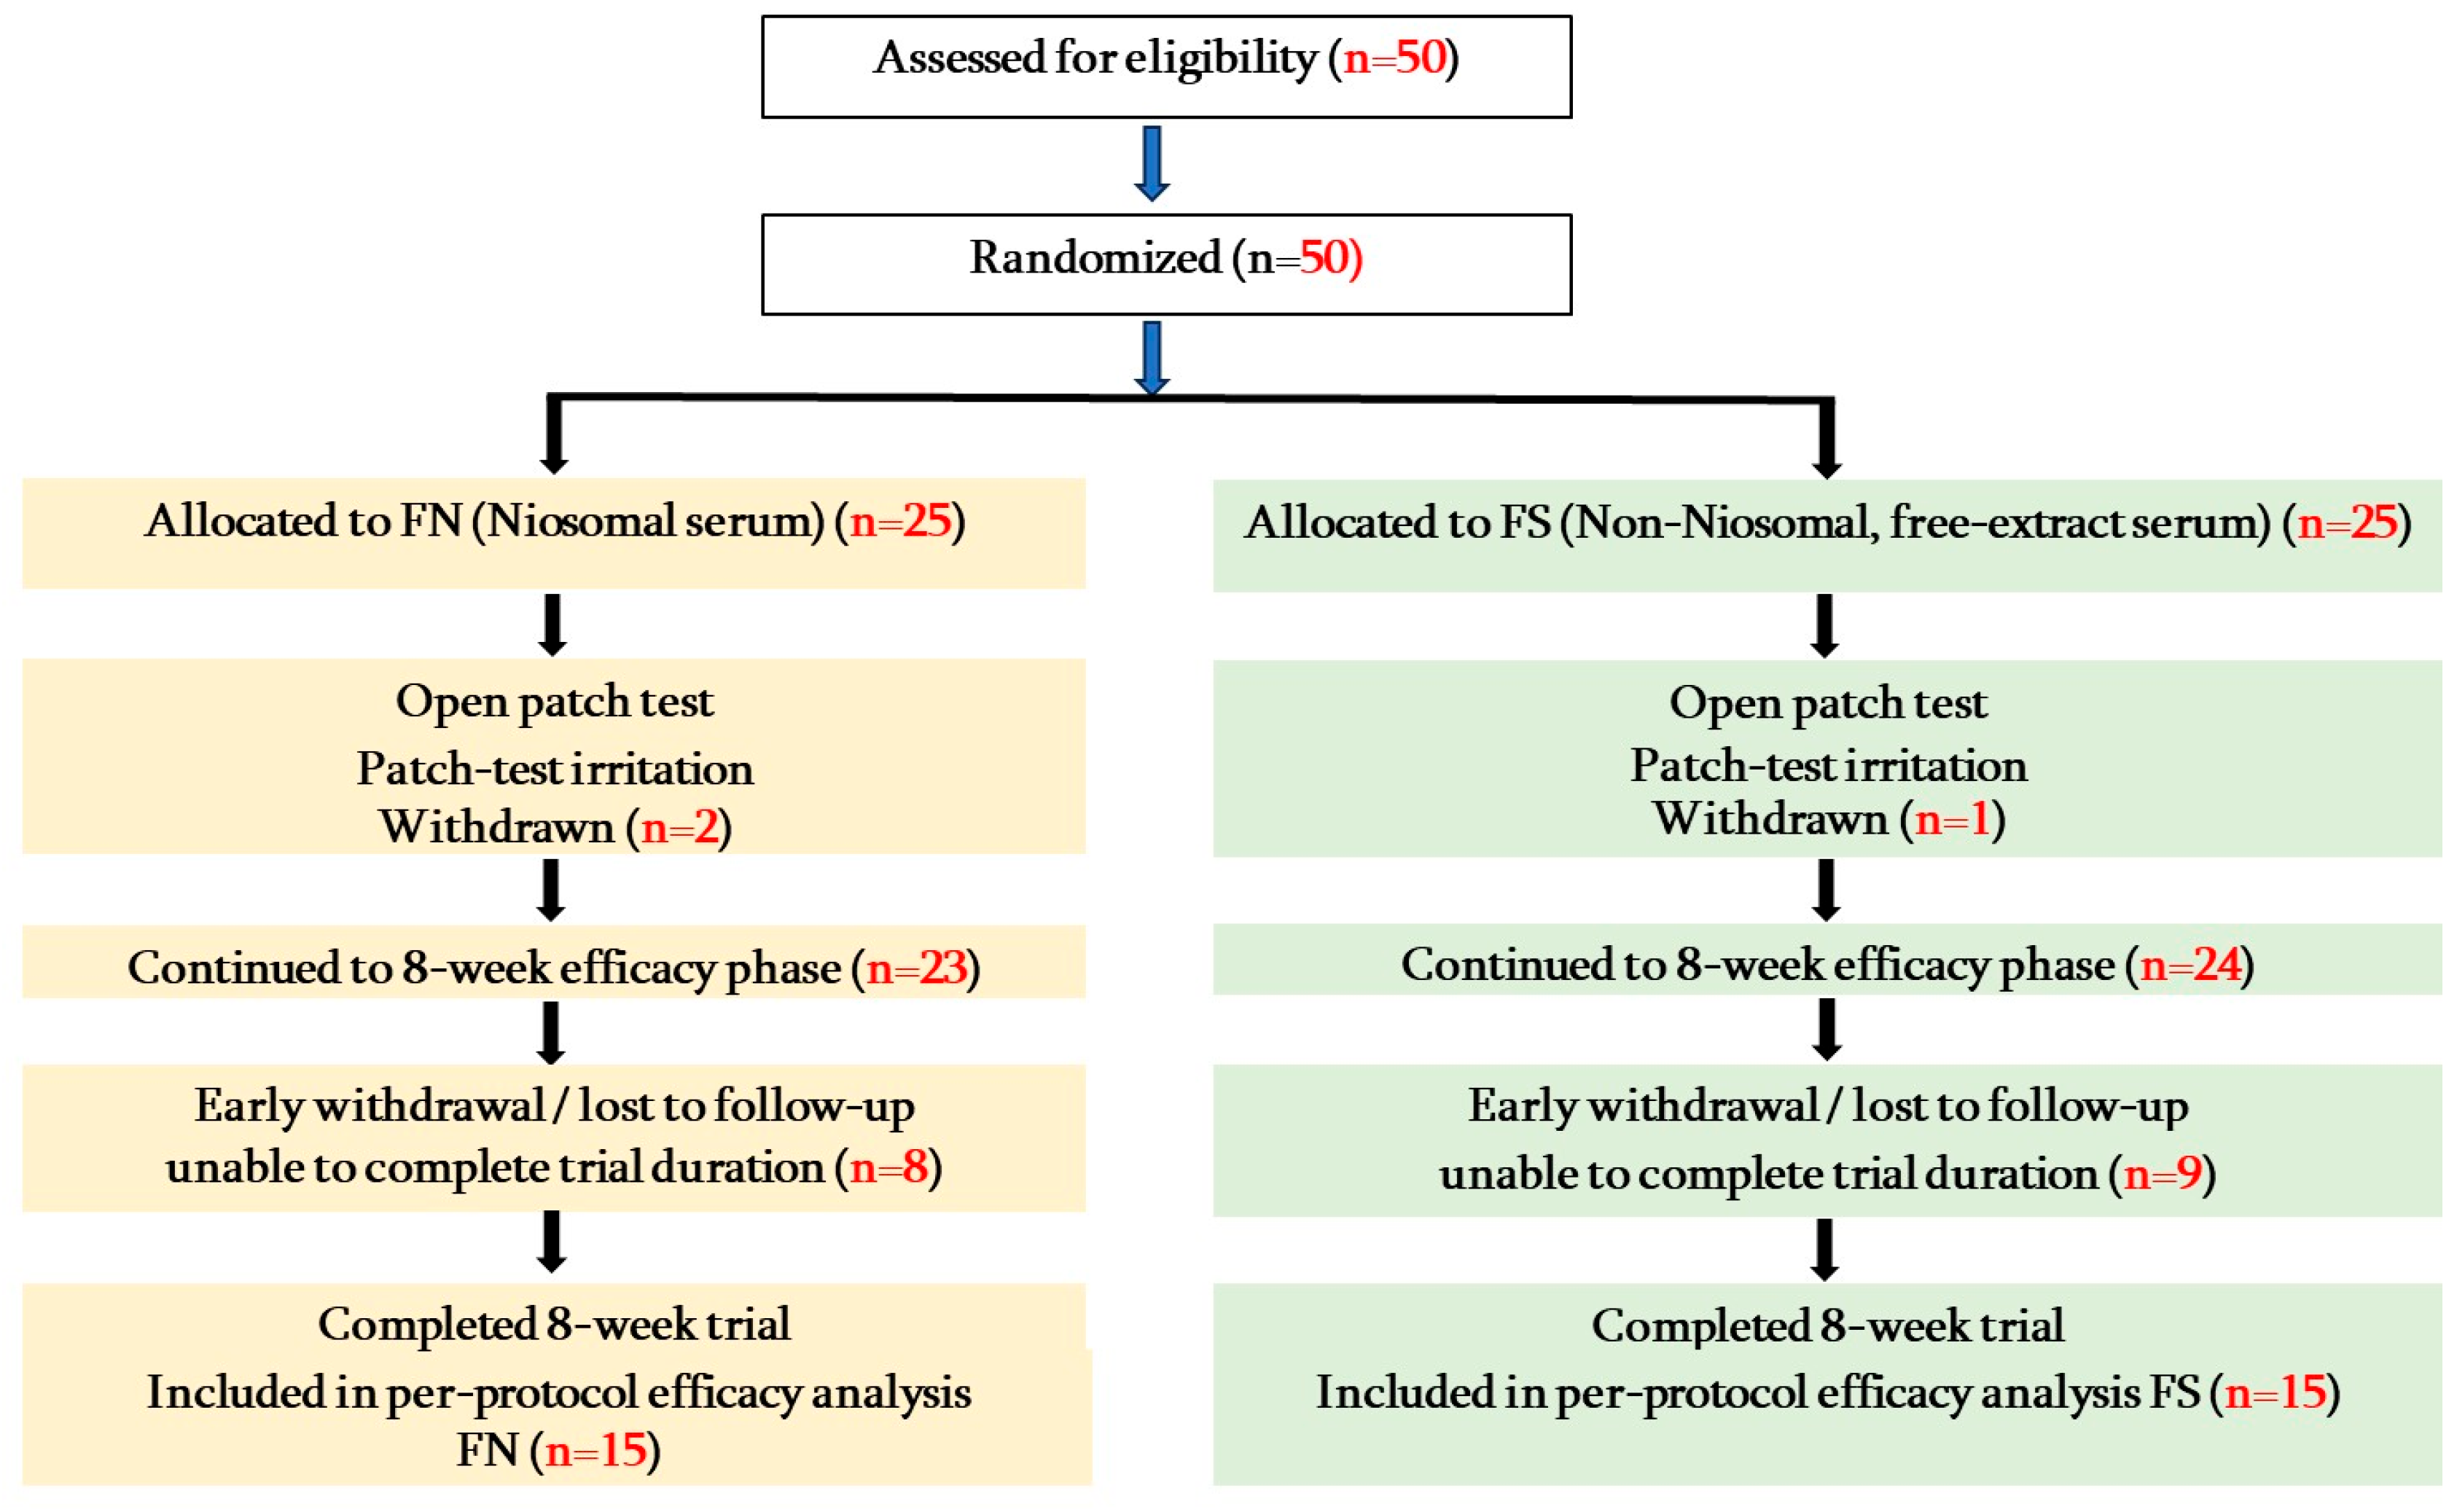

Disclaimer/Publisher’s Note: The statements, opinions and data contained in all publications are solely those of the individual author(s) and contributor(s) and not of MDPI and/or the editor(s). MDPI and/or the editor(s) disclaim responsibility for any injury to people or property resulting from any ideas, methods, instructions or products referred to in the content. |
© 2026 by the authors. Licensee MDPI, Basel, Switzerland. This article is an open access article distributed under the terms and conditions of the Creative Commons Attribution (CC BY) license.