


Highlights
What are the main findings of your research?
- The main finding suggests that the NW–SE structural trend matches regional tectonic structures linked to Red Sea rifting.
- Radiometric data and remote sensing help map high phosphatic limestone and identify serpentinite-hosted magnesite and chromite extensions.
- The Wadi Queih region possesses mineralization potential in both sedimentary and basement rock formations.
- The incorporation of a multi-geophysical methodology can improve the identification of the mineralization zone for subsequent in-depth investigations.
Abstract
The integration of aeromagnetic, gamma-ray spectrometric, and remote sensing approaches was used to delineate structural configurations and identify potential mineralization sites in the Wadi Queih area, Eastern Desert, Egypt. Focusing on weathered Precambrian terrains, this study establishes a predictive, multitier exploration model for the Wadi Queih area (Eastern Desert, Egypt) by integrating aeromagnetic, gamma-ray spectrometric, and Landsat-9 OLI-2 datasets. Rather than analyzing these datasets in isolation, the novel contribution of this integrated approach lies in its ability to map the complete genetic path of mineralization—bridging subsurface structural conduits, surface hydrothermal alteration, and radioelements. Subsurface structural configurations mapped via magnetic tilt derivative (TDR) and analytic signal (AS) filters were revealed. The main finding is that the dominant NW–SE structural trend is consistent with regional tectonic structures associated with Red Sea rifting. By co-registering these deep structures with surface mineralogical mapping from Landsat-9 OLI-2 (processed using PCA, band ratios, and Spectral Angle Mapper), we demonstrate a direct structural control on hydrothermal alteration zones. Specifically, these fault zones align with intense hydroxyl and iron oxide alterations, while the Spectral Angle Mapper successfully identified serpentinite-hosted magnesite and chromite extensions. Airborne gamma-ray spectrometry validated these targets, mapping localized potassium enrichment along fault-controlled alteration zones and identifying strata-bound uranium enrichment within the phosphorogenic Duwi and Tarif Formations. The convergence of these three independent datasets provides a self-validating targeting framework that significantly reduces exploration risk compared to traditional single-dataset analyses. Ultimately, this integrated, multidisciplinary approach provides a robust and highly generalizable exploration framework for complex Precambrian terrains globally.
1. Introduction
The Eastern Desert is one of the most mineral-rich provinces in Egypt. It hosts a wide variety of economic metallic and non-metallic deposits that have been exploited since ancient Pharaonic times. This basement complex is situated in the Neoproterozoic Arabian–Nubian Shield (ANS) and shows a complex and highly complicated tectonic history involving several phases of island-arc volcanism, ophiolitic accretion, regional metamorphism, crustal deformation, and post-orogenic plutonism. This complex evolutionary framework was important in the creation of regional-scale hydrothermal systems, the concentration of mineralizing fluids, and the development of favorable traps for ore deposits. Therefore, the Eastern Desert is considered a first-class natural laboratory for the study of Precambrian mineralization processes, particularly for gold, copper, chromite, iron, manganese, talc, and strata-bound sedimentary uranium-bearing phosphates.
The rapid development of multidisciplinary exploration methods in recent decades has changed the face of mineral prospecting in highly weathered and deformed terrains. Among these, satellite-based remote sensing has become an indispensable and cost-effective tool for mapping regional lithological boundaries and identifying hydrothermally altered rock exposures. Mineral exploration heavily relies on the unique spectral absorption and reflectance characteristics of mineral groups in the Visible to Shortwave Infrared (VNIR-SWIR) ranges. Multispectral sensors, such as the Landsat Operational Land Imager (OLI), have been widely applied to delineate surface alteration mineralogy. For many years, prospective zones characterized by diagnostic iron oxide phases and hydroxyl-bearing/argillic clay assemblages (including montmorillonite, sericite, alunite, and kaolinite) have been successfully identified using Landsat spectral band ratios and extraction techniques [1,2,3,4].
While remote sensing maps surface alteration mineralogy, it cannot image subsurface geological structures or measure deeper chemical contrasts. To bridge this gap, potential-field geophysics—specifically aeromagnetic—is widely utilized in mineral exploration to map subsurface tectonic elements, including deep-seated faults, folds, lithological contacts, shear zones, and buried intrusive bodies that control the localization of ore deposits. In this regard, advanced magnetic data enhancement filters—such as the tilt derivative (TDR) and analytic signal (AS)—are commonly employed to resolve magnetic boundary configurations, estimate source depths, and characterize structural lineaments, thereby greatly improving the visualization of prospective fluid pathways [5,6,7,8,9].
Radioelement mineralization is controlled by the abundance of certain alteration minerals, such as hematite, illite, sericite, and chlorite, as well as by structural lineaments, including fractures and deep-seated faults. These lineaments act as favorable pathways for mineral-bearing fluids, facilitating the concentration of radioelements [10]. Airborne gamma-ray spectrometry records the natural radioactivity of K, U, and Th confined to a thin near-surface horizon, typically no more than a few tens of centimeters deep [11]. Weathering directly exposes this horizon, easily disturbing its radioelement budget. U and Th tend to be leached from most rock types. At the same time, K can instead become concentrated where hydrothermal or supergene alteration has occurred.
The gamma-ray and magnetic surveys conducted by [12] resulted in the delineation of several radioactive anomalies and structural features in the Eastern Desert of Egypt. Most of these anomalies are linked, both spatially and in terms of origin, to younger granitic bodies within the basement complex or to phosphate horizons hosted in the sedimentary succession. This study uses airborne gamma-ray spectrometric and magnetic datasets to examine how radioelements are distributed across the sedimentary sequence, aiming to clarify their associations with the various rock units present and with structural features at depth [13]. Gamma-ray data are widely used to support geological mapping, including geological and structural interpretation. Often, radiometric patterns strongly correlate with variation in rock units [14]. This technique represents an effective approach to mapping the geochemical distribution of radioactive elements, including potassium, uranium, and thorium. Accordingly, the present study uses these data to identify and characterize the radiometric signatures associated with gold-hosting rock units.
These methods have been successfully employed in a number of historic studies in the Eastern Desert. Early airborne gamma-ray and magnetic regional surveys by government and exploration consortia were successful in delineating many radioactive anomalies and major structural lineaments throughout the province. These datasets are important for studying the spatial distribution of radioelements in sedimentary and igneous sequences and, hence, for understanding the structural control and lithological limits of these sequences. Furthermore, radiometric patterns are used extensively to aid in regional geological mapping because of their excellent spatial correlation with fresh, unaltered rock units. These combined geophysical and radiometric techniques have been successfully applied to characterize individual mineralization settings in the Eastern Desert, such as the structurally controlled environments of the Um Salim gold mine and the regional Gebel Duwi area [13,15].
Despite the proven utility of remote sensing, aeromagnetic, and airborne radiometric mapping, previous investigations in the region have predominantly analyzed these datasets in isolation or as parallel, independent layers of information. Consequently, a critical research gap remains: there is a distinct lack of predictive models that directly bridge the subsurface structural trends (determined via geophysics) with surface hydrothermal mineral zoning (resolved via remote sensing) and near-surface radioelement geochemistry (mapped via gamma-ray spectrometry) in highly deformed Precambrian terrains. Previous studies in this area mapped spatial distributions or investigated individual gold mines. However, they did not provide an integrated, multitier framework linking deep structural conduits directly to surface spectral and radiometric alterations in Wadi Queih.
To address this gap, this study focuses on the Wadi Queih area in the Central Eastern Desert of Egypt. The main goal of this work is to develop a unified multitier exploration model that:
- Uses advanced magnetic filters (TDR and AS) to resolve the regional subsurface structural fabric and to map tectonic lineaments;
- Characterizes the spatial distribution of key surface alteration mineral assemblages (hydroxyl, iron oxide, magnesite, and chromite) using Landsat-9 OLI-2 spectral indices and classification models;
- Characterizes the surface geochemical distribution of radioelements (K, eTh, eU) to track localized alteration and to identify potential sediment-hosted uranium concentrations.
The novel contribution of this work is the development of a synergistic self-validating exploration framework. By co-registering subsurface structural lineaments directly with surface spectral and radiometric signatures, we demonstrate a unified geological–geophysical approach that reduces mineral exploration targeting risk, providing a highly reliable and generalizable exploration framework for complex Precambrian terrains worldwide.
Geologic Settings
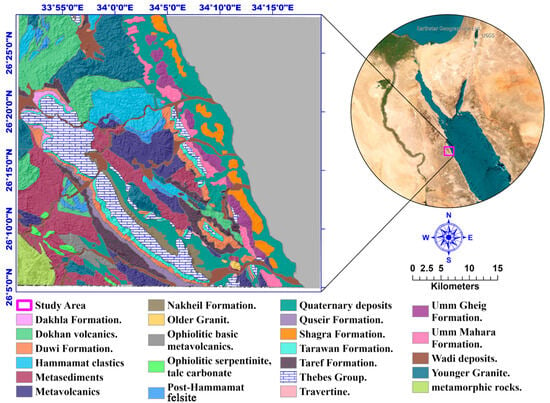
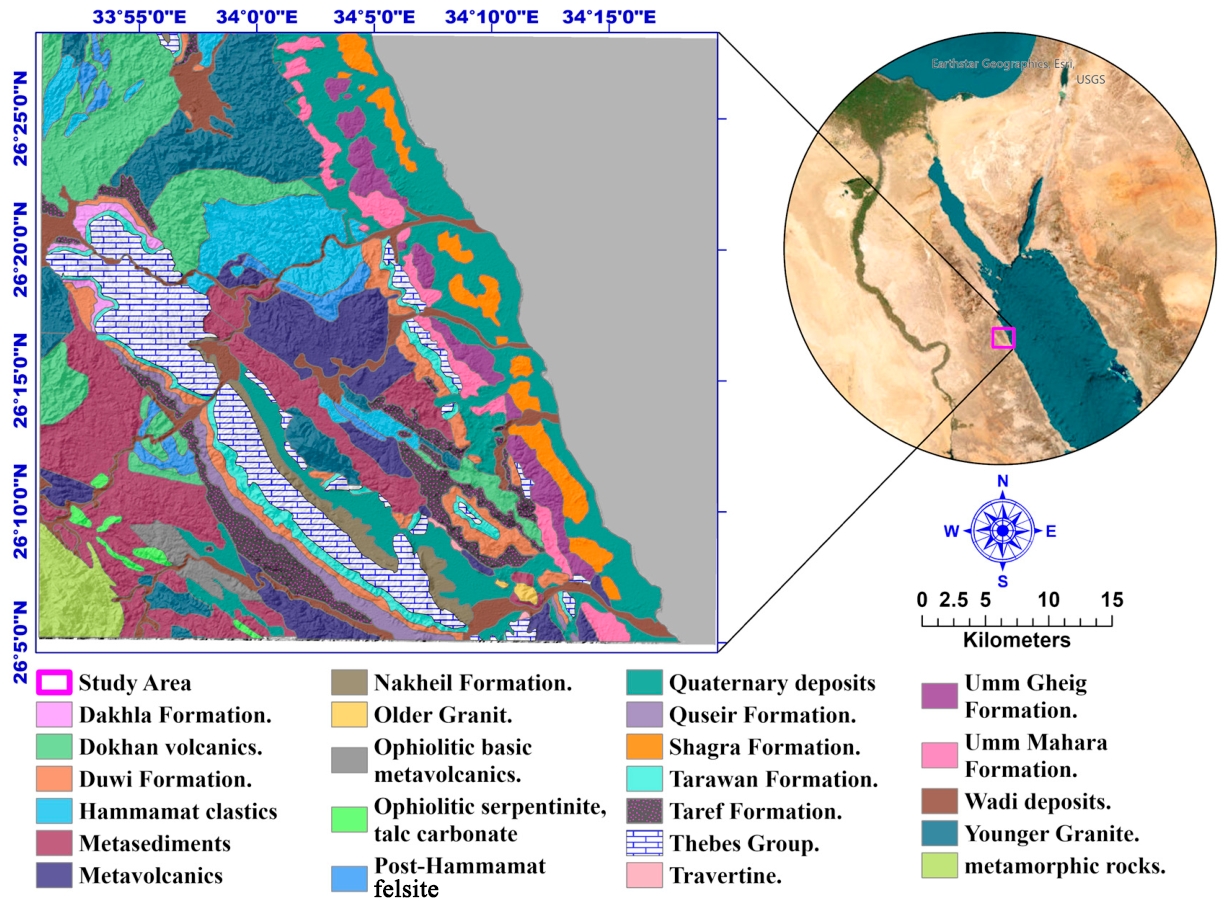
The Wadi Queih area is a geologically significant corridor situated in the Central Eastern Desert of Egypt, geographically bounded between latitudes 26°04′50″ N and 26°28′15″ N, and longitudes 33°50′42″ E and 34°19′35″ E. This sector of the Arabian–Nubian Shield (ANS) is characterized by an exceptionally diverse stratigraphic and lithotectonic record, encompassing a wide suite of igneous, metamorphic, and sedimentary lithologies that span from the Neoproterozoic Precambrian basement to Quaternary surficial deposits. According to regional geological mapping (e.g., the Quseir sheet at a 1:500,000 scale) [16], as shown in Figure 1, the stratigraphic framework of Wadi Queih can be subdivided into three major, unconformity-bounded mega-sequences:
Figure 1.
Location and geological map of the study area, modified after [16].
- ❖
- The Precambrian Crystalline Basement Complex: Representing Neoproterozoic basement lithologies of the Arabian–Nubian Shield [17].
- ❖
- Pre-Rift Sedimentary Sequences: A Mesozoic to Cenozoic transgressive sedimentary succession.
- ❖
- Syn-Rift Sedimentary Sequences: Late Oligocene to Recent marine and terrestrial strata were deposited during the rifting of the Red Sea.
- Neoproterozoic precambrian basement complex
The Precambrian basement comprises the oldest structural rock units in the area, outcropping extensively and covering approximately 70% of the Wadi Queih exploration district [18]. These crystalline basement rocks record the accretionary and post-orogenic history of the Eastern Desert basement. Based on established regional chrono-stratigraphies for the Eastern Desert, the crystalline basement rocks of the study area can be arranged in a relative, oldest-to-youngest chronological order as follows:
- Serpentinite and Talc Carbonate Belts: Highly deformed ultramafic ophiolitic remnants representing the earliest accreted oceanic crust elements.
- Metagabbro-Diorite Complex and Ophio;;litic Metagabbros: Plagioclase–pyroxene-rich intrusive suites showing varying degrees of ocean-floor metamorphism.
- Metavolcanic and Metasedimentary Rocks: Volcano-sedimentary sequences associated with island-arc development and oceanic basin closures.
- Hammamat sediments: Immature molasse-type clastics (conglomerates, greywackes, and siltstones) deposited in intramontane basins.
- Gabbroic Intrusions: Localized post-orogenic mafic plutons.
- Older Granites (syn- to late-orogenic): Calc-alkaline tonalite–granodiorite–quartz diorite suites.
- Younger Granites (post-orogenic): Highly fractionated, potassium-rich alkaline granite suites.
- Dokhan Volcanics: Subaerial, thick calc-alkaline volcanic flows and volcaniclastics.
- Post-hammamat Felsites: These are very unique and evolved felsic dykes and plugs that show the final stages of igneous activity from the Precambrian era.
- B.
- Mesozoic–cenozoic pre-rift sedimentary sequences
Following a prolonged period of erosion and peneplanation of the Precambrian basement, a thick Mesozoic to Cenozoic pre-rift sedimentary sequence was deposited unconformably over the crystalline basement complex. This sequence spans from the Late Cretaceous to the Middle Eocene and records major marine transgressive–regressive cycles prior to the initiation of Red Sea rifting. The stratigraphic succession, from base to top, comprises the following formations:
- Nubian Sandstone: This formation forms the base of the pre-rift sequence, unconformably blanketing the crystalline basement with thick, massive, quartz-rich continental-to-deltaic bedded sandstones. Based on the work of [19].
- Quseir Variegated Shale Formation: Conformably overlies the Nubian Sandstone and is characterized by multi-colored, gypsiferous silty shales and claystones.
- Duwi Formation: This represents the most economically critical sedimentary marker in the region. It is composed of alternating beds of marine phosphate, black shale, marl, and fossiliferous oyster limestones. Regional radiometric and geochemical investigations [15,20,21,22] have confirmed the presence of economically significant concentrations of sediment-hosted uranium in the phosphate-rich beds within this formation.
- Pelagic and Open-Marine Succession: The Duwi Formation is conformably succeeded by a thick, continuous marine pelagic sequence consisting of the Dakhla Shale, Tarawan Chalk, Esna Shale, and Thebes Formations.
- Thebes Formation: Characterized by massive, chert-bearing limestones, representing the uppermost pre-rift stratigraphic layer of Lower to Middle Eocene age [23,24].
- C.
- Late oligocene to recent syn-rift sedimentary sequences
The tectonic initiation of the Red Sea Rift in the Oligocene resulted in regional uplift, faulting, and the creation of deep, fault-bounded marginal basins. The syn-rift sedimentary sequences, ranging from Late Oligocene to Recent, rest unconformably upon the older pre-rift Eocene Thebes limestones. These deposits document the evolution from restricted continental basins to open-marine, coastal conditions:
- Nakheil Formation: The lowermost syn-rift unit, consisting of continental red-bed clastics, conglomerates, and sandstones shed directly from the rapidly uplifting basement blocks [25].
- Um Mahara Formation: Overlies the Nakheil clastics and is composed of marine limestones, clastics, and thick evaporitic sequences representing restricted basin conditions.
- Um Gheig Formation: A Late Miocene carbonate-rich (limestone and dolostone) marine sequence that outcrops prominently along the modern coastal margin.
- Pliocene to Recent Syn-Rift Deposits: Coastal-marine accumulations consisting of shallow-water reefal carbonates, clastic nearshore sediments, and elevated beach gravels.
- Quaternary Surficial Deposits: The youngest deposits in the study area, located along active wadi channels and drainage networks (such as Wadi Queih and Wadi El Nakheel). These are composed of unconsolidated wadi alluvium, detrital sands, gravels, pebbles, and cobbles derived from the surrounding basement and sedimentary escarpments [26].
2. Materials of the Study
2.1. Remote Sensing Data
For this work, we used Landsat-9 remote sensing data acquired from [27] (http://earthexplorer.usgs.gov (accessed on 21 June 2025)). We selected a clear weather day to ensure that the data was cloud-free, leveled, and terrain-corrected.
The image was collected on 26 May 2025 (path/Raw 174/42). This timeframe provided a cloud-free Level 1 Terrain Corrected (L1TP) view of the area, selected to minimize the effects of atmospheric humidity and dust. The Level 1T data product ensures systematic radiometric accuracy and geometric precision by integrating ground control points and a digital elevation model (DEM) to enhance topographic accuracy. The Landsat-9 data were captured using two distinct sensor types, Operational Land Imager (OLI) and Thermal Infrared Sensor (TIRS) manufactured by Ball Aerospace in Boulder, Colorado, USA , with Collection 2 Level-1 15 to 30 m multispectral data.
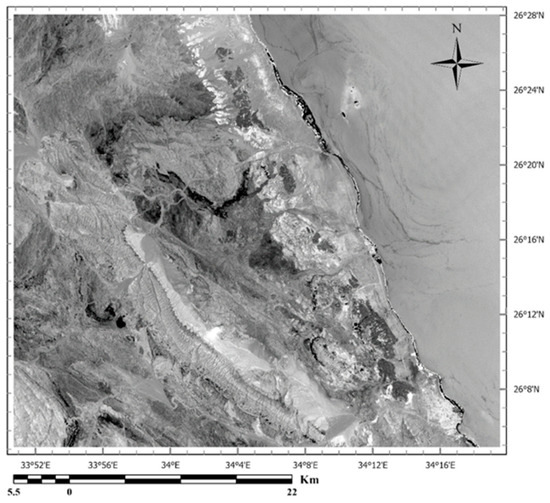
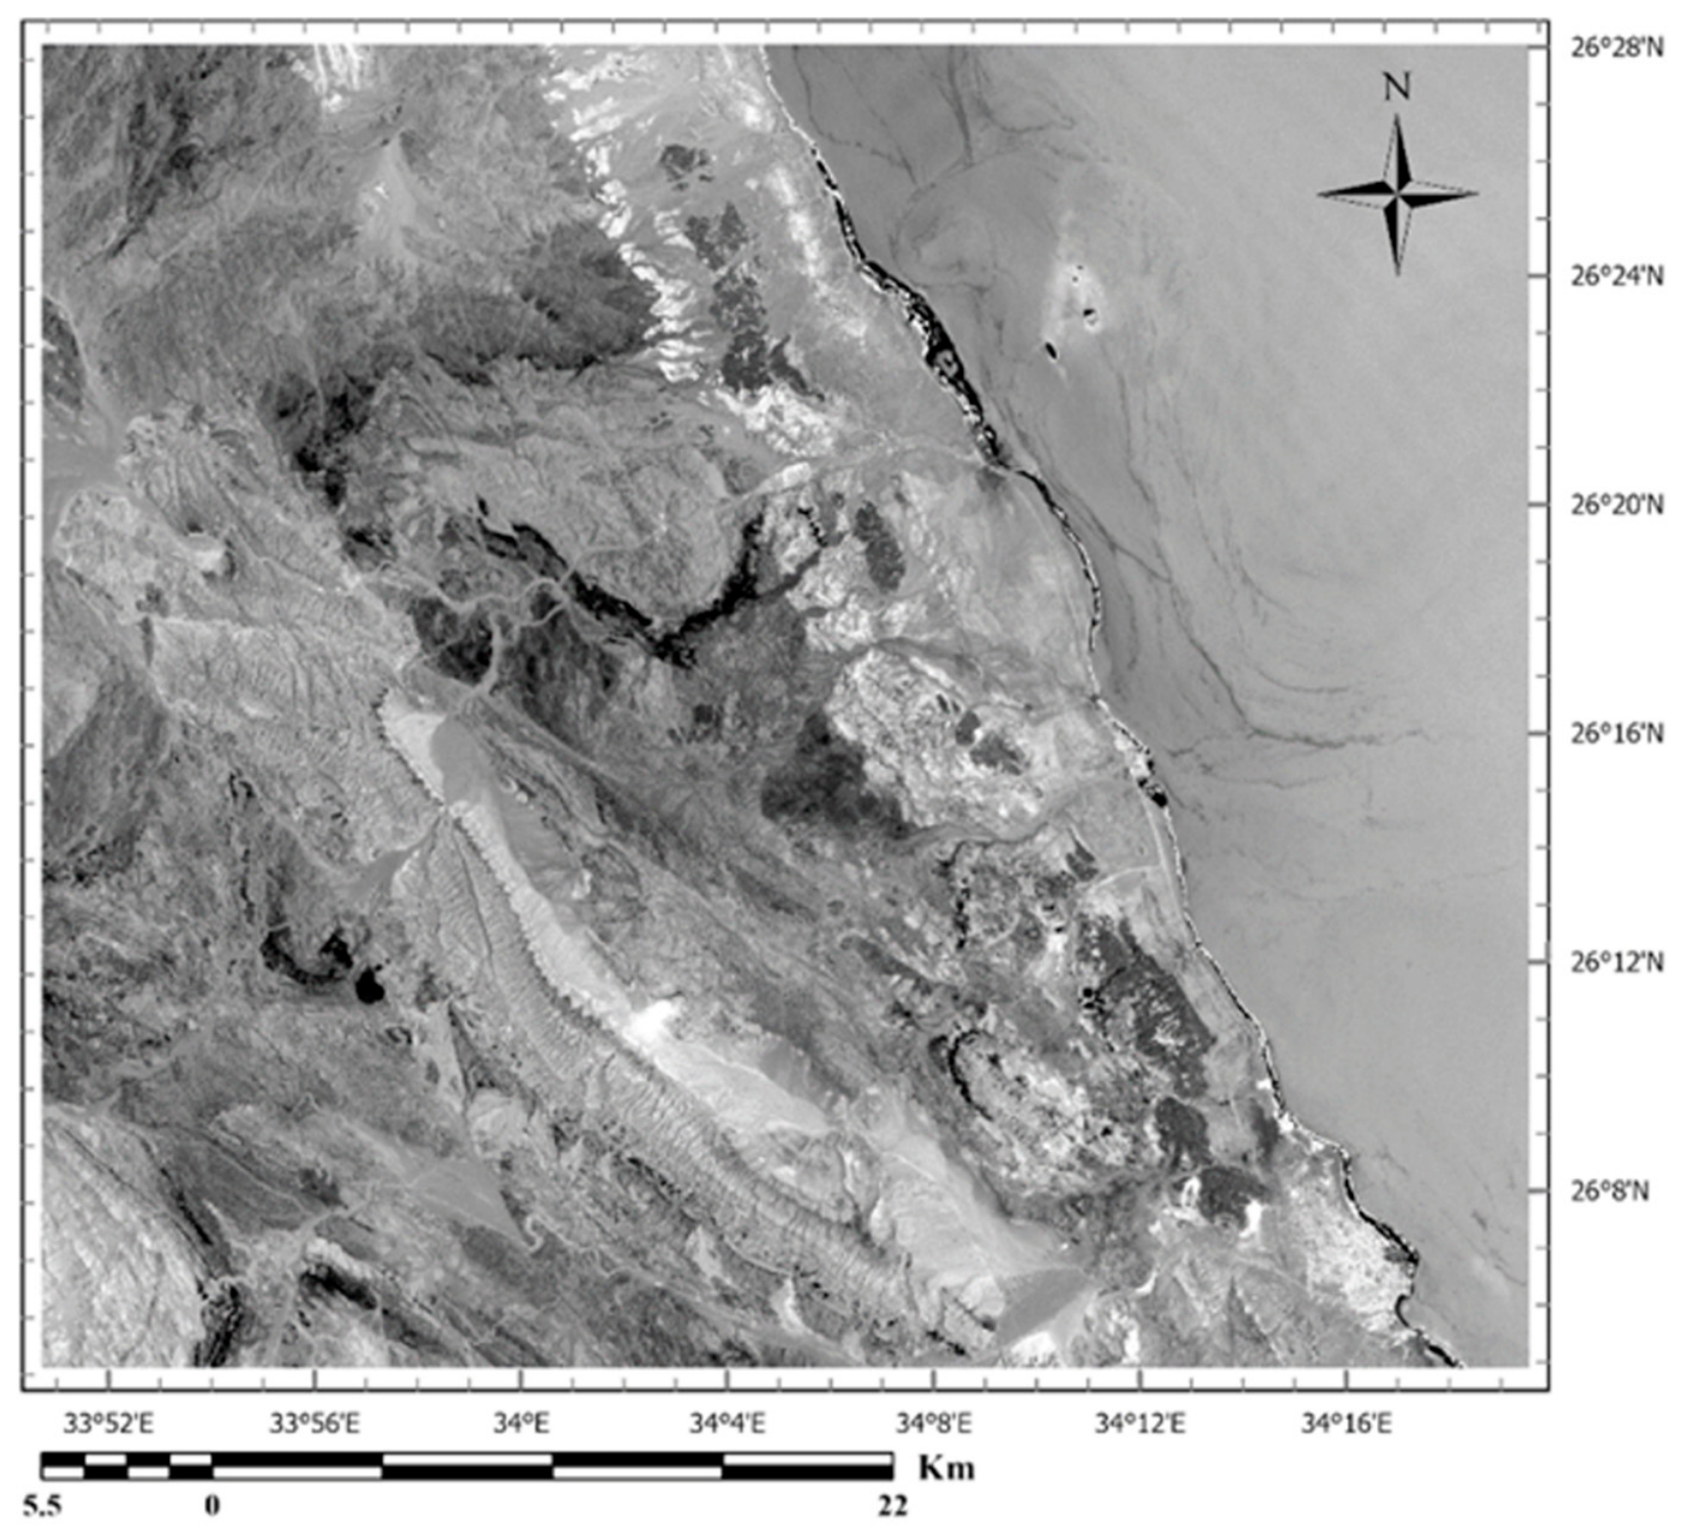
This image comprises 11 distinct bands according to wavelength: 5 of them situated within the visible and near-infrared (VNIR) spectrum, 2 located in the thermal infrared (TIR) region, 2 within the shortwave infrared (SWIR) domain, and an additional band (ultra blue) designated as described in Table 1. In addition to a false color image (Band 4/Band 3/Band 5), an RGB composite is shown in Figure 2.
Table 1.
Landsat-9 band description.
2.2. Aeromagnetic Data
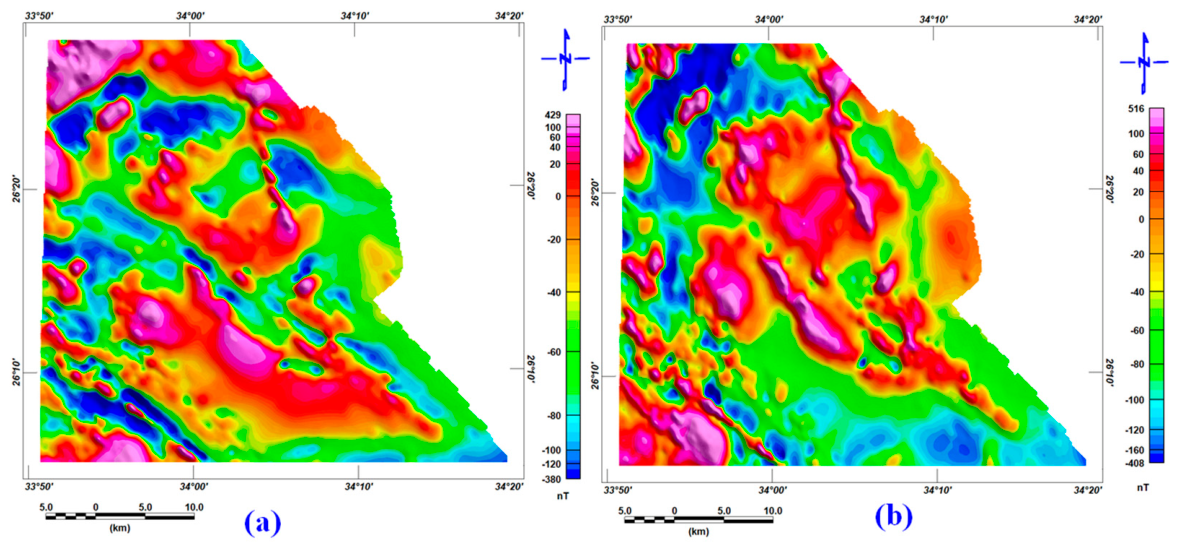
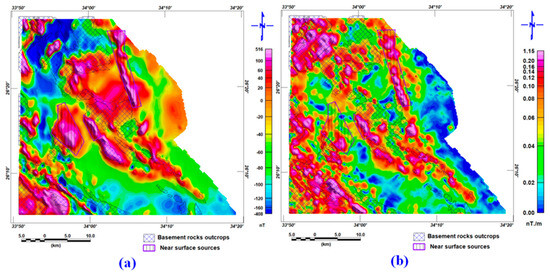
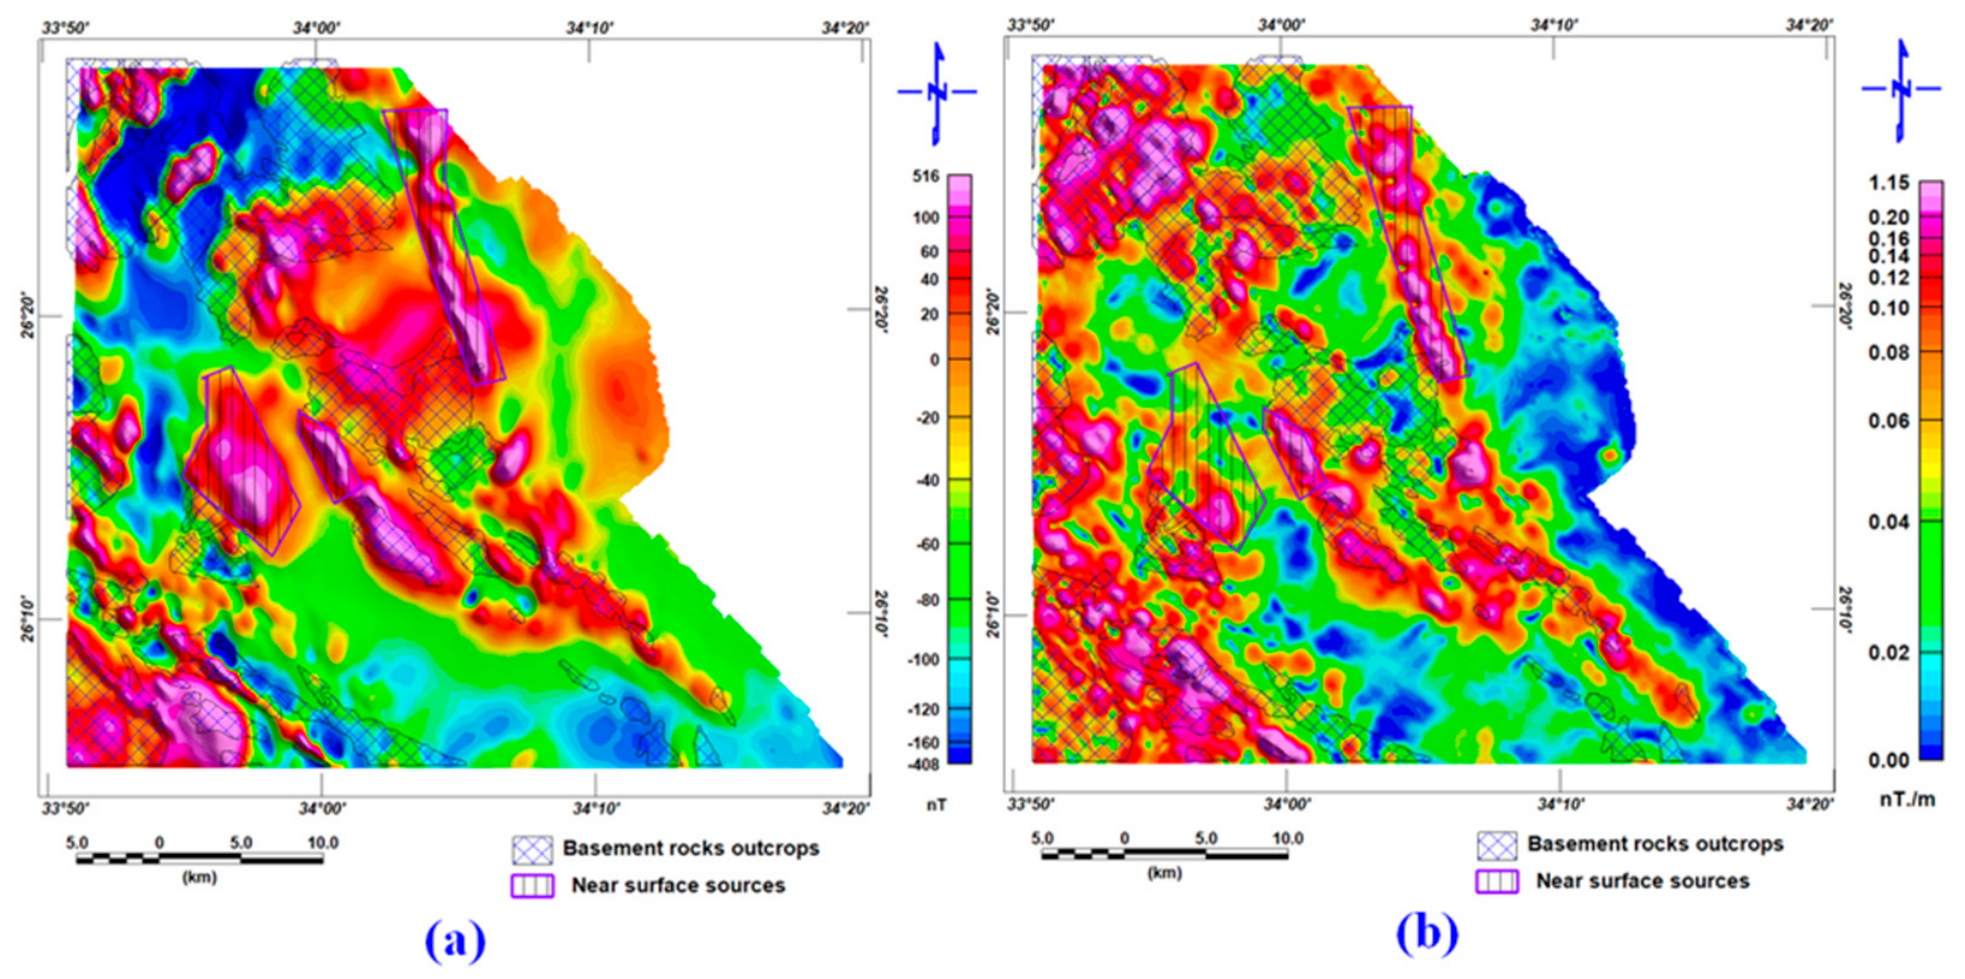
For this research, an aeromagnetic data sheet was obtained from the aeromagnetic maps of the study area, which were created in 1983 by the Western Geophysical Company of America’s Aero-Service Division,(USA). The aeromagnetic maps show magnetic field data at a contour interval of 10 nT and a terrain clearance of 120 m. The information was gathered across 1.0 km of traverses and tied at 10 km intervals. The average magnetic inclination and declination across the survey area were 32.8° North and 1.9° East, respectively [12]. The Earth’s geomagnetic field was removed from the data using the International Geomagnetic Reference Field (IGRF) formula, and the data sheet was digitized in ArcMap. The data are gridded, displayed, and processed using [28]. The total magnetic (TMI) map and the RTP are shown in Figure 3.
Figure 2.
Landsat-9 data demonstrated by a false-color image using band 4/band 3/band 5 (RGB) as the blue of the Wadi Queih area, Eastern Desert, Egypt.
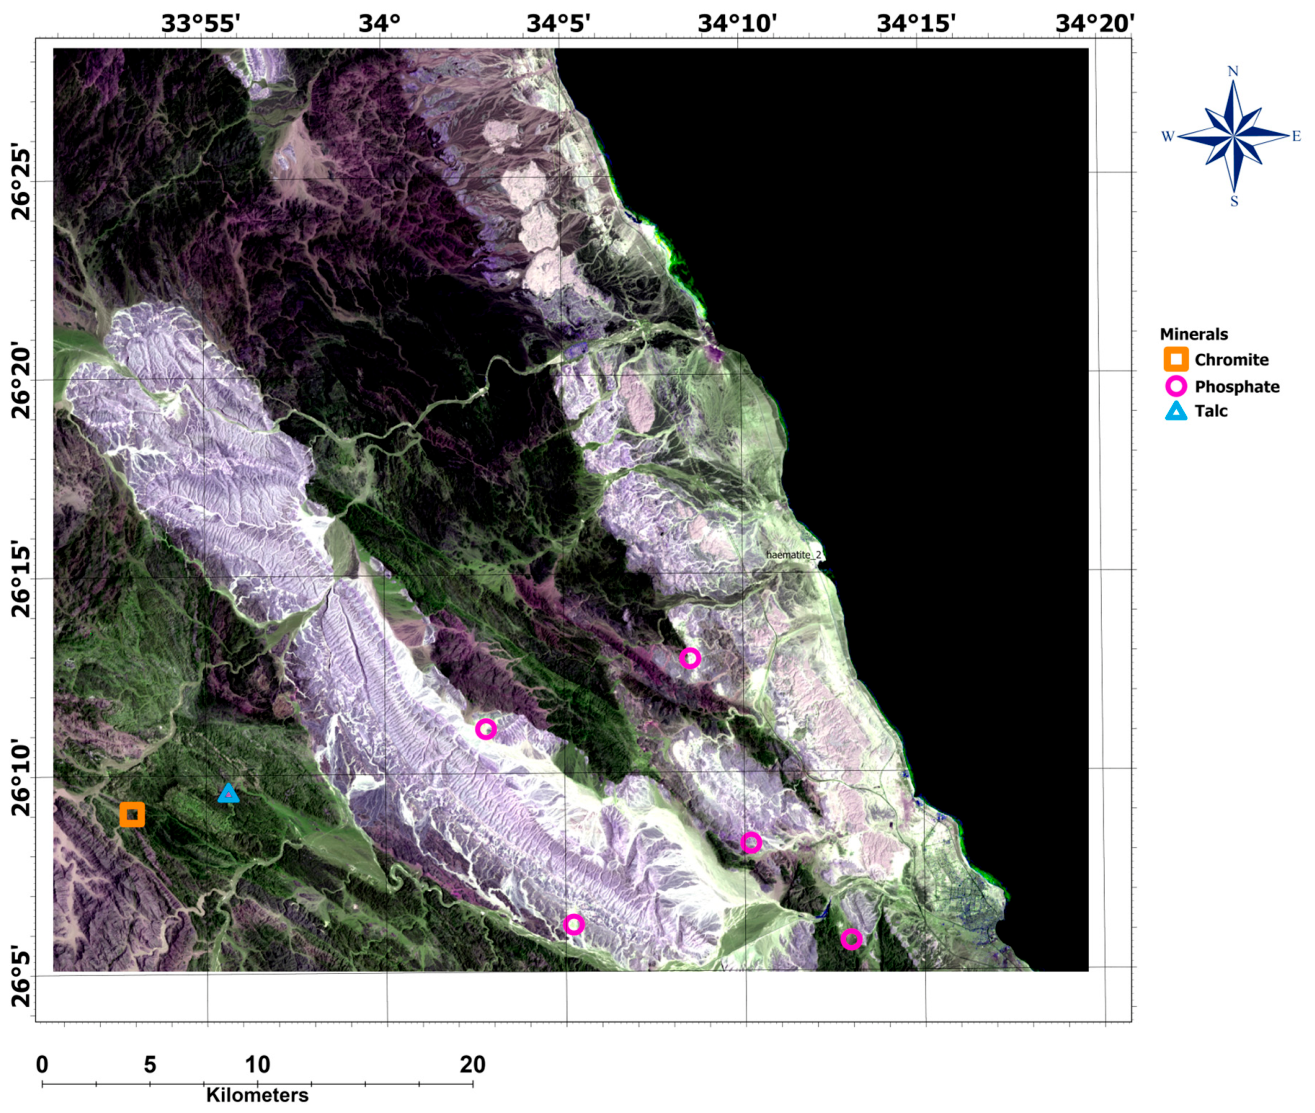
Figure 3.
(a) The total magnetic intensity and (b) the reduced-to-pole (RTP) map of the Wadi Queih area, Eastern Desert, Egypt.
2.3. Radiometric Data
The MPGAP survey was carried out in 1982 as a joint undertaking involving the Egyptian General Petroleum Corporation (EGPC), Cairo, Egypt, the Egyptian Geological Survey and Mining Authority (EGSMA),Cairo, Egypt, and the Aero-Service Division of the Western Geophysical Company of America (USA), encompassing an airborne magnetic and spectrometric gamma-ray survey across a substantial portion of Egypt’s Eastern Desert. The aim was to generate geophysical datasets that would aid in identifying and assessing the region’s mineral, petroleum, and groundwater resources [12].
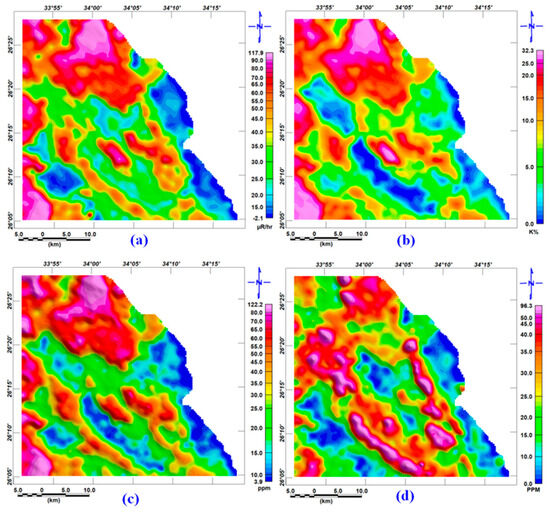
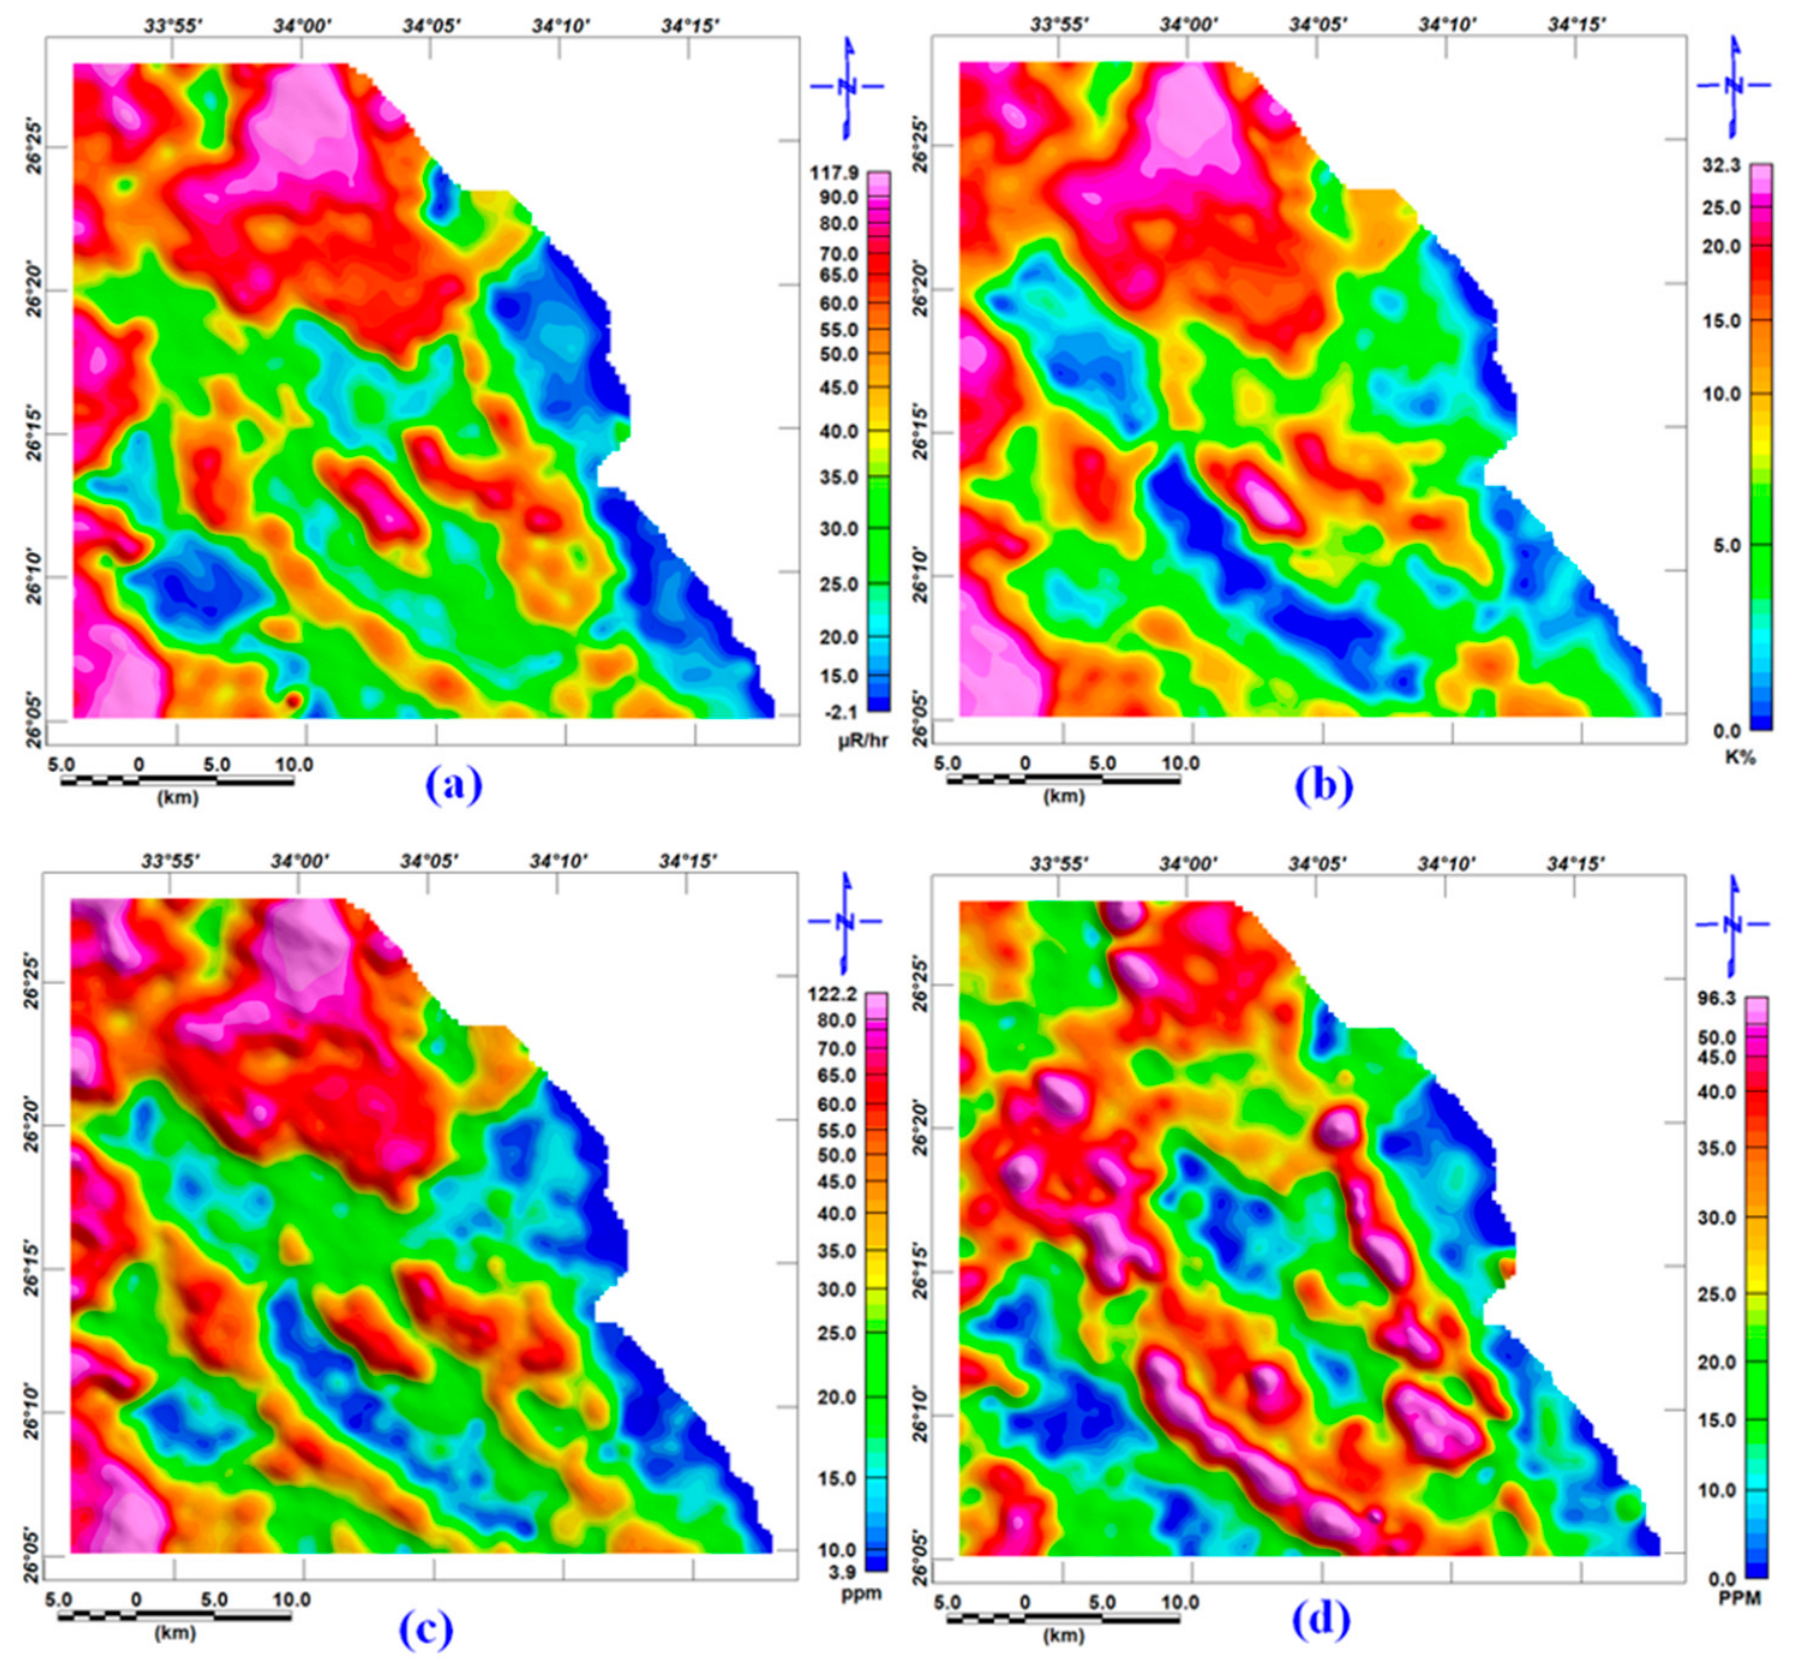
A total of 16 data sheets were acquired. These sheets were subsequently digitized in ArcMap. The data were then gridded, visualized, and processed using [28]. As shown in Figure 4a–d, the data shows the total count, potassium, thorium, and uranium of the studied area, as, from visual inspection, the color variation is comparable to the geological features in the area.
Figure 4.
Radiometric maps of the study area showing (a) total count expressed in micro-roentgens per hour (µR/hr), (b) potassium concentration (K, in wt.%), (c) equivalent thorium content (in ppm), and (d) equivalent uranium content (in ppm).
3. Methodology
3.1. Remote Sensing
Landsat-9 imagery was utilized for this study. The raw digital number (DN) values were converted to spectral radiance and, subsequently, to top-of-atmosphere (TOA) reflectance before analysis. Specifically, the data from the Operational Land Imager-2 (OLI-2) sensor, as described in Table 1, were processed and analyzed as described in [29]. The main processing flow is as follows:
3.1.1. Band Composite and Band Ratios
This research employed RGB (red–green–blue) color composites derived from band ratios applied to the data. These composites were used to discriminate among various lithological units and delineate their spatial distribution across the study area. Band ratio images work by dividing the pixel values of one spectral band by those of another, which strengthens the contrast between features of interest. This technique plays a key role in bringing out specific minerals or surface features that would otherwise remain indistinguishable in the original, unrationed bands [30]. Moreover, the application of band ratio and color composite techniques [31] improves the differentiation of alteration zones. References [31,32] illustrated the efficacy of the RGB combination of band ratios band 4/band 2, band 6/band 7, and band 6/band 5 in mapping lithological and alteration zones. In this false-color composite, iron oxide-bearing zones stand out in bright red through the band 4/band 2 ratio. In contrast, the band 6/band 7 ratio is effective at picking out areas containing clay minerals and hydroxyl-bearing phases. The band 6/band 5 ratio, meanwhile, highlights ferrous mineral-rich zones, which appear as a distinct blue in the composite.
The transformation of the band ratios provides an effective method for delineating areas of hydrothermal alteration and associated mineralization, lineaments, and lithological units within a given area [32,33,34]. Drawing on the spectral reflectance behavior and the characteristic absorption-band positions of specific minerals and mineral groups, three band ratios—4/2 for iron oxides, 6/7 for hydroxyl-bearing and clay minerals, and 6/5 for ferrous minerals [32,35]—were applied to the enhanced Landsat-9 dataset. This approach was then used to map the spatial distribution and relative concentration of iron oxides, clay minerals, and ferrous minerals, providing insight into the alteration mineral patterns across the study area.
3.1.2. Spectral Angle Mapper
SAM classifies image pixels by comparing their spectral shape to reference (endmember) spectra rather than their absolute brightness. Each spectrum—pixel and reference alike—is represented as a vector in an n-dimensional space, where n equals the number of bands used; the angular separation between a pixel’s vector and a reference vector then serves as a direct measure of how closely their spectral shapes match [36]. A small angle indicates a strong match, while pixels exceeding a user-defined angular threshold are left unclassified.
The Spectral Angle Mapper (SAM) works by measuring the angular separation, in n-dimensional space, between the vector representing a reference (endmember) spectrum and the vector of each image pixel. A smaller angle indicates a stronger match to the reference material, while pixels whose angle exceeds a user-defined maximum threshold, expressed in radians, are excluded from classification. This spectral angle, θ, is calculated as described by [36].
3.1.3. Principal Component Analysis (PCA)
The PCA is an effective method for enhancing multispectral imagery, particularly for geological interpretation. It is a mathematical technique that seeks to reduce information redundancy across multiple dimensions by applying translations and rotations. Principal component analysis is a method for dimensionality reduction. It is often used to reduce the dimensionality of extensive datasets. It transforms a large set of variables into a smaller one while still retaining most of the information from the original set.
New axes are thus derived, resulting in the various bands being “decorrelated” with respect to the newly defined reference points along these axes. The spatial resolutions of the different bands have already been standardized. The PCA was applied to the seven bands of Landsat-9 OLI to assist in distinguishing lithological formations in this study.
As with any dimensionality reduction technique, condensing the spectral bands into a smaller set of components involves a trade-off: some of the original variance is inevitably sacrificed in exchange for a dataset that is easier to visualize and interpret geologically. In practice, PCA is favored in lithological and alteration mapping precisely because it concentrates the diagnostic spectral variability—much of which is redundant across correlated bands—into a handful of components that can be directly linked to mineralogical absorption features [37,38]. In conclusion, principal component analysis (PCA) is straightforward: it aims to reduce a dataset’s dimensionality while retaining as much information as possible.
3.2. Magnetic Method
A reduction to the north magnetic pole is applied to remove the positional bias of magnetic anomalies caused by inclined magnetization in areas of low and intermediate latitudes. The RTP-processed magnetic data can then be used to trace the subsurface structural patterns and dominant geological trends.
Structural interpretation of the RTP magnetic data was carried out using two main approaches. The first draws on the tilt derivative (TDR) to trace subsurface structural features . This concept was originally introduced by [39] and was later refined by [40]. The tilt derivative is mathematically expressed as:
where , and represent the gradients in the vertical and total horizontal of the magnetic grids, respectively.
The second approach makes use of the analytic signal technique, applied to the total magnetic field data, to locate the causative bodies—predominantly basement rocks. This technique was used to carry out a quantitative interpretation of the total magnetic intensity (TMI) data, with the amplitude (A) of the analytic signal calculated using the equation below [41,42].
which is based on the spatial derivatives of the magnetic field (M) with respect to the horizontal (x, y) and vertical (z) directions. Following [43], the analytic signal was also used to estimate the depth (d) to the magnetized source bodies:
In this approach, the depth is determined from the variation in the analytic signal amplitude (A) of the magnetic field at a given point (x).
3.3. Radiometric Method
The radiometric technique is highly effective for mapping surface structures, lithological units, and hydrothermally altered rocks.
The radiometric datasets were gridded to generate maps of total count (TC), potassium (K, wt.%), equivalent thorium (eTh, ppm), and equivalent uranium (eU, ppm), which together illustrate how these elements are distributed at the surface and help trace surface lineaments. A K/eTh ratio map was also produced to pinpoint zones of hydrothermal alteration, since alteration environments within ore deposits are typically marked by a decrease in eTh alongside an increase in K, as stated by [44]. Lastly, the three radioelement concentrations were combined into an RGB color scheme to produce a ternary composite map.
4. Results and Discussion
4.1. Remote Sensing Results
4.1.1. Color Composite
A three-band color composite can be very important for highlighting the presence and distribution of some minerals that can be attributed to a distinct geological unit. A three-band combination is used to distinguish iron oxides and clay minerals. For iron oxides, we used band 6 (SWIR1) as the red color, band 5 (NIR) as the green color, and band 4 as the blue color. The produced image is shown in Figure 5. Iron oxides typically appear in shades of bright red or reddish-brown. The strong reflectance in the infrared bands is highlighted, enabling clear differentiation.
Figure 5.
The iron oxides color composite shows the distribution of pink and reddish colors associated with the crystalline basement and volcaniclastic sedimentary units. These anomalies trace zones of intense surface weathering and supergene oxidation, where mobile ferrous iron (Fe2+) from primary rock-forming minerals has oxidized to highly stable, insoluble ferric iron (Fe3+) phases, principally hematite. These iron oxides undergo localized mechanical redistribution and residual concentration within the weathering profile and surrounding detrital sediments.
For clay minerals, we used the combination of near-infrared (band 5) as red, shortwave infrared (band 6) as green, and band 2 as blue. Clay minerals often exhibit muted tones, such as shades of green, indicating their presence. The shortwave infrared band (band 6) is crucial for discerning clay variations, as shown in Figure 6.
Figure 6.
The clay mineral color composite of the Wadi Queih area. It shows the distribution of green colors associated with altered metamorphic and metasedimentary rocks.
Band Composite (Sabin’s Ratio): Figure 7 presents the RGB color composite derived from the ratios of bands (4/2) as red, bands (6/7) as green, and bands (6/5) as blue, commonly known as “Sabin’s ratios.” This illustration demonstrates the different spatial arrangements of the various alteration zones, characterized by areas dominated by iron oxide, clay-hydroxyl, and ferrous minerals, represented in pink, green, and blue, respectively. As a result, iron oxide minerals are prevalent in the southeastern region, primarily in areas above greenstone. By contrast, clay and hydroxyl-bearing minerals are concentrated mainly in the western and northwestern parts of the study area, underlain by a varied granitic suite comprising granite, granodiorite, and quartz diorite (Figure 2). Where iron oxide (red) and clay/hydroxyl (green) signatures overlap, the resulting composite yellow tone often traces linear trends of likely tectonic origin, pointing to a zoned pattern of hydrothermal alteration.
Figure 7.
Sabin’s ratio of the Wadi Queih area. It shows different color shades related to various geological units.The ratiosharpens the contrast or contact between different materials.
4.1.2. Principal Component Analysis
In this analysis, PCA was conducted using the covariance matrix for Landsat-9 OLI bands 1–7. The first PCA (PC1) accounts for 98.35% of the variance in the data. It contains the most detailed information in the input bands. This makes it ideal for highlighting lithological and structural features. Meanwhile, the last PC accounts for the least amount of information from the input bands, contributing just 0.00119% of the total variance. The signs and magnitudes of the eigenvector loadings in PC2, PC3, and PC5 reveal that these components capture distinct spectral signatures associated with zones of alteration.
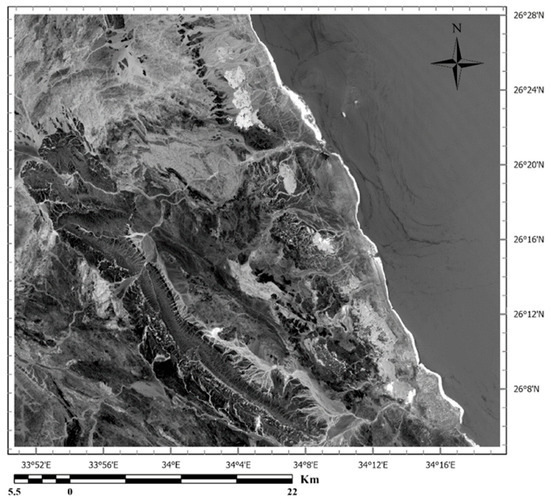
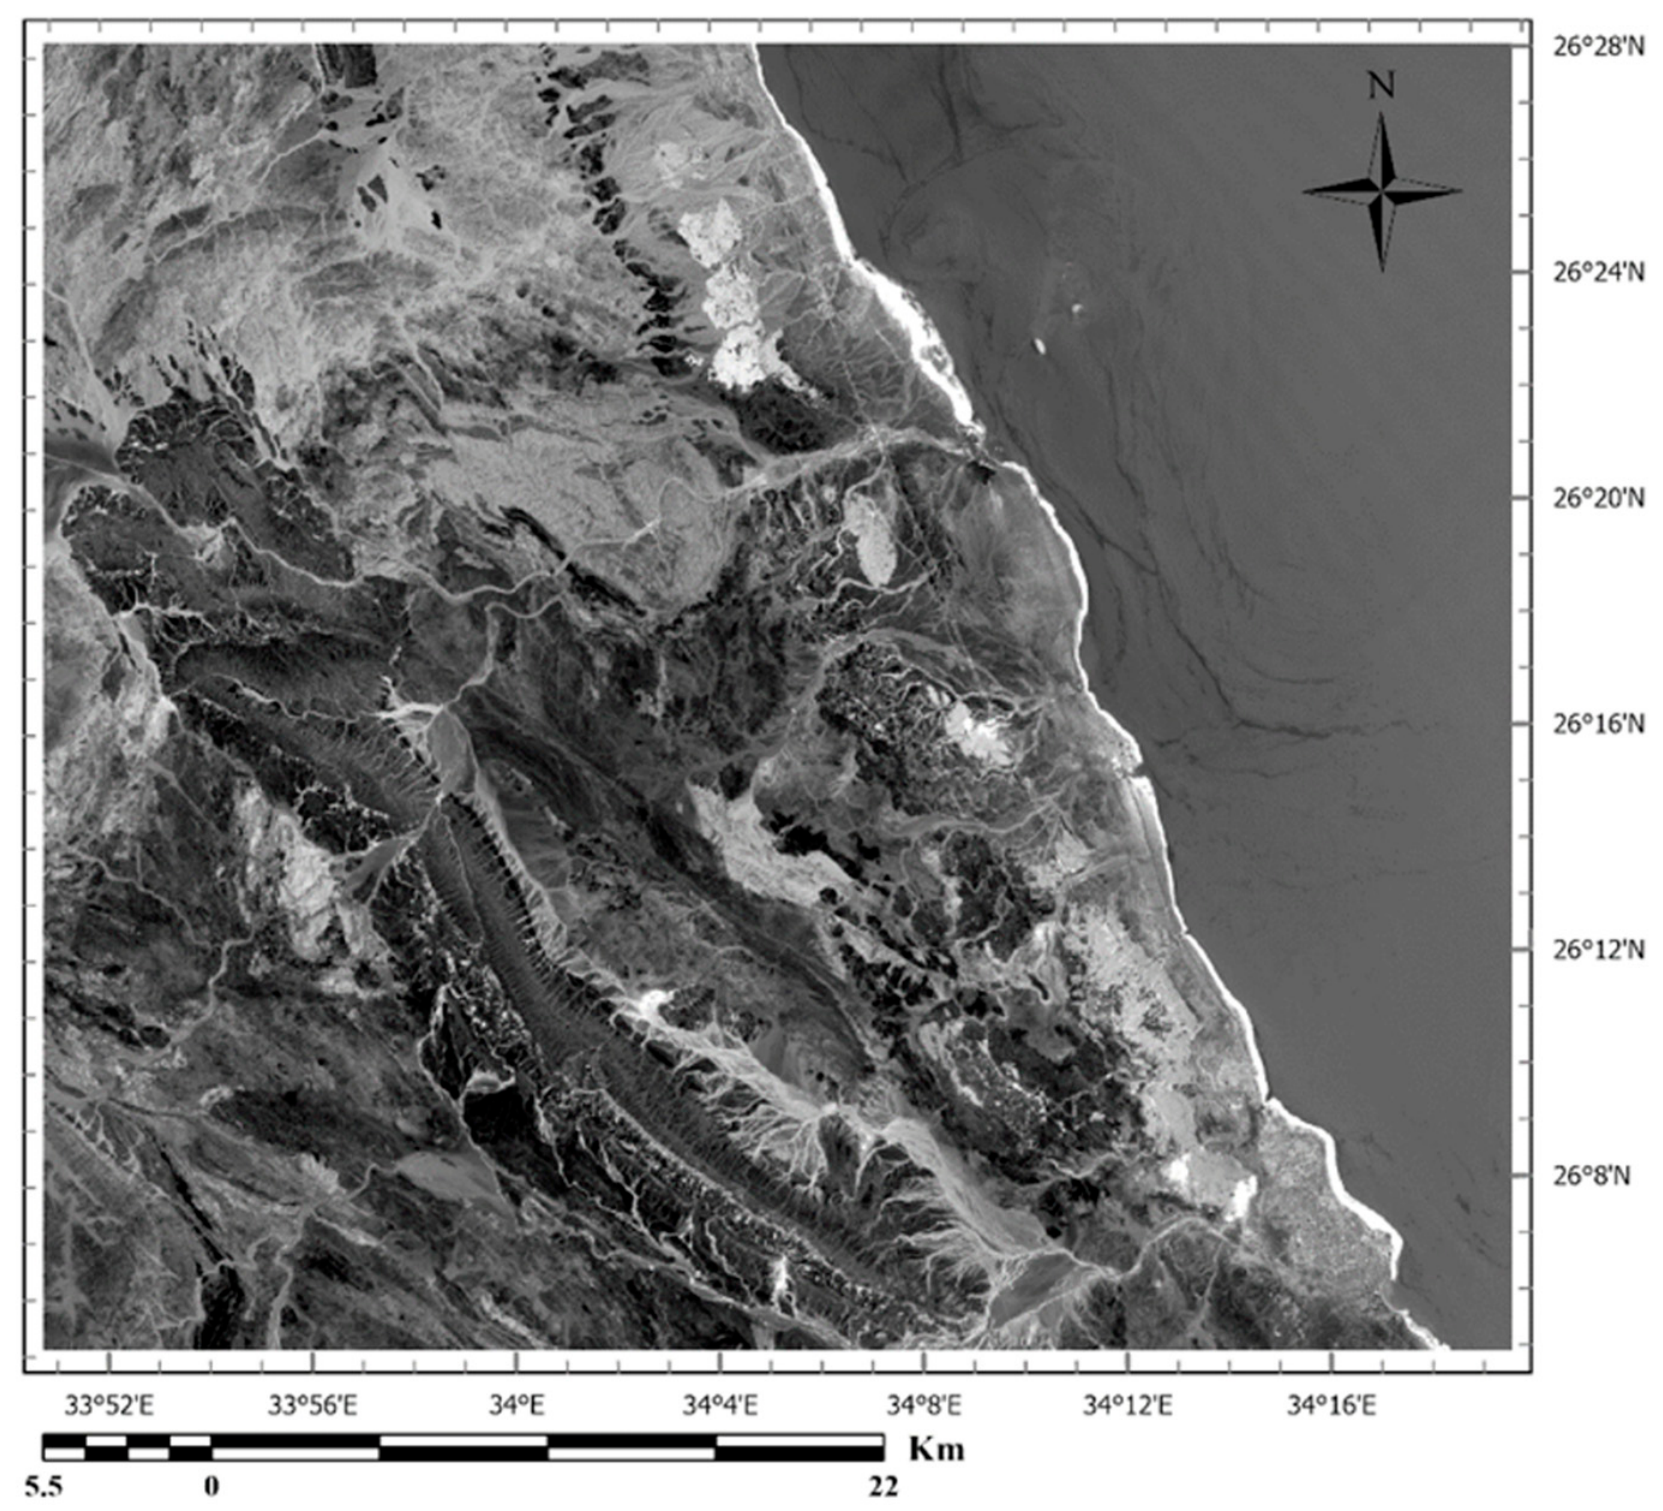
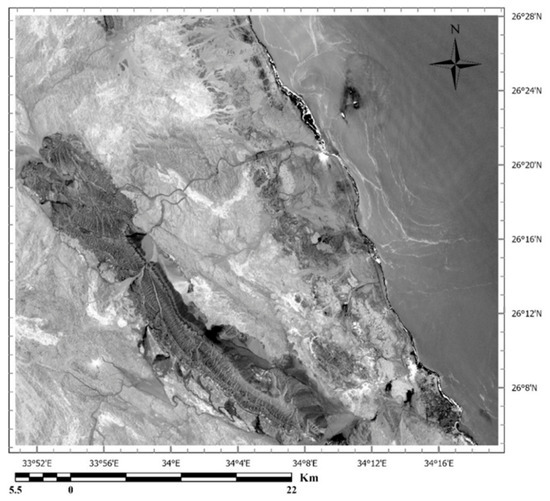
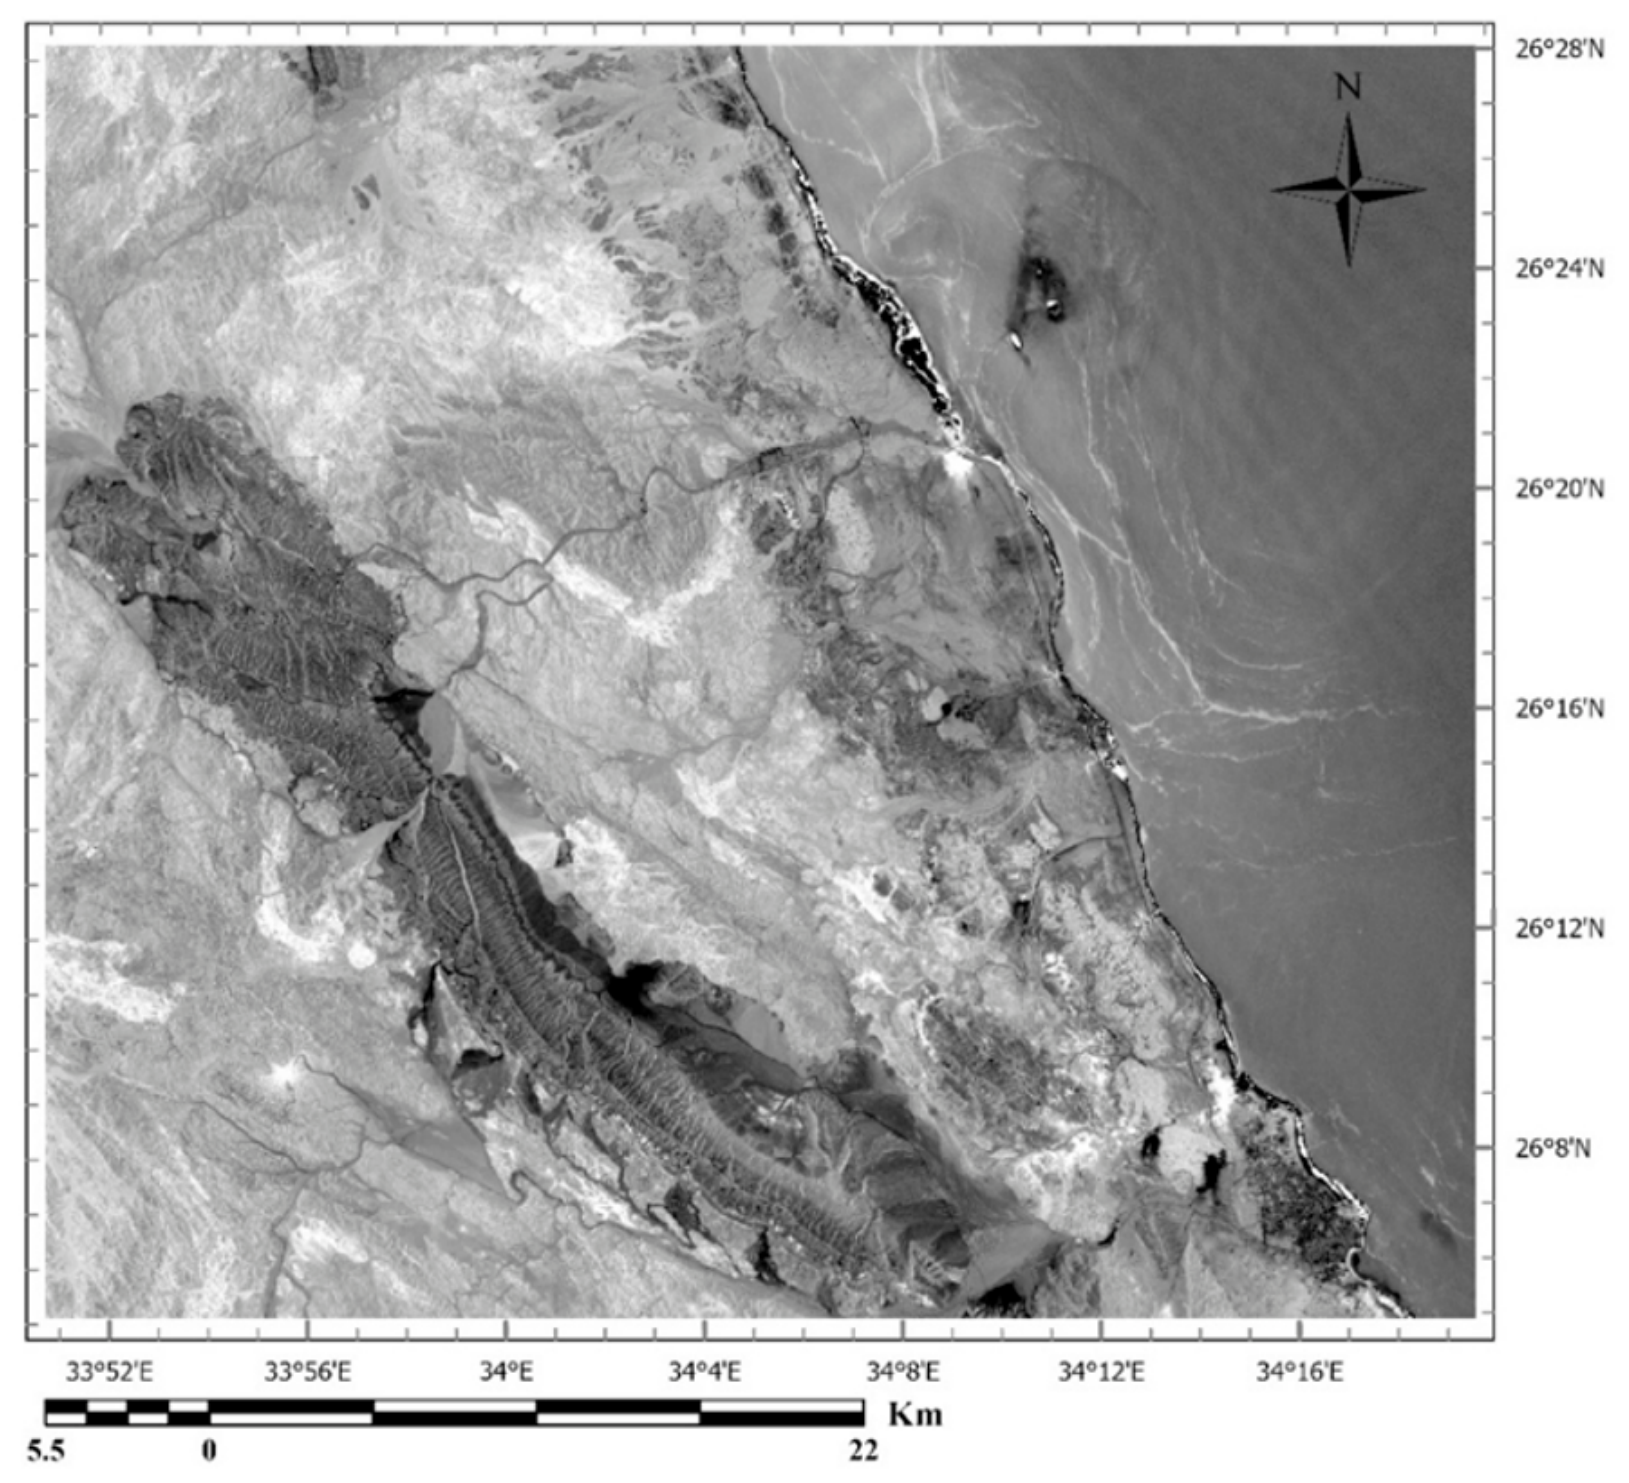
PC5 exhibits strong contributions from band 2 (0.322) and band 4 (−0.530), with opposing signs Table 2. Iron oxide and hydroxide-bearing minerals and rocks display strong absorption features in Landsat-9 OLI band 2 (0.45–0.51 µm) and pronounced reflectance in band 4 (0.64–0.67 µm) [45]. Consequently, the PC5 image highlights the iron oxide and hydroxide-bearing minerals and rocks as dark pixels in Figure 8.
Table 2.
The eigenvector matrix corresponding to these bands.
Figure 8.
PC 5 image map from 7-band PCA of the Wadi Queih area. It shows the presence of minerals containing iron oxide and hydroxide as dark pixels.
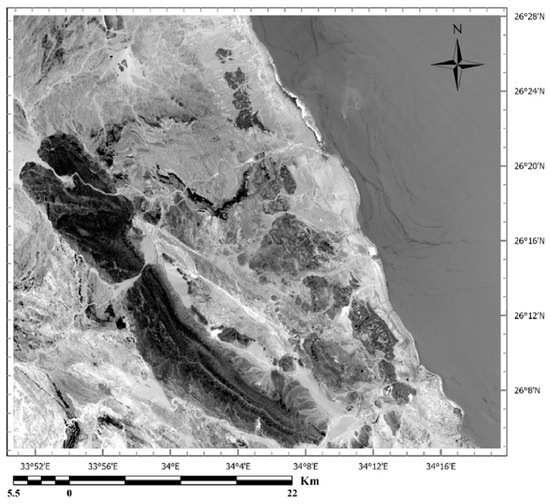
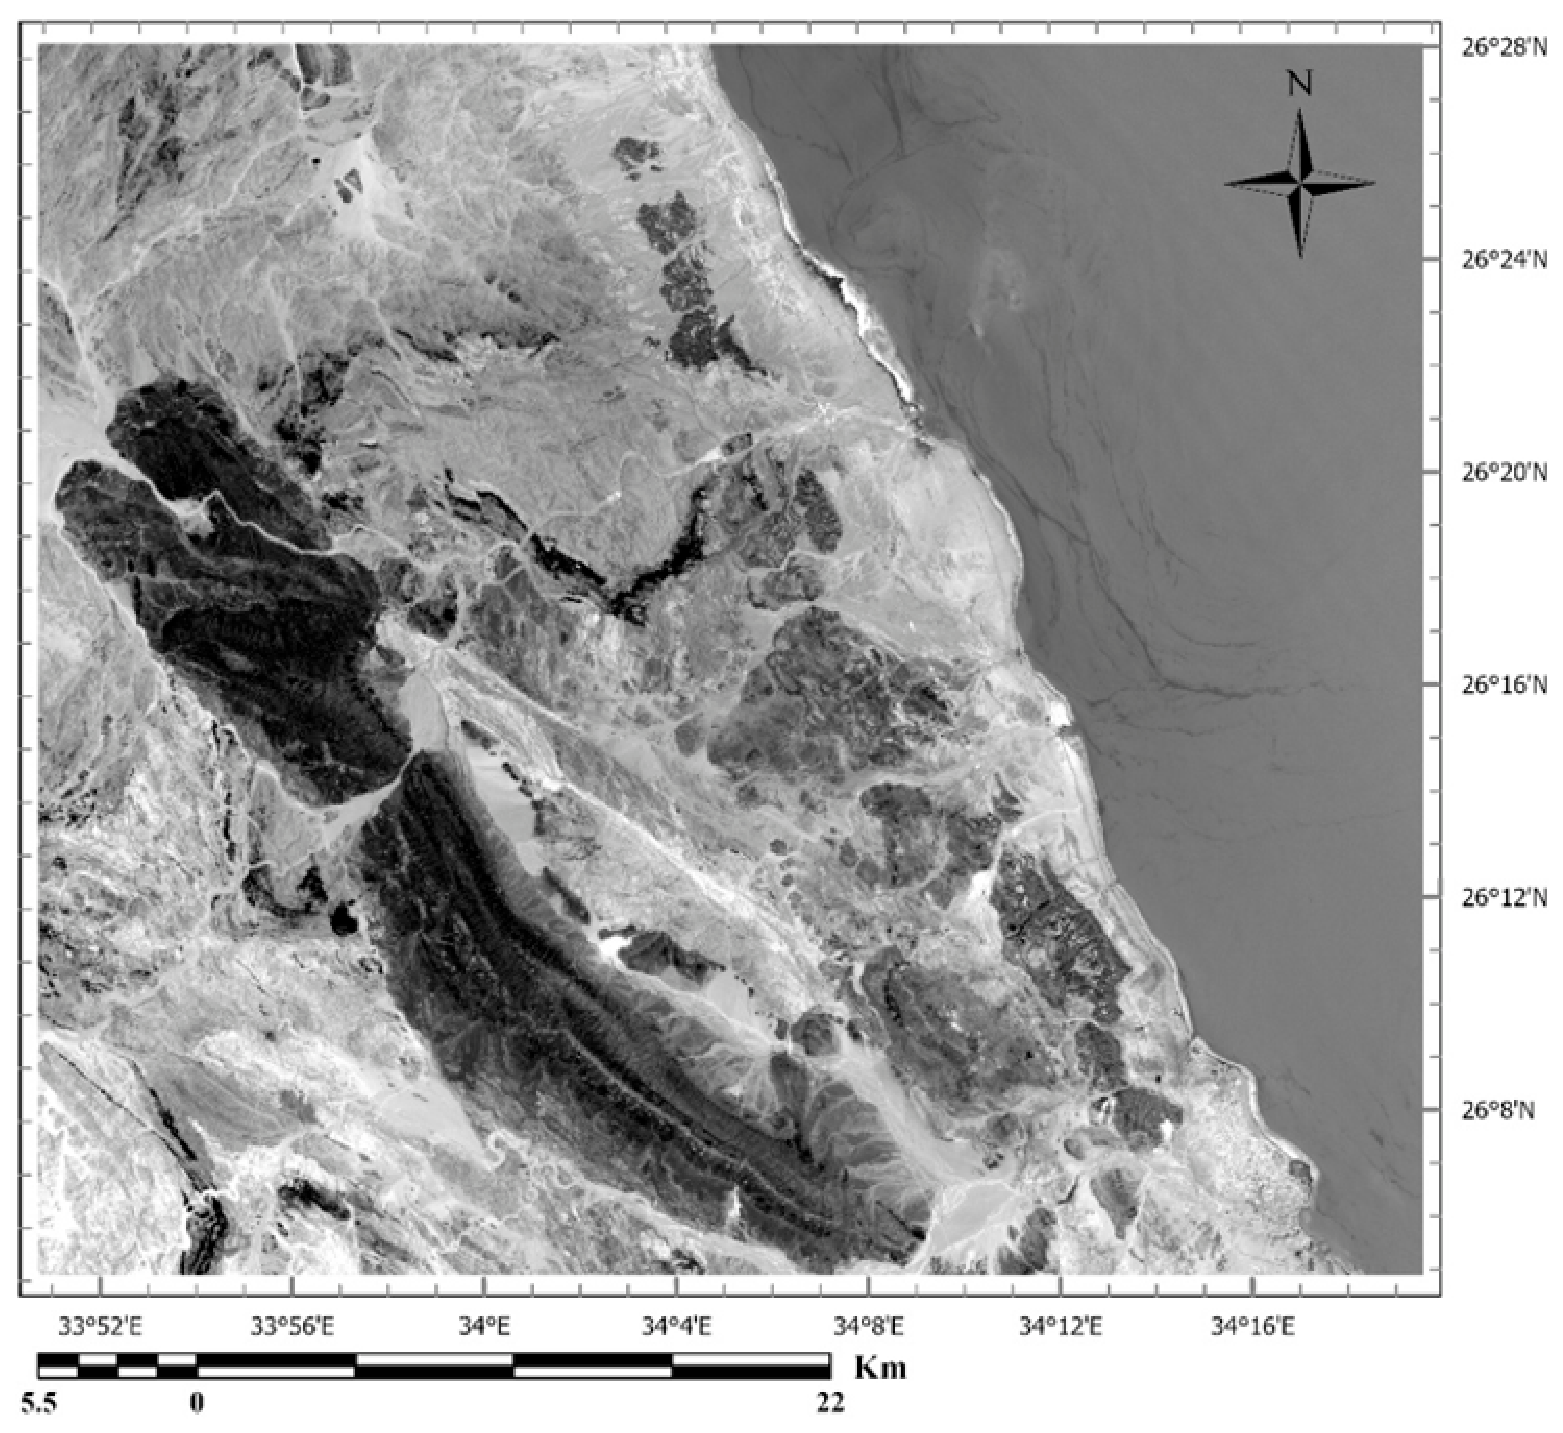
The PC2 eigenvector shows significant loadings from band 5 (0.458) and band 6 (−0.452) with opposite signs (Table 2). Ferrous silicates exhibit strong absorption features in the 0.9–1.2 µm range, corresponding to Landsat-9 bands band 5 and band 6 [46]. As a result, the PC2 image enhances the surface distribution of ferrous silicates, highlighting them as bright pixels (Figure 9).
Figure 9.
The PC2 image map from the 7-band PCA of the Wadi Queih area shows ferrous silicate minerals as bright pixels.
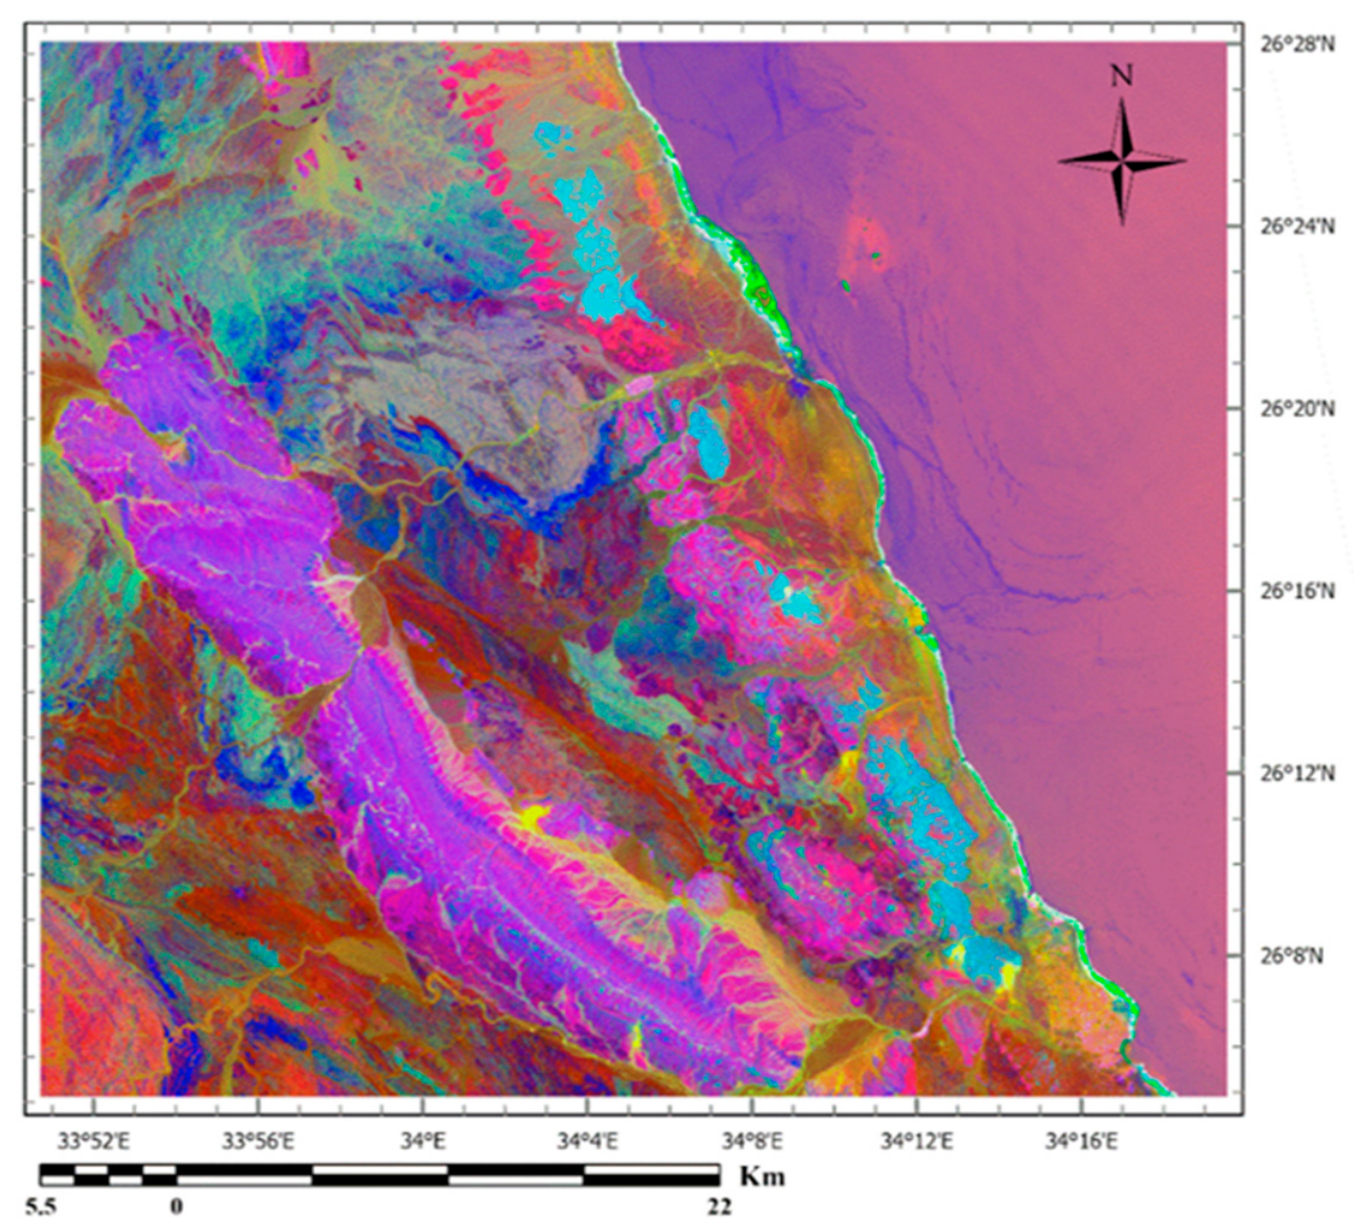
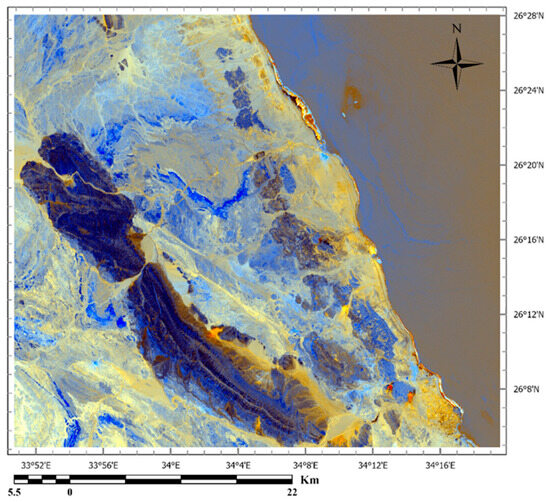
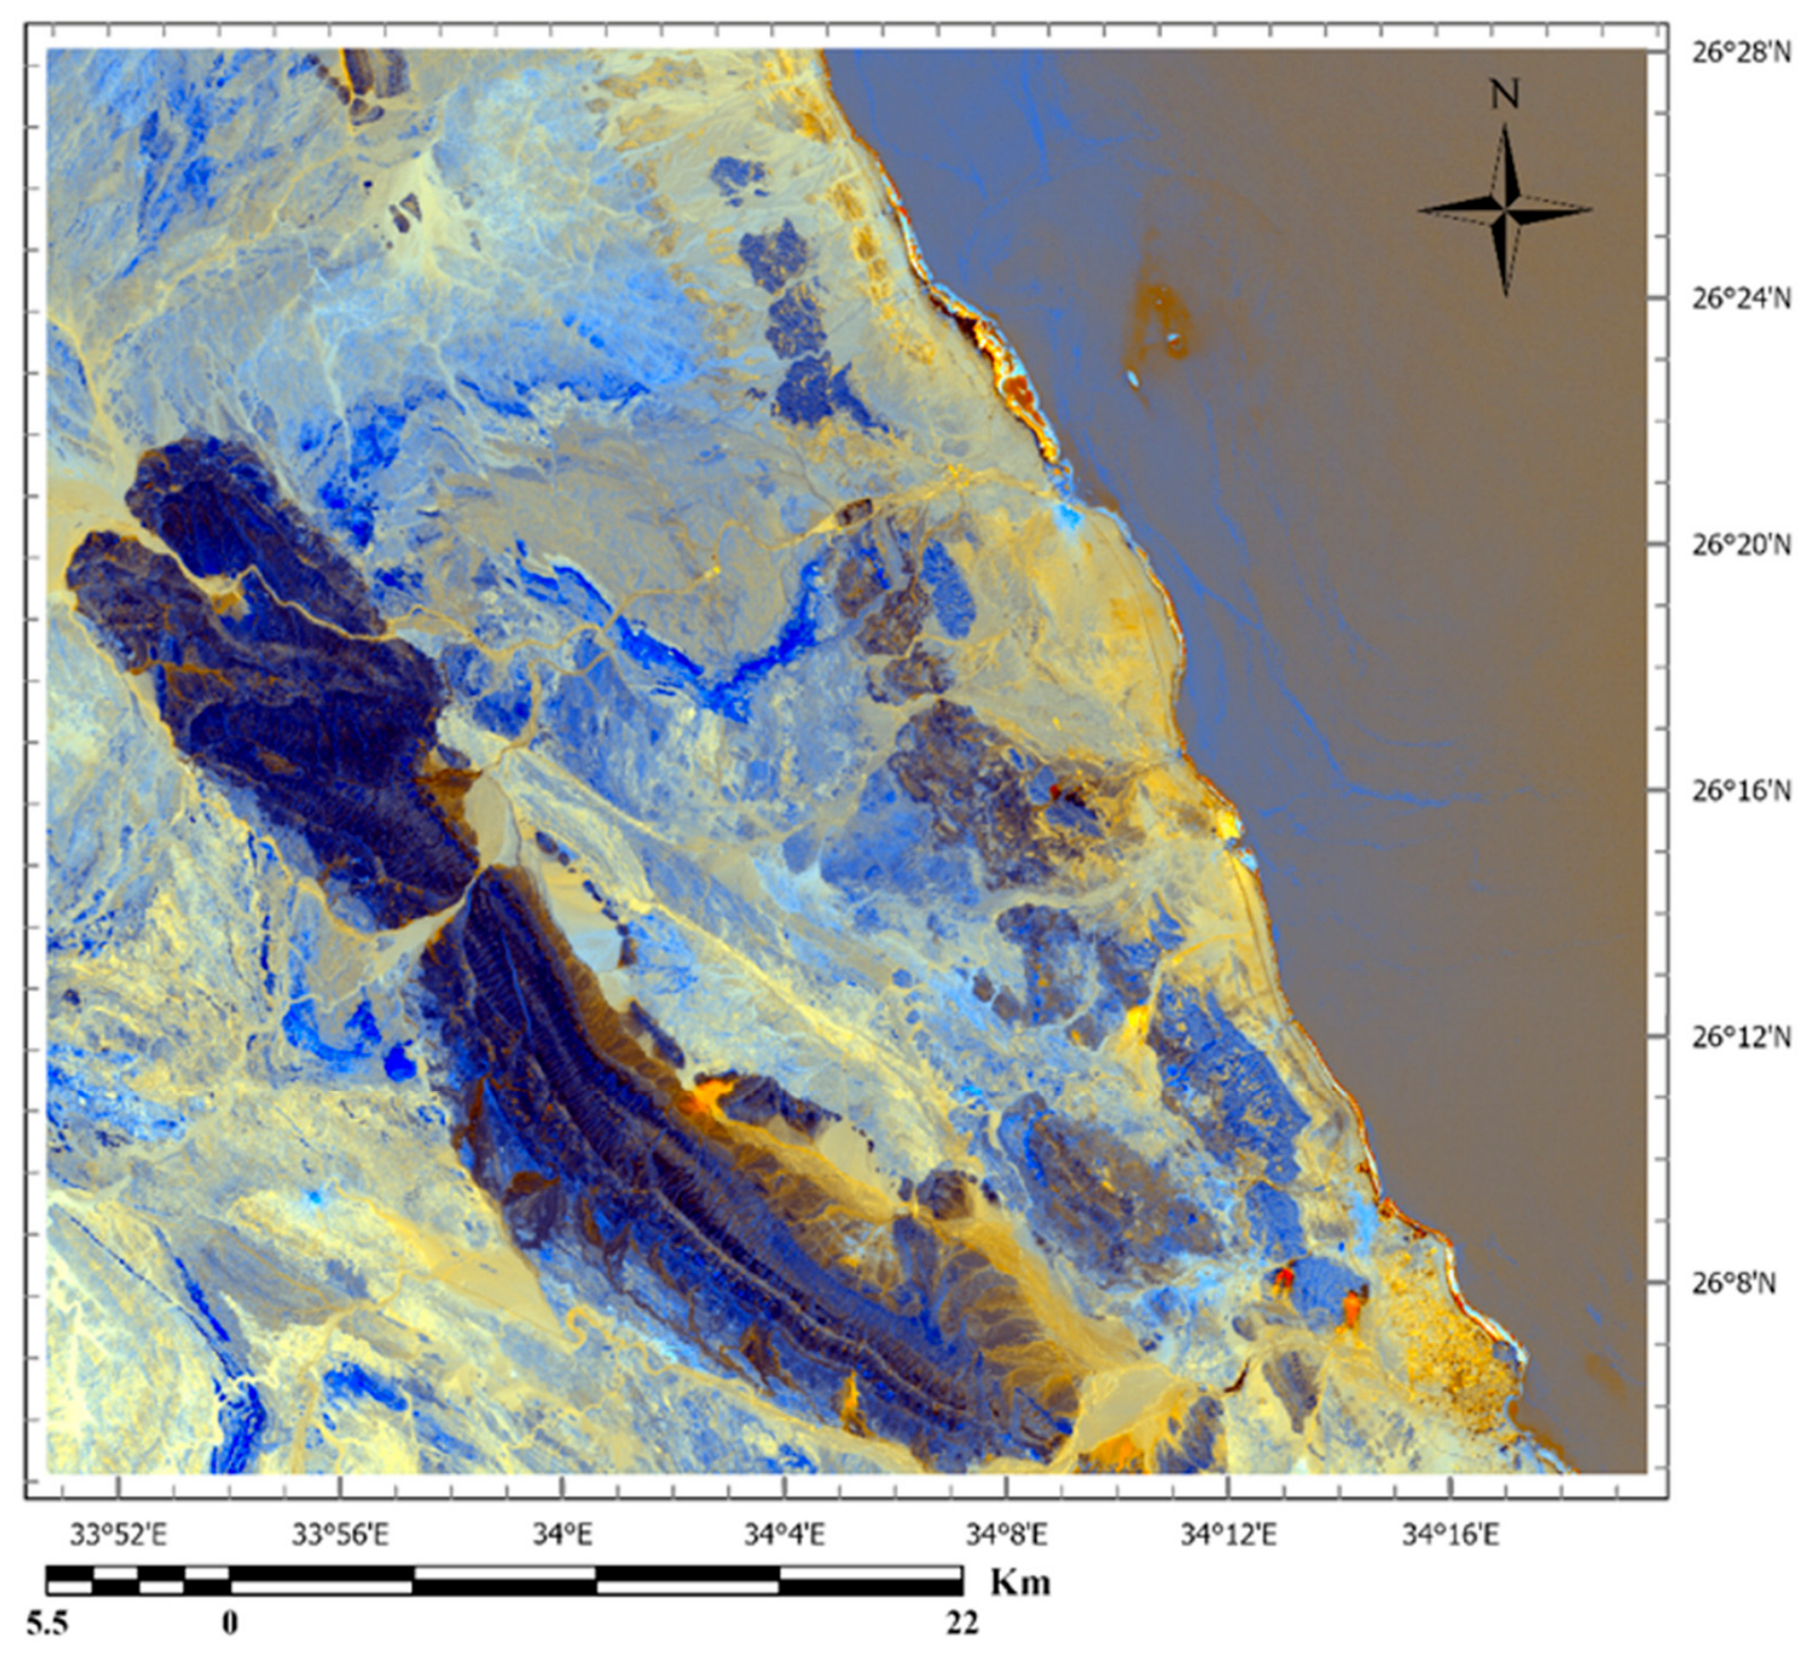
PC3 is characterized by high loadings of opposite signs on band 6 (0.444) and band 7 (−0.623). This pattern reflects the known spectral behavior of hydroxyl-bearing sulfates, clays, and carbonates, which reflect strongly in band 6 (1.57–1.65 µm) but absorb in band 7 (2.11–2.29 µm) of the Landsat-9 OLI sensor [46]. As a result, these minerals appear as bright pixels in the PC3 image, outlining their surface distribution (Figure 10). When combined into an RGB composite using PC5, PC2, and PC3, the resulting image brings out zones of hydrothermal alteration, rendered in orange-to-gold tones across the study area (Figure 11). Notably, most of the recorded mineral occurrences coincide spatially with these alteration zones.
Figure 10.
The PC 3 image map from the 7-band PCA of the Wadi Queih area displays carbonates and clays as bright pixels.
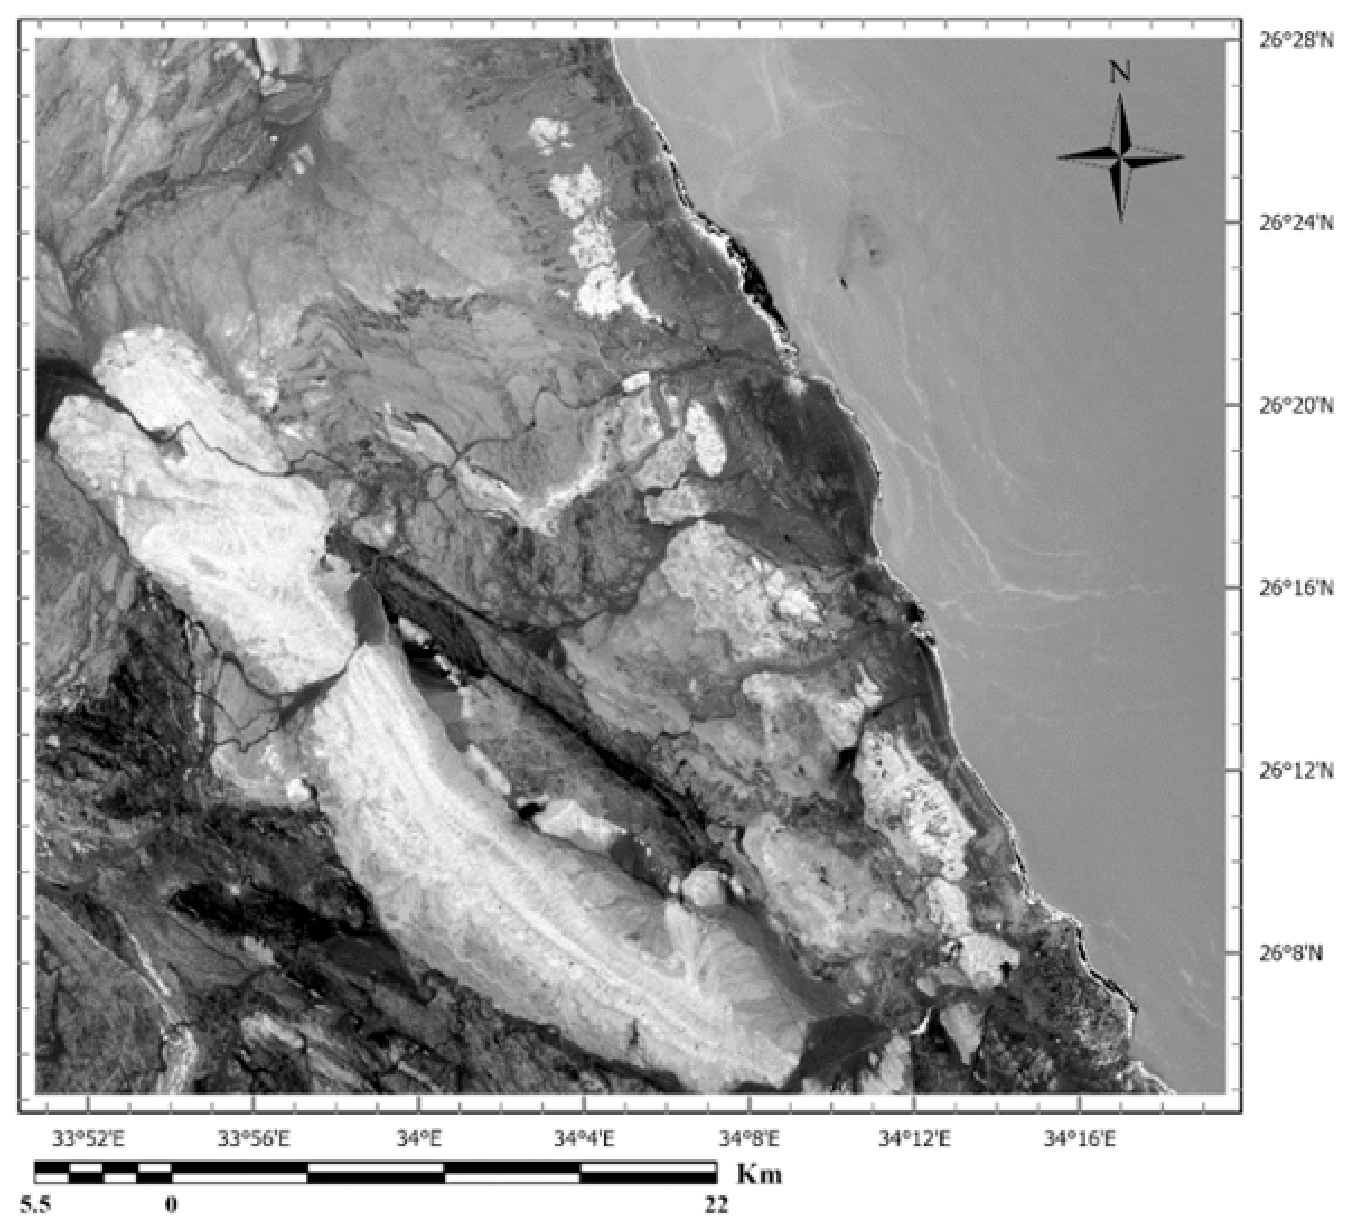
Figure 11.
The color composite of the PC5, PC2, and PC3 images of the Wadi Queih area. It highlights hydrothermal alteration zones. Where hydrothermal alteration, appears in orange-to-gold tones in the area.
4.1.3. Crosta Method Used on Six Bands
A combination of different PCAs is described by [47]. Table 3 shows the eigenvalues of the image, which reflect the reduction in variance across sequential PCA, and the eigenvector loadings, which represent the principal components as weighted linear combinations of the original input images/bands. These are obtained from a principal component transformation using the covariance matrix and are applied to six reflectance bands of the Operational Land Imager (OLI). The six OLI bands from band 2 to band 7 The color composite of the PC5, PC2, and PC3 imagesare shown in in Figure 11.
Table 3.
PCA components of Landsat-9 OLI on six bands.
- ❖
- Crosta technique on four bands—Hydroxyl minerals.
Hydroxyl mapping analysis requires OLI bands 2, 5, 6, and 7. Bands 3 and 4 have been intentionally left out to prevent iron oxides. PC3 eigenvector loadings showed a significant correlation with the spectral response for hydroxyl. This “hydroxyl” (H) image highlights the hydroxyl-bearing rocks as dark pixels in Figure 12 due to the negative contribution from band 6. Table 4 shows the eigenvalues of the image.
Figure 12.
(H) image of the Wadi Queih area. It displays the PC3 image from the 4-band PCA (2, 5, 6, 7). Hydroxyl-bearing exposures appear as dark pixels.
Table 4.
Principal component analysis of hydroxyl mapping.
4.1.4. Crosta Technique on Four Bands—Iron Oxide Minerals
The four bands used as input for the PCA were chosen based on laboratory-derived spectral signatures of minerals typically associated with hydrothermal alteration. A spectral response of iron oxide-bearing minerals was performed using OLI bands 2, 4, 5, and 6. In this analysis, band 7 could be substituted for band 4 with minimal impact on the results; however, one SWIR band is intentionally omitted to prevent hydroxyl mapping. Table 5 displays the principal component transformations applied to OLI bands 2, 4, 5, and 6 for iron oxide mapping. PC4 relates to iron oxide, with eigenvector loadings of (−0.734) for band 2 and (0.606) for band 4. The PC4 image (F image) shown in Figure 13 can be used to pick out iron oxide-stained zones, which appear as bright pixels owing to the strong positive contribution of band 4.
Table 5.
Principal component analysis of iron oxide mapping.
Figure 13.
(F) image of the Wadi Queih area. It shows the PC4 image from 4-band (2, 4, 5, 6) PCA. Iron oxide exposures appear as bright pixels.
4.1.5. Crosta Composites for Alteration Mapping
A further advantage of the Crosta technique is the ability to combine its outputs into a composite “H + F” image, in which the brightest pixels correspond to areas showing elevated concentrations of both hydroxyl-bearing (argillic) minerals and iron oxides. This composite is generated by merging the H and F images and rescaling the combined output to a 256-level grayscale.
Many previous studies show different combinations of the Crosta images, with the literature favoring an RGB composite of H, H + F, and F [38]. In this scheme, hydroxyl-bearing minerals show up as bright yellow to orange tones. At the same time, iron oxide-rich areas appear in cyan to bluish shades (Figure 14). Ref. [47] stated that Within the brightest reflective zones, white pixels likely mark the areas of highest exploration potential, since they represent terrain that is simultaneously iron-stained and argillized. Ref. [47] observed that argillization identified in the H images frequently corresponds to genuine exploration anomalies, especially where such zones coincide with outcrops and residual soil cover. On this basis, zones showing orange to yellow reflectance can be interpreted as likely sites of hydrothermal alteration.
Figure 14.
A composite color map of H, H + F, and F images of the Wadi Queih area. The orange and yellow pixels can be interpreted as likely sites of hydrothermal alteration.
4.1.6. Spectral Angle Mapper Results
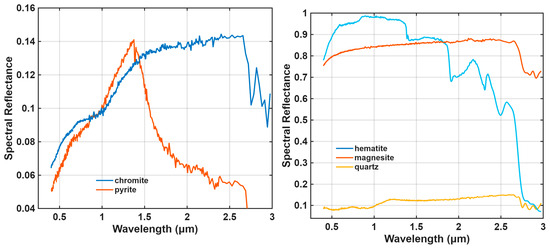
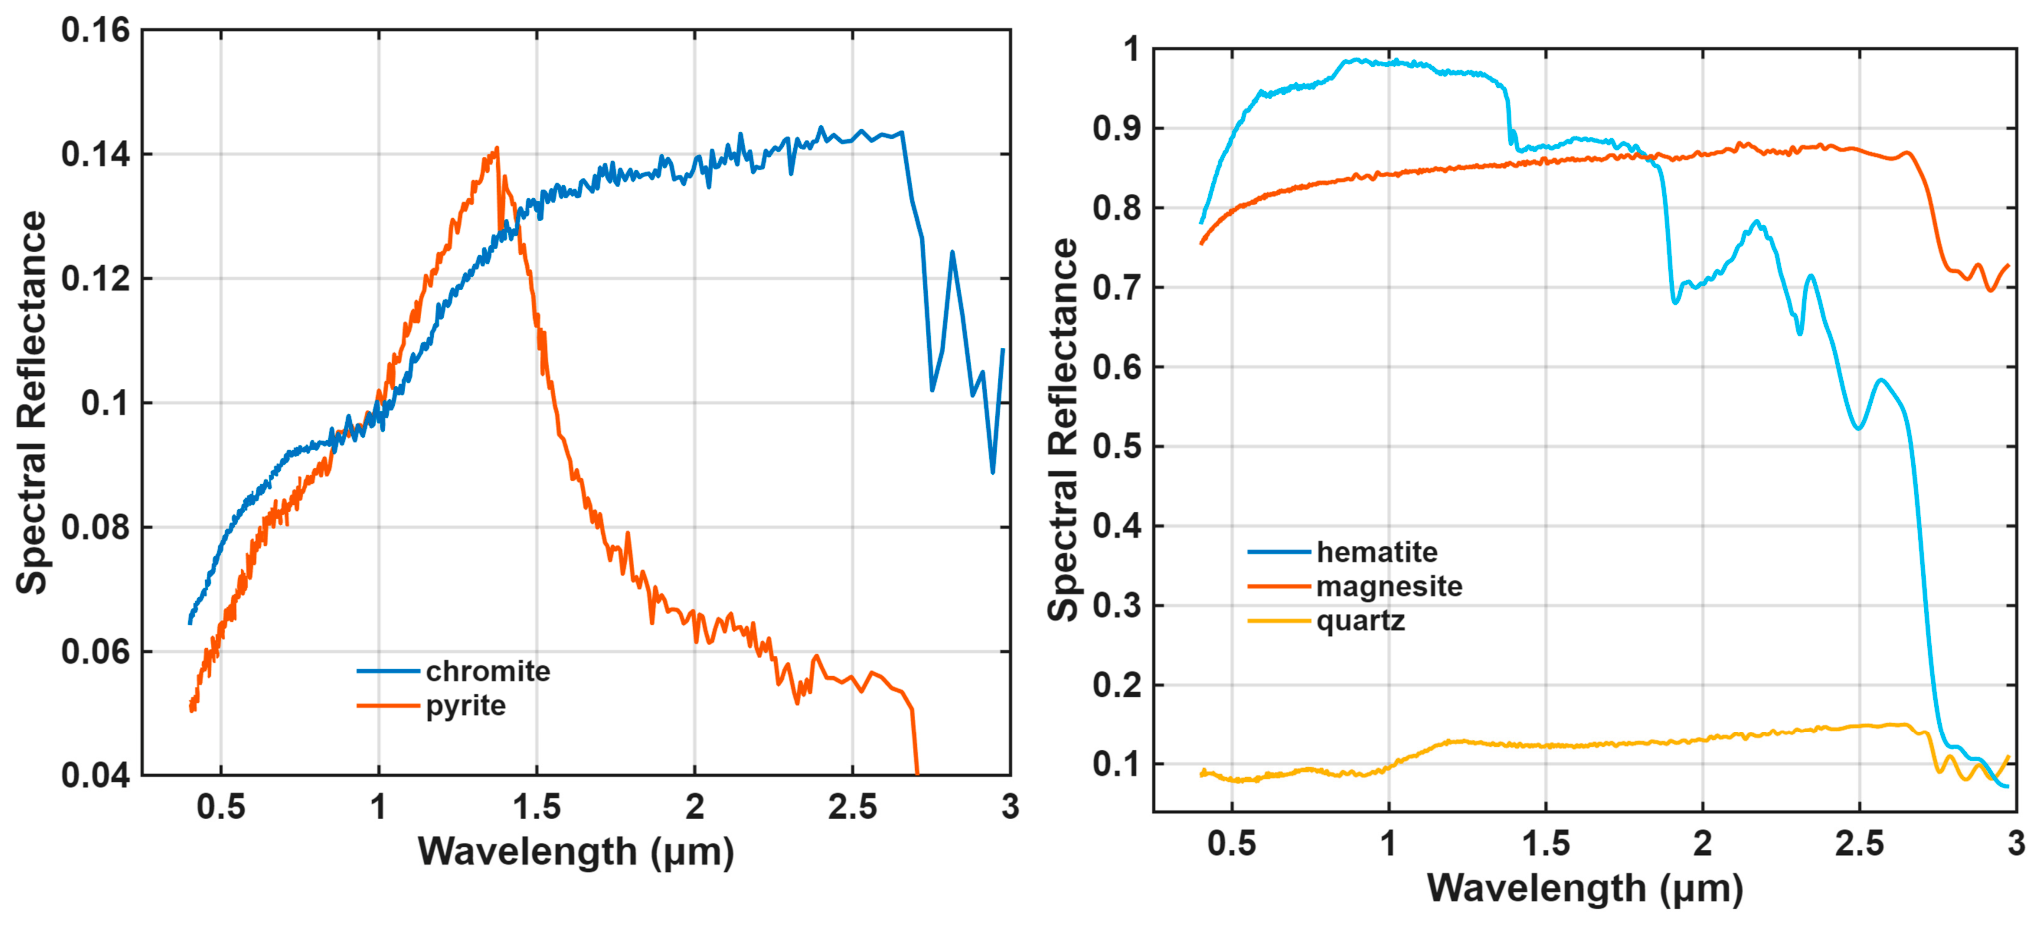
Using the spectral signatures of major minerals, which may be related to mineralization in the studied area, SAM can help identify similar materials in a scene based on their spectral characteristics, as shown by the spectrum used in this study.
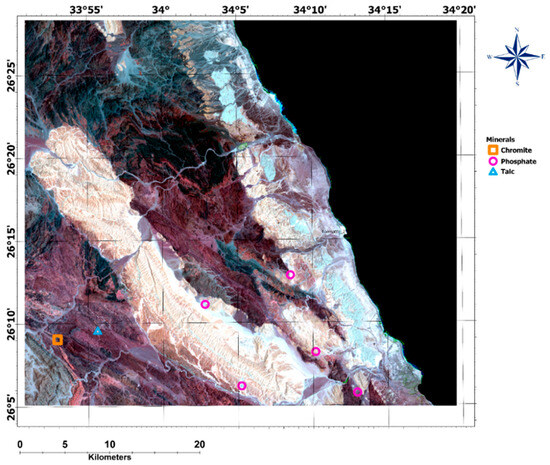
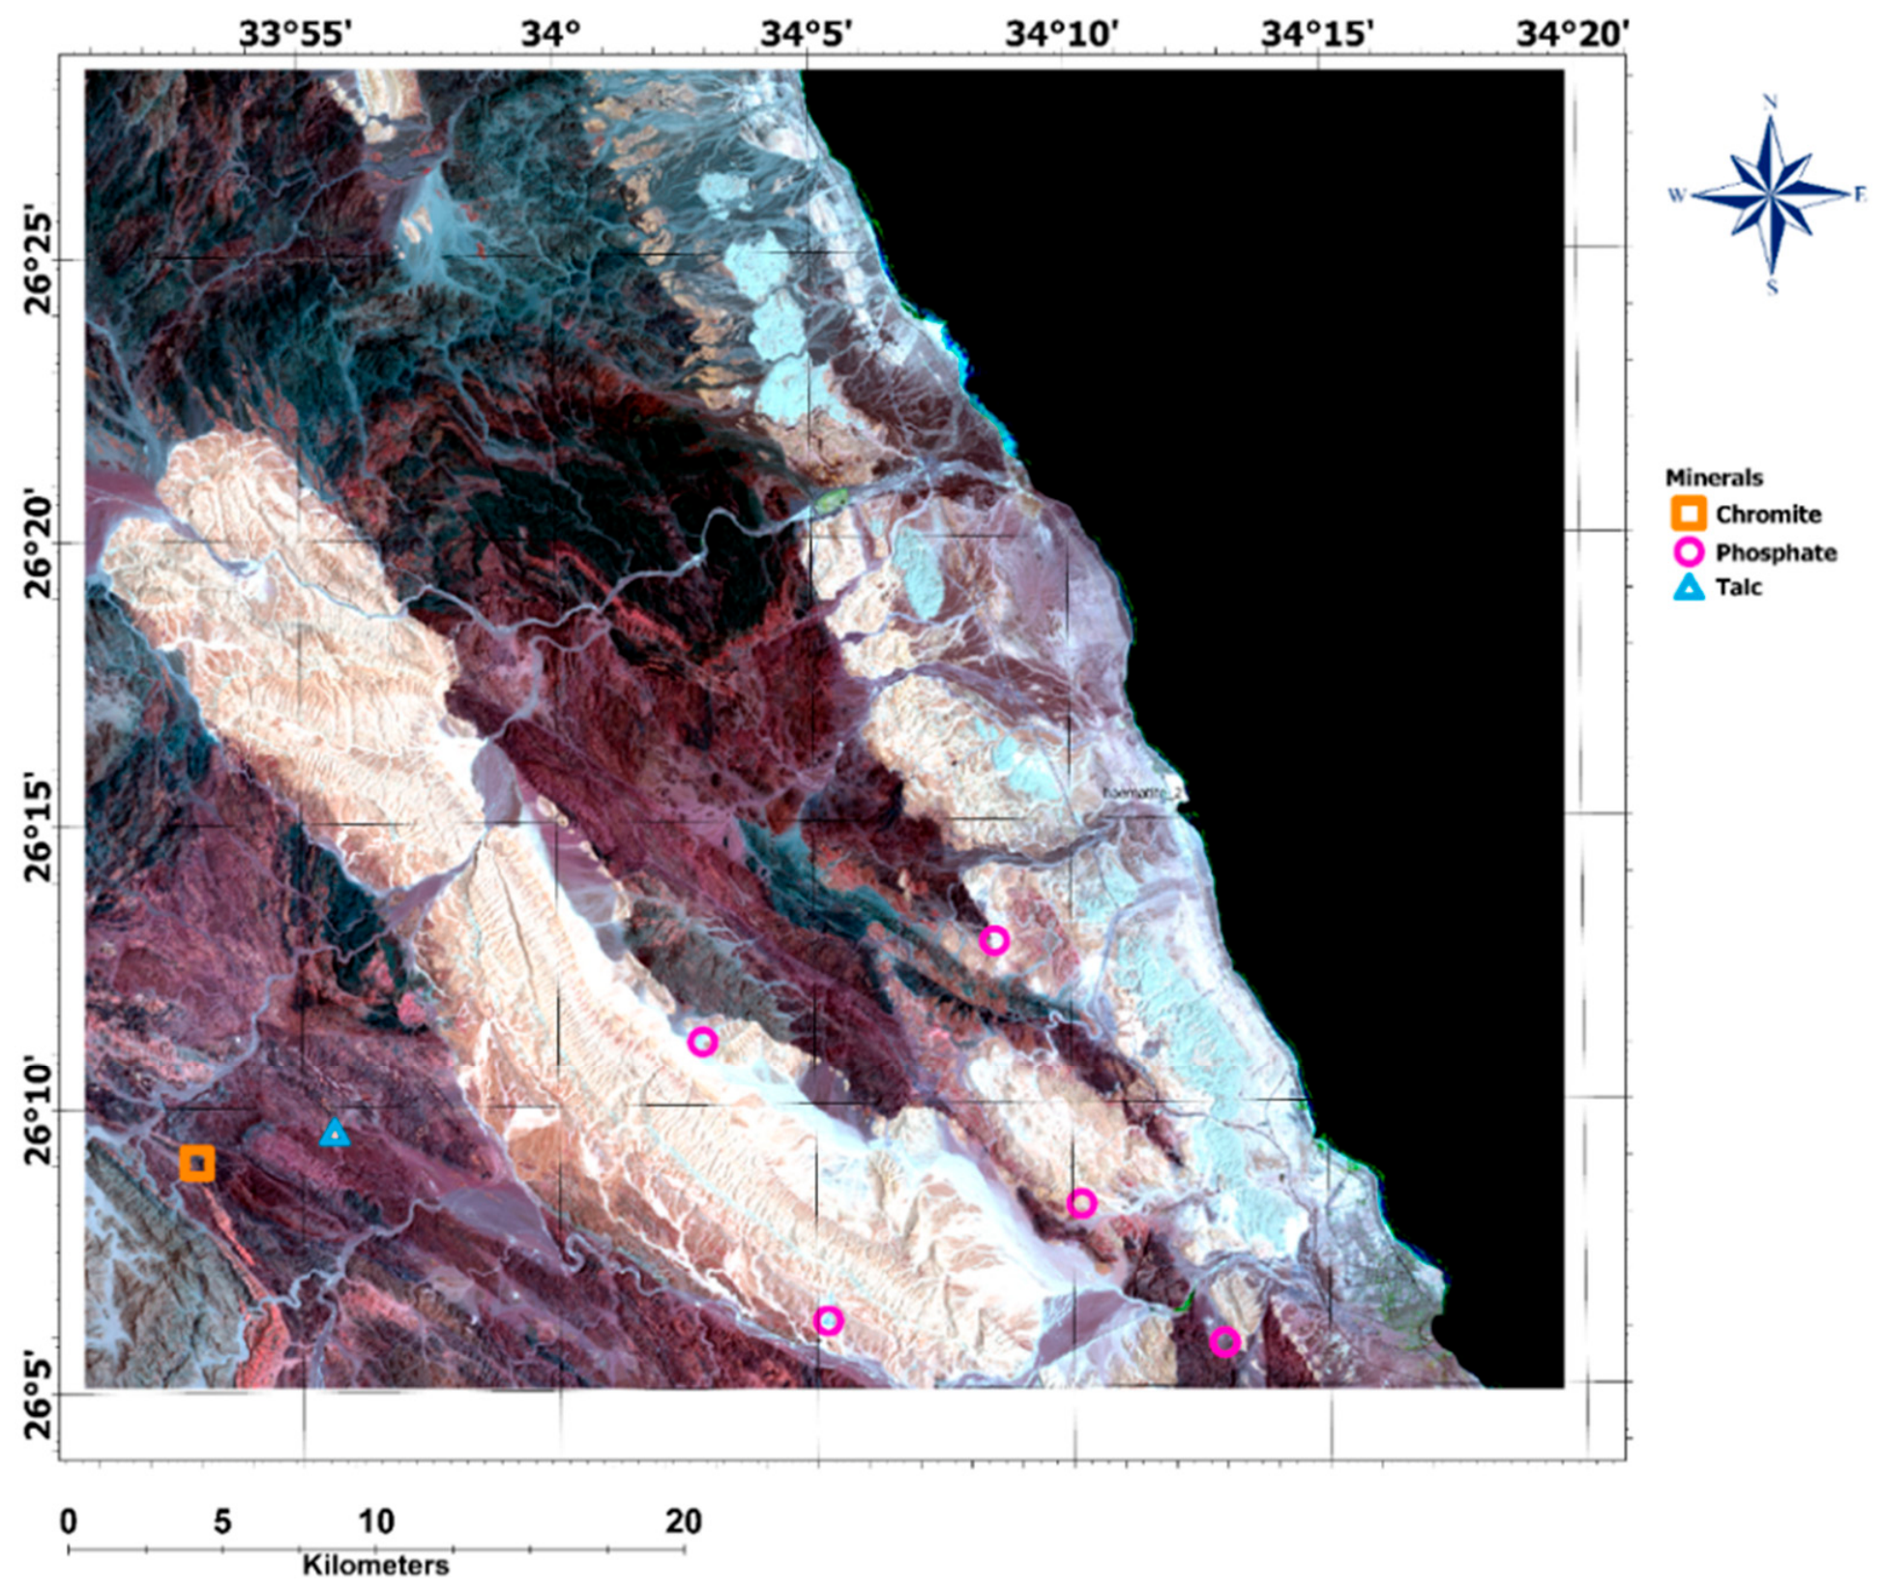
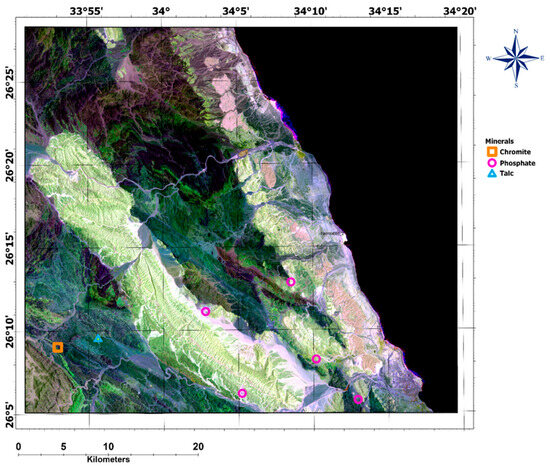
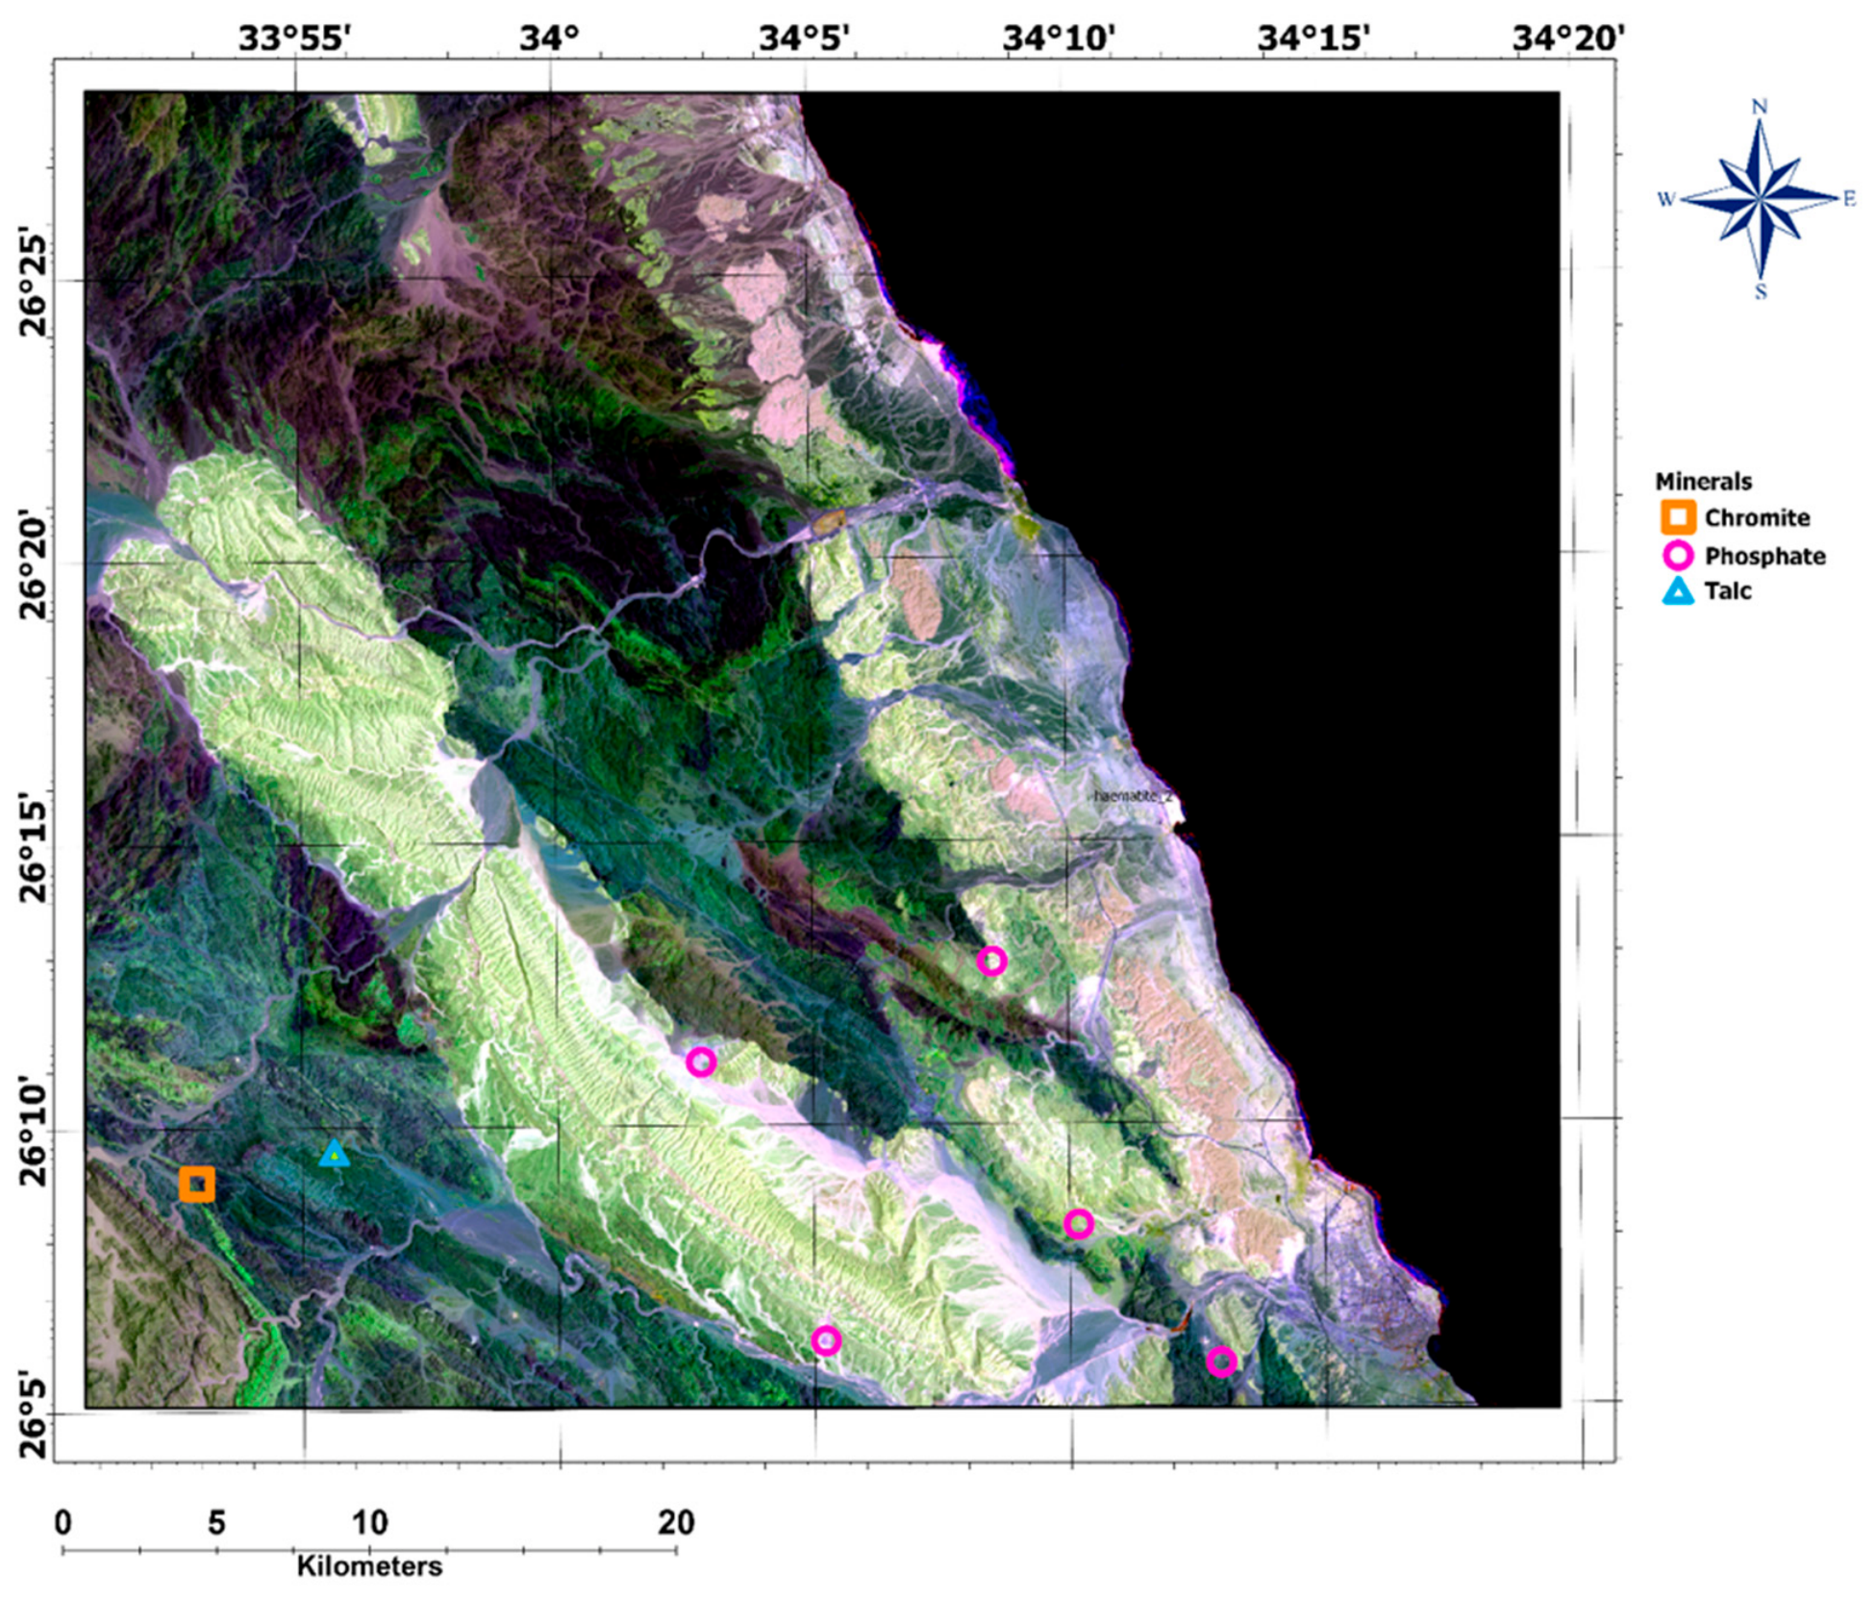
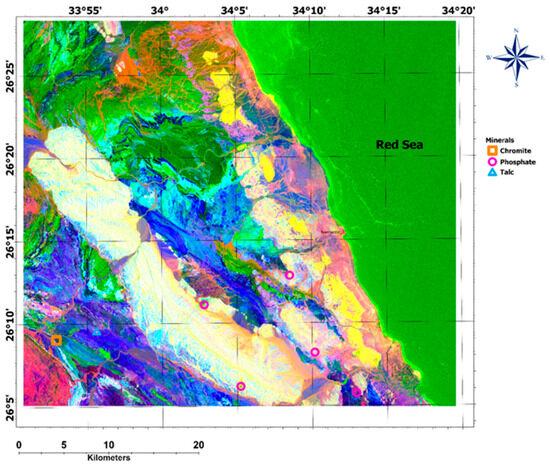
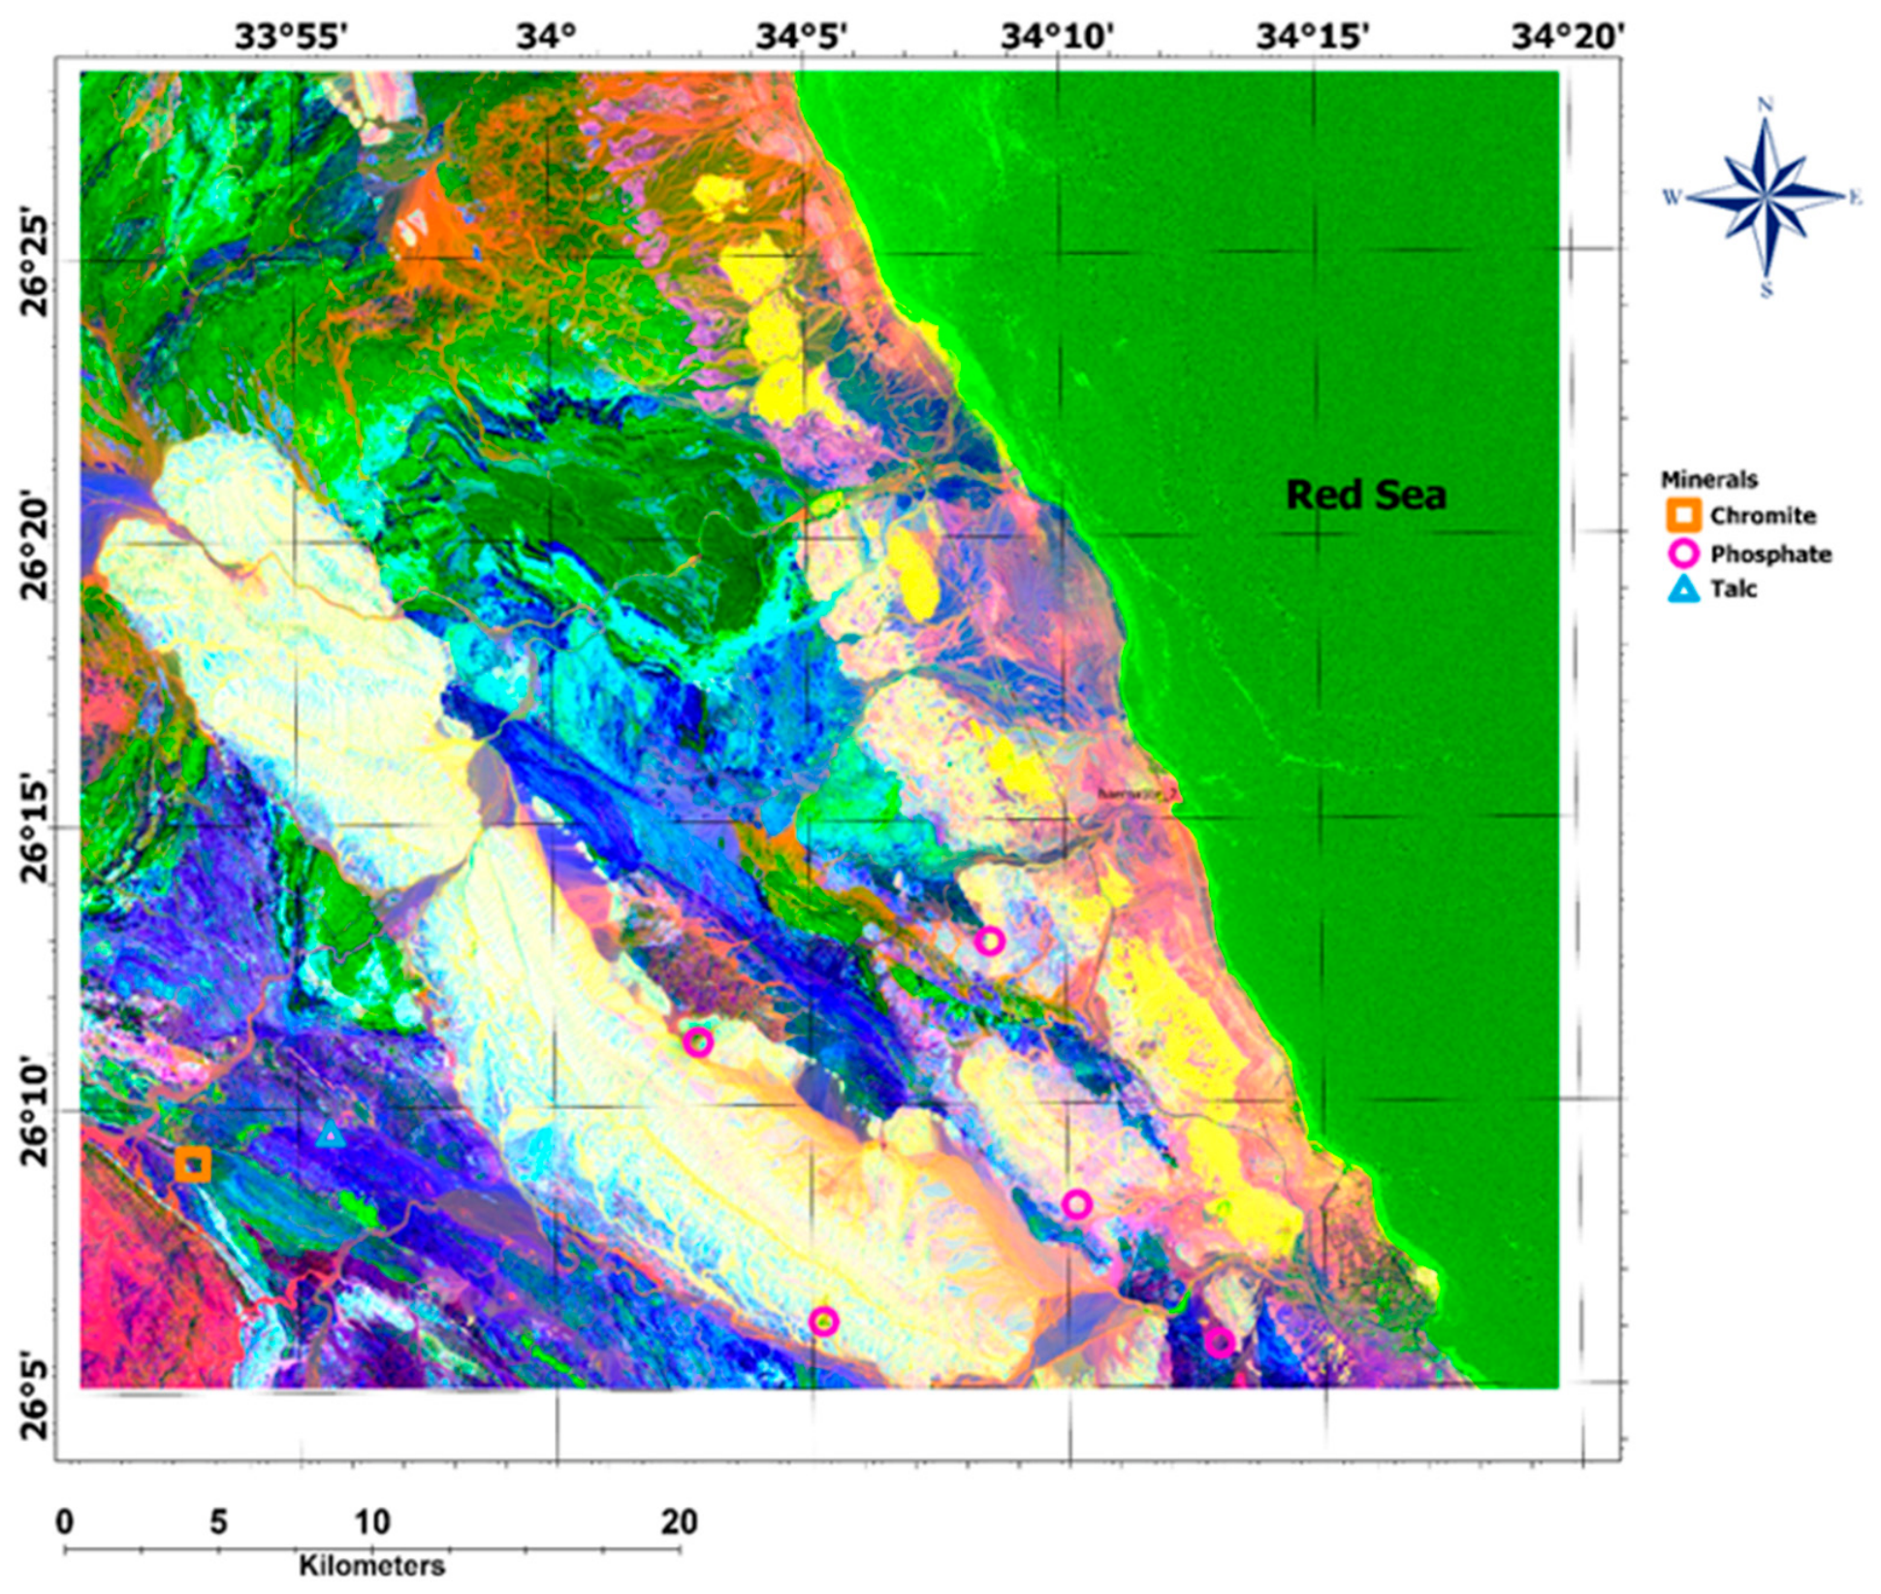
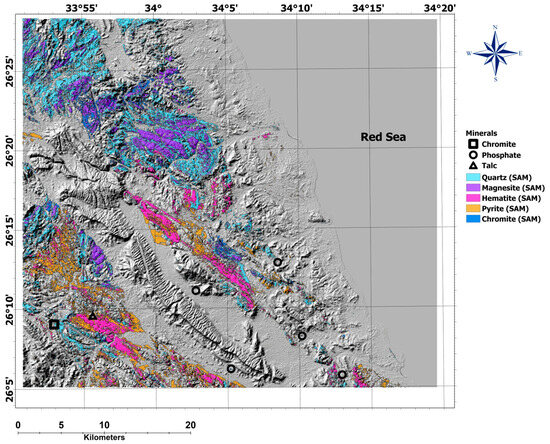
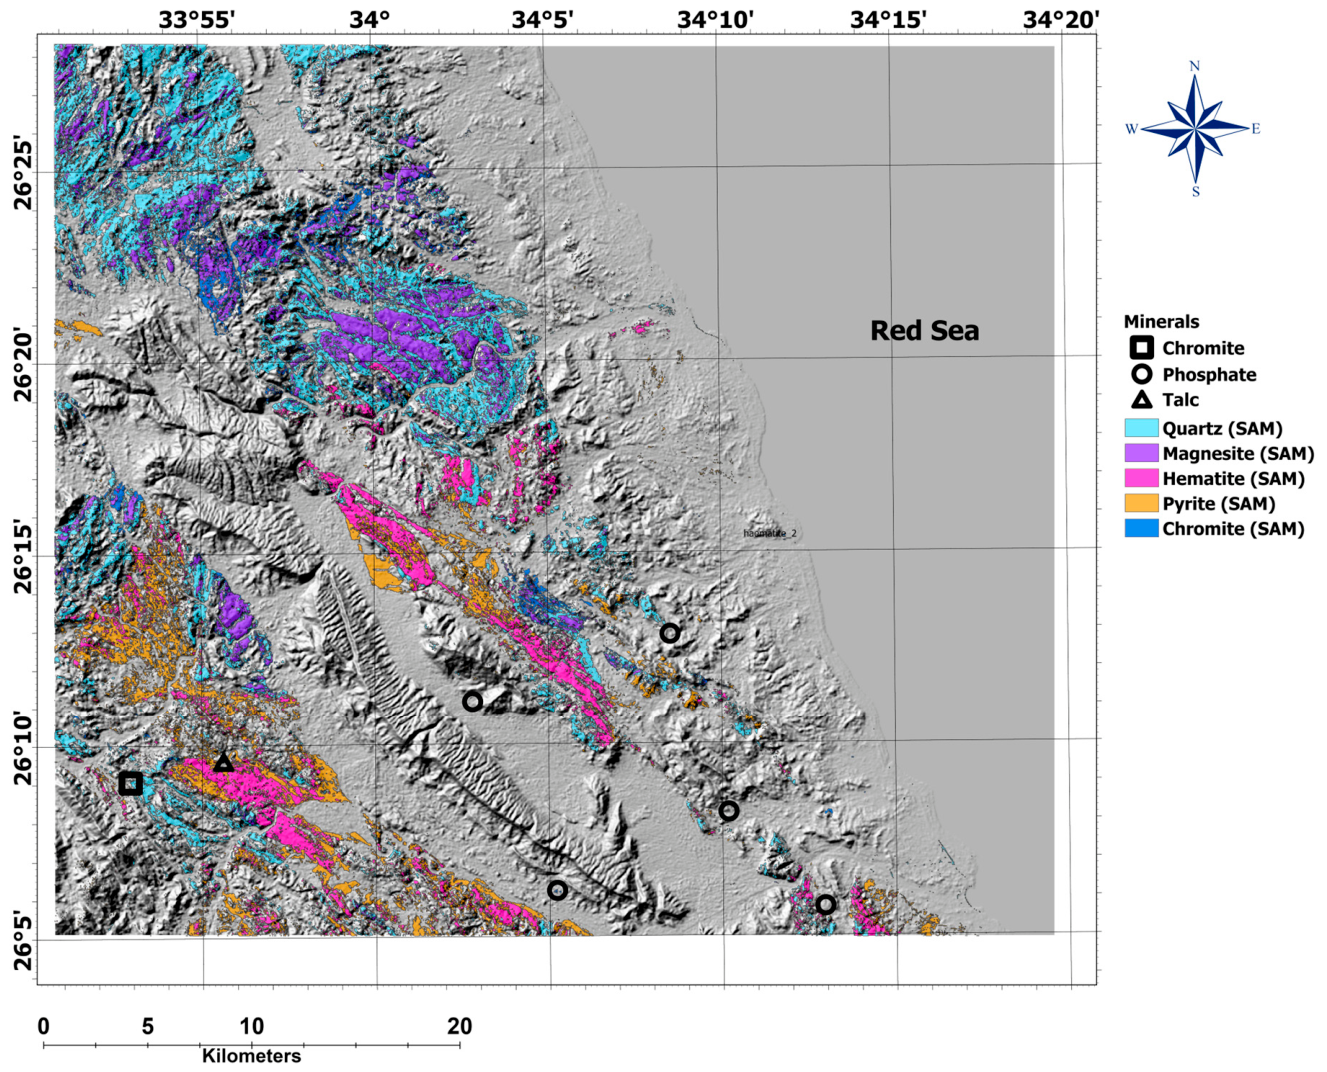
The selected minerals are hematite, magnesite, chromite, pyrite, and quartz. Quartz and magnesite are distributed throughout the area’s igneous and metamorphic rocks. The spectral library of each reference mineral spectra is shown in Figure 15, and the SAM anomalies detected are presented in Figure 16. Hydrothermal metamorphism and alteration of magnesium-rich minerals, such as olivine and pyroxene, can transform into talc at higher temperatures and pressures through chemical reactions involving carbon dioxide and water. Magnesite is a byproduct of this process, which is why it appears near the talc mining process. Chromite also appears in several areas within the study area, and, as shown, there is a chromite mining location in the area.
Figure 15.
The spectrum used for mineral detection using the Spectral Angle Mapper tool from Landsat-9 data; the main elements are hematite, magnesite, chromite, pyrite, and quartz.
Figure 16.
Spectral Angle Mapper results of the selected minerals in the Wadi Queih area.
To avoid over-interpreting surface spectral anomalies, a clear distinction must be made between sensor-derived spectral responses and physically confirmed mineral assemblages. In hyper-arid terrains like Wadi Queih, widespread surface weathering and supergene oxidation can alter primary rock-forming minerals to produce stable ferric iron (Fe3+) oxides (such as hematite and goethite) and clay minerals. These superficial weathering rinds or desert varnishes can yield strong spectral anomalies that mimic hydrothermal alteration. To isolate true, economically significant hydrothermal alteration zones from superficial weathering, this study utilizes a multi-proxy integration workflow. First, we leverage the Crosta H + F composite to identify “white pixels” where hydroxyl-bearing clays and iron oxides directly superimpose—a co-registration diagnostic of phyllic and argillic hydrothermal alteration rather than isolated weathering. Second, we cross-validate these surface spectral anomalies with subsurface structural lineaments derived from aeromagnetic data (TDR and AS); our results show that the prospective alteration anomalies are not blanket-like, but are strictly localized along deep-seated, NW–SE-trending fault conduits. Finally, these zones correlate with elevated radiometric K/eTh ratios, confirming chemical potassium enrichment typical of hypogene hydrothermal systems. This multitier validation ensures that the mapped targets represent genuine hydrothermal alteration zones rather than superficial weathering.
4.2. Magnetic Results
4.2.1. Basement Rock Mapping
The remarkable geological setting of the area requires a thorough study to determine the unique position of the sedimentary rocks within the basement rocks. In this study, magnetic data are analyzed qualitatively using two maps, the analytic signal map and the reduced-to-pole map, to differentiate basement rocks from sedimentary cover. The two maps show comparable high-magnitude anomalies related to the presence of basement rocks in the area, mostly Dokhan volcanics, post-hammamat felsite, younger granites, and older granites, as shown in Figure 17.
Figure 17.
Basement distribution of the Wadi Queih area, in relation to high magnetic anomalies as shown from the RTP (a) and analytic signal (b) maps.
4.2.2. Structural Interpretation of Magnetic Data
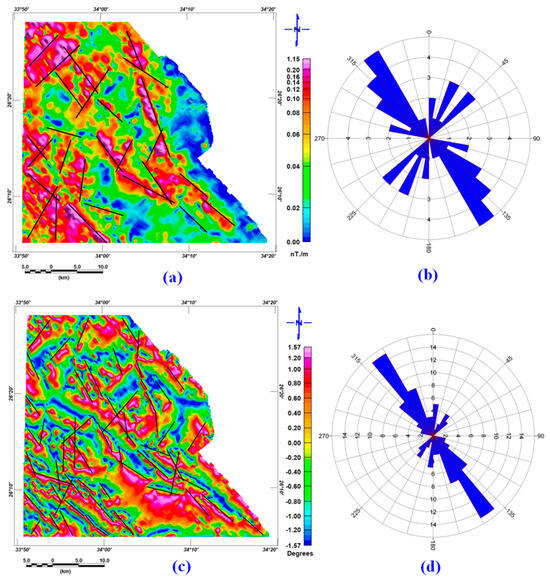
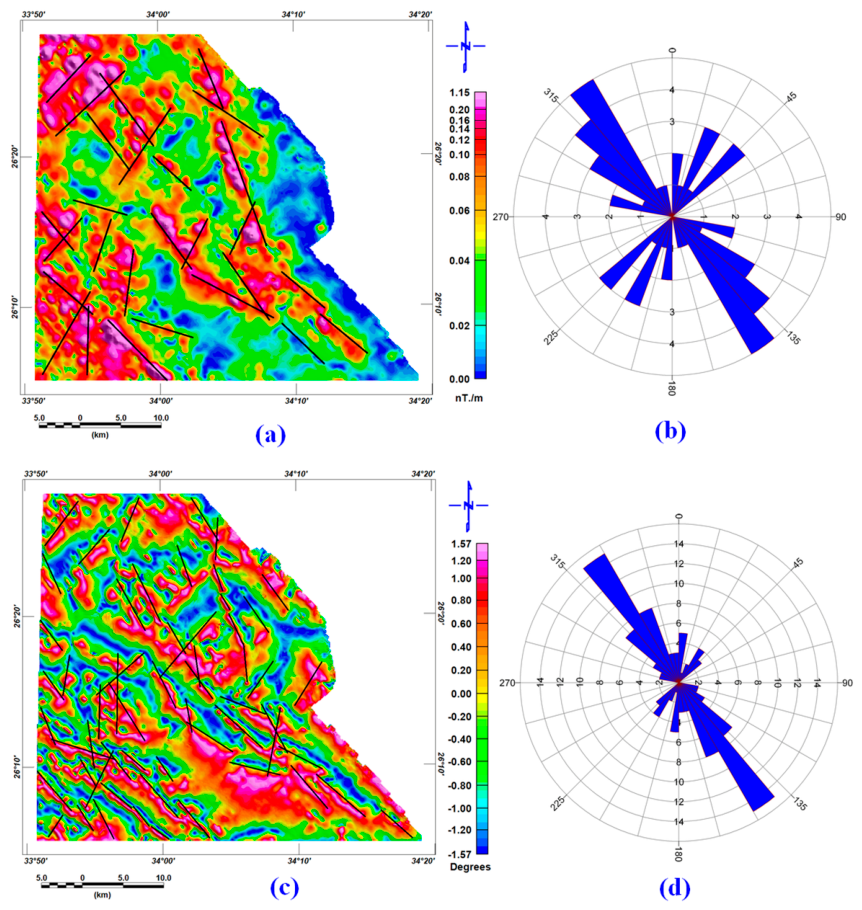
For trend analysis, we constructed tilt derivative and analytical signal maps to detect fault locations and directions, thereby identifying subsurface linear structural features that affect the alteration zones. Figure 18 shows the geological structure deduced from the applied filters, the analytic signal, and the tilt derivative maps. The geological fault direction in Wadi El Nakheel aligns predominantly with the northwest–southeast (NW-SE) trend. Most of the geological features in the area are aligned with this direction. This orientation is influenced by the regional tectonic framework resulting from the Red Sea Rift movement and the Pan-African orogeny. Other minor fault directions include northeast–southwest (NE-SW), east–west (E-W), and north–south (N-S) alignments, contributing to the region’s overall geological complexity. The interpreted structural trends are broadly consistent with those reported by [26].
Figure 18.
Lineament analysis as predicted from (a) the analytic signal map of the Wadi Queih area, (b) the rose diagram of the lineaments interpreted from the analytic signal, (c) the tilt derivative map of Wadi Queih area, and (d) the rose diagram of the lineaments interpreted using the tilt derivative.
4.3. Radiometric Results
A detailed examination of the total count map is shown in Figure 4a, along with its comparison to the geological map shown in Figure 1, which exposes several prominent geological features. These features clearly delineate contacts between basement and sedimentary units. Furthermore, most of the identified basement complex lithologies—including metamorphic rocks, younger granites, Dokhan volcanics, metasediments, acidic and basic metavolcanics, ophiolitic serpentine, talc carbonates, and metagabbro—show strong consistency with the rock units represented on the geological map.
4.3.1. Two-Element Ratio
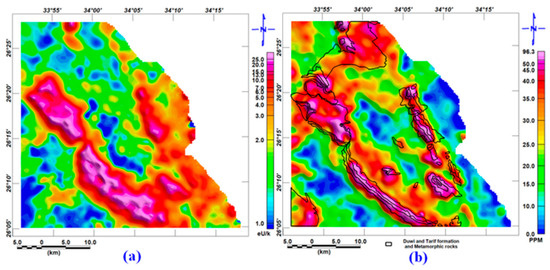
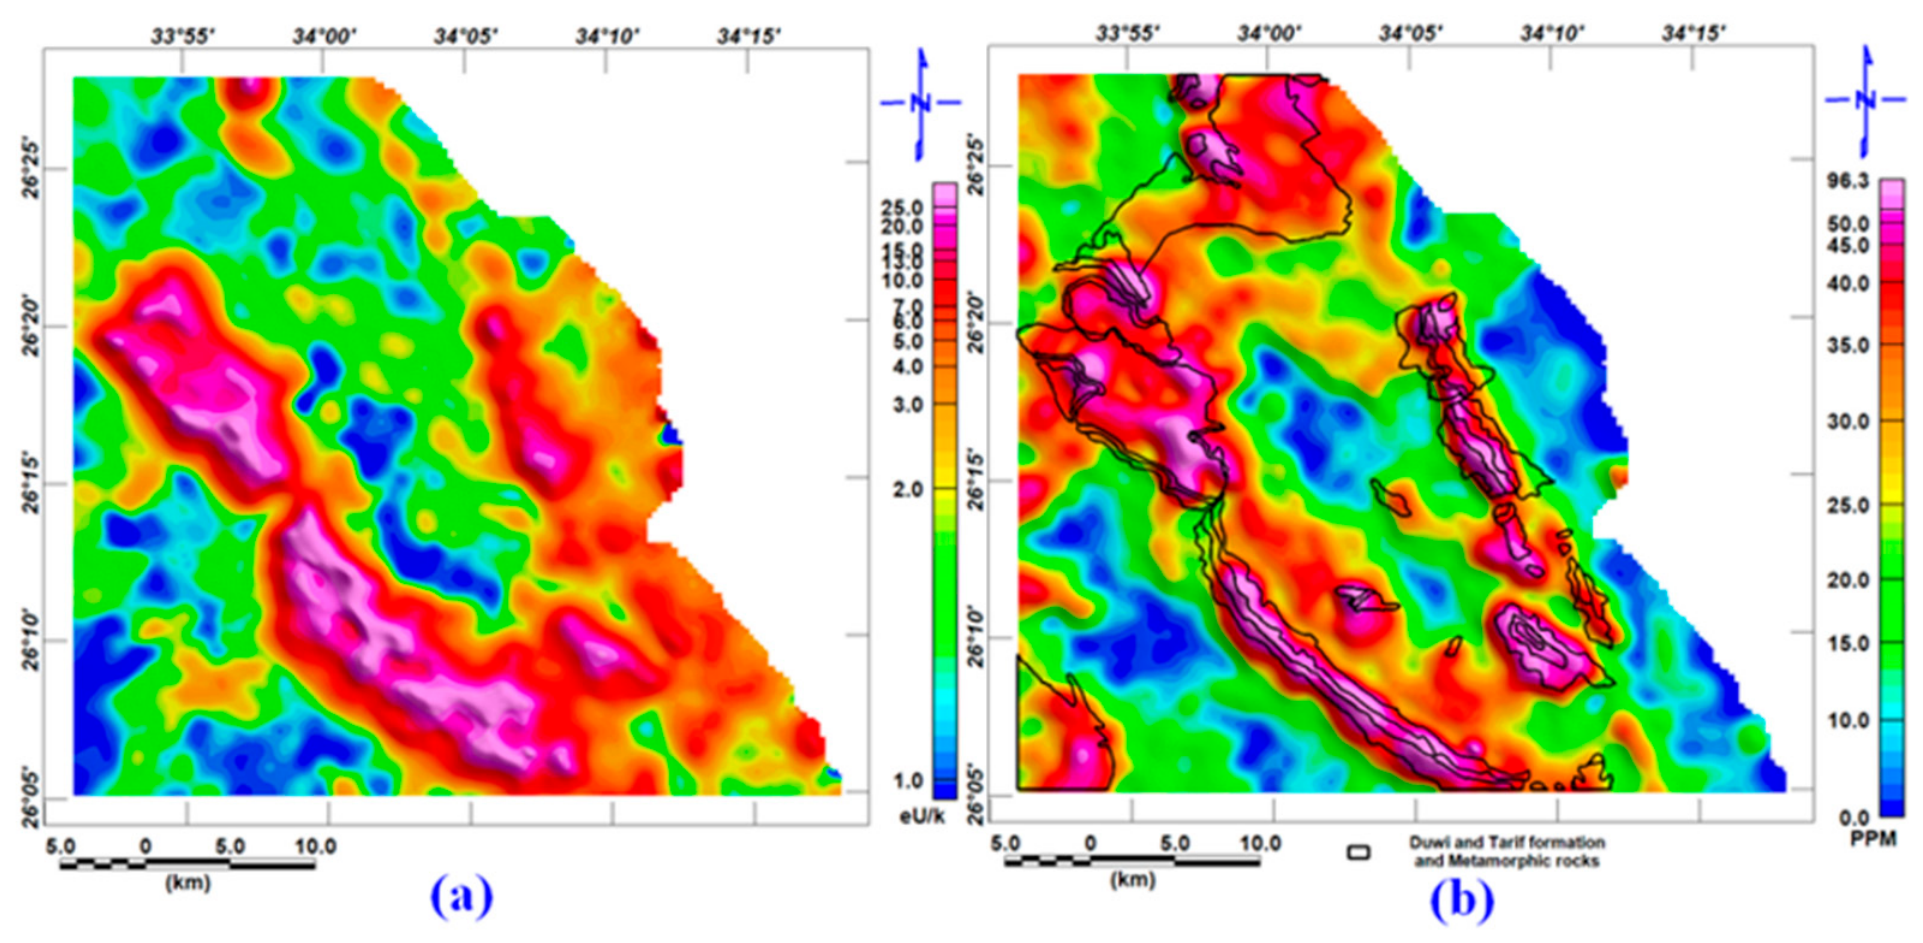
The study area is known to be a source of phosphatic mining from the Duwi Formation, which is characterized by high uranium concentration [48]. The Tarif Formation also shows a high uranium content [49], which is why the uranium indexes are linked to the sedimentary covers. The equivalent uranium–potassium ratio is shown in Figure 19a. In Figure 19b, a polygon encloses the higher-uranium-content rocks.
Figure 19.
(a) Equivalent uranium–potassium ratio highlighting the phosphate-rich sediments, Duwi and Tarif Formations, (b) The equivalent uranium with polygon of the Duwi and Tarif Formations and younger granite.
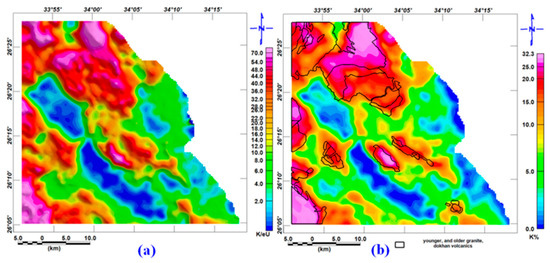
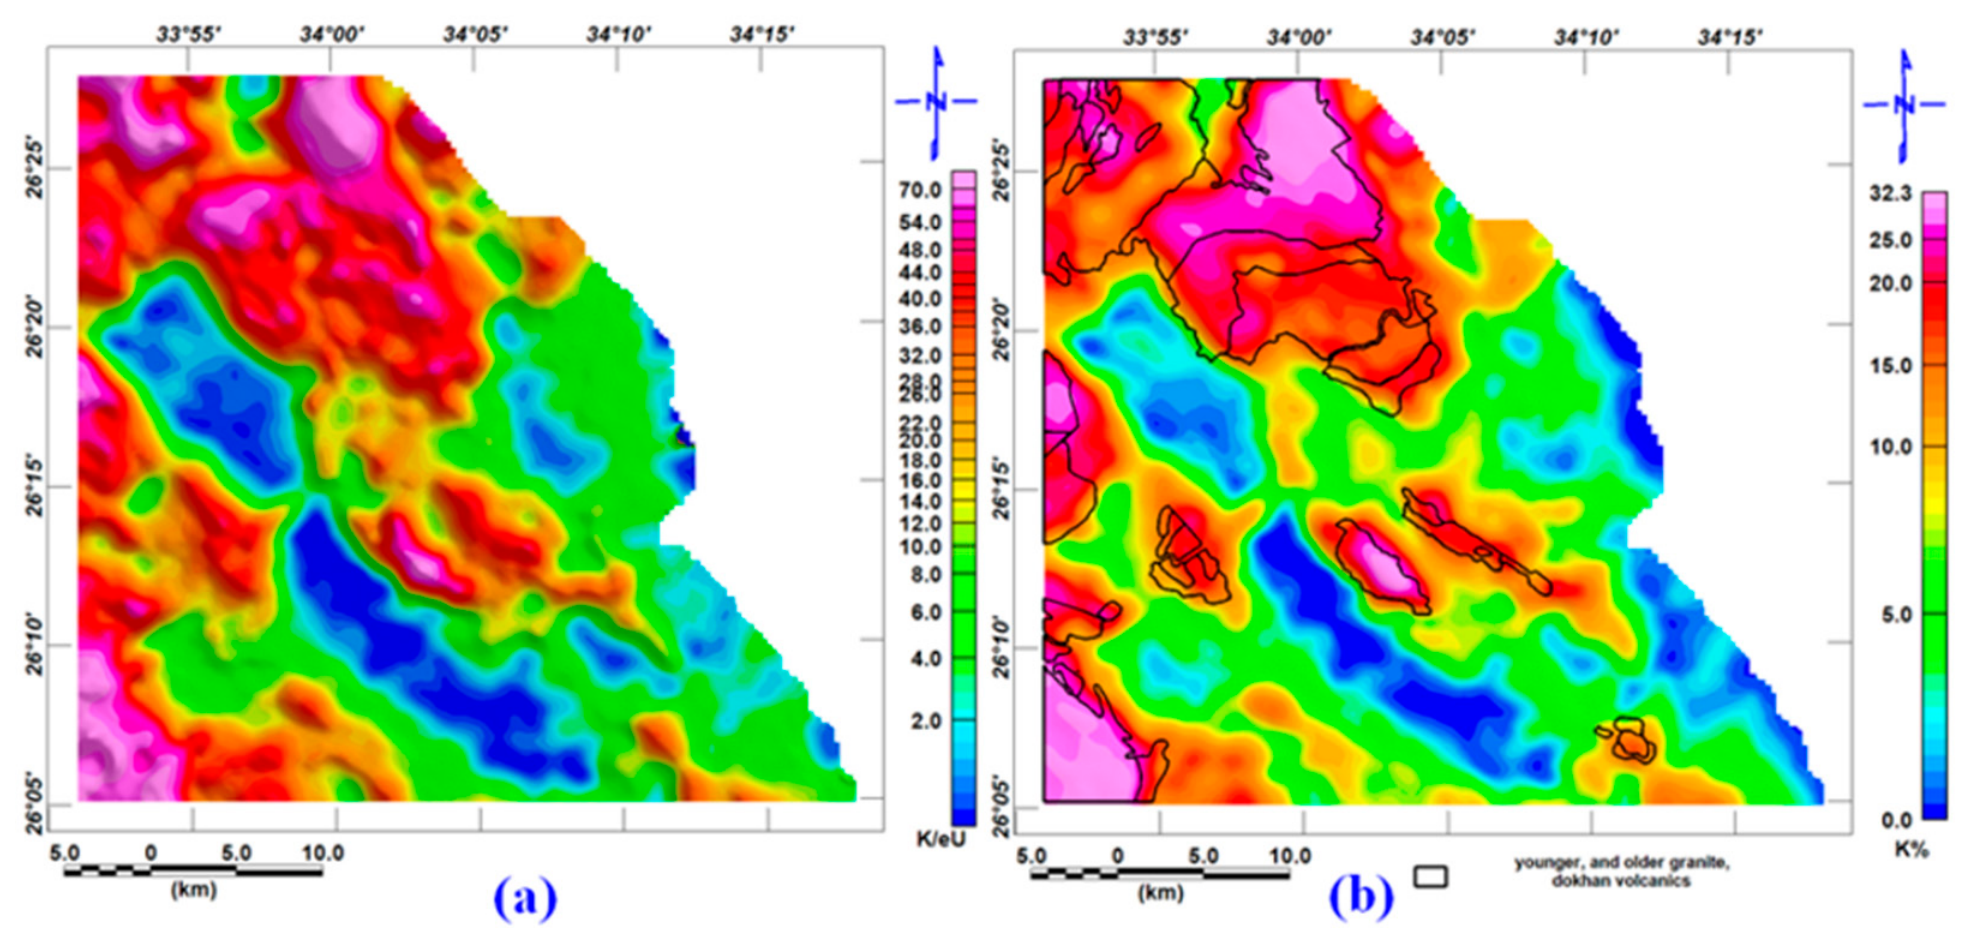
The equivalent potassium/uranium ratio is usually used to Highlights the presence of potassiumfeldspars, which are represented in the younger and older granites, in addition to some metamorphic rocks, also to the Dokhan volcanics, as shown in Figure 20. In Figure 20b, a polygon enclosing the mentioned rock formation in the study area is drawn in blue. We can observe the match between the geological rock formations associated with younger and older granites and post-hammamate felsite.
Figure 20.
(a) Potassium to equivalent uranium ratio map of the Wadi Queih area, highlighting the potassium-rich feldspar in the area; and (b) potassium with polygons of the metamorphic rocks, younger granite, and older granite.
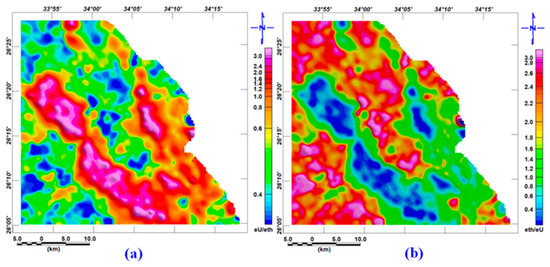
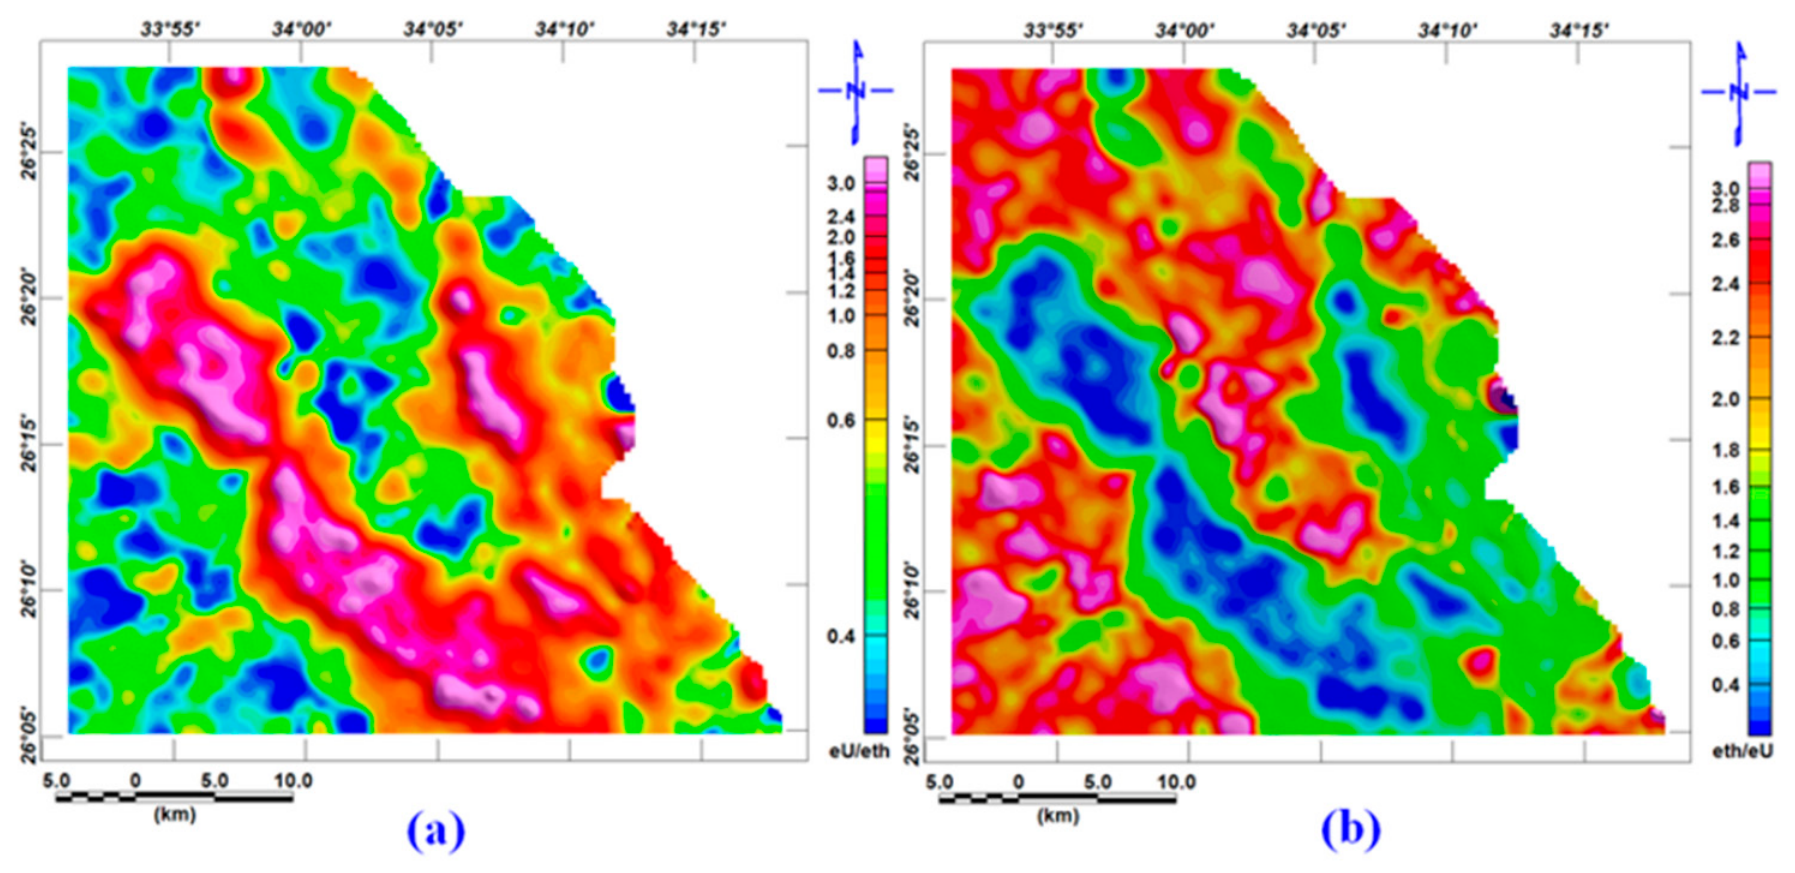
The high uranium/thorium ratio is indicative of relative uranium enrichment or secondary mineralization. At the same time, the low levels may reflect uranium leaching or fresh, unaltered rocks, as shown in Figure 21a. On the other hand, the thorium/uranium ratio is actually similar to the K components and highlights the potassium-rich feldspar and fresh, unaltered rocks as shown in Figure 21b.
Figure 21.
(a) The eU/eTh ratio map of the Wadi Queih area highlighting the uranium-rich rock units in the study area, and (b) the eTh/eU ratio map of the Wadi Queih area highlighting the younger granite, older granite, and metamorphic rocks.
4.3.2. Ternary and Interpreted Lithological Maps
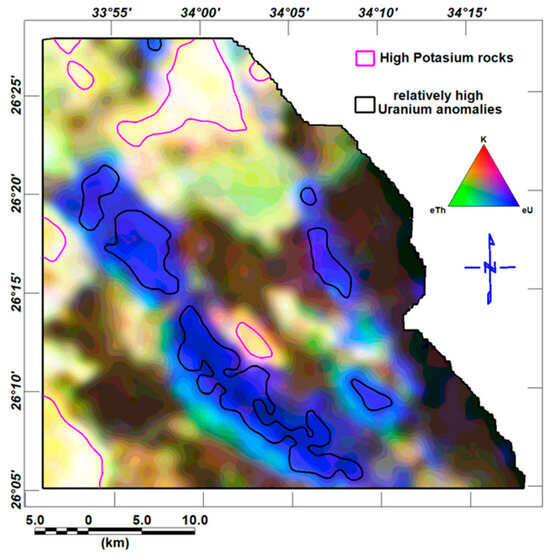
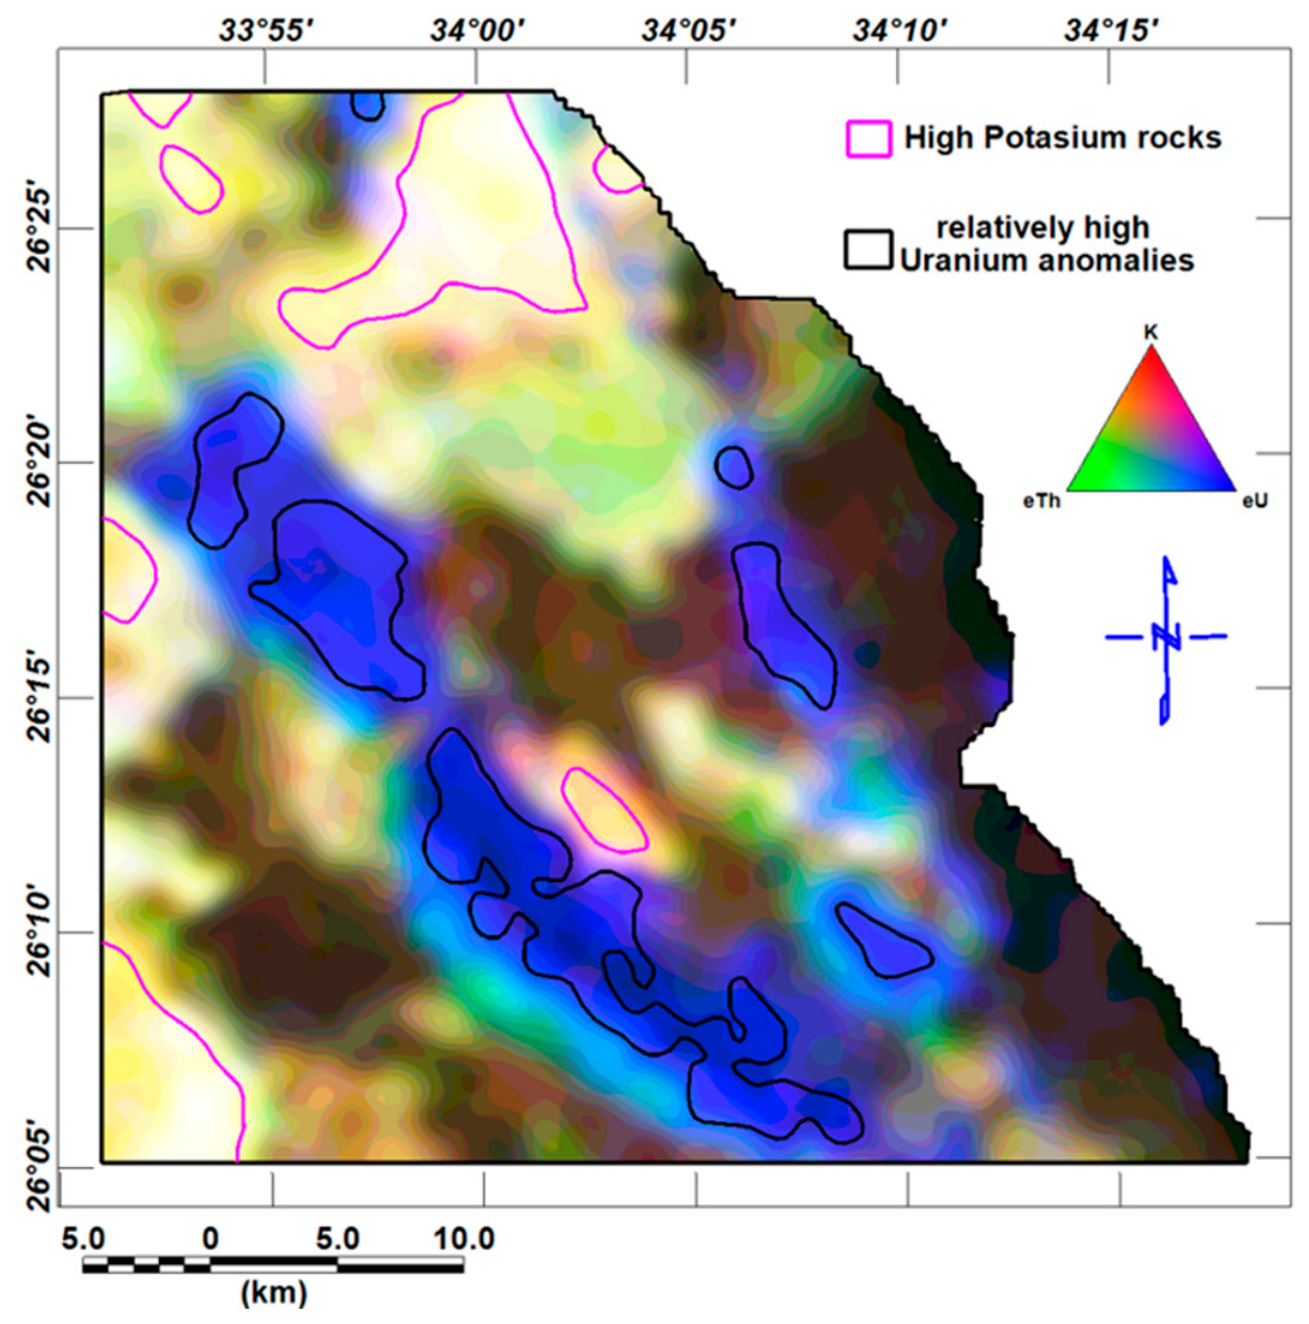
The ternary diagram shown in Figure 22 was constructed by combining the red = K, green = eTh, and blue = eU color channels to represent the relatively high values of thorium, potassium, and uranium, respectively. Typically, thorium is represented in green and uranium in blue, as the blue channel helps to minimize the low signal-to-noise ratio of the uranium data [50]. In this study, however, the resulting composite image provided a more effective visualization. The blue color indicates U-enriched rock units, specifically the Duwi and Tarif Formations. The yellow and reddish shades are associated with potassium feldspar in felsic and metamorphic rocks. They are presented in the area as granites and post-hammamate felsite. A high potassium polygon is magenta and coincides with the feldspar-rich rocks, while the blue polygon represents the relatively high uranium content in the study area.
Figure 22.
The ternary composite map of the Wadi Queih area. It includes the combination of K as red, eTh as green, and eU as blue.
4.4. Economic Significance and Exploration Targeting
The integration of aeromagnetic, airborne gamma-ray spectrometric, and Landsat-9 OLI-2 datasets in the Wadi Queih area provides a highly positive exploration framework. Rather than presenting isolated anomalies, this multi-proxy approach maps active, regional-scale mineralizing systems and delineates high-priority targets by cross-validating surface alteration geochemistry, subsurface structures, and radioactivity. In this Precambrian basement and sedimentary terrain, as showen in Table 6 a three distinct mineralization systems and highly prospective targets have been identified:
Sediment-Hosted Uranium and Phosphate Targets.
The phosphorogenic sedimentary succession of the Upper Cretaceous represents a primary economic exploration target in Wadi Queih.
Prospectivity and Evidence: Airborne radiometric spectrometry reveals highly elevated equivalent uranium (eU) concentrations and strong eU/eTh ratio values within the Duwi and Tarif Formations. In the ternary radioelement composite map (K as red, eTh as green, eU as blue), these formations are clearly defined by distinct blue anomalies, indicating intense, localized uranium enrichment. This radiometric signature correlates with known regional phosphate mining horizons. The elevated eU/eTh ratios also suggest the presence of secondary uranium mineralization or relative uranium concentration rather than simple, unaltered host rocks.
Exploration Target: The strata-bound phosphate beds of the Duwi Formation (which alternate with black shale, marl, and oyster limestone), and the sandstone-dominant Tarif Formation.
Structurally Controlled Hydrothermal Alteration.
The complex tectonic history of the Central Eastern Desert has generated deep-seated pathways for mineral-bearing fluids, with the contacts between the crystalline basement and younger sedimentary units acting as prime structural controls.
- ❖
- Prospectivity and Evidence: Structural analysis of the reduced-to-pole (RTP) aeromagnetic data, enhanced by tilt derivative (TDR) and analytic signal (AS) filters, demonstrates a dominant northwest–southeast (NW–SE) tectonic trend. This structural trend is genetically linked to the regional Red Sea Rift dynamics. Remote sensing alteration mapping reveals that these faults act as critical conduits for hydrothermal fluids.
- ❖
- On Sabin’s band ratio composite (RGB: 4/2, 6/7, 6/5), where iron oxide (red) and hydroxyl-clay (green) signatures overlap, a composite yellow tone highlights linear alteration zones directly tracing these NW–SE rifting trends.
- ❖
- This is further corroborated by the principal component analysis (PCA) Crosta technique. The H + F composite image reveals “white pixels” where intense iron oxide staining (PC4 bright pixels) and hydroxyl-bearing/argillaceous alteration (PC3 dark pixels) directly overlap. These co-registered “white pixel” zones represent the highest exploration potential for structurally controlled vein-type polymetallic mineralization.
- ❖
- Exploration Target: The shear zones and lithological boundaries intersecting the younger granites, post-hammamat felsites, and metasedimentary contacts along the NW–SE structural trends.
Ultramafic-Hosted Talc, Magnesite, and Chromite Deposits.
The extensive Precambrian ophiolitic basement complex in Wadi Queih, specifically the serpentinite and shear belts, hosts high-value industrial and metallic commodities.
- ❖
- Prospectivity and Evidence: Landsat-9 Spectral Angle Mapper (SAM) classification, using laboratory reference spectra, successfully mapped surface mineral assemblages, including magnesite and chromite.
- ❖
- Magnesite anomalies are clustered directly adjacent to active talc mining areas. Geologically, this is explained by the hydrothermal metamorphism and carbonation of magnesium-rich rocks (serpentinites containing olivine and pyroxene), which transforms them into talc and produces magnesite as a direct byproduct.
- ❖
- Furthermore, SAM-derived chromite signatures show a strong correlation with known chromite occurrences and active extraction pits in the study area, identifying key spatial extensions of these podiform deposits.
- ❖
- Exploration Target: The Precambrian serpentinite and ophiolitic metagabbro belts located in the central and eastern portions of the study area.
Table 6.
Exploration targeting and resource synthesis for Wadi Queih
A phased, three-step exploration roadmap is proposed to advance Wadi Queih from regional exploration mapping to direct discovery of deposits:
Phase 1: Field Ground-Truthing and Spectrometry (Short-term): Deploy field crews equipped with portable spectrometers (ASD/XRF) to validate the highly prospective Crosta “white pixels” and SAM magnesite/chromite anomalies. This process will confirm the satellite-derived mineralogy on-site and help screen targets before committing to costly geophysical programs.
Phase 2: High-Resolution Ground Geophysics (Medium-term): Conduct targeted ground magnetic and Induced Polarization (IP) profiling across the major NW–SE trending fault zones where they intersect younger granites and metasedimentary boundaries. This will clarify the vertical geometry, dip, and chargeability/resistivity of potential mineralized structures at depth.
Phase 3: Geochemical Assaying and Exploratory Drilling (Long-term): Implement systematic channel sampling and chemical assays of the phosphate-bearing Duwi Formation to evaluate the economic feasibility of dual-commodity extraction (phosphate and uranium). Perform shallow exploratory core drilling on high-chargeability IP anomalies along NW–SE structural targets.
5. Conclusions
This study successfully integrated aeromagnetic, airborne gamma-ray spectrometric, and Landsat-9 OLI-2 remote sensing datasets to provide a comprehensive, strongly positive exploration framework for the Wadi Queih area. Rather than presenting isolated, disconnected anomalies, the synthesis of these multi-proxy techniques establishes a highly robust model that directly correlates surface alteration geochemistry, subsurface structures, and near-surface radioactivity to delineate distinct ore-hosting environments. Based on this integrated dataset, the study area demonstrates high economic potential for three distinct mineralization systems and specific commodity targets:
- Sediment-Hosted Uranium and Phosphate: The strata-bound phosphorogenic sedimentary sequences of the Duwi and Tarif Formations represent a primary economic exploration target. This is supported by highly elevated equivalent uranium (eU) concentrations, high eU/eTh ratios indicative of secondary uranium enrichment, and distinct blue composite signatures on ternary radiometric maps.
- Structurally Controlled Polymetallic Veins: The structural architecture of Wadi Queih acts as a primary control on hydrothermal mineralization. Subsurface structural lineaments mapped via aeromagnetic tilt derivative (TDR) and analytic signal (AS) filters reveal a dominant northwest–southeast (NW–SE) tectonic trend related to the regional Red Sea Rift. These deep-seated faults served as critical pathways for mineralizing fluids. Their surface expression is marked by intense hydrothermal alteration zones along the contacts between younger granitic suites, post-hammamat felsites, and sedimentary formations. Specifically, localized targets are defined by the yellow composite trends on Sabin’s ratio maps and the high-priority “white pixels” of the Crosta composite map, where hydroxyl-bearing argillaceous alteration (PC3) and iron oxide staining (PC4) directly superimpose.
- Ultramafic-Hosted Industrial and Metallic Minerals: The Precambrian ophiolitic serpentinite belts represent a major host for key industrial and metallic commodities. Landsat-9 Spectral Angle Mapper (SAM) classification successfully mapped surface magnesite anomalies adjacent to active talc mining zones, representing a direct byproduct of the hydrothermal carbonation of magnesium-rich rocks. Additionally, SAM-derived chromite signatures show a strong spatial correlation with known chromite occurrences, effectively delineating prospective extensions of these podiform deposits.
The strength of the evidence presented is extremely high because it represents the systematic, spatial alignment of independent spectral, structural, and radiometric datasets. The convergence of surface alteration mineralogy (Landsat-9) with subsurface fault geometries (aeromagnetic) and radioelement geochemistry (gamma-ray spectrometry) significantly reduces target-definition risk.
To transition the Wadi Queih area from regional exploration mapping to direct deposit discovery, we propose an actionable, three-phase exploration roadmap.
Phase 1 (Short-term Field Ground-Truthing): Deploy field exploration crews equipped with portable spectrometers (ASD/XRF) to ground-truth and sample the highly prospective Crosta “white pixel” alteration zones and the SAM magnesite/chromite anomalies to verify satellite-derived mineralogy on the ground.
Phase 2 (Medium-term Ground Geophysics): Execute targeted ground-based Induced Polarization (IP) and electrical resistivity profiles across the major NW–SE-trending fault zones to define the vertical geometry, dip, and chargeability of potential mineralized structures at depth.
Phase 3 (Long-term Assaying and Drilling): Conduct high-density channel sampling and chemical assays on the Duwi and Tarif phosphate beds to evaluate the economic feasibility of dual-commodity (phosphate and uranium) extraction, followed by exploratory core drilling targeting high-chargeability IP anomalies along the NW–SE structural conduits.
In conclusion, integrating geophysical and remote sensing methods transcends the limitations of individual datasets, moving beyond simple lithological discrimination to establish a predictive, structural–geochemical exploration model. This integrated multidisciplinary approach provides a highly reliable, generalizable framework for mineral exploration in complex Precambrian terrains globally.
Author Contributions
Conceptualization, M.A. and A.S. (Arwa Sameer); methodology, M.A., K.F., and A.S. (Ahmed Saleh); software, M.A. and A.S. (Arwa Sameer); validation, S.A.S.A. and S.H.A.E.N.; formal analysis, S.A.S.A. and A.S. (Ahmed Saleh); investigation, M.A. and A.S. (Arwa Sameer); data curation, M.A. and A.S. (Arwa Sameer); writing—original draft preparation, M.A. and A.S. (Arwa Sameer); writing—review and editing, S.A.S.A., A.S. (Ahmed Saleh), S.H.A.E.N., and K.F.; visualization, M.A. and A.S. (Arwa Sameer); supervision, S.A.S.A., A.S. (Ahmed Saleh), S.H.A.E.N., and K.F. All authors have read and agreed to the published version of the manuscript.
Funding
This work was supported by the Science and Technology Development Fund (STDF), Egypt, under Grant Number: 37233.
Data Availability Statement
The datasets generated and analyzed during the current study are available from the corresponding author upon reasonable request. In addition to open-source data like Landsat-9 data, which is available from http://earthexplorer.usgs.gov/ (accessed on 21 June 2025).
Conflicts of Interest
The authors declare no conflicts of interest.
References
- Kaufman, H. Mineral exploration along the Aqaba-Levant structure by use of TM-data concepts, processing, and results. Int. J. Remote Sens. 1988, 9, 1639–1658. [Google Scholar] [CrossRef] [Scilit]
- Abrams, M.J.; Brown, D.; Lepley, L.; Sadowski, R. Remote Sensing for Porphyry Copper Deposits in Southern Arizona. Econ. Geol. 1983, 78, 591–604. [Google Scholar] [CrossRef] [Scilit]
- Aboelkhair, H.; Hasan, E.; Sehsah, H. Mapping of Structurally Controlled Uranium Mineralization in Kadabora Granite, Central Eastern Desert, Egypt Using Remote Sensing and Gamma Ray Spectrometry Data. Open Geol. J. 2014, 8, 54–68. [Google Scholar] [CrossRef] [Scilit][Green Version]
- Saleh, A.; Abdelmoneim, M.; Abdelrady, M.; Al Deep, M. Subsurface Structural Features of the Basement Complex and Mineralization Zone Investigation in the Barramiya Area, Eastern Desert of Egypt, Using Magnetic and Gravity Data Analysis. Arab. J. Geosci. 2018, 11, 676. [Google Scholar] [CrossRef] [Scilit]
- Alkholy, A.; Saleh, A.; Ghazala, H.; Al Deep, M.; Mekkawi, M. Groundwater exploration using drainage pattern and geophysical data: A case study from Wadi Qena, Egypt. Arab. J. Geosci. 2023, 16, 92. [Google Scholar] [CrossRef] [Scilit]
- Saleh, A.; Gabr, S.S. Application of magnetic data and satellite spectral imaging in identifying gold mineralization zones and its associated subsurface structures at Fawakheir-Attala area, Central Eastern Desert, Egypt. Environ. Earth Sci. 2024, 83, 500. [Google Scholar] [CrossRef] [Scilit]
- Aldeep, M.; Soliman, M.; Mesbah, H.S.A.; Gaweish, W.R.; Ali, A.M.; Meqbel, N.; Zaher, M.A. Magnetic and magnetotelluric data integration to determine the origin of Siwa Oasis Lakes, Western Desert, Egypt. Sci. Rep. 2025, 15, 32697. [Google Scholar] [CrossRef] [Scilit] [PubMed]
- Araffa, S.A.S.; Abdulattif, A.; Al Deep, M.; Khozym, A.; Salama, H.; Gaweish, W.R.; Ebrahim, S. Integrated geophysical and hydrochemical assessment of groundwater aquifers for agricultural development: A case study in the Area South Alamein-Wadi El Natrun Road, Egypt. All. Earth 2025, 37, 1–17. [Google Scholar] [CrossRef] [Scilit]
- Abd-Elsadek, M.K.; Araffa, S.A.S.; Aldeep, M.; Badreldin, H.; Othman, A.A.A.; Mohamed, W.H.; Zaghlol, K. Geological and Geophysical Survey of Mineral Resources with an Emphasis on Gold and Associated Minerals in Atshan area, South Eastern Desert, Egypt. Min. Metall. Explor. 2026, 43, 463–481. [Google Scholar] [CrossRef] [Scilit]
- Cuney, M. The extreme diversity of uranium deposits. Miner. Depos. 2008, 44, 3–9. [Google Scholar] [CrossRef] [Scilit]
- Dickson, B.L.; Scott, K.M. Interpretation of aerial gamma-ray surveys—Adding the geochemical factors. AGSO J. Aust. Geol. Geophys. 1997, 17, 187–200. [Google Scholar]
- Aero-Service. Final Operational Report of Airborne Magnetic/Radiation Survey in the Eastern Desert, Egypt. In For the Egyptian General Petroleum Corporation (EGPC) and the Egyptian Geological Survey and Mining Authority; EGSMA: Cairo, Egypt, 1984. [Google Scholar]
- El Ghrabawy, O.; Ismail, A.; Metwaly, M.; Mostafa, A.M. Interpretation of aero spectrometric, aeromagnetic, and geochemical data, Um-Alhuweitat basin area, Central Eastern Desert, Egypt. Appl. Radiat. Isot. 2021, 170, 109477. [Google Scholar] [CrossRef] [Scilit] [PubMed]
- Gunn, P.J.; Minty, B.R.S.; Milligan, P.R. The airborne gamma-ray spectrometric response over arid Australian terranes. In Proceedings of Exploration; Prospectors and Developers Association of Canada: Toronto, ON, Canada, 1997; pp. 733–740. [Google Scholar]
- El-Sadek, M.A. Radio spectrometric and magnetic signatures of a gold mine in Egypt. J. Appl. Geophys. 2009, 67, 34–43. [Google Scholar] [CrossRef] [Scilit]
- Conoco Inc. Geological Map of Egypt 1:500 000; The Egyptian General Petroleum Corporation: Cairo, Egypt, 1987. [Google Scholar]
- Said, R. The Geology of Egypt; Balkema: Rotterdam, The Netherlands, 1990; p. 734. [Google Scholar]
- El Ramly, M.F. A new geological map for the basement rocks in the Eastern and Southwestern Desert of Egypt, scale 1:1,000,000. Ann. Geol. Surv. Egypt 1972, 2, 11. [Google Scholar]
- Khalil, S.M.; McClay, K.R. Structural control on syn-rift sedimentation, northwestern Red Sea margin, Egypt. Mar. Pet. Geol. 2009, 26, 1018–1034. [Google Scholar] [CrossRef] [Scilit]
- Salman, A.B. Structures and Radioactivity of Some Phosphate Deposits, East Luxor Area, Eastern Desert, Egypt. Ph.D. Thesis, Faculty of Science Ain Shams University, Cairo, Egypt, 1974; p. 322. [Google Scholar]
- Salahel Din, K. Estimation of heat generation by radioactive decay of some phosphate rocks in Egypt. Appl. Radiat. Isot. 2009, 67, 2033–2036. [Google Scholar] [CrossRef] [Scilit] [PubMed]
- EL Qassas, R.A.Y. Application of Airborne Spectral Gamma-Ray Data for Delineating Surface Distribution of Heat Production at Gebel El Bakriyah—Wadi El Batur Area, Central Eastern Desert, Egypt. J. Egypt. Geophys. Soc. 2018, 16, 187–198. [Google Scholar] [CrossRef] [Scilit]
- Abd El-Razik, T.M. Stratigraphy of the Sedimentary Cover of the Anz-Atshan South Duwi District. Bull. Fac. Sci. Cairo Univ. 1967, 431, 135–179. [Google Scholar]
- Issawi, B.; Francis, M.; El-Hinnawi, M.; Mehanna, A. Contribution to the Structure and Phosphate Deposits of Quseir Area. Geol. Surv. Egypt Pap. 1969, 50, 35. [Google Scholar]
- Heath, R.; Vanstone, S.; Swallow, J.; Ayyad, M.; Amin, M.; Huggins, P.; Swift, R.; Warburton, I.; McClay, K.; Younis, A. Renewed exploration in the offshore north Red Sea region, Egypt. In Proceedings of the 14th Petroleum Conference; Egyptian General Petroleum Corporation: Cairo, Egypt, 1998; pp. 16–34. [Google Scholar]
- Montenat, C.; d’Estevou, P.O.; Jarrige, J.J.; Richert, J.P. Rift development in the Gulf of Suez and the north-western Red Sea: Structural aspects and related sedimentary processes. In Sedimentation and Tectonics in Rift Basins Red Sea:- Gulf of Aden; Purser, B.H., Bosence, D.W.J., Eds.; Springer: Dordrecht, The Netherlands, 1998. [Google Scholar] [CrossRef] [Scilit]
- Earth Resources Observation and Science (EROS) Center. Landsat 8-9 Operational Land Imager/Thermal Infrared Sensor Level-1, Collection 2 [Dataset]; U.S. Geological Survey; Earth Resources Observation and Science (EROS) Center: Sioux Falls, SD, USA, 2020. [CrossRef]
- Geosoft Inc. Oasis Montaj (Version 8.4) [Software]. Geosoft Inc., 2015. Available online: https://www.geosoft.com (accessed on 2 September 2026).
- Harris Geospatial Solutions. ENVI, Version 5.3; Harris Geospatial Solutions: Broomfield, CO, USA, 2016. [Google Scholar]
- Inzana, J.; Kusky, T.; Higgs, G.; Trucker, R. Supervised Classifications of Lands at TM Band Ratio Images and Lands at TM Band Ratio Image with Radar for Geological Interpretation of Central Madagscar. J. Afr. Earth Sci. 2003, 7, 59–72. [Google Scholar] [CrossRef] [Scilit]
- Sabins, F.F. Remote sensing for mineral exploration. Ore Geol. Rev. 1999, 14, 157–183. [Google Scholar] [CrossRef] [Scilit]
- Pour, A.B.; Hashim, M. Hydrothermal alteration mapping from Landsat-8 data, Sar Cheshmeh copper mining district, southeastern Islamic Republic of Iran. J. Taibah Univ. Sci. 2015, 9, 155–166. [Google Scholar] [CrossRef] [Scilit]
- Rockwell, B.W.; Hofstra, A.H. Identification of quartz and carbonate minerals across northern Nevada using ASTER thermal infrared emissivity data—Implications for geologic mapping and mineral resource investigations in well-studied and frontier areas. Geosphere 2008, 4, 218. [Google Scholar] [CrossRef] [Scilit]
- Kumar, C.; Shetty, A.; Raval, S.; Champatiray, P.K.; Sharma, R. Sub-pixel mineral mapping using EO-1 Hyperion hyperspectral data. Int. Arch. Photogramm. Remote Sens. Spat. Inf. Sci. 2014, XL-8, 455–461. [Google Scholar] [CrossRef] [Scilit]
- Ali, A.; Pour, A. Lithological mapping and hydrothermal alteration using Landsat 8 data: A case study in ariab mining district, red sea hills, Sudan. Int. J. Basic Appl. Sci. 2014, 3, 199–208. [Google Scholar] [CrossRef] [Scilit]
- Kruse, F.A.; Lefkoff, A.B.; Boardman, J.W.; Heidebrecht, K.B.; Shapiro, A.T.; Barloon, P.J.; Goetz, A.F.H. The spectral image processing system (SIPS)—Interactive visualization and analysis of imaging spectrometer data. Remote Sens. Environ. 1993, 44, 145–163. [Google Scholar] [CrossRef] [Scilit]
- Jolliffe, I.T.; Cadima, J. Principal component analysis: A review and recent developments. Philos. Trans. R. Soc. A 2016, 374, 20150202. [Google Scholar] [CrossRef] [Scilit] [PubMed]
- Loughlin, W.P. Principal Component Analysis for alteration mapping. Photogramm. Eng. Remote Sens. 1991, 57, 1163–1169. [Google Scholar]
- Miller, H.G.; Singh, V. Potential field tilt—A new concept for location of potential field sources. J. Appl. Geophys. 1994, 32, 213–217. [Google Scholar] [CrossRef] [Scilit]
- Verduzco, B.; Fairhead, J.D.; Green, C.M.; MacKenzie, C. New insights into magnetic derivatives for structural mapping. Lead. Edge 2004, 23, 116–119. [Google Scholar] [CrossRef] [Scilit]
- Nabighian, M.N. The analytic signal of two-dimensional magnetic bodies with polygonal cross-section: Its properties and use for automated anomaly interpretation. Geophysics 1972, 37, 507–517. [Google Scholar] [CrossRef] [Scilit]
- Nabighian, M.N. Additional comments on the analytic signal of two-dimensional magnetic bodies with polygonal cross-section. Geophysics 1974, 39, 85–92. [Google Scholar] [CrossRef] [Scilit]
- Roest, W.; Verhoef, J.; Pilkington, M. Magnetic interpretation using 3-D analytic signal. Geophysics 1992, 57, 116–125. [Google Scholar] [CrossRef] [Scilit]
- Ostrovskiy, E.Y. Antagonism of radioactive elements in wallrock alterations fields and its use in aerogamma spectrometric prospecting. Int. Geol. Rev. 1975, 17, 461–468. [Google Scholar] [CrossRef] [Scilit]
- Pour, A.B.; Park, T.-Y.S.; Park, Y.; Hong, J.K.; Zoheir, B.; Pradhan, B.; Ayoobi, I.; Hashim, M. Application of Multi-Sensor Satellite Data for Exploration of Zn–Pb Sulfide Mineralization in the Franklinian Basin, North Greenland. Remote Sens. 2018, 10, 1186. [Google Scholar] [CrossRef] [Scilit]
- Pour, A.B.; Park, Y.; Park, T.-Y.S.; Hong, J.K.; Hashim, M.; Woo, J.; Ayoobi, I. Regional geology mapping using satellite-based remote sensing approach in Northern Victoria Land, Antarctica. Polar Sci. 2018, 16, 23–46. [Google Scholar] [CrossRef] [Scilit]
- Crósta, A.; Moore, J.M. Enhancement of Landsat Thematic Mapper imagery for residual soil mapping in SW Minais Gerais State, Brazil: A prospecting case history in Greenstone belt terrain. In Proceedings of the 7th (ERIM) Thematic Conference: Remote Sensing for Exploration Geology, Calgary, AB, Canada, 2–6 October 1989; pp. 1173–1187. [Google Scholar]
- Abou El-Anwar, E.A.; Mekky, H.S.; Abd El Rahim, S.H.; Aita, S.K. Mineralogical, geochemical characteristics and origin of Late Cretaceous phosphorite in Duwi Formation (Geble Duwi Mine), Red Sea region, Egypt. Egypt. J. Pet. 2017, 26, 157–169. [Google Scholar] [CrossRef] [Scilit]
- Hegab, M.A.E.R. A multidisciplinary approach for uranium exploration using remote sensing and airborne gamma-ray spectrometry data in the Gebel Duwi area, Central Eastern Desert, Egypt. Sci. Rep. 2024, 14, 19739. [Google Scholar] [CrossRef] [Scilit] [PubMed]
- Milligan, P.R.; Gunn, P.J. Enhancement and Presentation of Airborne Geophysical. AGSO J. Aust. Geol. Geophys. 1997, 17, 64–74. [Google Scholar]

Disclaimer/Publisher’s Note: The statements, opinions and data contained in all publications are solely those of the individual author(s) and contributor(s) and not of MDPI and/or the editor(s). MDPI and/or the editor(s) disclaim responsibility for any injury to people or property resulting from any ideas, methods, instructions or products referred to in the content. |
© 2026 by the authors. Licensee MDPI, Basel, Switzerland. This article is an open access article distributed under the terms and conditions of the Creative Commons Attribution (CC BY) license.