


Abstract
Sustainable pavement maintenance increasingly requires coordinated management of infrastructure condition, renewable-energy availability, carbon emissions, financial resources, and operational capacity. This study proposes a renewable-energy resource management framework for low-carbon network-level pavement maintenance using simulation-based pavement-energy modeling and multi-agent deep reinforcement learning. The proposed framework develops an AnyLogic-based pavement-energy simulation environment in which road sections, deterioration states, work zones, maintenance crews, equipment resources, photovoltaic generation, battery storage, grid support, diesel backup, carbon tracking, and budget consumption are represented within one integrated decision environment. To support adaptive maintenance control, pavement sections are modeled as interacting agents, while road connectivity, dispatch dependency, traffic interaction, and maintenance-route relationships are encoded through graph structures. A graph-based multi-agent deep reinforcement learning model, named Graph-MAPPO, is then used as the decision controller. The model integrates multi-head graph attention for spatial dependency learning, GRU-based temporal memory for deterioration-history representation, finite-element-assisted structural-risk indicators for hidden damage characterization, and constraint-aware action masking to prevent infeasible decisions under budget, carbon, energy, crew, and equipment constraints. Two calibrated datasets were generated to support the framework: a pavement network and maintenance dataset containing 4437 records and 55 features, and a renewable energy-carbon-budget dataset containing 9875 records and 38 features. The decision controller jointly selects the pavement section, treatment type, intervention timing, crew, equipment, and energy mode. Results from 20 experimental configurations show that the balanced Graph-MAPPO policy improves average from 69.4 to 78.9, achieves an gain of 6.8 years, reduces emissions to 58.3 tCO2e, maintains a renewable-energy share of 74.6%, and limits the constraint-violation rate to 1.8%. Under high renewable-energy availability, the framework achieves the best overall performance, with an average of 80.2, renewable-energy share of 84.6%, emissions of 50.8 tCO2e, and reward of 0.90. These findings demonstrate that integrating pavement-energy simulation, renewable-energy resource allocation, carbon-aware maintenance planning, structural-risk awareness, and multi-agent decision control can support more adaptive, low-carbon, and resource-efficient pavement maintenance management.
1. Introduction
Road pavement networks are among the most critical components of transportation infrastructure, supporting mobility, freight movement, emergency response, and economic activity. However, pavement assets continuously deteriorate under the combined effects of traffic loading, heavy-vehicle repetitions, environmental exposure, moisture variation, aging, and insufficient maintenance resources. From a resource-management perspective, pavement maintenance is not only a technical intervention problem, but also a resource allocation problem in which limited financial budgets, construction materials, maintenance crews, equipment capacity, energy supply, and carbon-emission allowances must be coordinated to preserve infrastructure serviceability. Conventional pavement maintenance planning is commonly based on condition indices, fixed trigger thresholds, and agency budget limits [1]. Although these approaches are practical, they often treat pavement sections as isolated assets and do not fully capture network dependency, structural vulnerability, maintenance-resource availability, work-zone constraints, or sustainability requirements [2]. As transportation agencies move toward resilient and low-carbon infrastructure management, pavement maintenance decisions must evolve from simple condition-based scheduling to intelligent, multi-objective, and constraint-aware decision-making [3,4].
Recent advances in artificial intelligence, simulation modeling, and digital infrastructure management provide new opportunities for improving pavement maintenance planning [5]. Machine learning and reinforcement learning methods can learn complex relationships among pavement condition, traffic demand, deterioration history, maintenance cost, and treatment effectiveness [6]. Many existing AI-based pavement maintenance models focus mainly on predicting deterioration or selecting treatment types, while giving limited attention to operational execution constraints such as crew availability, equipment assignment, work-zone delay, budget consumption, and energy-source feasibility [7]. Moreover, sustainability dimensions are often considered after the maintenance decision has already been made, rather than being embedded directly into the decision process. As a result, the management of renewable-energy availability, grid and diesel backup, battery storage, material consumption, budget use, and carbon-emission limits is rarely treated as a central resource-planning problem within pavement maintenance decision-making. This creates a methodological gap between pavement-condition optimization and real-world sustainable maintenance execution [8]. Therefore, there is a need for pavement maintenance frameworks that explicitly evaluate not only which section should be maintained, but also whether the required energy, material, financial, labor, equipment, and carbon resources are available and efficiently used.
To address this limitation, this study proposes a novel simulation-based renewable-energy-aware network-level pavement maintenance framework using multi-agent deep reinforcement learning. The proposed framework is positioned as a resource-management framework for low-carbon pavement maintenance, where renewable-energy resources, battery capacity, grid support, diesel backup, maintenance materials, crew/equipment availability, budget capacity, and carbon limits are jointly represented as decision-constraining resources. The framework integrates an AnyLogic maintenance-energy simulation environment with a graph-based multi-agent proximal policy optimization model, referred to as Graph-MAPPO. In the proposed framework, pavement sections are modeled as interacting agents rather than independent segments, and their spatial relationships are represented through a graph structure containing node features, adjacency relationships, and edge-level operational dependencies. The decision model incorporates multi-head graph attention to learn network-level spatial interactions, a GRU temporal encoder to capture deterioration history and delayed treatment effects, finite-element-assisted structural-risk indicators to represent hidden pavement weakness [9], and a constraint-aware action mask to prevent infeasible decisions. The policy jointly selects the pavement section, maintenance treatment, intervention timing, crew, equipment, and energy-source mode under budget, carbon, renewable-energy, and resource constraints. The proposed model does not simply optimize pavement condition; it determines how maintenance resources should be allocated over time to maximize pavement performance while minimizing energy waste, carbon burden, resource conflicts, and infeasible operational decisions.
The novelty of this work lies in treating pavement maintenance not only as a treatment-selection problem, but as a coupled pavement-energy-carbon-resource decision process. The proposed simulation environment includes pavement condition states, work zones, material depots, maintenance crews, equipment movement, renewable-energy hubs, battery storage, grid support, diesel backup, carbon tracking, and budget management. In this context, energy, carbon capacity, budget, materials, crews, equipment, and remaining pavement service life are treated as interacting resources that must be managed simultaneously. This allows the reinforcement learning policy to evaluate whether a maintenance action is technically beneficial, financially possible, environmentally acceptable, energy-feasible, and operationally executable. By combining simulation-generated datasets, finite-element-informed structural indicators, graph-based learning, temporal deterioration memory, and renewable-energy-aware decision control, the framework provides a comprehensive platform for evaluating sustainable pavement maintenance strategies under realistic constraints. This resource-oriented framing directly supports the development of more efficient infrastructure management systems in which renewable-energy use, carbon reduction, and maintenance-resource efficiency are embedded into the core decision process rather than treated as secondary evaluation indicators.
The main contributions of this study are summarized as follows:
- A renewable-energy-aware AnyLogic simulation framework is developed to integrate pavement deterioration, work-zone execution, material resources, crews, equipment, PV/battery/grid/diesel energy, carbon tracking, and budget control. This frames pavement maintenance as an integrated resource-management problem.
- A Graph-MAPPO decision model is proposed to select section, treatment, timing, crew, equipment, and energy mode using graph attention, GRU memory, FE-assisted risk inputs, and constraint-aware masking. The model prevents decisions that exceed budget, energy, crew/equipment, or carbon limits.
- A comprehensive evaluation is conducted using two generated datasets, 20 experimental configurations, and indicators covering , , cost, CO2, renewable-energy share, treatment distribution, and violation rate. The evaluation measures both pavement performance and resource-efficiency outcomes.
Figure 1 demonstrates the conceptual background of the proposed renewable-energy-aware pavement maintenance framework and highlights the engineering motivation for developing a network-level resource-management approach. The figure emphasizes that sustainable pavement maintenance requires the coordinated management of several resource categories, including pavement-service life, maintenance materials, crew and equipment capacity, renewable-energy supply, grid and diesel backup, battery storage, financial budget, and carbon-emission allowance. The left part of the figure depicts the first stage of pavement-condition assessment, where heterogeneous pavement sections have different deterioration levels, such as with = 91 and = 12 years, with = 68 and = 5 years, and with = 48 and = 2 years. This difference shows why fixed threshold-based maintenance is not adequate, since pavement areas differ not only in apparent surface condition, but also in traffic loading, remaining service life, expected maintenance needs, and hidden structural susceptibility. This condition assessment is extended by the lower-left inset that introduces FE-assisted structural-risk indicators, such as pavement-layer response, deflection, strain, and risk level, demonstrating that internal structural weakness can support more reliable maintenance prioritization.
Figure 1.
Conceptual Motivation of the Proposed Renewable-Energy-Aware AI-Based Pavement Maintenance Framework.
The middle portion of the figure represents active maintenance implementation, including crack sealing, microsurfacing, thin overlay, inspection/assessment, lane closure, cones, crews, pavers, rollers, support vehicles, material storage, crew base, and equipment dispatch. This part illustrates that maintenance decisions consume physical and operational resources, and therefore the selected intervention must be evaluated according to the availability of materials, crews, equipment, work-zone capacity, and dispatch feasibility. The renewable-energy support system, comprising PV generation, battery storage, grid connection, diesel backup, and an energy control panel, supplies the maintenance operations shown in the right and lower-right parts of the figure. The reported operating values, including 145 kWh/day PV output, 64% battery SOC, 31 kWh grid draw, diesel standby mode, and 71% renewable-energy share, show how energy-resource availability directly affects the maintenance decision. Thus, renewable energy is treated as an operational resource whose availability can influence maintenance timing, treatment feasibility, carbon emissions, and dependence on conventional energy sources. Lastly, the outcome section portrays improved pavement states, including with = 78 and with = 82, along with desired outcomes such as higher , longer , lower CO2 emissions, improved renewable-energy use, feasible resource allocation, and reduced constraint violations. The figure reinforces the central resource perspective of the study by showing how pavement condition, energy supply, carbon limits, budget, materials, crews, equipment, and service-life gains are jointly managed within one decision-support framework.
2. Literature Review
Yao et al. [2] proposed a multi-agent reinforcement learning model for maintenance optimization of interdependent highway pavement networks. Their study addressed the limitation of treating pavement segments as isolated assets by considering how maintenance decisions on one segment can affect traffic redistribution, pavement usage, and deterioration in other segments. Methodologically, they combined simultaneous network optimization with a multi-agent reinforcement learning algorithm and tested it on a real-world highway pavement network. Their results showed a reduction in total costs and up to improvement in average pavement performance compared with a two-stage bottom-up model. However, their framework did not explicitly incorporate renewable-energy availability, carbon limits, battery/grid/diesel energy modes, or crew/equipment feasibility. The present study addresses this gap by extending network-level multi-agent pavement maintenance into a renewable-energy-aware Graph-MAPPO framework that jointly selects section, treatment, timing, crew, equipment, and energy mode under budget, carbon, and energy constraints.
Kazemeini and Swei [6] investigated environmentally sustainable pavement management strategies using deep reinforcement learning. Their study focused on balancing pavement performance with environmental impacts, particularly global warming potential, through an adaptive learning framework. The authors formulated pavement management as a reinforcement learning problem and applied a proximal policy optimization-based model to learn maintenance strategies from pavement states and environmental feedback. Their results showed that DRL could identify policies capable of reducing environmental impact by approximately compared with traditional strategies. Nevertheless, the model mainly focused on environmental sustainability at the strategy level and did not represent maintenance execution through a simulation environment involving work zones, crews, equipment, renewable-energy supply, battery storage, or operational feasibility. The present study addresses this limitation by coupling reinforcement learning with an AnyLogic maintenance-energy simulation environment and embedding renewable-energy utilization, carbon emissions, budget availability, and constraint masking directly into the decision process.
Chong et al. [3] created a multi-objective optimization framework to make sustainable decisions regarding pavement maintenance through the integration of pavement image segmentation, and TOPSIS methods. They evaluated their study to transform the pavement distress recognition into their practical maintenance choices by evaluating the dimensions of distress, the cost, the carbon emission, and the maintaining options. As a methodology, they employed a U-Net segmentation model as a way of identifying pavement distress dimensions and an enhanced entropy-weighted TOPSIS as the model of ranking maintenance options. Their findings revealed that they had on average a distress-recognition accuracy of 96.88%, an optimal maintenance strategy score of 99.16, a 30.80 percent reduction in carbon emissions, and a 20.81 percent reduction in cost. The framework, however, was a fixed ranking strategy but not a sequential learning policy that is dynamically changing. It did not simulate deterioration memory over long periods, over time interdependence at the network level, renewable-energy state scheduling or resource constraints on operations. The present work fills this gap by applying graph-mapppo to learn time varying maintenance-policy over time and integrating the pavement-condition, carbon, budget, the availability of renewable-energy, assigning the crew/equipment and control constraint-aware feasibility.
Xu et al. [1] proposed a sustainable pavement maintenance and rehabilitation planning approach based on a quantum cognitive trust network. Their study addressed the problem of subjectivity and uncertainty in expert-based pavement maintenance decisions. The objective was to improve the reliability of group decision-making by modeling trust relationships, cognitive uncertainty, belief bias, sequential effects, and interference effects among experts. Methodologically, they developed a probabilistic linguistic multi-attribute decision-making model based on quantum cognitive theory and applied it to practical road-segment case studies. Their results showed that the proposed method could support sustainable maintenance strategy selection and that sensitivity analysis confirmed the stability of the decision model. However, the approach remained primarily an expert-based multi-attribute decision framework and did not learn from simulation feedback, dynamic deterioration, energy availability, or operational constraints. The present study addresses this gap by replacing static expert-based strategy selection with a simulation-driven multi-agent reinforcement learning policy that optimizes pavement, cost, carbon, renewable-energy, and resource-feasibility objectives simultaneously.
Zhou and Al-Qadi [9] proposed a graph neural network simulator for flexible pavement structural responses using three-dimensional finite-element analysis data. Their study addressed the high computational cost of accurate 3D finite-element pavement response simulations under tire loading. The objective was to develop a faster surrogate model that could approximate structural responses while preserving spatial relationships within FE meshes. Methodologically, FE mesh nodes were represented as graph nodes and mesh connections as graph edges, and a GNN was trained using 240 three-dimensional flexible pavement FE simulations. Their results showed that the GNN could provide accurate one-step and rollout predictions, reducing prediction time to about 5 min for a single case after training, compared with much longer traditional FE analyses. However, the study focused on structural-response simulation rather than maintenance decision-making, energy-aware scheduling, or carbon/budget feasibility. The present study addresses this gap by using FE-derived structural indicators as decision-state variables within a Graph-MAPPO maintenance framework, allowing hidden structural risk to influence treatment prioritization, timing, and feasibility-aware execution.
Li et al. [4] developed a smart and sustainable road construction and maintenance framework through life-cycle optimization of concrete pavements. Their study addressed the need to integrate structural performance, life-cycle greenhouse-gas emissions, agency costs, and sustainability objectives in pavement planning. Methodologically, they proposed a weighted multi-objective optimization framework combining mechanistic-empirical modeling, life-cycle assessment, life-cycle cost analysis, and AI-driven optimization. Their case studies showed that optimized jointed plain concrete pavement could reduce life-cycle greenhouse-gas emissions by up to , while the environmental benefit horizon relative to a hot-mix asphalt baseline could be reduced from 37 to 22 years. However, their framework mainly operated at the design and life-cycle planning level and did not explicitly model real-time maintenance execution, renewable-energy supply, battery/grid/diesel energy allocation, crew/equipment constraints, or multi-agent network-level maintenance actions. The present study addresses this gap by embedding carbon and budget objectives into an operational AnyLogic-Graph-MAPPO framework that evaluates maintenance feasibility, renewable-energy utilization, and pavement performance during network-level execution.
Topu et al. [5] proposed a digital-twin-driven pavement health monitoring and maintenance optimization framework using graph neural networks. Their study addressed the limitations of reactive pavement management systems by incorporating spatial dependencies, environmental variability, and nonlinear deterioration behavior. Methodologically, pavement segments and their spatial relationships were modeled as graph nodes and edges, while real-time data streams from UAVs, sensors, and LiDAR were integrated into a digital twin. An inductive GNN was then used to forecast pavement distress and support proactive maintenance planning. Their model achieved an value of , outperforming baseline regressors, and the study also introduced an interactive dashboard and reinforcement learning module for adaptive maintenance planning. However, the work remained primarily focused on monitoring and distress forecasting, and its reinforcement learning component was not formulated as a full renewable-energy-aware, carbon-constrained, resource-constrained multi-agent maintenance policy. The present study addresses this gap by developing a Graph-MAPPO framework that integrates graph attention, temporal memory, FE-assisted structural risk, renewable-energy scheduling, carbon tracking, budget constraints, and crew/equipment feasibility within a unified simulation-based pavement maintenance environment.
Torres-Machi et al. [10] developed a sustainable optimization approach for pavement maintenance programs under budgetary restrictions. Their study provided an important overview of how pavement maintenance planning can be treated as a resource-allocation problem in which technical pavement performance, financial limitations, and environmental impacts must be considered simultaneously. The main objective of their study was to address the research problem that conventional pavement maintenance programs often rely mainly on technical and economic criteria, while environmental impacts and the optimal use of limited maintenance funds are not sufficiently integrated into the decision process. Methodologically, they formulated an optimization tool for designing sustainable maintenance programs under a given maintenance budget, with the aim of maximizing long-term pavement-network effectiveness while minimizing greenhouse-gas emissions generated by maintenance treatments. Their case-study results showed that the proposed tool could increase the average pavement-network condition by up to and reduce greenhouse-gas emissions by compared with a traditional maintenance policy. However, their work mainly focused on budget-constrained maintenance optimization and greenhouse-gas reduction, without explicitly modeling renewable-energy availability, battery storage, grid and diesel energy modes, crew/equipment feasibility, material-resource availability, or adaptive multi-agent decision control. The present study addresses this gap by extending sustainable pavement maintenance planning into a renewable-energy-aware, carbon-constrained, and resource-feasible AnyLogic–Graph-MAPPO framework that jointly considers pavement condition, budget, carbon, energy source, crew, equipment, and operational feasibility.
Yu et al. [11] conducted a comparative carbon-emission assessment of asphalt pavement maintenance methods, with particular attention to the resource and energy consumption associated with maintenance activities. Their study provided an overview of how different pavement maintenance strategies contribute to carbon emissions through raw material production, transportation, and construction processes. The main objective of their study was to address the research problem that comprehensive carbon-emission assessments for pavement maintenance remain limited, even though maintenance activities can generate substantial emissions due to high material demand and energy use. Methodologically, they developed a life-cycle-assessment-based carbon-emission model and applied it to compare five common asphalt pavement maintenance methods across the phases of raw material production, transportation, and construction. Their results showed that asphalt production is a major emission source during the raw-material production phase, aggregate transportation is a dominant contributor during the transportation phase, and mixing/heating processes are major contributors during the construction phase; they also showed that maintenance methods using recycled materials can reduce emissions by lowering virgin material demand. However, their study mainly provided a comparative carbon-accounting assessment of maintenance methods rather than a dynamic decision framework that jointly optimizes pavement condition, renewable-energy use, battery/grid/diesel allocation, carbon allowance, budget availability, crew assignment, equipment use, and operational feasibility. The present study addresses this gap by embedding carbon and energy-resource considerations directly into a simulation-based multi-agent maintenance policy, allowing maintenance decisions to be evaluated according to pavement performance, renewable-energy availability, carbon impact, financial resources, and operational-resource feasibility. Table 1 illustrate the comparative with related works.
Table 1.
Comparative positioning of related pavement maintenance studies from a resource-management perspective.
3. Methodology
The proposed AnyLogic simulation represents a network-level pavement maintenance environment in which each road segment is modeled as a pavement section agent with its own condition state, maintenance priority, and remaining service life. As shown in Figure 2, the road network contains several pavement sections with different deterioration levels, including with PCI , with PCI and RSL years, with PCI and RSL years, with PCI, another section with PCI and RSL years, with PCI and RSL years, with PCI and RSL years, and with PCI and RSL years. The color-coded road links indicate the pavement condition state, where green sections represent good condition, orange sections indicate preventive maintenance requirements, and red sections represent sections requiring urgent or active intervention. This agent-based representation enables the model to monitor deterioration, inspection status, maintenance triggers, and treatment progress at the section level rather than treating the network as one aggregated asset.
Figure 2.
AnyLogic implementation of the proposed renewable-energy-aware network-level pavement maintenance simulation framework.
The operational maintenance layer of the simulation, such as the material depot, inspection route, maintenance work zones, equipment movement, work-order queue, and policy controller can be also seen in Figure 2. The material depot is composed of the storage of asphalt mix, sealant tank, storage of aggregate, equipment yard, maintenance yard, and crew base, which are connected to the road network via dispatch routes. The simulation currently has three active work zones: WZ1, where crack sealing is active with lane closure and 43 percent completion; WZ2, where microsurfacing is being reopened/activated; and WZ3, where thin overlay is reopened/activated. The work-order queue has several maintenance tasks, including a high-priority thin overlay order, medium-priority microsurfacing and crack-sealing orders, and a low-priority surface-seal order, which awaits execution. The lower status bar shows that the simulation runs in year 8, day 146 and that there are 3 active and 4 queued work orders and 2 available crews. These values reflect that the model is not only estimating the condition of pavement and surrounding environment, but also simulating the maintenance execution, availability of the crew, the route of the vehicle, activities and operations in the work-zone as well as the status of treatments.
The Renewable Energy Hub, Battery Storage, Grid Connection, Diesel Backup, CarbonTracker, and BudgetManager modules allow integration of the renewable-energy and sustainability layer into the same AnyLogic environment. In the shown simulation state, the renewable energy hub reports a photovoltaic power output of 145 kWh of power/day, a battery state of charge of 64%, a draw on the grid of 31 kWh of power/day, the battery in standby mode and the battery active operating mode of PV + Battery. According to the CarbonTracker, the daily emissions are 7.2 tCO2, and at present, the share of renewable energy is 71%. The annual budget of an investment of million as shown in the simulation panel is presented in the BudgetManager as; These operational values are passed to the Policy Controller which can choose the priority of the maintenance, the type of treatment, the crew and the kind of energy mode amongst the imported policy rules or the learned multi-agent reinforcement policy. Thus, the simulated environment suggests a dynamic decision on which pavement improvement in terms of condition, maintenance cost, and crews and equipment availability, carbon emissions, the utilization of renewable energy, and the cost constraint are jointly considered during network-level pavement maintenance planning.
3.1. Generated Datasets
Two calibrated synthetic datasets were generated to support the proposed AnyLogic-based renewable-energy-aware pavement maintenance framework and the associated ML/ANN decision models. The datasets were constructed through an engineering-constrained simulation design rather than independent random sampling. This design was adopted because integrated field datasets that include pavement condition, traffic loading, structural response, maintenance execution, renewable-energy availability, carbon emissions, and budget status are rarely available in a complete and agency-ready form. Therefore, the generation process was organized to produce internally consistent pavement, maintenance, energy, carbon, and budget states that could initialize the AnyLogic agents and train the decision models under realistic but controlled operating conditions. For the pavement layer, the selected variables and ranges were guided by recent pavement-condition and machine-learning studies that use practical indicators such as , pavement age, layer thickness, traffic demand, heavy-vehicle percentage, and distress-related features to support pavement-condition assessment and maintenance decision-making [12]. The condition-state and treatment-trigger logic was also aligned with condition-based pavement maintenance modeling, where intervention decisions depend on the deterioration state, remaining performance, and expected future condition rather than on isolated threshold values only [13]. For the decision-control layer, the target labels and overlapping treatment boundaries were calibrated to reflect engineering-adaptive maintenance decision-making, in which expert-informed rules, performance prediction, and reinforcement-learning feedback are combined to avoid rigid deterministic action assignment [14,15]. For the sustainability and resource-management layer, the energy, carbon, and budget variables were selected to reflect maintenance-stage energy consumption, greenhouse-gas emissions, treatment cost, and resource constraints reported in recent low-carbon pavement maintenance and MRR optimization studies [16,17]. In addition, pavement life-cycle assessment studies that discuss data uncertainty, inventory completeness, and ML-supported scenario evaluation were used to justify the need for calibrated simulation records when complete field inventories are unavailable [18]. Accordingly, the generated datasets should be interpreted as calibrated simulation datasets designed for methodological evaluation, scenario testing, and policy comparison, rather than as direct field measurements from a single road agency.
Table 2 shown the first dataset, named the Pavement Network and Maintenance Dataset, contains 4437 records and 55 features representing pavement geometry, traffic loading, structural condition, environmental exposure, finite-element-inspired response indicators, pavement distress, maintenance history, treatment cost, treatment duration, and maintenance action labels. The selection of pavement-condition variables was guided by recent pavement-condition modeling studies in which , pavement age, traffic demand, heavy-vehicle share, pavement-layer characteristics, and distress-related indicators are used as practical inputs for condition assessment and maintenance-support modeling [12]. The dataset was designed to initialize the pavement-section agents in AnyLogic and to support supervised learning models for predicting the maintenance action denoted by MARL_Treatment_Action. The generated values cover realistic pavement-maintenance ranges, including section lengths from 0.303 to 5.294 km, AADT values from 525 to 80,826 vehicles/day, truck percentages from 1.50% to 29.67%, values from 22.8 to 98.0, values from 1.8 to 20.0 years, IRI values from 0.80 to 5.59 m/km, rutting from 0.00 to 26.91 mm, cracking from 0.00% to 70.00%, and treatment costs from 0.00 to 1,095,196.83 USD. These values were not assigned independently. Traffic-loading variables such as AADT, truck percentage, cumulative ESALs, and functional class were linked to deterioration-related variables, including , , IRI, rutting, cracking, and FE-inspired damage indicators. This correlation structure is consistent with condition-based pavement maintenance modeling, where maintenance timing and action selection depend on the combined deterioration state and expected remaining performance rather than on isolated threshold values [13]. Similarly, maintenance cost, treatment duration, required equipment, crew type, gain, and RSL gain were conditioned on the selected maintenance action so that high-intensity treatments such as thin overlay and rehabilitation produced higher cost, duration, energy demand, and service-life improvement than preventive treatments. The treatment-label calibration was also aligned with recent reinforcement-learning-based pavement maintenance studies, where expert-informed rules, engineering feedback, and reward design are used to avoid rigid deterministic action assignment and to support adaptive maintenance-policy learning [14,15]. This correlation structure was introduced to avoid physically unrealistic records, such as low-cost rehabilitation, high for severely damaged sections, or high-PCI sections requiring major reconstruction without structural justification. The target labels were calibrated to avoid trivial classification and include 1704 “Do Nothing”, 770 “Crack Sealing”, 546 “Microsurfacing”, 1133 “Thin Overlay”, and 284 “Rehabilitation” cases. This distribution creates overlapping treatment boundaries and allows ML/ANN models to learn pavement-maintenance decisions without relying on simple deterministic thresholds.
Table 2.
Features and parameters of the Pavement Network and Maintenance Dataset with their calibration role in the AnyLogic–Graph-MAPPO framework.
The second dataset was generated using the same calibration logic, but for the renewable-energy, carbon, and budget layer. Photovoltaic output was linked to season, cloud index, solar irradiance, and PV capacity; battery availability was controlled through the state-of-charge range and charge/discharge logic; grid and diesel use were activated when renewable supply was insufficient to satisfy equipment energy demand; and total CO2 emissions were calculated from grid electricity, diesel consumption, PV life-cycle factors, and material-related emissions. This structure is consistent with recent pavement-maintenance carbon-assessment studies that evaluate maintenance-stage energy consumption and greenhouse-gas emissions through material production, transportation, equipment operation, and construction/maintenance activities [16]. Budget variables were also linked to treatment type and accumulated maintenance cost, so that the feasibility label reflected the combined effect of energy availability, carbon allowance, remaining budget, and operational resource constraints. This is consistent with recent MRR optimization studies that formulate pavement maintenance scheduling as a multi-objective problem involving pavement performance, cost, and greenhouse-gas emissions [17]. This design allowed the generated records to preserve important dependencies among renewable-energy share, equipment demand, grid/diesel support, carbon emissions, and budget consumption.
To further assess the applicability of the generated datasets, the experimental analysis included sensitivity checks on key technical and economic parameters, including PV output, battery SOC, treatment cost, diesel use, grid-emission factor, annual budget, and carbon limit. These parameters were varied around their calibrated baseline values to examine whether the proposed policy remained stable under changes in energy availability, carbon intensity, and financial capacity. The use of sensitivity checks is also supported by recent pavement life-cycle assessment research, which emphasizes that ML-supported pavement LCA can help address inventory uncertainty, detect data inconsistencies, simulate alternative scenarios, and strengthen decision-making under uncertain environmental inputs [18]. The sensitivity analysis was used to verify that the main conclusions were not driven by a single fixed dataset configuration, but reflected the behavior of the integrated pavement–energy–carbon decision framework across plausible operating conditions.
Table 3 shown the second dataset, named the Renewable Energy, Carbon, and Budget Dataset, contains 9875 records and 38 features representing the time-dependent energy, environmental, and financial conditions required to operate the renewable-energy-aware maintenance system. This dataset was generated to reproduce the operational coupling between maintenance demand, renewable-energy availability, carbon burden, and financial capacity. Its variables were not sampled as isolated values; rather, they were linked through energy-balance, emission-accounting, budget-consumption, and treatment-execution rules so that each record represents a feasible or constrained maintenance-energy state. This dataset is used by the AnyLogic energy hub, battery-storage module, carbon tracker, budget manager, equipment pool, and policy controller. It also supports ML/ANN models for predicting Energy_Mode_Target and Energy_Feasibility_Label. The dataset includes seasonal and weather-dependent photovoltaic generation, battery state of charge, grid and diesel availability, equipment energy demand, energy-source allocation, carbon emissions, budget utilization, and renewable-energy share. The energy and carbon variables were structured consistently with recent pavement-maintenance carbon-assessment studies, where emissions are estimated from material production, transportation, equipment operation, grid electricity, fuel consumption, and maintenance-stage activities [16]. Budget and emission-related variables were also aligned with recent MRR optimization studies that formulate pavement maintenance as a multi-objective problem involving pavement performance, cost, and greenhouse-gas emissions [17]. The generated values include PV outputs from 212.42 to 2500.00 kWh/day, battery SOC from 7.67% to 98.00%, energy demand from 0.00 to 4500.00 kWh, diesel consumption from 0.00 to 1216.22 L, total carbon emissions from 0.00 to 28,993.84 kgCO2e, annual budget values from 2.03 to 5.20 million USD, and carbon limits from 59,500 to 148,500 kgCO2e. PV output was conditioned on season, day of year, cloud index, solar irradiance, and installed PV capacity, while battery use was constrained by state of charge and charge/discharge logic. Grid and diesel support were activated only when the renewable-energy contribution was insufficient to satisfy the equipment demand of the selected maintenance activity. Total CO2 emissions were calculated from grid electricity, diesel fuel, PV life-cycle contribution, and material-related emissions, whereas budget variables were updated according to treatment type, section length, equipment use, and accumulated maintenance cost. The target energy modes include 5572 PV+Battery, 1341 PV+Grid, 449 Battery+Grid, 306 Grid+Diesel, 56 Diesel, 14 Infeasible, and 2137 no-action energy records. The feasibility labels were calibrated into 4413 feasible and 5462 constrained records to represent realistic energy limitations and avoid overly simple classification patterns. This calibrated distribution ensures that the learning model is exposed to both normal renewable-supported operation and constrained cases caused by low PV availability, insufficient battery SOC, high equipment demand, budget shortage, or carbon-limit pressure.
Table 3.
Features and parameters of the Renewable Energy, Carbon, and Budget Dataset with their calibration role in the renewable-energy-aware maintenance framework.
Table 4 summarizes the finite-element-assisted variables used to strengthen the structural calibration of the pavement maintenance dataset. Finite-element-assisted variables were incorporated into the generated pavement dataset to provide a deeper structural basis for deterioration modeling beyond conventional surface indicators such as , IRI, rutting, and cracking. In the proposed framework, finite-element analysis is not treated as the main simulation platform; rather, it is used as a supporting structural-response calibration module whose outputs are imported into AnyLogic as pavement-section attributes and MARL state variables. This design is important because pavement sections with similar surface-condition values may still differ in hidden structural capacity, fatigue susceptibility, rutting potential, and deflection response. Each representative pavement section is modeled using layer-specific structural parameters, including asphalt thickness, base thickness, subbase thickness, asphalt modulus, base modulus, subbase modulus, subgrade modulus, Poisson’s ratios, axle load, tire pressure, contact area, pavement temperature, moisture condition, layer-interface condition, and mesh density. These parameters are used to estimate mechanistic response indicators such as tensile strain at the bottom of the asphalt layer, compressive strain at the top of the subgrade, surface deflection, maximum vertical stress, maximum shear stress, fatigue damage index, rutting risk index, and structural capacity factor. The FE-assisted variables were calibrated in relation to traffic loading, heavy-vehicle share, pavement age, layer thickness, subgrade support, temperature, moisture condition, and load repetition so that the structural-risk indicators remained consistent with the generated surface-distress and remaining-life variables. In the calibrated pavement dataset, the structural and condition variables were generated within realistic ranges, including pavement section lengths of –, AADT values of 525–, truck percentages of –, values of –, values of –, IRI values of –, rutting depths of –, cracking percentages of –, and treatment costs of –. The FE-inspired outputs are particularly important because two pavement sections with similar values may have different internal structural capacities; for example, a section with moderate surface condition but high tensile strain, high subgrade compressive strain, and large deflection may require earlier intervention than another section with the same but lower structural damage. Therefore, FE-derived variables such as Tensile_Strain_Asphalt, Compressive_Strain_Subgrade, Surface_Deflection_mm, Fatigue_Damage_Index, Rutting_Risk_Index, and Structural_Capacity_Factor are converted into Deterioration_Rate_Modifier, Maintenance_Trigger_Modifier, and FE_Damage_Score. These derived indicators directly affect the simulated deterioration trajectory, the timing of maintenance triggers, and the priority score used by the decision model. For instance, sections with high traffic loading, high truck percentage, weak subgrade modulus, elevated pavement temperature, or poor moisture condition are assigned higher structural-risk values, which accelerate reduction and loss in the AnyLogic environment. This integration makes the generated dataset more complex and more realistic for ML, ANN, and MARL applications because the final maintenance action is not determined only by simple threshold rules. Instead, the target decision MARL_Treatment_Action is influenced by interacting surface, structural, operational, and network-level factors. This calibration strategy is consistent with the use of engineering-informed and reinforcement-learning-based pavement maintenance decision models, where maintenance actions are shaped by condition states, structural vulnerability, resource feasibility, and expected long-term performance rather than by a single surface indicator [14,15]. As a result, the calibrated target distribution includes 1704 “Do Nothing” cases, 770 “Crack Sealing” cases, 546 “Microsurfacing” cases, 1133 “Thin Overlay” cases, and 284 “Rehabilitation” cases, creating realistic overlapping decision boundaries and preventing overly deterministic classification behavior.The finite-element-assisted features strengthen the scientific basis of the generated dataset by linking hidden structural response to observable pavement condition and by enabling AnyLogic and the MARL controller to evaluate whether a pavement section requires preventive maintenance, corrective overlay, or major rehabilitation based on both surface deterioration and internal structural vulnerability.
Table 4.
Finite-element-assisted features and parameters used for structural-response calibration of the pavement maintenance dataset.
To reduce the risk of circular validation, the generated treatment labels, feasibility labels, priority scores, and constraint states were not treated as fully independent field ground truth, but as engineering-informed simulation variables used to initialize the decision environment, define feasible action boundaries, and support controlled benchmarking. The Graph-MAPPO policy was therefore not evaluated only by its ability to reproduce these generated labels; instead, its performance was assessed using outcome-based indicators, including gain, gain, maintenance cost, CO2 emissions, renewable-energy share, deferred work orders, critical sections, constraint-violation rate, and cumulative reward. This distinction is important because the learned policy jointly selects the pavement section, treatment type, intervention timing, crew, equipment, and energy-source mode under dynamically changing budget, carbon, energy, and resource constraints, rather than simply mapping a condition state to a predefined treatment label. Nevertheless, because the training and evaluation environment remains simulation based, some dependence between embedded engineering rules and learned policy behavior cannot be completely excluded. Therefore, the results should be interpreted as proof-of-concept evidence under controlled simulation assumptions. A stronger validation stage should use external pavement-management data or a separately generated unseen network with different topology, deterioration patterns, traffic loading, PV availability, battery behavior, budget levels, carbon limits, crew/equipment resources, and treatment-cost assumptions to further distinguish transferable maintenance behavior from reproduction of embedded simulation logic [19].
3.2. Overall Emulated Framework of the Renewable-Energy-Aware Pavement Maintenance System
The proposed framework is first represented through a system-level emulation that illustrates how pavement condition monitoring, maintenance execution, renewable-energy allocation, carbon tracking, budget control, and AI-based decision-making interact within one integrated pavement maintenance environment. As shown in Figure 3, the emulated network includes multiple pavement section agents with heterogeneous condition states, such as with and years, with and years, with and years, with and years, and with and years. Condition-based overlays are used to make visual differentiation of the road connectors with green areas representing conditions of acceptable pavement, orange areas representing conditions of preventive or corrective maintenance, and red areas representing conditions of critical or active intervention. Besides surface indicators, the emulation has structural-risk information, aided by finite elements among others, including the damage scores of 0.22 in the case of , 0.36 in the case of , and 0.64 in the case of . These indicators enable the framework to indicate hidden structural frailty in pavement segments the surface state of which may not be entirely reflective of their urgency to maintain their structural integrity.
Figure 3.
Simulation emulation of the renewable-energy-aware network-level pavement maintenance framework.
The emulated framework also demonstrates how maintenance decisions are constrained by operational resources, renewable-energy availability, carbon emissions, and budget limits. At the displayed state, corresponding to Year 8 and Day 146, the system contains three active work zones, four queued work orders, and two available crews. Specifically, is assigned to crack sealing with completion and lane closure, is assigned to microsurfacing with curing progress, is assigned to thin overlay with crew deployment, and is an inspection-pending queued task. Maintenance resources are supplied from a material depot containing asphalt mix storage, sealant tanks, aggregate storage, an equipment yard, a crew base, and a dispatch gate, with inventory levels of asphalt mix, sealant, and aggregate. The renewable-energy subsystem provides of PV output, a battery state of charge of , of grid draw, and diesel backup in standby mode, resulting in a PV + Battery operating mode and a renewable-energy share of . The carbon tracker reports daily emissions of , while the budget manager indicates an annual budget of million USD, used budget, and remaining budget. These emulated states are used to define the information flow later implemented in AnyLogic and passed to the graph-based MARL controller, which selects the pavement section, treatment type, intervention timing, crew, equipment, and energy mode; in the shown state, the current decision is for thin overlay using Crew 1 under a feasible PV + Battery energy mode.
Table 5 defines the maintenance treatments used by the AnyLogic simulation and the MARL decision controller. Each treatment is assigned a pavement-condition trigger range, treatment cost, execution duration, equipment-energy demand, carbon-emission burden, and expected post-treatment improvement in pavement condition and remaining service life. Preventive treatments, such as crack sealing, are assigned to pavement sections with relatively acceptable condition levels, typically , and require only , , and , producing a moderate improvement of and years of remaining service life. Microsurfacing is applied to sections with moderate deterioration, , with a cost of , a duration of , an energy demand of , and an expected improvement of and years of . For more deteriorated sections, thin overlay is assigned within , requiring , , , and generating , while increasing pavement condition by approximately and extending by years. Rehabilitation is reserved for critical sections with , where the intervention requires , , , and , but provides the largest recovery effect of and years of service life. These treatment characteristics allow the framework to evaluate trade-offs among pavement performance, maintenance cost, work-zone duration, energy consumption, carbon emissions, and resource availability.
Table 5.
Maintenance treatment characteristics used in the renewable-energy-aware pavement maintenance simulation.
The renewable-energy subsystem is modeled as a priority-based dispatch controller rather than as a simple feasibility checker. At each simulation step, the controller first allocates available PV energy to the active maintenance load because it has the lowest operating carbon burden. If PV generation exceeds the current equipment demand, the surplus is directed to battery charging when . If PV generation is insufficient, the battery is discharged when and the discharge-power limit is not exceeded. Grid electricity is then used as the third dispatch option when PV and battery resources cannot satisfy the load, while diesel backup is activated only as the last-resort source under low renewable availability, insufficient battery charge, grid unavailability, or emergency work-zone execution. This dispatch hierarchy allows the framework to distinguish between renewable-supported operation, hybrid operation, grid-supported operation, diesel-supported operation, and infeasible maintenance execution. Battery operation is constrained by a protected operating window of and , charging and discharging efficiencies, maximum charge/discharge limits, and a throughput-based degradation indicator. The raw generated energy dataset may include SOC values outside this protected range, but such records are treated as constrained cases by the feasibility label and action-mask rules. PV output and electricity price are time dependent: PV generation varies with season, day of year, solar irradiance, cloud index, and installed PV capacity, while grid cost follows off-peak, shoulder, and peak tariff periods. Diesel use is converted into equivalent energy and carbon emissions using a backup-generator efficiency assumption and the diesel emission factor. The carbon-accounting boundary includes grid electricity, diesel fuel, PV life-cycle contribution, and material-related emissions, while detailed equipment manufacturing, worker commuting, and end-of-life disposal are excluded from the operational simulation boundary.
Table 6 clarifies how renewable-energy resource management is implemented inside the simulation. The dispatch sequence gives priority to PV generation, followed by battery support, grid electricity, and diesel backup, which ensures that low-carbon energy is used before conventional sources whenever it is technically available. The battery is not treated as an unlimited buffer; instead, it is operated within a protected 20– SOC window, with charge and discharge efficiencies of 0.95 and 0.92, respectively, and maximum charge/discharge power limits of 250 kW. These constraints prevent unrealistic use of stored energy and allow the action-mask layer to reject battery-supported actions when the SOC or power limits are violated. The grid is modeled as a time-dependent fallback source using off-peak, shoulder, and peak tariffs of 0.08, 0.14, and 0.22 USD/kWh, respectively, so that maintenance timing can affect both cost and energy-source selection. Diesel backup is reserved as the final dispatch option and is represented using an effective conversion of 3.43 kWh/L and an emission factor of 2.68 kgCO2/L, making diesel-supported maintenance more costly and carbon intensive than renewable-supported operation. The table also defines the carbon-accounting boundary by including grid electricity, diesel fuel, PV life-cycle emissions, and material-related emissions, while excluding equipment manufacturing, worker commuting, and end-of-life disposal from the operational simulation scope. Battery degradation is represented through a throughput-based penalty of 0.025 USD/kWh discharged, which discourages excessive cycling without requiring a detailed electrochemical aging model.
Table 6.
Renewable-energy dispatch, storage, backup, cost, and carbon-accounting rules used in the simulation.
The renewable-energy-aware maintenance module was formulated to evaluate whether each maintenance activity can be executed using the available energy resources while satisfying operational, carbon, and budget constraints. In the proposed framework, the total equipment energy demand at time step t, denoted by , is supplied through a hybrid energy system consisting of photovoltaic generation, battery storage, grid electricity, and diesel backup. This relationship is expressed as:
where is the energy supplied by the solar PV system, is the discharged battery energy, is the energy drawn from the grid, and is the equivalent energy supplied through diesel backup. For example, in the emulated simulation state, the renewable-energy hub provides of PV output, maintains a battery state of charge of , draws from the grid, and keeps diesel backup in standby mode. This enables the system to operate under a PV + Battery mode with a renewable-energy share of , while supporting active maintenance activities such as crack sealing, microsurfacing, and thin overlay.
Battery behavior is updated dynamically to represent the charging and discharging process during maintenance execution. The battery state of charge at the next time step is calculated using:
where is the current battery state of charge, is the charged energy from excess PV generation, is the discharged energy used for equipment operation, and and are the charging and discharging efficiencies, respectively. This formulation allows the simulation to decide whether a treatment should be executed immediately, delayed, or supported by grid/diesel energy depending on battery availability. For instance, low-energy preventive treatments such as crack sealing require approximately , making them suitable for PV + Battery operation, while high-energy treatments such as thin overlay and rehabilitation require and , respectively, which may require hybrid support from the battery and grid. Therefore, the battery update equation directly affects treatment feasibility, maintenance timing, and the renewable-energy-aware decision policy.
The environmental and financial constraints are evaluated through carbon-emission and budget-update formulations. The total carbon emissions at time step t are computed as:
where is the grid electricity emission factor, is grid energy consumption, is the diesel emission factor, is diesel fuel consumption, is the material-related emission factor, and is the quantity of maintenance material consumed. In the emulated state, the carbon tracker reports , using emission factors of for grid electricity and for diesel. The budget state is updated as:
where is the available budget before maintenance and is the cost of the selected maintenance activity. In the current simulation state, the annual budget is million USD, with used and remaining. These formulations allow the MARL controller to evaluate each candidate maintenance action not only according to pavement improvement, but also according to energy feasibility, carbon impact, and budget availability.
3.3. Multi-Agent Deep Reinforcement Learning Decision Model
Figure 4 illustrates the proposed Multi-Agent Deep Reinforcement Learning (MADRL) decision model developed for renewable-energy-aware pavement maintenance. The architecture starts with a multi-agent state tensor , where N represents the number of pavement-section agents and F represents the feature dimension of each agent. Each agent state vector includes pavement condition, structural, traffic, energy, and constraint-related variables, such as , , , rutting, cracking, FE damage score, , section priority, remaining budget, battery state of charge, photovoltaic availability, and carbon allowance. These inputs are combined with the adjacency matrix and the edge tensor to construct the graph state , where pavement sections are represented as graph nodes and road connectivity, dispatch dependency, and interaction strength are represented as graph edges. The constructed graph is passed through a three-block multi-head graph attention encoder, where each GAT block contains linear projection, attention weighting, aggregation, and normalization layers. The resulting temporal representation is mapped into a shared latent embedding using dense layers, forming , which is then passed to the actor-critic structure. In the actor branch, a shared actor trunk generates decentralized action logits through six decision heads: section selection, treatment selection, timing decision, crew assignment, equipment assignment, and energy-mode selection. The raw action probabilities are then filtered by a constraint-aware masking layer , which removes infeasible actions caused by budget shortage, carbon-limit violation, insufficient energy, unavailable crew, or unavailable equipment. In parallel, the centralized critic branch aggregates the global state through pooling and dense layers to estimate , supporting stable multi-agent policy learning. The selected maintenance action is executed through the AnyLogic environment interface, where , , cost, carbon emissions, delay, and energy states are updated. The reward module evaluates the action using PCI RSL , where the reward encourages pavement-condition improvement, service-life extension, and renewable-energy utilization while penalizing cost, emissions, delay, and constraint violations. the MAPPO update module uses advantage estimation, actor loss, critic loss, entropy regularization, and clipped policy optimization to update the actor and critic networks. The final output is a renewable-energy-aware maintenance policy, such as , which determines the selected section, treatment type, intervention timing, resource assignment, and energy-source mode under feasibility, low-carbon, and budget-valid conditions.
Figure 4.
Proposed Multi-Agent Deep Reinforcement Learning Decision Model.
Table 7 provides the reproducibility specification of the proposed Graph-MAPPO decision model by defining the input state, action structure, reward design, network architecture, training configuration, constraint-handling rules, baseline operating limits, and stopping criteria in a compact form. The state representation combines pavement surface condition, distress indicators, FE-assisted structural risk, traffic loading, graph connectivity, and resource availability, allowing each pavement-section agent to evaluate both its physical deterioration state and its operational feasibility. The action space is formulated as a six-head decision tuple covering section selection, treatment type, intervention timing, crew assignment, equipment allocation, and energy-mode selection, which reflects the practical requirement that maintenance planning must determine not only what treatment is needed, but also when, where, by whom, with which equipment, and under which energy source it can be executed. The reward function balances pavement performance and sustainability by assigning positive weights to gain, gain, and renewable-energy share, while penalizing cost, carbon emissions, work-zone delay, and constraint violations using normalized components. The architecture is specified through three graph-attention blocks with four attention heads, a 64-unit GRU temporal encoder with a four-week history window, a shared actor network, and a centralized critic, thereby making the spatial, temporal, and actor–critic components reproducible. The training setup further improves repeatability by using a 70/30 train–test split, random seed 42, 1000 training episodes, a 365-step annual horizon, Adam optimization with a learning rate of , batch size of 256, mini-batch size of 64, 10 PPO epochs, discount factor , GAE parameter , PPO clipping value of 0.20, entropy coefficient of 0.01, value-loss coefficient of 0.50, and gradient clipping of 0.50. The masking rules ensure that the learned policy cannot select infeasible actions when budget, carbon, energy, battery SOC, crew, equipment, treatment-suitability, or work-zone-capacity constraints are violated [20].
Table 7.
Compact reproducibility settings of the Graph-MAPPO decision model.
Algorithm 1 presents the proposed Unified Modular Graph-MAPPO procedure used to train the renewable-energy-aware pavement maintenance policy. The algorithm begins by initializing the actor network , centralized critic , graph encoder , and temporal encoder , and then links these learning components with the AnyLogic maintenance-energy environment , which is initialized using the pavement dataset , the energy-carbon-budget dataset , and the pavement graph . At each episode, the simulation is reset to generate the initial pavement state , graph state , and temporal memory . During each decision step t, the algorithm first extracts the node-feature matrix , adjacency matrix , and edge-feature tensor , forming the graph state . The Figure 4 state is used to allow the model to use pavement sections as interacting agents instead of road sections. The multi-head graph attention encoder is then used to produce , which captures the relationships among pavement sections in space, including network connectivity, dispatch dependence, and neighboring deterioration effects. The temporal encoder subsequently updates the hidden representation to obtain , which incorporates the temporal evolution of pavement conditions and maintenance-related states to retain the history of long-term deterioration, past maintenance activities, delayed treatment impact, and time- and energy-varying operation and maintenance. This shared embedding function, denoted as , is then sent to the actor network, which then generates logits, denoted as , which is referred to as multi-component maintenance action, covering section selection, type of treatment, time of intervention, assignment of crew, allocation of equipment, and mode of energy source. Before sampling the action, the constraint mask is applied to the softmax policy, producing , which prevents infeasible decisions caused by insufficient budget, carbon-limit violation, unavailable crews or equipment, invalid treatment applicability, or inadequate energy supply. The centralized critic estimates , after which the selected action is executed in AnyLogic through . The environment returns the updated state and the output vector , including pavement improvement, gain, cost, emissions, delay, renewable-energy use, and constraint violations. These outputs are converted into the reward and stored in the rollout buffer . After completing the horizon T, the algorithm computes generalized advantage estimates , actor loss , critic loss , and entropy loss . The total objective is minimized using Adam to jointly update the actor, critic, graph encoder, and temporal encoder parameters. As a result, the learned policy becomes capable of selecting maintenance actions that jointly improve pavement condition, extend service life, reduce cost and carbon emissions, maximize renewable-energy utilization, and maintain feasibility under budget, energy, crew, equipment, and carbon constraints.
| Algorithm 1 Unified Modular Graph-MAPPO Algorithm for Renewable-Energy-Aware Pavement Maintenance |
|
The multi-component action space is formulated as a conditionally factorized joint action. At each decision step t, the actor produces a structured action tuple
where denotes the selected pavement section, denotes the maintenance treatment, denotes the intervention timing, denotes the assigned crew, denotes the required equipment set, and denotes the energy-source mode. The policy is not sampled as six unrelated categorical decisions. Instead, it is factorized in a sequential conditional form as
This conditional factorization means that the treatment decision is conditioned on the selected pavement section, the timing decision is conditioned on the section–treatment pair, crew and equipment allocation are conditioned on the planned maintenance task, and the energy-mode decision is conditioned on the resulting equipment demand and the available PV, battery, grid, and diesel resources. Therefore, the controller learns a structured maintenance-execution policy rather than independently sampling section, treatment, timing, resource, and energy decisions.
Invalid action combinations are handled during learning through a hierarchical action-mask mechanism. For each action component, a binary feasibility mask is applied to the corresponding logits before sampling. The masked policy for action head k is defined as
where , is the logit vector of action head k, is the corresponding feasibility mask, and is the shared GAT–GRU representation. Invalid combinations are removed before sampling, including selecting rehabilitation for a high-PCI section, scheduling a treatment when the remaining budget is insufficient, assigning an unavailable crew, selecting occupied equipment, choosing a battery-supported energy mode when , selecting PV-only operation when PV output is lower than equipment demand, or accepting an action that would exceed the carbon limit. In implementation, infeasible logits are assigned a very large negative value before the softmax operation, so their sampling probability becomes zero.
The feasibility mask is constructed from treatment, budget, carbon, energy, crew, and equipment constraints. For a candidate joint action , the treatment-feasibility mask is defined as
where is the allowable -trigger interval for the selected treatment. For example, crack sealing is allowed for moderate deterioration, thin overlay is allowed for structurally and functionally deficient sections, and rehabilitation is allowed only when the section condition satisfies the severe-deterioration trigger. The budget-feasibility mask is defined as
where is the estimated maintenance and equipment cost of the candidate action and is the remaining available budget. The carbon-feasibility mask is given by
where denotes the expected carbon emissions from the selected treatment, equipment, and energy-source mode, and is the remaining carbon allowance. The energy-feasibility mask is defined as
where is the energy demand of the selected treatment and equipment set, and is the available energy under the selected PV, battery, grid, diesel, or hybrid energy mode. Battery-supported modes are further constrained by
where is the minimum allowable battery state of charge. The crew-feasibility and equipment-feasibility masks are defined as
where is the set of available crews and is the set of available equipment units. The final joint feasibility mask is computed as the logical product of all constraint-specific masks:
If , the candidate joint action is invalid and its sampling probability is set to zero before action selection. Therefore, the controller cannot execute combinations that violate treatment-trigger rules, exceed the remaining budget or carbon allowance, require unavailable energy, use insufficient battery SOC, assign unavailable crews, or select occupied equipment.
3.4. Experimental Setup and Configurations
Table 8 presents the 20 experimental configurations designed to evaluate the proposed Graph-MAPPO policy under baseline, ablation, reward-sensitivity, architectural, sustainability, and operational stress conditions. The experiments are organized to progressively test how each component of the proposed framework affects pavement maintenance performance, renewable-energy utilization, carbon control, and decision feasibility. E1 establishes a non-learning rule-based benchmark using fixed / treatment thresholds under the standard annual budget of million USD and a carbon limit of . E2–E5 compare different reward-priority structures, including a cost-dominant policy with , a carbon-dominant policy with and a stricter carbon limit of , a renewable-energy-dominant policy with and PV availability, and the balanced proposed model using , , , , , , and . E6–E14 investigate the internal algorithmic structure of Graph-MAPPO by removing or modifying key components: E6 removes graph attention and passes features directly to an MLP, E7 reduces the graph encoder to one GAT block with two attention heads and hidden size 64, E8 increases graph depth to five GAT blocks with eight attention heads and hidden dimensions , E9 removes GRU temporal memory, E10 increases temporal capacity using GRU-128 with an 8-week sequence window, E11 removes the FE damage feature by reducing the state dimension from to , E12 amplifies structural-risk sensitivity by multiplying FE damage by and applying a critical threshold of , E13 disables the constraint mask so actions are sampled directly from , and E14 applies stricter feasibility control by increasing the violation weight to , reducing the budget to million USD, tightening the carbon limit to , and masking actions when , budget use exceeds , or carbon use exceeds . Finally, E15-E20 examine operational robustness under practical stress cases: E15 reduces the annual budget to million USD, E16 increases it to million USD with a relaxed carbon limit of , E17 imposes a renewable-energy shortage by reducing PV output by and capping SOC at , E18 represents abundant clean energy with PV output and minimum , E19 creates resource scarcity by reducing crews from three to one and reducing paver/roller availability by , and E20 models accelerated deterioration by increasing AADT by , truck share by , deterioration rate by , and reducing by 10 points for 30% of sections.
Table 8.
Experimental configurations used to evaluate the proposed Graph-MAPPO pavement maintenance policy under different algorithmic, operational, energy, carbon, and budget conditions.
4. Discussion, Results, and Comparison
The performance of the proposed renewable-energy-aware Graph-MAPPO framework was evaluated through the 20 experimental configurations. These experiments were designed to assess the framework from complementary perspectives, including AI learning performance, pavement-condition improvement, maintenance effectiveness, renewable-energy utilization, carbon-emission reduction, budget feasibility, treatment distribution, and operational robustness. The evaluation compares the proposed balanced configuration against a rule-based baseline, cost-dominant, carbon-dominant, and renewable-energy-dominant reward structures, as well as ablation variants that remove or modify graph attention, temporal memory, finite-element-assisted structural inputs, and constraint-aware action masking. In addition, stress-test scenarios are included to examine the framework under low budget, high budget, renewable-energy shortage, abundant renewable-energy availability, crew/equipment scarcity, and accelerated deterioration conditions. The results are reported using both AI-oriented metrics, such as training/testing accuracy, F1-score, and , and engineering-oriented indicators, including average , minimum , gain, maintenance cost, CO2 emissions, renewable-energy share, violation rate, and reward. This combined evaluation is particularly important because the proposed framework is not intended to maximize a single performance indicator. Instead, it is designed to learn maintenance policies that balance pavement-condition recovery, service-life extension, budget consumption, carbon-emission reduction, renewable-energy utilization, and operational feasibility. Therefore, the following results are interpreted from both learning-performance and technical–economic perspectives. This combined analysis allows the proposed framework to be evaluated as a learning algorithm, and as a practical pavement-maintenance decision system capable of balancing infrastructure performance, sustainability, energy availability, and operational feasibility.
Table 9 reports the training and testing AI-performance results for the 20 experimental configurations and links each result to the dominant configuration change. Because the proposed controller is trained as a reinforcement-learning policy, the reported accuracy, F1-score, and values are interpreted here as auxiliary diagnostic indicators rather than as the primary evidence of policy performance. These metrics indicate whether the learned model produces stable action patterns and value-related trends under the generated evaluation data, but they do not by themselves prove long-term policy quality. Therefore, the AI-oriented results in this table should be read together with the reinforcement-learning and engineering outcomes reported later, including reward, constraint-violation rate, gain, gain, CO2 emissions, renewable-energy share, deferred work orders, and robustness under shifted budget, renewable-energy, resource, and deterioration conditions. The rule-based baseline in E1 provides the lowest diagnostic performance, with a testing accuracy of , testing F1-score of , and testing . This confirms that fixed threshold rules are less capable of representing the coupled decision logic required for network-level pavement maintenance, especially when budget, carbon, renewable-energy availability, crew/equipment resources, and feasibility constraints interact.
Table 9.
Training and testing AI-performance results linked to the main experimental configuration parameters.
The reward-sensitivity experiments E2–E5 show that changing the objective priority affects both the learnability of the policy and the type of long-term maintenance behavior that the policy tends to produce. The cost-dominant policy in E2 reaches testing accuracy and testing F1-score, indicating that cost-focused action patterns can be learned; however, this diagnostic performance should not be interpreted as evidence of superior reinforcement-learning policy quality because cost-prioritized behavior may still lead to weaker pavement recovery, lower renewable-energy use, or higher emissions. The carbon-dominant policy in E3 increases testing accuracy to and testing F1-score to , while the renewable-energy-dominant policy in E4 further improves testing accuracy to and testing F1-score to . The proposed balanced Graph-MAPPO model in E5 achieves stronger diagnostic performance, with testing accuracy, testing F1-score, and testing . More importantly, its policy-level value is assessed through the corresponding reward, feasibility, pavement-condition, and sustainability indicators reported in the subsequent results tables, where the balanced configuration is evaluated according to long-term improvement, emissions, renewable-energy share, and constraint violations rather than supervised-style agreement alone.
The ablation experiments E6–E13 further clarify the technical contribution of each model component while also helping to interpret policy stability. Removing graph attention in E6 reduces testing accuracy to , while using a shallow graph encoder in E7 increases it to . A deeper graph encoder in E8 improves testing accuracy to and testing to , showing that spatial relationships among pavement sections, dispatch routes, and network dependencies improve the consistency of learned decision patterns. Similarly, removing temporal memory in E9 reduces testing accuracy to , whereas strengthening the GRU temporal memory in E10 increases testing accuracy to , testing F1-score to , and testing to . These results indicate that graph-based spatial representation and temporal deterioration memory support more stable policy learning, but their practical value is ultimately determined by whether they improve long-term pavement outcomes, reduce infeasible actions, and maintain acceptable cost–carbon behavior over the planning horizon.
The structural-risk and feasibility experiments demonstrate that the proposed policy depends on both hidden pavement vulnerability and operational constraint handling. Removing the FE-assisted structural feature in E11 decreases testing accuracy to , whereas strengthening the FE priority in E12 increases testing accuracy to and testing to , indicating that FE-derived hidden damage information improves treatment-prioritization consistency beyond visible surface indicators such as , IRI, rutting, and cracking. The largest diagnostic degradation occurs in E13, where removing the constraint mask reduces testing accuracy to , testing F1-score to , and testing to . This result is important in the reinforcement-learning context because infeasible actions may still appear attractive if only immediate pavement improvement is considered, but they violate budget, carbon, energy, crew, or equipment limits and therefore reduce the operational validity of the learned policy. In contrast, the strict feasibility policy in E14 maintains testing accuracy and testing , showing that stronger feasibility control can preserve diagnostic stability while reducing infeasible maintenance decisions.
The stress-test experiments E15–E20 provide partial evidence of policy robustness under shifted operating assumptions. Under low-budget stress in E15, testing accuracy decreases to , reflecting the difficulty of learning effective treatment selection when financial capacity is restricted. Under low-renewable stress in E17, testing accuracy decreases to , indicating that limited PV availability and reduced battery support make energy-mode selection more constrained. Under resource-shortage stress in E19, testing accuracy reaches , showing that crew and equipment scarcity directly affects feasible maintenance scheduling. Conversely, the high-renewable scenario in E18 achieves the strongest diagnostic performance, with testing accuracy, testing F1-score, and testing , because abundant PV supply and stronger renewable-energy weighting reduce conflicts among energy feasibility, carbon reduction, and maintenance execution. Finally, the heavy-deterioration scenario in E20 maintains testing accuracy and testing , suggesting that the policy remains stable under more severe simulated deterioration and traffic-loading assumptions. However, these stress tests should be interpreted as simulation-based robustness checks rather than full evidence of external generalization; stronger validation would require unseen pavement networks or field pavement-management data with different topology, deterioration behavior, treatment history, resource availability, and agency constraints.
Table 9 shows that the highest diagnostic learning quality is obtained when the policy has access to graph relationships, temporal deterioration memory, FE-assisted structural risk, renewable-energy information, and constraint-aware masking. Nevertheless, the central reinforcement-learning interpretation is not that the model simply improves accuracy, F1-score, or , but that these diagnostic improvements are consistent with stronger policy-level behavior when evaluated using cumulative reward, constraint violations, long-term pavement-condition improvement, gain, carbon emissions, renewable-energy utilization, and operational feasibility. This distinction clarifies that the reported AI metrics are supporting evidence, while the main policy-performance assessment is based on whether the learned controller produces feasible, sustainable, and effective maintenance outcomes over the planning horizon. To further interpret the sustainability effect of these configurations, Figure 5 compares the cumulative carbon-emission pathways and illustrates how carbon-focused, renewable-energy-focused, and balanced policies differ in their long-term emission trajectories.
Figure 5.
Cumulative carbon-emission pathways under resource- and renewable-energy-constrained pavement maintenance policies.
Figure 6 provides a component-level view of the AI generalization behavior and stress robustness of the proposed Graph-MAPPO framework by comparing testing accuracy, testing F1-score, testing , average generalization gap, and the F1-score change relative to the balanced E5 configuration. The balanced model forms the reference point, achieving testing accuracy, testing F1-score, , and a moderate generalization gap of , confirming stable learning under the standard full GAT–GRU–FE–mask configuration. The reward-policy variants show that objective weighting affects both model reliability and technical–economic behavior. The cost-dominant policy produces lower testing accuracy and F1-score of and , with a F1-score reduction relative to E5, indicating that minimizing cost alone simplifies the decision space but weakens the ability to learn balanced maintenance actions under carbon, energy, and feasibility constraints. In contrast, the carbon- and renewable-energy-dominant policies improve robustness to – testing accuracy, suggesting that sustainability-aware objectives provide more consistent decision boundaries than cost minimization alone. The ablation results clearly demonstrate the value of the proposed components. Removing graph attention reduces testing accuracy to and F1-score to , while the deep GAT configuration improves them to and , showing that richer spatial representation strengthens network-level maintenance decision learning. Similarly, removing GRU temporal memory gives accuracy and F1-score, whereas the strong GRU variant reaches accuracy, F1-score, and , confirming that deterioration-history modeling is critical for sequential maintenance planning. The FE-related results also show that structural-risk information improves policy quality, as the strong FE configuration increases F1-score to , while removing FE input lowers it to . The most severe degradation occurs when the constraint mask is removed, producing the lowest testing accuracy of , F1-score of , , and the largest F1-score loss of . This highlights that feasibility-aware action filtering is not only an operational safeguard, but also a learning-stability mechanism because it prevents the policy from learning infeasible budget, carbon, energy, crew, or equipment assignments. Among stress scenarios, low renewable availability and resource shortage are the weakest cases, with F1-score reductions of and , respectively, because both cases increase uncertainty in energy and resource feasibility. In contrast, the high-renewable scenario gives the strongest overall result, with accuracy, F1-score, , the smallest gap of , and a F1-score improvement over E5. This demonstrates that abundant PV supply and stable battery support reduce conflicts among energy feasibility, carbon reduction, and maintenance execution. Overall, the matrix confirms that the best robustness is achieved when renewable-energy availability, graph-based spatial learning, temporal memory, FE-assisted risk, and constraint masking are jointly integrated.
Figure 6.
Component-level AI performance and stress-robustness matrix of the proposed Graph-MAPPO framework.
Table 10 presents the overall engineering, sustainability, feasibility, and learning-performance outcomes of the 20 experimental configurations. The rule-based baseline in E1 achieves an average of , minimum of , gain of years, and reward of , but it also produces relatively high emissions of , low renewable-energy share of , and a violation rate of . This indicates that fixed thresholds cannot effectively coordinate pavement improvement with energy, carbon, budget, and operational constraints. The reward-priority experiments E2–E4 show clear trade-offs among cost, carbon, and renewable-energy objectives. The cost-dominant policy in E2 minimizes expenditure to , but this saving is obtained at the expense of pavement performance, with the lowest average of , minimum of , gain of only years, and the highest emissions of . This demonstrates that aggressive cost control can defer effective maintenance and may increase carbon burden when lower-cost actions do not sufficiently restore pavement condition. In contrast, the carbon-dominant policy in E3 reduces emissions to , while the renewable-energy-dominant policy in E4 increases renewable-energy share to , although neither configuration achieves the balanced pavement, cost, carbon, and feasibility performance of the proposed model. The balanced Graph-MAPPO model in E5 achieves a stronger system-level compromise, improving average to , minimum to , and RSL gain to years, while reducing emissions to , maintaining a renewable-energy share of , limiting violations to , and reaching a reward of .
Table 10.
Overall performance and technical–economic trade-off comparison of the experimental configurations.
The architectural ablation results further confirm the importance of the proposed model components in shaping technical–economic performance. Removing graph attention in E6 reduces the reward to , while using a shallow graph encoder in E7 improves it slightly to . The deeper graph encoder in E8 increases the reward to , average to , and renewable-energy share to , showing the advantage of richer spatial dependency learning for selecting more effective and feasible network-level interventions. Similarly, removing temporal memory in E9 lowers the reward to , whereas strengthening the GRU memory in E10 produces one of the best results, with average of , gain of years, emissions of , violation rate of only , and reward of . The FE-related experiments also demonstrate that structural-risk information improves prioritization: removing FE input in E11 limits the reward to , while strengthening FE priority in E12 increases average to , minimum to , and RSL gain to years.
The constraint-mask experiments highlight the feasibility–performance trade-off. Without constraint masking, E13 achieves an average of and gain of years, but it records the highest violation rate of , higher emissions of , and a reduced reward of . This shows that unconstrained policies may select apparently beneficial maintenance actions that are not financially, energetically, environmentally, or operationally feasible. In contrast, the strict feasibility case in E14 reduces violations to and emissions to , while maintaining a reward of . Although E14 is slightly more conservative than E5 in terms of average and gain, it confirms that stronger feasibility control can reduce violations and emissions without collapsing pavement performance.
The stress-test experiments E15–E20 show how the policy behaves under practical constraints. Low budget in E15 reduces the cost to , but lowers average to , showing that budget savings can restrict treatment intensity. High-budget expansion in E16 improves average to and gain to years, but increases cost to and emissions to , demonstrating that higher spending can improve pavement performance while increasing economic and carbon burdens. Renewable-energy shortage in E17 reduces renewable-energy share to , increases emissions to , and lowers reward to , while the high-renewable scenario in E18 provides the best overall performance, with average of , minimum of , gain of years, the lowest emissions of , the highest renewable-energy share of , violation rate of , and the highest reward of . Therefore, higher renewable-energy availability does not necessarily delay or weaken maintenance actions; rather, when dispatch and constraints are managed properly, it can improve both pavement effectiveness and carbon performance. Resource shortage in E19 reduces reward to due to limited crew/equipment availability, while heavy deterioration in E20 maintains a moderate reward of , showing that the proposed policy remains functional even when traffic loading and deterioration severity increase.
Table 11 reports the pavement-condition and maintenance-effectiveness results relative to the same initial average of . The rule-based baseline in E1 increases the final average only to , corresponding to a modest gain of and an average gain of years, while leaving 9 critical sections and 18 deferred work orders. This indicates that threshold-based decisions tend to favor simple crack-sealing actions and do not sufficiently reduce network-level deterioration. The cost-dominant policy in E2 performs even weaker from a pavement perspective, with the lowest final average of , gain of only , 12 critical sections, and 26 deferred orders. This confirms the technical–economic trade-off observed in Table 10: aggressive cost saving reduces immediate expenditure, but it can also defer needed corrective treatments and weaken pavement-condition improvement.
Table 11.
Pavement condition and maintenance effectiveness results.
The carbon-dominant and renewable-energy-dominant policies in E3 and E4 improve the final average to and , respectively, and reduce critical sections to 8 and 7. However, their dominant treatments remain relatively conservative, mainly microsurfacing or crack sealing, because both configurations prioritize sustainability constraints over aggressive pavement recovery. The proposed balanced Graph-MAPPO model in E5 provides a stronger pavement outcome, increasing the final average to , achieving a gain of , extending by years, reducing critical sections to 3, and lowering deferred orders to 9. This shows that the integrated reward structure enables the policy to select stronger treatments such as thin overlay while still maintaining operational feasibility in Figure 7.
Figure 7.
Temporal energy-source contribution across selected renewable-energy-aware maintenance scenarios.
In Figure 8 the architecture-enhanced configurations demonstrate that spatial, temporal, and structural learning improve maintenance effectiveness. The deep graph encoder in E8 increases the final to , achieves a gain of , and reduces deferred orders to 8, confirming that graph-based spatial dependency learning supports better network-level prioritization. The strong temporal-memory configuration in E10 further increases the final to , achieves a gain of , and reduces the number of critical sections to 2, showing that GRU-based deterioration memory improves long-term intervention timing. The FE-sensitive policy in E12 provides another enhancement, with a final average of , gain of , gain of years, 2 critical sections, and only 7 deferred orders. This demonstrates that amplifying the FE damage score helps the policy prioritize structurally vulnerable sections before surface indicators become severe.
Figure 8.
Carbon-budget-constrained network performance decomposition for the selected E5 balanced policy.
The strict feasibility case in E14 achieves acceptable pavement performance, with final of , gain of , gain of years, and 4 remaining critical sections, but it relies mainly on microsurfacing. This reflects a more conservative treatment strategy imposed by tighter feasibility constraints, where the policy avoids higher-burden interventions when energy, budget, carbon, or operational limits are close to their thresholds. The best pavement result is obtained in E18, where abundant renewable-energy availability enables a greater combination of preventive and overlay measures. This scenario increases the final average to , produces the largest gain of , achieves the highest gain of years, reduces critical sections to 2, and decreases deferred work orders to 6. These results show that renewable-energy availability can directly support maintenance effectiveness by reducing energy-related feasibility conflicts and allowing the policy to execute more beneficial treatments.
The energy, carbon, and budget indicators in Table 12 were calculated using a maintenance-operation accounting boundary. The included carbon sources are material-related embodied CO2 for the selected maintenance treatment, equipment-operation energy demand, grid-electricity emissions, diesel-backup emissions, and PV life-cycle emissions. This boundary is consistent with recent pavement maintenance life-cycle and low-carbon transition studies, in which maintenance-stage emissions are commonly linked to material consumption, equipment operation, fuel use, electricity supply, and construction or maintenance activities [16,18]. Transport-related emissions are represented within the material and equipment-related carbon terms when associated with treatment execution, whereas traffic-delay emissions are not directly included in the reported total CO2 values because a separate traffic-emission submodel was not implemented. Instead, the operational effect of work-zone disruption is represented through the work-zone delay index and delay-related penalty in the decision model. The renewable-energy share was calculated as the ratio of PV-supported and battery-supported energy use to total maintenance energy demand, while grid and diesel contributions were treated as non-renewable support sources. Budget utilization was calculated from accumulated treatment, equipment, and operational costs, following the cost–emission trade-off logic used in recent MRR optimization studies [17]. The additional non-renewable support column reports the share of maintenance energy supplied by non-renewable sources, calculated as , while the CO2 reduction column measures the percentage change in total emissions relative to the rule-based baseline E1.
Table 12.
Energy, carbon, and budget performance of selected experimental configurations with non-renewable support and emission-reduction indicators.
Table 12 evaluates the sustainability and financial behavior of the selected experimental configurations by comparing PV utilization, average battery state of charge, diesel dependence, renewable-energy share, non-renewable support, total carbon emissions, emission reduction relative to the rule-based baseline, budget consumption, and carbon-violation rate. The reported total CO2 values represent the maintenance-operation carbon boundary defined above and therefore include material-related emissions, equipment-operation energy, grid electricity, diesel backup, and PV life-cycle contribution, while excluding direct traffic-delay emissions. The rule-based baseline in E1 uses of PV energy, consumes of diesel, reaches only renewable-energy share, and depends on non-renewable support, producing and a carbon-violation rate of . The cost-dominant policy in E2 gives the weakest environmental outcome, with the lowest PV use of , highest diesel use of , highest non-renewable support of , highest emissions of , and a negative emission reduction of relative to E1. In contrast, E3 and E4 show that prioritizing carbon control or renewable-energy use can reduce emissions and non-renewable dependence, although E4 exceeds the annual budget at , indicating that maximizing renewable-energy use alone may increase operational expenditure.
Figure 9 illustrate the proposed balanced model in E5 provides a stronger trade-off across the accounting indicators, using of PV energy, maintaining average battery SOC, reducing diesel use to , achieving renewable-energy share, limiting non-renewable support to , reducing emissions to , achieving a CO2 reduction relative to E1, and keeping carbon violations below . E14 gives the lowest carbon-violation rate of and a CO2 reduction, but with more conservative budget use of . Under low-renewable stress, E17 confirms the sensitivity of the framework to PV shortage, with PV use falling to , diesel use increasing to , non-renewable support rising to , and emissions reaching . The best sustainability outcome occurs in E18, where high renewable-energy availability increases PV use to , raises renewable-energy share to , limits non-renewable support to , reduces emissions to , and achieves the highest CO2 reduction of . Overall, these results show that the Graph-MAPPO framework performs best when renewable-energy availability, battery storage, carbon constraints, and budget feasibility are jointly optimized, and the findings should be interpreted within the defined maintenance-operation accounting boundary rather than as a full network-level life-cycle assessment including direct traffic-delay emissions.
Figure 9.
Maintenance work-zone scheduling timeline across selected experimental scenarios.
Table 13 presents the ablation analysis used to quantify the contribution of the main Graph-MAPPO components, including graph attention, temporal memory, FE-assisted structural input, and constraint-aware action masking. The full proposed model in E5 achieves a strong reference performance, with an average reward of , average of , renewable-energy share of , and violation rate of only , confirming that the integrated GAT-GRU-FE-mask structure provides a balanced policy for pavement performance, energy utilization, and feasibility control. Removing the graph attention mechanism in E6 reduces the average reward to , average to , and renewable-energy share to , while increasing violations to , which indicates that eliminating spatial dependency learning weakens the model’s ability to coordinate maintenance among connected pavement sections. The shallow graph encoder in E7 partially recovers the performance with reward of 0.80, of 76.1 and violation rate of 3.2% but still worse than the complete model because a single block of GAT with two heads cannot capture the interaction of the full multi-hop network with its embedding. Conversely, a deep graph encoder in E8 increases the reward to 0.87, average to 79.1, renewable share to 75.2% and violation rate to 1.7%, indicating that increasing graph capacity leads to a better spatial maintenance prioritization. There is a similar pattern in the temporal-memory experiments: the weaker configuration with GRU-128 and an 8-week window (E10) provides the weakest results, with reward of 0.88, of 79.4, renewable share of 75.9 percentage, and violation rate of 1.5 percentage. This confirms the fact that the long-term history of deterioration, the history of previous interventions, and time-varying energy availability are the invaluable elements that can be used to obtain stable long-term maintenance decisions. The near-miss of the FE-linked ablation also demonstrates the importance of structural-risk information: by expressly representing the hidden damage, the structurally vulnerable bits are better prioritized. Last but not the least is the constraint-mask results which are particularly important that the removing of the feasibility mask in E13 produces the lowest reward of 0.69 and highest violation rate of 12.6 percent despite the maintenance of an average of 77.1. By comparison, the strict feasibility configuration in E14 imposes restrictions on violations to just : imply 0.88/0.89) and maintains a strong reward, albeit with a conservative filtering that slightly reduces compared with the deeper graph and temporal-memory versions. The results of the ablation in the figure illustrated in Figure 10 confirm that the highest policy behavior is achieved when spatial graph encoding, temporal deterioration memory, FE-assisted structural prioritization and feasibility masking are simultaneously involved.
Table 13.
Ablation analysis of the main Graph-MAPPO components.
Figure 10.
Architecture of the Proposed Graph-MAPPO Controller with Spatial Graph Attention, Temporal State Encoding, Constraint-Aware Action Masking, and Centralized Critic Evaluation.
Table 14 shows how the selected maintenance-treatment distribution changes under representative experimental configurations, revealing the decision behavior of each policy beyond aggregate performance metrics. The rule-based baseline in E1 selects 426 do-nothing actions, 318 crack-sealing actions, 211 microsurfacing actions, 136 thin overlays, and 48 rehabilitation actions from 1139 total decisions, indicating a threshold-driven strategy that relies heavily on low- to medium-intensity treatments. The cost-dominant policy in E2 shifts the distribution toward conservative decisions, with the highest number of do-nothing actions among the selected scenarios , the lowest number of thin overlays , and only 22 rehabilitation actions, confirming that prioritizing cost reduction suppresses expensive but structurally effective interventions. In contrast, the carbon-dominant and renewable-energy-dominant configurations in E3 and E4 increase preventive and medium-intensity treatments, where E3 selects 224 microsurfacing actions and E4 selects 372 crack-sealing and 246 microsurfacing actions, reflecting a preference for treatments that improve pavement condition while avoiding the high energy and carbon burden of rehabilitation. The proposed balanced model in E5 produces a more diversified and intervention-effective treatment mix, reducing do-nothing actions to 318 while increasing microsurfacing to 284 and thin overlay to 196, which explains its stronger and improvement compared with E1–E4. Under strict feasibility control in E14, the model selects 352 do-nothing actions, 364 crack-sealing actions, 276 microsurfacing actions, 151 thin overlays, and only 28 rehabilitation actions, showing that tighter budget, carbon, and energy feasibility rules shift the policy toward lower-risk treatments. The low-budget and resource-shortage stress cases in E15 and E19 further confirm this pattern: E15 increases do-nothing actions to 471 and reduces rehabilitation to 18, while E19 increases do-nothing actions to 489, limits thin overlays to 78, and reduces rehabilitation to only 16, demonstrating that financial and crew/equipment constraints strongly restrict major interventions. The high-renewable scenario in E18 enables the most active and balanced maintenance strategy, with only 284 do-nothing actions, 384 crack-sealing actions, 302 microsurfacing actions, 214 thin overlays, and 51 rehabilitation actions across 1235 total decisions, indicating that abundant PV supply and stable battery availability allow the policy to execute more preventive and corrective maintenance while maintaining sustainability. Finally, the heavy-deterioration scenario in E20 shifts the treatment mix toward stronger interventions, with 248 thin overlays and 73 rehabilitation actions, the highest rehabilitation count among all selected configurations, which is consistent with the imposed increase in AADT, truck share, deterioration rate, and PCI degradation. The Figure 11 treatment-distribution results confirm that the Graph-MAPPO policy does not simply maximize maintenance frequency; instead, it adapts the treatment mix according to budget, carbon, renewable-energy availability, structural deterioration, and resource constraints.
Table 14.
Distribution of selected maintenance treatments under representative experimental configurations.
Figure 11.
Pavement condition-state transitions across selected experimental scenarios.
Renewable-Energy and Resource-Management Implications
The proposed framework should be interpreted not only as an AI-based pavement maintenance optimizer, but also as a resource-management decision-support system for low-carbon infrastructure maintenance. In practical pavement management, a technically suitable intervention may still be infeasible if the required energy supply, battery capacity, maintenance budget, crew availability, equipment resources, material stocks, work-zone capacity, or carbon allowance is insufficient. Therefore, the value of the proposed framework lies in evaluating maintenance decisions under coupled pavement, renewable-energy, financial, carbon, and operational-resource constraints. This perspective is essential because pavement interventions consume several resources simultaneously, including renewable electricity, grid support, diesel backup, asphalt materials, sealants, aggregates, maintenance crews, heavy equipment, work-zone space, and available budget.
Table 15 summarizes the main renewable-energy and resource-oriented results used to interpret the proposed framework from a broader resource-management perspective. The emulated maintenance-energy state includes 145 kWh/day of photovoltaic output, 64% battery state of charge, 31 kWh/day grid draw, diesel backup in standby mode, and a PV + Battery operating mode with a renewable-energy share of 71.0%. The treatment-level resource parameters also show large differences in resource demand: crack sealing requires 120 kWh/km, 8500 USD/km, and 900 kgCO2e/km, whereas rehabilitation requires 3500 kWh/km, 180,000 USD/km, and 18,500 kgCO2e/km. These values demonstrate that maintenance treatment selection is not only a pavement-condition decision, but also an energy, cost, carbon, material, crew, and equipment allocation problem.
Table 15.
Renewable-energy and resource-oriented results of the proposed pavement maintenance framework.
The balanced Graph-MAPPO policy demonstrates that resource-aware decision-making can improve pavement condition while maintaining feasibility under multiple resource constraints. The policy improves the average from 69.4 to 78.9, corresponding to an average gain of +9.5, and achieves an gain of 6.8 years. At the same time, it maintains a renewable-energy share of 74.6%, limits total CO2 emissions to 58.3 tCO2e, and achieves a constraint-violation rate of only 1.8%. These results indicate that the proposed policy does not simply maximize pavement-condition improvement; rather, it identifies maintenance actions that provide service-life benefits while respecting the available energy, budget, carbon, crew, equipment, material, and work-zone resources. The low violation rate also confirms that the constraint-aware action-masking mechanism helps reduce infeasible decisions that would otherwise exceed resource or operational limits.
The high renewable-energy scenario further clarifies the resource implications of the proposed framework. Under higher renewable-energy availability, the renewable-energy share increases from 74.6% to 84.6%, while total CO2 emissions decrease from 58.3 tCO2e to 50.8 tCO2e. The average also reaches 80.2, representing a +10.8 improvement relative to the initial average of 69.4, and the overall policy reward reaches 0.90. These findings show that renewable energy is not only an environmental indicator, but also an operational resource that can improve maintenance feasibility, reduce dependence on grid electricity and diesel backup, and support better pavement-performance outcomes. Overall, the framework addresses the resource-management perspective by coordinating renewable-energy use, battery storage, grid/diesel backup, budget availability, carbon limits, material resources, crew/equipment capacity, work-zone constraints, and pavement service-life preservation within one integrated decision environment.
Figure 12 provides a treatment-level interpretation of the resource burden associated with the proposed pavement maintenance framework by linking normalized resource demand to pavement benefit. In Panel (a), the normalized resource-burden index combines energy demand, treatment cost, and CO2 emissions, while the normalized pavement-benefit index combines gain and gain. The results show a clear escalation in resource intensity from preventive to major corrective actions. Crack sealing represents the lowest-resource intervention, requiring only 120 kWh/km, 8.5 kUSD/km, and 900 kgCO2e/km, but it also provides the lowest benefit. Microsurfacing increases the resource requirement to 420 kWh/km, 22.6 kUSD/km, and 2800 kgCO2e/km, indicating a moderate preservation option. Thin overlay requires substantially higher resources, with 1300 kWh/km, 74.0 kUSD/km, and 7200 kgCO2e/km, but it achieves a stronger pavement-recovery effect. Rehabilitation is positioned at the highest end of the envelope, requiring 3500 kWh/km, 180.0 kUSD/km, and 18,500 kgCO2e/km, confirming that it provides the largest recovery potential but also imposes the highest energy, financial, and carbon burden. Panel (b) further clarifies the efficiency of each treatment relative to the fitted resource-burden envelope. Crack sealing shows a negative deviation of −35.7%, suggesting that although it is resource-light, its pavement benefit per normalized resource unit is relatively limited. Microsurfacing shows a positive deviation of +7.6%, indicating a more balanced preservation effect. Thin overlay has the strongest positive deviation of +19.9%, meaning that it provides the most favorable balance between resource consumption and pavement benefit among the evaluated treatments. In contrast, rehabilitation shows a slight negative deviation of −3.9%, reflecting that its high recovery value is accompanied by a very high resource burden. Overall, the figure confirms that maintenance planning should not be based only on or improvement, but should also account for the combined energy, cost, carbon, and service-life tradeoffs associated with each intervention.
Figure 12.
Resource-burden envelope and efficiency deviation of maintenance treatments under energy-demand, cost, carbon-emission, -gain, and -gain considerations.
Table 16 provides a methodological comparison between the proposed Graph-MAPPO framework and recent optimization- and reinforcement-learning-based pavement maintenance studies. The comparison indicates that existing approaches have contributed important advances in specific aspects of pavement maintenance optimization, but they generally address narrower decision settings. For example, Chiou [21] combined MILP and genetic algorithms to improve road-maintenance strategy selection under and budget constraints, achieving moderate gains and resource savings the model did not represent renewable-energy scheduling, battery/grid/diesel energy modes, carbon limits, or crew/equipment feasibility. Similarly, Chowdhury and Guler [17] incorporated greenhouse-gas emissions into multi-objective MRR scheduling, but the optimization remained focused mainly on cost–emission trade-offs rather than real-time renewable-energy allocation and multi-agent operational control. Reinforcement-learning-based methods, such as the PPO and Q-learning framework of Li et al. [22] and the Q-learning-based sustainable maintenance model of Molinero-Pérez et al. [15], provide stronger adaptability than static optimization models, yet they do not explicitly encode road-network graph dependencies, decentralized pavement-section interactions, energy-source selection, or simultaneous crew/equipment assignment. The multi-agent reinforcement learning model of Yao et al. [2] is closer to the present work because it considers interdependent pavement networks and reports cost and performance improvements; nevertheless, it does not jointly model renewable-energy availability, battery SOC, grid/diesel support, carbon allowance, budget consumption, and operational-resource feasibility. In contrast, the proposed Graph-MAPPO framework integrates graph attention, temporal memory, FE-informed structural-risk indicators, centralized critic learning, decentralized action heads, and constraint-aware masking within one pavement–energy–carbon simulation environment. Therefore, its advantage is not limited to improving pavement condition, but lies in coordinating treatment selection, intervention timing, energy mode, budget use, carbon control, and resource feasibility under network-level dependencies.
Table 16.
Comparison between the proposed Graph-MAPPO framework and recent published optimization/RL-based pavement maintenance baselines.
5. Conclusions and Future Work
This study introduced a simulation-based renewable-energy-aware framework for network-level pavement maintenance planning under budget, carbon, energy, crew, equipment, and operational constraints. The proposed approach integrates an AnyLogic maintenance-energy simulation environment with a Graph-MAPPO decision model that combines graph attention, temporal GRU memory, finite-element-assisted structural-risk indicators, actor-critic learning, and constraint-aware action masking. Unlike conventional threshold-based pavement management, the framework jointly determines the pavement section, treatment type, intervention timing, crew, equipment, and energy-source mode while considering pavement condition improvement, remaining service-life extension, cost, emissions, renewable-energy utilization, and feasibility. Because the evaluation was conducted using generated/calibrated datasets and a controlled AnyLogic simulation environment, the reported results should be interpreted as simulation-based evidence of the framework’s potential rather than as direct validation of general field applicability. The results showed that the balanced Graph-MAPPO model improved the average from to , achieved an gain of years, reduced emissions to , maintained a renewable-energy share of , and limited constraint violations to . The high-renewable-energy scenario achieved the best overall simulated performance, with an average of , renewable-energy share of , emissions of , and reward of . These findings suggest that, under the assumed simulation conditions, combining pavement-energy simulation, structural-risk awareness, renewable-energy scheduling, and multi-agent reinforcement learning can support more adaptive, low-carbon, and operationally feasible pavement maintenance policies. However, the framework should be regarded as a proof-of-concept decision-support approach until it is validated using field data from real pavement networks and agency maintenance operations. Future work should therefore prioritize external validation using real pavement management databases, field-measured traffic and distress records, agency maintenance histories, actual treatment costs, observed work-zone durations, measured PV/battery operation data, and real budget and carbon constraints. Such validation would allow the calibrated simulation assumptions, energy-dispatch rules, deterioration patterns, and maintenance-policy outputs to be compared against real engineering practice. Additional extensions may include multi-city deployment, uncertainty-aware deterioration modeling, real-time digital-twin integration, life-cycle assessment, explainable reinforcement learning, and coupling with connected-vehicle data for dynamic work-zone and maintenance scheduling. Future studies should also examine how the proposed policy performs under different climatic regions, pavement-material systems, electricity-grid carbon intensities, renewable-energy capacities, and agency-specific maintenance standards before broader practical implementation is recommended.
Author Contributions
Conceptualization, N.L. and M.Q.A.-J.; methodology, N.L., M.Q.A.-J. and M.A.; software, M.A. and A.A.; validation, M.Q.A.-J., M.A., A.A. and S.A.A.; formal analysis, N.L., M.Q.A.-J. and M.A.; investigation, N.L. and M.Q.A.-J.; resources, N.L., M.Q.A.-J. and S.A.A.; data curation, M.A. and A.A.; writing—original draft preparation, N.L., M.Q.A.-J. and M.A.; writing—review and editing, N.L., M.Q.A.-J., M.A., A.A. and S.A.A.; visualization, M.A. and A.A.; supervision, N.L. and M.Q.A.-J.; project administration, N.L. and M.Q.A.-J.; funding acquisition, N.L. All authors have read and agreed to the published version of the manuscript.
Funding
This research was supported and funded by Al-Ahliyya University, Amman, Jordan.
Data Availability Statement
The generated dataset in this study is available upon responsible requests from the corresponding author.
Acknowledgments
The authors gratefully acknowledge the institutional support provided by Al Ahliyya University, which contributed to the successful completion of this research work.
Conflicts of Interest
The authors declare no competing interests.
References
- Xu, X.; Wang, S.; Du, Z.; Rong, H.; Li, Q.; Wu, T.; Li, S.; Zheng, J. Sustainable Pavement Maintenance and Rehabilitation Planning Using the Quantum Cognitive Trust Network. Dev. Built Environ. 2024, 20, 100553. [Google Scholar] [CrossRef] [Scilit]
- Yao, L.; Leng, Z.; Jiang, J.; Ni, F. A Multi-Agent Reinforcement Learning Model for Maintenance Optimization of Interdependent Highway Pavement Networks. Comput.-Aided Civ. Infrastruct. Eng. 2024, 39, 2951–2970. [Google Scholar] [CrossRef] [Scilit]
- Chong, D.; Liao, P.; Fu, W. Multi-Objective Optimization for Sustainable Pavement Maintenance Decision Making by Integrating Pavement Image Segmentation and TOPSIS Methods. Sustainability 2024, 16, 1257. [Google Scholar] [CrossRef] [Scilit]
- Li, H.; Zhang, M.; AzariJafari, H.; Kirchain, R. Advancing Smart and Sustainable Road Construction and Maintenance through Life-Cycle Optimisation of Concrete Pavements. Intell. Transp. Infrastruct. 2025, 4, liaf029. [Google Scholar] [CrossRef] [Scilit]
- Topu, M.M.; Anik, M.A.; Wasi, A.T.; Ahsan, M.M. Digital Twin-Driven Pavement Health Monitoring and Maintenance Optimization Using Graph Neural Networks. arXiv 2025, arXiv:2511.02957. [Google Scholar]
- Kazemeini, A.; Swei, O. Identifying Environmentally Sustainable Pavement Management Strategies via Deep Reinforcement Learning. J. Clean. Prod. 2023, 390, 136124. [Google Scholar] [CrossRef] [Scilit]
- Conde Morales, D. Monitoring of Road Construction Sites Based on Computer Vision with Photogrammetry and Deep Learning. Ph.D. Dissertation, Universidade de Vigo, Vigo, Spain, 2025. [Google Scholar]
- Xin, J.; Frangopol, D.M.; Akiyama, M.; Zhang, L.; Pei, J. Life-Cycle Performance, Design, Maintenance, Optimization, and Decision-Making of Asphalt Pavement under Uncertainty: A Review. Struct. Infrastruct. Eng. 2026, 22, 358–386. [Google Scholar]
- Zhou, Q.; Al-Qadi, I.L. Graph Neural Networks to Simulate Flexible Pavement Responses Using Three-Dimensional Finite Element Analysis Data. Transp. Res. Rec. 2024, 2678, 1111–1127. [Google Scholar] [CrossRef] [Scilit]
- Torres-Machi, C.; Pellicer, E.; Yepes, V.; Chamorro, A. Towards a Sustainable Optimization of Pavement Maintenance Programs under Budgetary Restrictions. J. Clean. Prod. 2017, 148, 90–102. [Google Scholar] [CrossRef] [Scilit]
- Yu, H.; Zhang, X.; Chen, Q.; Lu, G.; Tan, Z. Carbon Emission Assessment in Asphalt Pavement Maintenance: A Comparative Study of Five Methods. Case Stud. Constr. Mater. 2025, 22, e04668. [Google Scholar] [CrossRef] [Scilit]
- Ashqar, H.I.; Issa, A.; Masri, S. A software for predicting Pavement Condition Index (PCI) using machine learning for practical decision-making with an exclusion approach. SoftwareX 2025, 31, 102304. [Google Scholar] [CrossRef] [Scilit]
- van Aggelen, M.; De Schutter, B. Optimal condition-based maintenance of asphalt-concrete pavement systems. Road. Mater. Pavement Des. 2026, 27, 833–858. [Google Scholar] [CrossRef] [Scilit]
- Cai, W.; Du, Y.; Wu, D.; Weng, Z.; Liu, C. Engineering-adaptive pavement maintenance decision-making model: A reinforcement learning approach from expert feedback. IEEE Trans. Intell. Transp. Syst. 2025, 26, 10865–10880. [Google Scholar] [CrossRef] [Scilit]
- Molinero-Pérez, N.; Sanz-Benlloch, A.; Montalbán-Domingo, L.; García-Segura, T. Sustainable pavement maintenance using reinforcement learning with systematic reward design. Int. J. Pavement Eng. 2026, 27, 2646637. [Google Scholar] [CrossRef] [Scilit]
- Zhang, L.; Tian, W.; Wang, B.; Dai, X. Dynamic life cycle assessment of low-carbon transition in asphalt pavement maintenance: A multi-scale case study under China’s dual-carbon target. Sustainability 2025, 17, 6540. [Google Scholar] [CrossRef] [Scilit]
- Chowdhury, L.F.; Guler, S.I. Multi-objective optimization of maintenance, repair, and rehabilitation schedule for pavements in urban networks considering greenhouse gas emissions. Struct. Infrastruct. Eng. 2025, 1–15. [Google Scholar] [CrossRef] [Scilit]
- Das, B.P.; Deka, S.; Dettenborn, T.; Bordoloi, S. Feasibility of machine learning application in pavement life cycle assessment: A review. Renew. Sustain. Energy Rev. 2026, 231, 116757. [Google Scholar] [CrossRef] [Scilit]
- Hussain, Z.; Wang, X.; Riaz, I.; Lin, Z.; Nie, W.; Lin, Y.; Tao, C.; Huang, Y. Experimental and multi-scale simulation evaluation of nanoclay/nanosilica epoxy coatings for enhanced corrosion protection of structural steel. Corros. Sci. 2026, 260, 113574. [Google Scholar] [CrossRef] [Scilit]
- Akbar, M.; Zar, A.; Qing, W.; Masood, S.; Salmi, A.; Ghazouani, N.; Aljuaid, N.S. Data-driven XGBoost framework for predicting multi-age mechanical properties of sustainable concrete using 900 experimental specimens. Structures 2026, 88, 111805. [Google Scholar] [CrossRef] [Scilit]
- Chiou, Y.-S.; Ho, M.-C.; Song, P.-Y.; Lin, J.-D.; Lu, S.-H.; Ke, C.-Y. A study on the application of genetic algorithms to the optimization of road maintenance strategies. Appl. Sci. 2025, 15, 10094. [Google Scholar] [CrossRef] [Scilit]
- Li, H.; Wang, S.; Pan, J.; Shan, F.; Jiang, Y.; Zhang, H.; Dai, Z.; Shi, Q. Research on pavement maintenance planning using reinforcement learning. Intell. Transp. Infrastruct. 2024, 3, liaf001. [Google Scholar] [CrossRef] [Scilit]
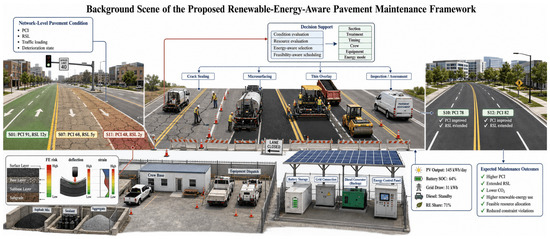
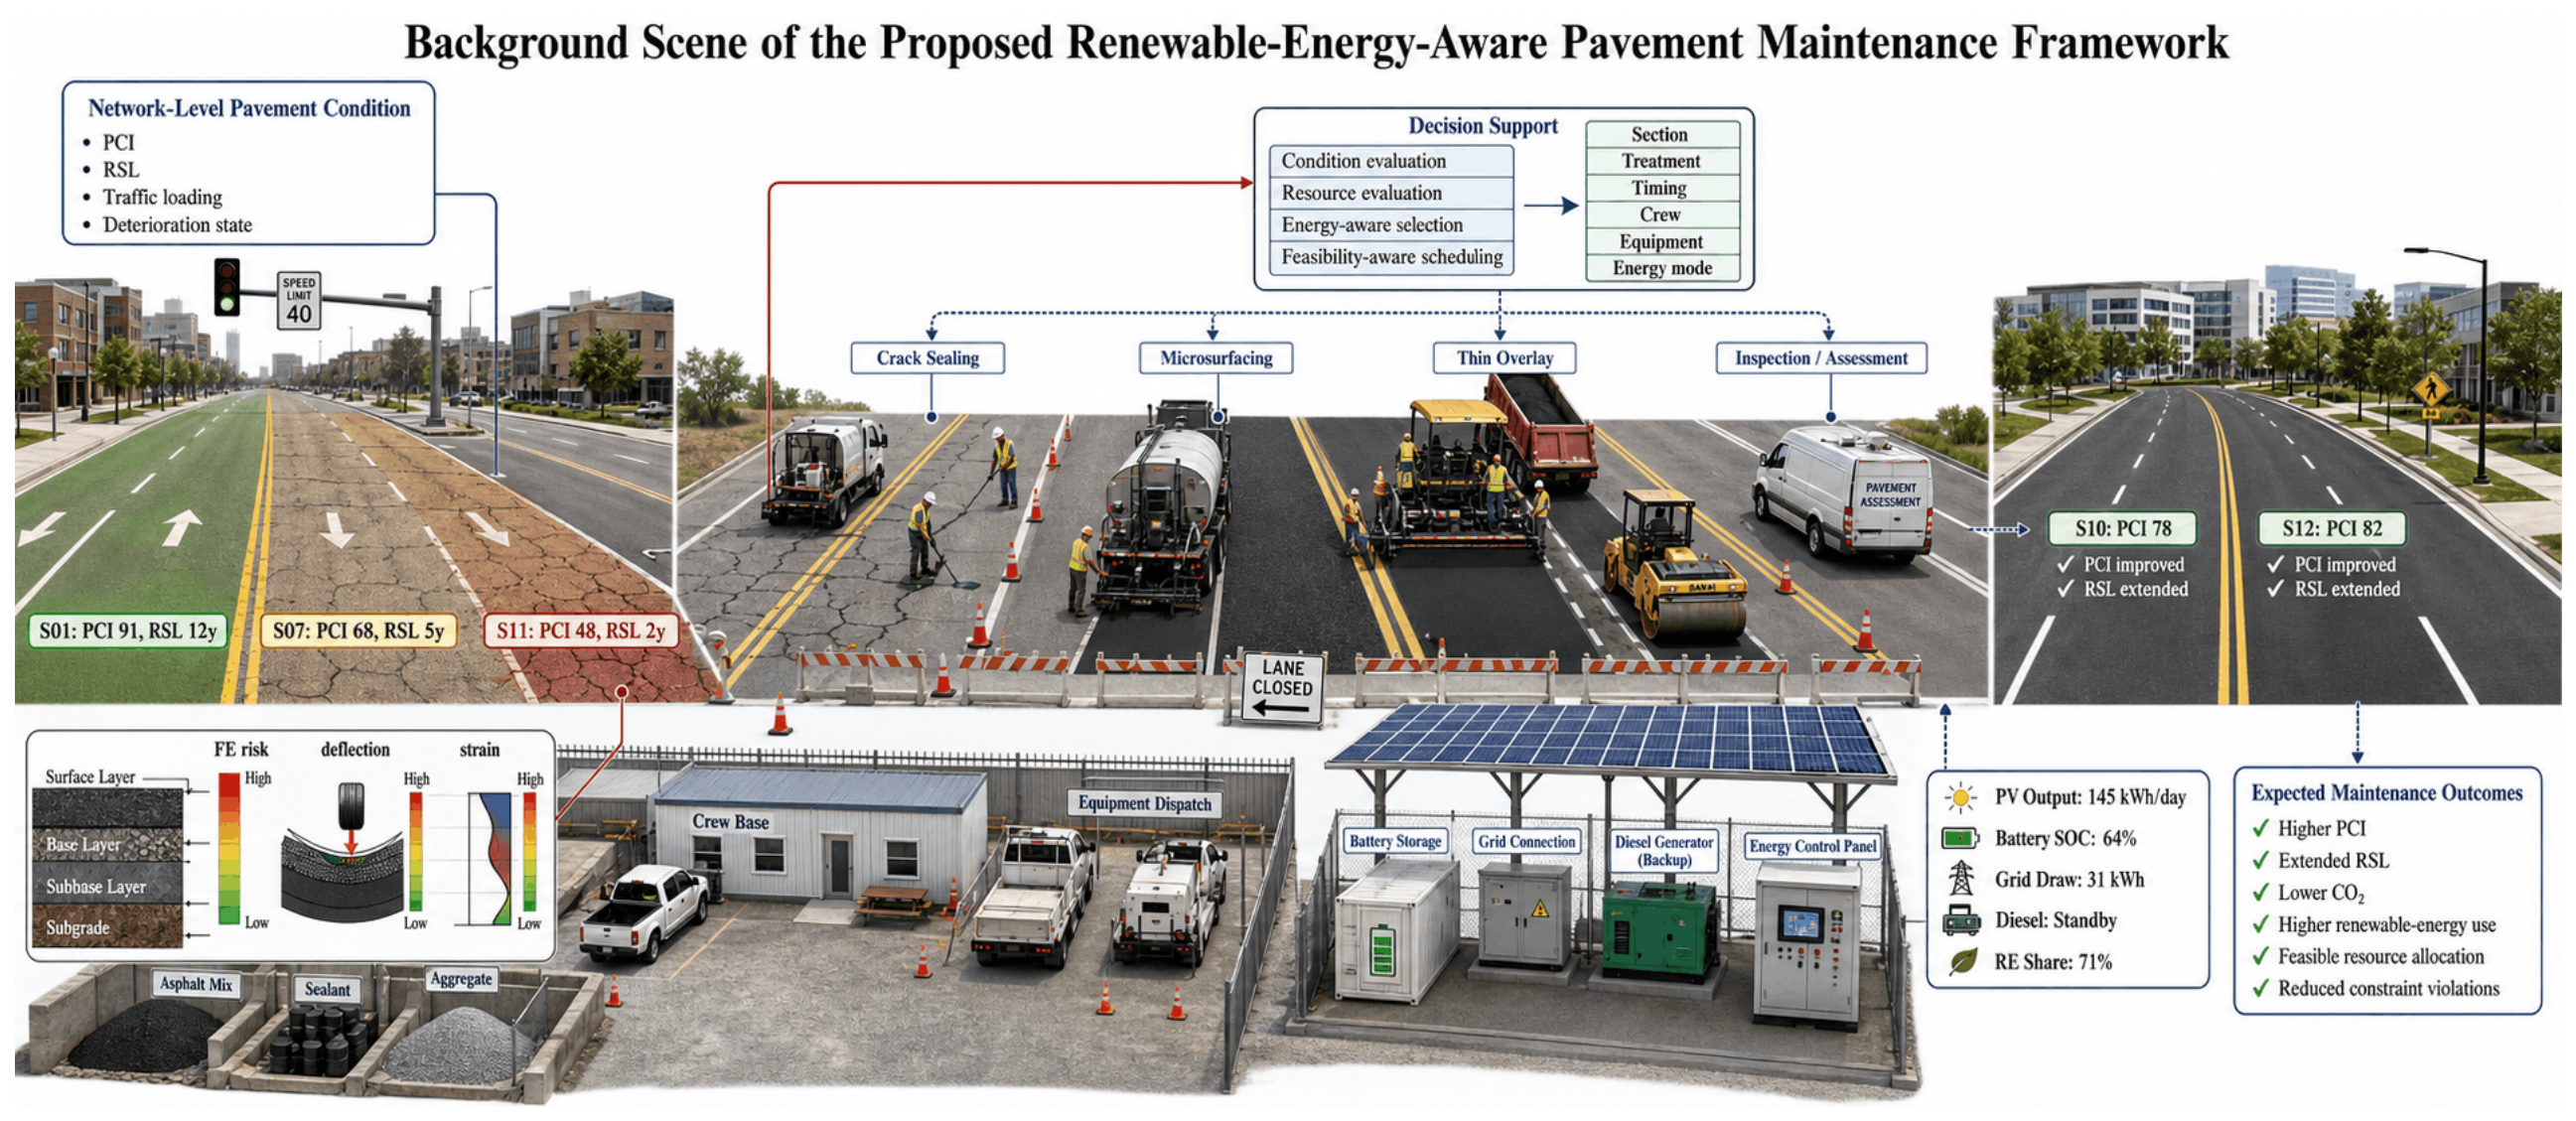
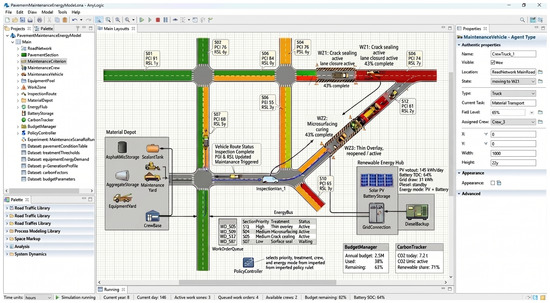
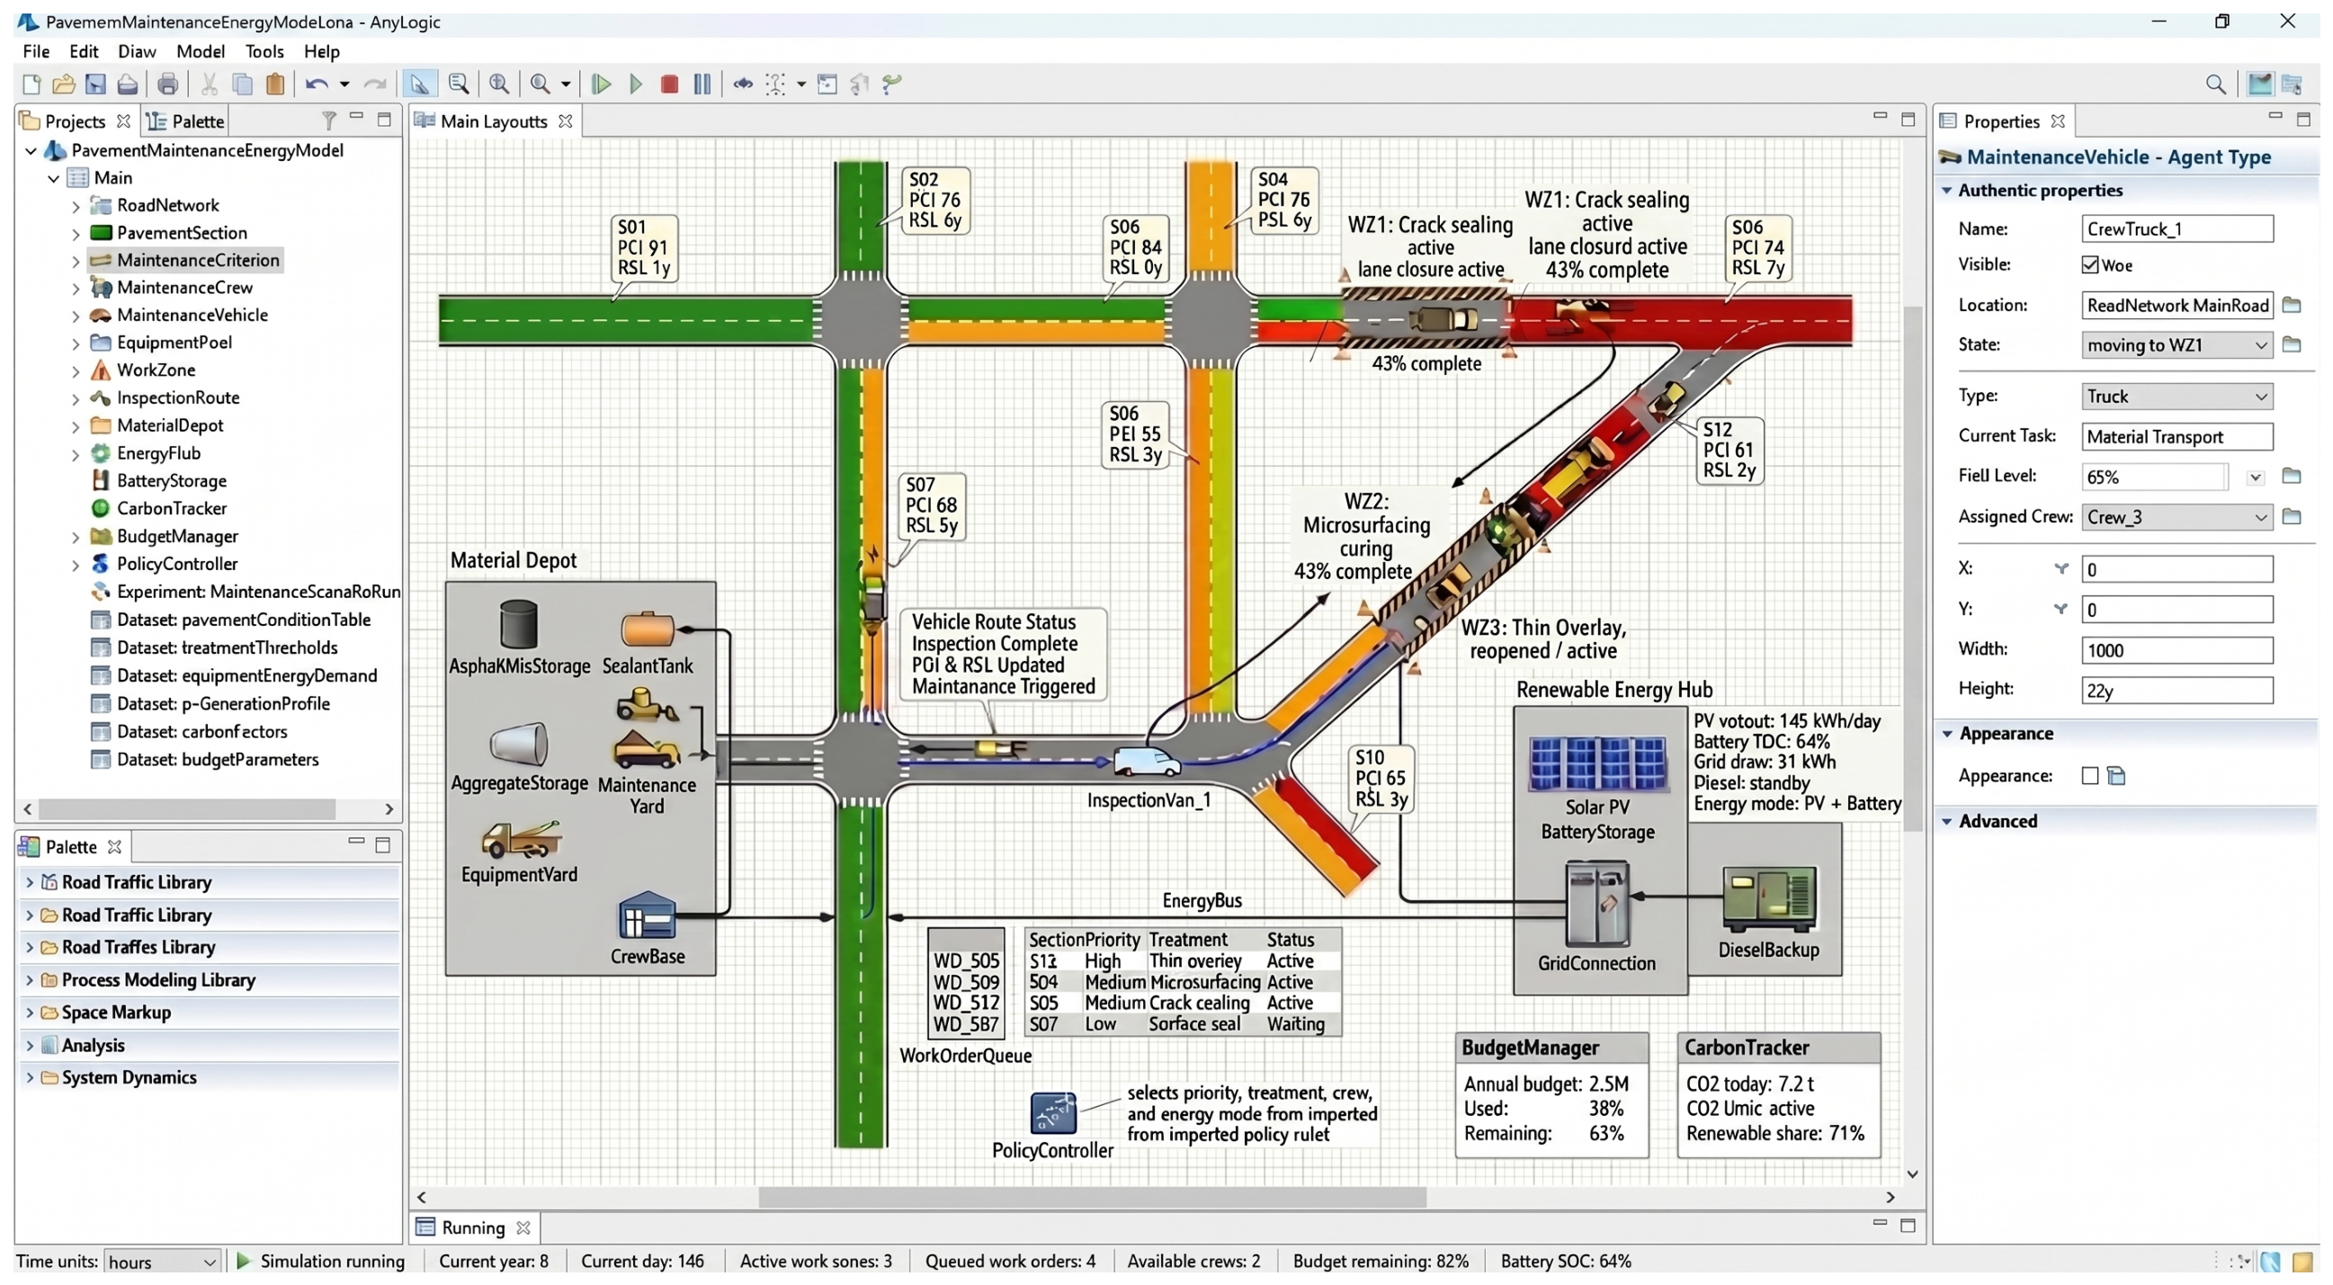
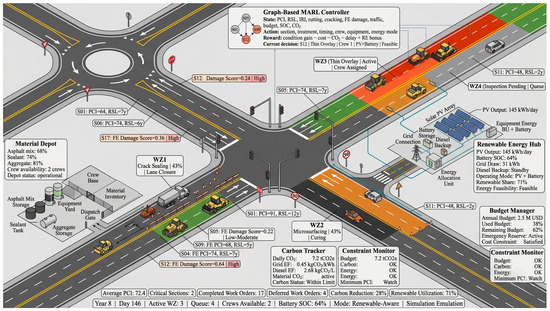
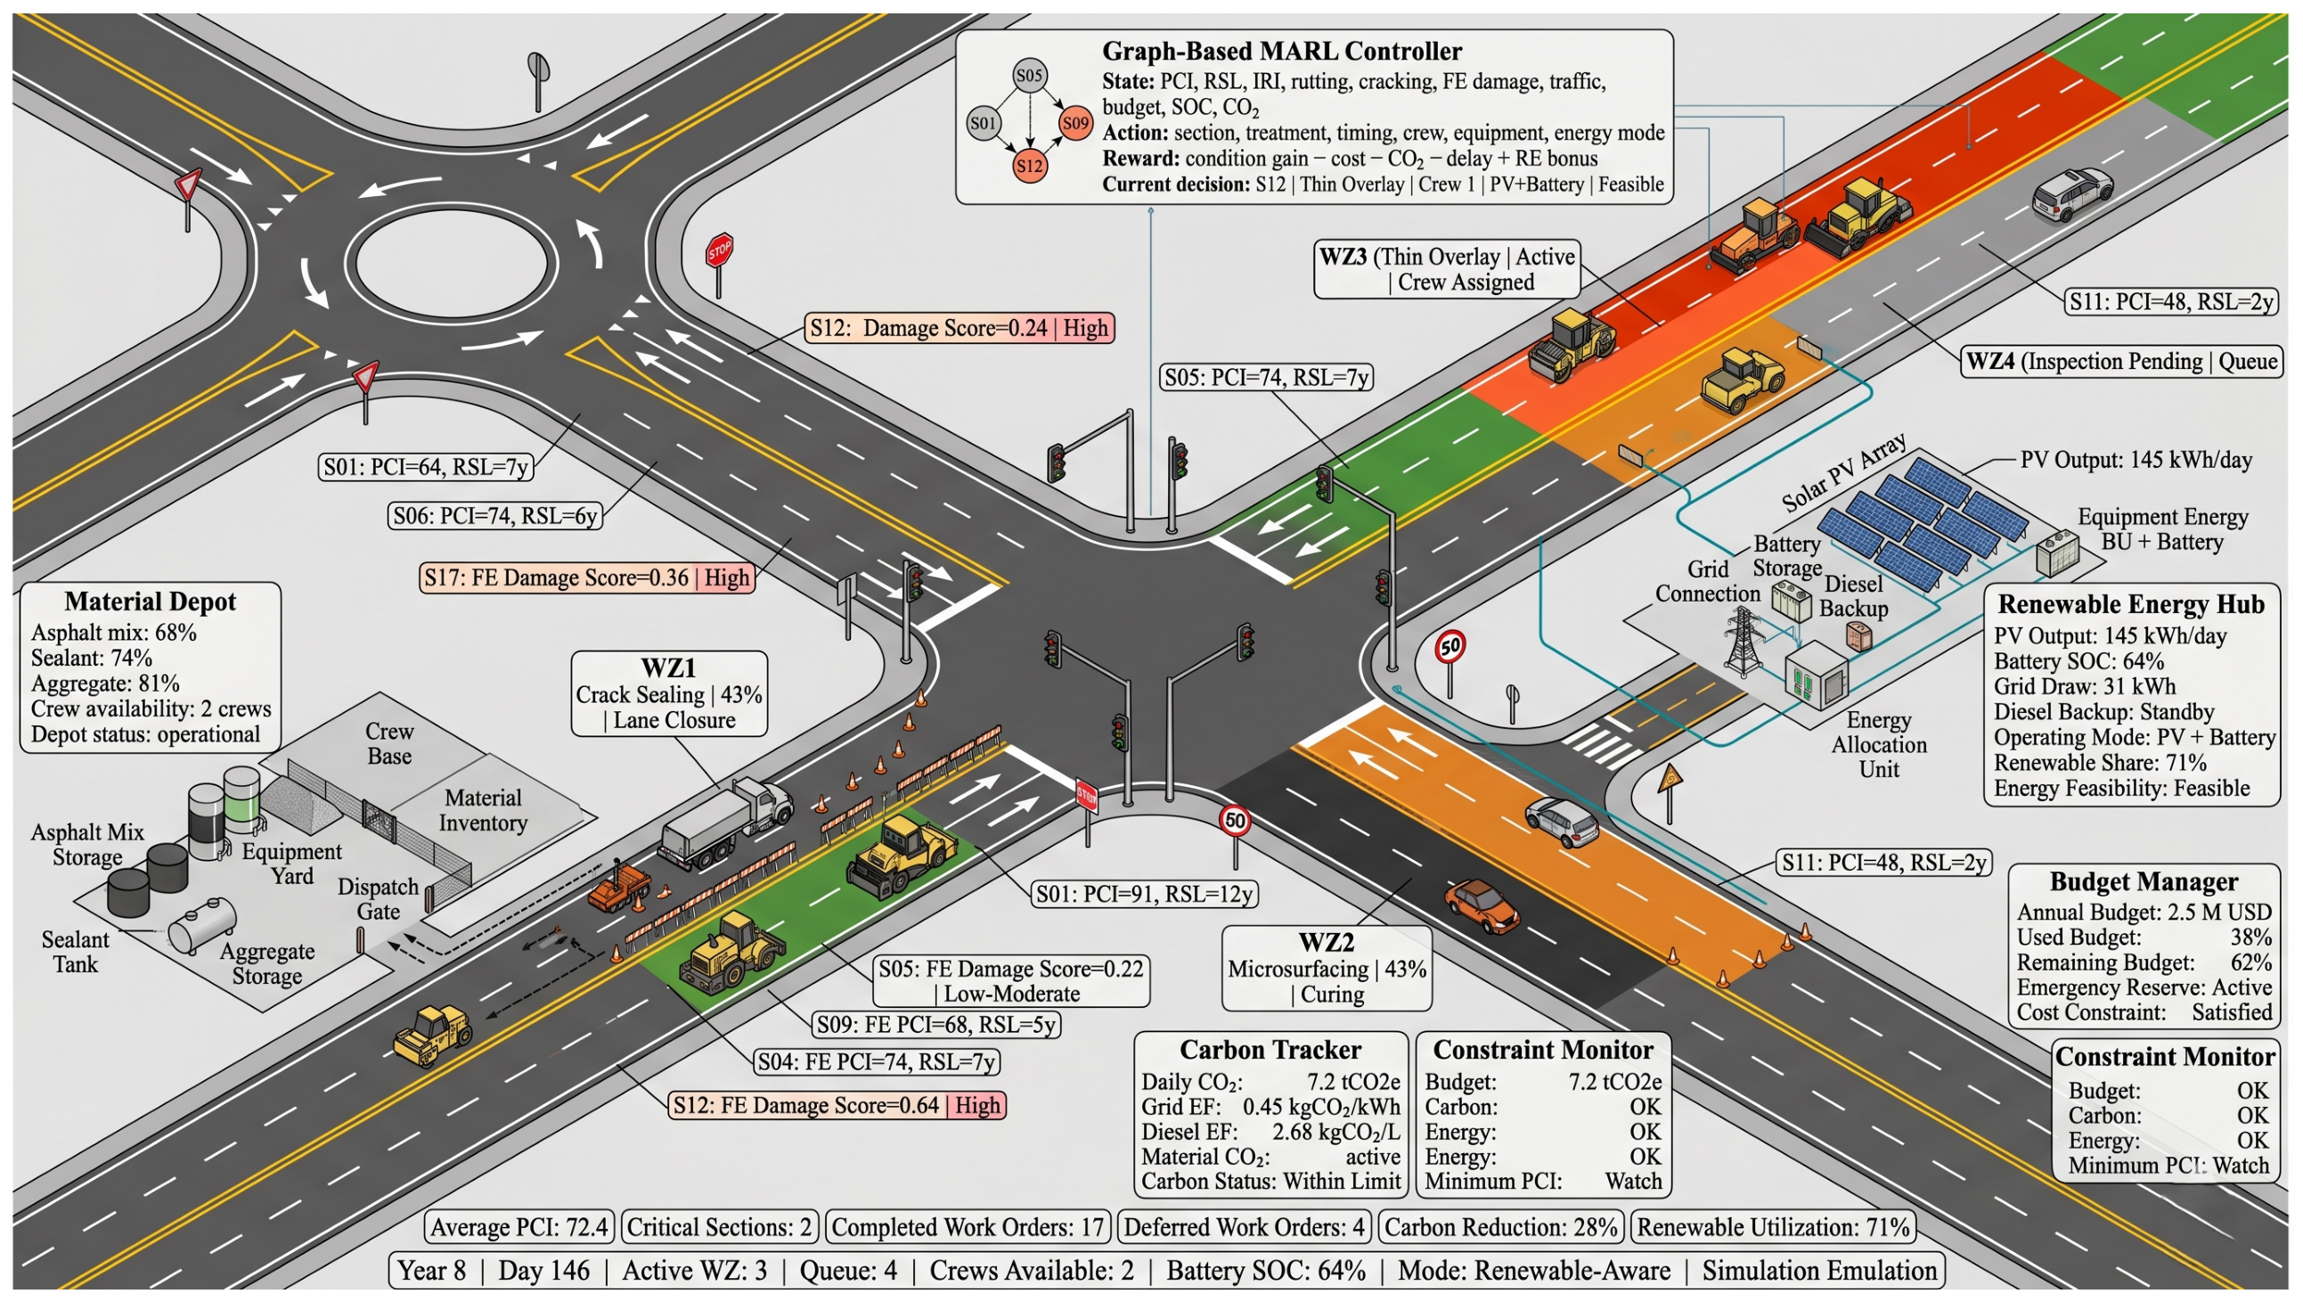
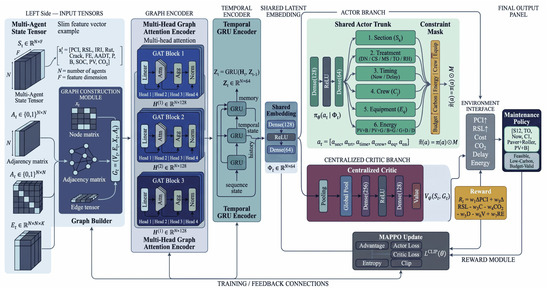
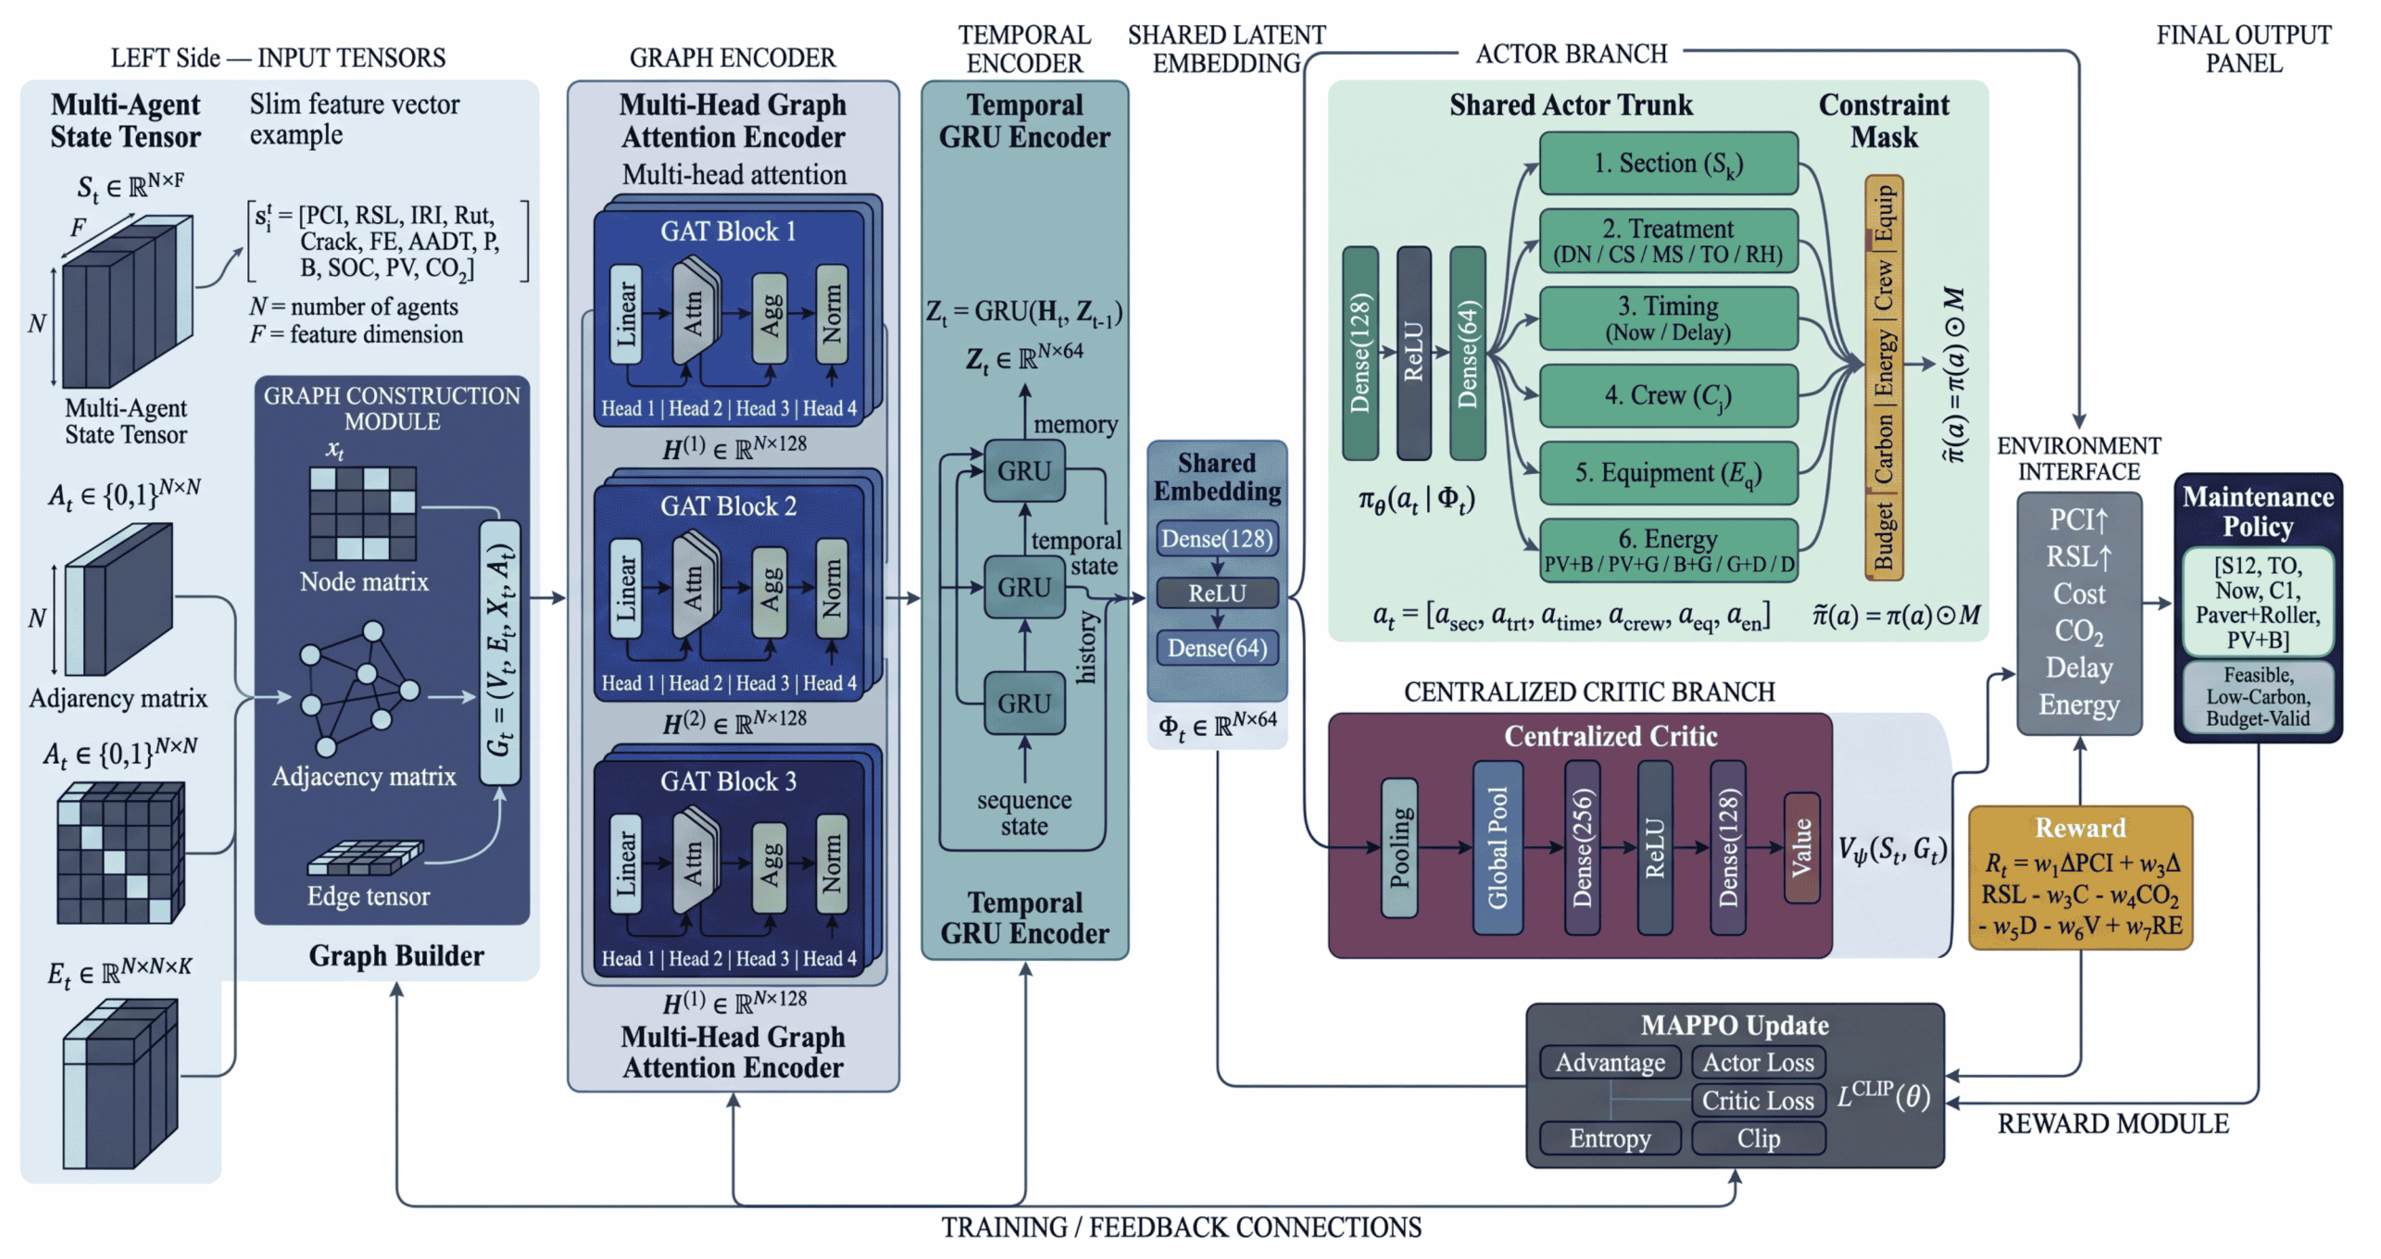
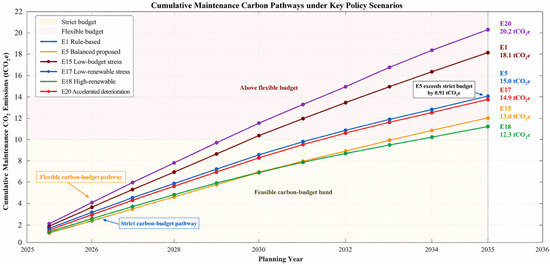
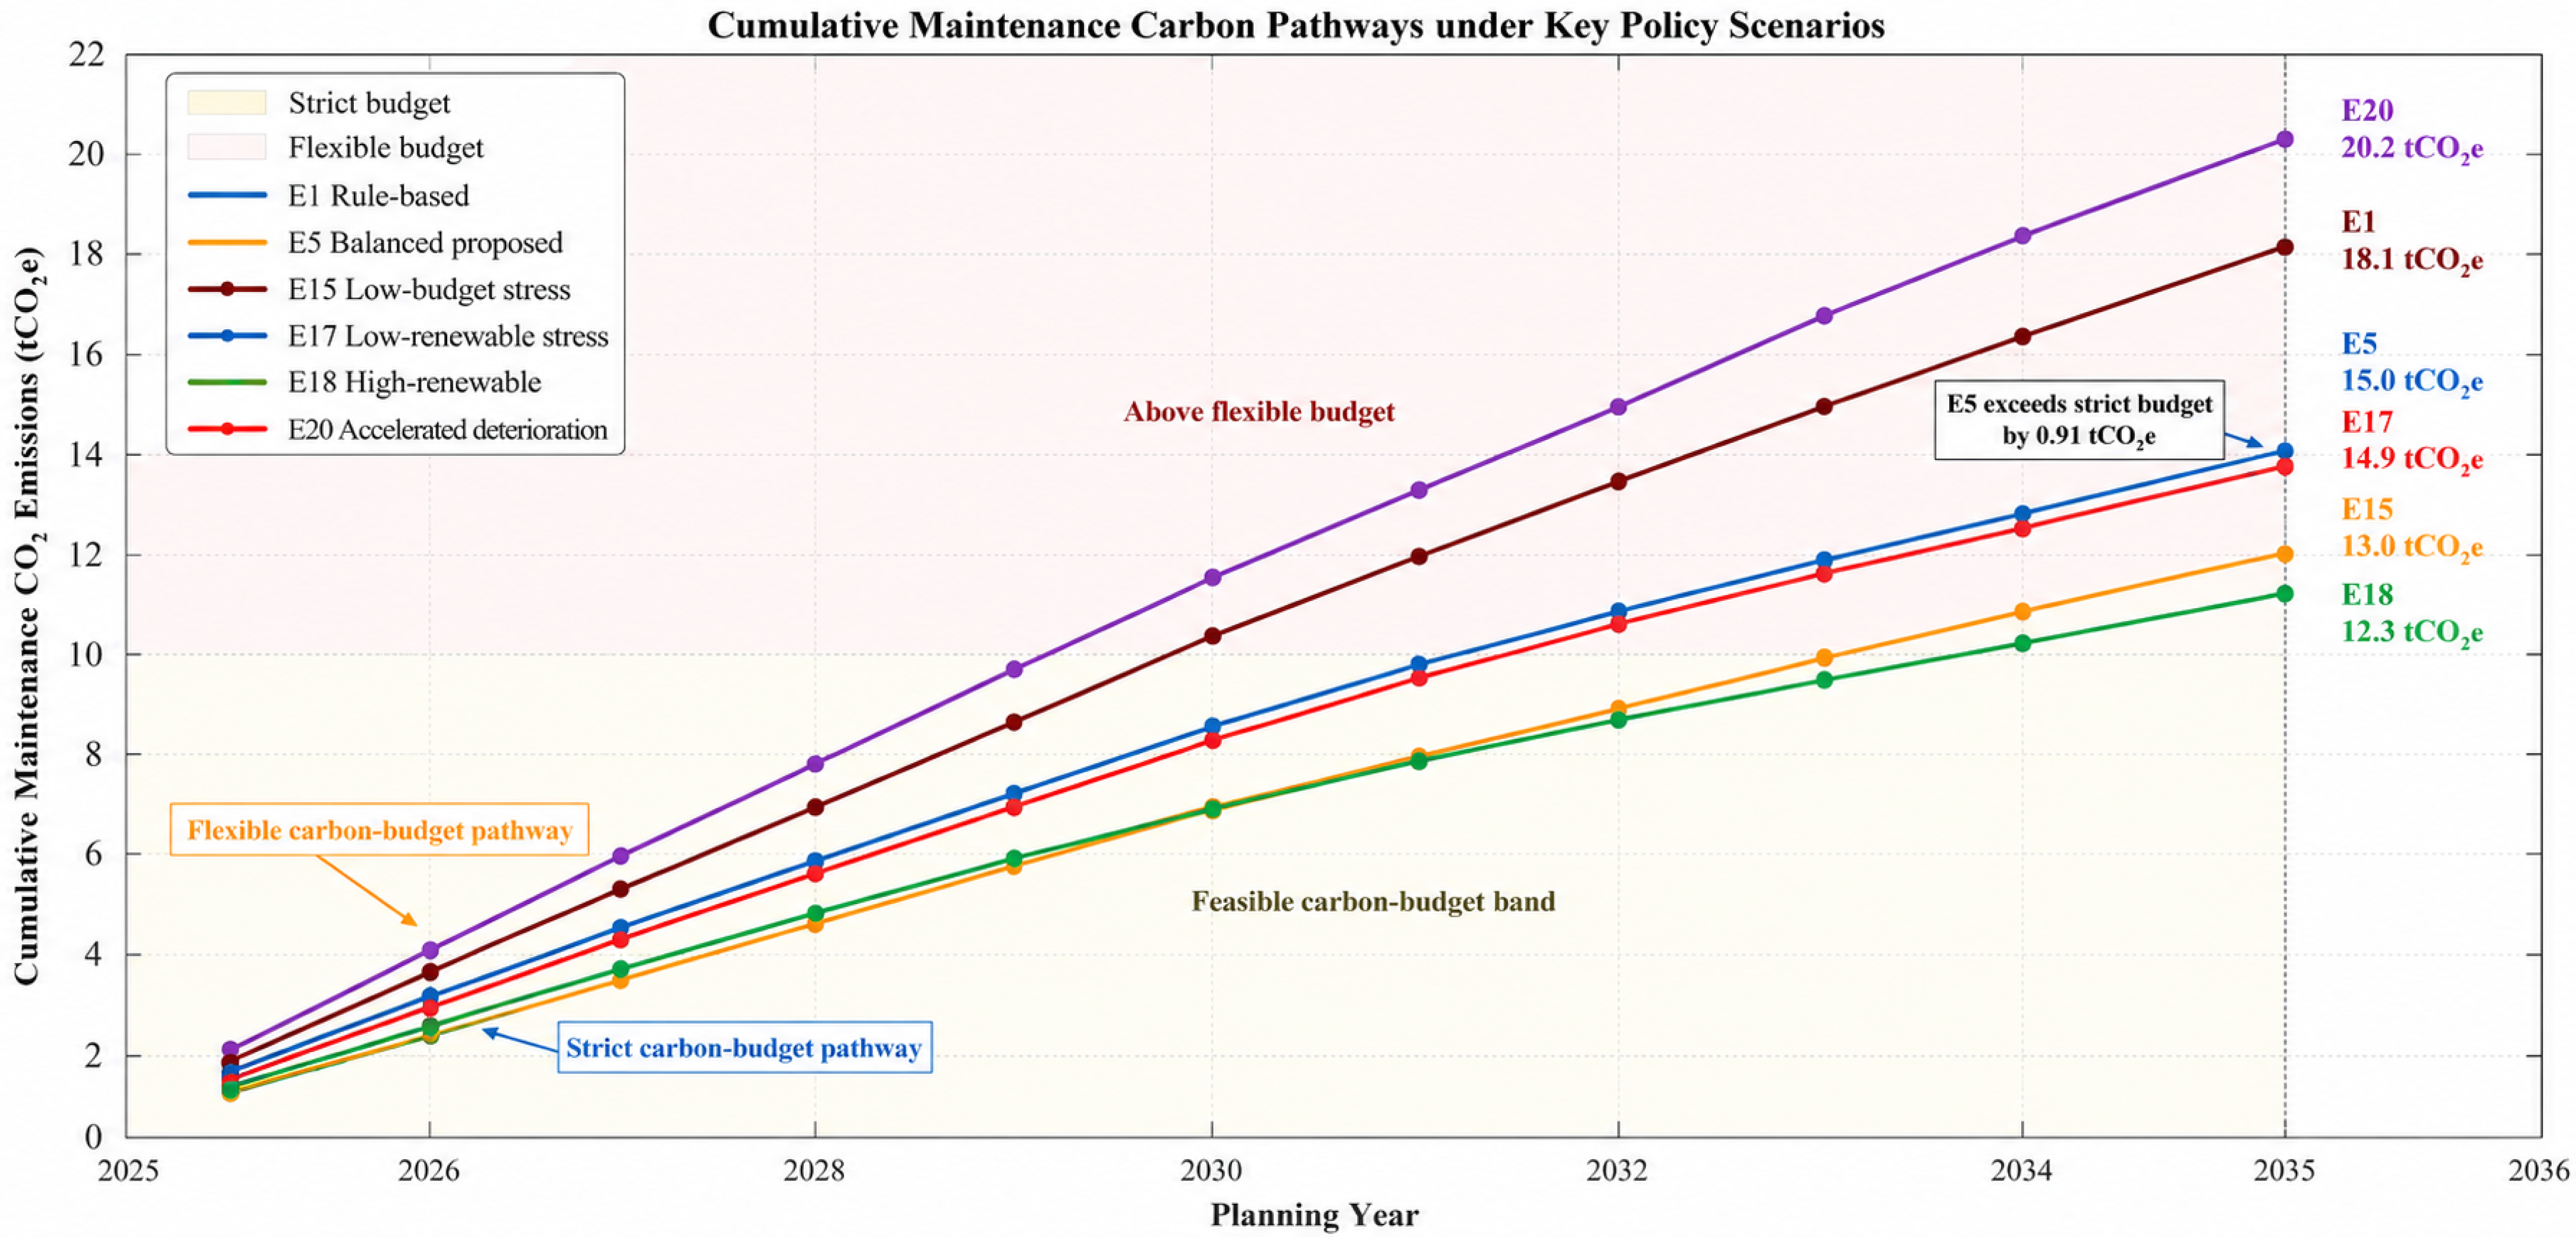
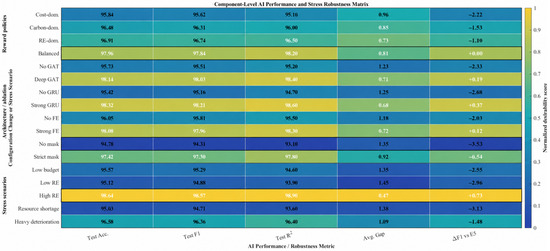
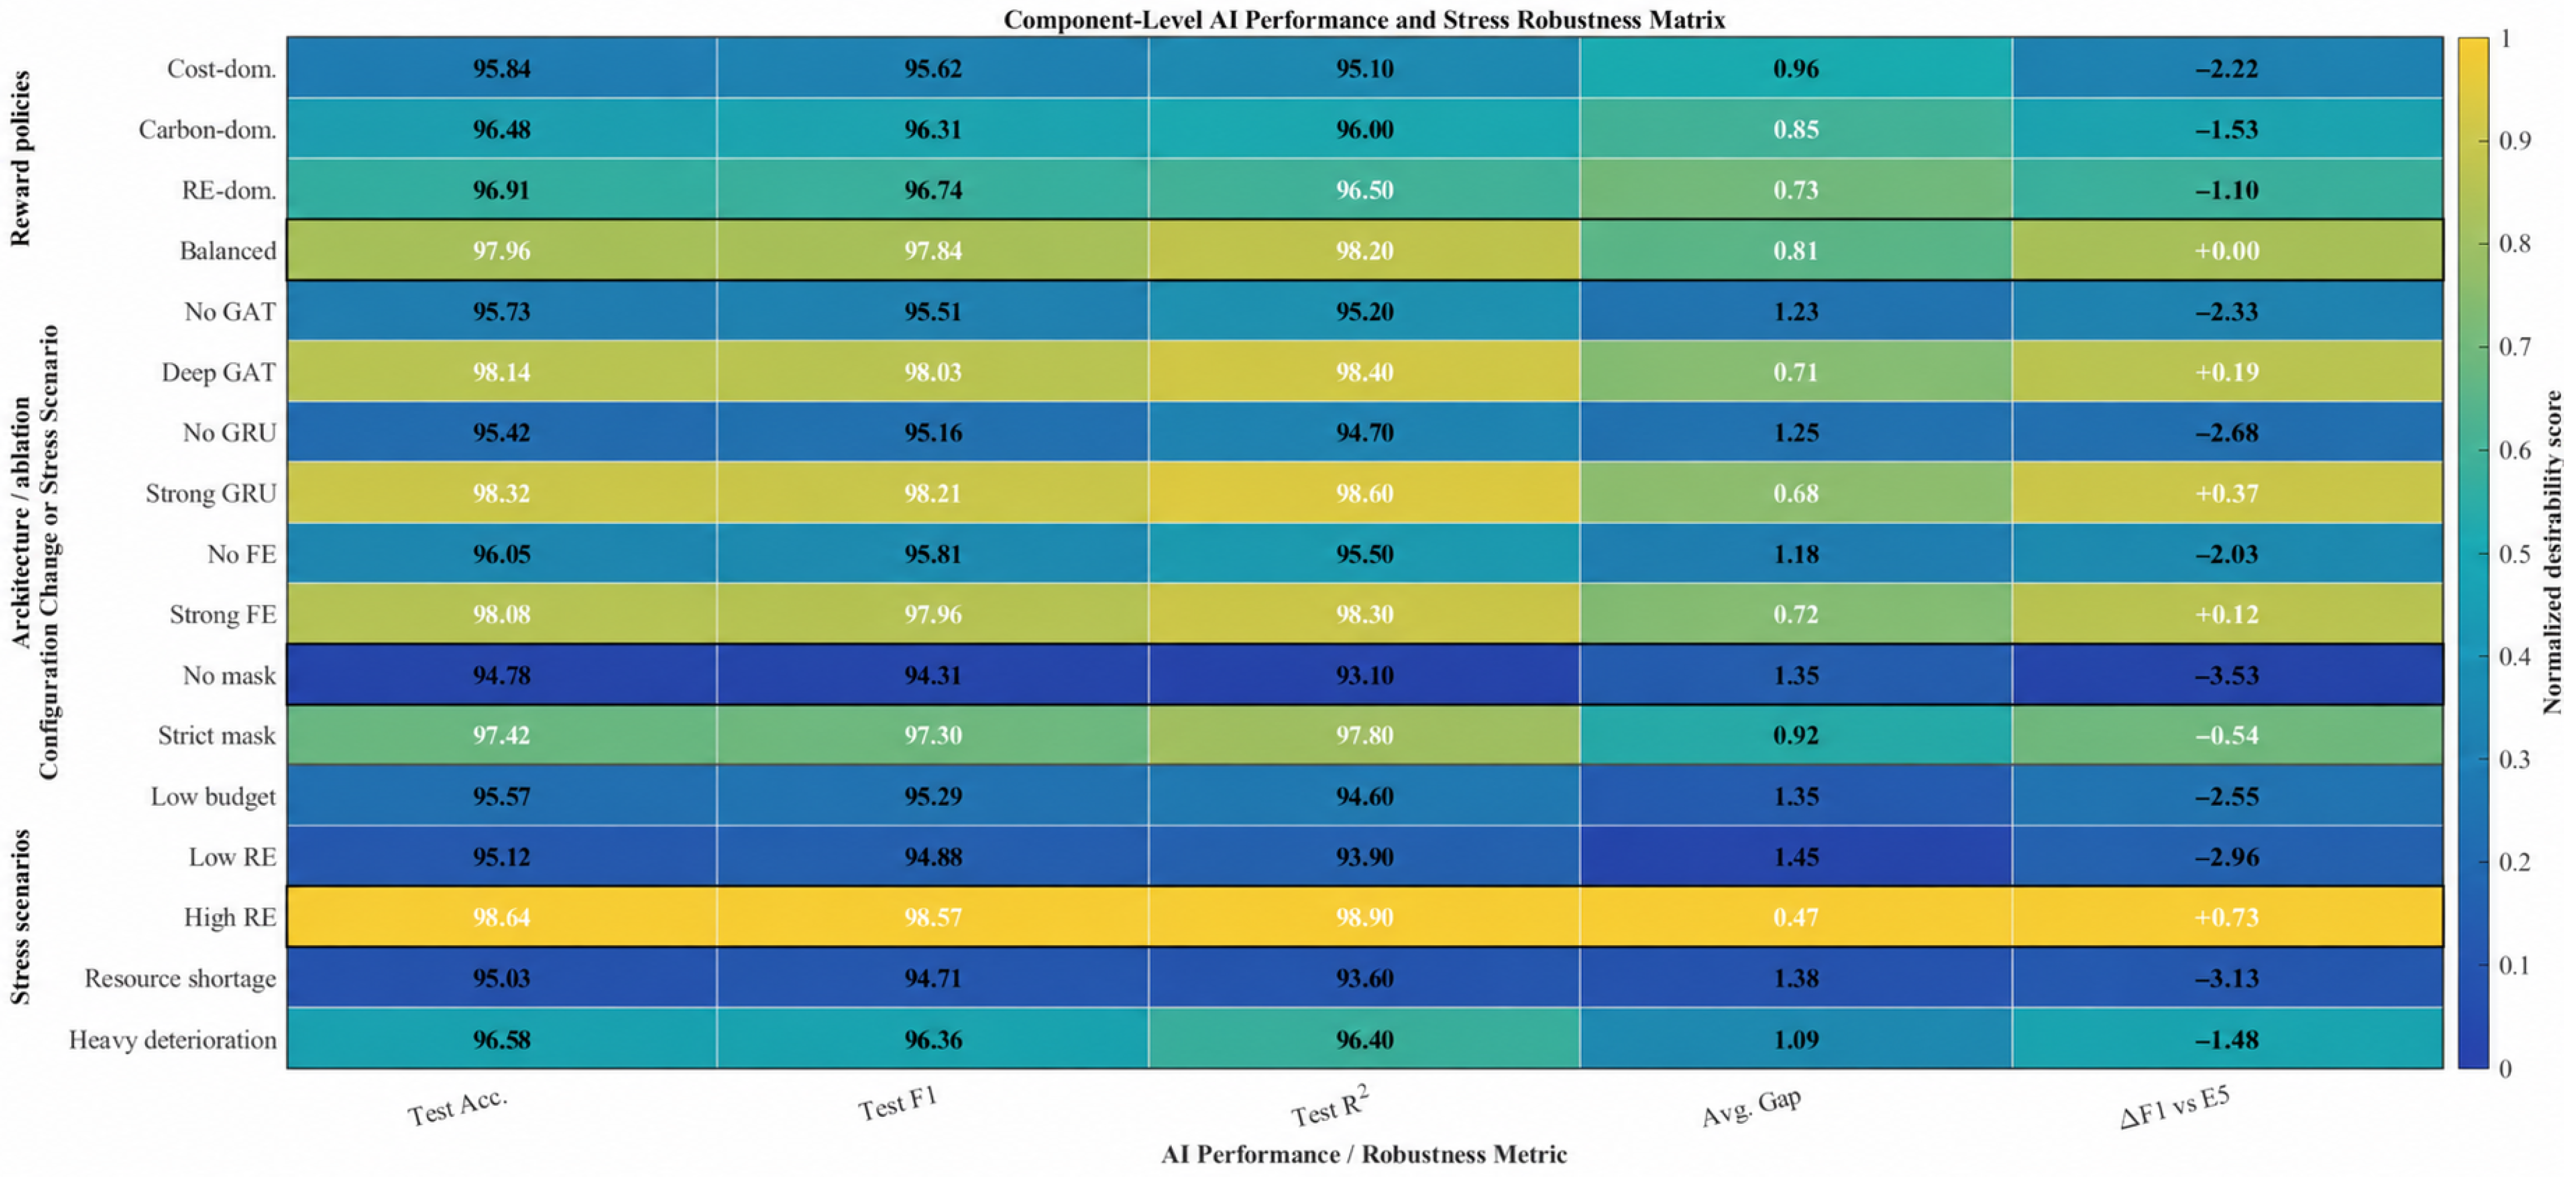
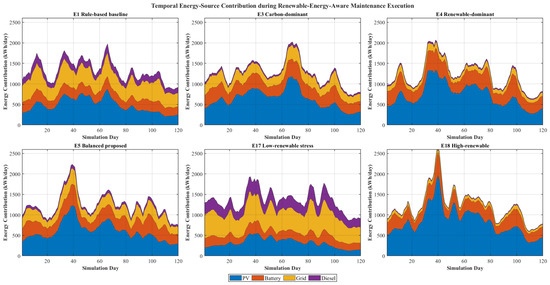
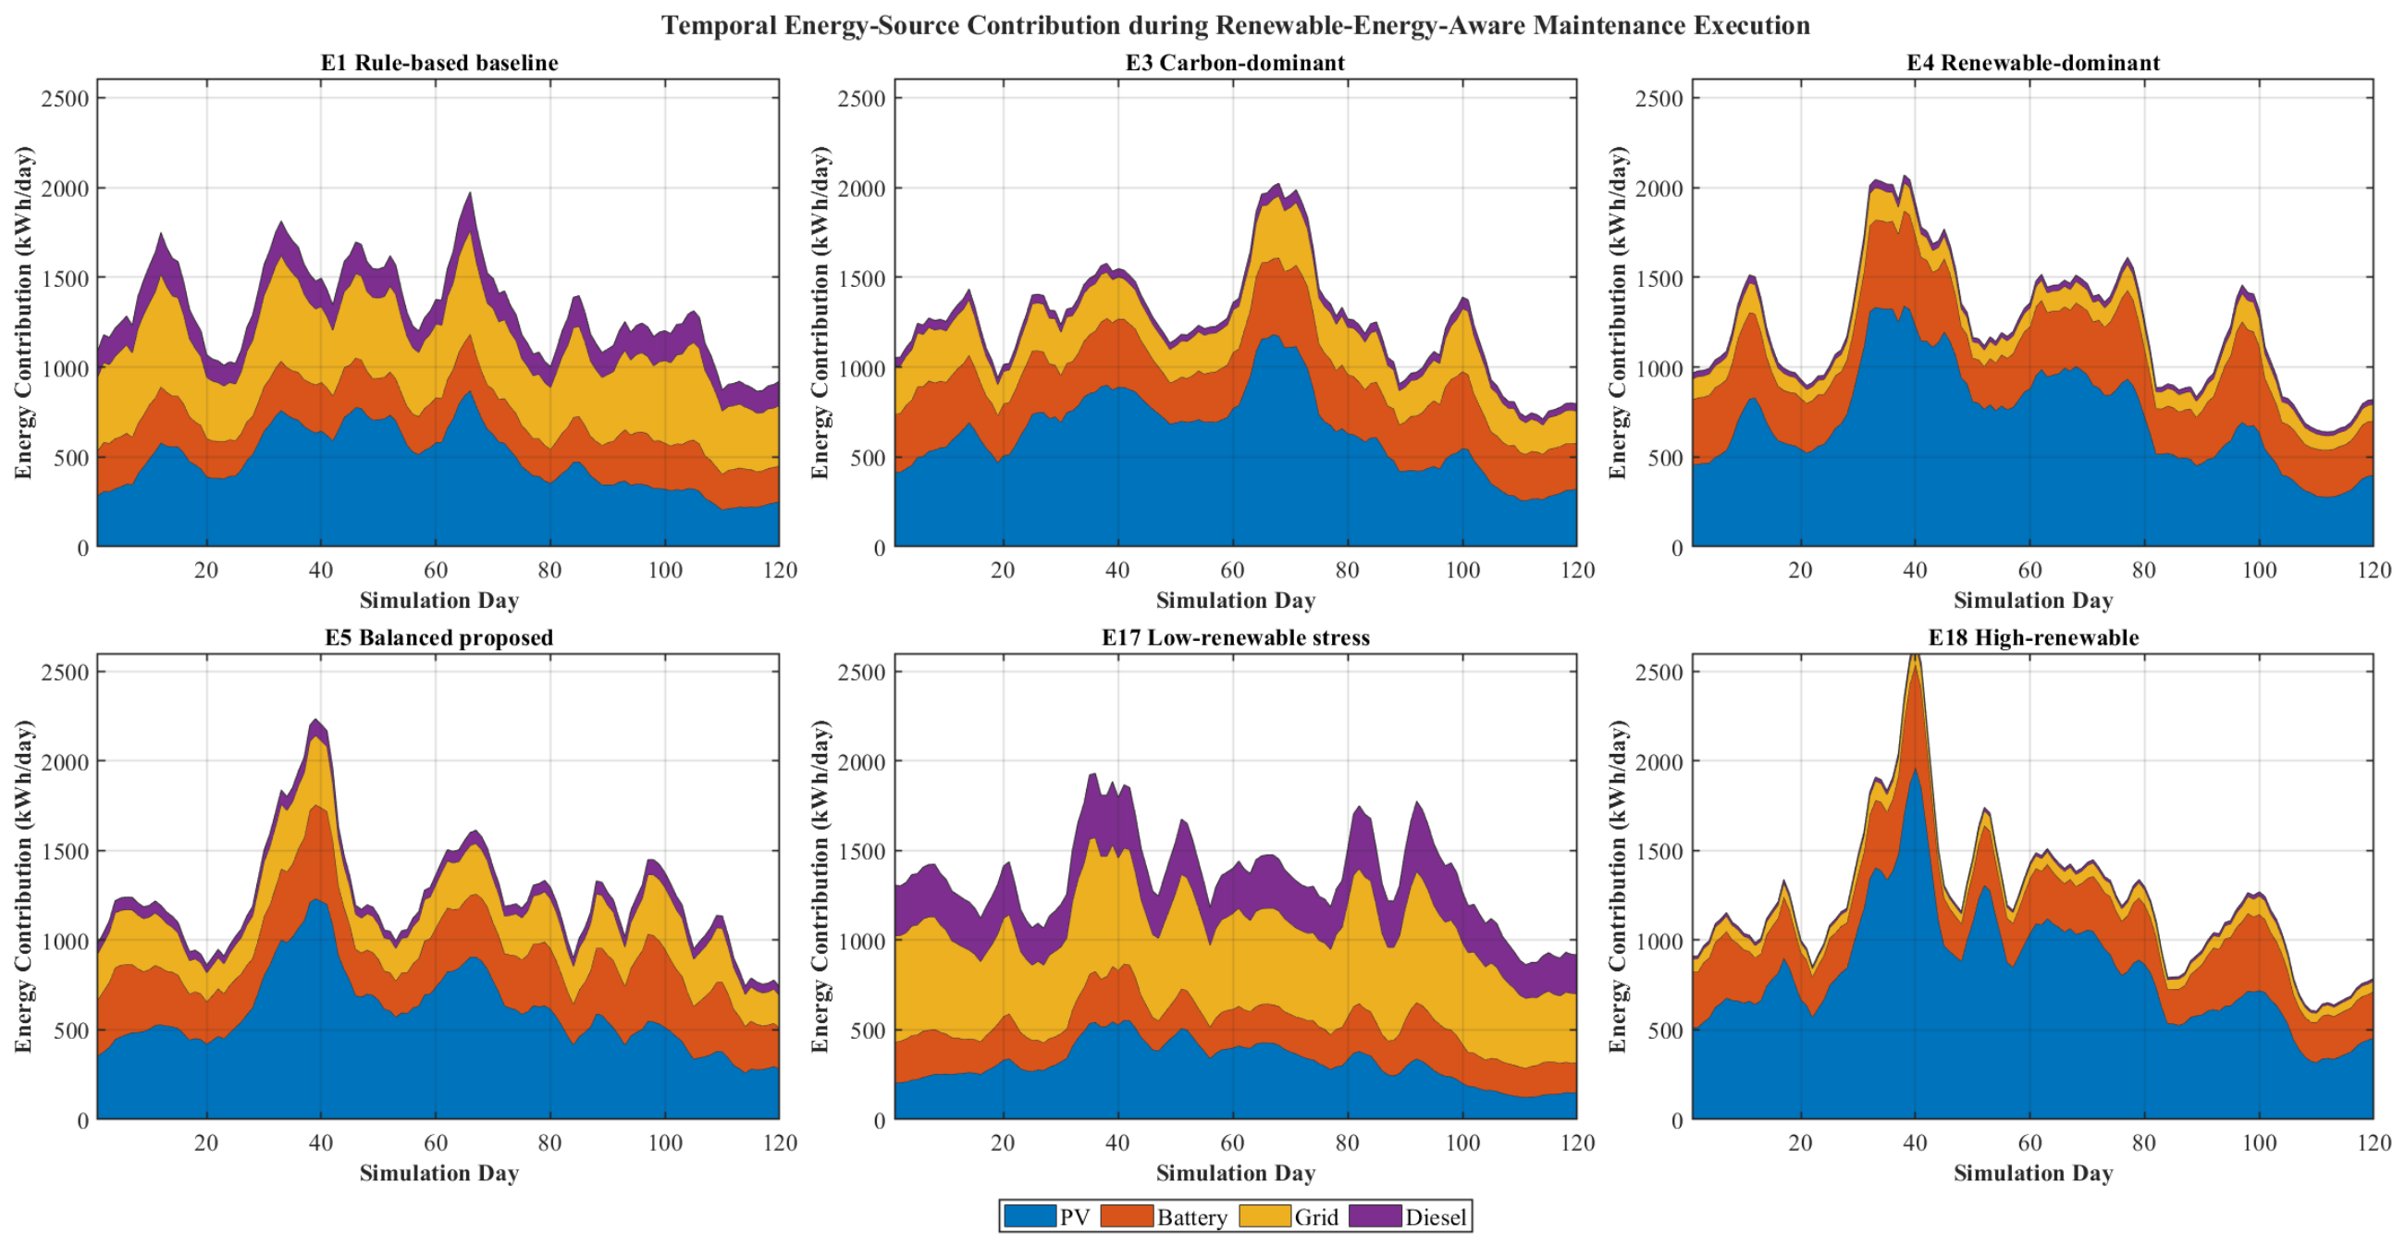
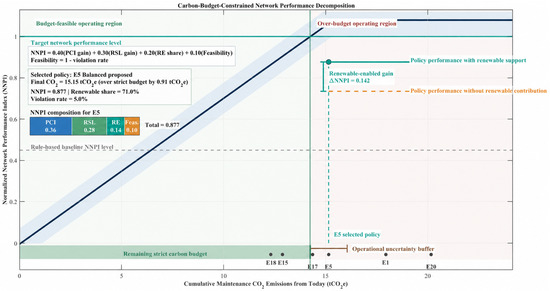
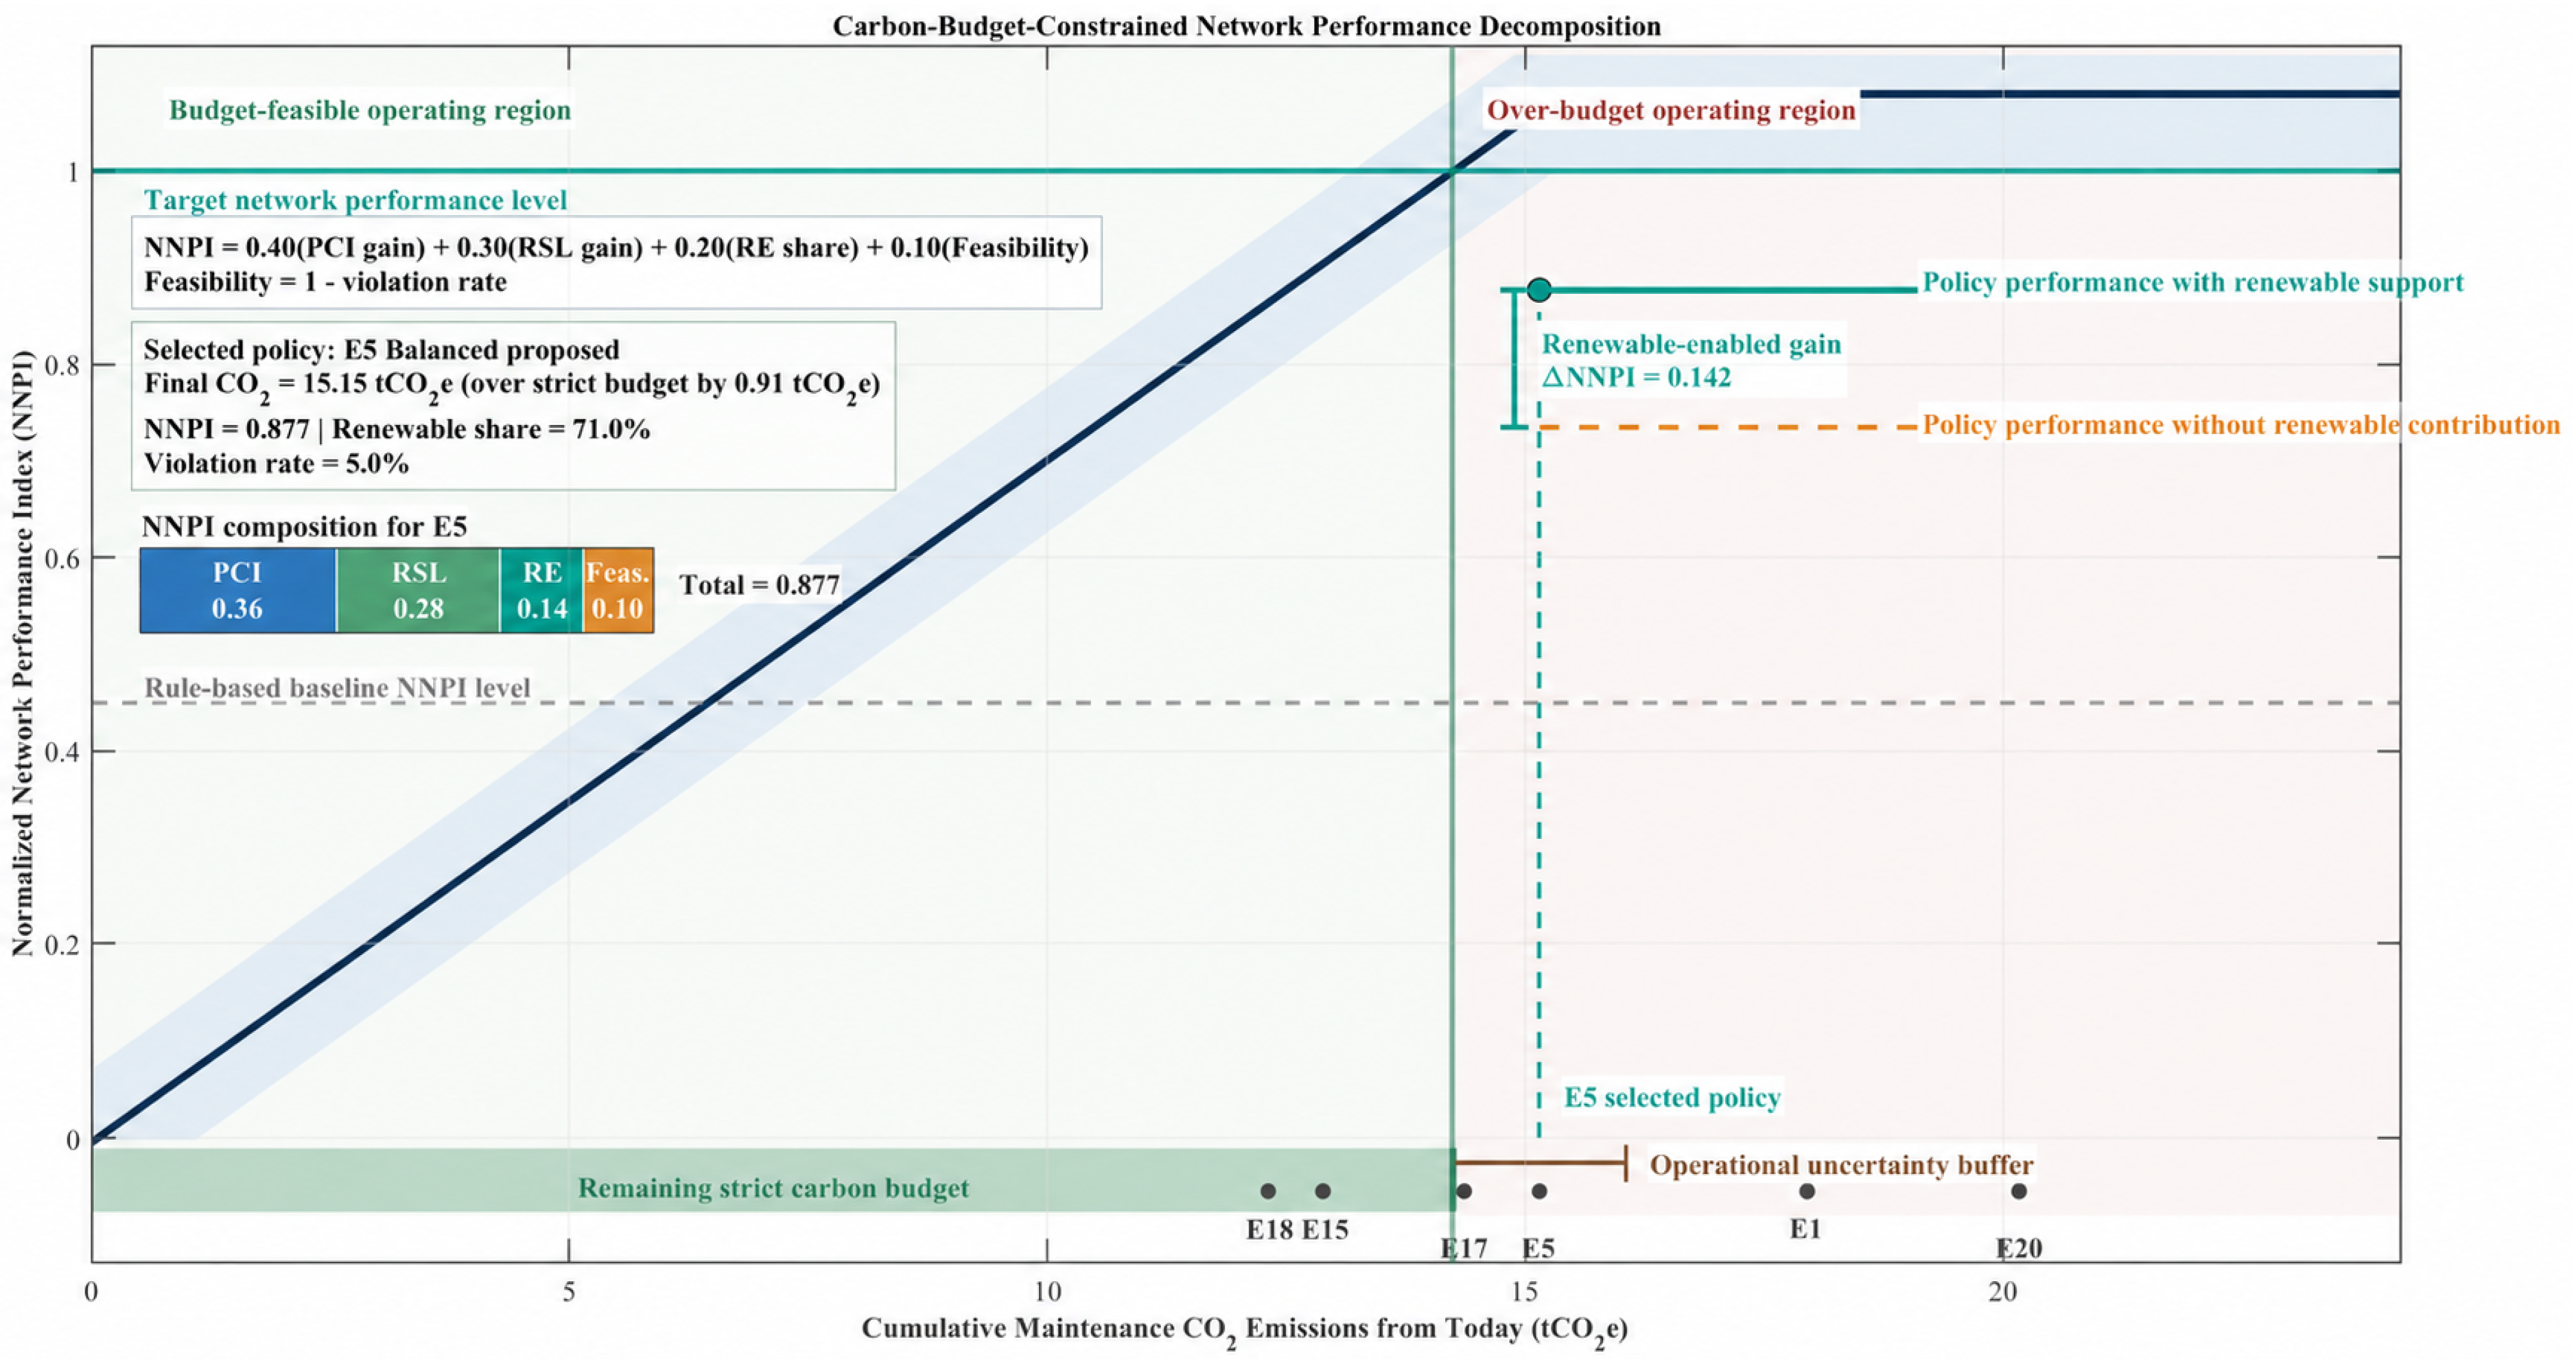
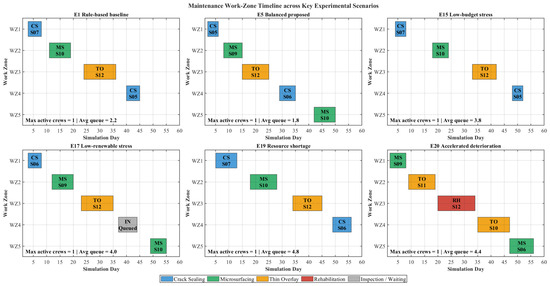
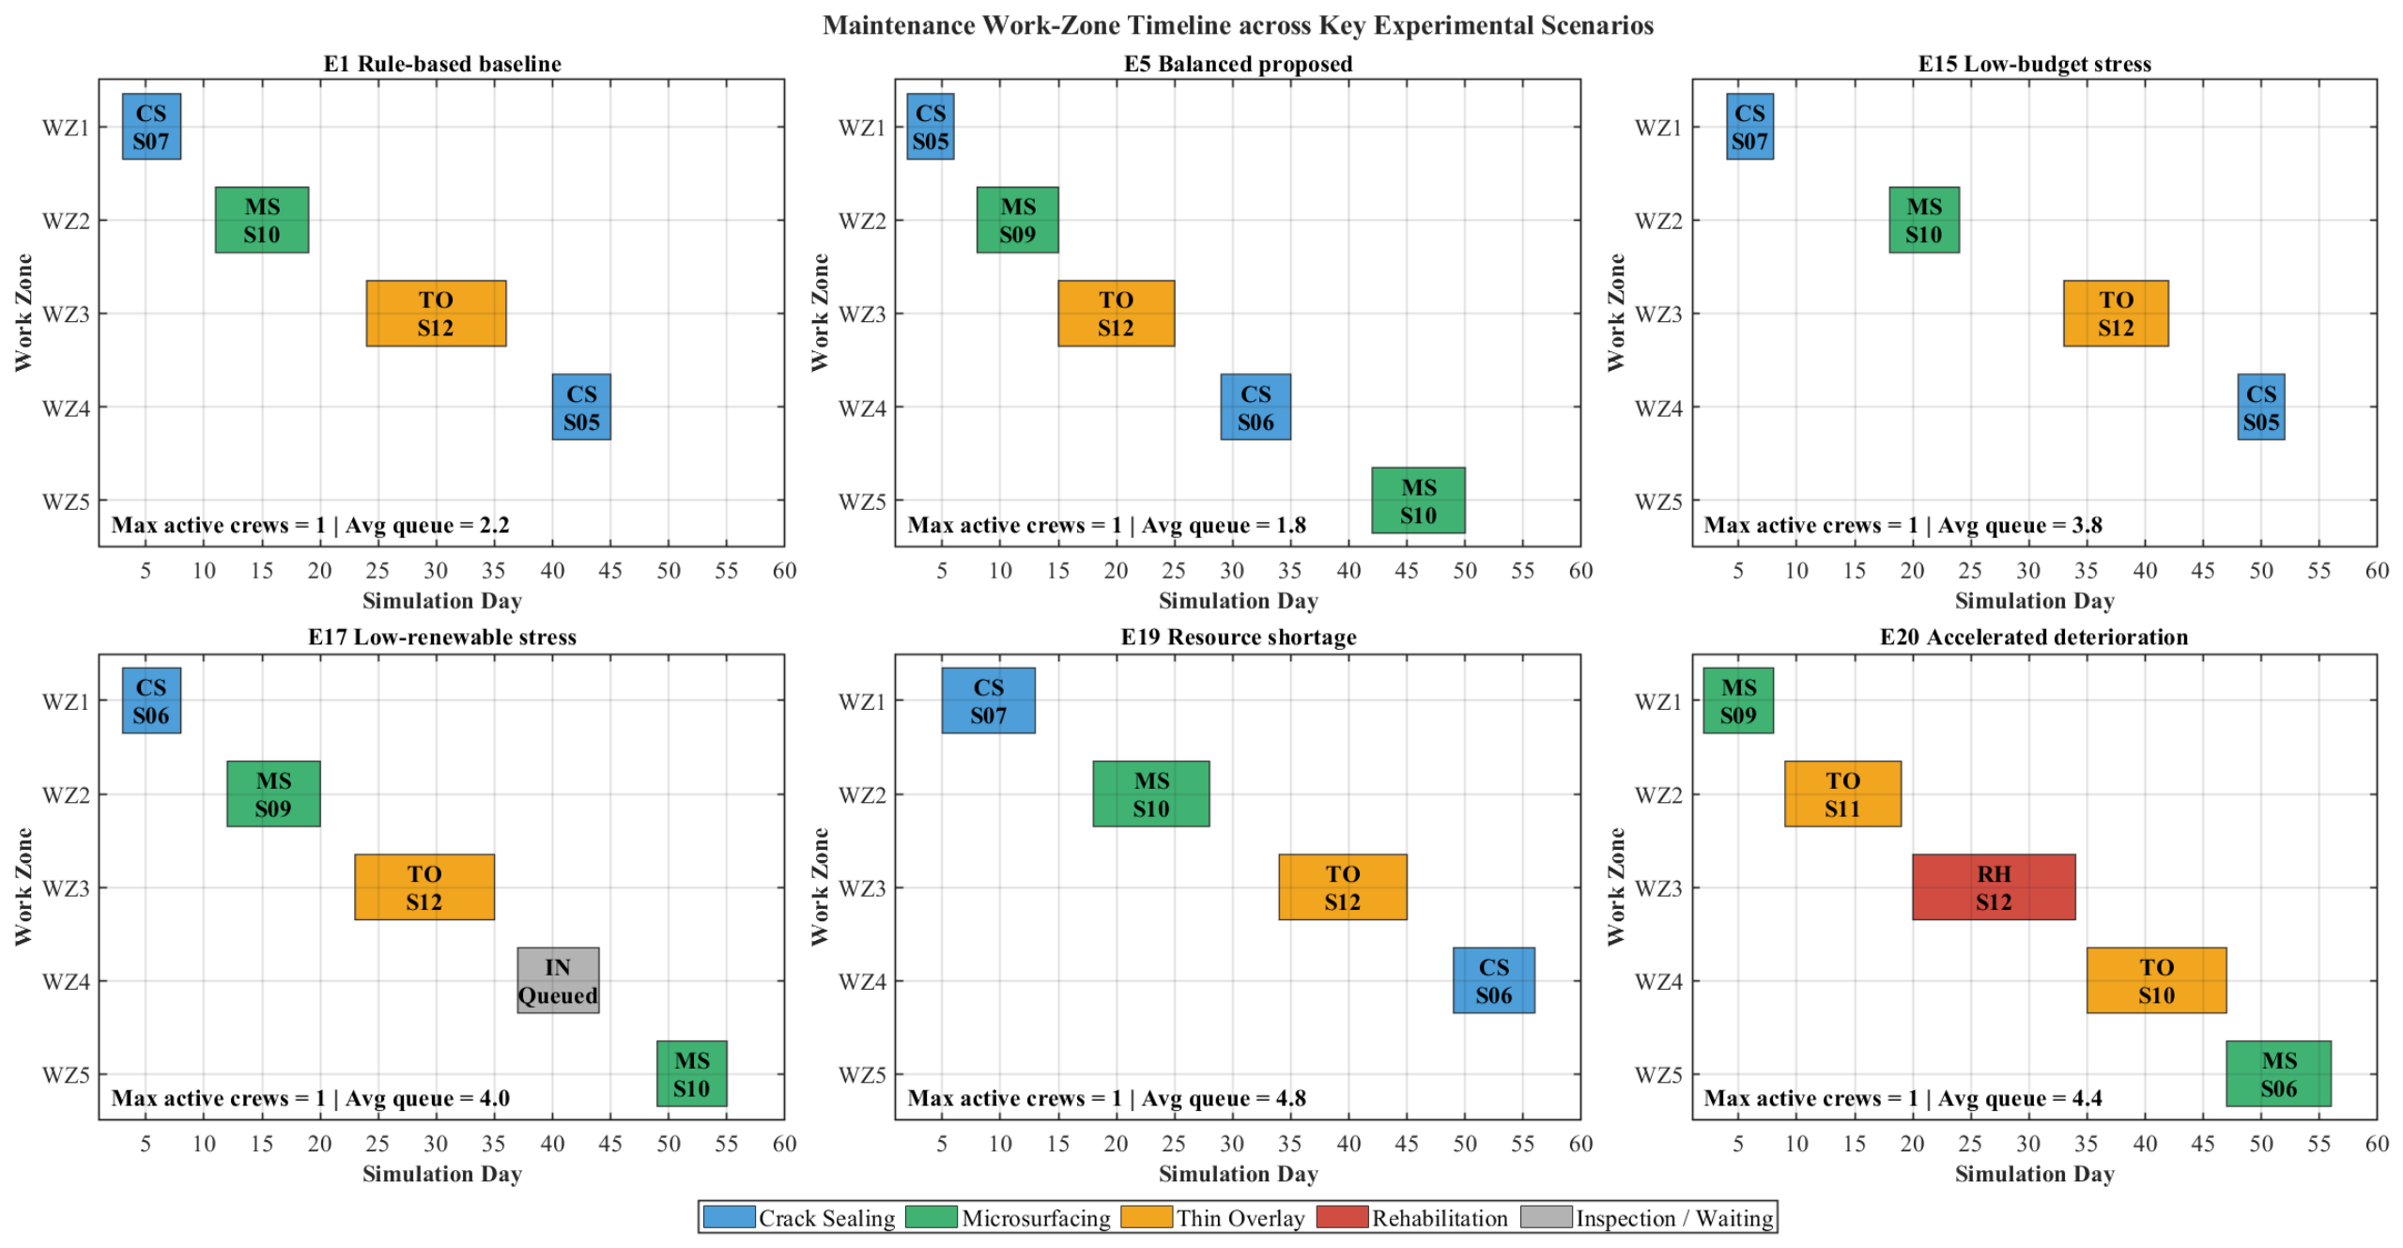
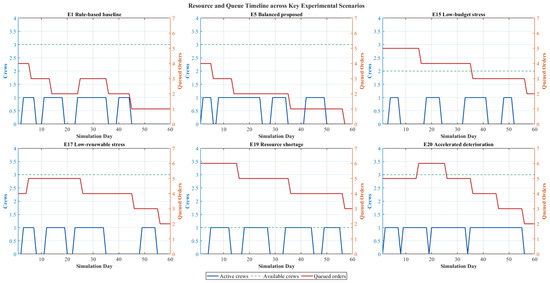
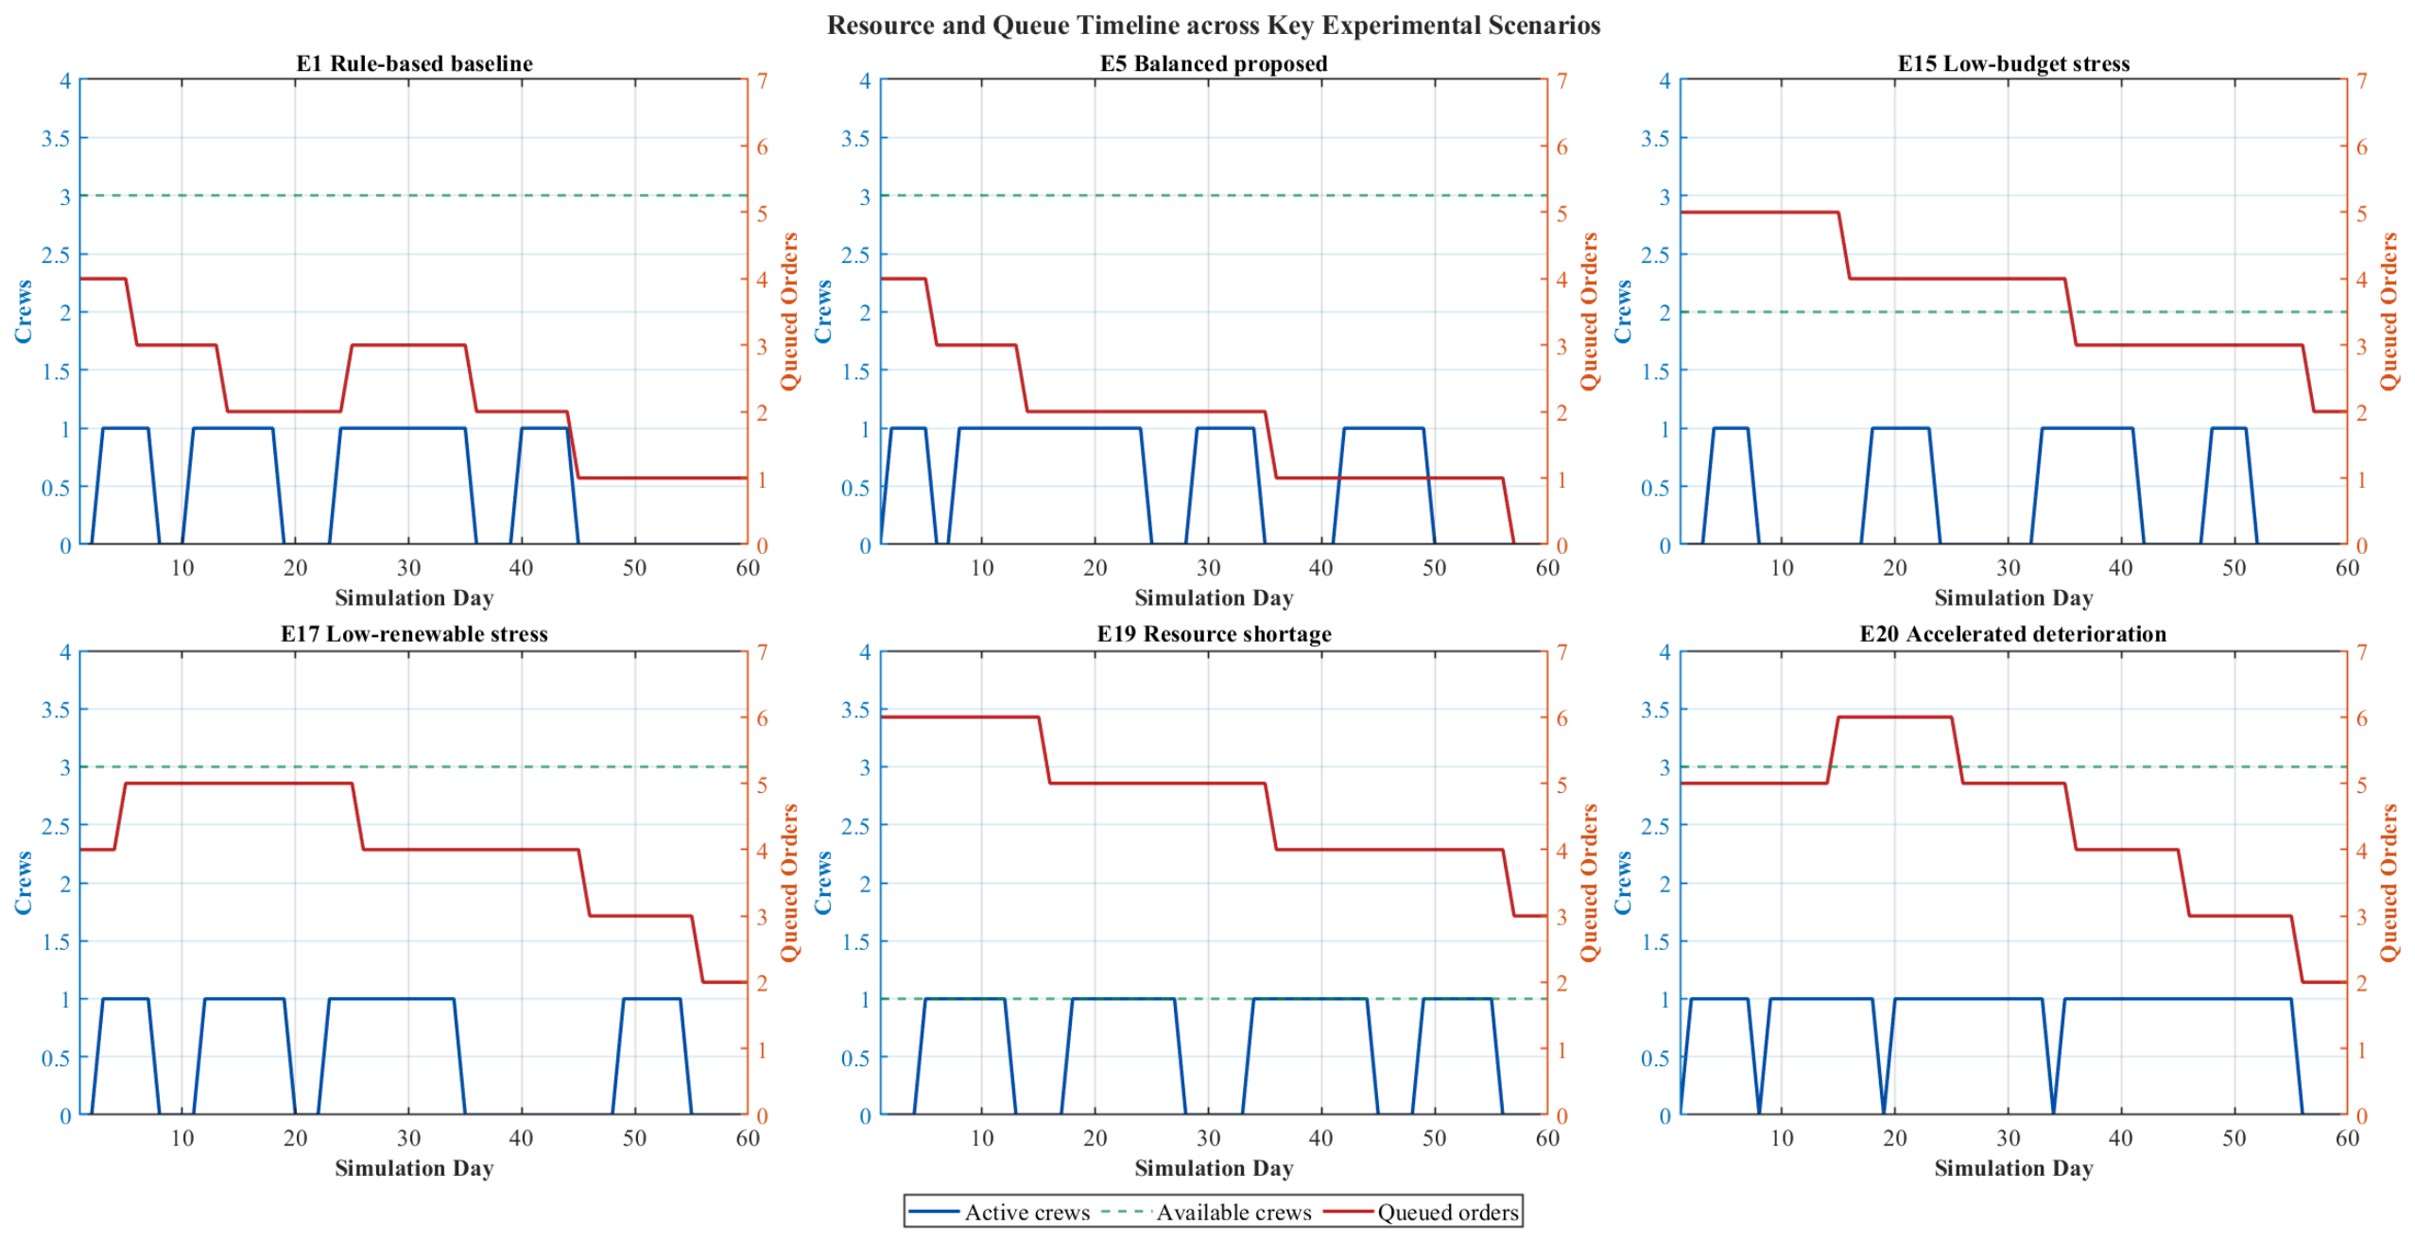
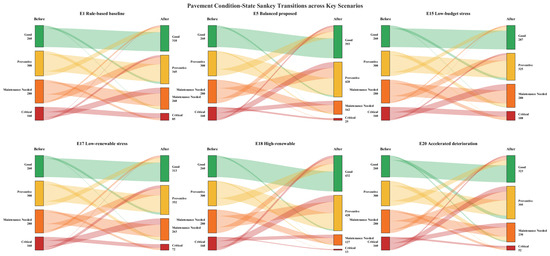
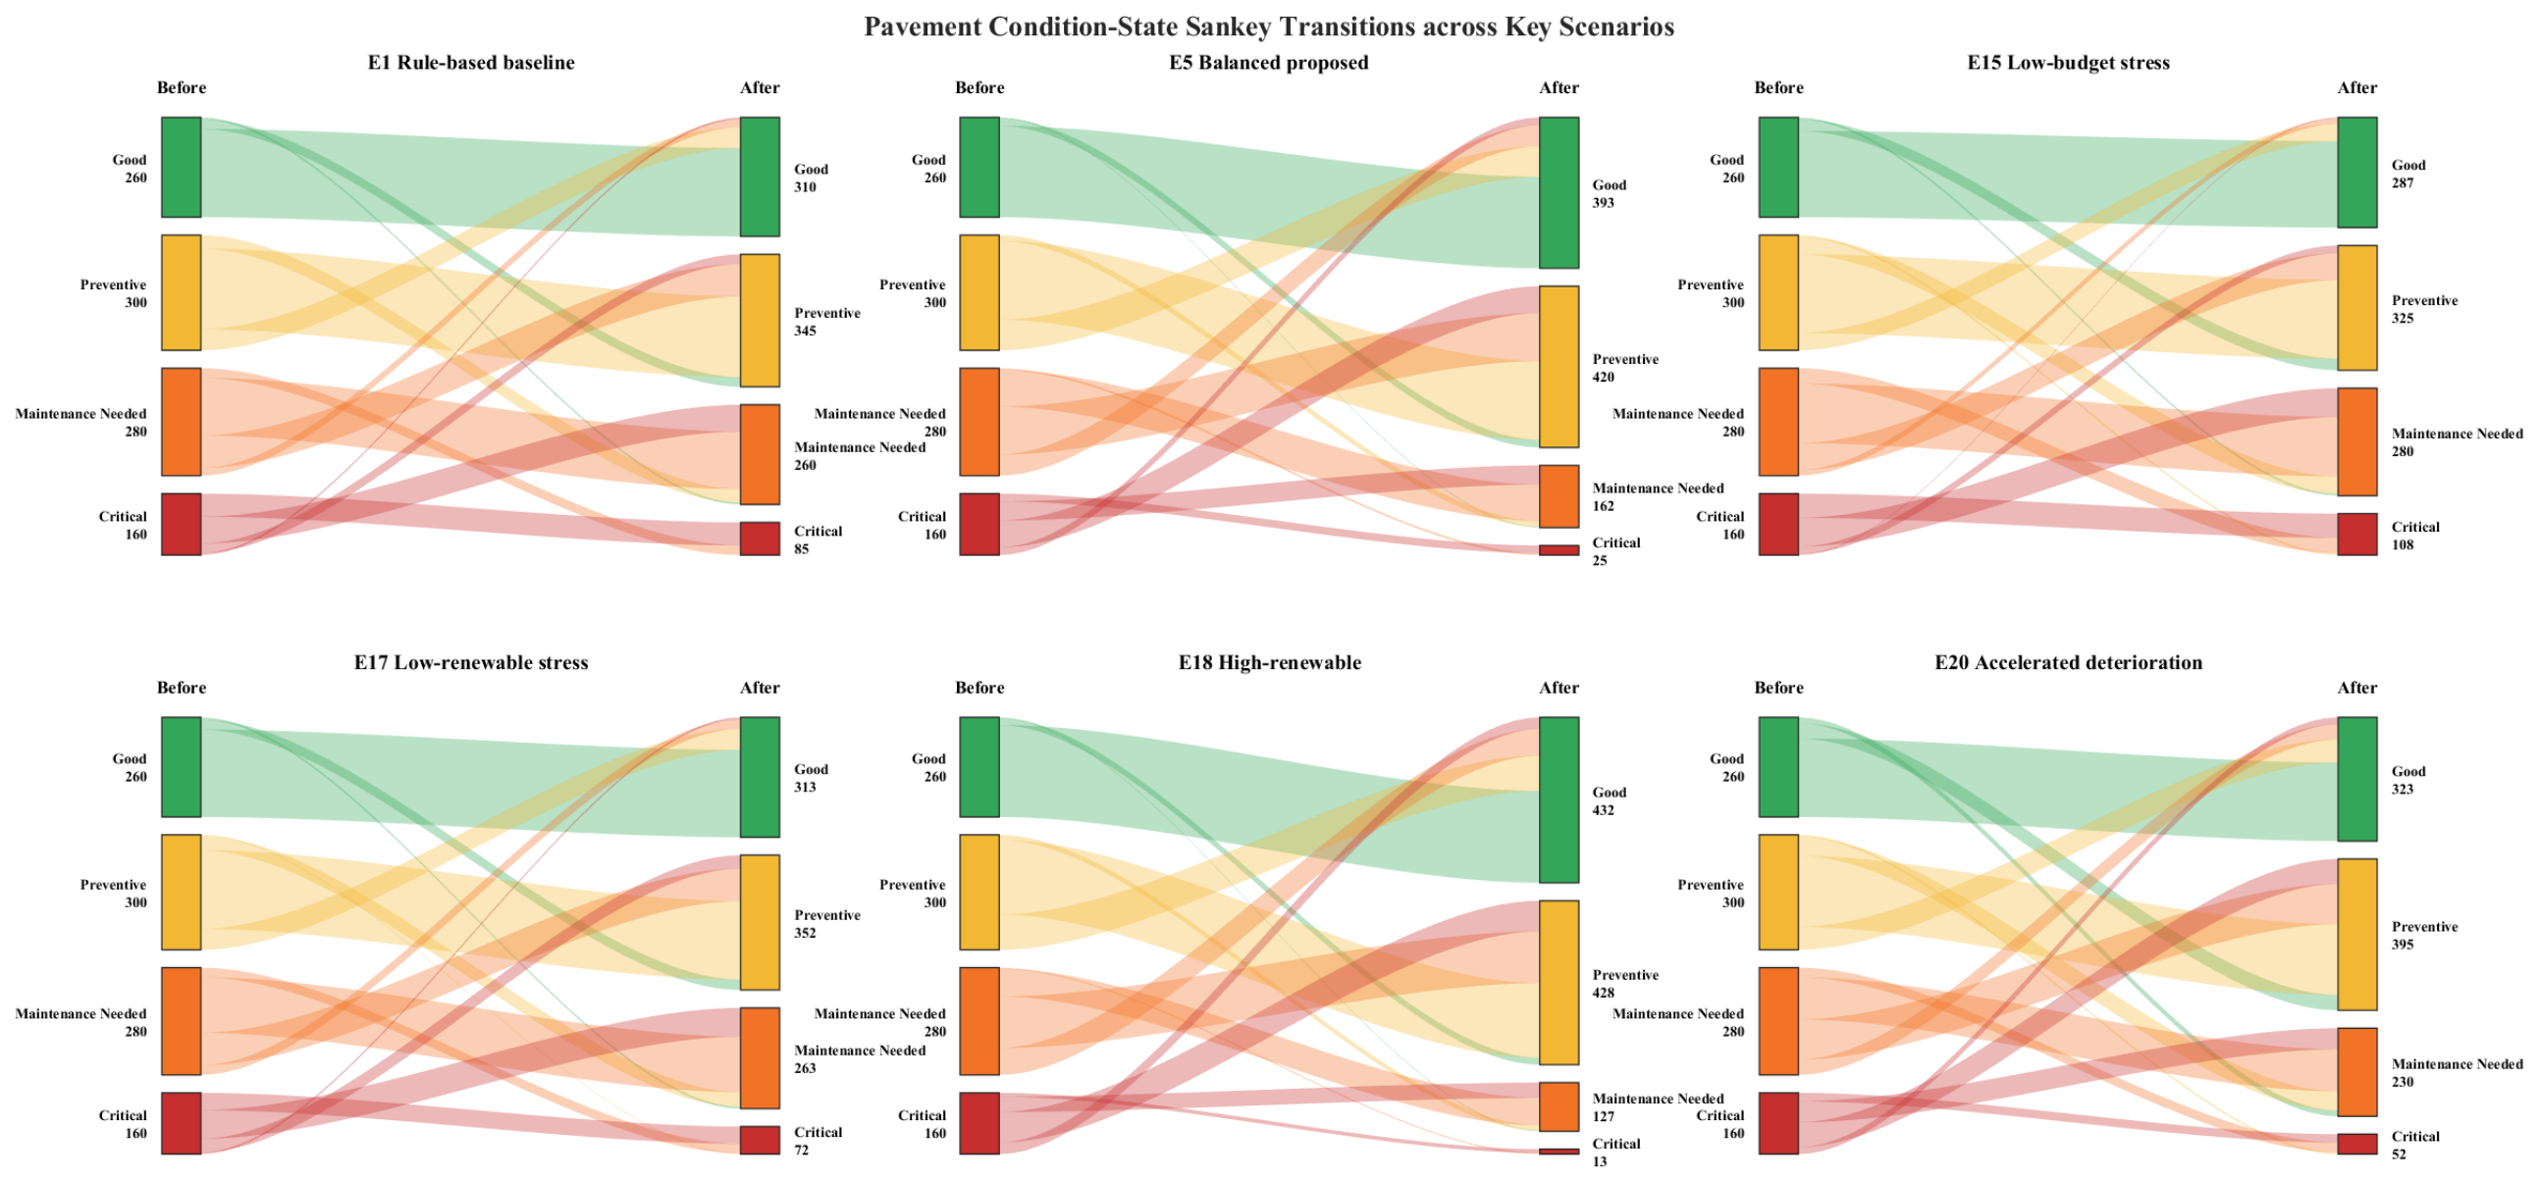
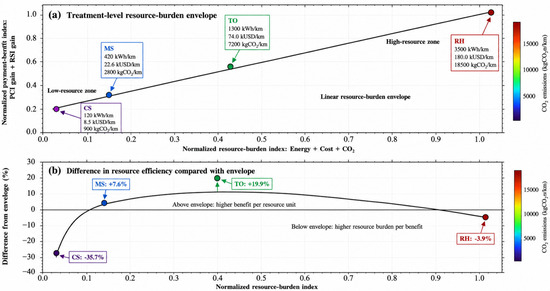
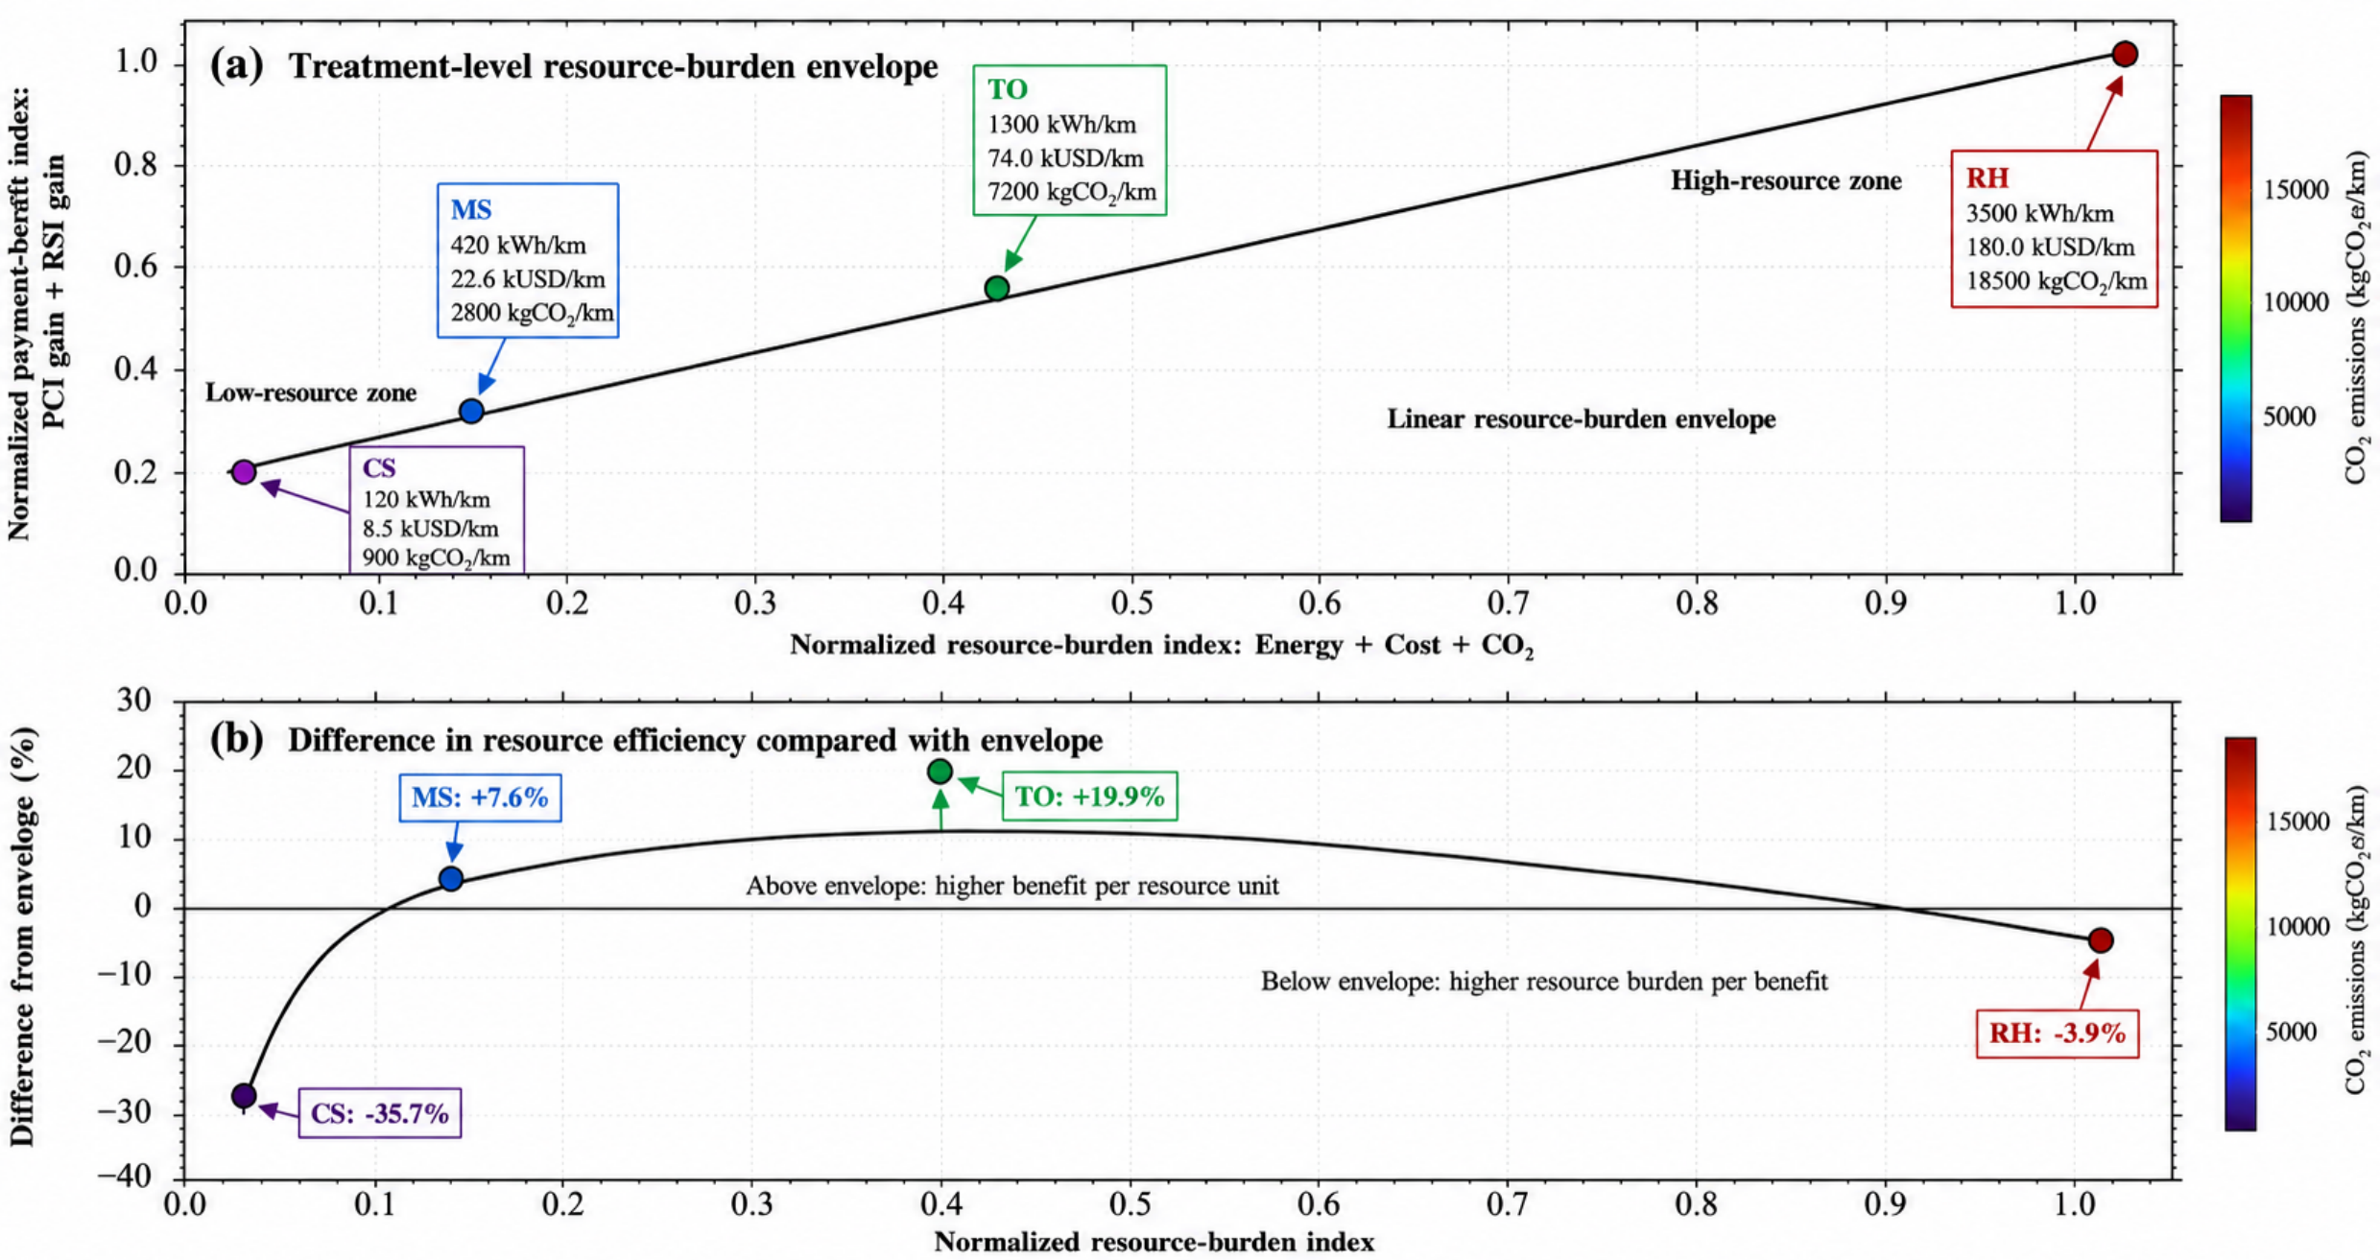

Disclaimer/Publisher’s Note: The statements, opinions and data contained in all publications are solely those of the individual author(s) and contributor(s) and not of MDPI and/or the editor(s). MDPI and/or the editor(s) disclaim responsibility for any injury to people or property resulting from any ideas, methods, instructions or products referred to in the content. |
© 2026 by the authors. Licensee MDPI, Basel, Switzerland. This article is an open access article distributed under the terms and conditions of the Creative Commons Attribution (CC BY) license.